Embed Size (px)
Citation preview

Friction 6(1): 62–74 (2018) ISSN 2223-7690 https://doi.org/10.1007/s40544-017-0163-9 CN 10-1237/TH
RESEARCH ARTICLE
Thermocapillary migration mechanism of molten silicon droplets on horizontal solid surfaces
Tao SUN1, Cunhua JIANG1, Jianning DING1,2,*, Ningyi YUAN1,2,* 1School of Mechanical Engineering, Changzhou University, Changzhou 213164, China 2 Collaborative Innovation Center of Photovoltaic Science and Engineering, the Breeding Construction Point of State Key Laboratory of
Photovoltaic Engineering Science, Changzhou 213164, China
Received: 02 March 2017 / Revised: 15 April 2017 / Accepted: 23 April 2017
© The author(s) 2017. This article is published with open access at Springerlink.com
Abstract: Effective lubrication under extreme conditions such as high temperature is of considerable importance
to ensure the reliability of a mechanical system. New lubricants that can endure high temperatures should be
studied and employed as alternatives to traditional oil-based lubricant. In this paper, a thermocapillary model of
a silicone-oil droplet is developed by solving the Navier–Stokes and energy equations to obtain the flow,
pressure, and temperature fields. This is accomplished using a conservative microfluidic two-phase flow level
set method designed to track the interface between two immiscible fluids. The numerical simulation accuracy is
examined by comparing the numerical results with experimental results obtained for a silicone-oil droplet.
Hence, the movement and deformation of molten silicon droplets on graphite and corundum are numerically
simulated. The results show that a temperature gradient causes a tension gradient on the droplet surface, which
in turn creates a thermocapillary vortex. As the vortex develops, the droplet migrates to the low-temperature
zone. In the initial stage, the molten silicon droplet on the corundum substrate forms two opposite vortex cells,
whereas two pairs of opposite vortices are formed in the silicone fluid on the graphite substrate. Multiple vortex
cells gradually develop into a single vortex cell, and the migration velocity tends to be stable. The greater the
basal temperature gradient, the stronger the internal thermocapillary convection of the molten silicon droplet
has, which yields higher speeds.
Keywords: molten silicon; droplet; temperature gradient; thermocapillary migration
1 Introduction
Effective lubrication is a key factor in ensuring the
stability of a high-temperature machine such as a gas
turbine or silicon pulling machine [1, 2]. In such ma-
chine systems, temperatures T higher than 1,000 °C can
develop between the components. In these scenarios,
traditional oil-based lubricant is not appropriate for
use, because of its disadvantages such as unfavorable
viscosity–temperature μ–T characteristics and flam-
mability [3, 4]. Thus, new lubricants suitable for such
applications should be found and studied. For example,
meltable materials are promising lubricants that can
function under the above conditions. Recently, Li et al.
[5] exploited the high thermal diffusivity of liquid metal
to utilize this material as a lubricant under extreme
pressure p.
Thermocapillarity refers to phenomena that arise
because of variation in the interfacial tension at a
fluid–solid interface, which is caused by a T gradient.
Thermocapillarity occurring between a friction pair
will affect the lubrication performance by changing
the surface tension σ and meniscus shape. Previously,
Brozska et al. [6] described the thermocapillary migration
behavior of droplets on solid surfaces using a lubrication
model, proving that the migration velocity was linearly
* Corresponding authors: Jianning DING, E-mail: [email protected]; Ningyi YUAN, E-mail: [email protected]

Friction 6(1): 62–74 (2018) 63
∣www.Springer.com/journal/40544 | Friction
http://friction.tsinghuajournals.com
dependent on the radius r and that a certain critical r
existed. In addition, Brochard [7] assumed an appro-
ximately wedge-shaped droplet with a small static
contact angle θ, and found that the droplet motion
varies with θ. Tseng et al. [8] analyzed the change in
the flow and T fields inside the droplet; however, good
consistency between experimental and numerical
results was not obtained because of differences in the
initial and experimental conditions. Finally, Chen et al.
[9] studied the effect of contact-angle hysteresis and
slip length on the migration velocity during droplet
migration, showing that the magnitude of the slip
coefficient has little effect on the migration velocity.
A lubrication system will generate heat and, therefore,
thermocapillary motion; then, the μ, p, and capillary
motion of the lubricant will change during the droplet
migration. Therefore, the thermocapillary migration
of molten-material-based lubricant has a significant
influence on the lubrication efficacy [10, 11]. However,
few works report the flow characteristics of molten
materials under high T. Among the investigated
materials, silicon has a high melting point and is easily
oxidized at high T values. However, it is difficult to
study the thermocapillary migration phenomena of
molten silicon droplets via an experimental approach.
In this work, we employ the finite element method
with the two-phase level set technique, which is ideally
suited to the tracking of interfaces between two
immiscible fluids, to examine thermocapillary migration
in molten silicon droplets. To verify the accuracy of the
conserved level set method, the numerical simulation
results obtained for a silicone-oil droplet are compared
with experimental results. Hence, the movement and
deformation of molten silicon droplets on graphite
and corundum substrates are numerically simulated.
Graphite crucibles and corundum crucibles are two
commonly used base materials for molten silicon. In
this study, high-T contact-angle equipment is used to
measure the θ of the silicon liquid on the graphite
substrate and corundum, in an argon atmosphere.
The evolution of the internal T field and the flow
field of the molten silicon droplets is studied based
List of symbols
H, W Rectangular width and height θ Static contact angle
TH The temperature of high temperature side
x Abscissa displacement
Tc The temperature of low temperature
Bo Bond
Ca Capillary
Re Reynolds
Oh Ohnesorge numbers
Density
G Gravitational acceleration
V Droplet velocity
L Characteristic length
D The droplet contact diameter under the
solid surface.
k−1 Capillary length
Μl,ua The dynamic viscosity of droplet and air
Cpl, Cpa Specific heat of droplet and air
kl, ka Thermal conductivity of droplet and air
Fx, Fy Surface tension forces in the x and y
directions
T The surface tension coefficient
σ0 Surface tension at the reference
temperature T0
Ω1 Air subdomain
Ω2 Droplet subdomain
Level set function
ε Interface thickness
γ Reinitialization parameter
u Velocity vector
bls Slip length
uτ Velocity of the fluid slip on the boundary
Ma Marangoni number
ΔT Temperature difference between two
contact lines
α The thermal diffusivity
p The droplet pressure difference
R Droplet interface curvature
LG ,
SG ,
SL Gas–liquid surface tension, solid–air
interfacial tension, solid–liquid
interfacial tension

64 Friction 6(1): 62–74 (2018)
| https://mc03.manuscriptcentral.com/friction
on the experimental value of θ. The thermocapillary
migration behavior of the silicon droplets on the
graphite and corundum substrates under the argon
atmosphere is investigated via numerical simulation,
which provides a theoretical basis for control of the
thermocapillary convection.
2 Physical model and meshing
In the numerical simulation conducted in this study,
a small liquid droplet was placed at the bottom
solid wall in a rectangular cross-sectional area with
dimensions of 1.5 mm × 8 mm (height H × width W).
The liquid droplet was initially assumed to have a
cylindrical cap shape, with a static θ which is defined
as the angle formed between the droplet/air interface
and the droplet/solid interface at the intersection
of droplet-air-solid phase (Fig. 1(a)). A uniform tem-
perature gradient G was imposed on the bottom wall,
and the T distribution followed the relation T = TH
G × x. Where TH is the temperature of high temperature
side, x is the abscissa displacement. Here, if x = 0, T =
TH, and if x = W, T = TC. Here, TC is the temperature of
low temperature side. As the droplet was considered
to be very small, the density of the liquid within it
could be assumed to be constant and the influence of
the body force could be neglected. Note that both the
droplet and air can be regarded as incompressible
Fig. 1 (a) Theoretical model of thermocapillary migration. (b) Schematic meshing of model.
and Newtonian fluids. Further, σ and θ are functions
of T, whereas the physical properties of the droplet
and air are independent of T.
A total of 18,912 grids were used for calculation in
the subsequent simulation, and grid encryption was
used at the interface, as shown in Fig. 1(b). The bond,
capillary, Reynolds, and Ohnesorge numbers, which
are expressed as follows, were used to determine the
cylindrical cap assumption:
2
Bogr
; Cav
; RevL
; 2
Wev L
;
WeOh
ReL
(1)
For silicone-oil droplets with r = 0.5 mm, the migra-
tion velocity has an order of magnitude of 1 mm/s.
We obtained Bo = 0.115, Ca = 0.01, Re = 10, We = 10–5,
Oh = 10–4 where ρ represents the droplet density; g is
the gravitational acceleration; v represents the droplet
velocity; L is the characteristic length; and D represents
the droplet contact diameter under the solid surface. If the droplet D is smaller than the capillary length
k−1, 1 1/ 2( / )k g and the shape of the side surface
of the droplet ridge has a circular cross section.
However, if D > k–1, the shape of the liquid drop ridge
is flat.
In the silicone-oil case examined in this study,
thermocapillary migration was simulated under the
condition that θ = 90°. For the molten silicon on
graphite and corundum substrates, the thermocapillary
migration of the droplets was simulated under the con-
ditions that θ = 45° (hydrophilic condition) and θ = 90°.
3 Mathematical formulation and boundary
conditions
3.1 Gas–liquid two-phase flow of thermocapillary
mathematical model
The two-dimensional equations for the conservation
of mass, momentum, and energy for incompressible
and Newtonian fluids are expressed as
0i
i
u v
x y
(2)

Friction 6(1): 62–74 (2018) 65
∣www.Springer.com/journal/40544 | Friction
http://friction.tsinghuajournals.com
2 2
2 2i i x
i i
pu u u u uu v F
t x y x x y
(3)
2 2
2 2i i y
i i
pv v v v vu v F
t x y y x y
(4)
2 2
2 2ii p i
i i
T T T T TC u v k
t x y x y
(5)
where ui and vi are the velocity components in the x
and z directions, respectively; ρi is the fluid density;
μi is the dynamic viscosity; Cpi is the specific heat;
and ki is the thermal conductivity. The subscripts i = l,
a are used to represent liquid and air, respectively. Fx
and Fy are the surface tension forces in the x and y
directions, respectively.
The force generated by the differences at the
gas–liquid interface is given by the equation
T
u T
y x
(6)
Here, μ is the dynamic viscosity and T is the surface-
tension coefficient, which can be assumed to vary
linearly with temperature [12] such that
0 T 0( )T T (7)
where σ0 is the surface tension at the reference
temperature T0. The physical properties of the liquid
and gas are listed in Table 1.
3.2 Gas–liquid interface tracking method
The conservative level set [13, 14] method is commonly
used to manage the deformation of the free interface
Table 1 Physical properties of fluids (silicone-oil, air at 25 °C, molten silicone, Ar at 1,427 °C).
Physical property
Silicone-oil Air Molten silicon
Ar
ρ (kg/m3) 968 1.1614 2560 0.28
σ (N/m) 0.021 — 0.72 —
γт (N/(m·K)) 6 × 10⁻⁵ — 8 × 10⁻⁵ —
μ (Pa·s) 0.02 1.74 × 10⁻⁵ 7.5 × 10⁻⁴ 7.35 × 10⁻⁵
k (W/(m·K)) 0.1 2.63 × 10⁻² 0.21 5.7 × 10⁻²
Cp (J/(kg·K)) 1670 1007 2800 521
during droplet motion. In this method, the air Ω1 and
droplet Ω2 subdomains are separated by the interface
ϕ with the level set function ϕ = 0.5. The value of ϕ
smoothly increases from 0 to 1 with 0 ≤ ϕ < 0.5 in the
liquid-droplet subdomain, with 0.5 < ϕ ≤ 1 in the air
subdomain. The reinitialized convection of the interface
can be expressed as
( (1 )
tu (8)
where ε is the interface thickness, γ is the reinitialization
parameter, and u is the velocity vector. Note that γ
determines the numerical calculation of the conver-
gence in this case and should be of the same order of
magnitude as the maximum flow rate in the flow
field.
3.3 Boundary conditions
The left and right walls are nonslip adiabatic walls.
The upper wall is isothermal with no sliding property;
the bottom wall is a wetting surface with a uniform G.
The Navier slip condition is applied at the liquid–solid
boundary, such that
ls
uu b
y
(9)
where bls is the slip length and uτ is the velocity of the
fluid slip on the boundary.
4 Results and discussion
The droplet velocity v is defined as the velocity of the
droplet motion relative to the solid surface. The
method of numerical simulation used to calculate
v gives the average velocity, which is obtained by
integration of the velocities of each point inside the
droplet, followed by division by the volume integral
of the entire droplet.
To verify the accuracy of the conservative level set
method, the numerical simulation results obtained
for a silicone-oil droplet were compared with the
experimental results. On the basis of this numerical
calculation method, the thermocapillary migration
processes of molten silicon droplets on graphite and
corundum substrates were studied. The thermocapillary

66 Friction 6(1): 62–74 (2018)
| https://mc03.manuscriptcentral.com/friction
migration process for droplets primarily includes a
dynamic change in the gas–liquid two-phase flow
field, a T change of the droplets and the surrounding
gas, and deformation of the gas–liquid interface.
4.1 Analysis and validation of silicone-oil droplet
migration model
4.1.1 Slip length effect
Figure 2 illustrates the change in the silicone-oil
migration rate over time t for slip lengths b = 1, 3, and
5 nm. In the initial stage (t < 0.5 s), the greater the
value of b, the greater the droplet migration rate has.
When the migration velocity becomes stable, the effect
of b on the silicone-oil migration rate decreases. The
stable migration velocity of the silicone oil tends to be
consistent for all three examined b values. Previous
research has shown that the b of this model has little
effect on the thermocapillary migration rate [8], and
the computational model used to obtain the results
presented below was unified for all cases using b = 1.
Fig. 2 Effect of slip length on silicone-oil migration velocity.
4.1.2 Temperature gradient effect
Figure 3(a) illustrates the G effect on the silicone-oil
migration, as determined for G = 1.96, 5, and 20 K/mm
(the corresponding Marangoni (Ma) numbers are 28.8,
73.4, and 293.6, respectively), θ = 90°, and the droplet
contact diameter D = 1 mm. It is apparent that the
average migration rate changes with t. The Ma effect
(i.e., the thermocapillary convection intensity) is usually
expressed by the Ma numbers [15], where
TMa TL (10)
Here, ΔT is the temperature difference between
two contact lines, L is the contact length between
the droplet and bottom wall, and α is the thermal
diffusivity. A larger Ma number indicates greater
internal thermocapillary convection intensity. As shown
in Fig. 3(a), the silicone-oil droplet thermocapillary
migration velocity first increases rapidly, before
gradually decreasing to a steady process. The greater
the value of G, the greater the maximum v and the
shorter the time taken to reach the maximum v; this
behavior indicates that the instantaneous acceleration
of the droplet migration increases as G increases.
This is because the variation in σ from lower values
on the warm side of the interface to higher values on
the cool side generates a flow in the droplet, which
exerts a hydrodynamic force on the solid surface that
points in the direction of the applied G. The solid
surface, which is held immobile, exerts an equal and
opposite reaction on the droplet that propels it in the
opposite direction [16], i.e., toward cooler regions.
Under suitable conditions, quasisteady motion, for
Fig. 3 (a) Silicone-oil migration velocity under different temperature gradients G with Marangoni Ma numbers of 28.8, 73.4, and 146.8.(b) Comparison of computational fluid dynamics (CFD) and experimental results for silicone-oil migration velocity at G = 1.96 K/mm and contact angle θ = 40°.

Friction 6(1): 62–74 (2018) 67
∣www.Springer.com/journal/40544 | Friction
http://friction.tsinghuajournals.com
which the net hydrodynamic force on the droplet is
zero, can be achieved.
Equation (6) shows that the shear stress produced
by the thermocapillary effect on the gas–liquid inter-
facial surface is proportional to G. These trends are
consistent with experimental phenomena [17].
In the numerical simulation, the boundary conditions
were chosen such that the static θ = 40° and the
substrate G was 2 K/mm; these conditions are identical
to those reported for a previous experiment conducted
by Tseng [8]. Figure 3(b) illustrates the numerical
and experimental results for the thermocapillary
migration of the silicone-oil droplet. A certain degree
of consistency is apparent between the different sets of
results, which verifies the accuracy of the conservation
level set method. Therefore, the numerical simulation
can provide basic and detailed physical quantities
for the droplets, such as the flow, p, and T fields
during the migration. However, because the numerical
simulation does not consider the effect of buoyancy
convection and gravity, certain inconsistencies exist
between the numerical and experimental results.
4.1.3 Detailed flow and temperature fields inside silicone-
oil droplet
Figure 4 illustrates the variation in the internal T
distribution of the silicone-oil droplet over time, for
Ma = 146.8, bls = 1 nm, θ = 90°, G = 20 K/mm, and D =
1 mm. The colored lines indicate isotherms, and the
T difference between two adjacent isotherms is 0.8 K.
The initial stage of the droplets and the T of the
surrounding gas constitute the reference temperature.
With increasing t, heat is transferred from the substrate
to the droplets and air. Because the thermal diffusion
coefficient of silicone oil is greater than that of air, heat
is transmitted faster in the droplets and eventually
forms the obtained T distribution. As shown in Fig. 5
(t = 0.01 s), in the high-T region (left side), the inner
vortex is greater; this is attributed to the greater G.
Two vortices are formed in the gas area around the
droplets, and development of this asymmetric vortex
pushes the droplet toward the low-T region.
In contrast to the internal flow field of the droplet
shown in Fig. 6, the T and V fields are almost decoupled
at 0.01 s, and the T field does not reflect the disturbance
Fig. 4 Temperature T changes in silicone oil with time t at θ = 90° and G = 20 K/mm.
68 Friction 6(1): 62–74 (2018)
| https://mc03.manuscriptcentral.com/friction
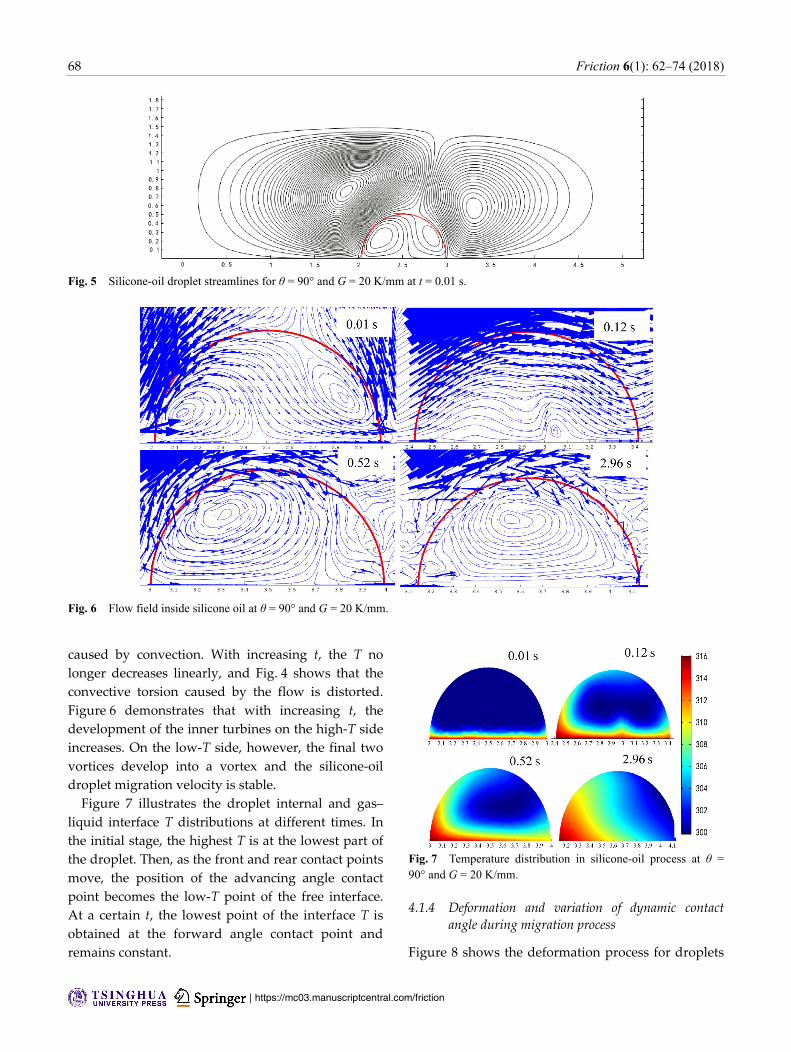
caused by convection. With increasing t, the T no
longer decreases linearly, and Fig. 4 shows that the
convective torsion caused by the flow is distorted.
Figure 6 demonstrates that with increasing t, the
development of the inner turbines on the high-T side
increases. On the low-T side, however, the final two
vortices develop into a vortex and the silicone-oil
droplet migration velocity is stable.
Figure 7 illustrates the droplet internal and gas–
liquid interface T distributions at different times. In
the initial stage, the highest T is at the lowest part of
the droplet. Then, as the front and rear contact points
move, the position of the advancing angle contact
point becomes the low-T point of the free interface.
At a certain t, the lowest point of the interface T is
obtained at the forward angle contact point and
remains constant.
Fig. 7 Temperature distribution in silicone-oil process at θ = 90° and G = 20 K/mm.
4.1.4 Deformation and variation of dynamic contact
angle during migration process
Figure 8 shows the deformation process for droplets
Fig. 5 Silicone-oil droplet streamlines for θ = 90° and G = 20 K/mm at t = 0.01 s.
Fig. 6 Flow field inside silicone oil at θ = 90° and G = 20 K/mm.

Friction 6(1): 62–74 (2018) 69
∣www.Springer.com/journal/40544 | Friction
http://friction.tsinghuajournals.com
under boundary conditions of θ = 90° and G = 20 K/mm.
The non-uniform distribution of the gas–liquid interface
generates differences in the gas–liquid surface p that
deform the droplet.
From the current simulation, θ increases during the
migration process and then stabilizes at a fixed value,
while the advancing angle is always greater than
the receding angle. It can be seen from Fig. 9 that the
advancing and receding angles [18] increase before t =
0.01 s, because the droplet gradient produces shear
stress that deforms the interface. Moreover, changes
in the interface curvature vary the internal and external
differential p values, thereby altering θ. The gas–liquid
interfacial deformation yields capillary convection
within the droplet. Note that the capillary flow is
caused by the different curvatures at the droplet
interface. According to the Young–Laplace equation,
Fig. 9 Receding/advancing dynamic contact angles of silicone oil droplet.
for droplets,
2p
R
(11)
where p represents the droplet pressure difference
and R is the droplet interface curvature. The droplet
deformation during the migration induces the difference
in the interface curvature at the droplet interface.
The smaller the curvature, the greater the difference
is between the inside and outside p values. Therefore,
the capillary flow occurs from the smaller side of the
curvature to the larger side, and the droplet interface
shape affects the capillary convection direction.
Figure 8 demonstrates that the capillary convection
direction is opposite and resistant to the thermo-
capillary convection (Marangoni convection); this
behavior ultimately stabilizes the advancing and
receding angles at a constant value.
4.2 Numerical simulation of thermocapillary
migration of molten silicon droplets
Figure 10 shows the changes in the static θ values of
the silicon liquid on the graphite and corundum surfaces
in response to changing T. Here, θ decreases rapidly as
T increases from the silicon melting point to 1,700 K.
The Young equation [19] is given by:
LG SG SLcos (12)
Fig. 8 Change of interface shape during silicone oil migration.

70 Friction 6(1): 62–74 (2018)
| https://mc03.manuscriptcentral.com/friction
Fig. 10 θ curves of molten silicon on polished graphite and corundum surface (Ar).
This equation illustrates the relationship between
the static θ, the gas–liquid surface tension LG
( ) , the
solid–air interfacial tension SG
( ) , and the solid–liquid
interfacial tension SL
( ) . With increasing T, of the
silicon liquid decreases linearly [20] and the liquid
surface of the silicon liquid in the argon atmosphere
decreases, thereby decreasing θ. The penetration of
the graphite interior by the silicon liquid passing
through the graphite surface pores is another important
factor that contributes to the θ reduction of the molten
silicon on the graphite substrate [21]. This behavior
yields greater reduction of the θ value on the graphite
substrate than that on the corundum substrate. Further,
at 1,700 K, the molten silicon density changes abnormally.
The coefficient of body expansion in this T region is
eight times (8×10⁻⁴ °C−1) that in the T region beyond
1,700 K, and is obviously caused by the change in θ.
Once T reaches and exceeds 1,700 K, θ remains almost
constant.
Figures 11(a) and 11(b) illustrate the variation trend
of the average migration velocities of the molten silicon
droplets on the corundum and graphite substrates,
respectively, for G = 2, 5, and 20 K/mm. The initial T
is 1,700 K and the static θ values of the molten silicon
on the graphite and corundum substrates are 45°
and 90°, respectively. With increasing substrate G,
the average migration velocity increases and the
instantaneous velocity on the graphite substrate
(t = 0.009 s) is as high as 1.8 m/s. Compared with the
silicone-oil droplets, the differences in the thermal
diffusivity, μ, and v values of the molten silicon
droplets are greater.
Figures 12 and 13 illustrate the changes in the
internal T and flow fields of the droplets, respectively,
during molten silicone droplet migration on the
graphite substrate (G = 20 K/mm). In these figures, the
colored lines represent isotherms, and the T difference
between each adjacent pair of lines is 6 K. The substrate
has a linear G; therefore, as the substrate heat is
transferred inside the silicon droplets, a surface
tension gradient is generated at the gas–liquid interface
that causes the droplets to move from the region with
lower σ to the region with higher σ. Further, a shear
stress is generated from the high- to low-T regions on
the silicon liquid surface, as indicated by Eq. (6). The
μ effect causes the formation of reflux in the silicon
liquid.
Figure 13 shows that the thermocapillary convection
influences the silicon liquid and forms two vortices
with opposite directions. As the vortices change, the
clockwise vortex undergoes greater development,
which pushes the droplets toward the low-T side. The
Fig. 11 (a) Thermocapillary migration velocities of molten silicon on (a) corundum (θ = 90°) and (b) graphite (θ = 45°) substrates under different G.

Friction 6(1): 62–74 (2018) 71
∣www.Springer.com/journal/40544 | Friction
http://friction.tsinghuajournals.com
development of the vortex affects the distribution of
the internal T of the silicon liquid. It can be seen from
Fig. 12 that the distribution of the contours reflects
the vortex shape, indicating coupling of the T and
flow fields. As the interfacial T increases while the σ
decreases, the droplet has a tendency to spread.
Figures 14 and 15 show the change in the internal
T and the flow fields of the molten silicon droplets
at G = 20 K/mm on the corundum substrate. The T
difference between each pair of isotherm lines is 4 K.
Fig. 12 Variation of T field of molten silicon droplet on graphite substrate (θ = 45°) during motion process.
Fig. 13 Change of flow field of molten silicon droplet on graphite substrate (θ = 45°) during motion process.

72 Friction 6(1): 62–74 (2018)
| https://mc03.manuscriptcentral.com/friction
Compared with the graphite substrate, the silicon liquid
on the corundum substrate produces two vortices
during the migration process. As the silicon liquid
migrates to the cold side, the two vortices gradually
disappear and form a stable laminar flow from the
high- to low-T regions.
Fig. 14 Variation of T field of molten silicon droplet on corundum (θ = 90°) substrate during motion process.
Fig. 15 Change of flow field of molten silicon droplet on corundum substrate (θ = 90°) during motion process.

Friction 6(1): 62–74 (2018) 73
∣www.Springer.com/journal/40544 | Friction
http://friction.tsinghuajournals.com
5 Conclusion
The thermocapillary actuation mechanism of a molten
silicon droplet in a microchannel was studied via
numerical computation, and the results were compared
with experimental results. It was found that the
variation in the surface tension from lower values on
the hot side of the interface to higher values on the
cool side generates a flow in the droplet, which exerts
a hydrodynamic force on the solid surface in the
direction of the applied temperature gradient. The
solid surface, which is held immobile, exerts an equal
and opposite reaction on the droplet that propels it
in the opposite direction, i.e., toward cooler regions.
Under suitable conditions, quasisteady motion can be
achieved, wherein the net hydrodynamic force on the
droplet is zero. Four horizontal vortex arrangements
were generated during the migration process of the
molten silicon droplet on a graphite substrate: two
clockwise and two counterclockwise. During the same
migration process, two vortices were formed on a
corundum substrate. The vortices disappeared and
gradually formed a stable laminar flow, and the droplet
velocity became stable. These results indicate that the actuation behavior of
the droplet is strongly influenced by the temperature
gradient. A higher temperature gradient generates
higher droplet actuation velocity.
Acknowledgements
The authors appreciate the support from the Key
Program of the National Natural Science Foundation
of China (Grant No. 51335002) and Key support projects
of strategic emerging industries in Jiangsu Province
(Grant No. 2015-318).
Open Access: The articles published in this journal
are distributed under the terms of the Creative
Commons Attribution 4.0 International License (http://
creativecommons.org/licenses/by/4.0/), which permits
unrestricted use, distribution, and reproduction in
any medium, provided you give appropriate credit to
the original author(s) and the source, provide a link
to the Creative Commons license, and indicate if
changes were made.
References
[1] Abdullah O I, Schlattmann J. Thermal behavior of friction
clutch disc based on uniform pressure and uniform wear
assumptions. Friction 4(3): 228–237(2016)
[2] Cheng G, Jiang S, Khosla T, Pesika N S, Ding J, Zhang Y,
Wang Y. Synthesis of hard carbon/iron microspheres and
their aqueous-based tribological performance under magnetic
field. Tribol Lett 64: 48–56 (2016)
[3] Qian X, Xiang Y, Shang H, Cheng B, Zhan S, Li J. Thermal-
oxidation mechanism of dioctyl adipate base oil. Friction
4(1): 29–38 (2016)
[4] Heise R. Friction between a temperature dependent viscoelastic
body and a rough surface. Friction 4(1): 50–64 (2016)
[5] Li H, Tian P, Lu H, Jia W, Du H, Zhang X, Li Q, Tian Y.
State-of-the-art of extreme pressure lubrication realized
with the high thermal diffusivity of liquid metal. ACS Appl
Mater Interfaces 9 (6): 5638–5644 (2017)
[6] Brzoska J B, Brochardwyart F, Rondelez F. Motions of
droplets on hydrophobic model surfaces induced by thermal
gradients. Langmuir 9(8): 2220–2224 (1993)
[7] Brochard F. Motions of droplets on solid-surfaces induced
by chemical or thermal gradients. Langmuir 5(2): 432–438
(1989)
[8] Tseng Y T, Tseng F G, Chen Y F, Chieng C C. Fundamental
studies on micro-droplet movement by marangoni and capillary
effects. Sensors & Actuators A Physical 114(2): 292–301
(2004)
[9] Chen J Z, Troian S M, Darhuber A A, Wagner S. Effect of
contact angle hysteresis on thermocapillary droplet actuation.
Journal of Applied Physics 97(1): 257–1882 (2005)
[10] Li X, Guo F, Wang S, LIU C, WANG W. Behaviors of a
micro oil droplet in an EHL contact. Friction 4(4): 359–368
(2016)
[11] Guo F, Wong P, Luo J. Guest editorial: Special issue on
thin film lubrication. Friction 4(4): 277–279 (2016)
[12] Rhim W K, Ohsaka K. Thermophysical properties mea-
surement of molten silicon by high-temperature electrostatic
levitator: density, volume expansion, specific heat capacity,
emissivity, surface tension and viscosity. Journal of Crystal
Growth 208(1): 313–321 (2000)
[13] Olsson E, Kreiss G, Zahedi S. A conservative level set
method for two phase flow II. Journal of Computational
Physics 225(1): 785–807 (2005)
[14] Zahedi S, Kronbichler M, Kreiss G. Spurious currents in a
finite- element based level set method for two phase flow.
International Journal for Numerical Methods in Fluids 69(9):
1433–1456 (2009)

74 Friction 6(1): 62–74 (2018)
| https://mc03.manuscriptcentral.com/friction
[15] Wu Z B. Thermocapillary migration of a droplet with a
thermal source at large Reynolds and Marangoni numbers.
International Journal of Heat & Mass Transfer 75(16):
704–709 (2014)
[16] Le T L, Chen J C, Shen B C, Hwu F S, Nguyen H B.
Numerical investigation of the thermocapillary actuation
behavior of a droplet in a microchannel. International Journal
of Heat & Mass Transfer 83(3): 721–730 (2015)
[17] Felix Otto. Lubrication approximation with prescribed
nonzero contact angle. Communications in Partial Differential
Equations 23(11–12): 63–103 (1998)
[18] Hong S J, Chou T H, Liu Y Y, Sheng Y J, Tsao H K.
Advancing and receding wetting behavior of a droplet on a
narrow rectangular plane. Colloid and Polymer Science
291(2): 347–353 (2013)
[19] Robert J. Contact angle, wetting, and adhesion: a critical
review. Journal of Adhesion Science and Technology 6(12):
1269–1302 (1992)
[20] Shishkin A V, Basin A S. Surface tension of liquid silicon.
Theoretical Foundations of Chemical Engineering 38(6):
660–668 (2004)
[21] Li J G, Hausner H. Wetting and infiltration of graphite
materials by molten silicon. Scripta Metallurgica Et Materialia
32(3): 377–382 (1995)
Tao SUN. He received his bachelor
degree in mechanical engineering in
2014 from Changzhou University,
Changzhou, China. After then,
he was a master of Collaborative
Innovation Center of Photovoltaic
Science and Engineering at the same university.
He will obtain his master degree of engineering in
mechanical engineering at Changzhou University in
June, 2017. His research interests include manufacture
and equipment of new energy materials and devices.
Jianning DING. He received his
Ph.D. degree in mechanical enginee-
ring from Tsinghua University,
China, in 2001. He joined Jiangsu
University between 1991–2007.
He is a research fellow in City
University of Hong Kong from
2002 to 2003. His current position is a professor and
vice president of Changzhou University. He is the
director of Center for low-dimensional materials,
micro-nano devices and system, director of Jiangsu
Collaborative innovation center of “Photovoltaic
science and engineering” in 2011, director of Jiangsu
Key Laboratory for Solar Cell Materials and
Technology, the head of Science and Technology
Innovation Team in Jiangsu Universities, and the chief
scientist in the first level of young and middle-aged
in “333 project” of Jiangsu province. His research
areas cover the research of new energy materials,
low-dimensional materials, micro-nano devices and
system, and tribology. Above 500 academic papers
and 6 books were published.


![AMADEUS Rome 5.12.17 WP4 [Modo de compatibilidad] · 2018. 10. 2. · Molten Silicon Storage of Concentrated Solar Power with Integrated Thermophotovoltaic Energy ... Microsoft PowerPoint](https://img.dokumen.tips/doc/110x75/60fb5574de26b1129b131860/amadeus-rome-51217-wp4-modo-de-compatibilidad-2018-10-2-molten-silicon.jpg)