Embed Size (px)
Citation preview
NASA-CR-159039
NASA CR 159039 19800016839
Thermal-Structural Design Studyof an Airframe-Integrated ScramjetFinal Report
J.J. Killackey, E.A. Katinszky,S. TepperA.A. Vuigner, C.C. Wright, and G.G. Stockwell
AIRESEARCH MANUFACTURING COMPANY OF CALIFORNIAA Divisionof The GarrettCorporation
CONTRACT NAS 1-13984 LIbrArY _OPY
May 1980 .,_' t 1S89
I.ANGL_-¥RF,'SE'AR(JHCENTERLIBRARY NAS/% HAMPTON, V/k.
N/ ANationalAeronautics andSpace Administration
Langley Research CenterHampton. Virginia23665AC 804 827-3966
https://ntrs.nasa.gov/search.jsp?R=19800016839 2020-03-24T03:28:30+00:00Z

NASA CR 159039
Thermal-Structural Design Study
of an Airframe-Integrated ScramjetFinal Report
J.J. Killackey, E.A. Katinszky, S. TepperA.A. Vuigner, C.C. Wright, and G.G. Stockwell
AIRESEARCH MANUFACTURING COMPANY OF CALIFORNIAA Division of The Garrett Corporation
CONTRACT NAS 1-13984May 1980
N/ANational Aeronautics andSpace Administration
Langley ResearchCenterHampton, Virginia 23665AC 804 827-3966
A/2O- _.533 V -,_

CONTENTS
Page
INTRODUCTION............................................... 1
SYMBOLS .................................................... 2
ENGINE DESCRIPTION ......................................... 3
DESIGH CONDITIONS .......................................... 7
Internal Flow Properties .............................. 8Pressure Loads ........................................ 10Inertia Loads ......................................... I0Structural Design Criteria ............................ 10Fuel/Coolant Conditions ............................... 14
DESIGN LOADING ............................................. 15
Aerodynamic Heating ................................... 15Heat Load Summary ..................................... 18Leading Edge Heat Flux ................................ 18Corner Flow Heating ................................... 20Strut Pressure Loads .................................. 21Panel Pressure Loads .................................. 21
DESIGN APPROACH ............................................ 23
iiiiiiiii!il;iiii!iiiiii!iiiiiiiiiiiiiiiiiiii!ili!iiiiilFuel System .............. 26Layout Design ......................................... 26
DESIGN AND PERFORMANCE ..................................... 27
Material Selection .................................... 27
Thermal protection system (TPS) .................. 27Primary structure ................................ 29Final selections ................................. 29
Coolant Flow Routing .................................. 30Design conditions ................................ 30Design goals ..................................... 30Manifold orientation ............................. 30Component flow arrancement ....................... 30Outlet manifold position optim zation ............ 32Strut flow routing ............................... 37
iii
COrITENTS (Continued)
Page
Flight Envelope Cooling Requirements .................. 37Thermal Protection System (TPS) ....................... 40
Heat exchanger design ............................ 40Structural design ................................ 46Performance summary .............................. 54
Leading Edges ......................................... 54Flow rate options ................................ 58Geometric constraints ............................ 58
Heat transfer performance ....................... 59Cycle life analysis .............................. 62
Fuel Injection Struts ................................ 63Hydrogen manifolding design options .............. 63Manifold design conditions ....................... 65Tubular manifold design .......................... 65Integral manifold design ........................ 65Midspan tie ...................................... 88Side strut structural analysis ................... 91Strut/panel interface analysis ................... 99
Primary Structure ..................................... 125Three dimensional finite element models .......... 125
Design selection ................................. 137External cowl panel .............................. 137Topwall nonuniform heat flux analysis ............ 140Thermal transient analysis ....................... 156Engine layout design ............................. 185
ENGIME-AIRCRAFT IHTERFACE .................................. 201
HYDROCEM FLOW CONTROL ...................................... 203
Coolant Flow Routing .................................. 203Fuel System ........................................... 204
Fuel system schematic ............................ 204Hydrogen supply ................................. 206Helium supply .................................... 206Computer ........................................ 206Turbopump subsystem .............................. 206Valves .......................................... 208
CONCLUDIHG REMARKS ......................................... 211
Cooled Structure ...................................... 211
Coolant Flow Routing .................................. 211Thermal Protection System ............................. 212Leading Edges ......................................... 212Fuel Injection Struts ................................. 212Engine-Aircraft Interface ............................. 213
iv

CONTENTS (Continued)
Page
Hydrogen Flow Control ................................. 213
REFERENCES ................................................. 213
APPE_DIX
Conversion Factors .................................... A-I
LIST OF ILLUSTRATIONS
Figure Page
I Scramjet engine configuration and installation ..... 32 Scramjet thermal-structural design ................. 63 Salient features of cooled scramjet structure ...... 64 Altitude-Mach number envelope ...................... 85 Flow properties for internal surfaces of outboard
module (Condition H) ............................. 9
6 Engine unstart pressure distribution ............... 117 Aerodynamic heating rates on engine internal
surfaces (Condition H) ........................... 16
8 External surface thermal loading, Condition H ...... 179 Comparison of laminar and turbulent heating in a
corner; sharp leading edge ....................... 2010 Strut loads, transient unstart conditions .......... 2211 Panel flow routing schemes ......................... 3112 Primary structure temperature profiles ............. 3313 Sidewall shunt coolant distribution concept .. 34
14 Coplanar outlet manifolds and shunt flow routi_iiiii. 35
15 Coolant flow conditions ....................... 36
16 Selected strut coolant flow path ............... 3717 Engine cooling requirements ................... 3918 Engine heat loads ............................. 4119 TPS heat exchanger configurations .................. 4220 TPS heat exchanger performance ..................... 4321 Elastic-plastic cycle .............................. 4622 TPS structural design fin configurations ........... 4723 Finite element model ............................... 48
24 Effective stresses (ksi) in plate-fin structure .... 4925 TPS response to thermal gradient ................... 5126 Cycle life for formed-fin TPS ...................... 5227 Cycle life for machined-fin TPS .................... 5328 TPS configuration .................................. 5629 Leading edge cooling options ....................... 5730 Leading edge radius for direct impingement concept . 5831 Leading edge radius for indirect impingement concept 5932 Typical temperature gradients around sidewall and
side strut leading edges ......................... 6033 Cowl apex in the cowl plane ........................ 6334 Center strut fuel/coolant passages concepts ....... 6435 Cross-sectional sketch of side strut and TPS wall
structure ........................................ 6836 Cross-sectional sketch of center strut ............. 6837 TPS coolant flow path .............................. 6938 Strut heat flux distribution ....................... 7139 Header flow model .................................. 7340 Manifold pressure distribution equation for discrete
fluid withdrawl .................................. 73
vi
ILLUSTRATIONS (Continued)
Figure Page
41 Summary of center strut perpendicular injectornozzle sizes ..................................... 77
42 Summary of center strut parallel injector nozzlesizes ............................................ 78
43 Summary of side strut perpendicular injector nozzlesizes ............................................ 79
44 Summary of side strut parallel injector nozzle sizes 8045 Static pressure distribution in center strut TPS
coolant manifolds ................................ 81
46 Static pressure and flow distribution in the sidestrut TPS coolant manifolds ...................... 82
47 TPS coolant temperature distribution in the centerstrut ............................................ 83
48 TPS coolant temperature distribution in the sidestruts ........................................... 83
49 Heat transfer coefficients in center strut TPScoolant surfaces ................................. 85
50 Heat transfer coefficients in the side strut TPScoolant surfaces ................................. 85
51 Heat transfer coefficients in the center strut TPSinlet and outlet coolant manifolds ............... 86
52 Heat transfer coefficients in the side strut TPSinlet and outlet coolant manifolds 86
53 Heat transfer coefficients in the center strut per-pendicular and parallel injector manifolds ....... 87
54 Heat transfer coefficients in the side strut per-pendicular and parallel injector manifolds ....... 87
55 Midspan tie design ................................. 8956 Finite element model of three-strut assembly ....... 9057 Boundary conditions adjusted for thermal growth
and rotation ..................................... 92
58 Effective (yon _ises) stresses--highly stressedareas with midspan tie ........................... 93
59 Absolute deformation with midspan tie, perpendicularto flow, due to pressure only .................... 94
60 Absolute deformation with midspan tie, parallel toflow, due to pressure only ....................... 95
61 Modified strut structural design with midspan tie .. 9762 Side strut structure for increased-cooling analysis 9763 Side strut model with key nodes .................... 9864 Starboard wall centroid maximum principal stress,
surface C ........................................ iO0
65 Starboard wall centroid minimum principal stress,surface C ........................................ 101
66 Port wall centroid maximum principal stress,surface C ........................................ 102
67 Port wall centroid minimum principal stress,surface C ........................................ 103
vii
ILLUSTRATIONS (Continued) .
Figure Page
68 Starborad wall displacements....................... 10469 Starboard wall schematic........................... 105
70 Reactions at constrained degrees of freedom,SPAR output..................................... 106
71 Finite element model of side strut substructure _o. I 10872 Finite element model of seal between the side strut
and the topwall, substructure Mo. 3............. 11073 NASA Scramjet, finite element model of the topwall,
substructure No. 2.............................. 112
74 NASA Scramjet, typical horizontal sections (paral-lel to X-Y plane) through 3D solid finite ele-ments of substructure No. 2 (topwall)........... 113
75 NASA Scramjet, vertical sections through 3D solidfinite elements of substructure No. 2 (topwall). 113
76 Finite element representation of the layered honey-comb model ...................................... 114
77 NASA Scramjet layout of membrane finite elements torepresent the cold and TPS hot sheets in sub-structure No. 2 (topwall)....................... 118
78 NASA Scramjet, derivation of boundary conditionsfor substructure Ho. 2 ......................... 117
79 NASA Scramjet, pressure distribution in substruc-ture No. 2 (topwall) for symmetrical unstartcondition, Ib/sq in............................. 118
80 NASA Scramjet, temperature distribution in sub-structure No. 2 (topwalI) for symmetricalunstart condition............................... 119
81 Summary of seal performance for three differentcases of initial clearance...................... 124
82 Primary support structure for swept beam model ..... 12783 Clip geometry used in analysis .................... 12984 Plate-beam element sliding connection simulation... 13085 Honeycomb thickness variation (all honeycomb model)86 Finite element models ............................ 13187 Sidewall performance .............................. 13388 Topwall performance .............................. 13489 Cowl performance .................................. 13590 Sidewall distorted geometry ...................... 13691 Nozzle deformation ................................ 13892 Basic features of top surface flow ield .......... 14193 Typical top surface heat flux distribution along a
flow path (streamline 5) ....................... 14494 Top surface heat flux distribution for a combina-
tion of flow paths ............................. 14595 Machined channel passage configuration ............ 14796 Topwall temperature distribution for maximum
heating path ................................... 148
viii
ILLUSTRATIONS (Continued)
Figure Page
97 Two-dimensional temperature distribution for top-wall............................................ 149
98 NASA Scramjet, TPS/hot face sheet isotherms (°F)... 15199 Topwall finite element model, isometric view ....... 153I00 Honeycomb cell configuration....................... 155101 Honeycomb cell finite element model................102 Distorted geometry of the cold face sheet.......... 157103 Maximum principal stresses of the cold face sheet.. 158104 Minimum principal stresses of the cold face sheet.. 159105 Maximum shear stresses for the cold face sheet..... 160
I06 Perpendicular displacement contours for the coldface sheet...................................... 161
I07 Maximum principal stresses for the TPS hot facesheet........................................... 162
108 Distorted geometry for the TPS hot face sheet...... 163109 Minimum principal stresses for the TPS hot face
sheet........................................... 164110 Maximum shear stress for the TPS hot face sheet.... 165I11 Perpendicular displacement contours for the TPS hot
face sheet...................................... 166112 Effective stresses of TPS hot face sheet and cold
face sheet...................................... 167
113 Model for transient temperature analysis .......... 169114 Mission profile.................................... 171115 Coolant outlet temperature......................... 172I16 Structural temperature response.................... 172117 Sidewall honeycomb panel temperature profiles...... 173118 Honeycomb transient analysis thermal model,
topwall-sidewall corner ........................ 174119 Sidewall temperature histories, cruise mission ..... 175120 Topwall temperature histories, cruise mission...... 176121 Sidewall temperature histories, cruise mission..... 177122 Topwall temperature distribution, cruise mission... 179123 Topwall/sidewall temperature distribution, cruise
mission ......................................... 180124 Transient stress analysis model.................... 181125 Startup transient distortions...................... 181126 Steady-state distortions of the Scramjet honeycomb
model (Stn. 58.83) .............................. 182
127 Shutdown distortions of the Scramjet honeycomb _-model (Stn. 58.83).............................. 183
128 Peak thermal stresses (elastic).................... 184
129 Backside heat exchanger, two-pass TPS/structure .... 186130 Honeycomb core design, large &T .................... 186131 Engine mounting considerations..................... 202132 Engine fuel system................................. 205
ix

LIST OF TABLES
Table Page
I Inertia loading, G units......_.................... 132 Heat loads at Condition H.......................... 19
3 Leading edge heat fluxes at Condition H............ 194 Material properties for TPS candidate alloys....... 285 Materials selected for design...................... 296 Altitude-Mach number envelope coolant requirements. 387 Sidewall TPS temperature gradient and pressure drop 458 TPS performance.................................... 559 Leading edge thermal performance HastelIoy X
material ........................................ 61
I0 Leading edge cycle life............................ 6211 Tubular manifold performance....................... 6612 Strut fuel injection manifold and nozzel design
conditions ...................................... 7013 Strut coolant manifold and TPS design conditions... 7014 NASA Scramjet, summary of the seal behavior between
the side strut and the topwall (Case 7 - initialclearance = 0.0 in.)............................ 121
15 NASA Scramjet, summary of the seal behavior betweenthe side strut and the topwall (Case 2 - initialclearance = 0.010 in.).......................... 122
16 NASA Scramjet, summary of the seal behavior betweenthe side strut and the topwall (Case 3 - initialclearance = 0.020 in.).......................... 123
17 NASA Scramjet, boundary conditions for the sparside strut model (Case 3 - initial clearance
= 0.020 in.)...... ... 12618 Corner displacementS'::::::::::::::::::::::...::... 739
20 Streamline sequence of events..! :: 14221 Numerical results, engine topwa 15222 Critical topwall stresses ...... .. 16923 Fuel system components (two groups of modules; six
modules total) ................................. 207
24 Turbopump subsystem, three modules................. 20925 Fuel system plumbing line size .................... 210
INTRODUCTION
The Langley Research Center of NASA has been involved in a research
program for the development of airframe-integrated Scramjet concepts. Theseconcepts use the entire undersurface of the aircraft to process the engineairflow. The forebody of the aircraft serves as an extension of the engineinlet and the afterbody serves as an extension of the engine nozzle.
The NASA Hypersonic Research Engine (HRE) program (ref. I) was a majorcontributor to the development of Scramjet technology. This program culminatedin two major milestones: (I) successful development of the first flight-weight,hydrogen-cooled engine structure, including verification tests in the NASA-Langley 8-Foot High-Temperature Structures Tunnel; and (2) confirmation ofdual-mode (subsonic/supersonic combustion) aero-thermodynamic performance atMach 5 to 7 in the NASA-Lewis facility at Plum Brook. Baseline data for thecurrent study were also taken from the NASA-sponsored hydrogen-cooled panelstudies (refs. 2 and 3).
Subsequent research at NASA-Langley has led to a lightweight, fixed-geometry, modular, airframe-integrated Scramjet engine concept that promiseshigh installed performance (net thrust) over a wide Mach number range. Per-formance predictions for this hydrogen-fueled, regeneratively cooled Scramjetindicate a cooling requirement that is less than the heat sink available inthe hydrogen fuel up to at least a flight Mach number of I0. This providesa potential for actively cooling the airframe.
The current study is an extension of the preliminary thermal-structuraldesign of an airframe-integrated Scramjet study conducted by NASA (ref. 4).The objective is todefine a practical engine concept that has a sound basisin materials and manufacturing technology. Emphasis is placed on the enginethermal-structural design, although consideration is given to the fuel sub-system and the aircraft interface. The thermal-structural design evolved inthe ref. 4 study and the HRE technology form the basis for this effort. The
aerodynamic lines were defined by NASA-Langley and remained unchanged duringthe study. This report presents the results of the current study. A summaryis given in ref. 5.
Engine design is based on a research-size aircraft to provide a focalpoint; however, technological development is aimed at more advanced applica-tions. The importance of hypersonic technology, its potential applications,and the case for a hypersonic research vehicle are described by Hearth andPreyss (ref. 6). Convectively cooled engine and airframe structures for hyper-sonic flight are reviewed in ref. 7.
The Project Manager for NASA was Mr. A. R. Wieting, Thermal StructuresBranch, Structures and Dynamics Division, NASA Langley Research Center. TheAiResearch Program Manager was Mr. O. A. Buchmann. The principal contributorsto the study were Messrs. J. J. Killackey and G. G. Stockwell (ProgramEngineer); E. A. Katinszky, G. D. Mueller, and S. Tepper (Structural Analysis);A. A. Vuigner (Thermal Analysis); C. C. Wright (Strut Flow Analysis); andM. Cooke (Mechanical Design).
Values for the physical quantities are given primarily in U.S. Customaryunits. Values are also given in SI units for much of the material presented.Calculations were made in U.S. Customary units. A conversion table from U.S.Customary to SI units is included in the Appendix.
Identification of commercial products in this report is to adequatelydescribe the materials and does not constitute official endorsement, expressedor implied, of such products or manufacturers by the National Aeronautics andSpace Administration.
SYMBOLS
E Young's modulus, MPa (psi)
h heat transfer coefficient, W/cm2-°C (Btu/hr-ft2-°F)
k thermal conductivity, W/cm-°C (Btu/hr-ft-°F)
M_ free-stream Mach number, dimensionless
q_ free-stream dynamic pressure, Pa (psf)
RA reduction in area, dimensionless
Rx local Reynolds number, dimensionless
V_ free-stream velocity, m/sec (ft/sec)
coefficient of thermal expansion, I/°C (I/°F)
_y yield stress, Pa (psi)
_c cooling equivalence ratio (fuel used for regenerative enginecooling as fraction of fuel burned), dimensionless
_f fuel equivalence ratio burned, dimensionless
AP pressure drop, Pa (psi)
AT temperature difference, K (°R)
T temperature, K (°R)
P pressure, Pa (psi)
Two Temperature at outer (aerodynamic) surface of cooling jacket wall,K (°R)
Twi Temperature at inner surface of cooling jacket wall, K (°R)
_Tw Temperature difference across cooling jacket wall, Two-Twi, K (°R)
ENGINE DESCRIPTION
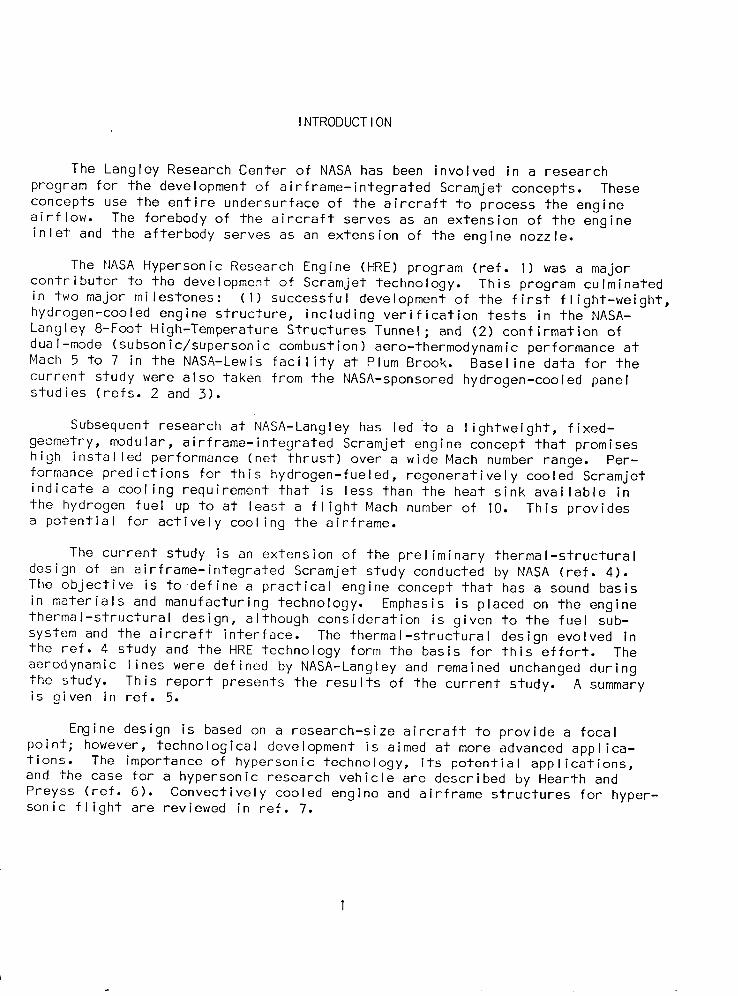
A typical installation of the Scramjet engines on a high-speed researchairplane is shown in fig. I. The rectangular modular engine is attacheddirectly to the vehicle undersurface. The aircraft forebody serves as theair inlet compression ramp and the afterbody serves as an extension of theengine nozzle; the entire undersurface is integrated into the engine design.The modular engines provide maximum capture of the airflow between the bodyand bow shock with minimum external drag. Since the Scramjet does not operateat low speeds, some form of takeoff and acceleration system is required. Inthe research application, the vehicle is air launched at Mach 0.8, rocket boos-ted to test Mach number, and flown on the hydrogen-fueled Scramjets over theprescribed envelope.
i
Fuel-inJect ion struts
Combustot
Inlet
Nozz ] e
COW 1 s3034*.A
Figure 1.-Scramjet engine configuration and installation.

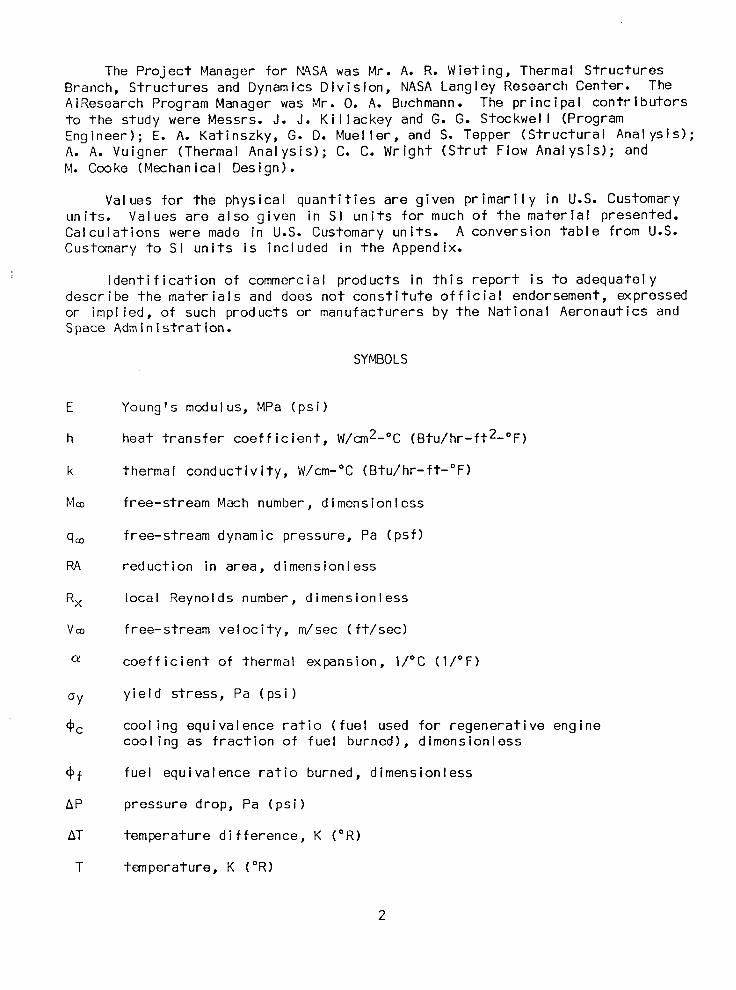
As a baseline, the Scramjets were sized for one concept of a hypersonicresearch vehicle that has a mass after rocket burn-out of 21,430 lb. Theaircraft is 20.3 m (66.7 ft) long and requires six Scramjet engine modules thatare located 12.2 m (39.9 ft) from the aircraft nose. Two inner Scramjet modulesare shown in fig. I; the side wall of one module is removed to show the internalengine surfaces. The Scramjet module is 45.7 cm (18.0 in.) high by 36.6 cm(14.4 in.) wide with an overall length of 314.3 cm (123.742 in.). Externalaerodynamic lines are defined in detail on Drawing 190062 (page 5).
The sidewall leading edges are swept back 48 deg and the cowl does not beginuntil engine station 49.031 (approximately 2.7 x inlet height); this providesan "open window" upstream of the cowl leading edge to spill flow downward duringthe inlet starting process at the low end of the Mach number range (ref. 4).This important design feature circumvents variable geometry.
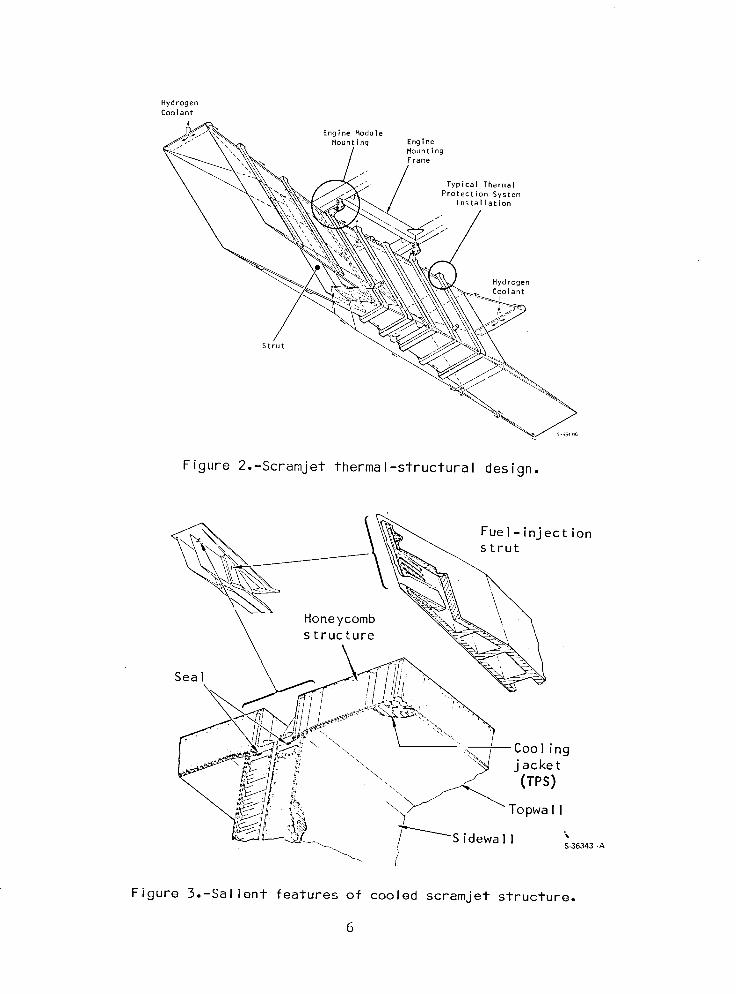
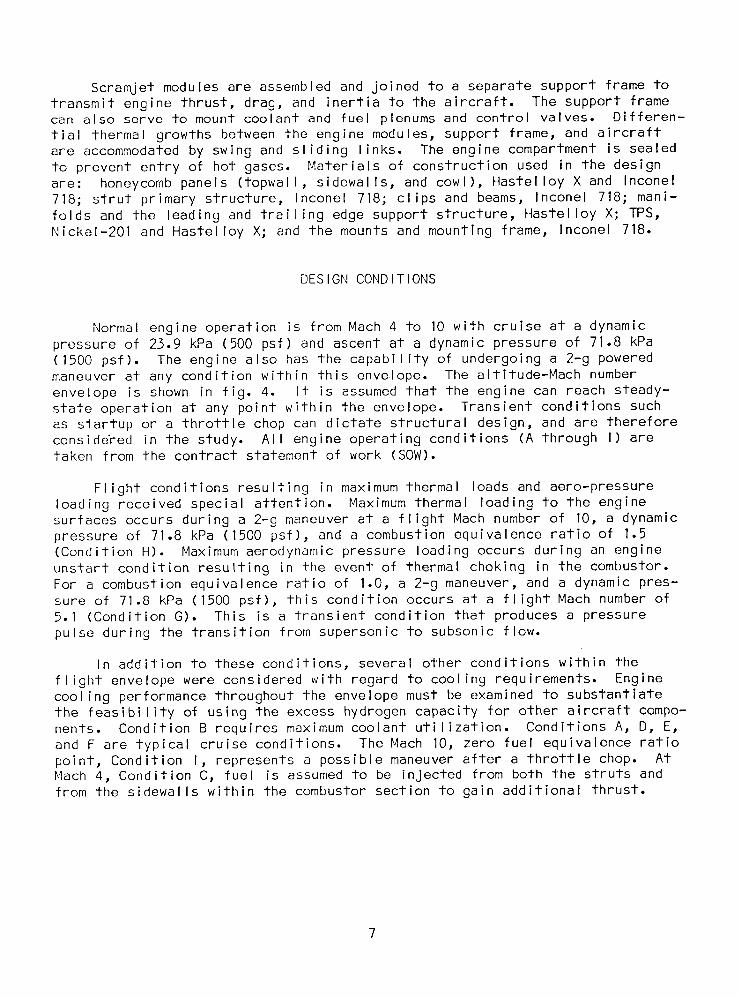
Three fuel injection struts are used for multiplaner fuel injection, whichenhances fuel mixing and thereby minimizes the combustor length and heat loadto the internal surfaces. To provide accessibility and replaceability of parts,each Scramjet module comprises four structural components: topwall, cowl,sidewalls, and three fuel injection struts. The two side struts are identical,asymmetric, and have 3/2 of the chord of the symmetric center strut.
The two module structural design concepts shown in figs. 2 and 3 wereconsidered. All engine internal and external surfaces exposed to gas flow arecooled regeneratively by circulating the cryogenically stored hydrogen fuelthrough a thermal protection system (TPS). The hydrogen fuel coolant is intro-duced at the leading and trailing edges (low heat load) and flows toward theengine throat (highest heat load), where it is collected in manifolds anddirected to the fuel plenum. From there, the hydrogen is routed to fuelmanifolds in each strut and injected into the airstream.
All leading edges are impingement cooled. Coolant is injected throughmultiple slots and impinges directly on the inside surface of the leading edge,turns, and then flows through the TPS surface. Impingement cooling using cryo-genic hydrogen provides a maximum possible cooling effect in these areas ofmaximum heat flux. Pressure and thermal loads acting on the panels are accom-modated by a honeycomb primary structure in the selected structural configura-tion. The panels are rigidly joined at the corners using a bolted connectionand static seals to contain the gas flow. The struts are inserted through open-ings in the topwall and secured by a fixed mount in the topwall and a slidingsupport in the cowl. Bulkheads within the struts provide separate manifoldsand contain the high-pressure hydrogen fuel and coolant.
The TPS is not considered as part of the primary load-carrying structure,although it must contain the high-pressure hydrogen coolant at elevated temper-atures. In the combustor section, the heat flux is intense and the in-depthtemperature gradient across the TPS is high. Under these conditions, the TPSgoes into a plastic state and the controlling factor in structural designbecomes Cyclic life. The cooling flow passages are parallel channels in thepanels and an offset pin-fin geometry in the struts. The passages are formedusing photo-chemical machining techniques.
/
~.
/
/-------,/
\-------===-------'-
I
I
~
2
2
.~-
I ~! Z now
j _LX _I
~\..! .....
-------_._-- -/[~--~----
--.--
I
I
J
•
·-.M.~O-
VIEW A.~L£)"1
HydrogenCoolant
LEngine Module
Mountlng Eng|neMountlngFrame
/"
Typical ThermalProtection System
Installation
/ o
HydrogenCoolant
Strut
Figure 2.-Scramjet thermal-structural design.
Fuel- inject ionstrut
Honeycombstructure
Seal
\ \. _. 1 Cooling
\_ _ jacket(TPS)\\\
\ TopwaII
_S idewaII \S 36343 -A
Figure 3.-Salient features of cooled scramjet structure.
6
Scramjet modules are assembled and joined to a separate support frame totransmit engine thrust, drag, and inertia to the aircraft. The support framecan also serve to mount coolant and fuel plenums and control valves. Differen-tial thermal growths between the engine modules, support frame, and aircraftare accommodated by swing and sliding links. The engine compartment is sealedto prevent entry of hot gases. Materials of construction used in the designare: honeycomb panels (topwall, sidewalls, and cowl), Hastelloy X and Inconel718; strut primary structure, Inconel 718; clips and beams, Inconel 718; mani-folds and the leading and trailing edge support structure, Hastelloy X; TPS,Nickel-201 and Hastelloy X; and the mounts and mounting frame, Inconel 718.
DESIGN CONDITIONS
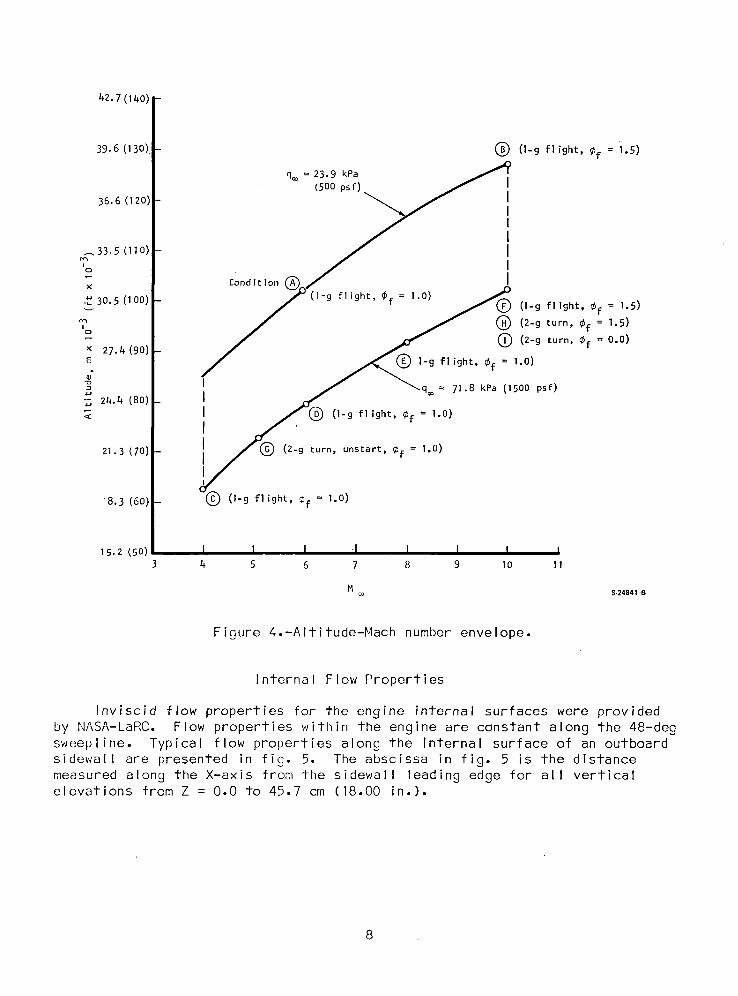
Normal engine operation is from Mach 4 to 10 with cruise at a dynamicpressure of 23.9 kPa (500 psf) and ascent at a dynamic pressure of 71.8 kPa(1500 psf). The engine also has the capability of undergoing a 2-g poweredmaneuver at any condition within this envelope. The altitude-Mach numberenvelope is shown in fig. 4. It is assumed that the engine can reach steady-state operation at any point within the envelope. Transient conditions suchas startup or a throttle chop can dictate structural design, and are thereforeconsideWed in the study. All engine operating conditions (A through I) aretaken from the contract statement of work (SOW).
Flight conditions resulting in maximum thermal loads and aero-pressureloading received special attention. Maximum thermal loading to the enginesurfaces occurs during a 2-g maneuver at a flight Mach number of 10, a dynamicpressure of 71.8 kPa (1500 psf), and a combustion equivalence ratio of 1.5(Condition H). Maximum aerodynamic pressure loading occurs during an engineunstart condition resulting in the event of thermal choking in the combustor.For a combustion equivalence ratio of 1.0, a 2-g maneuver, and a dynamic pres-sure of 71.8 kPa (1500 psf), this condition occurs at a flight Mach number of5.1 (Condition G). This is a transient condition that produces a pressure
pulse during the transition from supersonic to subsonic flow.
In addition to these conditions, several other conditions within theflight envelope were considered with regard to cooling requirements. Enginecooling performance throughout the envelope must be examined to substantiatethe feasibility of using the excess hydrogen capacity for other aircraft compo-nents. Condition B requires maximum coolant utilization. Conditions A, D, E,and F are typical cruise conditions. The Mach 10, zero fuel equivalence ratiopoint, Condition I, represents a possible maneuver after a throttle chop. AtMach 4, Condition C, fuel is assumed to be injected from both the struts andfrom the sidewalls within the combustor section to gain additional thrust.
42.7 (140) -
39.6 (130) Q (1-g flight, Cf = i.5)
q_ = 23.9 kPa _1c_oopsf) / !
_-.33.5 (110)I0
f (l-g flight, _f = 1.0)_3o.s(IOO)- / / LFPO-gfligh,:,Cf= 1.5)
,% _ / Q (2-g turn, Cf = 1.5)
x 27.4 (90) - (2-g turn, Cf = 0.0)
_ "_0'-g flight, Cf = 1.0)
I, / _qco _ 71.8 kPa(1500psf)24.4 (80)
7< ,I J Q (l-g flight' Cf = 1"0)
21.3(70 .I /Q (2-g turn, unstart, _f = 1.o)
'8.3 (60 C_ (l-g flight, Cf = 1.0)
is.2 (so: I I I I I I I I3 4 5 6 7 8 9 10 11
M co S-24841-8
Figure 4.-Altitude-Mach number envelope.
Internal Flow Properties
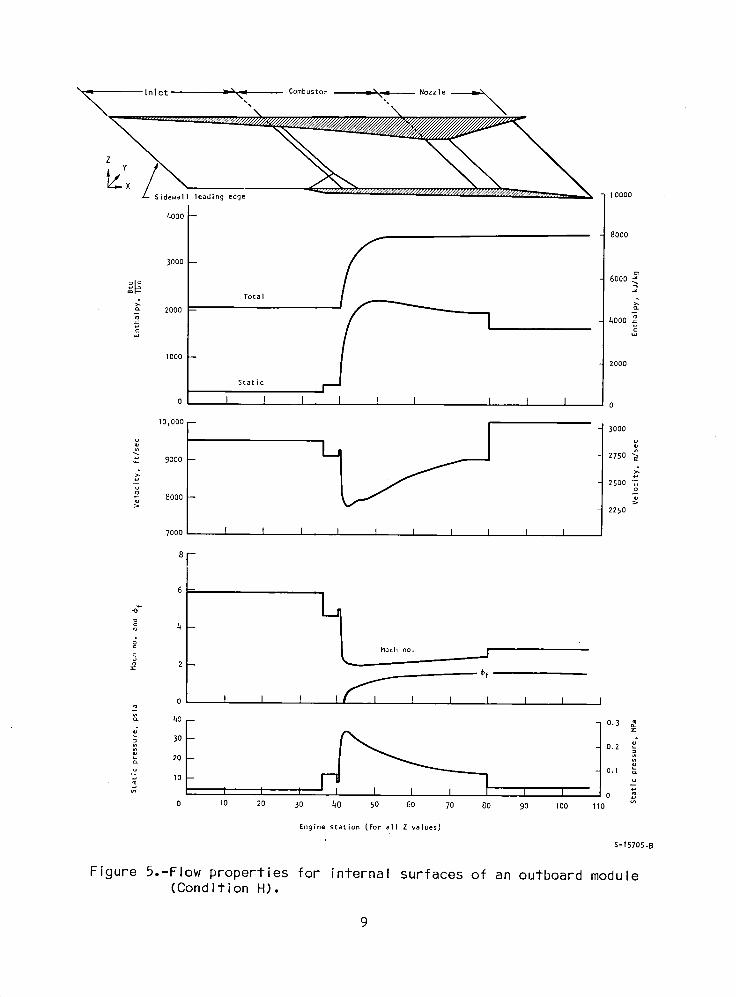
Inviscid flow properties for the engine internal surfaces were providedby NASA-LaRC. Flow properties within the engine are constant along the 48-degsweepline. Typical flow properties along the internal surface of an outboardsidewall are presented in fig. 5. The abscissa in fig. 5 is the distancemeasured along the X-axis from the sidewall leading edge for all verticalelevations from Z = 0.0 to 45.7 cm (18.00 in.).
\ not Comutor ozze--
4000 --
8000
3000 --
6000
. Total
2000 --
4000c
I000 --2000
StaticF-"
o i I I I I I I I I I o
10,000 --
L__ 3000
27509000--
•_ 2500 "_
8000-2250
7000 I l I I I I I I I I
8 --
6 m
4 -
gc Math no. J'
2 -,$f
o I I I I_ I I I I I I Im
_- 4o 0.3
= 300.2
20
.u O. 1I0 o
m ._
0 lO 20 30 40 50 60 70 80 90 I00 110
Engine station (for all Z values)
$-15705-B
Figure 5.-Flow properties for internal surfaces of an outboard module(Oond ition H).
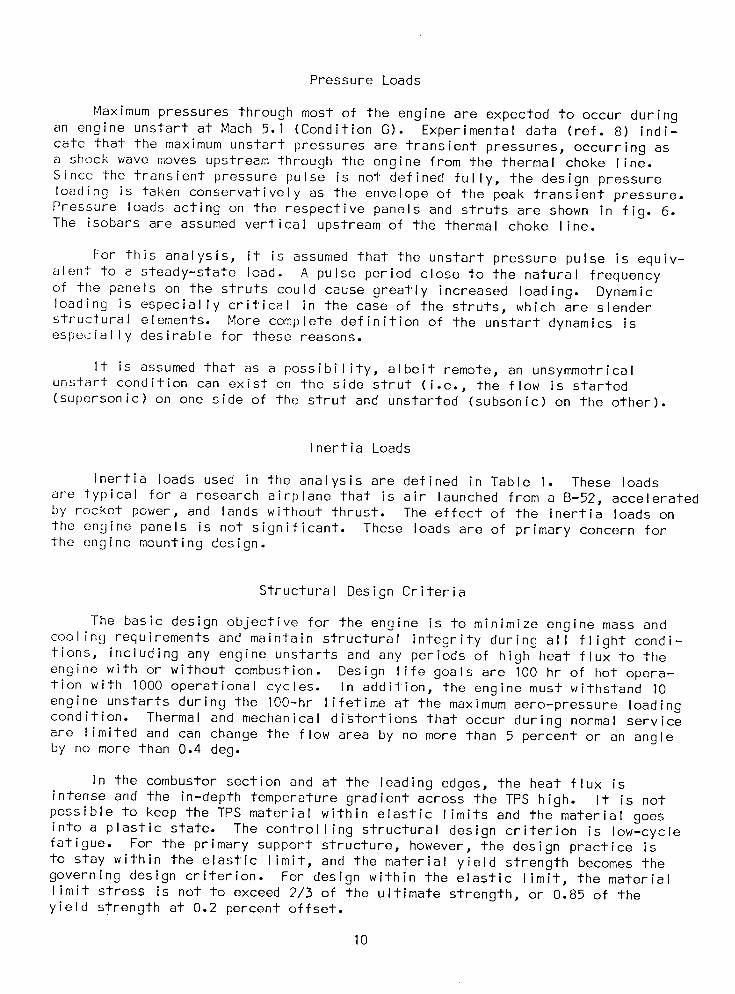
Pressure Loads
Maximum pressures through most of the engine are expected to occur duringan engine unstart at Mach 5.1 (Condition G). Experimental data (ref. 8) indi-
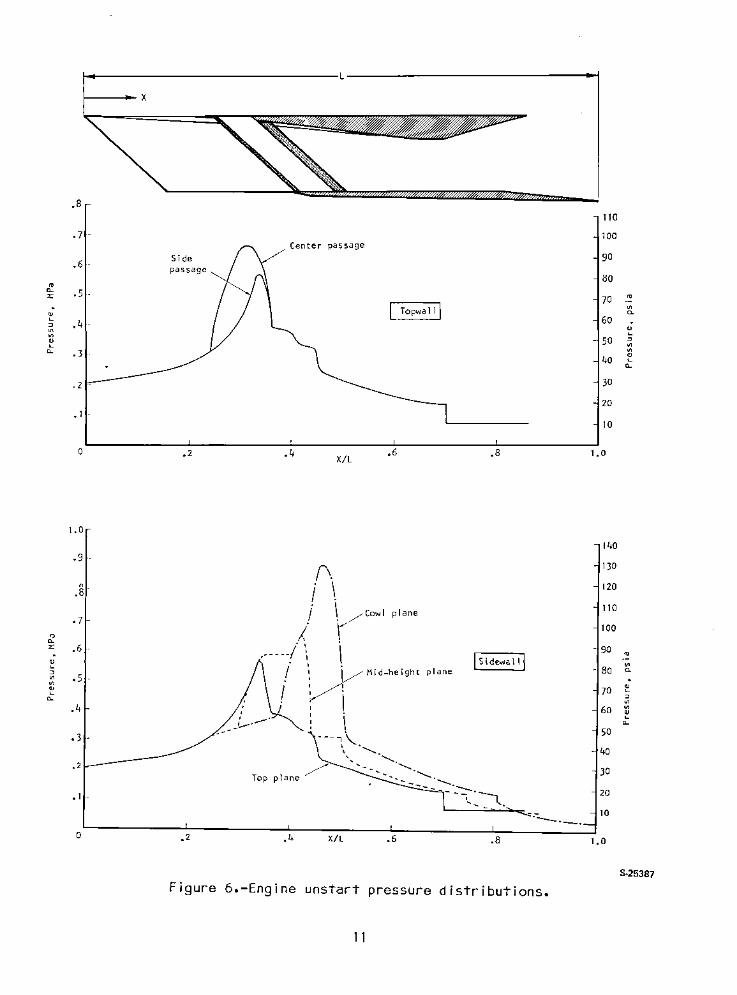
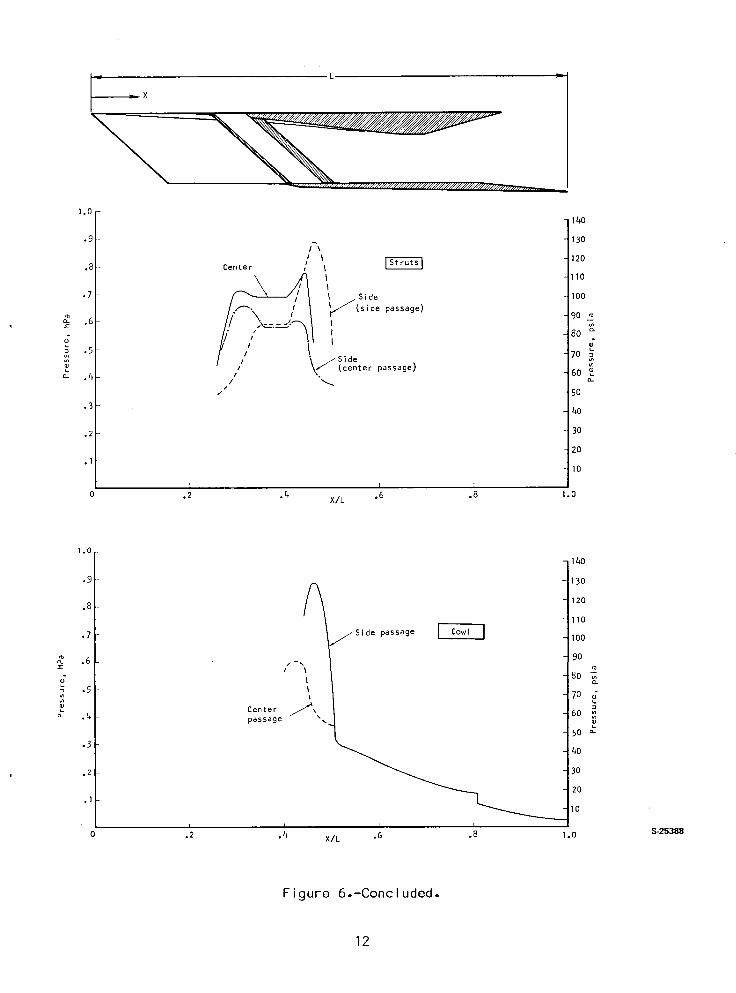
cate that the maximum unstart pressures are transient pressures, occurring asa shock wave moves upstream through the engine from the thermal choke line.Since the transient pressure pulse is not defined fully, the design pressureloading is taken conservatively as the envelope of the peak transient pressure.Pressure loads acting on the respective panels and struts are shown in fig. 6.The isobars are assumed vertical upstream of the thermal choke line.
For this analysis, it is assumed that the unstart pressure pulse is equiv-alent to a steady-state load. A pulse period close to the natural frequencyof the panels on the struts could cause greatly increased loading. Dynamicloading is especially critical in the case of the struts, which are slenderstructural elements. More complete definition of the unstart dynamics isespecially desirable for these reasons.
It is assumed that as a possibility, albeit remote, an unsymmetricalunstart condition can exist on the side strut (i.e., the flow is started(supersonic) on one side of the strut and unstarted (subsonic) on the other).
Inertia Loads
Inertia loads used in the analysis are defined in Table I. These loadsare typical for a research airplane that is air launched from a B-52, acceleratedby rocket power, and lands without thrust. The effect of the inertia loads on
the engine panels is not significant. These loads are of primary concern forthe engine mounting design.
Structural Design Criteria
The basic design objective for the engine is to minimize engine mass andcooling requirements and maintain structural integrity during all flight condi-tions, including any engine unstarts and any periods of high heat flux to theengine with or without combustion. Design life goals are 100 hr of hot opera-tion with I000 operational cycles. In addition, the engine must withstand 10engine unstarts during the 100-hr lifetime at the maximum aero-pressure loadingcondition. Thermal and mechanical distortions that occur during normal serviceare limited and can change the flow area by no more than 5 percent or an angleby no more than 0.4 deg.
In the combustor section and at the leading edges, the heat flux isintense and the in-depth temperature gradient across the TPS high. It is notpossible to keep the TPS material within elastic limits and the material goesinto a plastic state. The controlling structural design criterion is low-cyclefatigue. For the primary support structure, however, the design practice isto stay within the elastic limit, and the material yield strength becomes thegoverning design criterion. For design within the elastic limit, the materiallimit stress is not to exceed 2/3 of the ultimate strength, or 0.85 of theyield strength at 0.2 percent offset.
I0
If-..-----------L-------------j. • x
.8110
.7 100Center passage
90.6
Sidepassage
tlO'"
'"a.. .5
70::c
[ Topwall! V>0-
'" 60L-
.4'"
:J
L-V>
50 :JV>
V>'" V>L-
a.. • 340 ~
a..
30.2 -
20.1 -
10
0 .2 .4 .6 .8 1.0X/L
140
130
120
110
100
90'".-
80V>0-
70 ~:JV>
60 V>
~a..
50
40
30
20
10------ .1.0
5·25387
.8.6X!L. 4
f\. \I .
j ~COWI plane
/. .,__ ml \. \ ISidewall!
/ :~ Mid_height plane
II 1
. ; i; i
---, \." .............." ............................
Top ...........
--~.l.- - .
.2
1.0
.9
.8
.7
'"a..::c .6<JL-:J
.5V>V>
~a..
.4
.3
.2
.1
0
Figure 6.-Engine unstart pressure distributions.
11
L
X
1.0140
.9 30
i \ r-_ 120.8 Center / \
I 110I
• 7 _ j Side 100
.6 /_x'_._. _ |I_ (sidepassage)_j. I 90 _._. I 80 _"
= .5 / \ 70"_ jSide
_-_ .4 /I I l _. (center passage) 60 _L.m// 50
•3 40
.2 30
20
.110
T r I 1
.2 .4 X/L .6 .8 1.0
1.0140
•9 130
.8 120
110
•7 passage _ |00
.6 - 90
J i 8o _•5 | .
\ 70
Center _ 60o_ .4 passage L
50 m
•3 40
.2 30
20
I0
0 . 2 . 4 X/L . 6 . 8 1. 0 S 25388
Figure 6.-Concluded.
12
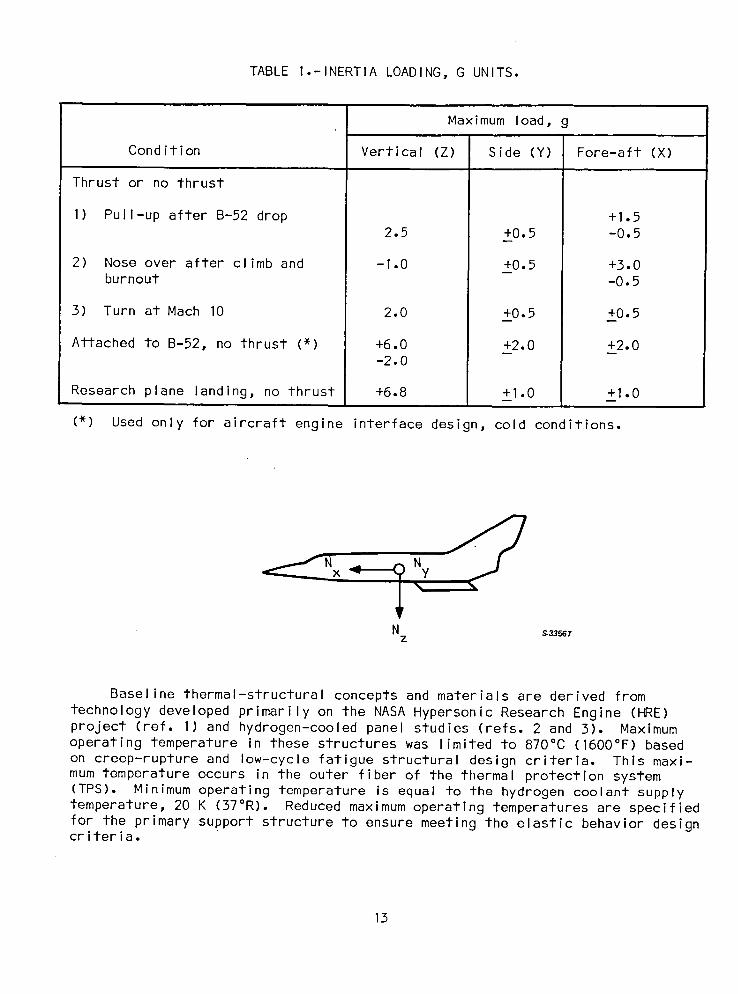
TABLE I.-INERTIA LOADING, G UNITS.
Maximum load, g
Condition Vertical (Z) Side (Y) Fore-aft (X)
Thrust or no thrust
I) Pull-up after B-52 drop +1.52.5 +0.5 -0.5
2) Nose over after climb and -I.0 +0.5 +3.0burnout -0.5
3) Turn at Mach I0 2.0 +0.5 +0.5
Attached to B-52, no thrust (*) +6.0 +2.0 +2.0-2.0
Research plane landing, no thrust +6.8 +1.0 +1.0
(*) Used only for aircraft engine interface design, cold conditions.
N S-33567z
Baseline thermal-structural concepts and materials are derived from
technology developed primarily on the NASA Hypersonic Research Engine (HRE)project (ref. I) and hydrogen-cooled panel studies (refs. 2 and 3). Maximumoperating temperature in these structures was limited to 870°C (1600°F) basedon creep-rupture and low-cycle fatigue structural design criteria. This maxi-mum temperature occurs in the outer fiber of the thermal protection system(TPS). Minimum operating temperature is equal to the hydrogen coolant supplytemperature, 20 K (37°R). Reduced maximum operating temperatures are specifiedfor the primary support structure to ensure meeting the elastic behavior designcriteria.
13
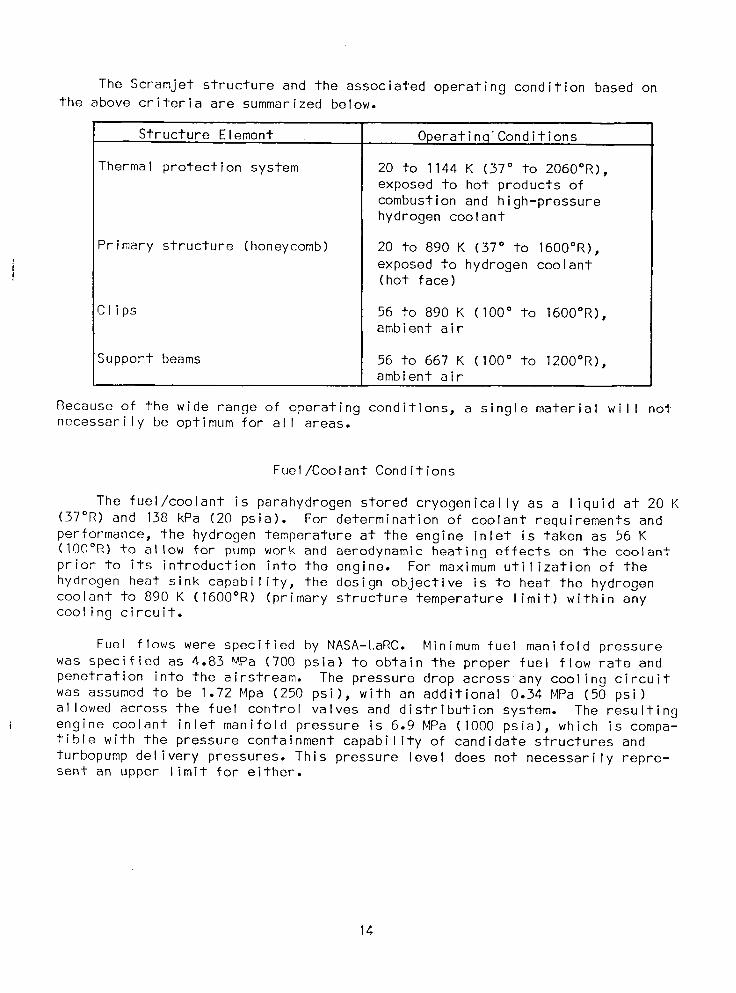
The Scramjet structure and the associated operating condition based onthe above criteria are summarized below.
Structure Element Operatin_ Conditions
Thermal protection system 20 to 1144 K (37° to 2060°R),exposed to hot products ofcombustion and high-pressurehydrogen coolant
Primary structure (honeycomb) 20 to 890 K (37° to 1600°R),i exposed to hydrogen coolantf (hot face)
Clips 56 to 890 K (100° to 1600°R),ambient air
Support beams 56 to 667 K (100° to 1200°R),ambient air
Recause of the wide range of operating conditions, a single material will notnecessarily be optimum for all areas.
Fuel/Coolant Conditions
The fuel/coolant is parahydrogen stored cryogenically as a liquid at 20 K(37°R) and 138 kPa (20 psia). For determination of coolant requirements andperformance, the hydrogen temperature at the engine inlet is taken as 56 K(IO0°R) to allow for pump work and aerodynamic heating effects on the coolantprior to its introduction into the engine. For maximum utilization of thehydrogen heat sink capability, the design objective is to heat the hydrogencoolant to 890 K (1600°R) (primary structure temperature limit) within anycooling circuit.
Fuel flows were specified by NASA-LaRC. Minimum fuel manifold pressurewas specified as 4.83 MPa (700 psia) to obtain the proper fuel flow rate andpenetration into the airstream. The pressure drop across any cooling circuitwas assumed to be 1.72 Mpa (250 psi), with an additional 0.34 MPa (50 psi)allowed across the fuel control valves and distribution system. The resulting
i engine coolant inlet manifold pressure is 6.9 MPa (1000 psia), which is compa-tible with the pressure containment capability of candidate structures andturbopump delivery pressures. This pressure level does not necessarily repre-sent an upper limit for either.
14
DESIGN LOADING
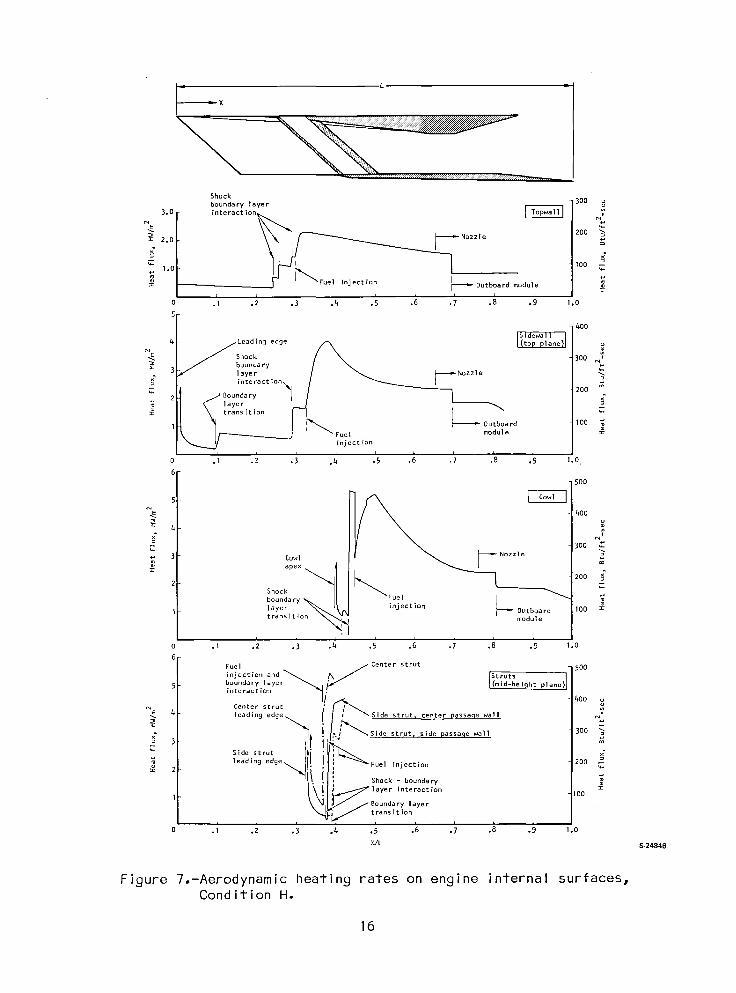
Aerodynamic Heating
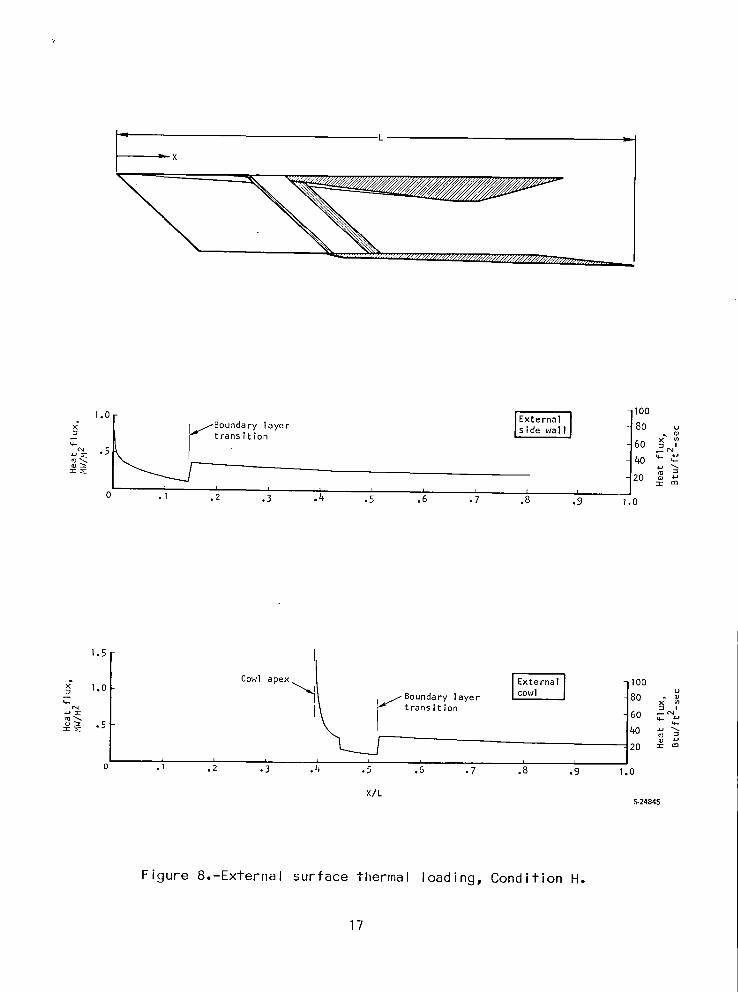
Aerodynamic heating of the internal engine surfaces (sidewall, top surface,cowl), strut sides, and external surfaces was determined for Condition H. Thiscondition was selected because it is the maximum thermal load case. Calcula-
tions were performed by the adiabatic wall reference enthalpy method (ref. 9).Results are presented in figs. 7 and 8.
The peak combustor heat fluxes for the top surface, sidewall, and internalcowl of 2.27, 4.03, and 5.22 MW/m2 (200, 355, and 460 Btu/sec-ft2), respec-tively, reflect the location of the virtual origin of the boundary layer. Forthe top surface, the virtual origin of the boundary layer was taken as I016 cm(400 in.) upstream of the engine inlet, based on engine installations rangingfrom 1219 to 965 cm (480 to 380 in.) aft of the aircraft nose. Because of
this, it was assumed that the flow transitioned upstream of the engine inletand that the flow on the engine top surface was turbulent. On the side surface,internal cowl surface, and side struts, a laminar-to-turbulent transitionReynolds number of 3 x I06 was used. The locations where transition occurs are
indicated in figs. 7 and 8. On the center strut, the Reynolds number basedon running length from leading edge was less than 3 x I0o at the perpendicularinjectors, so a transition to turbulent flow was imposed on the boundary layerat tile injector location.
The top surface and internal cowl surfaces are exposed to a complexpattern of shock wave bays in the engine inlet. Each bay has a unique andconstant set of inlet flow properties. This produces a heat loading on thesesurfaces that is both width- and axial-dependent. The loading definition onother surfaces of the engine is governed by flow properties that vary in theengine axial direction only. For initial analysis, to facilitate the loadingdefinition and the subsequent design, the various inlet streamlines producedby the complex shock bay pattern on the topwall panel were reduced to one
streamline. This one streamline was a composite of those producing maximumheating along the engine axis. Alternate paths through the inlet would yielda different and possibly more precise design heat load, but the variation wasnot considered significant. The maximum heat load in the inlet portion ofthe top surface from this analysis is about 148 kW (140 Btu/sec) compared witha total module heat load of 7380 kW (7000 Btu/sec). Thus, the maximum varia-tion in heat load due to path selection is less than 2 percent. The pathspecified results in a conservative design and is adequate for flow routingstudies.
A separate detail analysis was performed on the topwall panel in whichthe variation in heat flux along parallel streamlines was considered. Thisanalysis was conducted to determine the resulting temperature gradients andcorresponding thermal stresses in the structure. The results of these thermaland stress analyses are reported in a subsequent section.
15
Shockboundary layer 300
_Nozzle 2002.0 g
100
= Outboard moduleI i i J _ i I i
0 .I .2 .3 .4 .5 .6 .7 .8 .9 1.0
'[ _0
4 edge [_F_l_ne)J
300 _
_ 200
Outboard 100module
injectlon
h _ _ I 15 I I J8 '0 .I ., ., .4 • .6 .7 • .9 1.0 4
_ _o
-- 3ooCow] _-Nozzle
200
100
.i .2 .3 .4 .5 .6 .7 .8 .9 1.0
Fuel / Center strut 500injection and _ /_ / Strutsboundary layer,or....t,oo l o,dhe,0 t,ooo,l
st rutll _ 400 uCenter,_E leading edge i' _ Side strut center passaqe wall '
" , S de strut, slde passaqe wall 300
Sidestrut _ _ x"
Fuel injection 4-
• Shock - boundary
_ layer interaction I00/ /8oundary layer
_ t rans i t ioni i_ _ .....I . • .4 .5 .6 .7 .8 .5 1.0
X/L S-24846
Figure 7.-Aerodynamic heating rates on engine internal surfaces,Condition H.
16
L
I =x
1oF ExternaIO0x" _" transit/B°undarYonlayer isld e wall I 80 _ _u60 x
_: 20 _
T r I I I I I r r
o .I .2 .3 .4 .5 .6 .7 .8 .9 1.0
1.5
" 1.0 Cowl apex_I External I ]I00cowl I --- I Boundary layer 180_ nsition _ ,m_. 60 _._o:_ -5::_: 40 _ "_tU
20 :: _
I I I I I I I I Io oi •_ ., ._ ._ .o ., ._ . i.o
X/L,e,-24845
Figure 8.-External surface thermal loading, Condition H.
17
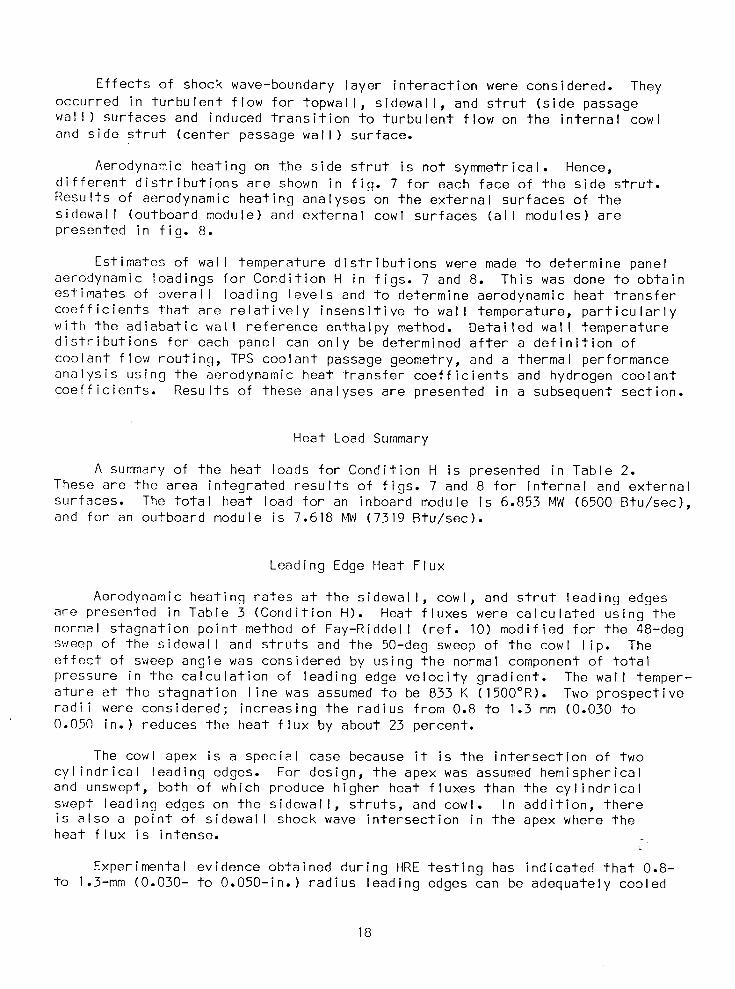
Effects of shock wave-boundary layer interaction were considered. Theyoccurred in turbulent flow for topwall, sidewall, and strut (side passagewall) surfaces and induced transition to turbulent flow on the internal cowl
and side strut (center passage wall) surface.
Aerodynamic heating on _he side strut is not symmetrical. Hence,different distributions are shown in fig. 7 for each face of the side strut.Results of aerodynamic heating analyses on the external surfaces of thesidewall (outboard module) and external cowl surfaces (all modules) arepresented in fig. 8.
Estimates of wall temperature distributions were made to determine panelaerodynamic loadings for Condition H in figs. 7 and 8. This was done to obtainestimates of overall loading levels and to determine aerodynamic heat transfercoefficients that are relatively insensitive to wall temperature, particularlywith the adiabatic wall reference enthalpy method. Detailed wall temperaturedistributions for each panel can only be determined after a definition ofcoolant flow routing, TPS coolant passage geometry, and a thermal performanceanalysis using the aerodynamic heat transfer coefficients and hydrogen coolantcoefficients. Results of these analyses are presented in a subsequent section.
Heat Load Summary
A summary of the heat loads for Condition H is presented in Table 2.
These are the area integrated results of figs. 7 and 8 for internal and external
surfaces. The total heat load for an inboard module is 6.853 MW (6500 Btu/sec),and for an outboard module is 7.618 _ (7319 Btu/sec).
Leading Edge Heat Flux
Aerodynamic heating rates at the sidewall, cowl, and strut leading edgesare presented in Table 3 (Condition H). Heat fluxes were calculated using thenormal stagnation point method of Fay-Riddell (ref. 10) modified for the 48-degsweep of the sidewall and struts and the 50-deg sweep of the cowl lip. Theeffect of sweep angle was considered by using the normal component of totalpressure in the calculation of leading edge velocity gradient. The wall temper-ature at the stagnation line was assumed to be 833 K (1500°R). Two prospectiveradii were considered; increasing the radius from 0.8 to 1.3 mm (0.030 to0.050 in.) reduces the heat flux by about 23 percent.
The cowl apex is a special case because it is the intersection of twocylindrical leading edges. For design, the apex was assumed hemisphericaland unswept, both of which produce higher heat fluxes than the cylindricalswept leading edges on the sidewall, struts, and cowl. In addition, thereis also a point of sidewall shock wave intersection in the apex where theheat flux is intense.
Experimental evidence obtained during HRE testing has indicated that 0.8-to 1.3-mm (0.030- to O.050-in.) radius leading edges can be adequately cooled
18
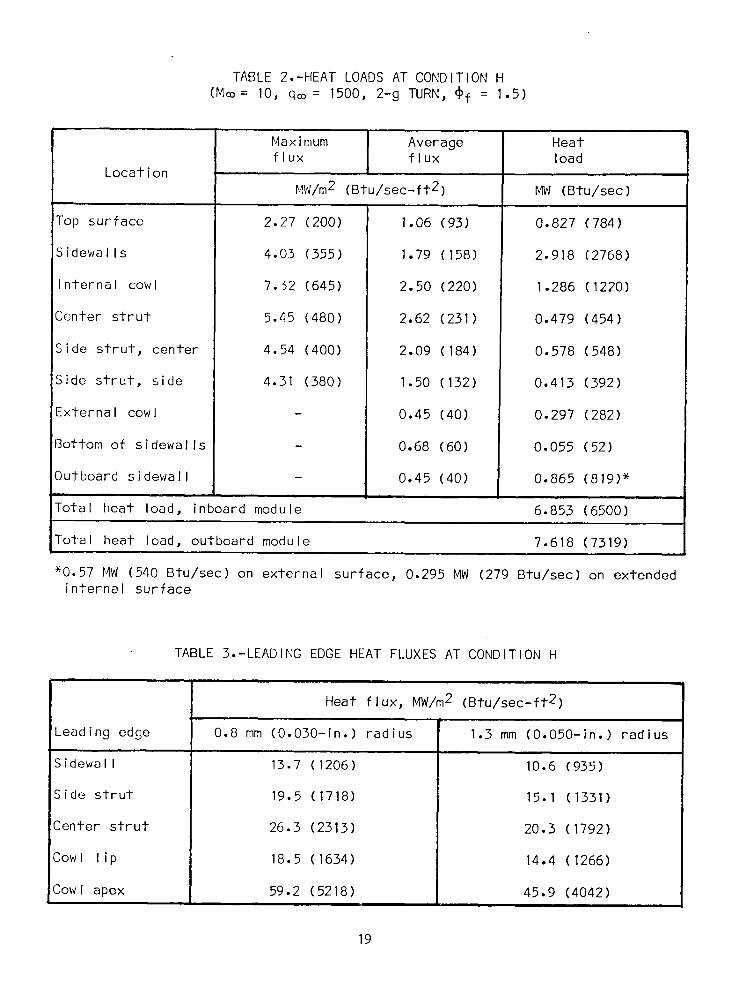
TABLE 2.-HEAT LOADS AT CONDITION H
(Mm = 10, qm = 1500, 2-g TURN, _f = 1.5)
Maximum Average Heatflux flux load
Location
MW/m2 (Btu/sec-ft2) MW (Btu/sec)
Top surface 2.27 (200) 1.06 (93) 0.827 (784)
Sidewalls 4.03 (355) 1.79 (158) 2.918 (2768)
Internal cowl 7.32 (645) 2.50 (220) 1.286 (1220)
Center strut 5.45 (480) 2.62 (231) 0.479 (454)
Side strut, center 4.54 (400) 2.09 (184) 0.578 (548)
Side strut, side 4.31 (380) 1.50 (132) 0.413 (392)
External cowl - 0.45 (40) 0.297 (282)
Bottom of sidewalls - 0.68 (60) 0.055 (52)
Outboard sidewall - 0.45 (40) 0.865 (819)*i
Total heat load, inboard module 6.853 (6500)
Total heat load, outboard module 7.618 (7319)
*0.57 MW (540 Btu/sec) on external surface, 0.295 MW (279 Btu/sec) on extendedinternal surface
TABLE 3.-LEADING EDGE HEAT FLUXES AT CONDITION H
Heat flux, MW/m2 (Btu/sec-ft2)
Leading edge 0.8 mm (O.030-in.) radius 1.3 mm (O.050-in.) radius
Sidewall 13.7 (1206) 10.6 (935)
Side strut 19.5 (1718) 15.1 (1331)
Center strut 26.3 (2313) 20.3 (1792)
Cowl lip 18.5 (1634) 14.4 (1266)
Cowl apex 59.2 (5218) 45.9 (4042)
19
with hydrogen up to stagnation heat fluxes of about 23 MW/m2 (2000 Btu/sec-ft2).Higher and very localized heat fluxes produced by shock impingement on leadingedges have also been accommodated when the shock impingement width on the lead-ing edge is much smaller than the leading edge radius; however, cowl leadingedge fluxes of 45 to 60 MW/m2 64000 to 5000 Btu/sec-ft2) over a significant partof the radius is a definite departure from existing experimental data.
Corner Flow Heating
The effect of corner-flow fields on the aerodynamic heating rate wasinvestigated to determine if this condition would control the thermal protec-tion syst m design in the corners.
Ref. 11 was used as the primary basis of the investigation; however,results are primarily for laminar flow for unswept leading edges, with andwithout wedge angles. Turbulent flow was treated on a limited basis becauseof the limited test data available. The data are sufficient, however, tomake judgments for this study.
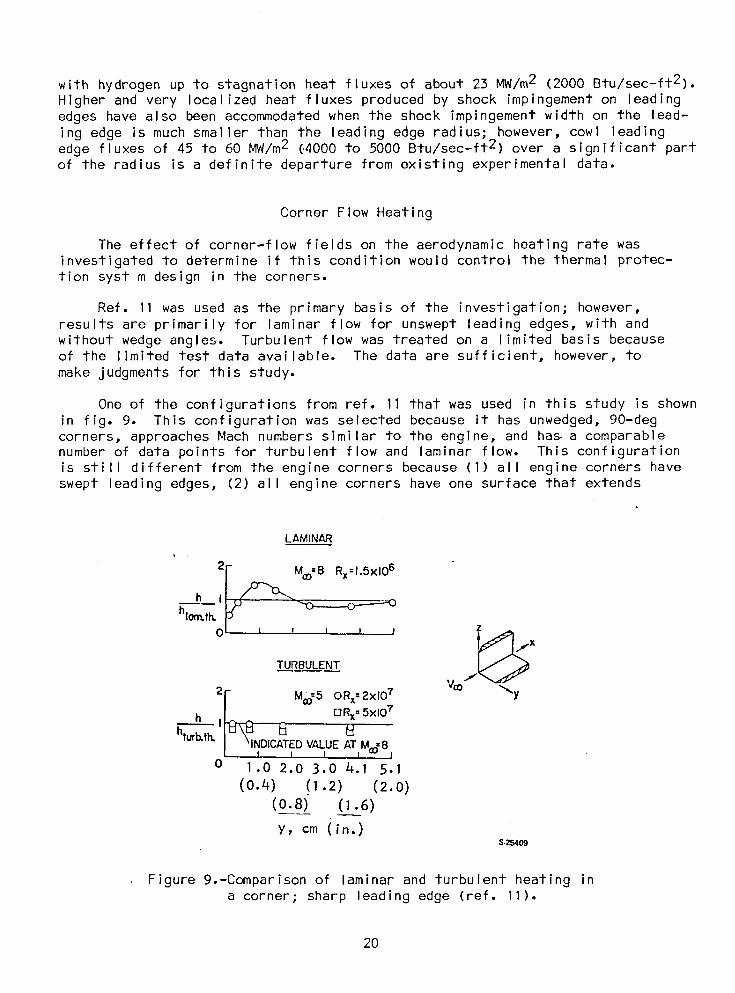
One of the configurations from ref. 11 that was used in this study is shownin fig. 9. This configuration was selected because it has unwedged, 90-degcorners, approaches Mach numbers similar to the engine, and has a comparablenumber of data points for turbulent flow and laminar flow. This configurationis still different from the engine corners because (I) all engine corners haveswept leading edges, (2) all engine corners have one surface that extends
LAMINARi .
2I, M :8R :,sx,o6
"la_th'o_ I w t = t z
TURBULENT _x
"-,.y2r Moo=50Rx=2xlO7h _ _Rx= 5×10⁷
turt_th._TED VALUEATM._=8L I I I I u_ I
o 1.02.03.0(0.4) (1 .2) (2.0)
(0.8) (i.6)y, cm (in.)
8-25409
Figure 9.-Comparison of laminar and turbulent heating ina corner; sharp leading edge (ref. 11).
2O
upstream from the origin of the corner so that this one surface already has anestablished boundary layer, and (3) all engine leading edges have leading edgeradii of 0.8 to 1.3 mm (0.030 to 0.050 in.). These differences are thought todiminish the corner heating effect relative to results in ref. 11. The basicbehavior of the aerodynamic heat transfer coefficient (h) for laminar andturbulent flow at approach Mach numbers of 5 and 8 is included in fig. 9 forthe selected configuration. For laminar flow, the corner effect on h is notice-able and also Reynolds number (and flow length) dependent. The h in the corneris less than predicted by laminar flat-plate theory, but increases to a peakvalue of 1.4 to 1.5 times the flat-plate value 10 mm from the corner beforediminishing to the flat plate value. For turbulent flow there is no cornereffect on h (i.e., the h profile is flat with distance from the corner). Thisresult does not appear to be affected by Reynolds number. In addition, theflat profile is approximately independent of approach Mach number, at leastat the two values examined.
From these data, peak corner heating is not expected to be significantlyhigher than the laminar flat-plate values in the laminar flow region of thecowl inlet. In addition, laminar flow heating is only about 15 to 25 percentof the corresponding heating if turbulent flow existed. Therefore, cornerheating should not affect the design because the TPS will be selected primarilyon the basis of turbulent flow heating in the cowl/strut section of the inlet.In the turbulent flow region, no increase in heating is expected due to corners.Laminar corner heating can be significant if a large portion of the corner isheated by laminar flow, regardless of turbulence level, but this is not thepresent case.
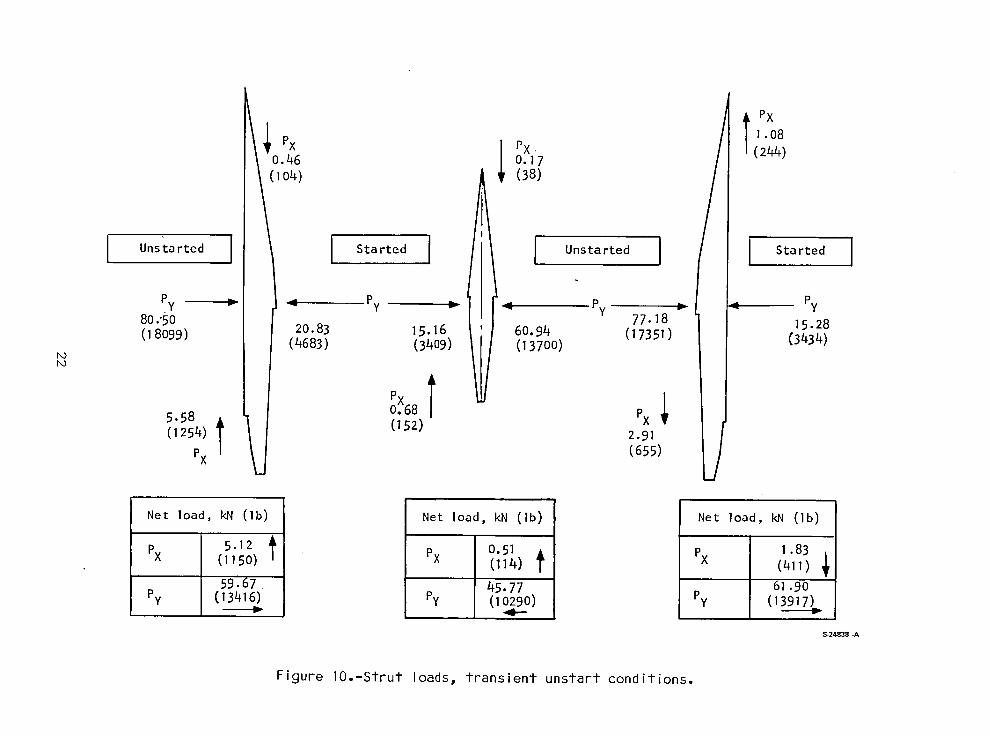
Strut Pressure Loads
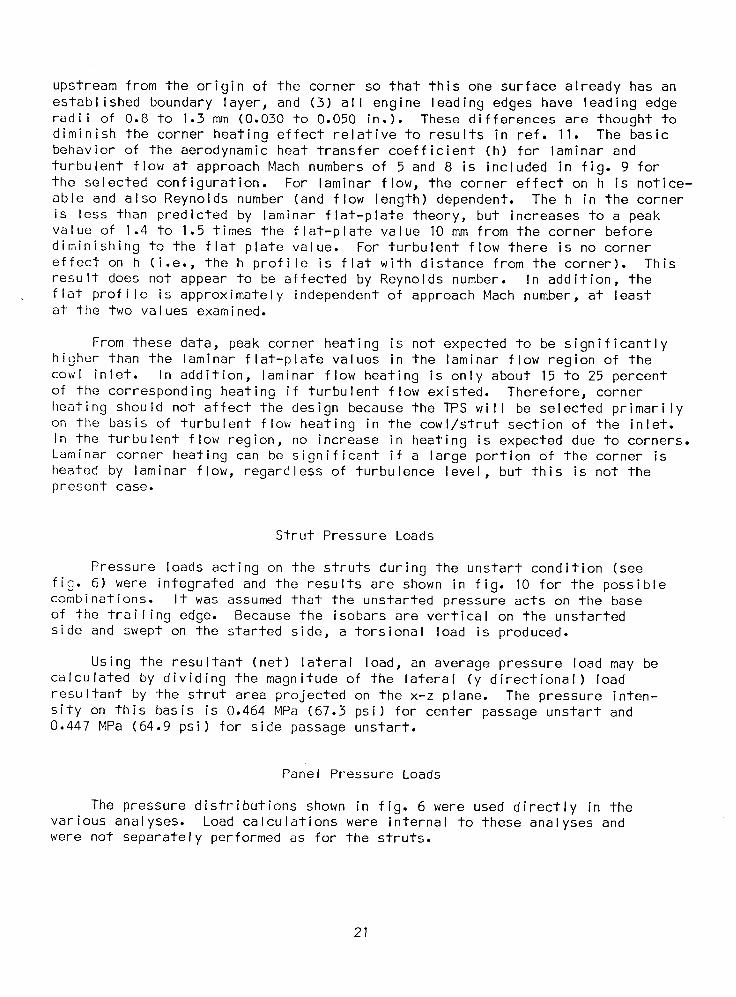
Pressure loads acting on the struts during the unstart condition (seefig. 6) were integrated and the results are shown in fig. 10 for the possiblecombinations. It was assumed that the unstarted pressure acts on the baseof the trailing edge. Because the isobars are vertical on the unstartedside and swept on the started side, a torsional load is produced.
Using the resultant (net) lateral load, an average pressure load may becalculated by dividing the magnitude of the lateral (y directional) loadresultant by the strut area projected on the x-z plane. The pressure inten-sity on this basis is 0.464 MPa (67.3 psi) for center passage unstart and0.447 MPa (64.9 psi) for side passage unstart.
Panel Pressure Loads
The pressure distributions shown in fig. 6 were used directly in thevarious analyses. Load calculations were internal to these analyses andwere not separately performed as for the struts.
21
ii Amx1.o8
PX (244)
(Oio4) o.17
(381
I I I 1 IUnstarted Started Unstarted I I Started
Py _ _ Py _- ;_ - Py
80.'50 PY 77.18 15.28(I8099) 20.83 15.16 60.94 (I7351)
(4683) (3409) (I3700) (3434)_3
Pxt ii!(i254) (152) .
PX
Net load, kN (Ib) Net load, kN (Ib) Net load, kN (Ib)
s.12 _, Px o.51 1.83PX (1150) (114) _ PX (411)
59.67 45.77 61 -90Py (13416) PY (I0290) Py (13917)
S-24838 -A
Figure 10.-Strut loads, transient unstart conditions.
DESIGN APPROACH
Cooling System
The thermal protection system was treated as a compact heat exchanger andanalyzed using the methods presented in ref. 12. Heat transferred by radiationis considered negligible and the aerodynamic heat transferred to the structureis balanced by the heat removed by the coolant. All fluid properties wereevaluated at the hydrogen bulk temperature as recommended (ref. 12) for offset-fin heat exchangers and at the wall-to-bulk film temperature for machinedchannels.
The topwall, sidewall and cowl, and the struts are each considered tobe an independent cooling circuit; for maximum coolant utilization the coolantis allowed to reach the maximum allowable temperature of 890 K (1600°R). Thebasic flow scheme is to introduce cryogenic coolant at the leading and trailingedges where the panel heat load is low and withdraw it at the engine throatwhere the heat load is highest. Variations on this basic flow routing wereexamined to (I) match temperature gradients along the engine (minimum AT betweenpanels); (2) minimize coolant pressure drop by providing optimum flow width andleng*h; and (3) minimize local heat input by controlling surface temperatureprofiles. These studies result in specification of coolant flows and manifoldlocation in each flow route.
Cooling requirements throughout the flight envelope were determined andcompared with the available cooling capacity as dictated by the fuel flow.Heat load split between engine sections, inlet, combustor, nozzle, and strutswas computed to provide a basis for coolant flow control design.
Material requirements were examined and selections made based on HREexperience and the current state of the art. These selections were used forall subsequent structural analyses.
The thermal protection system (TPS) was examined in detail. Experiencewith the rectangular, offset, plate-fin coolant passages on the HRE TPS indi-cated that, although adequate for research purposes, the thermal fatigue lifeof such structures is limited. The required Scramjet engine life of 100 hrand 1000 cycles is an order of magnitude greater than specified for the HRE.
The maximum thermal load case, Condition H, was used as the TPS designbasis. The TPS response is fast (the time constant is a few seconds) andit will reach a steady-state condition even though Condition H is a transientoperating point. Consequently, the TPS passage geometry and flow routingmust be sized and located to meet the maximum thermal load conditions. If the
TPS passage geometry were optimized for cruise conditions, then it may beimpossible to achieve the required Condition H coolant flow because of exces-sive pressure drop in the coolant passages.
23
The TPS hot skin temperature is dependent on the heat flux, and hence,peak temperature will occur at Condition H. It is presumed that this condi-tion will occur once during every mission.
Two flow passage geometries, machined channels and pin-fin, were selectedas candidate surfaces because they have a potential for increased cyclic life.Heat transfer and pressure drop performance of the candidate heat exchangerflow geometries and structural materials were examined using the methods inref. 12 and compared on the basis of in-depth temperature gradient and pressuredrop. Thermal stress, and hence the cyclic life, are directly related to theAT across the TPS. Thus, the basic objective is to obtain the minimum ATwithin the coolant pressure drop limitations. Decreasing passage size andadding flow interruptions, as with the pin-fin geometry, reduce AT but increase_P for a fixed flow rate.
A parallel structural analysis of the TPS was performed to predict low-cycle fatigue life of the candidate TPS designs. Two different techniquesare used: linear interaction using Miner's rule (ref. 13), and strainrangepartitioning (ref. 14). The heat transfer and structural results were thenreviewed and the best TPS geometry and materials selected.
Leading edges were given special consideration because of the high heatfluxes and geometry restrictions imposed. Hydrogen coolant is introduced atthe leading and trailing edges of the individual panels,and the coolant inlettemperature is therefore at or close to the minimum supply temperature of56 K (IO0°R). The design problem is similar to that for the TPS, where low-cycle fatigue was identified as limiting the cycle life. A design constraintis the leading edge radius, which should be minimized for aerodynamic reasons.
Fuel Injection Struts
The struts present a major design problem. They are slender structuralelements with a span-to-depth ratio of 25 to 28. The torsional and bendingstiffnesses are low. The struts must simultaneously perform the followingfunctions:
(a) Support a large side load such as occurs during an unstart transient
(b) Contain high-pressure hydrogen at two temperature extremes
(c) Withstand high thermal stresses generated by asymmetric aerodynamicheating and internal convective heating from manifolds
The cross-sectional area available for flow of the hydrogen coolant andfuel is limited by the basic cross-sectional area and the need to providestructural members. Hence, flow maldistribution could occur and produce anunacceptable fuel injection pattern and local hot spots in the TPS.
Structural analyses, described in ref. 4, were continued by NASA. Theprimary tool was a three-dimensional finite element model analyzed using theSPAI_ (ref. 15) computer co0e. i_l_side _rrut only was modeled, as the loading
24
was slightly more critical than the center-strut loading, and the results wouldbe conservative for the center strut.
Two approaches were examined to determine the best means to reduce strutdeflections and stresses. First, the boundary conditions were changed toreflect revised mounting constraints. A structural tie that joins the threestruts together at their midpoint--a concept originally used in the ref. 4analysis--was retained for this first approach. The second approach was tosupply additional coolant to the strut TPS to reduce the temperature gradientsalong the strut, and thereby decrease the thermal stresses. It was believedthat "overcooling" would result in a lower combined stress, and this wouldeliminate the mid-span tie, a decided complication in coolant flow routing andstrut fabrication.
Initial results of the structural analysis were used to prepare designlayouts for the strut cross-sections and flow routing schemes. From thisbasis the available flow areas for hydrogen fuel and coolant were established.Flow distributions were then determined using a computer program for one-dimensional compressible flow with friction in a manifold with continuouswithdrawal of flow.
The interface between the side strut and the topwall was investigatedto assess the performance of the seal at this interface and to provide theboundary conditions at the edges of the strut. The NASA-generated finiteelement model of the side strut was used in the computer analysis in conjunc-tion with models of a section of the topwall and of the seal. Boundary condi-tions were used from previous analysis of the overall all-honeycomb structure.
Engine Primary Structure
Response of the overall engine structure to the maximum thermal andpressure loading conditions was determined using ANSYS, a finite elementcomputer program (ref. 16). Although modeled relatively coarsely, the three-dimensional model had 4146 to 4794 degrees of freedom, depending on thetype of structure analyzed. The model was made up primarily of triangularand quadrilateral plate elements with both membrane and bending stiffness.Equivalent stiffness of the honeycomb, including the hot and cold face sheets,beams and clips, coolant manifolds, and the leading and trailing edge struc-tures, was represented in the computer program. The beams were permittedto slip along the clips to represent a differential thermal expansionprovision.
Three basic structures were examined: (I) seven swept beams reinforcing9.5-mm (3/8-in.) constant-thickness honeycomb sandwich panels, (2) seven verti-cal beams reinforcing 9.5-mm (3/8-in.) constant-thickness honeycomb sandwichpanels, and (3) 6.4- to 50.8-mm (0.25- to 2.0-in.) variable-thickness honeycombsandwich panels reinforced with two vertical beams. Maximum thermal and pres-sure loadings were applied to each of the models and the resulting deflectionsand stresses determined. Results were reviewed to select the structure thatproduces the minimum deflection for the least mass. Stress levels were checked
to verify that the primary structure is within the elastic range.
25

Deformations were checked against the allowable aerodynamic line distortions.Panel-to-panel deflections were examined to establish the seal requirements.
A separate thermal and structural analysis was performed on the inlet por-tion of the topwall to assess the effects of the nonuniform heat flux in thisarea. Two-dimensional aerodynamic heating analyses were performed on the inletand combustion sections of the topwall surface. A more realistic two-dimensionalthermal loading was determined by analyzing six distinct streamlines that bestrepresent the shock bay pattern in the engine inlet. Heat fluxes were computedalong each flow path. A three-dimensional steady-state thermal performanceanalysis was conducted on the forward topwall TPS panel using these heat fluxes.
For the stress analysis, a model was constructed representing the stiffnessand geometric features of the all-honeycomb topwall. A detail description ofthe model and the results of the analysis are contained in a subsequent section.
Transient Behavior
Maximum stresses in the primary structure are likely to occur during atransient condition, e.g., engine startup. To more clearly show the magnitudeof this problem, transient studies were performed. Two primary structure con-figurations were analyzed: (I) the 9.5-mm (3/8-in.) constant-thickness honey-comb reinforced with seven swept beams, and (2) the variable-thickness honey-comb reinforced with two vertical beams (all-honeycomb design). These configur-ations were modeled in cross-section and the transient temperature profiles weredetermined for an assumed mission. From these profiles, the thermal stresseswere determined and compared with material allowables.
Engine-Aircraft Interface
Deflection and load data from the engine finite element model were usedto derive guidelines for engine mounting, including differential thermalexpansion provisions and engine compartment sealing.
Fuel System
A complete fuel system schematic was developed including the turbopumpand all control valves. No detail designswere formulated. Rather, existingequipment, especially valve designs used on the HRE program (ref. I), was usedas the basis to obtain an estimate of size and mass.
Layout Design
Drawings of engine panels and the struts were prepared to define theselected designs and to show manufacturing feasibility. An installationdrawing was prepared to aid the aircraft designer. These drawings were usedto establish a detail mass estimate for the Scramjet engine and as a basis
for performance analysis.
26
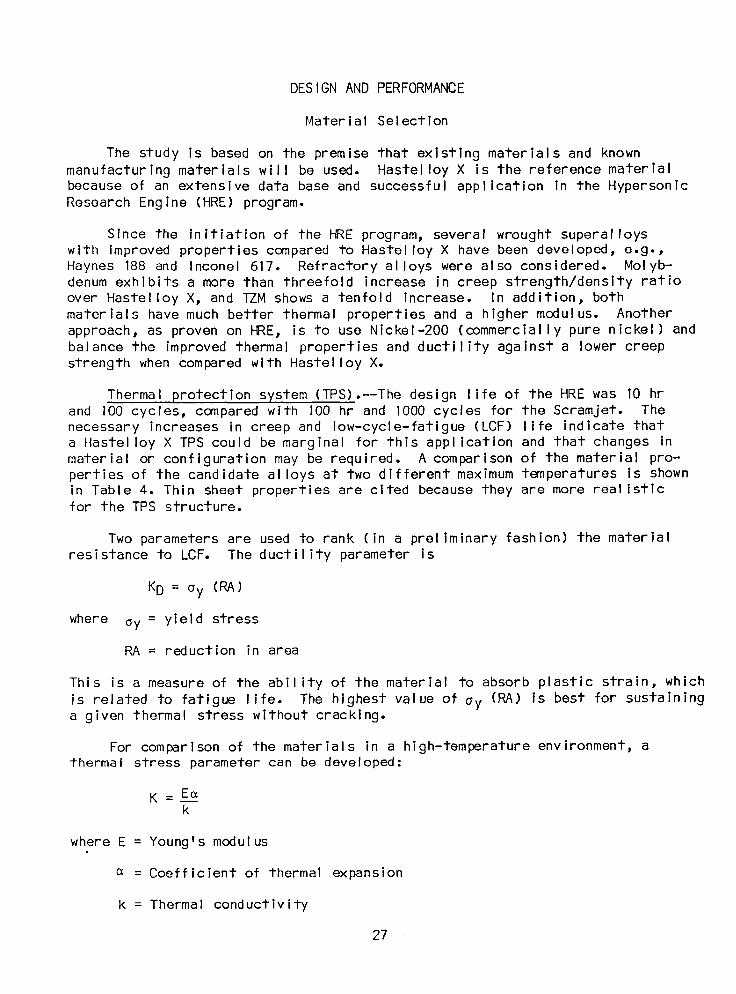
DESIGNAND PERFORMANCE
Material Selection
The study is based on the premise that existing materials and knownmanufacturing materials will be used. Hastelloy X is the reference materialbecause of an extensive data base and successful application in the HypersonicResearch Engine (HRE) program.
Since the initiation of the HRE program, several wrought superalloyswith improved properties compared to Hastelloy X have been developed, e.g.,Haynes 188 and Inconel 617. Refractory alloys were also considered. Molyb-denum exhibits a more than threefold increase in creep strength/density ratioover Hastelloy X, and TZM shows a tenfold increase. In addition, bothmaterials have much better thermal properties and a higher modulus. Anotherapproach, as proven on HRE, is to use Nickel-200 (commercially pure nickel) andbalance the improved thermal properties and ductility against a lower creepstrength when compared with Hastelloy X.
Thermal protection system (TPS).--The design life of the HRE was 10 hrand I00 cycles, compared with I00 hr and I000 cycles for the Scramjet. Thenecessary increases in creep and low-cycle-fatigue (LCF) life indicate thata Hastelloy X TPS could be marginal for this application and that changes inmaterial or configuration may be required. A comparison of the material pro-perties of the candidate alloys at two different maximum temperatures is shownin Table 4. Thin sheet properties are cited because they are more realisticfor the TPS structure.
Two parameters are used to rank (in a preliminary fashion) the materialresistance to LCF. The ductility parameter is
KD = ay (RA)
where oy = yield stress
RA = reduction in area
This is a measure of the ability of the material to absorb plastic strain, which
is related to fatigue life. The highest value of ay (IRA)is best for sustaininga given thermal stress without cracking.
For comparison of the materials in a high-temperature environment, athermal stress parameter can be developed:
K=E_k
where E = Young's modulus
= Coefficient of thermal expansion
k = Thermal conductivity
27
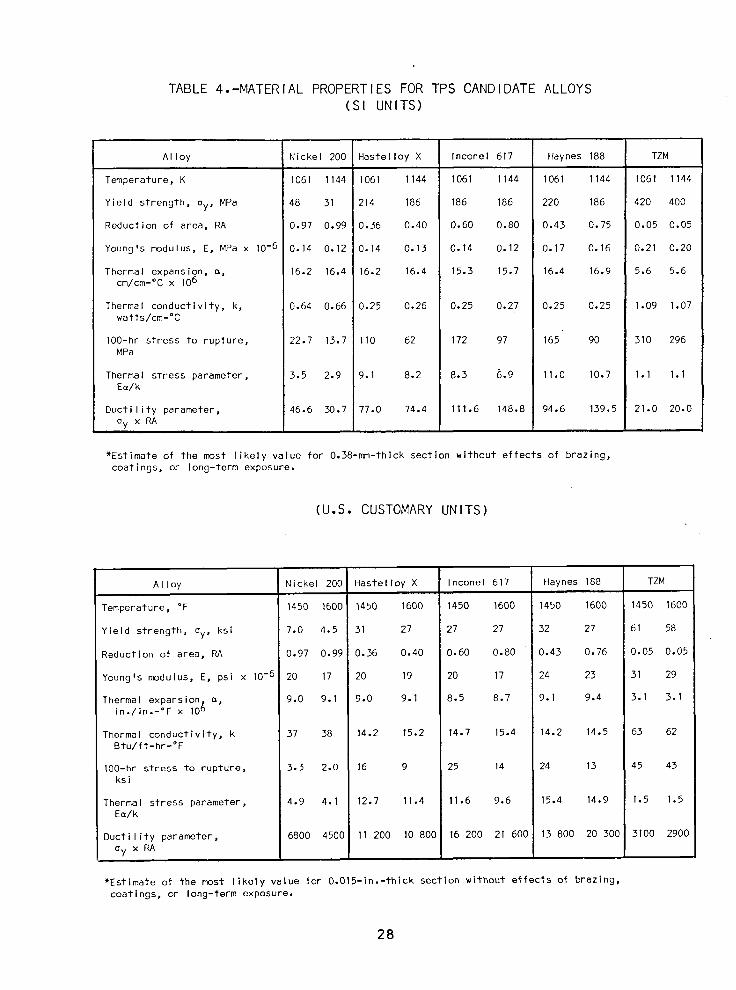
TABLE 4.-MATERIAL PROPERTIES FOR TPS CANDIDATE ALLOYS(SI UNITS)
Alloy Nickel 200 Hastelloy X Inconel 617 Haynes 188 TZM
Temperature, K 1061 1144 1061 1144 1061 1144 1061 1144 1061 1144
Yield strength, ay, MPa 48 31 214 186 186 186 220 186 420 400
Reduction of area, RA 0.97 0.99 0.36 0.40 0.60 0.80 0.43 0.75 0.05 0.05
Young's modulus, E, MPa x 10-6 0.14 0.12 0.14 0.13 0.14 0.12 0.17 0.16 0.21 0.20
Thermal expansion, _, 16.2 16.4 16.2 16.4 15.3 15.7 16.4 16.9 5.6 5.6cm/cm-°C x 106
Thermal conductivity, k, 0.64 0.66 0.25 0.26 0.25 0.27 0.25 0.25 1.09 1.07watts/cm-°C
100-hr stress to rupture, 22.7 13.7 II0 62 172 97 165 90 310 296MPa
Thermal stress parameter, 3.5 2.9 9.1 8.2 8.3 6.9 11.0 10.7 1.1 1.1E_/k
Ductility parameter, 46.6 30.7 77.0 74.4 111.6 148.8 94.6 139.5 21.0 20.0
ay xRA
*Estimate of the most likely value for 0.38-mm-thick section without effects of brazing,coatings, or long-term exposure.
(U.S. CUSTOMARY UNITS)
Alloy Nickel 200 Hastelloy X Inconel 617 Haynes 188 TZM
Temperature, °F 1450 1600 1450 1600 1450 1600 1450 1600 1450 1600
Yield strength, Oy, ksi 7.0 4.5 31 27 27 27 32 27 61 58
Reduction of area, RA 0.97 0.99 0.36 0.40 0.60 0.80 0.43 0.76 0.05 0.05
Young's modulus, E, psi x 10-6 20 17 20 19 20 17 24 23 31 29
Thermal expansionl _, 9.0 9.1 9.0 9.1 8.5 8.7 9.1 9.4 3.1 3.1in./in.-°F x 10_
Thermal conductivity, k 37 38 14.2 15.2 14.7 15.4 14.2 14.5 63 62Btu/ft-hr-°F
lO0-hr stress to rupture, 3.3 2.0 16 9 25 14 24 13 45 43ksi
Thermal stress parameter, 4.9 4.1 12.7 11.4 11.6 9.6 15.4 14.9 1.5 1.5Ea/k
Ductility parameter, 6800 4500 11 200 I0 800 16 200 21 600 13 800 20 300 3100 2900
oyxRA
*Estimate of the most likely value for O.Ol5-in.-thick section without effects of brazing,coatings, or long-term exposure.
2B

The lowest value of this parameter will yield the lowest thermal stress fora given temperature distribution. These parameters for the candidate alloysare also shown in Table 4.
Among the nickel- or cobalt-base wrought superalloys there is no clear-cut superiority, although the parameters do indicate an advantage for Inconel617. The data base for Hastelloy X, especially for direct measurements ofLCF life, is more extensive than for the other alloys.
Nickel-200 is an attractive alternate for the TPS because of its excep-tionally high ductility. Its creep strength is low and, hence, the maximumoperating temperature must be limited to 790°C (1450°F) or less. Directlyapplicable low-cycle fatigue data and high-temperature creep data are lacking.
The TZM refractory alloy is attractive because its thermal stress para-meter is low; however, in the unprotected condition, refractory alloys haveno oxidation resistance at the Scramjet operating conditions. Applicablecoating technology has not advanced significantly beyond that available inthe 1960-1965 period. Without further coating development, refractory alloyscannot be considered for the Scramjet.
Primary structure.--In this case, the maximum operating temperature is617°C (1140°F). At this level, Inconel 718 is generally regarded as optimumbecause of superior yield strength compared with Hastelloy X or Inconel 617.There is more difficulty in fabricating the primary structure using Inconel 718compared with Hastelloy X. Because yield strength is the governing design cri-terion for the primary structure, Inconel 617 has no advantage over Hastelloy Xat the design temperatures. For this reason, Hastelloy X is preferred. Wherehigher strength is required, Inconel 718 is specified.
Final selections.-The materials selected for design are shown in Table 5.Data are lacking in the critical area of low-cycle fatigue, especially for thespecialized TPS structures and materials under consideration. Thermal fatigue
TABLE 5.-MATERIALS SELECTED FOR DESIGN
Structural Element Selected Material Alternate Material
TPS Hastelloy X Nickel-200
Honeycomb Hastelloy X Inconel 718
Beams and clips Inconel 718 Hastelloy X
Leading edge support structure Hastelloy X Inconel 718
Strut primary structure Inconel 718 -
Mounts, mounting frame Inconel 718 -
29
will no doubt be the limiting factor in engine life. NASA-LaRC has initiateda program to develop the required data (ref. 7). The plan is to obtain fatigueand creep data for the candidate materials, including a determination of environ-mental effects. Fabrication techniques are to be developed and prototype panelsare to be tested to measure creep-rupture strength and cyclic life. Data fromthis program will be used to verify or modify the above material selections.
Coolant Flow Routing
Design conditions.--Coolant inlet and outlet temperatures are 56 and 890 K(100° and 1600°R), respectively. Coolant inlet pressure is 6.9 MPa (1000 psia)and the pressure drop in any one circuit is limited to 1.72 MPa (250 psi). Thereference design TPS was used in this analysis, viz., a Hastelloy X plate-finsurface, 11 fins per cm (28 fins per in.), 1.3 mm (0.050 in.) high, 2.5 mm(0.100 in.) offset, and 0.15 mm (0.006 in. thick), with a 0.38-mm (O.Oi5-in.)-thick hot face sheet.
i
Optimization was conducted at the maximum thermal loading case, Condition H.This condition involves a 2-g maneuver and is short term relative to a cruisecondition where design optimization is usually performed. Heating rates varybetween flight conditions, but the coolant temperature profiles and the primarystructure temperature tend to be similar for all operating conditions with com-bustion. This is because the heat flux distribution is similar for each condi-tion and the coolant inlet and outlet temperatures are maintained constant. Thecoolant flow is adjusted in response to the overall heat load. Since Condition His used for the TPS design, it was retained for the flow routing optimizationbecause of temperature profile similarity and because maximum coolant flow isrequired at Condition H and this controls manifold design.
Design goals.--The coolant pressure drop across the TPS should not exceed0.83 MPa (120 psi) to allow 0.55 MPa (80 psi) for manifolds and ducts and 0.34MPa (50 psi) for coolant control valves and distribution system. The localin-depth TPS temperature gradient should be less than 260°C (500°F) to meetcyclic life requirements. The 260°C (500°F) limit is an approximation and isused only for screening purposes. No specific limits are placed on the temper-ature difference between adjacent panels that are cooled by separate flowroutes, although the AT should be small to minimize axial differential thermalgrowth of adjacent panels.
Manifold orientation.--The hot gas flow properties are constant along anengine sweep line, and hence all sidewall manifolds were oriented parallel tothe engine 48-deg sweep line to achieve maximum coolant utilization. Thisarrangement also yields uniform temperature profiles along the sweep lines.
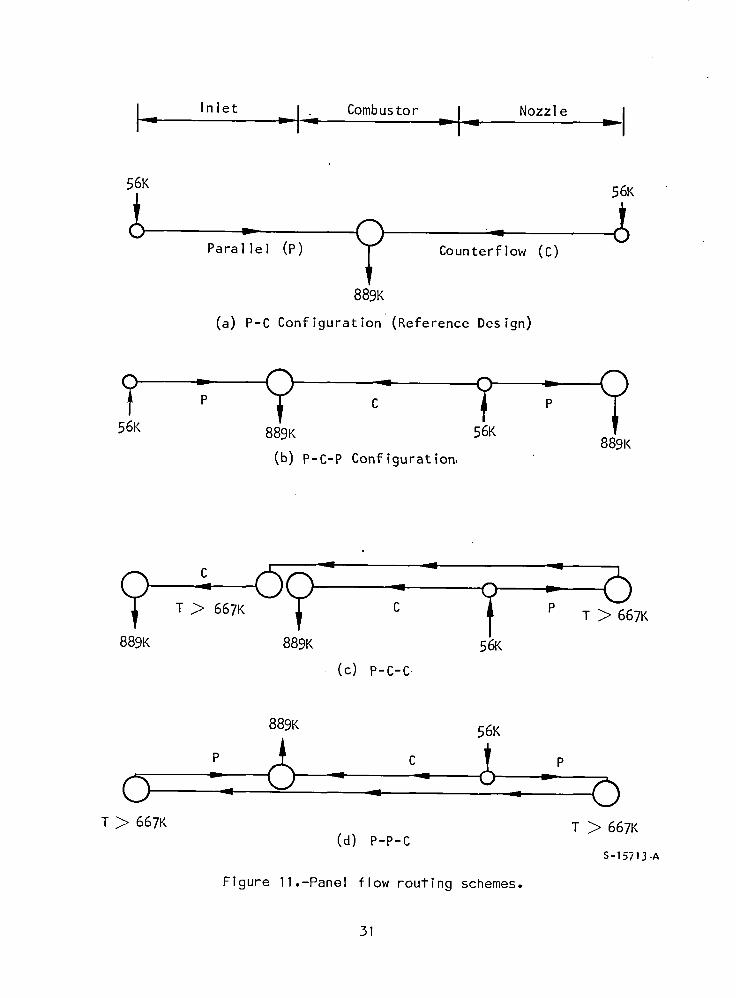
Component flow arranqement.--Possible routes through a typical component(top, sidewall, or cowl) are shown in fig. 11. The routes are designated as"P" or "C" to indicate a coolant path that is either parallel (P) or counter(C) to the airflow. Heat transfer and pressure drop performance was determinedfor each component using each of the flow route options. Most of the possibleroutes produced an excessive pressure drop, excessive temperature gradient, or
3O
I_ Inlet Combustor _l_ Nozzle II- --I- Vl-- _-I
56K 56K
Parallel (P) _r_ Counterflow (C)
889K
(a) P-C Configuration (Reference Design)
P C P
56K 889K 56K889K
(b) P-C-P Configuration,
T > 667K C P T > 667K
889K 889K 56K
(c) P-C-C.
889K 56K
P (_ C (_ p"_ _ _ _ 0
T _ 667K T _ 667K(d) P-P-C
S-15713-A
Figure 11.-Panel flow routing schemes.
31
a sudden step change in skin temperature of greater than 220 K (400°R). Thereference design flow route (fig. 11a) met all design criteria. Moreover, thisscheme requires a minimum number of manifolds and the flow is easy to meterbecause of an adequate pressure drop in each route. This reference design wasselected for final optimization.
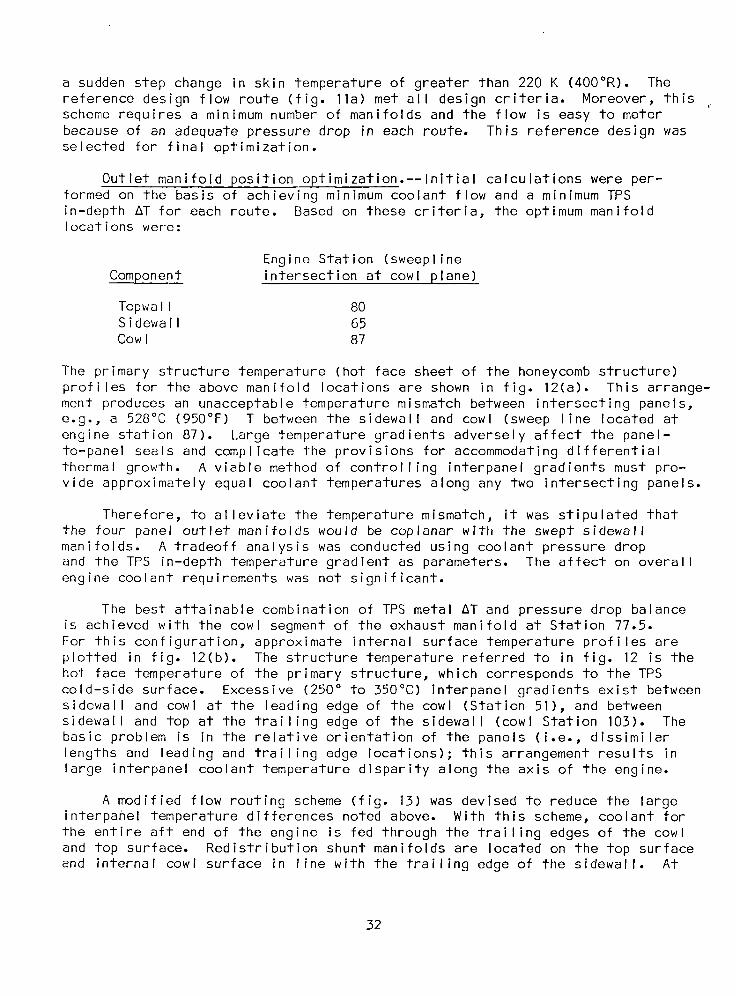
Outlet manifold position optimization.--Initial calculations were per-formed on the basis of achieving minimum coolant flow and a minimum TPSin-depth AT for each route. Based on these criteria, the optimum manifoldlocations were:
Engine Station (sweeplineComponent intersection at cowl plane)
Topwall 80Sidewall 65Cowl 87
The primary structure temperature (hot face sheet of the honeycomb structure)profiles for the above manifold locations are shown in fig. 12(a). This arrange-ment produces an unacceptable temperature mismatch between intersecting panels,e.g., a 528°C (950°F) T between the sidewall and cowl (sweep line located atengine station 87). Large temperature gradients adversely affect the panel-to-panel seals and complicate the provisions for accommodating differentialthermal growth. A viable method of controlling interpanel gradients must pro-vide approximately equal coolant temperatures along any two intersecting panels.
Therefore, to alleviate the temperature mismatch, it was stipulated thatthe four panel outlet manifolds would be coplanar with the swept sidewallmanifolds. A tradeoff analysis was conducted using coolant pressure dropand the TPS in-depth temperature gradient as parameters. The affect on overallengine coolant requirements was not significant.
The best attainable combination of TPS metal AT and pressure drop balanceis achieved with the cowl segment of the exhaust manifold at Station 77.5.For this configuration, approximate internal surface temperature profiles areplotted in fig. 12(b). The structure temperature referred to in fig. 12 is thehot face temperature of the primary structure, which corresponds to the TPScold-side surface. Excessive (250° to 350°C) interpanel gradients exist betweensidewall and cowl at the leading edge of the cowl (Station 51), and betweensidewall and top at the trailing edge of the sidewall (cowl Station 103). Thebasic problem is in the relative orientation of the panels (i.e., dissimilarlengths and leading and trailing edge locations); this arrangement results inlarge interpanel coolant temperature disparity along the axis of the engine.
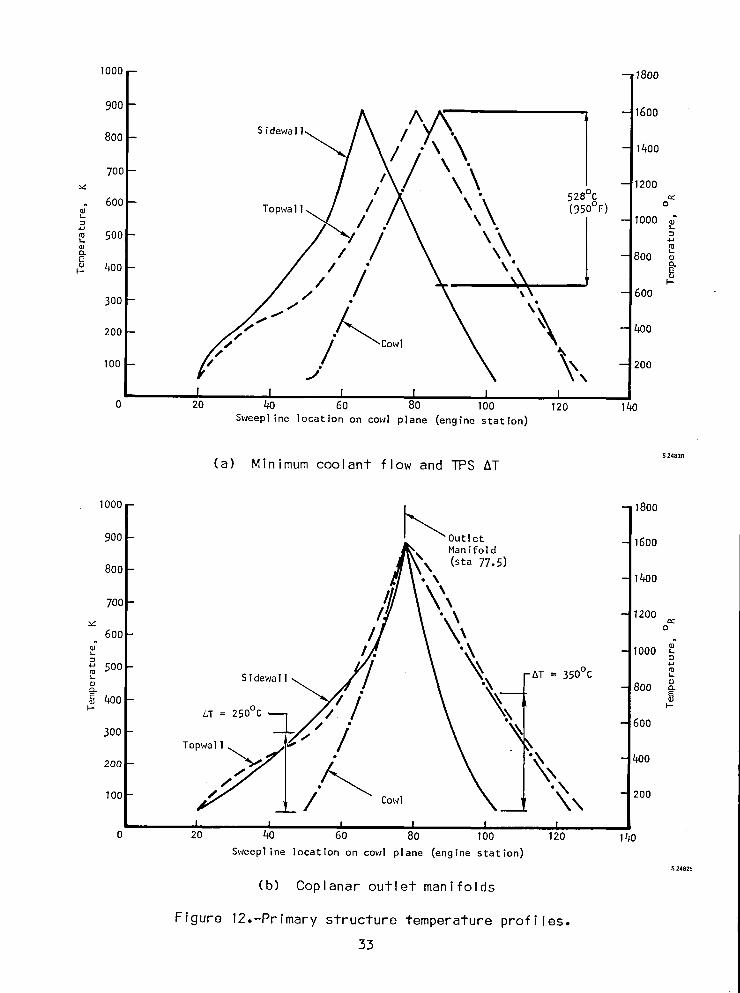
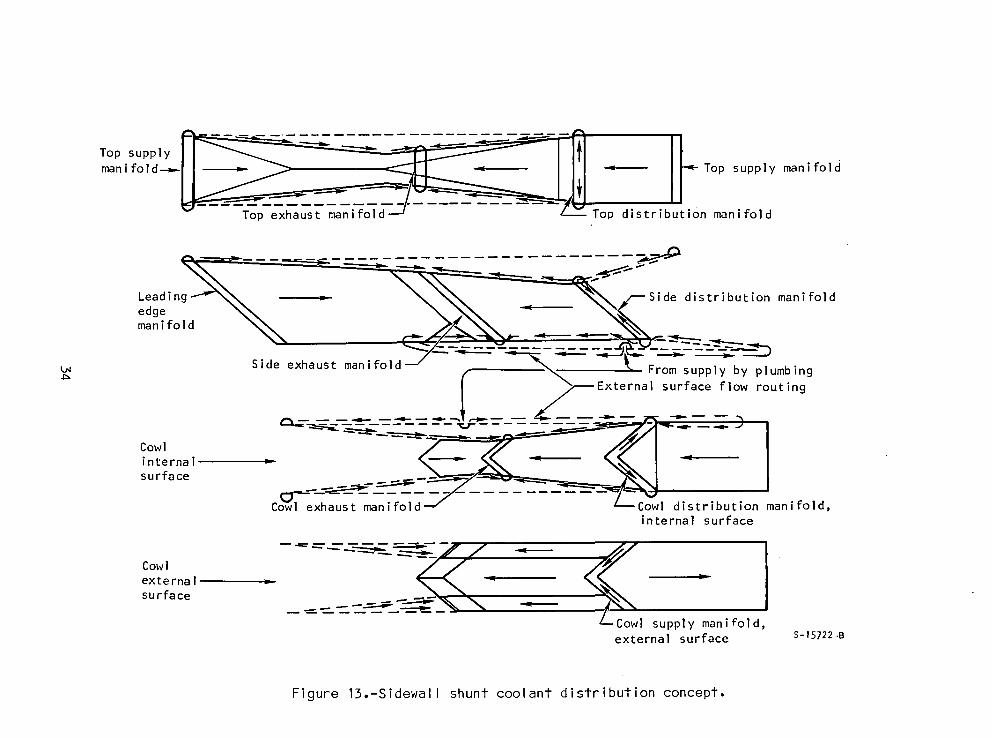
A modified flow routing scheme (fig. 13) was devised to reduce the largeinterpanel temperature differences noted above. With this scheme, coolant forthe entire aft end of the engine is fed through the trailing edges of the cowland top surface. Redistribution shunt manifolds are located on the top surfaceand internal cowl surface in line with the trailing edge of the sidewall. At
32
IOOO - -- 18o0
900 - 16oo
_oo- s,_ow /A)/k. ] ,4oo700 - "_"_" X 1200600- • 528% o_
g To I \ \ (gso°F)I \ - lOOOg500 \\
_ / \\ 800E o.
o4oo ,' / ,_ °i - 600
oo_,/--- .z.. ,\200 -- -- 400
/. / _ow, "\,,I00 -- j -- 200
I I I I I I0 20 /40 60 80 100 120 1/40
Sweepl ine location on cowl plane (engine station)
S 24830
(a) Minimum coolant flow and TPS AT
1000, - 1800
900- Outlet - 1600Manifold
800- \ (sta 77.5)- 1400
\700- \
v \ - 1200
600- I \ °_l ;- - 1ooo
500- ""Sidewal 1 -AT = 350°C ._
- 800
,4o0 Z_! °_- LT = 250°C _ _--- 600
_oo- __/.,°/200 - --400
100 - Cowl 200
- ' I I I I I0 20 40 60 80 I00 120 140
Sweepline location on cowl plane (engine station)24829
(b) Coplanar outlet manifolds
Figure 12.-Primary structure temperature profiles.
33
Topsupp,y....-_ -'Top distribution manifold
_,x,__"...... ___V\- "-_-_ _ _-,'_
Leading_'_ = \\\_'x_ _.,_cSide distribution manifoldedge _ =
manifold _ "-"2"/_"_"_"- ' """_- _'_._'_-'--'_"'_'_--- r-,.------_=---_=-_-_.- =.=--a_J_--=-----_____
Side exhaust manifold f _ _From supply by plumbing
_External surface flow routing
Cow' Ii n te rna Isurface
Cowl exhaust manifold -4 z---Cowl distribution manifold,internal surface
----_---_-__// _
Cowl __
rl/
externaI _- _ ---surface
z--Cowl supply manifold,external surface s-15722.e
Figure 13.-Sidewall shunt coolant distribution concept.
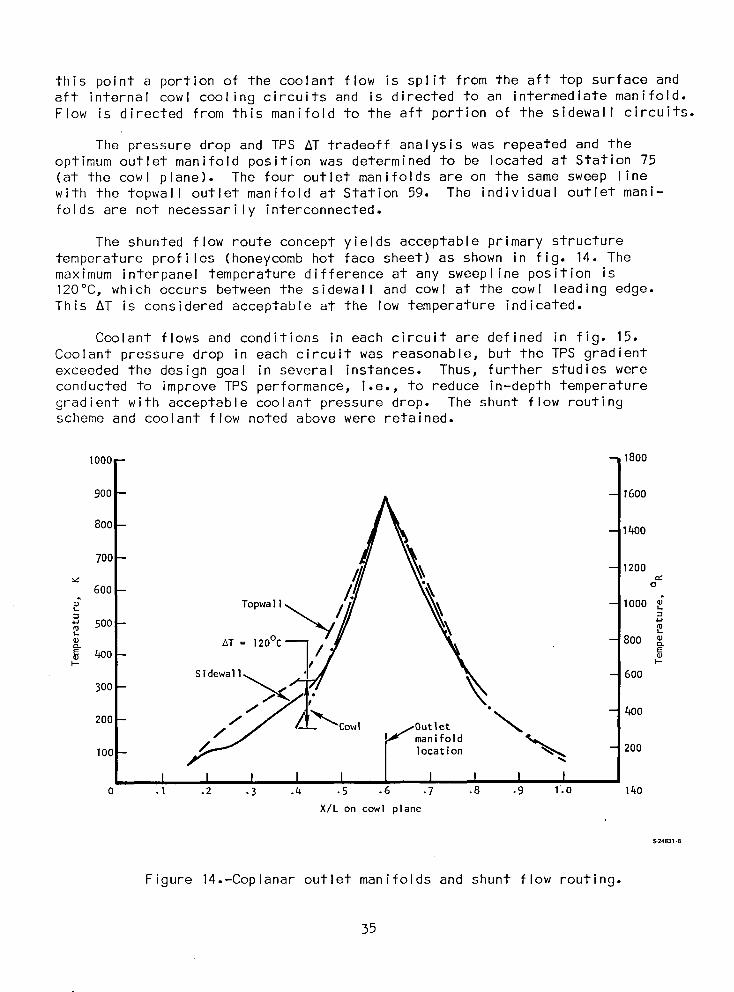
this point a portion of the coolant flow is split from the aft top surface andaft internal cowl cooling circuits and is directed to an intermediate manifold.Flow is directed from this manifold to the aft portion of the sidewall circuits.
The pressure drop and TPS AT tradeoff analysis was repeated and theoptimum outlet manifold position was determined to be located at Station 75(at the cowl plane). The four outlet manifolds are on the same sweep linewith the topwall outlet manifold at Station 59. The individual outlet mani-folds are not necessarily interconnected.
The shunted flow route concept yields acceptable primary structuretemperature profiles (honeycomb hot face sheet) as shown in fig. 14. Themaximum interpanel temperature difference at any sweepline position is120°C, which occurs between the sidewall and cowl at the cowl leading edge.This AT is considered acceptable at the low temperature indicated.
Coolant flows and conditions in each circuit are defined in fig. 15.Coolant pressure drop in each circuit was reasonable, but the TPS gradientexceeded the design goal in several instances. Thus, further studies wereconducted to improve TPS performance, i.e., to reduce in-depth temperaturegradient with acceptable coolant pressure drop. The shunt flow routingscheme and coolant flow noted above were retained.
I000- - 1800
0 .1 .2 .3 .4 .5 .6 .7 .8 .9 1.0 140
X/L on cowl plane
,_24831 -B
Figure 14.-Coplanar outlet manifolds and shunt flow routing.
35

i FLOW :
To oo,e(.2051 lb/sec)
.o_l7___
/ , . 39 I .o379 (.2980)J. ' (.3070) _ ._ (.0836)
. , - l_.,s_o_ l l/.2g_.i??,_' \ / I I T = 266 K (479°R)
i._:l.> . :1392..... _ I ._o_3
- T(-0995) "_.1561
(.3442)j..2012
4 1" (. 4437)01ant outlet
nifold /= 889K (1600%)1= 5.17 HPa (750 _"
psia) J "*-'-"-- "_I .1172
i0_)i). _ (.2584)
IS'rut'I _.0382 m )
(.0842)
_..o39s \.ol6s'(.0871) (.0363) .1172
• L(.2584>.Coolant inlet
T = 56 K (lO0°R)P = 6.89 MPa (I000 psla)
FLOW : .5465 kg/sec (1.2048 Ib/sec)
S-24924 -B
Figure 15.-Coolant flow conditions.
36
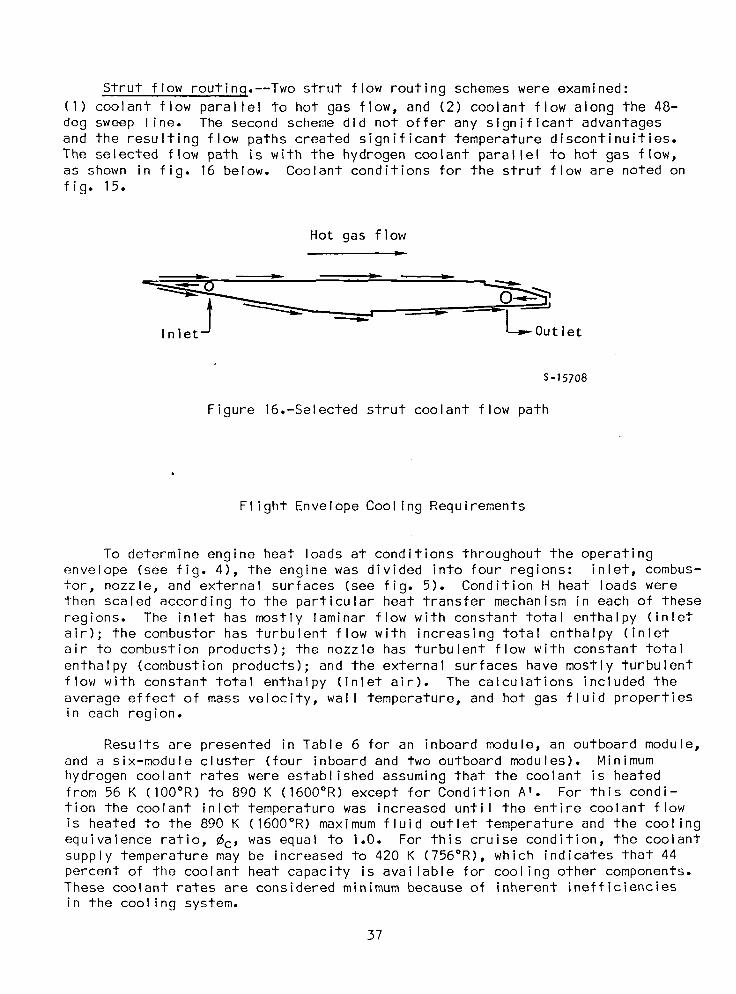
Strut flow routinq.--Two strut flow routing schemes were examined:
(I) coolant flow parallel to hot gas flow, and (2) coolant flow along the 48-deg sweep line. The second scheme did not offer any significant advantagesand the resulting flow paths created significant temperature discontinuities.The selected flow path is with the hydrogen coolant parallel to hot gas flow,as shown in fig. 16 below. Coolant conditions for the strut flow are noted onfig. 15.
Hot gas flow
Inlet Outlet
S-|5708
Figure 16.-Selected strut coolant flow path
Flight Envelope Cooling Requirements
To determine engine heat loads at conditions throughout the operatingenvelope (see fig. 4), the engine was divided into four regions: inlet, combus-tor, nozzle, and external surfaces (see fig. 5). Condition H heat loads werethen scaled according to the particular heat transfer mechanism in each of theseregions. The inlet has mostly laminar flow with constant total enthalpy (inletair); the combustor has turbulent flow with increasing total enthalpy (inletair to combustion products); the nozzle has turbulent flow with constant totalenthalpy (combustion products); and the external surfaces have mostly turbulentflow with constant total enthalpy (inlet air). The calculations included theaverage effect of mass velocity, wall temperature, and hot gas fluid propertiesin each region.
Results are presented in Table 6 for an inboard module, an outboard module,and a six-module cluster (four inboard and two outboard modules). Minimumhydrogen coolant rates were established assuming that the coolant is heatedfrom 56 K (IO0°R) to 890 K (1600°R) except for Condition A'. For this condi-tion the coolant inlet temperature was increased until the entire coolant flowis heated to the 890 K (1600°R) maximum fluid outlet temperature and the cooling
equivalence ratio, _c, was equal to 1.0. For this cruise condition, the coolantsupply temperature may be increased to 420 K (756°R), which indicates that 44percent of the coolant heat capacity is available for cooling other components.These coolant rates are considered minimum because of inherent inefficienciesin the cooling system.
37

TABLE 6.-ALTITUDE-MACH NUMBER ENVELOPE COOLANT REQUIREMENTS.
Inboard Outboard Six Inboard Outboard Six Inboard/ Inboard Outboard
module module module module module module outboard Six module, module,
heat heat heat coolant coolant coolant module module cooling cooling SixFlight load, load, load, flow, flow, flow, fuel flow, fuel flow, equiv, equiv, module
condition MW MW MW kg/sec kg/sec kg/sec kg/sec kg/sec ratio, _c ratio, _c _c at(fig. 4) (Btu/sec (Btu/sec) (Btu/sec)I (Ibm/sec) (Ibm/see) (Ibm/sec (Ibm/sec) (Ibm/sec) (#f = 1.0 (_f = 1.0) _f = I
A 1.48 1.73 9.39 .118 .138 .748 .245 1.470 .483 .563 .509(1407} (1640) (8908) (.261) (.304) (1.650) (.540) (3.240)
A' 1.48 1.73 9.39 .245 .249 1.47 .245 1.470 1.000 1.000 1.000(1407) (1640) (8908) (.540) (.540) (3.240) (.540) (3.240)
Tin = Tin = Tin =486 K 420 K 464 K
(876°R) (756°R) (836°R)
B 3.58 4.04 22.42 .285 .322 1.79 .365 2.188 I.f73 1.324 1.239(3399) (3835) (21266) (.629) (.710) (3.936) (.804) (4.824)
L_CO C 1.13 1.44 7.41 .090 .175 .591 .584 3.503 .155 .197 .169(1075) (1366) (7032) (.199) (.253) (1.302) (1.287) (7.722)
D 2.87 3.31 18.08 .229 .264 1.44 .607 3.644 .376 .434 .395(2719) (3135) (17,146) (.504) (.581) (3.175) (1.339) (8.034)
E 4.06 4.60 25.45 .324 .367 2.03 .581 3.484 .558 .631 .582(3855) (4361) (24,142) (.714) (.808) (4.471) (1.280) (7.680)
F 5.75 6.41 35.81 .458 .510 .285 .828 4.970 .829 .924 .861(5454) (6076) (33,968) (1.010) (1.125) (6.290) (1.826) (!0.956)
G 2.70 3.16 17.12 .215 .251 1.36 .667 4.003 .332 .377 .341(2562) (2993) (16,234) (.474) (.554) (3.006) (1.471) (8.826)
H 6.85 7.72 42.85 .546 .615 3.41 1.007 6.042 .813 .915 .848(6500) (7319) (40,638) (1.205) (1.355) (7.526) (2.220) (13.320)
I 3.25 3.88 20.74 .259 .309 1.65 0.0 0.0 - .410(3078) (3680) (19,672) (.570) (.681) (3.643)
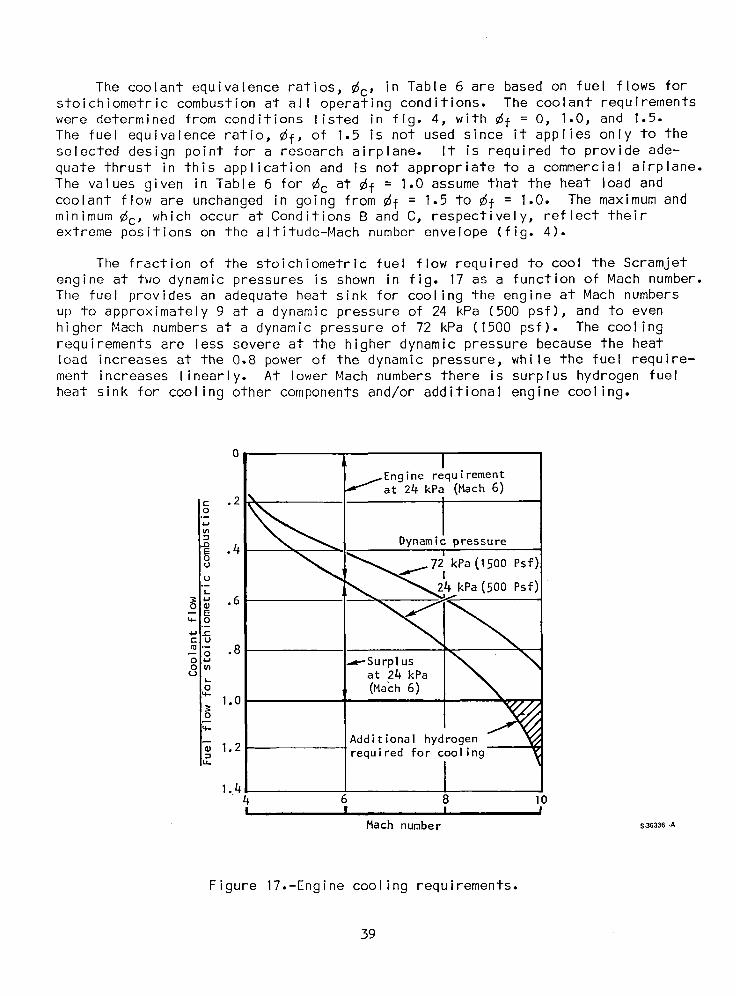
The coolant equivalence ratios, _c' in Table 6 are based on fuel flows forstoichiometric combustion at all operating conditions. The coolant requirementswere determined from conditions listed in fig. 4, with _f = O, 1.0, and 1.5.The fuel equivalence ratio, _f, of 1.5 is not used since it applies only to theselected design point for a research airplane. It is required to provide ade-quate thrust in this application and is not appropriate to a commercial airplane.
The values given in Table 6 for _c at _f = 1.0 assume that the heat load andcoolant flow are unchanged in going from _f = 1.5 to _f = 1.0. The maximum andminimum _c, which occur at Conditions B and C, respectively, reflect theirextreme positions on the altitude-Mach number envelope (fig. 4).
The fraction of the stoichiometric fuel flow required to cool the Scramjetengine at two dynamic pressures is shown in fig. 17 as a function of Mach number.The fuel provides an adequate heat sink for cooling the engine at Mach numbersup to approximately 9 at a dynamic pressure of 24 kPa (500 psf), and to evenhigher Mach numbers at a dynamic pressure of 72 kPa (1500 psf). The coolingrequirements are less severe at the higher dynamic pressure because the heatload increases at the 0.8 power of the dynamic pressure, while the fuel require-ment increases linearly. At lower Mach numbers there is surplus hydrogen fuelheat sink for cooling other components and/or additional engine cooling.
0 I_Engine requirementat 24 kPa (Mach 6)
Dynamic pressure
i _._..7_ kPa(1500 esf)• _. _2.4 kPa (500 Psf)
_-I._
4J _"
"°1" . Surp!us Io _ at 24 kPa I %.
required for cooling
1.44 6 8 10I ! I I
Mach number S.36336-A
Figure 17.-Engine cooling requirements.
39

A breakdown of heat load by engine section is presented in fig. 18a. Theinlet section is composed of all internal surfaces up to the fuel injectors;the combustor section extends to the internal sweepline from station 80.755 onthe top surface to 94.649 on the cowl, and the nozzle section extends to theend of the engine (see fig. 5). Included is the small fraction of externalheat loads. The major portion of the heating occurs in the combustor section.There is no fixed relationship in the heating rates between sections.
Another breakdown of engine heating is presented in fig. 18b, where theheating on the forward engine section is presented as a percentage of totalengine load. The forward section includes the inlet section plus the forwardexternal surfaces. The aft section (the complement of the forward section ona percentage basis) includes the combustor, nozzle, and aft external surfaces.This heating breakdown corresponds to the loading on forward and aft coolantflow routes on the engine. Again, there is no fixed relationship in the heat-ing rates between sections.
Thus, for efficient utilization of coolant throughout the operatingenvelope, active controls must be used to vary the coolant flow split betweenthe forward and aft portions of the engine. Flow control by means of fixedorifices would not suffice. A preliminary design of a scramjet fuel systemwith active coolant flow controls is presented in a subsequent section entitledHydrogen Flow Control.
Thermal Protection System (TPS)
Heat exchanqer design.--Three types of TPS configurations were considered:(I) rectangular offset plate-fin, (2) rectangular plain machined channel, and(3) equally spaced (equilateral triangle) circular pin-fin. Fig. 19 presentsa sketch of these surfaces and the dimensional ranges.
The 11-fin-per-cm rectangular offset fin is the reference design and is thebasis of comparison. The 14-fin-per-cm fin is one-half the above passage heightand is considered for high heat flux areas to minimize in-depth temperature dif-ferences (AT's). For the machined fins, the 2.0-mm (O.080-in.) fin spacing and0.51-mm (O.020-in.) fin thickness are reasonable manufacturing limits. The pin-fin was cqnsidered because it can provide the interrupted coolant passage char-
acteristics of an offset plate-fin. Spacing-to-pin diameter ratios (Sp/Dp) of2 and 2.7 were selected to provide adequate coolant pressure containmeht.- Inall configurations, a 0.38-mm (O.015-in.) face sheet was used.
Coolant flow rates and passage lengths in each circuit were defined bythe flow routing studies and are fixed. The coolant pressure drop in eachcircuit is limited to approximately 0.83 MPa (120 psi) (0.55 MPa for manifoldsand ducting); each circuit should expend as much as possible of this allotment.The struts have shorter flow lengths than the panels, and hence the unit pres-sure drop can be higher.
Heat transfer performance curves were developed for each surface; typicalexamples are shown in fig. 20. It is possible to trade off reductions in the
4O
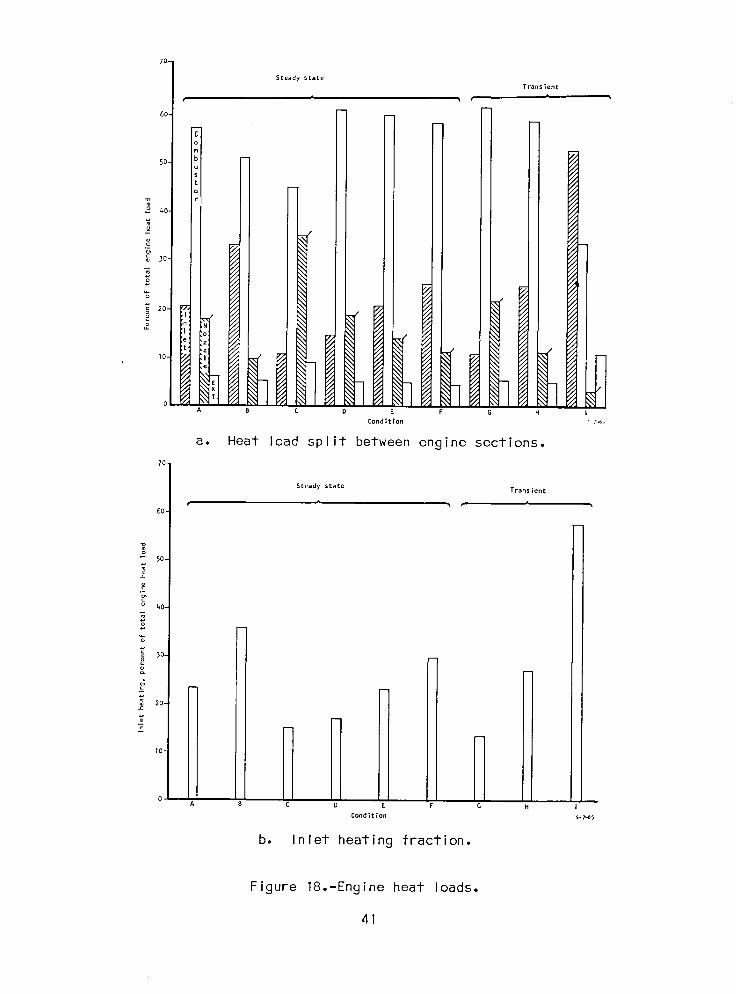
70-
Steady stateTrans |ent
60-
50-
°_ 4o-
"_ 30-
20-
o :',e ,
/ /
10- io A 7B C D E F G H I
Cond {t | on _-?46
a. Heat load split between engine sections.70
Steady state Trans lent
A60-
-- 50-
o_
4o-
_ 3o- r"
_ _20-
z
10- i
0A 8 C. D E F G H I
Cond_t ion S-7_6S
b. Inlet heating fraction.
Figure 18.-Engine heat loads.
41
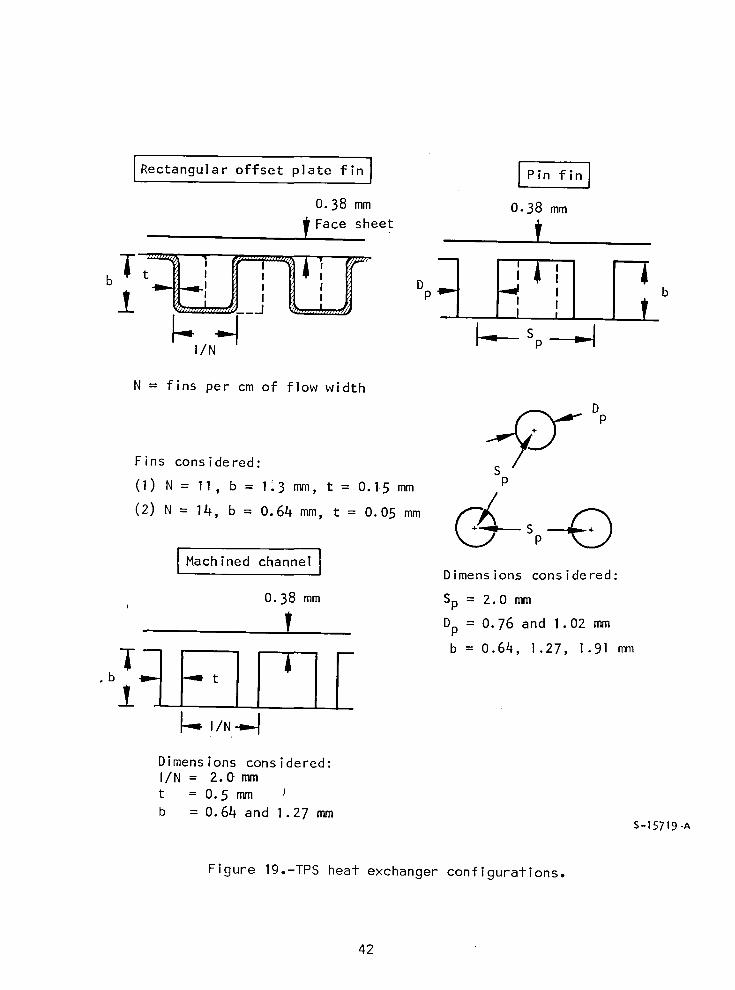
]Rectangular offset plate fin] {Pin fin]
0.38 mm 0.38 mm
_Face sheet
', b
N = fins per cm of flow width
Fins considered:
(I) N = 11, b = 1'3 ram,t = 0.1.5mm P
(2) N = 14, b = 0.64 mm, t = 0.05 mm __Sp__@
IMachined channel I Dimensions considered:
0.38 mm Sp = 2.0 mm
Dp = O. and I.0276 mfn
-_-_ _i I A _ b = 0.64, 1.27, 1.91 mm
ob t
i'/N-I_I
Dimensions considered:I/N = 2.0 mmt = 0.5 mm
b = 0.64 and 1.27 mmS-15719-A
Figure 19.-TPS heat exchanger configurations.
42
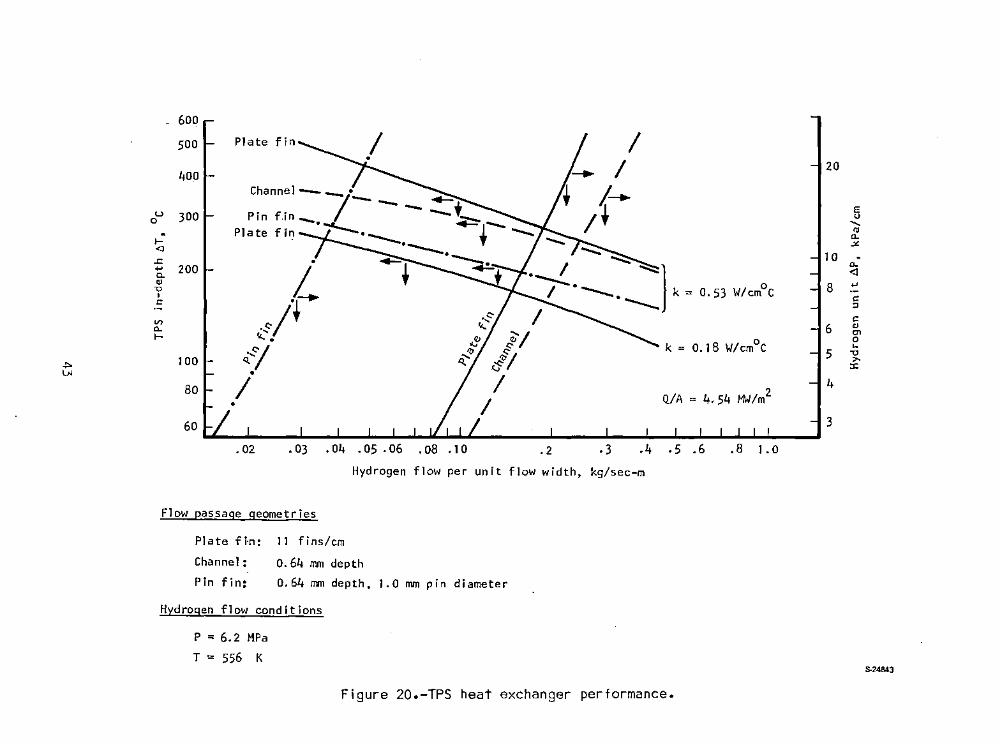
_ 60q
500
40920
u 300E
°0....... ttl
I-a.
<l~
.r: . 10 ft
.... 200 La.
Co <1Q)
0.53 W/cmoC 8 ...."I .-c: .•-. c:
:;l
Vl c:a. .~/ 6 Q)
I- 1<.,'. '/ 0'1
~ k = 0.18 W/cmoC °Q.'l ...§; 5 "'C
100 :>-~ G :I:~ •
80 / / 24
/ Q/A = 4.54 MW/m
60 3
.02 .03 .04 .05 .06 .08 .10 .2 .3 .4 .5 .6 .8 1.0
Hydrogen flow per unit flow width, kg/sec-m
Flow passage geometries
Plate fi·n:
Channel:
Pin fin:
11 fi ns/cm
0.64 mm depth
0.64 mm depth, 1.0 mm pin diameter
Hydrogen flow conditions
P = 6.2 MPa
T = 556 K&24843
Figure 20.-TPS heat exchanger performance.

TPS in-depth temperature gradient with increases in coolant pressure drop orin TPS material (thermal conductivity).
The performance in each flow route was determined for each candidate
surface at average hydrogen flow conditions. Coolant pressure drop wasestimated for the entire flow route; the TPS AT was determined only at thepeak heat flux condition. Results for the sidewall are shown in Table 7.Here, the 0.64-mm (O.025-in.)-deep channel provides the lowest AT within thepressure drop guidelines.
Thermal conductivity has a pronounced effect on the TPS thermal gradient.The following results are for the sidewall forward flow route:
TPS Mat_ri_l
Hastelloy Xt Nickel-200tk = 0.18 W/cm-°C k = 0.53 W/cm-°C(I0 Btu/hr-ft-°F) (30 Btu/hr-°F)
TPS hot skin temperature, K (°R) 784 (1412) 685 (1233)
Primary structure temperature, K 550 (990) 550 (990)(°R) (honeycomb hot face sheet)
TPS temperature gradient, 234 (422) 135 (243)maximum AT, K (°R)
For external surface cooling, passive as well as active schemes wereinvestigated with the following results at steady state:
Metal substrate Net heat input,Method temperature, K (°R) MW/m (Btu/sec-ft2)
Reusable surface insulation (RSI) 1300 (2340) 0.054 (4.8)0.25 in. thick, k = 0.18 W/cm-°C(1.0 Btu/hr-ft-°F)
Rockide Z insulation, 0.025 in. 1420 (2550) 0.093 (8.3)thick, k = 0.018 W/cm-°C(0.I Btu/hr-ft-°F)
Bare metal, emissivity = 0.8 1440 (2590) 0.10 (8.9)
Active cooling with hydrogen, 200 (360) 0.45 (40)inlet temperature = 56 K (IO0°R)
The internal structure was assumed to be at 278 K (500°R) in all cases. RSIthickness is limited by the cowl depth.
44

TABLE 7.-SIDEWALL TPS TEMPERATURE GRADIENT AND PRESSURE DROP
SI UNITS
Material: Hastelloy X, k = 0.18 watts/cm-°CHydrogen Conditions: T = 556 K, P = 6.20 MPa
Forward flow route(1) Aft flow route (2)
Surface Description AT, °C _P, MPa AT, °C _P, MPa
Plate fin 11 fins/cm 256 1.14 189 0.9414.2 fins/cm 206 5.10 152 4.03
Channel 1.27 mm deep 357 0.12 266 0.090.64 mm deep 234 0.70 178 0.52
Pin-fin 1.02 mm dia by 0.64 mm deep 172 24.06 131 19.031.02 mm dia by 1.27 mm deep 220 7.10 162 5.641.02 mm dia by 1.91 mm deep 254 3.15 188 2.440.76 mm dia by 1.27 mm deep 232 3.34 172 2.54
(I) Flow = 0.0631 kg/sec, average flow width = 0.419 m, flow length = 1.40 m,heat flux = 4.02 MW/m2.
(2) Flow = 0.0692 kg/sec, average flow width = 0.349 m, flow length = 0.63 m,heat flux = 3.27 MW/m2.
U.S. CUSTOMARY UNITS
Material: Hastelloy X, k = I0 Btu/hr-ft-°FHydrogen Conditions: T = IO00°R, P = 900 psia
Fgrward flow route(1) Aft flow route(2)Surface Description AT, °F _P, psi AT, °F _P, psi
Plate fin 28 fins/in. 460 165 340 13636 fins/in. 371 740 274 585
Channel .050 in. deep 643 18 478 13•025 in. deep 422 101 320 76
Pin fin .040 in. dia by .025 in. deep 310 3490 235 2760.040 in. dia by .050 in. deep 396 1030 292 818.040 in. dia by .075 in. deep 458 457 338 354.030 in. dia by .050 in. deep 418 484 310 368
(I) Flow = .1392 Ib/sec, average flow width = 1.375 ft, flow length = 55 in.,heat flux = 354 Btu/sec-ft2
(2) Flow = .1527 Ib/sec, average flow width = 1.144 ft, flow length = 25 in.,heat flux = 288 Btu/sec-ft2
45
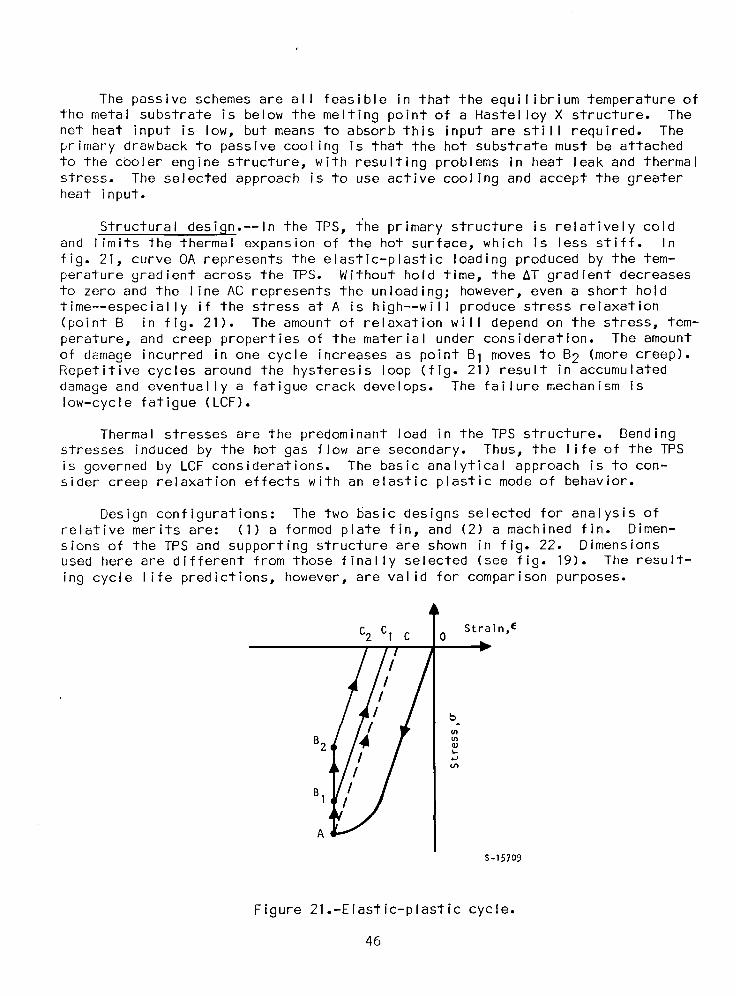
The passive schemes are all feasible in that the equilibrium temperature ofthe metal substrate is below the melting point of a Hastelloy X structure. Thenet heat input is low, but means to absorb this input are still required. Theprimary drawback to passive cooling is that the hot substrate must be attachedto the cooler engine structure, with resulting problems in heat leak and thermalstress. The selected approach is to use active cooling and accept the greaterheat input.
Structural design.--In the TPS, the primary structure is relatively coldand limits the thermal expansion of the hot surface, which is less stiff. Infig. 21, curve OA represents the elastic-plastic loading produced by the tem-perature gradient across the TPS. Without hold time, the AT gradient decreasesto zero and the line AC represents the unloading; however, even a short holdtime--especially if the stress at A is high--will produce stress relaxation(point B in fig. 21). The amount of relaxation will depend on the stress, tem-perature, and creep properties of the material under consideration. The amountof damage incurred in one cycle increases as point B I moves to B2 (more creep).Repetitive cycles around the hysteresis loop (fig. 21) result in accumulateddamage and eventually a fatigue crack develops. The failure mechanism islow-cycle fatigue (LCF).
Thermal stresses are the predominant load in the TPS structure. Bendingstresses induced by the hot gas flow are secondary. Thus, the life of the TPSis governed by LCF considerations. The basic analytical approach is to con-sider creep relaxation effects with an elastic plastic mode of behavior.
Design configurations: The two basic designs selected for analysis ofrelative merits are: (I) a formed plate fin, and (2) a machined fin. Dimen-sions of the TPS and supporting structure are shown in fig. 22. Dimensionsused here are different from those finally selected (see fig. 19). The result-ing cycle life predictions, however, are valid for comparison purposes.
C2 CI C 0 Strain'E
1/,"/ "/k'/,.I/;IB2 _
S-15705
Figure 21.-Elastic-plastic cycle.
46
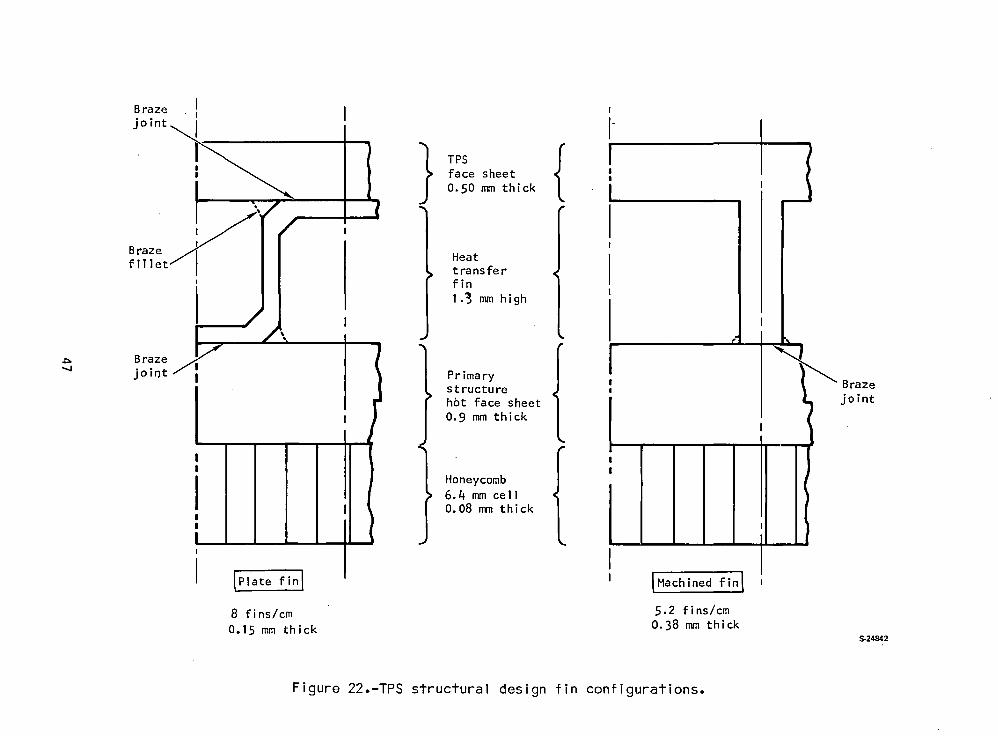
Braze I I
joint _,,,, I-i} jface sheet i
0.50 ram thick I
" ' I IBraze _ m
fi|letf I Heat Itransfer
I.3 mm high I
/
Braze
"_ jo irjt Primary I Brazestructure
hot face sheet joint
I 0.9 mm thick
IJ]IIHoneycomb 16.4 mm cell
0.08 mm thick i
I II
8 fins/cm 5.2 fins/cm
0.15 mm thick 0.38 ram thickS-24_2
Figure 22.-TPS structural design fin configurations.
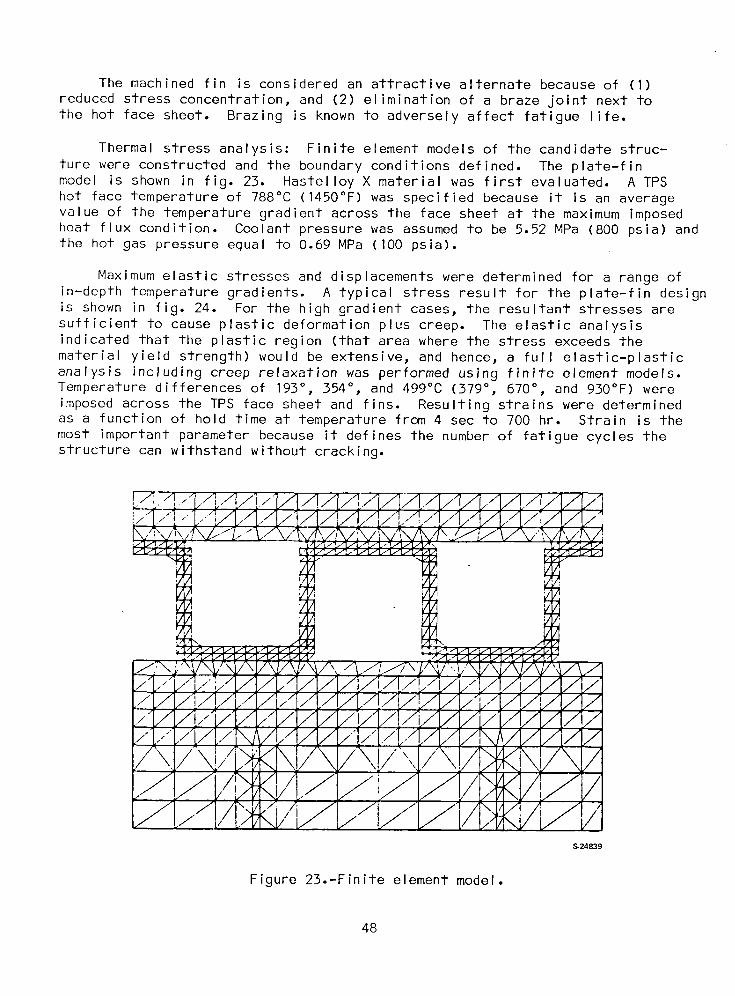
The machined fin is considered an attractive alternate because of (I)reduced stress concentration, and (2) elimination of a braze joint next tothe hot face sheet. Brazing is known to adversely affect fatigue life.
Thermal stress analysis: Finite element models of the candidate struc-ture were constructed and the boundary conditions defined. The plate-finmodel is shown in fig. 23. Hastelloy X material was first evaluated. A TPShot face temperature of 788°C (1450°F) was specified because it is an averagevalue of the temperature gradient across the face sheet at the maximum imposedheat flux condition. Coolant pressure was assumed to be 5.52 MPa (800 psia) andthe hot gas pressure equal to 0.69 MPa (100 psia).
Maximum elastic stresses and displacements were determined for a range ofin-depth temperature gradients. A typical stress result for the plate-fin designis shown in fig. 24. For the high gradient cases, the resultant stresses aresufficient to cause plastic deformation plus creep. The elastic analysisindicated that the plastic region (that area where the stress exceeds thematerial yield strength) would be extensive, and hence, a full elastic-plasticanalysis including creep relaxation was performed using finite element models.Temperature differences of 193°, 354°, and 499°C (379°, 670°, and 930°F) wereimposed across the TPS face sheet and fins. Resulting strains were determinedas a function of hold time at temperature from 4 sec to 700 hr. Strain is themost important parameter because it defines the number of fatigue cycles thestructure can withstand without cracking.
S-24839
Figure 23.-Finite element model.
48
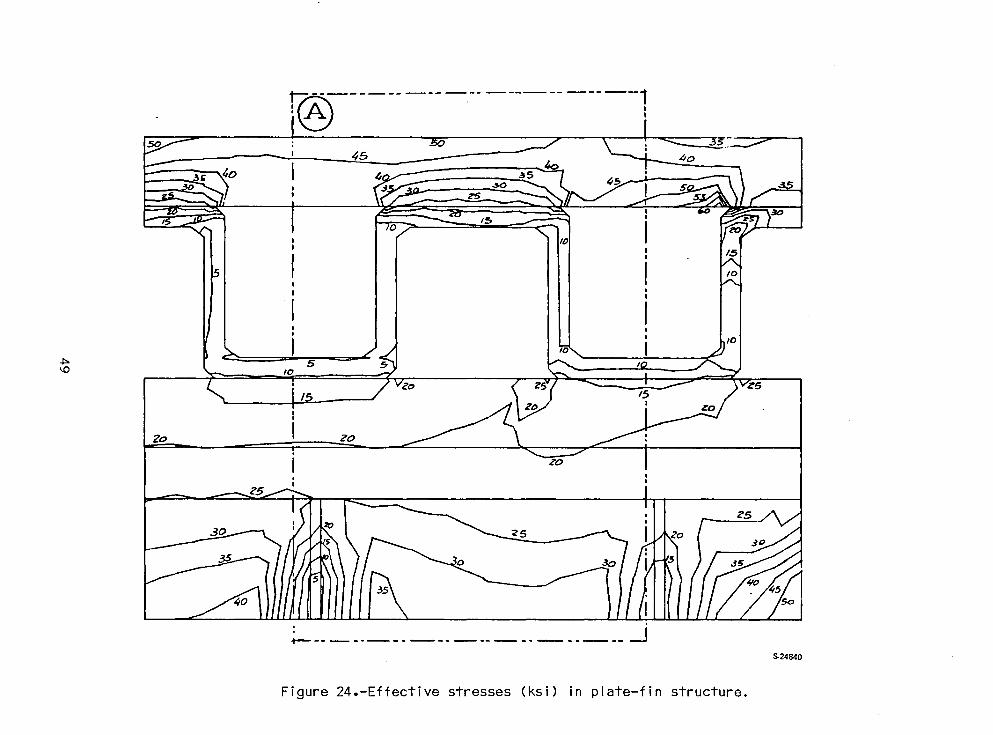
Figure 24.-Effective stresses (ksi) in plate-fin structure.
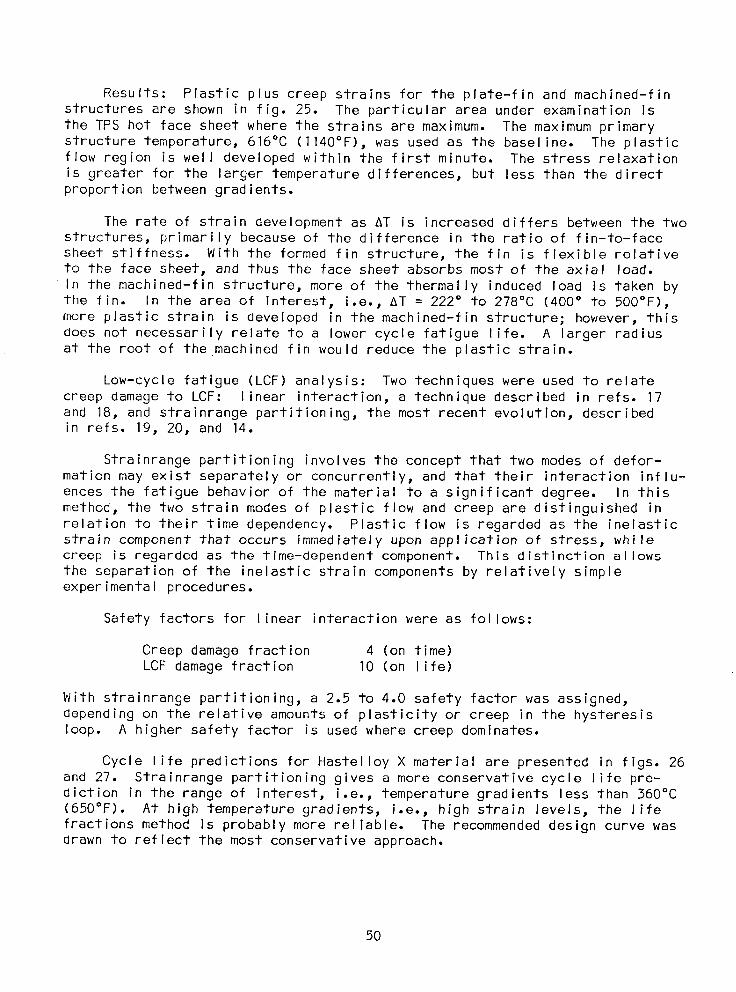
Results: Plastic plus creep strains for the plate-fin and machined-finstructures are shown in fig. 25. The particular area under examination isthe TPS hot face sheet where the strains are maximum. The maximum primarystructure temperature, 616°C (I140°F), was used as the baseline. The plasticflow region is well developed within the first minute. The stress relaxationis greater for the larger temperature differences, but less than the directproportion between gradients.
The rate of strain development as AT is increased differs between the twostructures, primarily because of the difference in the ratio of fin-to-facesheet stiffness. With the formed fin structure, the fin is flexible relativeto the face sheet, and thus the face sheet absorbs most of the axial load.
In the machined-fin structure, more of the thermally induced load is taken bythe fin. In the area of interest, i.e., &T = 222° to 278°C (400° to 500°F),more plastic strain is developed in the machined-fin structure; however, thisdoes not necessarily relate to a lower cycle fatigue life. A larger radiusat the root of the machined fin would reduce the plastic strain.
Low-cycle fatigue (LCF) analysis: Two techniques were used to relatecreep damage to LCF: linear interaction, a technique described in refs. 17and 18, and strainrange partitioning, the most recent evolution, describedin refs. 19, 20, and 14.
Strainrange partitioning involves the concept that two modes of defor-mation may exist separately or concurrently, and that their interaction influ-ences the fatigue behavior of the material to a significant degree. In thismethod, the two strain modes of plastic flow and creep are distinguished inrelation to their time dependency. Plastic flow is regarded as the inelasticstrain component that occurs immediately upon application of stress, whilecreep is regarded as the time-dependent component. This distinction allowsthe separation of the inelastic strain components by relatively simpleexperimental procedures.
Safety factors for linear interaction were as follows:
Creep damage fraction 4 (on time)LCF damage fraction I0 (on life)
With strainrange partitioning, a 2.5 to 4.0 safety factor was assigned,depending on the relative amounts of plasticity or creep in the hysteresisloop. A higher safety factor is used where creep dominates.
Cycle life predictions for Hastelloy X material are presented in figs. 26and 27. Strainrange partitioning gives a more conservative cycle life pre-diction in the range of interest, i.e., temperature gradients less than 360°C(650°F). At high temperature gradients, i.e., high strain levels, the lifefractions method is probably more reliable. The recommended design curve wasdrawn to reflect the most conservative approach.
5O
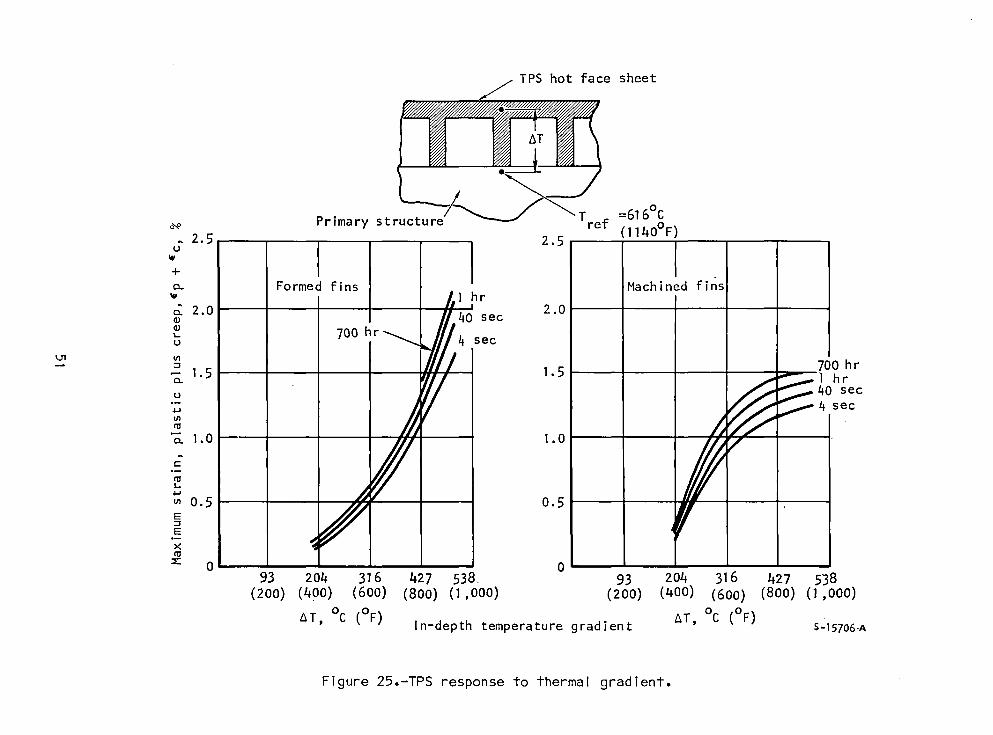
TPS hot face sheet
=616°C
o\O Primary structure Tref (1140°F)2.5 2.5
U
4-
c_ Formed fins Machined fins
_I hr_. 2.0 2.0
o __ 4( sec
,- 700hro 4 sec
--= 1.5 1.5 700hr
y _ h
o
_m _ _% 4 sec
"_ 1.0 1.0 /.5
0.5 0.5
, / ¥E"x _¢u
" 0 093 204 316 427 538 93 204 316 427 538
(200) (400) (600) (800) (1,000) (200) (400) (600) (800) (1 ,000)
AT, °C (OF) In-depth temperature gradient AT, °C (OF) S-15706-A
Figure 25.-TPS response to thermal gradient.
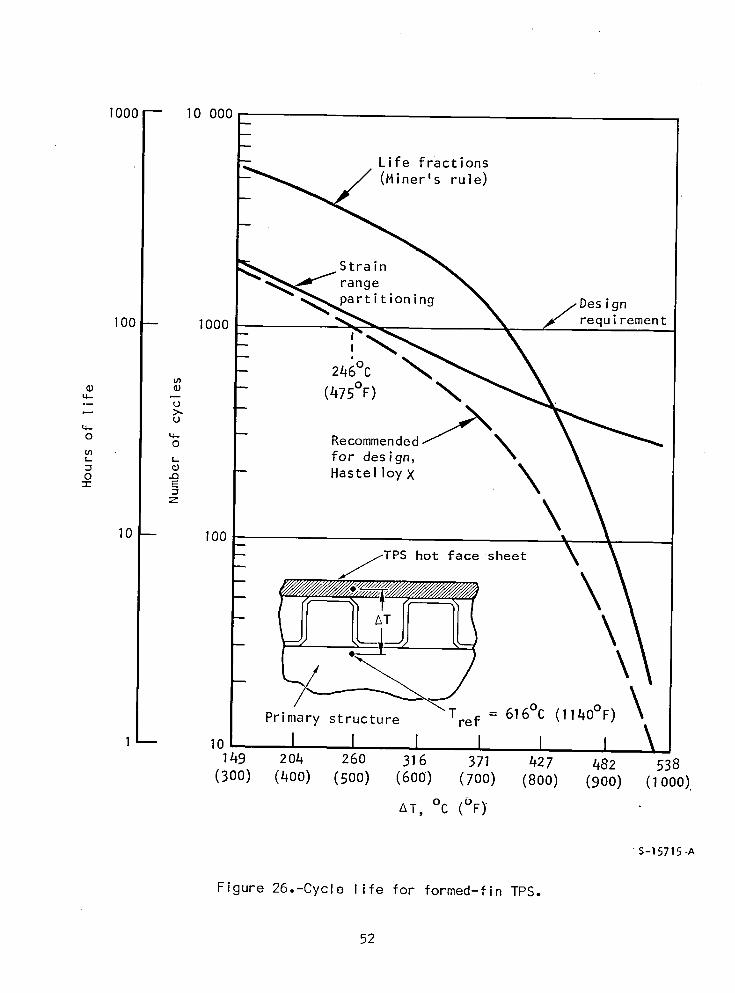
1000_ 10 000
- Life fractions
(Miner's rule)
Strain
range
rtitioning Des ign
I00 -- I000 requirement
I
246°C_o
¢_ -- (475°F)°u
uq.-
O q-- _ _.o Recommended\for design,I_ L_
o _ -- Hastel loyX-r E
10 -- I00
-- jTPS hot face-sheet k
\\
T = 616°C (1140°F) \Primary structure ref
I-- 1o I I I I I I \149 204 260 316 371 427 482 538
(300) (400) (500) (800) (700) (800) (900) (! 000).
AT, °C (OF)"
•S-15715-A
Figure 26.-Cycle life for formed-fin TPS.
52
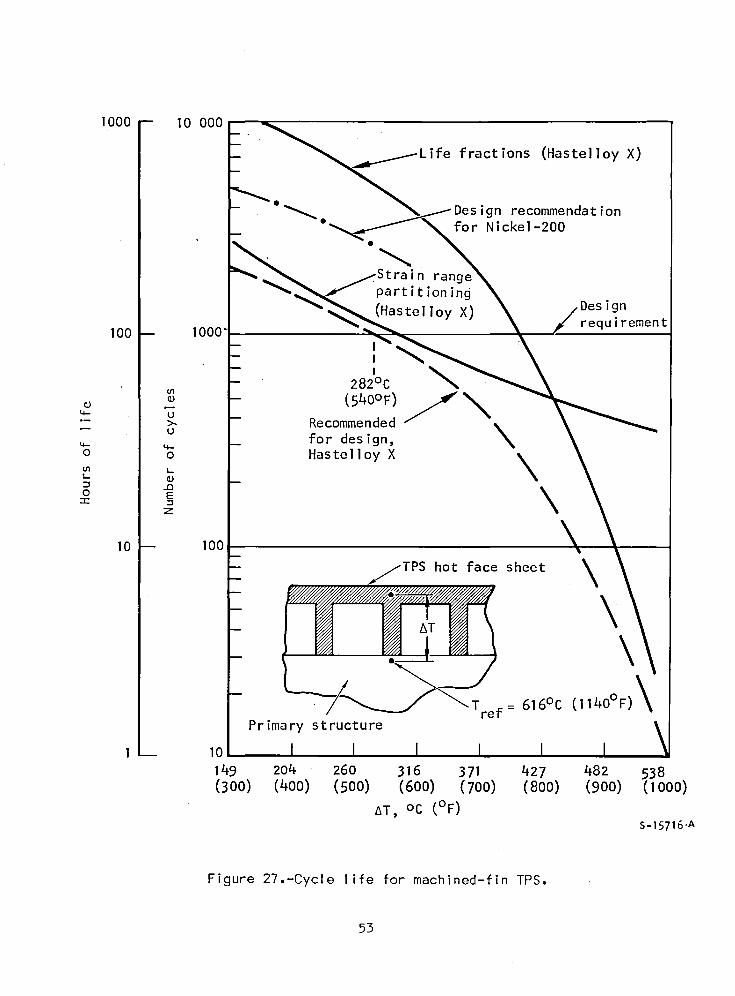
1000 -- 10 000
fe fractions (Haste]lay X)
Des ign recommendation• for Nickel-200
i n rangepart it ion ing
(Hastel lay X) ign100 -- lO00" requirement
II
, \282°C
o _° (540°F) J _q- u"- _- Recommended
-- u for design,q-- q_
o o Haste]lay X-i _Q
o E \"1- -1z
10 _ 100
hot face sheet X
\\
- \Tref = 616°C (I140°F)
Primary structure1-- 10 I I I I I I149 204 260 316 371 427 482 538(300) (400) (500) (600) (700) (800) (900) (IO0O)
AT, oc (OF)S-15716-A
Figure 27.-Cycle life for machined-fin TPS.
53
In terms of cycle life, the machined fin is superior to the formed-finstructure, even though the amount of plastic strain is greater for the machinedfin at temperature differences less than 444°C (800°F) (see fig. 25). Theformed-fin structure cycle life is degraded because of two factors. First, theultimate tensile strength and ductility, important factors in the cycle lifeequation, are degraded by about 15 percent to account for brazing adjacent tothe critical section (TPS hot face sheet). Second, there is a greater propor-tion of creep damage in the overall cycle with the formed fin. The relationshipbetween creep and fatigue damage fractions is especially significant in thestrainrange partitioning analysis.
Fatigue life for a Nickel-200 machined-fin structure was estimated byassuming that the strain versus AT behavior was similar to that predicted forHastelloy X. The strain was adjusted, however, to reflect the difference inYoung's modulus. The estimated life is shown in fig. 27 for the temperaturerange where the estimate is most valid.
Performance summary.--Final selections and estimated performance for theTPS are presented in Table 8 and fig. 28. The following criteria were used:(I) overall coolant pressure drop including any shunt circuits must be less thani.38 MPa (200 psi); (2) Hastelloy X material except where in-depth AT exceeds222°C (400°F); (3) Nickel-200 material in high heat flux areas where HastelloyX is not suitable; and (4) maximum TPS face sheet temperature less than 1144 K(2060°R) for Hastelloy X and I060 K (1910°R) for Nickel-200.
The cyclic life given for the channel structures is in accordance withthe recommended design curves in fig. 27. For the Nickel-200 pin-fin structure,as used in the strut, the cycle life was computed as follows: (I) a two-dimen-sional finite element model of the contoured cross-section was constructed andthe strain concentration factor determined; (2) the creep strain was computedassuming that the stress would be fully relaxed during the cycle; and (3) thecycle life was determined using the strainrange partitioning technique.
Fo_ external surface cooling, TPS passage geometry is not critical.Formed or machined fins, spaced circular tubes, or D-tubes are all feasible.A machined channel is recommended because of greater structural rigidity,low temperature gradients, and compatibility with the other TPS geometries.
Leading Edges
Two basic cooling options shown in fig. 29 were considered: impingement,direct and indirect; and parallel-flow concepts. Impingement can be directedparallel to the hot gas flow or normal to the sweep line. With indirectimpingement, the flow turns nearly 180 deg (less the wedge angle), thus pro-ducing a near-impingement cooling effect.
In parallel-flow cooling, the coolant flows in a channel just behind andparallel to the leading edge, as shown in fig. 29. The inherent disadvantage ofthis basic concept is that the coolant heat transfer coefficient is lower thanwith impingement, pressure drop is higher, and the flow routing is not compa-tible with the longitudinal flow routing of the engine panels.
54
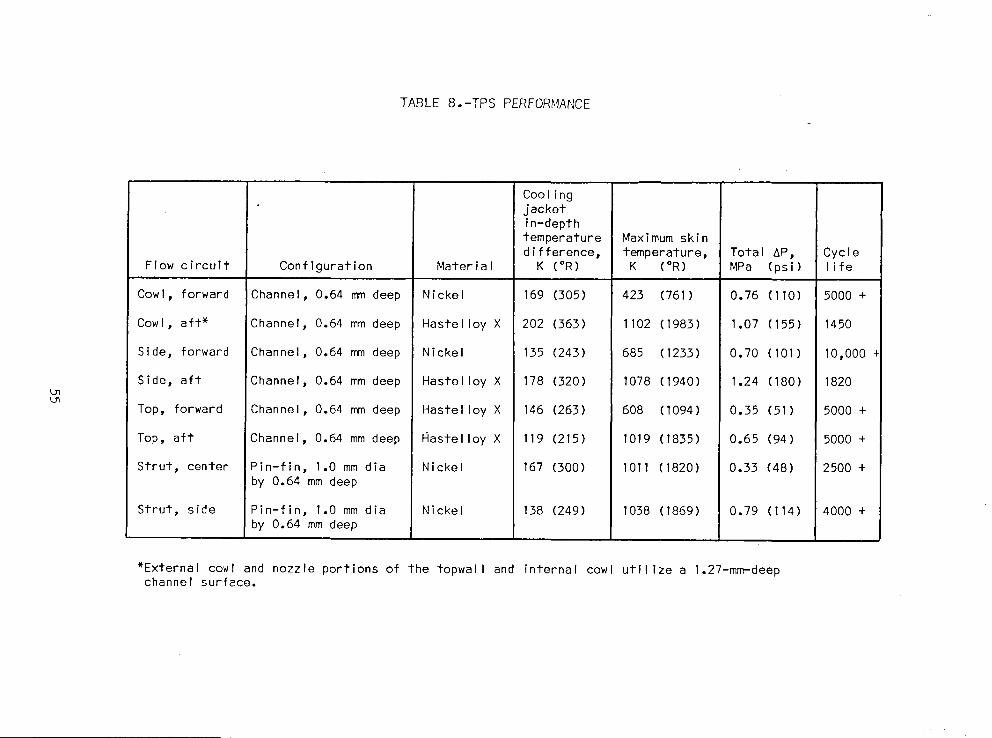
TABLE 8.-TPS PERFORMANCE
Coolingjacketin-depthtemperature Maximum skin
difference, temperature, Total AP, CycleFlow circuit Configuration Material K (°R) K (°R) MPa (psi) life
Cowl, forward Channel, 0.64 mm deep Nickel 169 (305) 423 (761) 0.76 (110) 5000 +
Cowl, aft* Channel, 0.64 mm deep Hastelloy X 202 (363) 1102 (1983) 1.07 (155) 1450
Side, forward Channel, 0.64 mm deep Nickel 135 (243) 685 (1233) 0.70 (101) 10,000
Side, aft Channel, 0.64 mm deep Hastelloy X 178 (320) 1078 (1940) 1.24 (180) 1820
Top, forward Channel, 0.64 mm deep Hastelloy X 146 (263) 608 (1094) 0.35 (51) 5000 +
Top, aft Channel, 0.64 mm deep Hastelloy X 119 (215) 1019 (1835) 0.65 (94) 5000 +
Strut, center Pin-fin, 1.0 mm dia Nickel 167 (300) 1011 (1820) 0.33 (48) 2500 +by 0.64 mm deep
Strut, side Pin-fin, 1.0 mm dia Nickel 138 (249) 1038 (1869) 0.79 (114) 4000 +by 0.64 mm deep
*External cowl and nozzle portions of the topwall and internal cowl utilize a 1.27-mm-deepchannel surface.
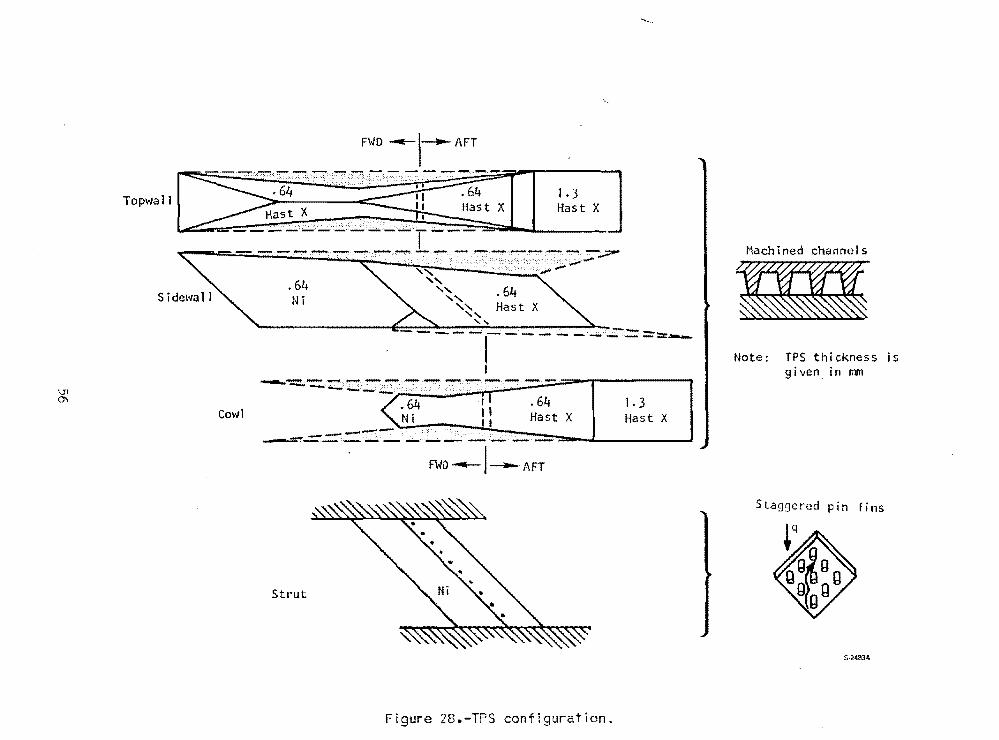
Machined channels
Note: TPS thickness isgiven, in mm
1.3Hast X
.64Hast X
.64Ni
Cowl
FWD -I---AFTTopwalll::?ii~-~~~:~ ~~;tX ]
- -.' -·:~:··~:~:~·:~\~·7>~>~T~':/:·:·~7::··7~}CT[:··<07:~·t:<:::;<..:fS:)~·~....., .........• ,',"',,"""'-
.....,.....~, .64
" Hast X""
FWD ----1--- AFT
Strut
Staggered pin fins
Figure 28.-TPS configuraTion.

a. Direct impingement
b. Indirect impingement
Coolant
A
c. Parallel flow_-_5881-A
Figure 29.-Leading edge cooling options.
57
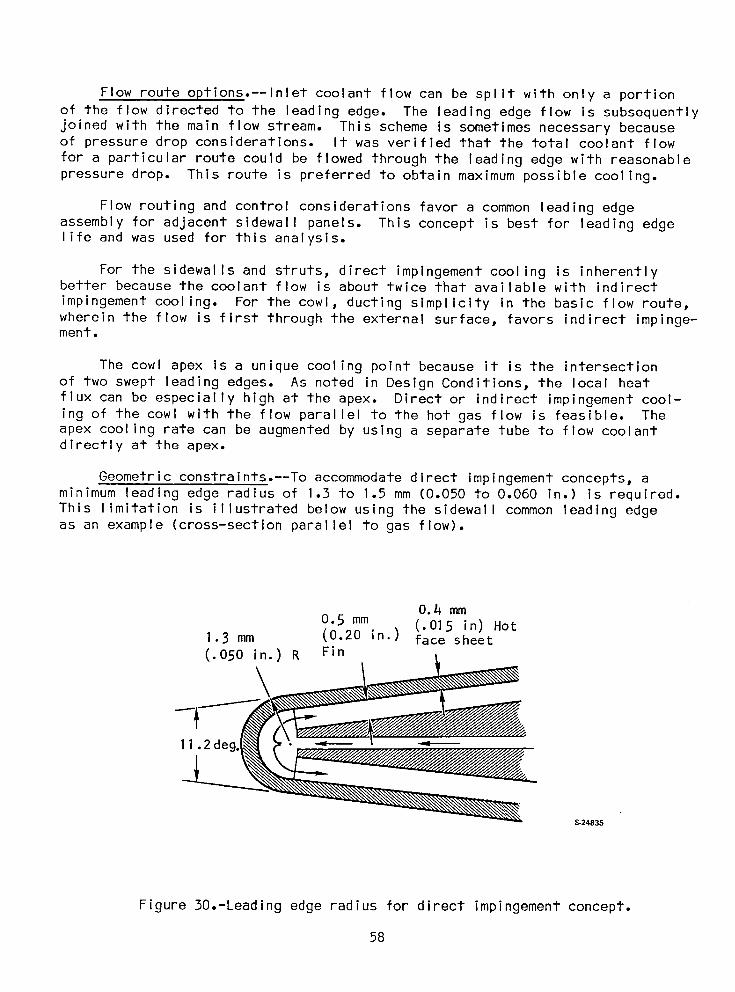
Flow route options.--Inlet coolant flow can be split with only a portion
of the flow directed to the leading edge. The leading edge flow is subsequentlyjoined with the main flow stream. This scheme is sometimes necessary becauseof pressure drop considerations. It was verified that the total coolant flow
for a particular route could be flowed through the leading edge with reasonablepressure drop. This route is preferred to obtain maximum possible cooling.
Flow routing and control considerations favor a common leading edgeassembly for adjacent sidewall panels. This concept is best for leading edgelife and was used for this analysis.
For the sidewalls and struts, direct impingement cooling is inherentlybetter because the coolant flow is about twice that available with indirect
impingement cooling. For the cowl, ducting simplicity in the basic flow route,wherein the flow is first through the external surface, favors indirect impinge-ment.
The cowl apex is a unique cooling point because it is the intersectionof two swept leading edges. As noted in Design Conditions, the local heatflux can be especially high at the apex. Direct or indirect impingement cool-ing of the cowl with the flow parallel to the hot gas flow is feasible. Theapex cooling rate can be augmented by using a separate tube to flow coolantdirectly at the apex.
Geometric constraints.--To accommodate direct impingement concepts, aminimum leading edge radius of 1.3 to 1.5 mm (0.050 to 0.060 in.) is required.This limitation is illustrated below using the sidewall common leading edgeas an example (cross-section parallel to gas flow).
0.4 mm
0.5 mm (.015 in) Hot1.3 mm (0.20 in.) face sheet(.050 in.) R Fin
\11.2deg.
S-24835
Figure30.-Leadingedge radius for direct impingementconcept.
58
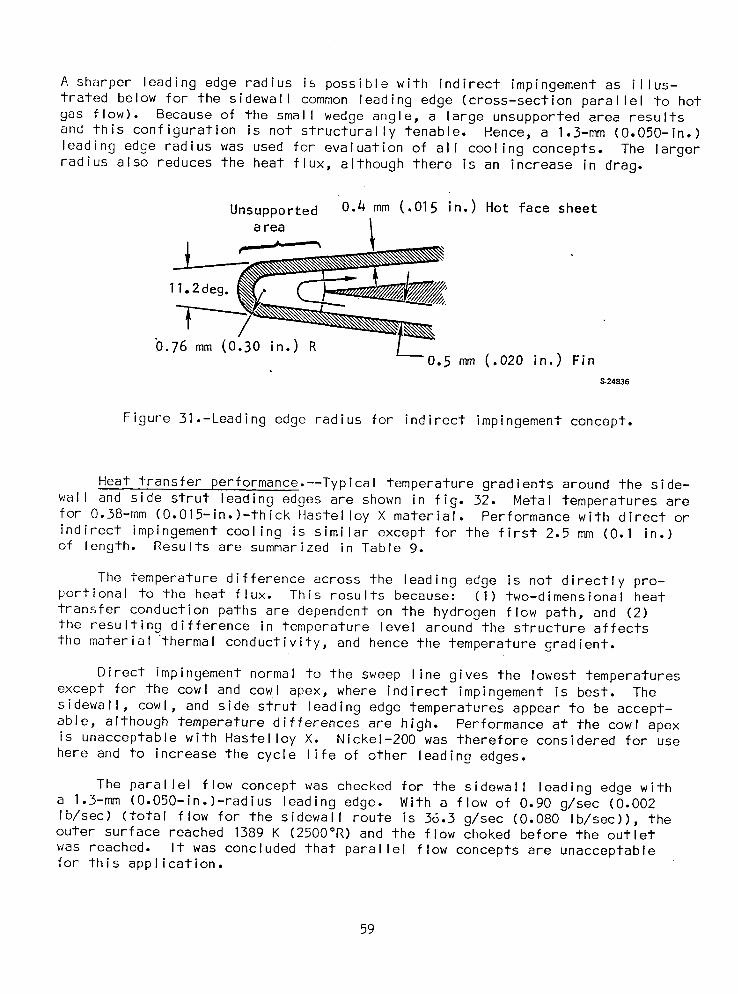
A sharper leading edge radius is possible with indirect impingement as illus-trated below for the sidewall common leading edge (cross-section parallel to hotgas flow). Because of the small wedge angle, a large unsupported area resultsand this configuration is not structurally tenable. Hence, a 1.3-mm (O.050-in.)leading edge radius was used for evaluation of all cooling concepts. The largerradius also reduces the heat flux, although there is an increase in drag.
Unsupported 0.4 mm (.015 in.) Hot face sheet
area 1
11.2deg.
0.76 mm (0.30 in.) R0.5 mm (.020 in.) Fin
S-24836
Figure 31.-Leading edge radius for indirect impingement concept.
Heat transfer performance.--Typical temperature gradients around the side-wall and side strut leading edges are shown in fig. 32. Metal temperatures arefor 0.38-mm (O.015-in.)-thick Hastelloy X material. Performance with direct orindirect impingement cooling is similar except for the first 2.5 mm (0.1 in.)of length. Results are summarized in Table 9.
The temperature difference across the leading edge is not directly pro-portional to the heat flux. This results because: (I) two-dimensional heat
transfer conduction paths are dependent on the hydrogen flow path, and (2)the resulting difference in temperature level around the structure affects
the material thermal conductivity, and hence the temperature gradient.
Direct impingement normal to the sweep line gives the lowest temperaturesexcept for the cowl and cowl apex, where indirect impingement is best. Thesidewall, cowl, and side strut leading edge temperatures appear to be accept-able, although temperature differences are high. Performance at the cowl apexis unacceptable with Hastelloy X. Nickel-200 was therefore considered for usehere and to increase the cycle life of other leading edges.
The parallel flow concept was checked for the sidewall leading edge witha 1.3-mm (O.050-in.)-radius leading edge. With a flow of 0.90 g/sec (0.002Ib/sec) (total flow for the sidewall route is 36.3 g/sec (0.080 Ib/sec)), theouter surface reached 1389 K (2500°R) and the flow choked before the outlet
was reached. It was concluded that parallel flow concepts are unacceptablefor this application.
59
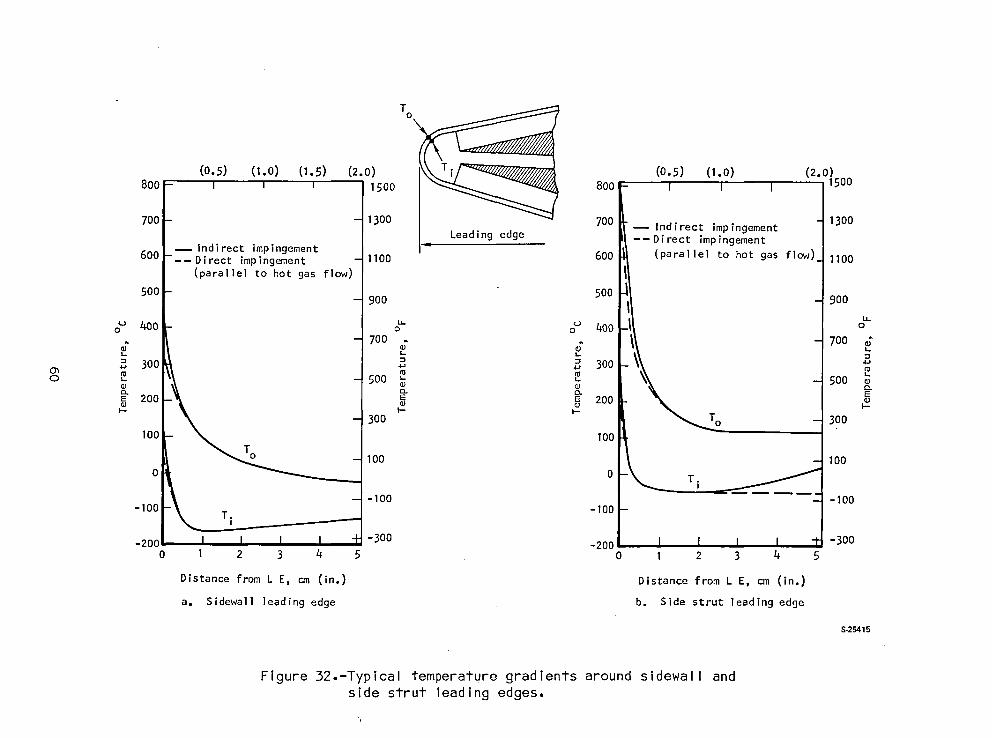
TO
(0.5) (I.0) (1.5) (2.0) (0.5) (1.0) (2.0)800 -- I I I 1500 800 - I I I 1500
700 - 1300 700 _ Indirect impingement 1300Leading edge --Direct impingement
_Indirect impingement600 -__Direct impingement - 1100 600 (parallel to hot gas flow) 1100
(parallel to hot gas flow)
5OO - 5OO- 900 900
400 o 400 oo o
. 700 _ . - 7003300 _ 300
o _ 500 _ _ - 500E 200 E _ 200
300 TO - 300
100 100
TO O0 100
O 0 T.i
-100 -100-100 -100
-200 -3OO -20G -3000 I 2 3 4 0 I 2 3 4 5
Distance from L E= cm (in.) Distance from L E, om (in.)
a. Sidewall leading edge b. Side strut leading edge
S-2_15
Figure 32.-Typicai temperature gradients around sidewall andside strut leading edges.
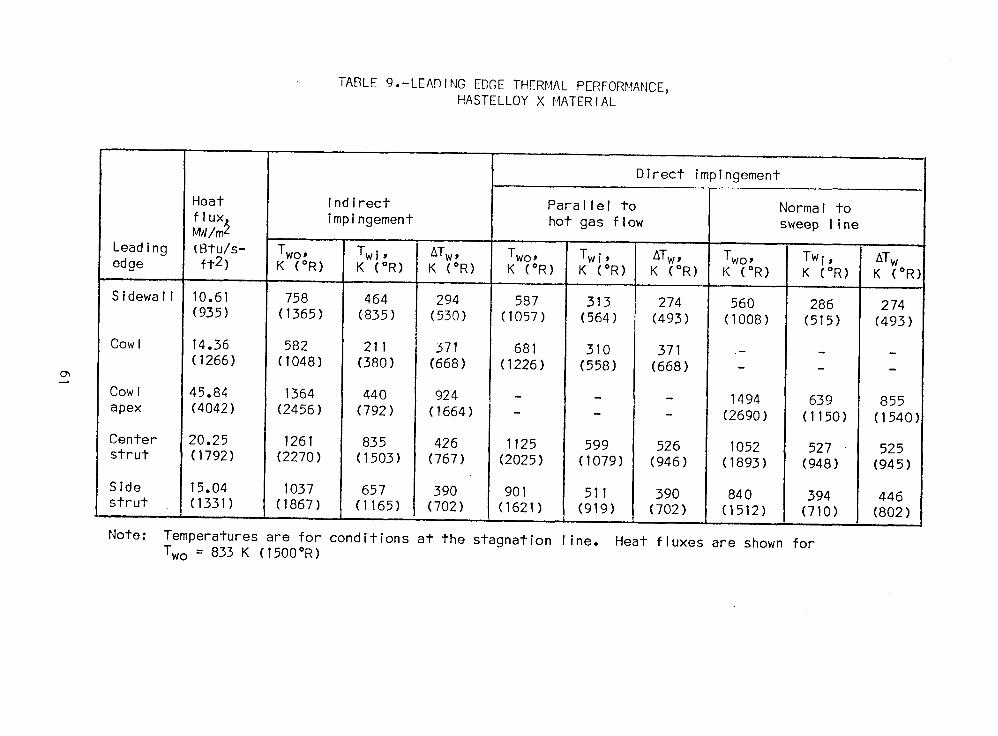
TABLE 9.-LEADING EDGETHERMALPERFORMANCE,HASTELLOY X MATERIAL
Direct impingement
Heat Indirect Parallel to Normal to
flux. impingement hot gas flow sweep lineMWlm_
Leading (Btu/s- TWO_R Twi ' ATw, Two, Twi, ATw, Two, Twi, ATwedge ft2) K ( ) K (°R) K (°R) K (°R) K (°R) K (°R) K (°R) K (°R) K (°R)
Sidewall 10.61 758 464 294 587 313 274 560 286 274(935) (1365) (835) (530) (1057) (564) (493) (1008) (515) (493)
Cowl 14.36 582 211 I 371 681 310 371 ....(1266) (1048) (380) (668) (1226) (558) (668) - - -
Cowl 45.84 1364 440 924 - - - 1494 639 855apex (4042) (2456) (792) (1664) - - - (2690) (1150) (1540)
Center 20.25 1261 835 426 1125 599 526 1052 527 525strut (1792) (2270) (1503) (767) (2025) (1079) (946) (1893) (948) (945)
Side 15.04 1037 657 390 901 511 390 840 394 446strut (1331) (1867) (1165) (702) (1621) (919) (702) (1512) (710) (802)
Note: Temperaturesare for conditions at the stagnation line. Heat fluxes are shown forTwo = 833 K (1500°R)

Cycle life analysis.--The estimated leading edge cycle life is shown inTable 10. The analysis used the strainrange partitioning technique with asafety factor of 4. Typical material properties and a strain concentrationfactor of 2.0 were specified. For Hastelloy X material, the temperature datapresented in Table 9 were used directly. For Nickel-200 material, the data inTable 9 were ratioed by the thermal conductivities to estimate the operatingtemperatures.
TABLE IO.-LEADING EDGE CYCLE LIFE
Cycle life with candidate materialsImpingement
Location cooling mode Hastelloy X Nickel-200
Sidewall Direct 2800 10,000Indirect 500 -
Cowl Indirect 1000 16,000
Cowl apex Indirect 40 1400
Side strut Direct 400 2600Indirect 300 -
Center strut Direct
Indirect 150 1700
These results lead to the following conclusions:
(a) Cycle life requirements can be met by using Nickel-200 material forall leading edges, including the cowl apex.
(b) Direct impingement cooling should be used for the sidewalls andstruts because it produces superior cycle life.
Although Nickel-200 is the recommended material, its creep strength is low.The selection of Nickel-200 is based on the use of general LCF correlations(refs. 14, 19, and 20). To confirm this selection, both detailed mathematical
modeling and experimental evaluation of the long-term behavior of the leadingedge structure with combined creep and fatigue loading are required. Consid-eration must also be given to the degradation of material properties in thebraze-affected zone. Relevant basic experimental data on Nickel-200 is beingobtained under NASA Contract NASI-14180.
Cycle life at the cowl apex is marginal. A supplementary cooling circuitcan be utilized to impinge a jet of cold hydrogen directly on the apex. Anotheroption is to blunt the apex in the cowl plane, as shown in fig. 33.
62
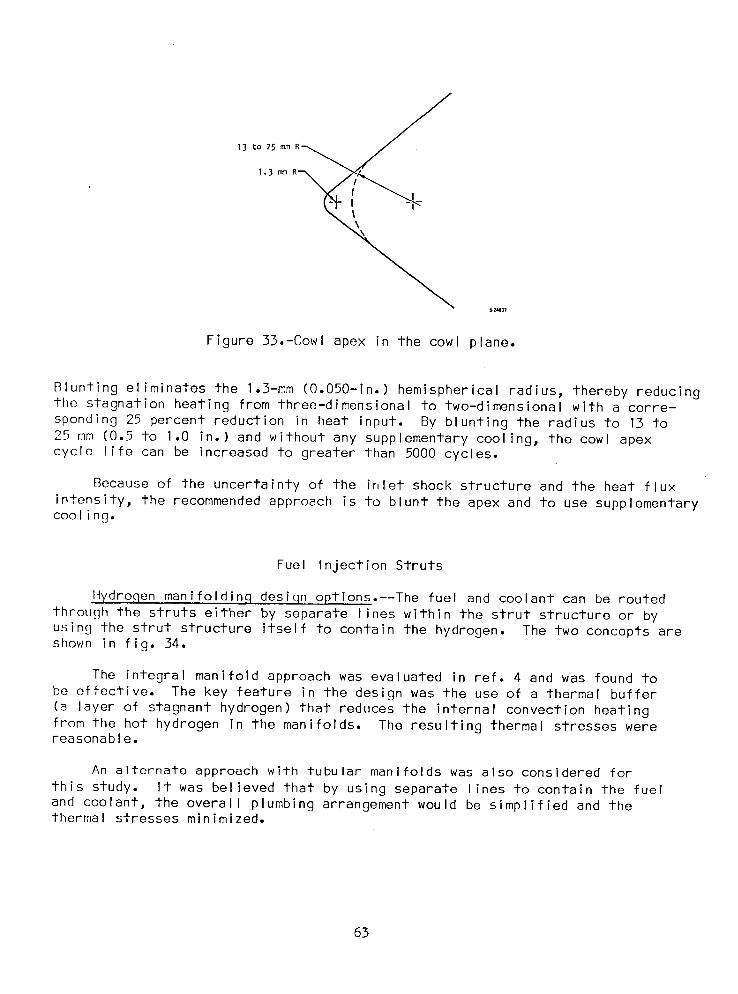
13 to 25 ram
1.3mm
\\
Figure 33.-CowI apex in the cowl plane.
Rlunting eliminates the 1.3-mm (O.050-in.) hemispherical radius, thereby reducingthe stagnation heating from three-dimensional to two-dimensional with a corre-
sponding 25 percent reduction in heat input. By blunting the radius to 13 to25 mm (0.5 to 1.0 in.) and without any supplementary cooling, the cowl apexcycle life can be increased to greater than 5000 cycles.
Because of the uncertainty of the inlet shock structure and the heat flux
intensity, the recommended approach is to blunt the apex and to use supplementarycooling.
Fuel Injection Struts
Hydrogen manifoldin_ design options.--The fuel and coolant can be routed
through the struts either by separate Dines within the strut structure or byusing the strut structure itself to contain the hydrogen. The two concepts areshown in fig. 34.
The integral manifold approach was evaluated in ref. 4 and was found tobe effective. The key feature in the design was the use of a thermal buffer(a layer of stagnant hydrogen) that reduces the internal convection heatingfrom the hot hydrogen in the manifolds. The resulting thermal stresses werereasonable.
An alternate approach with tubular manifolds was also considered for
this study. It was believed that by using separate lines to contain the fueland coolant, the overall plumbing arrangement would be simplified and thethermal stresses minimized.
63
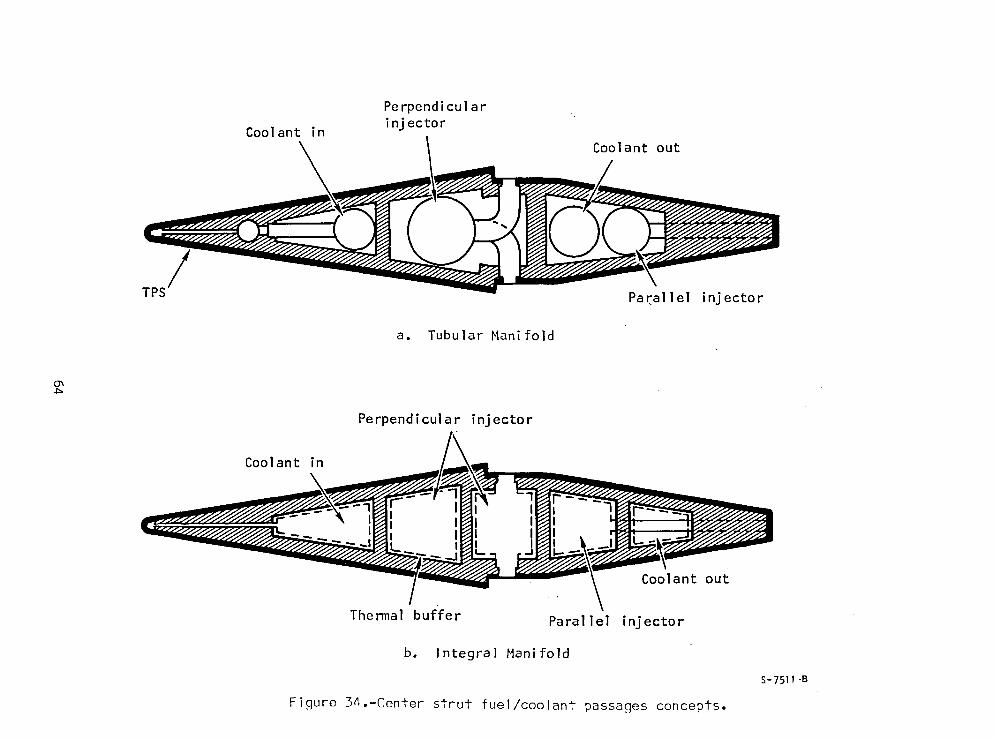
Perpendicular
Coolant in injectorCoolant out
TPS Parallel injector
a. Tubular Manifold
Perpendicular injector
Coolant in
Coolant out
Thermal buffer Parallel injector
b. Integral Mani fold
S-7511 -B
Figure 34.-Center strut fuel/coolant passages concepts.
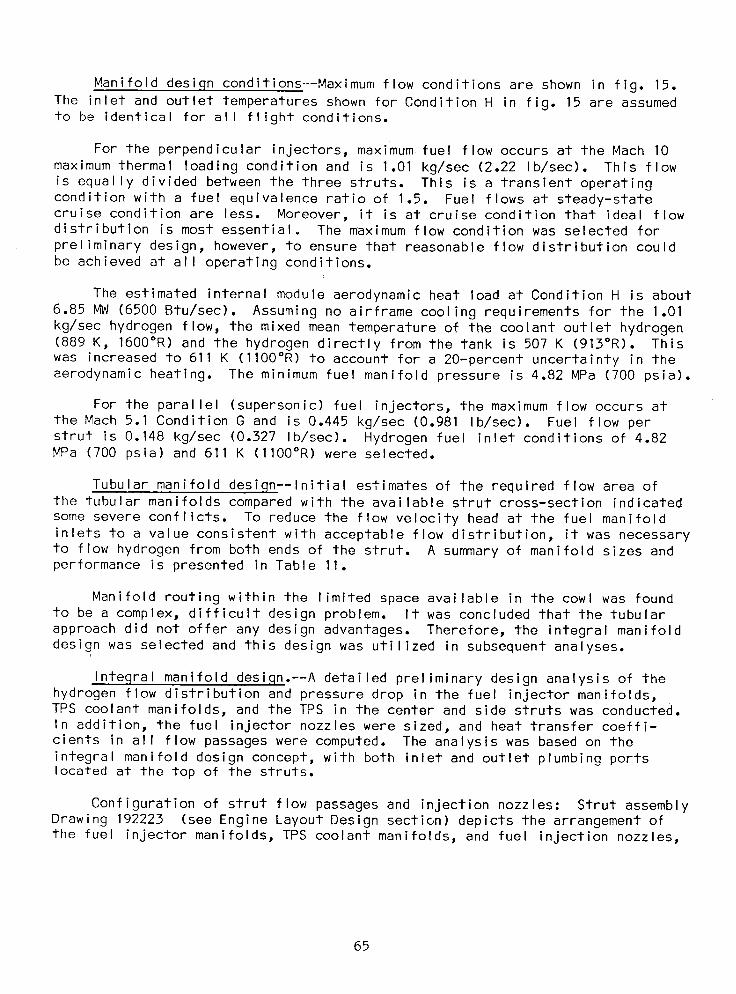
Manifold design conditions--Maximum flow conditions are shown in fig. 15.The inlet and outlet temperatures shown for Condition H in fig. 15 are assumedto be identical for all flight conditions.
For the perpendicular injectors, maximum fuel flow occurs at the Mach I0
maximum thermal loading condition and is 1.01 kg/sec (2.22 Ib/sec). This flowis equally divided between the three struts. This is a transient operatingcondition with a fuel equivalence ratio of 1.5. Fuel flows at steady-statecruise condition are less. Moreover, it is at cruise condition that ideal flowdistribution is most essential_ The maximum flow condition was selected for
preliminary design, however, to ensure that reasonable flow distribution couldbe achieved at all operating conditions.
The estimated internal module aerodynamic heat load at Condition H is about6.85 MW (6500 Btu/sec). Assuming no airframe cooling requirements for the 1.01kg/sec hydrogen flow, the mixed mean temperature of the coolant outlet hydrogen(889 K, 1600°R) and the hydrogen directly from the tank is 507 K (913°R). Thiswas increased to 611K (1100°R) to account for a 20-percent uncertainty in theaerodynamic heating. The minimum fuel manifold pressure is 4.82 MPa (700 psia).
For the parallel (supersonic) fuel injectors, the maximum flow occurs atthe Mach 5.1 Condition G and is 0.445 kg/sec (0.981 Ib/sec). Fuel flow perstrut is 0.148 kg/sec (0.327 Ib/sec). Hydrogen fuel inlet conditions of 4.82MPa (700 psia) and 611K (IIO0°R) were selected.
Tubular manifold design--Initial estimates of the required flow area ofthe tubular manifolds compared with the available strut cross-section indicatedsome severe conflicts. To reduce the flow velocity head at the fuel manifoldinlets to a value consistent with acceptable flow distribution, it was necessaryto flow hydrogen from both ends of the strut. A summary of manifold sizes andperformance is presented in Table 11.
Manifold routing within the limited space available in the cowl was foundto be a complex, difficult design problem. It was concluded that the tubularapproach did not offer any design advantages. Therefore, the integral manifo ddesign was selected and this design was utilized in subsequent analyses.
Inteqral manifold design.--A detailed preliminary design analysis of thehydrogen flow distribution and pressure drop in the fuel injector manifolds,TPS coolant manifolds, and the TPS in the center and side struts was conducted.In addition, the fuel injector nozzles were sized, and heat transfer coeffi-cients in all flow passages were computed. The analysis was based on theintegral manifold design concept, with both inlet and outlet plumbing portslocated at the top of the struts.
Configuration of strut flow passages and injection nozzles: Strut assemblyDrawing 192223 (see Engine Layout Design section) depicts the arrangement ofthe fuel injector manifolds, TPS coolant manifolds, and fuel injection nozzles,
65

TABLE 11.-TUBULAR MANIFOLD PERFORMANCE
Coolant Perpendicular Parallel Coolant
inIet injectors injectors out let
Tube pattern at 0 0 0 0 0topwall surface .
Tube pattern at 0 0 0 0cowl surface
Tube sizes I at 8 mm OD 4 at 13 mm 2 at 13 mm 2 at 13 mm
by 0.25 mm OD by 0.5 mm OD by 0.5 mm OD by 0.5 mmwall wall wall wall
/I at 5/16 OD /4 at I/2 /2 at I/2 /2 at I/20D|by0.010in. Iby 0.020in |by 0.020 in |by 0.020in\wall \wall \wall \wall
Flow area, sq cm 0.434 4.29 2.14 2.14(sq in.) (0.0672) (0.6648) (0.3324) (0.3324)
H2 flow rate per 0.0454 0.336 0.148 0.0454strut, kg/sec (0.I00) (0.740) (0.327) (0.I00)(Ib/sec)
H2 total pressure, 6.89 4.83 4.83 5.17MPa (psia) (1000) (700) (700) (750)
H2 total 56 611 611 889temperature, K (100) (1100) (II00) (1600)('R)
Mach number 0.061 0.220 0.196 0.067
Velocity head, 17.9 158 126 15.9kPa (psi) (2.6) (22.9) (18.3) (2.3)
A_648
Flow area through strut top = 4.88 sq cm (0.757 sq in.)
66
together with cross-sectional details of the strut manifolds, leading edges,and trailing edges. The drawing shows two strut manifold configurations. Bothof them are feasible, but only the preferred configuration (strut configurationNo. 2) was analyzed in detail. Configuration No. 2 was selected because thefeed tubes to the parallel injection nozzles in both struts and the aft per-pendicular injection nozzles in the side struts are not only shorter, but passthrough only one rib.
Additional cross-sectional details of the strut manifolds are shown in
figs. 35 and 36. Fig. 35 shows the side strut and an expanded view of the TPSwall structure; fig. 36 shows the center strut. A sketch of the TPS coolantflow path in the pin-fin TPS passages is presented in fig. 37. Flow dividersare used to minimize flow skewing in the pin-fin surface as a result of mani-fold pressure gradients.
Design conditions: The design condition total fi0w for the perpendicularfuel injection manifolds and nozzles is 2.220 Ib/sec, which corresponds toCondition H (2-g maneuver at Mach 10 and combustion equivalence ratio of 1.5).The design condition total flow for the parallel feel injection manifolds andnozzles is 0.981 Ib/sec, which corresponds to Condition G (2-g maneuver atMach 5.1 and a combustion equivalence ratio of 1.0).
A summary of the design point conditions upon which the flow distributionanalysis of the fuel injection manifolds and nozzles was based is presented inTable 12.
The thermal protection system (TPS) design conditions are summarized inTable 13. The flow distribution in the TPS manifolds was based on a flow of0.10 Ib/sec to each strut at inlet conditions of 6.894 MPa (1000 psia) and55.6 K (100°R). The strut heat flux distribution, which was needed to determinethe temperature distribution in the TPS, was obtained from fig. 38.
Method of Analysis: The analysis was performed with an AiResearch computerprogram that was developed using the experimental and analytical work of a num-ber of investigators as a basis (see refs. 21 through 27). The program analyzescompressible or incompressible flow with friction for both one-dimensional andtwo-dimensional mathematical modes.
67
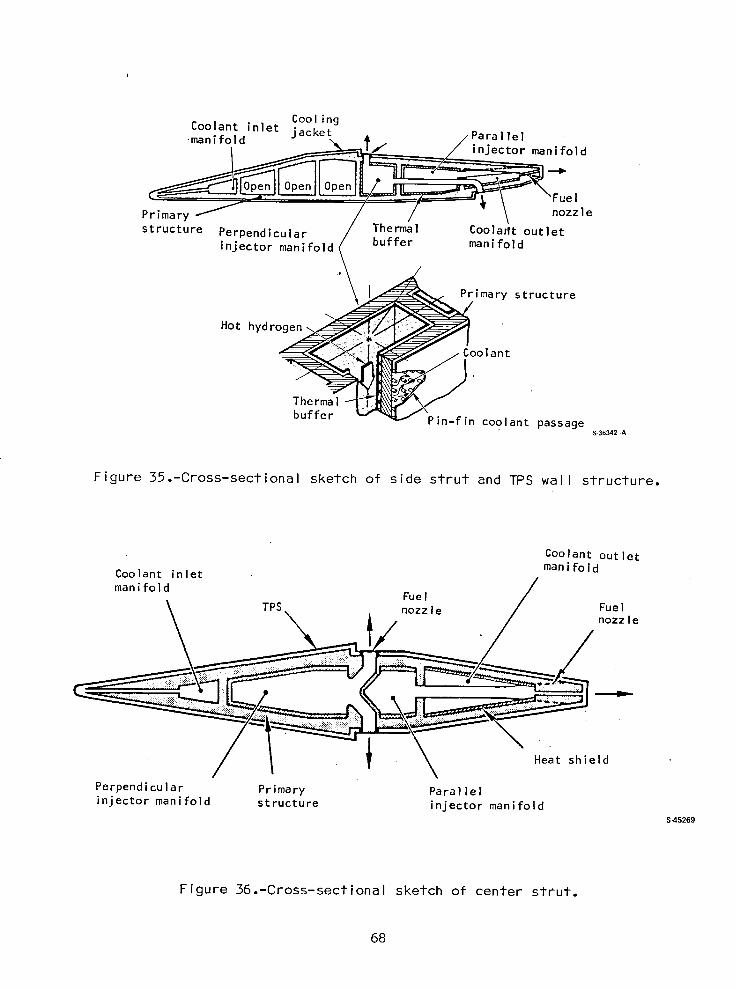
Cool ingCoolant inlet jacket
'mani f°_Id _ni fol d
l rOoen IIPrimary Jr / Th / " \ nozzlestructure Perpendicular / errna ! Coolaftt outlet
injector manifold<' buffer man,fold
"_\L__ Primary structure
Hot hydrogen ___m
_ _oolant
.
buffer l_L/\Pin-fin coolant passageS-36342 -A
Figure 35.-Cross-sectional sketch of side strut and TPS wall structure.
Coolant outlet
Coolant inlet manifoldmanifold
FuelTPS nozzle Fuel
nozzle
Heat shield
Perpendicular Primary Parallel
injector manifold structure injector manifoldS_5269
Figure 36.-Cross-sectional sketch of center strut.
68
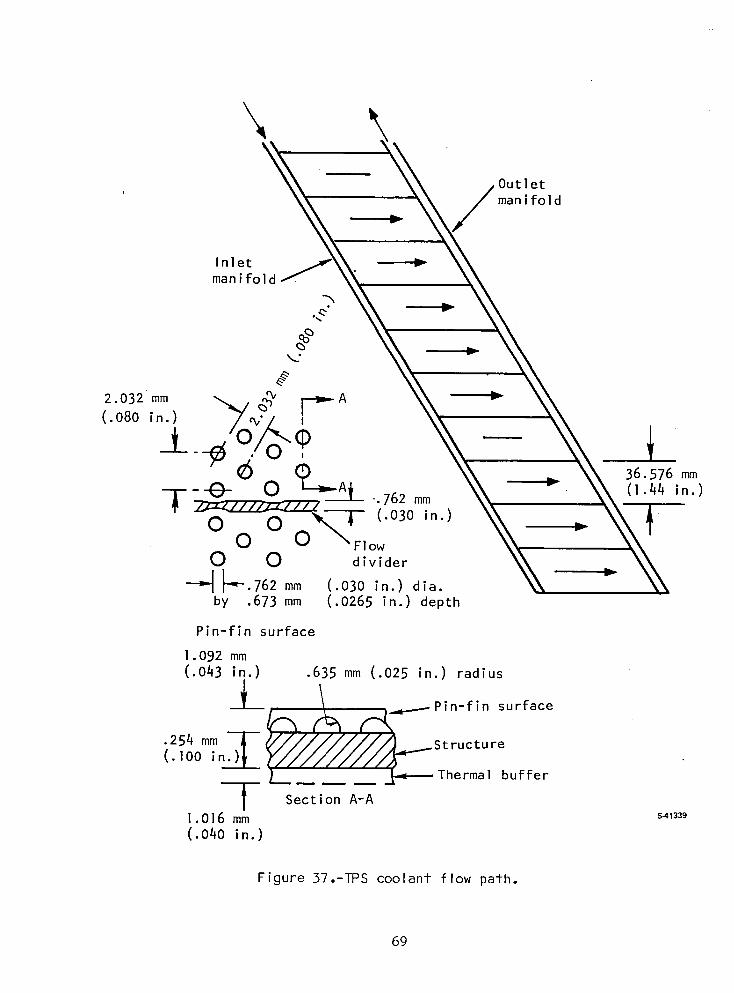
\Outletman i fol d
Inlet _--man ifold
.e"
2.032 mm "-_/ ._ _,-A(.080 in.) 7_?_, I
Cp__..A _T--_-O O --__O "i.030 in.) .._
_:Z:____ 762 mm (1.44 in.)
. - 0 - 0 \FlowO O divider
I I-'I_ 762mm (.030in)dia
by .673 mm (.0265 in.) depth
Pin-fin surface
l.092 mm(.043 in.) .635 mm (.025 in.) radius
-L_ {L f_._Pin-fin surface• 254 mm T V//////;///) _ St ruc t u re
(.iooi..)_LY//////////_f_.___ _ _ ._Thermal buffer
I Section A-AI.016 mm s41339(.040 in.)
Figure 37.-TPS coolant flow path.
69
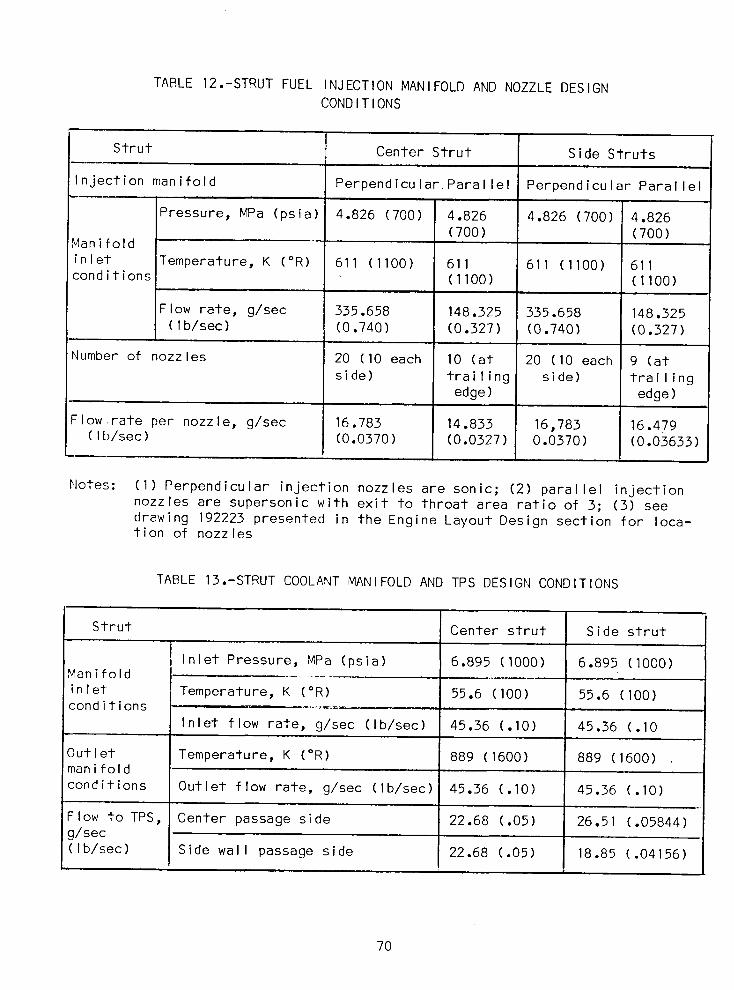
TABLE 12.-STRUT FUEL INJECTION MANIFOLD AND NOZZLE DESIGNCONDITIONS
Strut Center Strut Side Strutsi i i.
Injection manifold PerpendicularIParallel Perpendicular Parallel
Pressure, MPa (psia) 4.826 (700) 4.826 4.826 (700) 4.826(7OO) (7OO)
Manifold I
inlet Temperature, K (°R) 611 (1100) 611 611 (1100) 611conditions (1100) (1100)
Flow rate, g/sec 335.658 148.325 335.658 148.325(Ib/sec) (0.740) (0.327) (0.740) (0.327)
Number of nozzles 20 (10 each 10 (at 20 (10 each 9 (at
side) trailing side) trailingedge) edge)
Flow rate per nozzle, g/sec 16.783 14.833 16,783 16.479(Ib/sec) (0.0370) (0.0327) 0.0370) (0.03633)
Hotes: (I) Perpendicular injection nozzles are sonic; (2) parallel injectionnozzles are supersonic with exit to throat area ratio of 3; (3) seedrawing 192223 presented in the Engine Layout Design section for loca-tion of nozzles
TABLE 13.-STRUT COOLANT MANIFOLD AND TPS DESIGN CONDITIONS
Strut Center strut Side strut
i Inlet Pressure, MPa (psia) 6.895 (1000) 6.895 (I000)Manifold ......................
inlet Temperature, K (°R) 55.6 (100) 55.6 (I00)conditions ..............
Inlet flow rate, g/sec (Ib/sec) 45.36 (.10) 45.36 (.10
Outlet Temperature, K (°R) 889 (1600) 889 (1600)manifold
conditions Outlet flow rate, g/sec (Ib/sec) 45.36 (.10) 45.36 (.10)i
Flow to TPS, Center passage side 22.68 (.05) 26.51 (.05844)g/sec
(Ib/sec) Side wall passage side 22.68 (.05) 18.85 (.04156)
7O
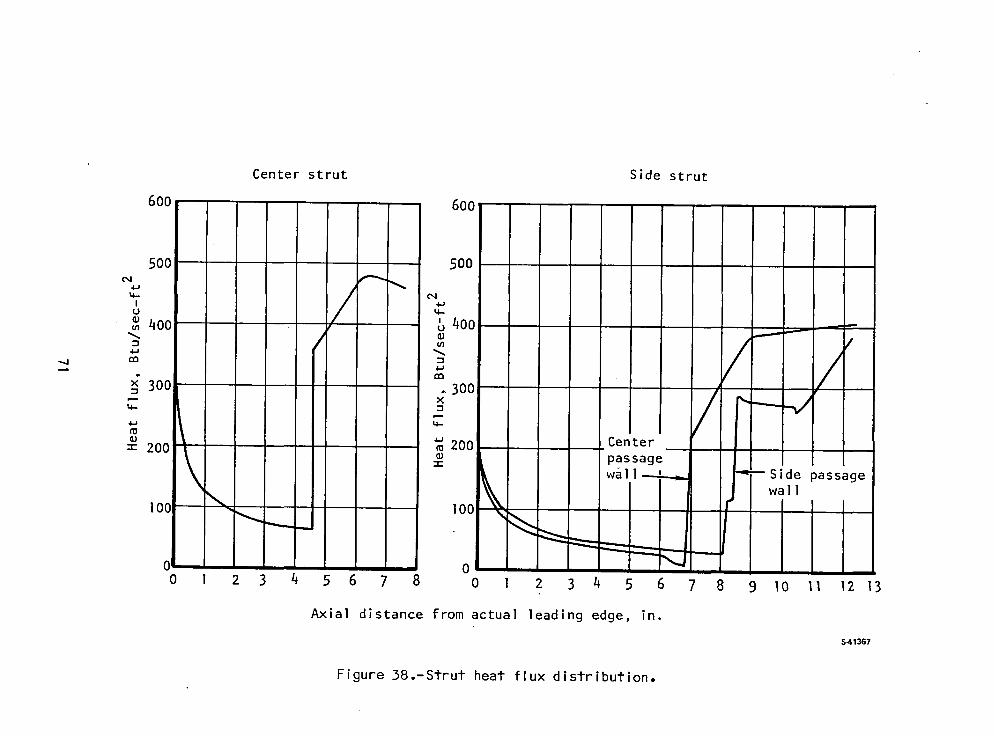
Center strut Side strut
600 600
500 500e4
u _4-
400 _)400 --
- ( ° /--/.__ 4-1
300 .300
- × / _'-Je _ 200 Center
:=:200 _ "'_ k passage
w& l_ _Side passage
wallI00 _ I00
0 0
0 I 2 3 4 5 6 7 8 0 I 2 3 4 5 6 7 8 9 I0 II 12 13
Axial distance from actual leading edge, in.
S41367
Figure 38.-Strut heat flux distribution.
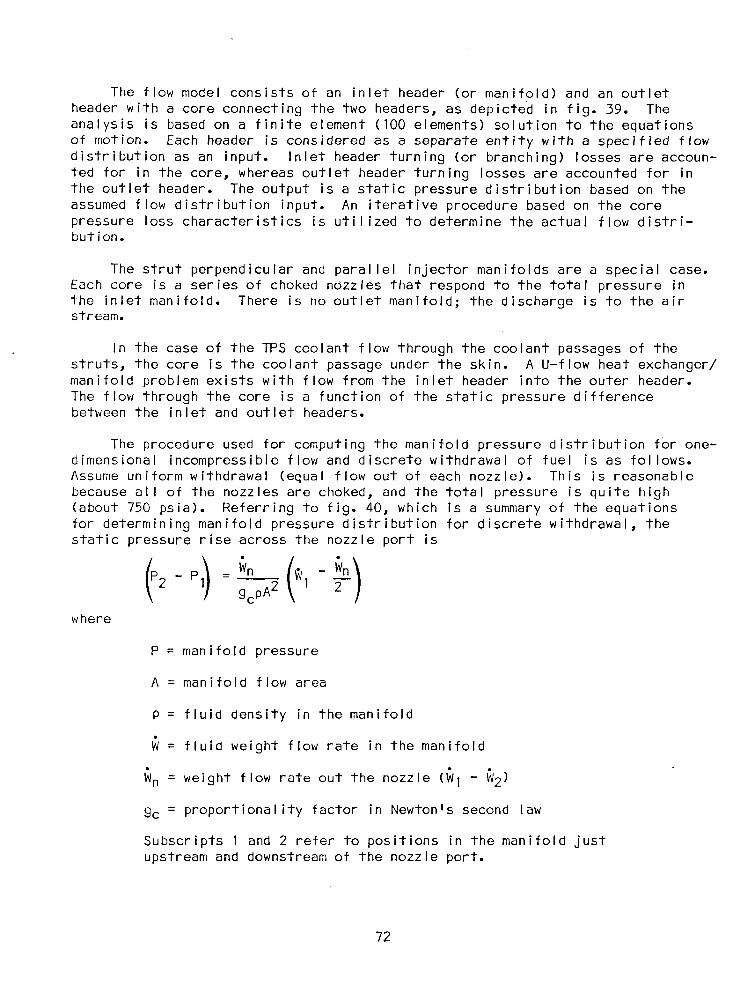
The flow model consists of an inlet header (or manifold) and an outlet
header with a core connecting the two headers, as depicted in fig. 39. Theanalysis is based on a finite element (100 elements) solution to the equationsof motion. Each header is considered as a separate entity with a specified flowdistribution as an input. Inlet header turning (or branching) losses are accoun-ted for in the core, whereas outlet header turning losses are accounted for inthe outlet header. The output is a static pressure distribution based on theassumed flow distribution input. An iterative procedure based on the corepressure loss characteristics is utilized to determine the actual flow distri-bution.
The strut perpendicular and parallel injector manifolds are a special case.Each core is a series of choked nozzles that respond to the total pressure inthe inlet manifold. There is no outlet manifold; the discharge is to the airstream.
In the case of the TPS coolant flow through the coolant passages of thestruts, the core is the coolant passage under the skin. A U-flow heat exchanger/manifold problem exists with flow from the inlet header into the outer header.The flow through the core is a function of the static pressure differencebetween the inlet and outlet headers.
The procedure used for computing the manifold pressure distribution for one-dimensional incompressible flow and discrete withdrawal of fuel is as follows.Assume uniform withdrawal (equal flow out of each nozzle). This is reasonablebecause all of the nozzles are choked, and the total pressure is quite high(about 750 psia). Referring to fig. 40, which is a summary of the equationsfor determining manifold pressure distribution for discrete withdrawal, thestatic pressure rise across the nozzle port is
where
P = manifold pressure
A = manifold flow area
P = fluid density in the manifold
= fluid weight flow rate in the manifold
Wn = weight flow rate out the nozzle (WI - W2)
gc = proportionality factor in Newton's second law
Subscripts I and 2 refer to positions in the manifold justupstream and downstream of the nozzle port.
72
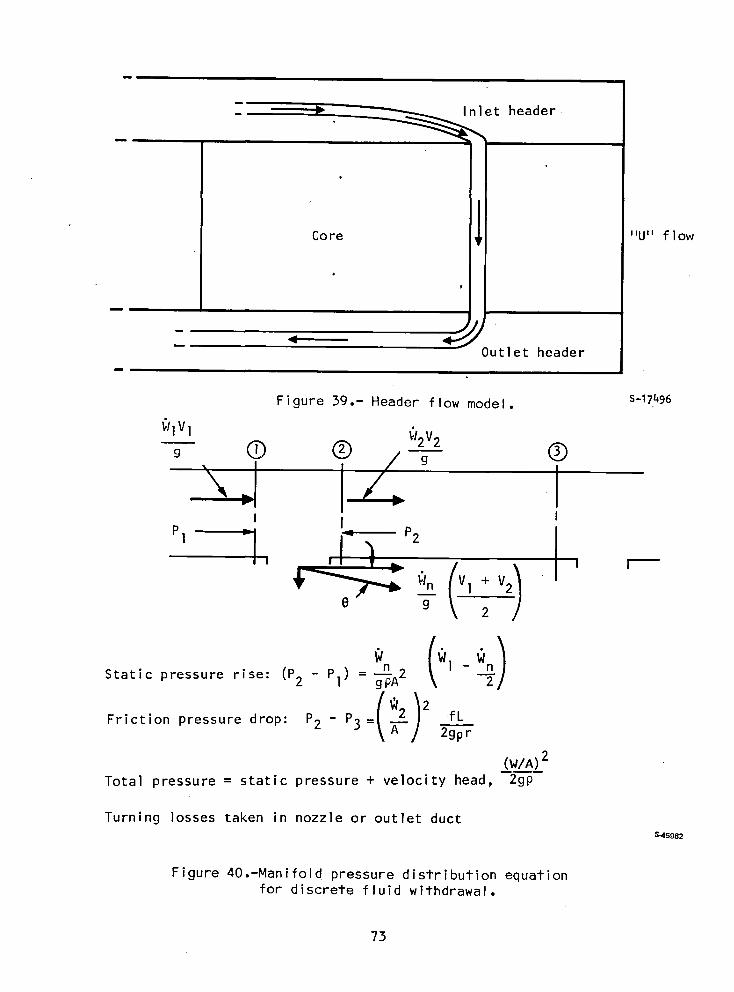
_nlet header
Core 'lUll f10w
v
R
Outlet header
Figure 39.- Header flow model, s-17496
_1!V1 _I2V2
IP1 =- I_- P2
I J
Vl+Vm
2
Wn 1-Static pressure rise: (P2 - P1) = "g-PA2
Friction pressure drop: P2 - P3 = _-" 2gp----r"
(W/A) 2Total pressure = static pressure +ve]ocity head, 2gp
Turning losses taken in nozzle or outlet duct$45982
Figure 40.-Manifold pressure distribution equationfor discrete fluid withdrawal.
73
The frictional ,pressure drop in the manifold between adjacent nozzle ports is
P2 - P3 = f L2 gcPr
where
f = Fanning friction factor for smooth rectangular duct
L = manifold length between ports
r = manifold hydraulic radius (A/p) where p is the wetted perimeter
The manifold total pressure (which is used to size the nozzles) is the static
pressure plus the velocity head, (W/A)2/2gcp.
Starting at the inlet of the manifold, and taking Wn = Wtotal/n°" nozzles(same flow to each nozzle), the pressure distribution was determined in a step-wise, port by port manner from the above equations, together with f versusReynolds number for the hydrogen flow in the manifold.
The computer program analysis for continuous withdrawl does essentiallythe same analysis except that I00 finite elements were used. Also, the mani-fold flow friction shear forces were included in the momentum equation.
All fuel injection nozzles were sized at their local inlet total pressuresaccording to the sonic nozzle equation.
W gc 2 Y-I7_*= CPnV--R-To Y + l
where
W = flow rate per nozzle
D2A* = nozzle choked (M = I) area =T n
Dn = nozzle diameter
Pn = nozzle total pressure
Y = ratio of specific heats
R = gas content
To = total temperature
gc = proportionality factor in Newton's second law
c = constant
74
The nozzle total pressure was computed from
Pn = Pm - APe - APb - APf
where
Pm = manifold total pressure
APe = nozzle entrance turning loss = 1.5 times the velocity head inthe manifold
&Pb = bend losses inside the nozzle or feed tube = bend loss coefficient times the velocity head in the nozzle or tube (in thecenter strut perpendicular injector nozzles, the mitre bendloss coefficient was taken as 0.35, and in the side strut aftperpendicular injector feed tube, the loss coefficient wasunity.)
_Pf = friction pressure loss in the feed tubes, where applicable.Adiabatic, constant area (Fanno line process) flow wasassumed.
The nozzle discharge coefficient was taken as 1.0 for the sonic nozzle whereall losses are accounted for in the calculation of the nozzle total pressure.In the case of the supersonic nozzles the additional friction in the converg-ing section was accounted for by using a discharge coefficient of 0.95.
In the fuel injection and TPS coolant manifolds, the heat transfer coeffi-cients were computed from:
h =Pr 2/3
where C = constant
h = heat transfer coefficient
G = mass velocity, W/A
Cp = fluid specific heat at constant pressure
Pr = fluid Prandtl number
j = Colburn heat transfer modulus
For the Reynolds number involved (all were in the turbulent flow regime), theColburn modulus for flow in the manifold is approximately
.0205j= Re 0.20
75
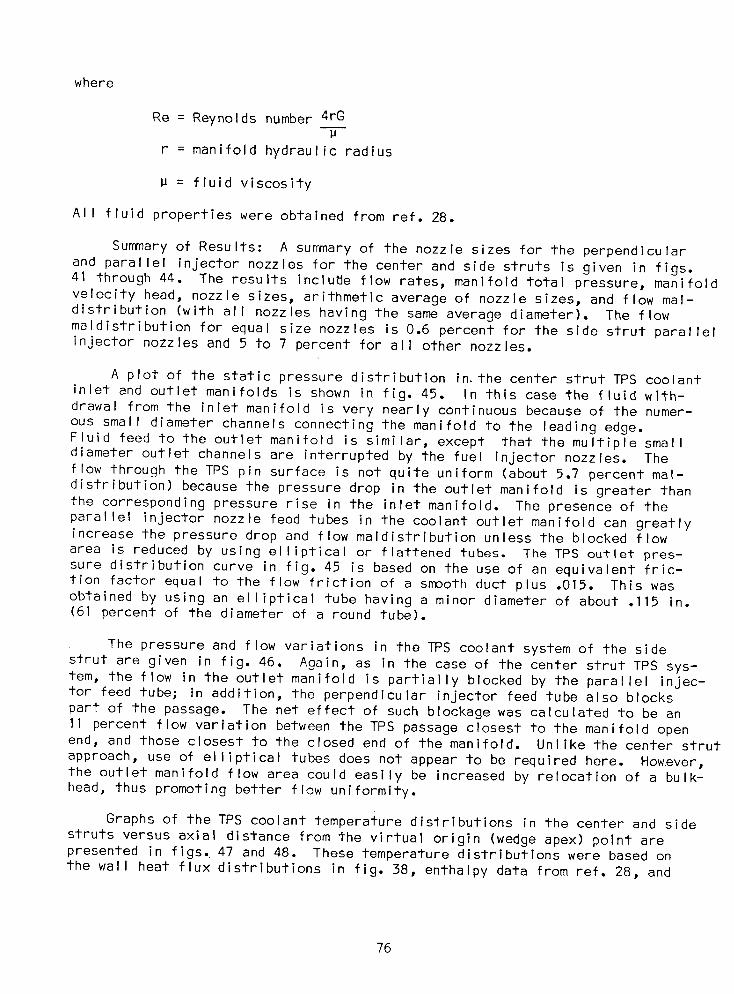
where
Re = Reynolds number 4rG
r = manifold hydraulic radius
= fluid viscosity
All fluid properties were obtained from ref. 28.
Summary of Results: A suF_ary of the nozzle sizes for the perpendicularand parallel injector nozzles for the center and side struts is given in figs.41 through 44. The results include flow rates, manifold total pressure, manifoldvelocity head, nozzle sizes, arithmetic average of nozzle sizes, and flow mal-distribution (with all nozzles having the same average diameter). The flowmaldistribution for equal size nozzles is 0.6 percent for the side strut parallelinjector nozzles and 5 to 7 percent for all other nozzles.
A plot of the static pressure distribution in the center strut TPS coolantinlet and outlet manifolds is shown in fig. 45. In this case the fluid with-drawal from the inlet manifold is very nearly continuous because of the numer-ous small diameter channels connecting the manifold to the leading edge.Fluid feed to the outlet manifold is similar, except that the multiple smalldiameter outlet channels are interrupted by the fuel injector nozzles. Theflow through the TPS pin surface is not quite uniform (about 5.7 percent mal-distribution) because the pressure drop in the outlet manifold is greater thanthe corresponding pressure rise in the inlet manifold. The presence of the
parallel injector nozzle feed tubes in the coolant outlet manifold can greatlyincrease the pressure drop and flow maldistribution unless the blocked flowarea is reduced by using elliptical or flattened tubes. The TPS outlet pres-sure distribution curve in fig. 45 is based on the use of an equivalent fric-tion factor equal to the flow friction of a smooth duct plus .015. This wasobtained by using an elliptical tube having a minor diameter of about .115 in.(61 percent of the diameter of a round tube).
The pressure and flow variations in the TPS coolant system of the side
strut are given in fig. 46. Again, as in the case of the center strut TPS sys-tem, the flow in the outlet manifold is partially blocked by the parallel injec-tor feed tube; in addition, the perpendicular injector feed tube also blockspart of the passage. The net effect of such blockage was calculated to be an11 percent flow variation between the TPS passage closest to the manifold openend, and those closest to the closed end of the manifold. Unlike the center strut
approach, use of elliptical tubes does not appear to be required here. However,the outlet manifold flow area could easily be increased by relocation of a bulk-head, thus promoting better flow uniformity.
Graphs of the TPS coolant temperature distributions in the center and sidestruts versus axial distance from the virtual origin (wedge apex) point arepresented in figs. 47 and 48. These temperature distributions were based on
the wall heat flux distributions in fig. 38, enthalpy data from ref. 28, and
76
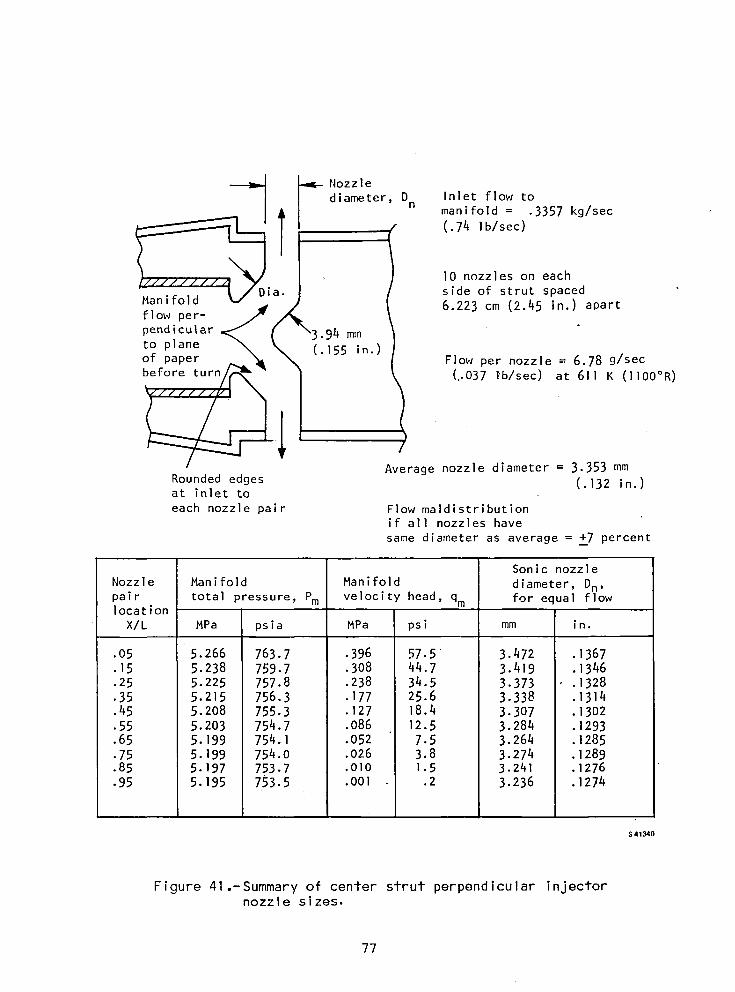
_ Nozzle
diameter, D Inlet flow to
n manifold = .3357 kg/secf (.74 Ib/sec)
lO nozzles on each" . side of strut spaced
Manifold 6.223 cm (2.45 in,) apartflow per- Jpendicular _"
to plane _ (.1553"94mmin.)
of paper /_I_ Flow per nozzle = 6.78 g/sec(..037 l'b/sec) at 611K (llO0°R)before turn/_ _
Average nozzle diameter = 3.353 mm
Rounded edges (.132 in.)at inlet to
each nozzle pair Flow maldistributionif all nozzles have
same diameter as average = +7 percent
Sonic nozzle
Nozzle Manifold Manifold diameter, Dn,
pair total pressure, Pm velocity head, qm for equal flowlocation
X/L MPa psia MPa psi mm in,
•05 5.266 763.7 .396 57.5 3.472 .1367
•15 5.238 759.7 .308 44.7 3.419 .1346.25 5.225 757.8 .238 34.5 3.373 .1328
•35 5.215 756.3 .177 25.6 3.338 .1314
•45 5.208 755.3 .127 18.4 3.307 .1302
•55 5.203 754.7 .086 12.5 3.284 .1293•65 5.199 754.1 .052 7.5 3.264 .1285
•75 5.199 754.0 .026 3.8 3.274 .1289•85 5.197 753.7 .OlO 1.5 3.241 .1276
•95 5.195 753.5 .OOl .2 3.236 .1274
I
$41_0
Figure 41.-Summary of center strut perpendicular injectornozzle sizes.
77
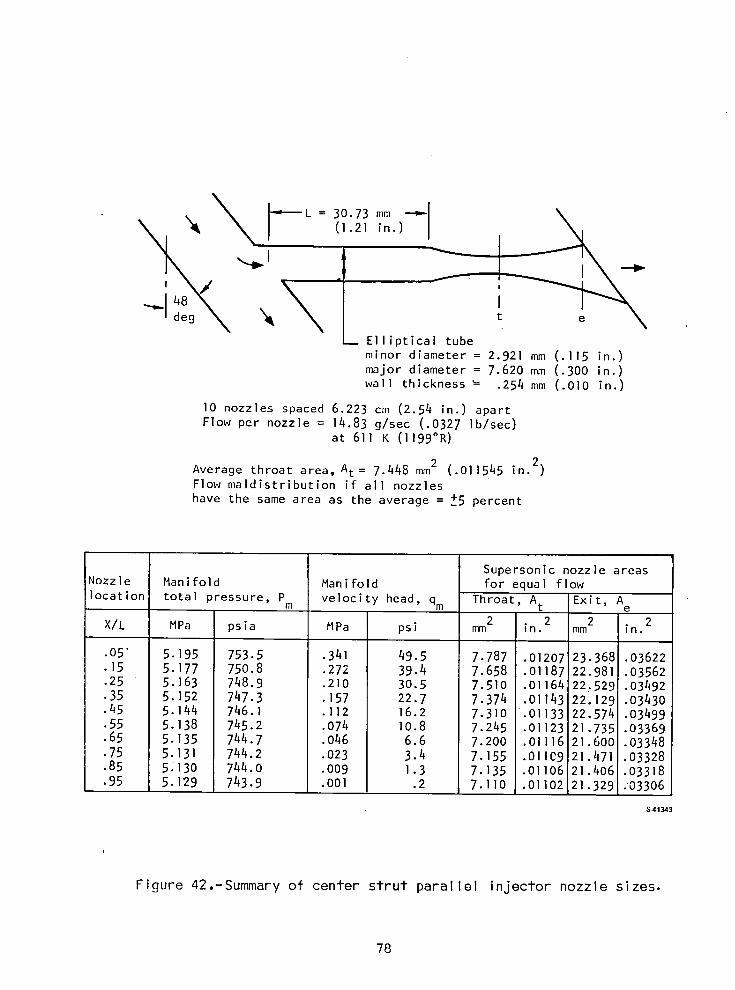
\rL3073mm--J(1.21 in.)
I
---I X eElliptical tubeminor diameter = 2.921 mm (.115 in.)major diameter = 7.620 mm (.300 in.)wall thickness _ .254 mm (.010 in.)
10 nozzles spaced 6.223 cm (2.54 in.) apartFlow per nozzle = 14.83 g/sec (.0327 lb/sec)
at 611K (1199°R)
Average throat area, At = 7.448 mm2 (.011545 in.2)Flow maldistribution if all nozzles
have the same area as the average = _5 percent
Supersonic nozzle areas
Nozzle Manifold Manifold for equal flow
location total pressure P velocity head qm Throat, At Exit, A' m ' e2 2 2 2
X/L MPa psia MPa psi mm in. mm in.
.05" 5.195 753.5 .341 49.5 7.787 .01207 23.368 .03622•15 5.177 750.8 .272 39.4 7.658 .01187 22.981 .03562
.25 5.163 748.9 .210 30.5 7.510 .01164 22..529 .03492
•35 5.152 747.3 .157 22.7 7.374 .01143 22.129 .03430•45 5.144 746.1 .ll2 16.2 7.310 .01133 22.574 .03499•55 5.138 745.2 .074 I0.8 7.245 .01123 21.735 .03369
•65 5.135 744.7 .046 6.6 7.200 .01]16 21.600 .03348
•75 5.131 744.2 .023 3.4 7.155 .01109 21.471 .03328
•85 5.130 744.0 .009 1.3 7.135 .Oil06 21.406 .03318
•95 5.129 743.9 .O01 .2 7.110 .01102 21.329 .'03306
S41_3
Figure 42.-Summary of center strut parallel injector nozzle sizes.
78
Tube number (_) (_)Average nozzle diameter, mm (in.) 3.175 (.125) 3.302 (.130)Flow maldistribution using average diameter _ 6 percent +6 percent
Strut outer surface
/ lO constant-area nozzles-- each spaced 6.223 cm
/ | , _ _(2.45 in.) apart
]6.78g/sec YJ /(.037 lb/sec) [/t
I_/Iper nozzle !I/ 16.78 g/sec _"J/_/ (.037 lb/sec--_(2 } "I \
_ Manifold flow per nozzle_ __v ( \ _
_/]= .3357 kg/sec o \
_//S.( ./4if ]b/i;c) a/611 K (1_ 0/0/ R _ L..---""
Strut outer surface
Sonic nozzle diameter, Dn,Nozzle Manifold total Manifold velocity for equal flowlocation pressure P head, qm
' m OCenter QSidepassage wall passage wall
X/L MPa psia MPa psi mm in. mm in.
.lO "5.203 754.6 .389 56.4 3.277 .1290 3.414 .1344
.20 5.195 753.4 .3ll 45.1 3.24] .1276 3.373 .1328•30 5.190 752.7 .243 35.2 3.208 .1263 3.340 .1315.40 5.188 752.5 .183 26.6 3.178 .1251 3.310 .1303•50 5.189 752.6 .134 19.4 3.155 .1242 3.284 .1293.60 5.192 753.0 .092 13.3 3.134 .1234 3.264 .1285•70 5.195 753.4 .059 8.5 3.117 .1227 3.246 .1278.80 5.199 754.1 .032 4.7 3.104 .1222 3.233 .1273•90 5.204 754.8 .014 2.1 3.094 .1218 3.223 .1269
"l.O 5.208 755.4 .003 .5 3.089 .1216 3.216 .1266
$41338
Figure 43.-Summary of side strut perpendicular injectornozzle sizes.
79
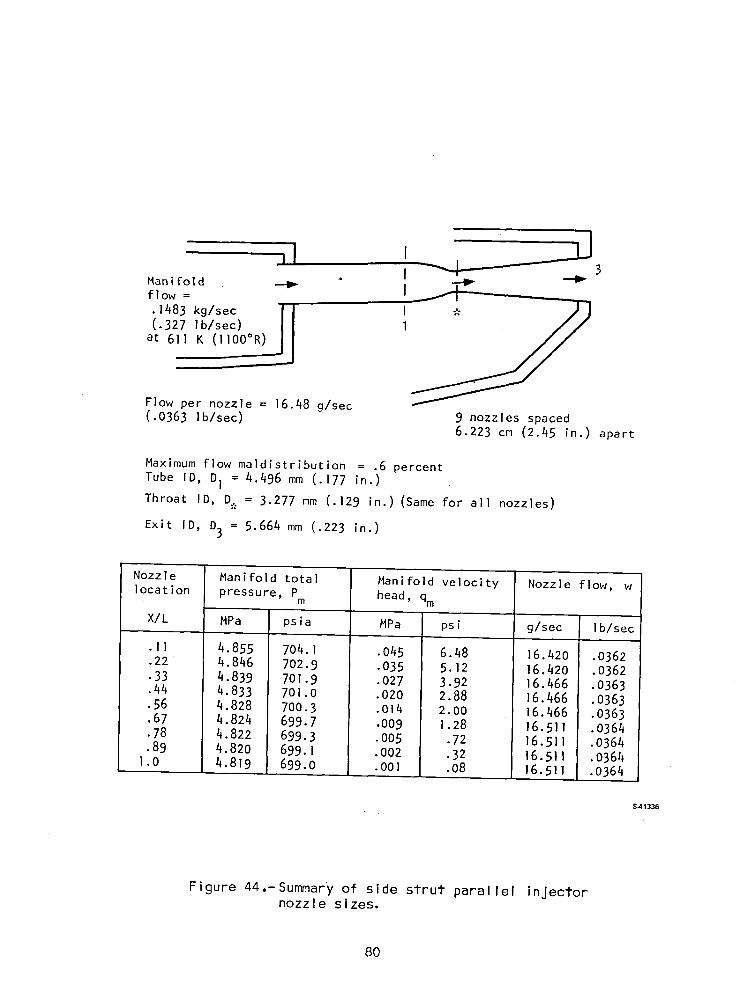
,I i ______dMan ifol d _ _flow = I _I
(.327 Ib/sec) I
at 611 K (llO0°R)
Flow per nozzle = 16.48 g/see(.0363 Ib/sec) 9 nozzles spaced
6.223 cm (2.45 in.) apart
Maximum flow maldistribution = .6 percent
Tube ID, Dl --4.496 mm (.177 in.)
Throat ID, D, = 3.277 mm (.129 in.) (Same for all nozzles)
Exit ID, D3 = 5.664 mm (.223 in.)
Nozzle Manifold total Manifold velocity Nozzle flow, w
location pressure, p head, qmm
X/L MPa psia MPa psi g/see Ib/sec
.ll 4.855 704.1 .045 6.48 16.420 .0362
.22 4.846 702.9 .035 5.12 16.420 .0362
•33 4.839 701.9 .027 3.92 16.466 .0363
.44 4.833 701.0 .020 2.88 16.466 .0363
•56 4.828 700.3 .O14 2.00 16.466 .0363•67 4.824 699.7 .009 1.28 16.511 .0364
•78 4.822 699.3 .005 .72 16.511 .0364
•89 4.820 699.1 .002 .32 16.511 .03641.0 4.819 699.0 .OOl .08 16.511 .0364
S-41336
Figure 44.-Summary of side strut parallel injectornozzle sizes.
8O
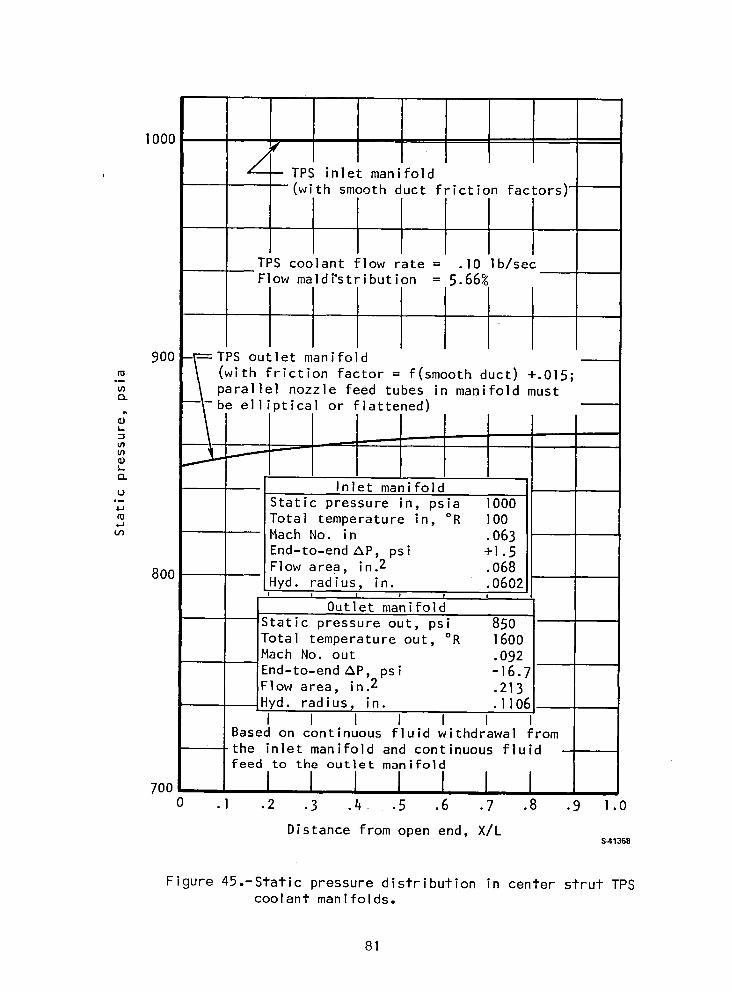
1000
_- TPS inlet man foldt
(with smooth duct friction factors)'
TPS coo ant flow rate = .I0 Ib/secFlow maldi'stribution = 5.66%
I900 -_TPS outlet manifold
.__ \ (with friction factor = f(smooth duct) +.015;_ parallel nozzle feed tubes in manifold must---be elliptical or flattened)
u Inlet manifold•_ Static pressure in, psia lO00
Total temperature in, °R 100Mach No. in .O63End-to-end Ap, psi +1.5
800 Flow area, in.2 .068Hyd. radius, in. .0602
I I I ! I
Outlet manifold
Static pressure out, psi 850Total temperature out, °R 1600Mach No. out .092End-to-end Ap, psi -16.7Flow area, in.2 .213H',d.radius, in. .ll06I I I I I I I
Based on continuous fluid withdrawal from- the inlet manifold and continuous fluid - •
feed to the outlet manifold
700 I I I I I0 .I .2 .3 .4 .5 .6 .7 .8 .9 1.0
Distance from open end, X/L$41368
Figure 45.-Static pressure distribution in center strut TPScoolant manifolds.
81
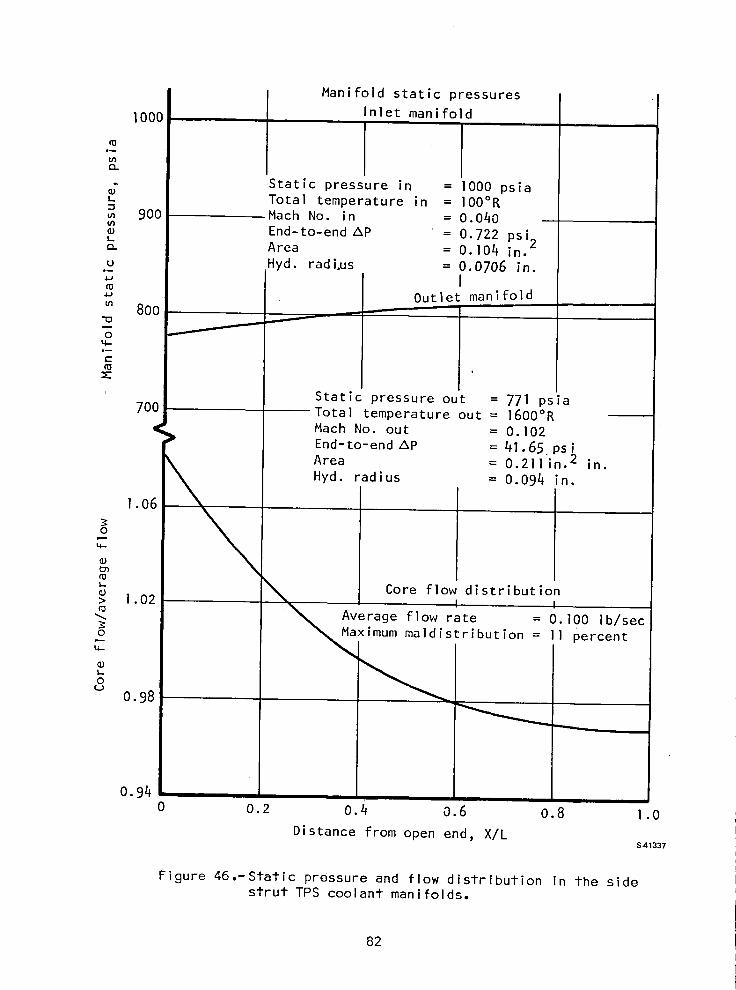
Manifold static pressures
lO00 Inlet manifold
° ru
"o
?
,
I:>_ 1.02 __MAav:_t_O_l Core floI distributioI _bn/_ec
r
o 0.98
0.94
0 0.2 0.4 0.6 0.8 l.0
Distance from open end, X/LS41337
Figure 46.-Static pressure and flow distribution in the sidestrut TPS coolant manifolds.
82
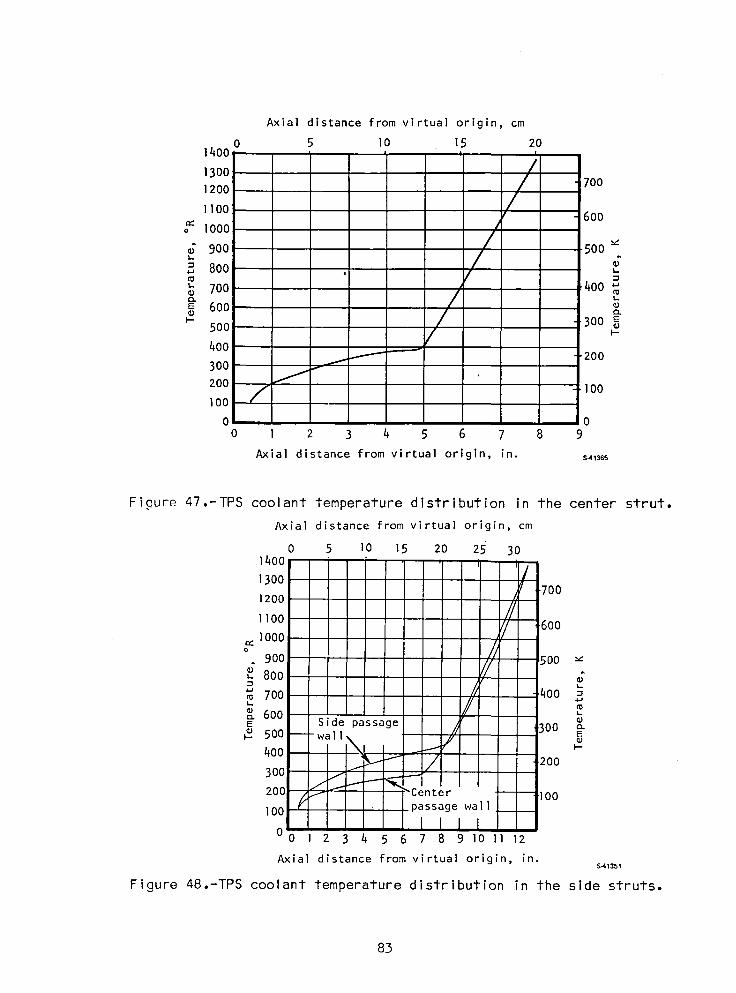
Axial distance from virtual origin, cm
0 5 I0 15 201400
1300 /
120o / tO01100 r ;00
o i000
900 500 _
= 800
700 / 400e 600
500, 300400 -
200300 f_
200 "I"I
I00 / I00
o I o0 1 2 3 4 5 6 7 8 9
Axial distance from virtual origin, in. s41s6s
Figure 47.-TPS coolant temperature distribution in the center strut.
Axial distance from virtual origin, cm
0 5 10 15 20 25 301400
/130o ! i7001200
11oo // I, 1000 _/ _600
o
900 ;00 v.
800 // _"m / I_
700 / ,00 ,.,,_=600 L.
E S de passage /_ 300 cLI- 500 -- -wal I //
400 i / .200300 "I
J ---_.'-1F i I200 _ _'_" -"Center _ 100100 passage wall
I I I I00 l 2 3 4 5 6 7 8 9 IO II 12
Axial distance from virtual origin, in.S41351
Figure 48.-TPS coolant temperature distribution in the side struts.
83
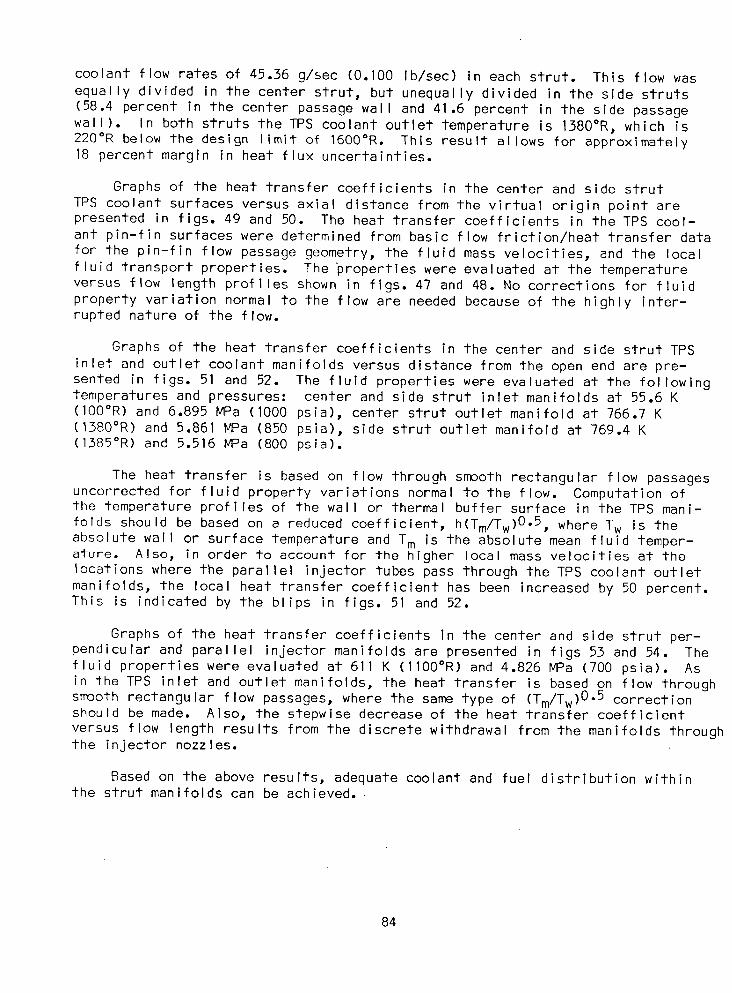
coolant flow rates of 45.36 g/sec (0.100 Ib/sec) in each strut. This flow was
equally divided in the center strut, but unequally divided in the side struts(58.4 percent in the center passage wall and 41.6 percent in the side passagewall). In both struts the TPS coolant outlet temperature is 1380°R, which is220°R below the design limit of 1600°R. This result allows for approximately18 percent margin in heat flux uncertainties.
Graphs of the heat transfer coefficients in the center and side strut
TPS coolant surfaces versus axial distance from the virtual origin point arepresented in figs. 49 and 50. The heat transfer coefficients in the TPS cool-ant pin-fin surfaces were determined from basic flow friction/heat transfer datafor the pin-fin flow passage geometry, the fluid mass velocities, and the localfluid transport properties. The properties were evaluated at the temperatureversus flow length profiles shown in figs. 47 and 48. No corrections for fluidproperty variation normal to the flow are needed because of the highly inter-rupted nature of the flow.
Graphs of the heat transfer coefficients in the center and side strut TPS
inlet and outlet coolant manifolds versus distance from the open end are pre-sented in figs. 51 and 52. The fluid properties were evaluated at the followingtemperatures and pressures: center and side strut inlet manifolds at 55.6 K(100°R) and 6.895 MPa (1000 psia), center strut outlet manifold at 766.7 K(1380°R) and 5.861MPa (850 psia), side strut outlet manifold at 769.4 K(1385°R) and 5.516 MPa (800 psia).
The heat transfer is based on flow through smooth rectangular flow passagesuncorrected for fluid property variations normal to the flow. Computation ofthe temperature profiles of the wall or thermal buffer surface in the TPS mani-
folds should be based on a reduced coefficient, h(Tm/Tw)0-5, where Tw is theabsolute wall or surface temperature and Tm is the absolute mean fluid temper-ature. Also, in order to account for the higher local mass velocities at thelocations where the parallel injector tubes pass through the TPS coolant outletmanifolds, the local heat transfer coefficient has been increased by 50 percent.This is indicated by the blips in figs. 51 and 52.
Graphs of the heat transfer coefficients in the center and side strut per-pendicular and parallel injector manifolds are presented in figs 53 and 54. Thefluid properties were evaluated at 611K (1100°R) and 4.826 MPa (700 psia). Asin the TPS inlet and outlet manifolds, the heat transfer is based on flow throughsmooth rectangular flow passages, where the same type of (Tm/Tw)0-5 correctionshould be made. Also, the stepwise decrease of the heat transfer coefficient
versus flow length results from the discrete withdrawal from the manifolds throughthe injector nozzles.
Based on the above results, adequate coolant and fuel distribution withinthe strut manifolds can be achieved.
84
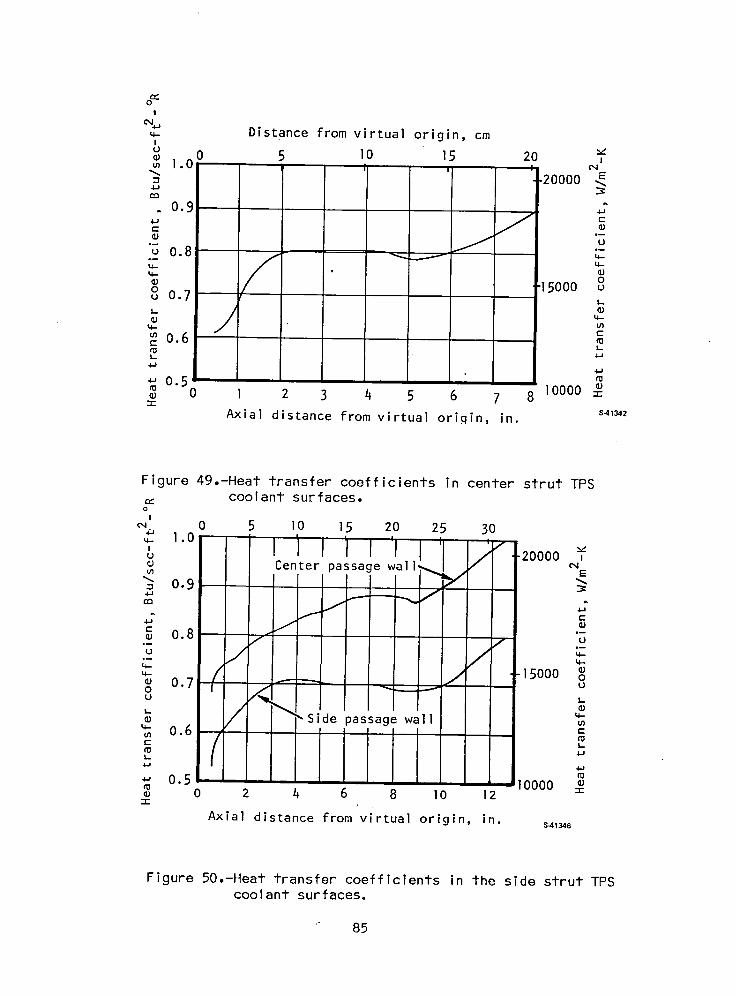
o!
_- Distance from virtual origin, cmIu v
0 5 I0 15 20 ,1.0_ 'i ! cq= 20000 Err_
. 0.9 2
"G0.8 ___- L=
•- /Iq_ q-
_ oo "I5000 uu 0.7 L
t,.. m
_0.6L
&_ 4-J4J
4J
_0.5
0 l 2 3 4 5 6 7 8 lO000 _--r
Axial distance from virtual oriqin, in. s4,342
Figure 49.-Heat transfer coefficients in center strut TPS
coolant surfaces.oI
o_ ,_ 0 5 lO 15 20 25 30,.u
/ "20000 ,Center passage wali,_ E
= 0.9 I Y
._ 0.8 /- / "G._
. / / o°15000 o
Side passage wall _0.6 l =
. 0.5i 00000 2 4 6 8 I0 12 =
Axial distance from virtual origin, in.
Figure 50.-Heat transfer coefficients in the side strut TPScoolant surfaces.
85
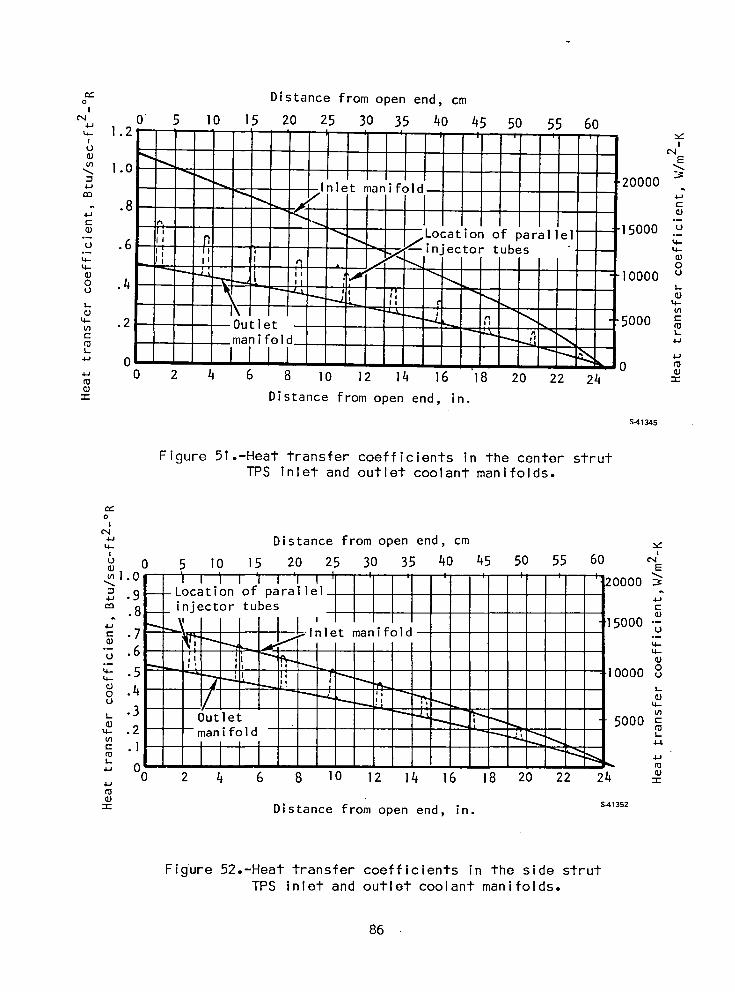
Distance from open end, cmoI
0 5 lO 15 20 25 30 35 40 45 50 55 601.2 , ,
6 '
= _'_ 20000Inlet manifold -
= _" "_' _ 15000 "G
"G_ 6 ili _ !,_i./Loca tinjectoron oftubes_arallel _'-
.-- " i "
""JJ I i, ' _ 10000 u
o .4 _'_ " _ L
_'_ _ _ 5000 =2 Outlet "_ _ mm manifold _....._1 _ "
• 0 m0 2 4 6 8 I0 12 14 16 18 20 22 24
= Distance from open end, in.
$41_5
Figure 51.-Heat transfer coefficients in the center strutTPS inlet and outlet coolant manifolds.
o!
Distance from open end, cm
b 0 5 I0 15 20 25 30 35 40 45 50 55 60 _'_J E• , i i i , i
m l 0 | I 1 I "I I 'I I "20000:3= o Location of parallel i ".--j -- _
_ .8 --- injector tubes '
_ ..__ ' ii5000 "u• 7- Inlet manifold ._
_ _,,_ ,4-tl_
•5 _ --_ !; 0000 o
o .4 ' --- ;• _ .if.,,,._
L 3 Outlet - _-a_ _ _ 5000 m
_-m .2 _ manifold _---../_...
O0 2 4 6 8 I0 12 14 16 18 20 22 24 -r4JCD_J
_- Distance from open end, in. s4_ss2
Figure 52.-Heat transfer coefficients in the side strutTPS inlet and outlet coolant manifolds.
86
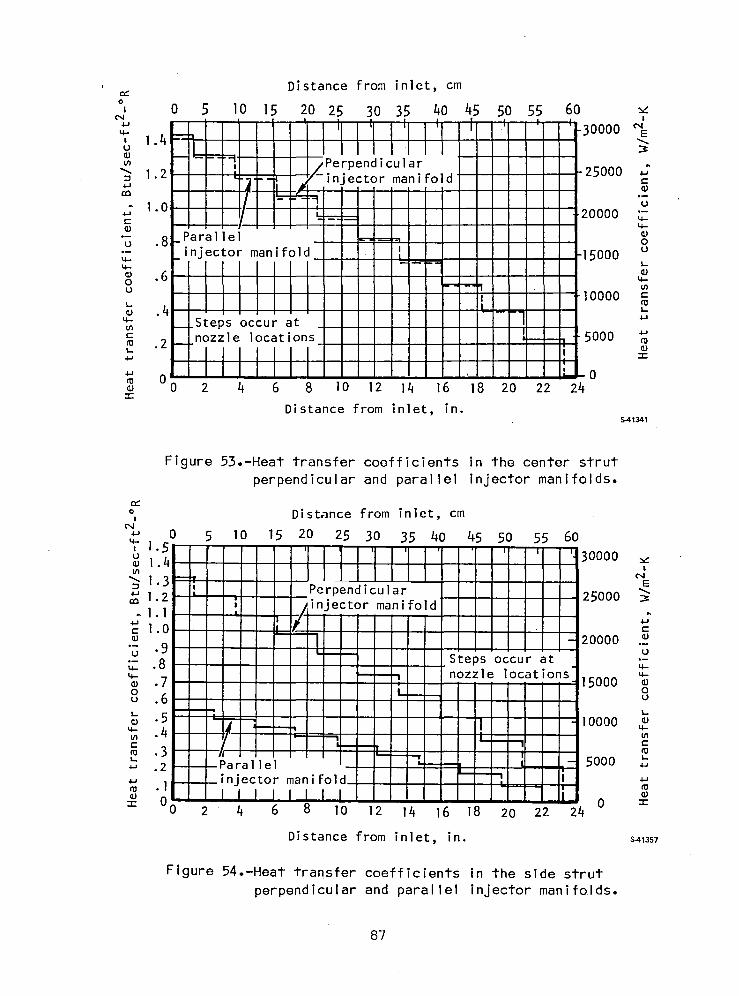
, Distance from inlet, cmr¢o
, 0 5 10 15 20 25 30 35 40 45 50 55 60 ,/oq I
4- II -30000 eq, 1.4 =--j_ E,. I I ,
! '--I_ernendicular .1 2 I/r -25000 ,_
'_- iY-,• _- _- I injector manifold =I_I _ ¢)
10 II u•_ " •20000
u .8 Paral le ._-_ o._ I L)_- injector manifold . , -15000
0 " I t_-
illillll I , ioooo.4 . , , L__ L
_- _rSteps occur at ] *_u_ In z l 1 c tions Lm_,. 5000
:IIIIIIll : om 00 2 4 6 8 10 12 ]4 16 18 20 22 24
-t-
Distance from inlet, in.S41341
Figure 53.-Heat transfer coefficients in the center strut
perpendicular and parallel injector manifolds.
o Distance from inlet, cmI
0 5 _o 15 2,0 25 30 35 40 45 50 55 60o I I]I'I 'I 'I.4 I I ' 30000
|
_ 1.3-: !lllllll' Perpendicular 25000
1.2 ' ; tinjector manifoldI
_l.0 -- _-I - 20000
L_ 8 Ste_s occur at4- _ nozzle locations 4-
7 15000O L_ ou 6 u
L 5I 10000_- 4 A _', _-
m 3 _--i , , i a a I _-- I _ - 5ooo 4J.2 _--Parallel -
•_ _injector manifold_ _ *_I I I I I I I I
_: 00 2 4 6 8 I0 12 14 16 18 20 22 24 0 _:
Distance from inlet, in. S-413S7
Figure 54.-Heat transfer coefficients in the side strut
perpendicular and parallel injector manifolds.
87
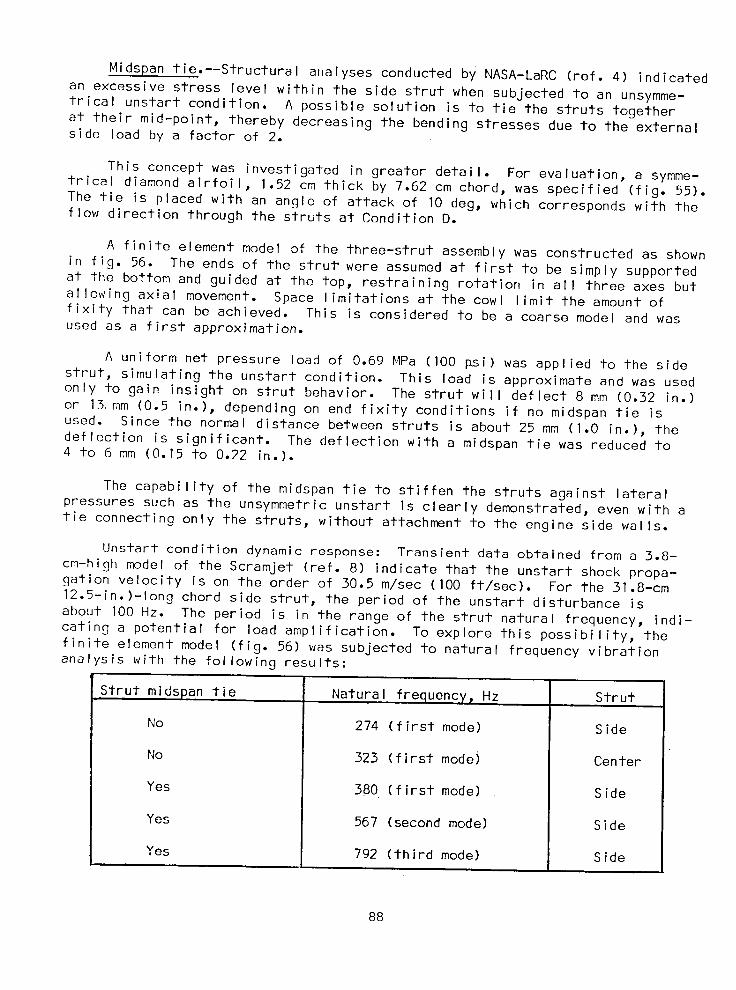
Midspan tie.--Structural aI_alysesconducted by NASA-LaRC (ref. 4) indicated
an excessive stress level within the side strut when subjected to an unsymme-trical unstart condition. A possible solution is to tie the struts togetherat their mid-point, thereby decreasing the bending stresses due to the externalside load by a factor of 2.
This concept was investigated in greater detail. For evaluation, a symme-trical diamond airfoil, 1.52 cm thick by 7.62 cm chord, was specified (fig. 55).The tie is placed with an angle of attack of 10 deg, which corresponds with theflow direction through the struts at Condition D.
A finite element model of the three-strut assembly was constructed as shown
in fig. 56. The ends of the strut were assumed at first to be simply supportedat the bottom and guided at the top, restraining rotation in all three axes butallowing axial movement. Space limitations at the cowl limit the amount offixity that can be achieved. This is considered to be a coarse model and wasused as a first approximation.
A uniform net pressure load of 0.69 MPa (100 psi) was applied to the sidestrut, simulating the unstart condition. This load is approximate and was usedonly to gain insight on strut behavior. The strut will deflect 8 mm (0.32 in.)or 13 mm (0.5 in.), depending on end fixity conditions if no midspan tie isused. Since the normal distance between struts is about 25 mm (1.0 in.), thedeflection is significant. The deflection with a midspan tie was reduced to4 to 6 mm (0.15 to 0.22 in.).
The capability of the midspan tie to stiffen the struts against lateralpressures such as the unsymmetric unstart is clearly demonstrated, even with atie connecting only the struts, without attachment to the engine side walls.
Unstart condition dynamic response: Transient data obtained from a 3.8-
cm-high model of the Scramjet (ref. 8) indicate that the unstart shock propa-gation velocity is on the order of 30.5 m/sec (100 ft/sec). For the 31.8-cm12.5-in.)-long chord side strut, the period of the unstart disturbance is
about 100 Hz. The period is in the range of the strut natural frequency, indi-cating a potential for load amplification. To explore this possibility, thefinite element model (fig. 56) was subjected to natural frequency vibrationanal lsis with the following results:
Strut midspan tie Natural frequencyt Hz Strut
No 274 (first mode) Side
No 323 (first modei Center
Yes 380 (first mode) Side
Yes 567 (second mode) Side
Yes 792 (third mode) Side|
88
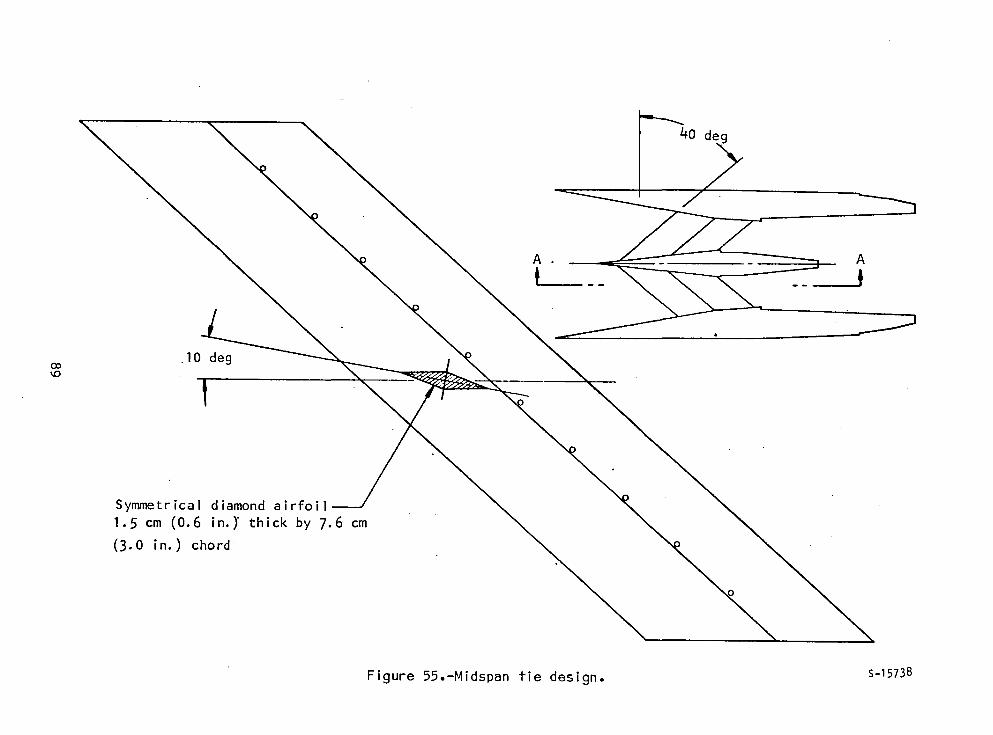
• 4o
1.5 cm (0.6 in.)" thick
(3.0 in.) chord
Figure 55.-Midspan tie design. S-15738
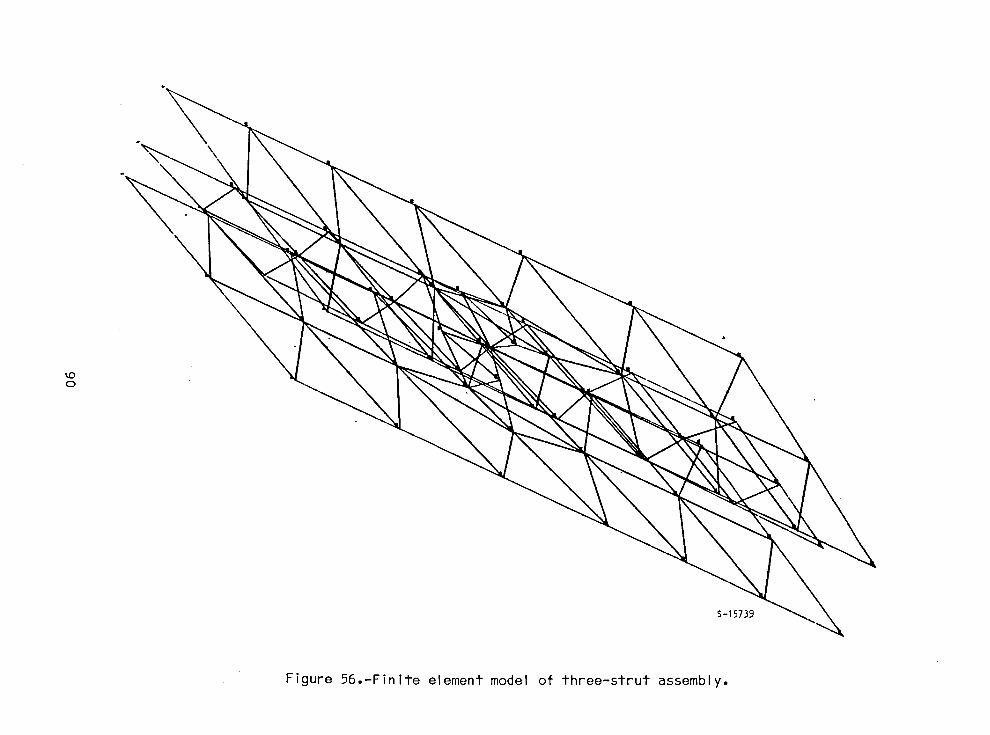
\
o
S-15739
Figure 56.-Finite element model of three-strut assembly.
The midspan tie can increase the natural frequency of the struts by 38percent (side strut) to over 150 percent (central strut). By moving the tiealong the strut height, the strut structural vibration response can be con-veniently tuned (or detuned).
For a side strut without a tie, the ratio of pulse period to strut periodis 0.37, which yields a loading factor of 1.3 (half sine wave shock profile).By adding a midspan tie, the loading factor is decreased to 0.9. These cal-culations must be considered to be approximate, but they do show the load reduc-tion provided by a midspan tie.
Conclusions: a midspan tie can provide several benefits and is structur-ally and aerodynamically feasible;_however, the resultant complications incoolant flow routing and strut fabrication are substantial. It is also recog-nized that the data used in establishing the loading condition are uncertain.Means for reducing the thermal loading were therefore considered as an alternateapproach to reduce the combined loading without resorting to a midspan tie.
Side strut structural analysis.--A large 3-dimensional finite elementmodel of the side strut was constructed by NASA using the SPAR computer code(ref. 14). Only the side strut was modeled, as its loading was slightly morecritical than the center strut loading and the results would be conservativelyrepresentative for the center strut. The model was primarily comprised of tri-angular and quadrilateral plate elements with both membrane and bending stiff-ness, and had 1708 unrestrained degrees of freedom.
Initial results, described in ref. 4, are based on the following strutmounting scheme: at the top, a three-point suspension is used in which theleading edge is fixed and the other two points have two degrees of freedomeach. The strut is permitted to move chordwise from the leading edge andlaterally from one side. At the cowl, the strut is fitted to a slot thatpermits longitudinal expansion but provides support for side loads. Localstresses developed with this scheme were found to be excessive.
Performance with revised mounting scheme: Boundary conditions wereadjusted to permit thermal growth and rotation along the strut main plane;a set of springs was used to represent the midspan tie. These conditionsare shown schematically in fig. 57.
The finite element model was constructed on the basis of the following:(I) two main longitudinal webs, 2.79 mm (0.11-in.) thick; (2) uniform thicknesssidewalls, 2.03 mm (O.080-in.) thick; and (3) 6.60 mm (0.26 in.) by 28.45 mm(1.12 in.) leading and trailing edge sections.
Pressure loads defined for an unsymmetrical unstart (at Condition G)were applied along with the Condition H thermal loading. It is presumed thatthe coolant flow is modulated to maintain the coolant outlet temperature at889 K (1600°R). Hence, the coolant temperature distribution, the primarystructure temperature distribution, and the resulting thermal stresses aresimilar for all operating conditions even though the overall heat input varies.
91
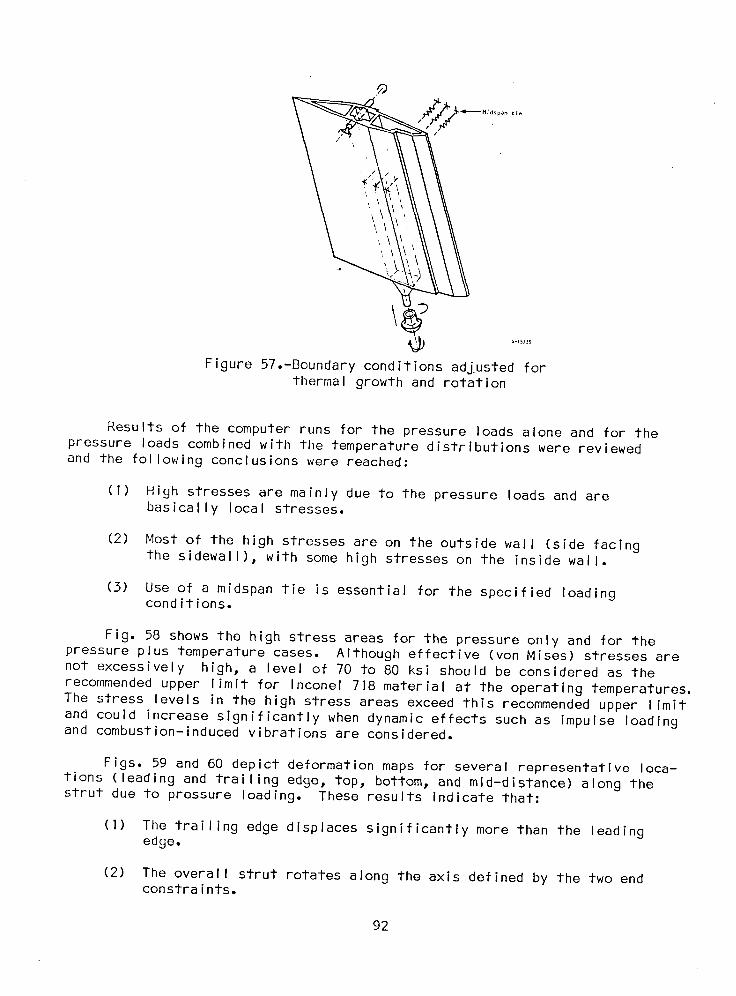
/_._ M_dspan tie
Figure 57.-Boundary conditions adjusted forthermal growth and rotation
Results of the computer runs for the pressure loads alone and for thepressure loads combined with the temperature distributions were reviewedand the following conclusions were reached:
(I) High stresses are mainly due to the pressure loads and arebasically local stresses.
(2) Most of the high stresses are on the outside wall (side facingthe sidewall), with some high stresses on the inside wall.
(3) Use of a midspan tie is essential for the specified loadingconditions.
Fig. 58 shows the high stress areas for the pressure only and for thepressure plus temperature cases. Although effective (von Mises) stresses arenot excessively high, a level of 70 to 80 ksi should be considered as the
recommended upper limit for Inconel 718 material at the operating temperatures.The stress levels in the high stress areas exceed this recommended upper limitand could increase significantly when dynamic effects such as impulse loadingand combustion-induced vibrations are considered.
Figs. 59 and 60 depict deformation maps for several representative loca-tions (leading and trailing edge, top, bottom, and mid-distance) along thestrut due to pressure loading. These results indicate that:
(I) The trailing edge displaces significantly more than the leadingedge.
(2) The overall strut rotates along the axis defined by the two endconstraints.
92
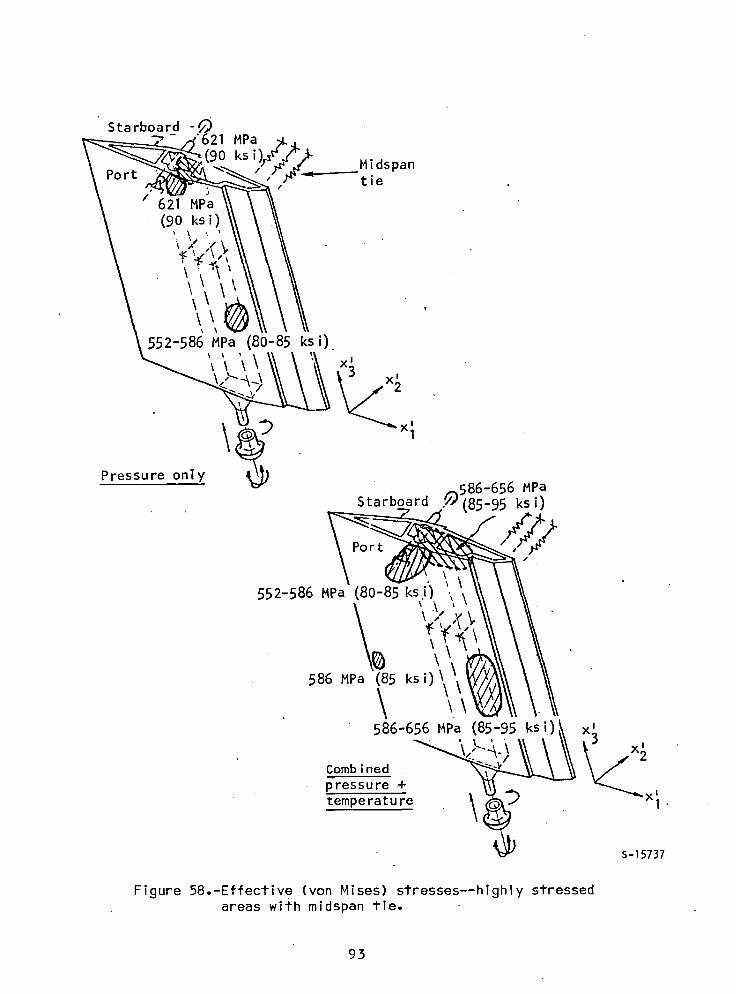
Starboard -621 MPa
(90 ks i'M idspantie
(80-85 ks i).
Pressure onlyt:_586-656MPa
Starboard :i1(85_95ksi)
552-586 MPa
\\
586MPa (85ksi)
586-656 MPa (85-95 ksi) x' v,Comb ined _j^2
: pressure + \ __x_temperature _ .
S-15737
Figure 58.-Effective (von Mises) stresses--highly stressedareas with midspan tie.
93
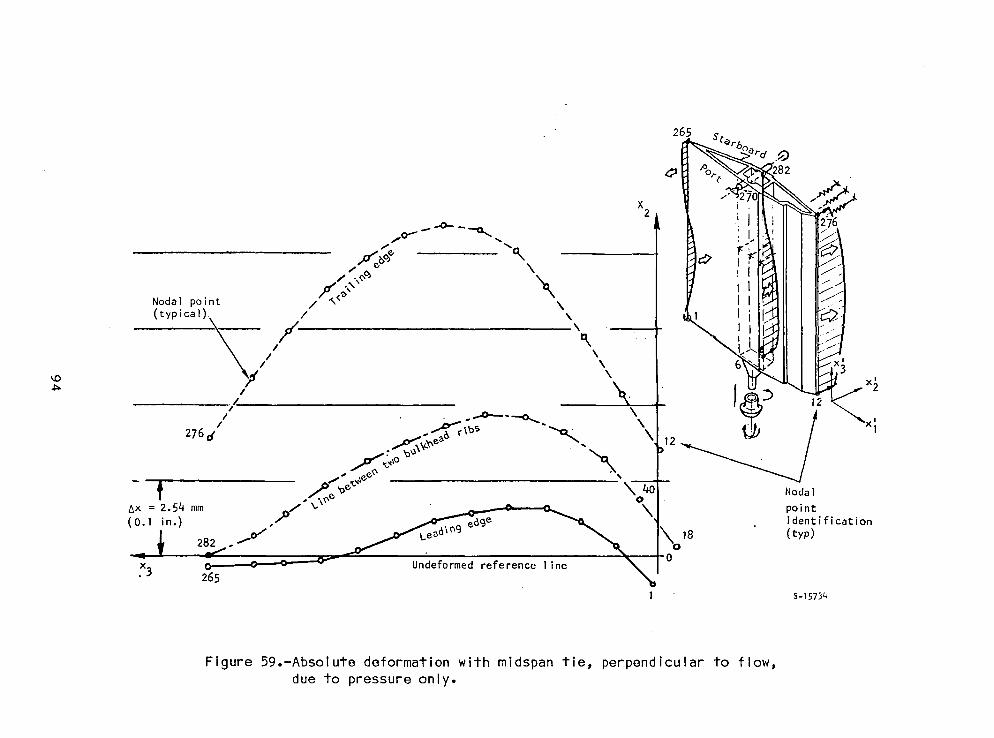
-,{j,X = 2.54 mm(0.1 in.)
\\
\ 12
Figure 59.-Absolute deformation with midspan tie, perpendicular to flow,due to pressure only.
:x'2
X'1
NOdalpointidentification(typ)
5-15734
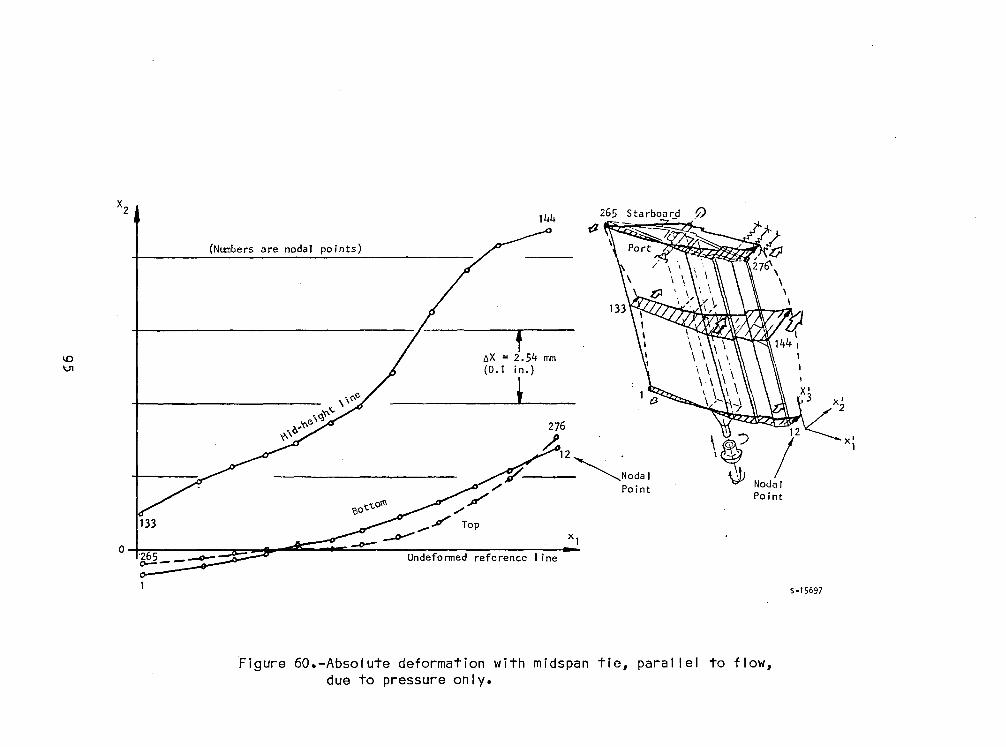
X'1
X'2
NodalPoint
265 Starboar_d ,0t!J
144
f().X = 2.54 rrun(0.1 in.)
______t__276
~12 .
r---~Nodal~ Point
~ot.t.oll' ~/.-0--/ Top
(Numbers are nodal points)
133
oi~--::::::::=::=E::::!"""""",z;..."'-"':"::=--~:i:'fn=l-:::f,;";:;:;=""Il;;:--Undefonned reference 1 ine
5-15697
Figure 60.-Absolute deformation with midspan tie, paral lei to flow,due to pressure only.
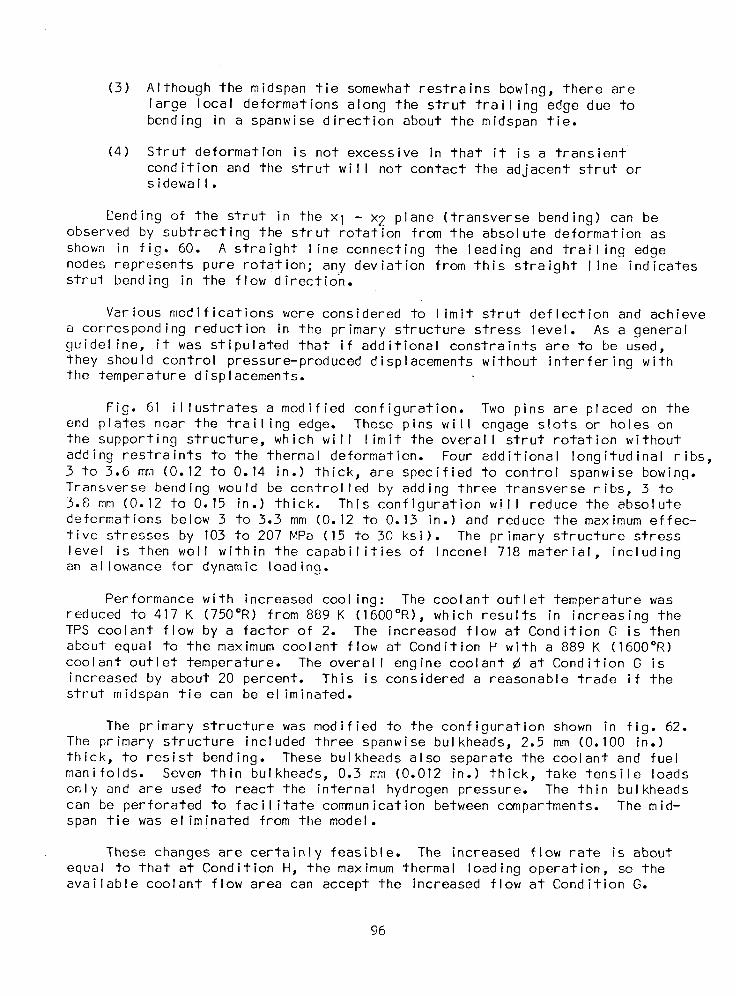
(3) Although the midspan tie somewhat restrains bowing, there arelarge local deformations along the strut trailing edge due tobending in a spanwise direction about the midspan tie.
(4) Strut deformation is not excessive in that it is a transient
condition and the strut will not contact the adjacent strut orsidewall.
_ending of the strut in tilexI - x2 plane (transverse bending) can beobserved by subtracting the strut rotation from the absolute deformation asshown in fig. 60. A straight line connecting the leading and trailing edgenodes represents pure rotation; any deviation from this straight line indicatesstrut bending in the flow direction.
Various modifications were considered to limit strut deflection and achieve
a corresponding reduction in the primary structure stress level. As a generalguideline, it was stipulated that if additional constraints are to be used,they should control pressure-produced displacements without interfering withthe temperature displacements.
Fig. 61 illustrates a modified configuration. Two pins are placed on theend plates near the trailing edge. These pins will engage slots or holes onthe supporting structure, which will limit the overall strut rotation withoutadding restraints to the thermal deformation. Four additional longitudinal ribs,3 to 3.6 mm (0.12 to 0.14 in.) thick, are specified to control spanwise bowing.Transverse bending would be controlled by adding three transverse ribs, 3 to3.8 mm (0.12 to 0.15 in.) thick. This configuration will reduce the absolutedeformations below 3 to 3.3 mm (0.12 to 0.13 in.) and reduce the maximum effec-tive stresses by 103 to 207 MPa (15 to 30 ksi). The primary structure stresslevel is then well within the capabilities of Inconel 718 material, includingan allowance for dynamic loading.
Performance with increased cooling: The coolant outlet temperature wasreduced to 417 K (750°R) from 889 K (1600°R), which results in increasing theTPS coolant flow by a factor of 2. The increased flow at Condition G is thenabout equal to the maximum coolant flow at Condition M with a 889 K (1600°R)coolant outlet temperature. The overall engine coolant _ at Condition G isincreased by about 20 percent. This is considered a reasonable trade if thestrut midspan tie can be eliminated.
The primary structure was modified to the configuration shown in fig. 62.The primary structure included three spanwise bulkheads, 2.5 mm (0.100 in.)thick, to resist bending. These bulkheads also separate the coolant and fuelmanifolds. Seven thin bulkheads, 0.3 mm (0.012 in.) thick, take tensile loadsonly and are used to react the internal hydrogen pressure. The thin bulkheadscan be perforated to facilitate communication between compartments. The mid-span tie was eliminated from the model.
These changes are certainly feasible. The increased flow rate is aboutequal to that at Condition M, the maximum thermal loading operation, so theavailable coolant flow area can accept the increased flow at Condition G.
96
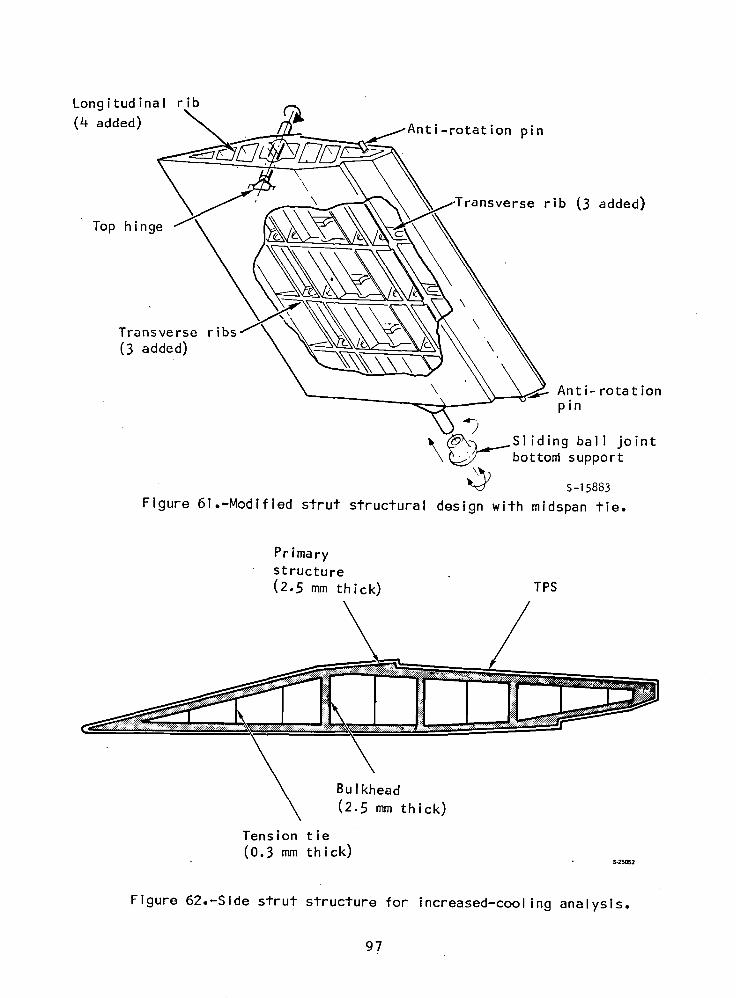
Longitudinal rib
(4 added) i-rotation pin
X rse rib (3 added)
Top hinge
Transverse ribs \
(3 added) \
\ Anti- rotationpin
X Sliding ball jointbattonlsupport
_) s-15883
Figure 61.-Modified strut structural design with midspan tie.
Primarystructure
(2,5 mm thick) TPS
Bulkhead
(2.5 mmthick)
Tension tie(0.3 mmthick)
Figure 62.-Slde strut structure for increased-cooling analysis.
97
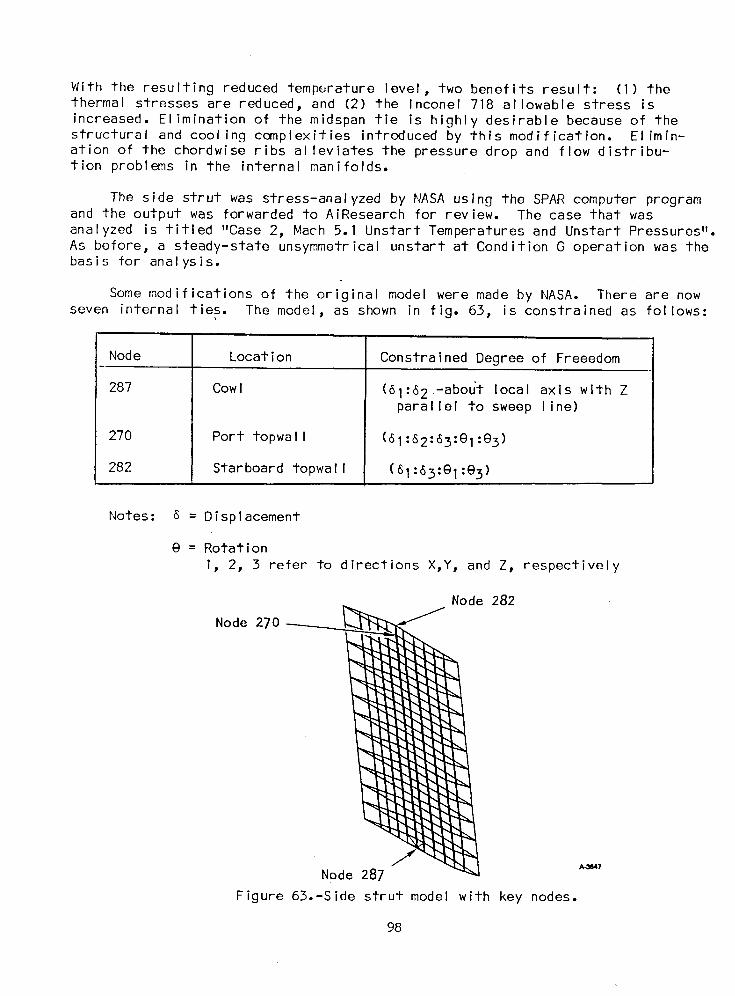
With the resulting reduced temperature level, two benefits result: (I) thethermal stresses are reduced, and (2) the Inconel 718 allowable stress isincreased. Elimination of the midspan tie is highly desirable because of thestructural and cooling complexities introduced by this modification. Elimin-ation of the chordwise ribs alleviates the pressure drop and flow distribu-tion problems in the internal manifolds.
The side strut was stress-analyzed by HASA using the SPAR computer programand the output was forwarded to AiResearch for review. The case that wasanalyzed is titled "Case 2, Math 5.1Unstart Temperatures and Unstart Pressures".As before, a steady-state unsymmetrical unstart at Condition G operation was thebasis for analysis.
Some modifications of the original model were made by NASA. There are now
seven internal ties. The model, as shown in fig. 63, is constrained as follows:
Node Location Constrained Degree of Freeedom
287 Cowl (61:62 -about local axis with Zparallel to sweep line)
270 Port topwall (_1:_2:_3:e1:e3)
282 Starboard topwall (_I:_3:01:e3)
Notes: _ = Displacement
e = Rotation
I, 2, 3 refer to directions X,Y, and Z, respectively
Node 282
Node 270
Node 287 A_7
Figure 63.-Side strut model with key nodes.
98
A review and analysis of the NASA computer results using the NASA modi-fied structure was conducted. Maximum and minimum principal stress maps areshown in figs. 64 through 67 for the starboard and port walls. The starboardwall displacements are shown in fig. 68 on an isometric deformation map.A schematic of the starboard wall of the model is shown in fig. 69.
The current model output indicates stresses that are higher than thosereported previously. However, the metal temperatures are lower than previouslyreported because the strut is being overcooled. For the temperature reportedon the strut, the allowable stress is 130 ksi (10 unstarts). The stressesin the model exceed the allowable stress only at the topwall support. Thisallows the midspan tie to be eliminated.
The strut is being bent laterally and is being twisted. This can be seenin the deformation and stress patterns. The stress patterns are similar forboth the starboard and port walls. A large central area is above 100 ksi. Thedeformations are large, but no contact will occur with the adjacent strut orthe sidewall panel. The trailing edge has a larger displacement than the lead-ing edge--0.628 in. and 0.386 in., respectively.
The effects of the loading can be best visualized by observing the reac-tions at the constraints (fig. 70). The strut is reacting similarly to a fixedsimple beam.
It is doubtful that the deformations at the topwall that are shown infig. 68 could be as large as have been calculated. The reason for this is thatthe seal and surrounding support structure in the topwall will provide addi-tional support to the strut at the area of contact. This will significantlyreduce the torsional couple at the topwall seen in the loading pattern of fig.70. This will, in turn, result in lower stresses physically existing in thisarea. The analysis to assess the performance of the seal at the intersectionof the side strut and the top panel is described in detail in the next section.
Further, in the analysis the support conditions at the top of the strut havenot taken into consideration the stiffness of the topwall structure. Considera-tion of the stiffness will help distribute the loads and thereby reduce thestress.
If necessary, the stresses at the topwall (nodes 270 and 282) can bereduced by sharing the topwall reactions by two mounts. This will cut the reac-tion per mount (and therefore the stress) at the topwall approximately in half.In addition, the torsional couple at the topwall can be reacted better as twolateral (direction 2) forces acting over a large span (fore and aft mountdistance).
Strut/panel interface analysis.--This consisted of a structural analysis ofa side strut and the region surrounding it when subjected to the maximum symme-trical unstart load condition. An analysis was conducted to assess the perfor-mance of the seal at the intersection of the side strut and the top panel, and toprovide the boundary conditions at the edges of the side strut. A portion ofthe engine, including a side strut and a portion of the topwall incorporatingthe strut support and seal assembly, was isolated for the analysis. Consistent
99
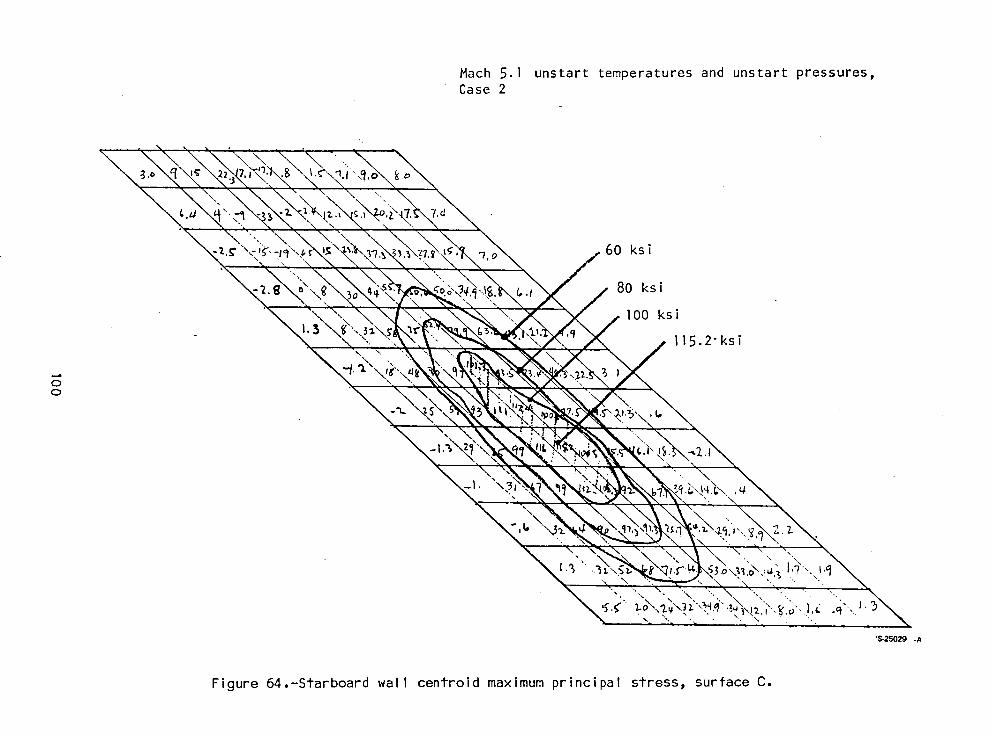
Mach 5.1 unstart temperatures and unstart pressures,Case 2
80 ksi
I00 ksi
ll5.2"ksi
oo
Figure 64.-Starboard wall centroid maximum principal stress, surface C.
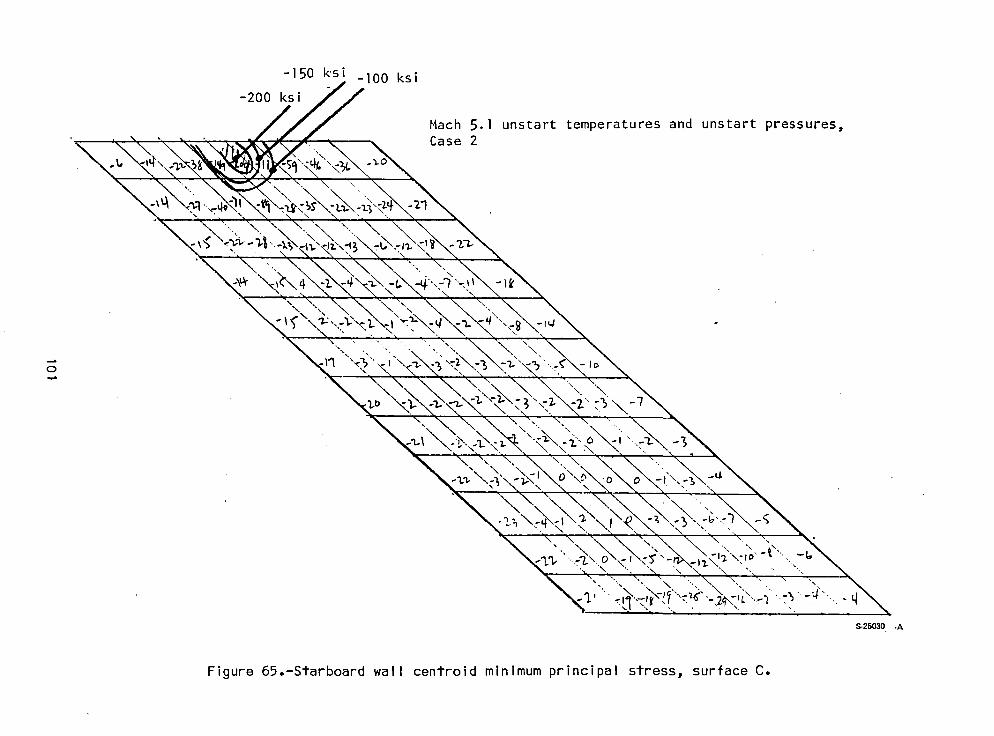
-150 ksi -lO0 ksi
-200 ksi
Math 5.1 unstart temperatures and unstart pressures,Case 2
o
S-25030 -A
Figure 65.-Starboard wall centroid minimum principal stress, surface C.
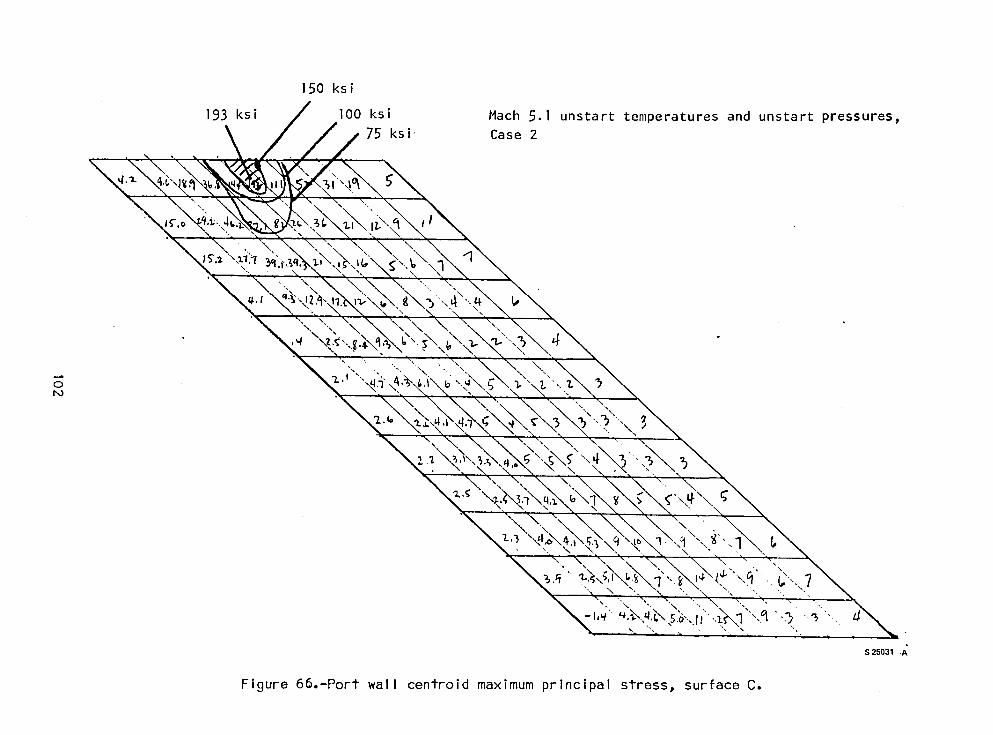
150 ksi
193 ksi lO0 ksi Mach 5.1 unstart temperatures and unstart pressures,75 ksi Case 2
Figure 66.-Port wall centroid maximum principal stress, surface C.
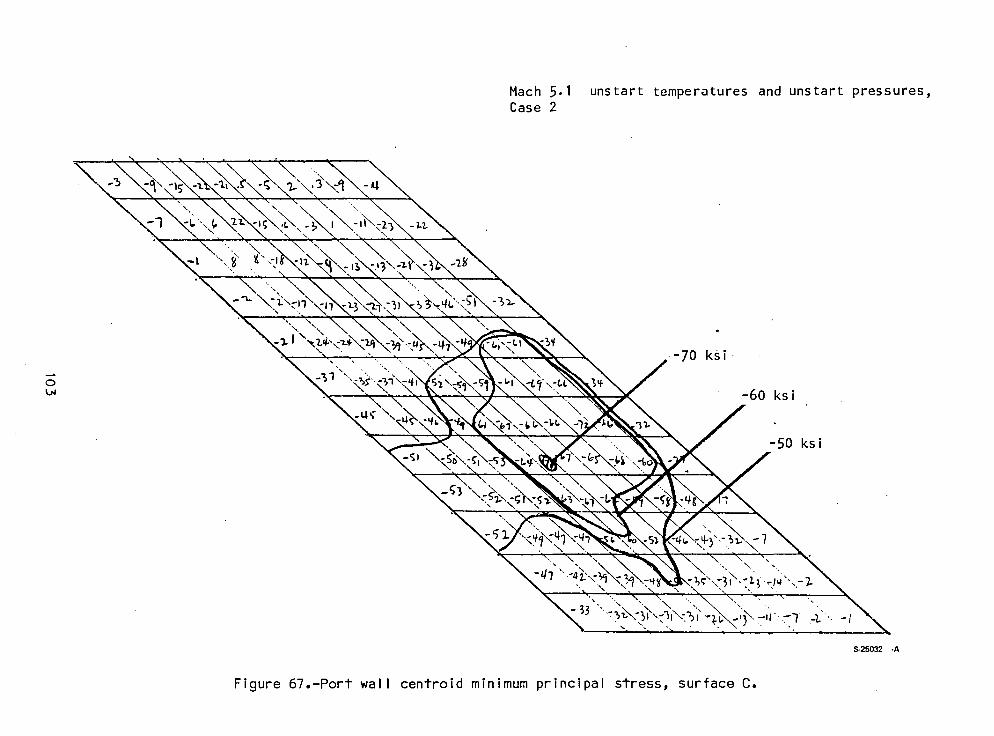
Mach 5.1 unstart temperatures and unstart pressures,Case 2
• .. .-70 ks i •
,1"L_ -60 ksi
-50 ksi
S-25032 -A
Figure 67.-Port wall centroid minimum principal stress, surface C.
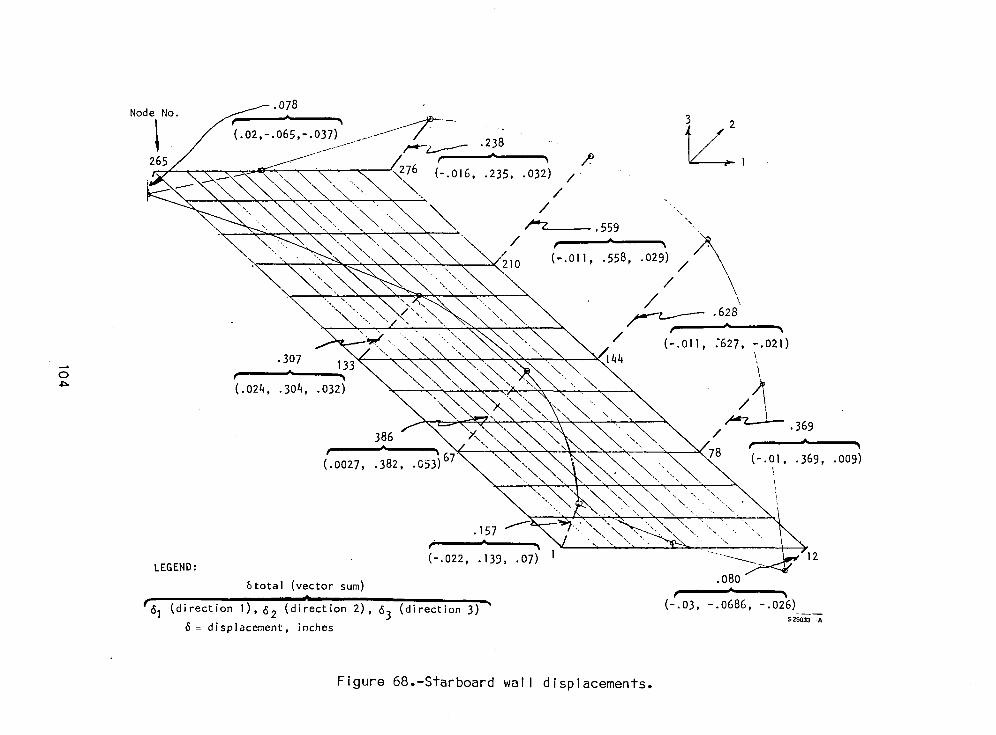
.o78
Node No. 3 2
(.02,-.065,-.037) .238/_'-7.._ ^
• _ _. I
265 :76 (-.016, .235, .032) /
"\ "x -. /
xx_ /'7-_.559/
\ ". _- 011 558 029)210 " ' ' P " /
\ , / \• \ / \
\
'\ """ " _ .628A
" ' "" / (-.011, _627, -.021)• 307 "" \" ' '144 ',
• ,\
"_" (.024, .304, .032) /_/\
.369386 / A
0027,.382,.053;6: -.o1,.369,.009)
\ \ -, \\ !\ '\ \ • .•-. \
• . x• 157 \ x'\ "'- ', •
LEGEND: (-.022, .139, .07) I
6total (vector sum) .080A • •
"61 (direction I), 62 (direction 2), 63 (direction 3)- (-.03, -.0686, -.026)S-25033 -A
6 = displacement, inches
Figure 68.-Starboard wall displacements.
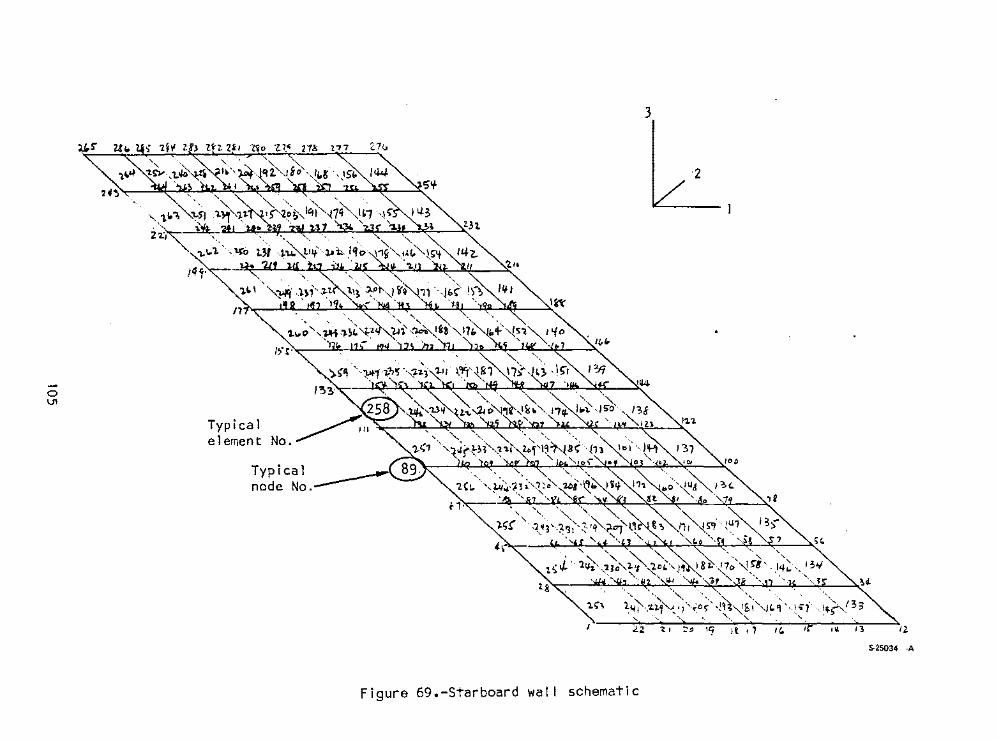
oU1
Typicalelement
Typical _____node No.
Figure 69.-Starboard wal I schematic
3
'2
.1/, n
5-25034 -A
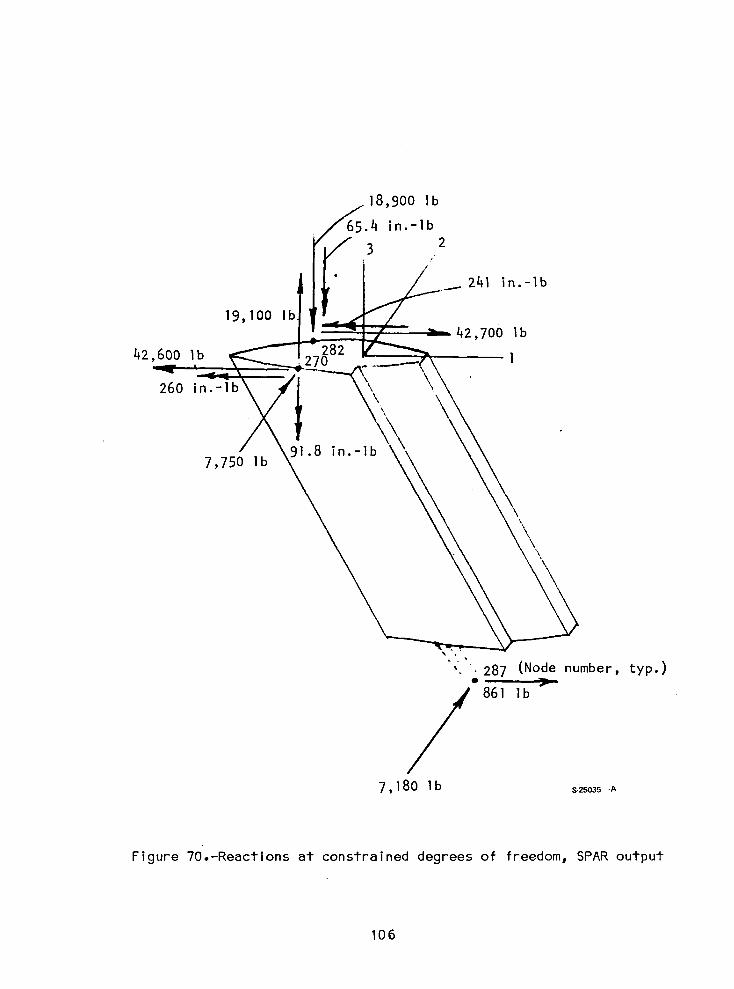
18,90o Ib
.4 in.-Ib
3 2I.t
241 in.-Ib
19,100 Ib42,700 Ib
42,600 Ib I
260 in.-Ib _\ \\
7,750 Ib 91.8 in.-Ib
\\'4\
\\
\
• 287 (Node number, typ.)D
861 Ib
7,180 1b s-2so3s-_
Figure 70.-Reactions at constrained degrees of freedom, SPAR output
106
with the assumption of a symmetrical unstart loading, only one-half of the
structure needed to be considered for the analysis.
To limit the size of the problem, the structure was divided into threeconvenient substructures, or superelements, as follows:
• A substructure of the side strut
• A substructure of the topwall
• A substructure of the seal between the side strut and the topwall
The theory behind creating a'substructure or a superelement is analogous tothe process of mass-lumping reduction commonly used in the dynamic analysis.The stiffnesses (and masses) for a specified degree of freedom at selected nodesare retained as the characteristics of a superelement, whereas the remainingdegrees of freedom are eliminated. The retained degrees of freedom are calledactive degrees of freedom. Such a superelement can then be used in any of thesubsequent analysis simply as another type of element. The details of each ofthese substructures are described in the followng paragraphs.
For a given loading condition, a specified set of displacements has to beimposed as boundary conditions along the edges of the isolated portion of thetopwall and the side strut interface with the cowl. The results of the all-
honeycomb 3-D analysis of the overall structure was used in defining the boundaryconditions. These boundary conditions already include the effects of the sidewalls, cowl, and center strut.
Substructure No. I, Side Strut: A finite element model of the side strut
(with the AiResearch-derived structural configuration) was previously preparedby _ASA for analysis with the SPAR computer program and was made available toAiResearch. The walls, ribs, and webs of the side strut were modeled using thinshell finite elements. A card deck of the SPAR finite element model of the side
strut was received from NASA. The deck contained information regarding the geo-metry and the loading condition for which the strut was analyzed.
The geometry of the SPAR model of the side strut was converted by AiResearchfor use with the ANSYS computer program; however, the order of the elements asconverted from the SPAR model had an exceptionally high element wavefront of 1650,which is too large to be analyzed using the ANSYS program. A wavefront optimi-zation program developed by AiResearch was utilized to rearrange the order of theelements, which reduced the element wavefront to 210. Computer plots of thereordered model are shown in fig. 71
In the SPAR model, 18 in. of the side strut above the cowl had been consi-
dered for analysis. For the present analysis, the model has been modified inorder to locate the strut modes at the seal level to correspond with the adjacentnodes in the topwall. The modified strut model has a total of 476 elements and331 nodes with 1983 active degrees of freedom.
The location and orientation of the coordinate axes used in defining theAMSYS strut model are identical to the ones used for the SPAR strut model.
107
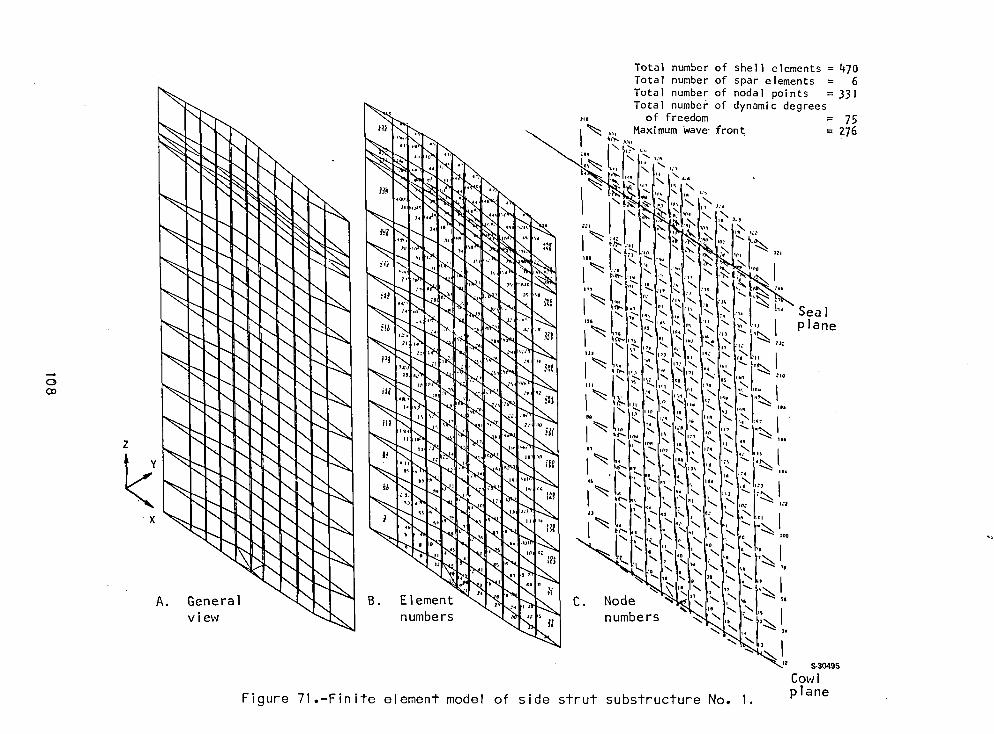
Total number of shelI elements = 470Total number of spar elements = 6Total number of nodal points = 331Total number of dynamic degrees
I", ii'+o++om +" ,_ ,+, ,_. ,,,,Maximum i+ave+fron t = 276
M \ ,'4 \J.,
.N
\ \ _ " ._ ,, _..+_
\ -.. _ ioiSeal
O _" \ _ _ "_ _
" _?Ill
\ \ ,,
• _,_ ,, ", _ ,_ ,_ _
X \ _ \ _.\ _'_ + "_ "" _ :' I
,_ ,,]\ \
A. General \ _ _ _\ \ B. Element ,. C. Node
view -- _ numbers _ _ _ numbers '+__I
Cowl
Figure 71.-Finite elemen_ model of side strut substrucfure No. I. plane
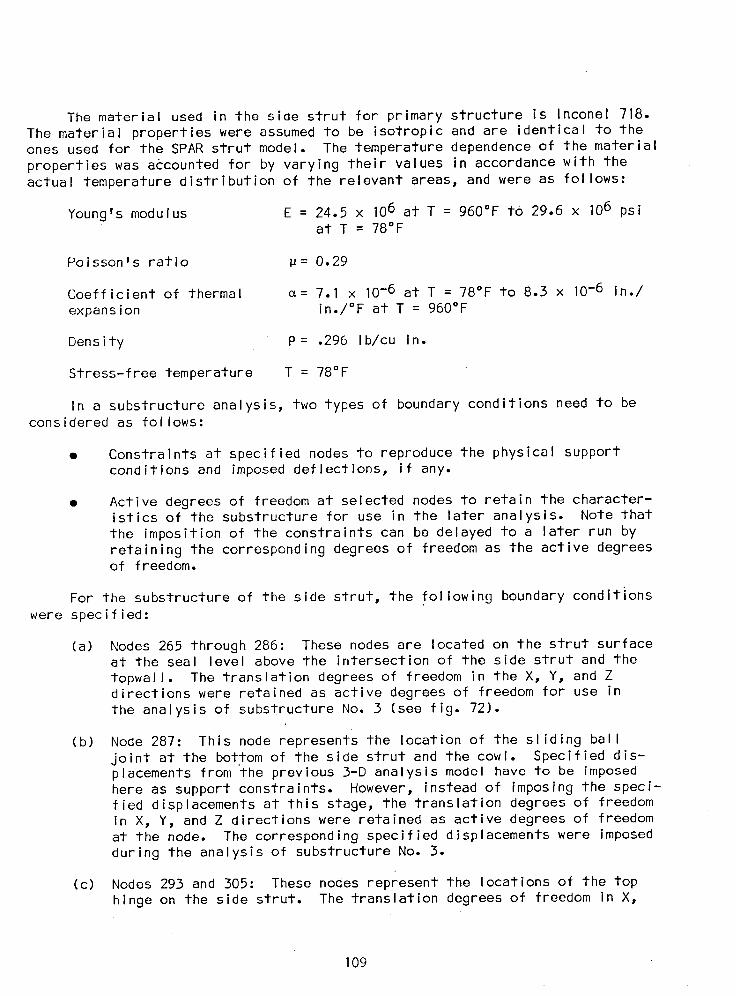
The material used in the side strut for primary structure is Inconel 718.The material properties were assumed to be isotropic and are identical to theones used for the SPAR strut model. The temperature dependence of the material
properties was accounted for by varying their values in accordance with theactual temperature distribution of the relevant areas, and were as follows:
Youngfs modulus E = 24.5 x 10⁶ at T = 960°F to 29.6 x I06 psiat T = 78°F
Poisson's ratio _= 0.29
Coefficient of thermal _= 7.1 x 10⁻⁶ at T = 78°F to 8.3 x I0-6 in./expansion in./°F at T = 960°F
Density P = .296 Ib/cu in.
Stress-free temperature T = 78°F
In a substructure analysis, two types of boundary conditions need to beconsidered as follows:
• Constraints at specified nodes to reproduce the physical supportconditions and imposed deflections, if any.
• Active degrees of freedom at selected nodes to retain the character-istics of the substructure for use in the later analysis. Note thatthe imposition of the constraints can be delayed to a later run byretaining the corresponding degrees of freedom as the active degreesof freedom.
For the substructure of the side strut, the following boundary conditionswere specified:
(a) Nodes 265 through 286: These nodes are located on the strut surfaceat the seal level above the intersection of the side strut and the
topwall. The translation degrees of freedom in the X, Y, and Zdirections were retained as active degrees of freedom for use inthe analysis of substructure No. 3 (see fig. 72).
(b) Node 287: This node represents the location of the sliding ball
joint at the bottom of the side strut and the cowl. Specified dis-placements from the previous 3-D analysis model have to be imposedhere as support constraints. However, instead of imposing the speci-fied displacements at this stage, the translation degrees of freedomin X, Y, and Z directions were retained as active degrees of freedomat the node. The corresponding specified displacements were imposedduring the analysis of substructure No. 3.
(c) Nodes 293 and 305: These nodes represent the locations of the tophinge on the side strut. The translation degrees of freedom in X,
109
783 791 799 807 "815 823 833 842
850757
7_6 774 782_ 790 798 806 814 822 832Leading edge
/ Trailing edgeL_ Node numbers on topwall model
O
Total number of super elements (substructures) = 2Total number of 3-D interface elements = 22Total number of nodal points = 49Maximum wave front = 138
Notes
I. Schematic diagram shows relative position of nodes in the topwall and sidestrut substructures at seal level. Each set of two nodes is connectedby a 3-D interface element representing the seal action.
2. Nodes 287, 293 and 305 of the side strut model and nodes 998 and 999 of the topwall mode]are not shown on this schematic diagram.
S-30491
Figure 72.-Finite element model of seal between the side strutand the topwall, substructure No.3.
Y, and Z directions were retained as active degees of freedom. Thesedegrees of freedom are required during the analysis of substructureNo. 3 for coupling with the appropriate degrees of freedom of thecorresponding nodes on the topwall to reproduce the hinge.
Thus, the finite element model of the side strut with 1983 active degreesof freedom was reduced to a substructure with only 75 active degrees of freedom.
The inertia load input to the ANSYS computer program consists of specify-ing a g factor. For the substructure of the side strut, a 2-g downward loadfactor was used. The format of the temperature and pressure loading data of theSPAR strut model had to be converted for use with the ANSYS strut model. In the
SPAR strut model, the pressure loading was specified at the element nodes. Forthe ANSYS strut model, a constant pressure over the element obtained by averagingthe nodal values has been specified.
Substructure No. 2, Topwall: A portion of the topwall incorporating thestrut support and seal assembly (engine stations 27.7 to 41.5) was modelled usingthree-dimensional solid and membrane isoparametric finite elements. The effectsof the grooves, holes, and local geometric variations have not been included inthe model. The finite element model shown in fig. 73 has a total of 490 elementsand 684 nodes with 2052 active degrees of freedom. The cross-sections throughthe solid elements shown in figs. 74 and 75 illustrate the layout of the finiteelement idealization in various planes.
The portion of the topwall under consideration includes a very smallregion of the honeycomb cells. Consequently, for convenience it was decidedto represent the honeycomb cells using the solid elements having isotropicmaterial properties only. The seal area is located at least two rows of solidelements away from the honeycomb cells. Hence, the assumption of representingthe honeycomb cells using isotropic solid elements will not have any signifi-cant effect on assessing the performance of the seal.
As shown in fig. 76, the cold face sheet and TPS and hot face sheet arerepresented with membrane elements attached to the solid elements on the out-side and inside faces of the topwall, respectively. The TPS and hot face sheetwere combined as one stiffness represented by a single isoparametric membraneelement (0.08 in. thick). The cold face sheet is represented by an isopara-metric membrane element (0.06 in. thick). The layout of such membrane elementsis shown in fig. 77. Once again, the location and orientation of the coordinateaxes used in defining the topwall model are identical to the ones used for theSPAR strut model.
The material used in the entire top panel is assumed to be Hastelloy X.The material properties were specified as isotropic and the Young's moduluswas allowed to vary linearly with temperature. The material properties aresimilar to the ones used for the topwall analysis conducted earlier in theprogram and are as follows:
Young's modulus E = 28.73 x 10⁶ - (3152 x Temperature in °F) psi
Poisson's ratio # = 0.32
111

Total number of splid elements = 349Total number of membrane elements = ]41
Total number of nodal points = 684
Total number of active degreesof freedom = 72
Maximum wave front = 180
Cold facesheet surface
\
Level of section A-A
TPS and hotfasheet surface--_, Level of section B-B
Level of section C-C
S-30496 A
Figure 73.-NASA Scram jet, finite element model of the topwall (substructureFlo.2). (Sections A-A, B-B and C-C are parallel to X-Y plane andere shown in figure 74).
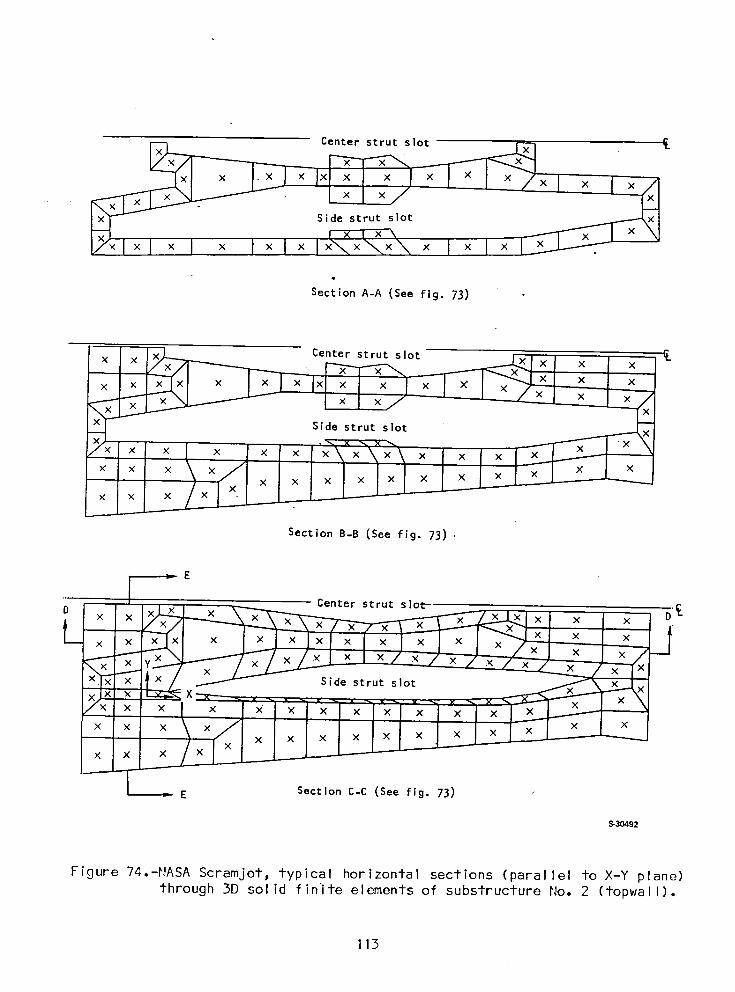
Center strut .slot Ix_ X_] _x,
I X'_-- Side strut slot _1_._Xlx x-_
Section A-A (See fig. 73)
Section B-B (See fig. 73) •
_x E Center strut slot
°_xx_ D£,
E Section C-C (See fig. 73)
S-30492
Figure 74.-NASA Scramjet, typical horizontal sections (parallel to X-Y plane)through 3D solid finite elements of substructure No. 2 (topwall).
113
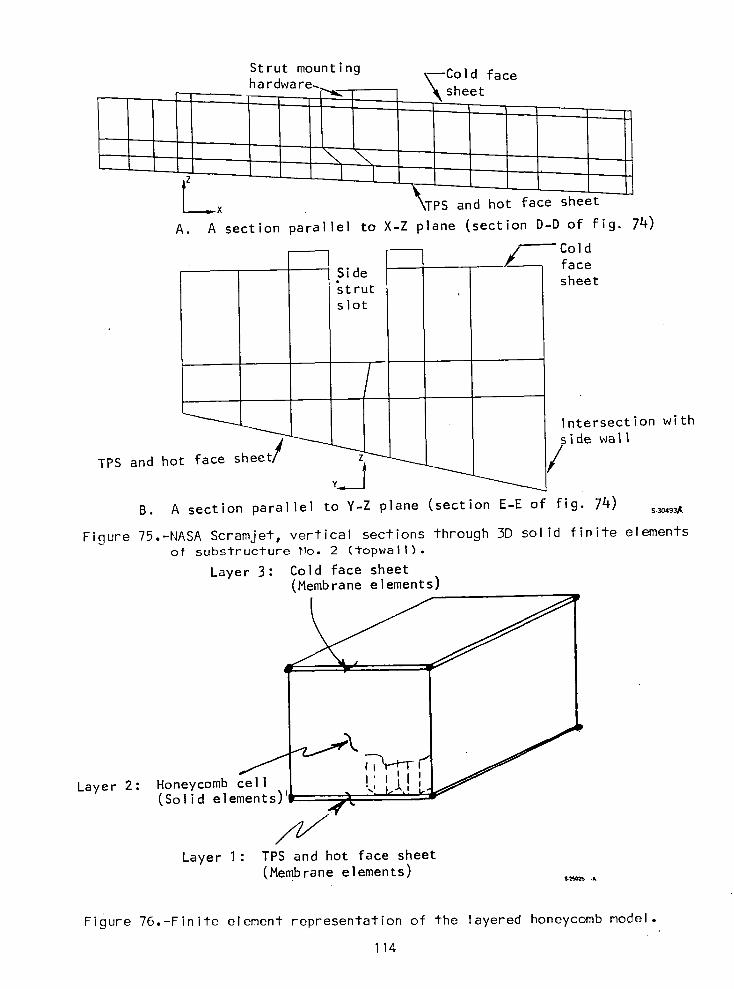
Strut mounting _-_Cold face
_ ha rdware_ _sheet
_..x PS and hot face sheet
A. A section parallel to X-Z plane (section D-D of fig. 74)
Cold
Side _ facestrut , sheetslot
!_ Intersection withTPS and hot face sheet/ ?ide
wa_l
B. A section parallel to Y-Z plane (section E-E of fig. 74) s_93_
Figure 75.-NASA Scramjet, vertical sections through 3D solid finite elementsof substructure _Io.2 (topwall).
Layer 3: Cold face sheet(Membrane elements)
Layer 2: Honeycomb cell l'..._..k!I',l .ements)
(Solid el __. -
Layer I: TPS and hot face sheet
(Membrane elements) _
Figure 76.-Finite element representation of the layered honeycomb model.
114

3.9
41 449 485
41 442. 4S31.8
I0 5_ 92_ 14S__------ i dewa 11
-2.4_ .8 .'.3 2.4 4.g 6,L/ 8 8 lO.b 13.b 15.1a,
-- 3,g[ A. Cold face sheet (thi'ckness= 0.060 in.)
strut slot
_n J 1.[ -- Cente_t 41p 443 I 4843 . 96 1 411_ 16_'_- I_7 Z11 23 _ _
"'_" ' _ 39 4 6 4' 9
Side strut slot .... _4'1_.31 t_i - _z f _}.,-zi
111 571 ,93 [ 14"1+ I'/I ;9+ _-t+ _4+ _7,;"3o+;_/_-_/i+33' 35"7+++_I+91Z_..._....J_I+5_,\,
I I I l , r'++.-'- '°+ _-'" _, +-,++o,...__--+8+I---------------- _"'_S idewa II
-2_.4 8 " , I I I !• 2._4 4,6 6.'7 8.8 10.9 1.3.0 15_1.
B. TPS/hot face sheet (thickness = 0.080 in.) S-3_94
Figure 77.-NASA Scramjet, layout of membrane finite elements to representthe cold and TPS/hot sheets in substructure No. 2 (topwall).
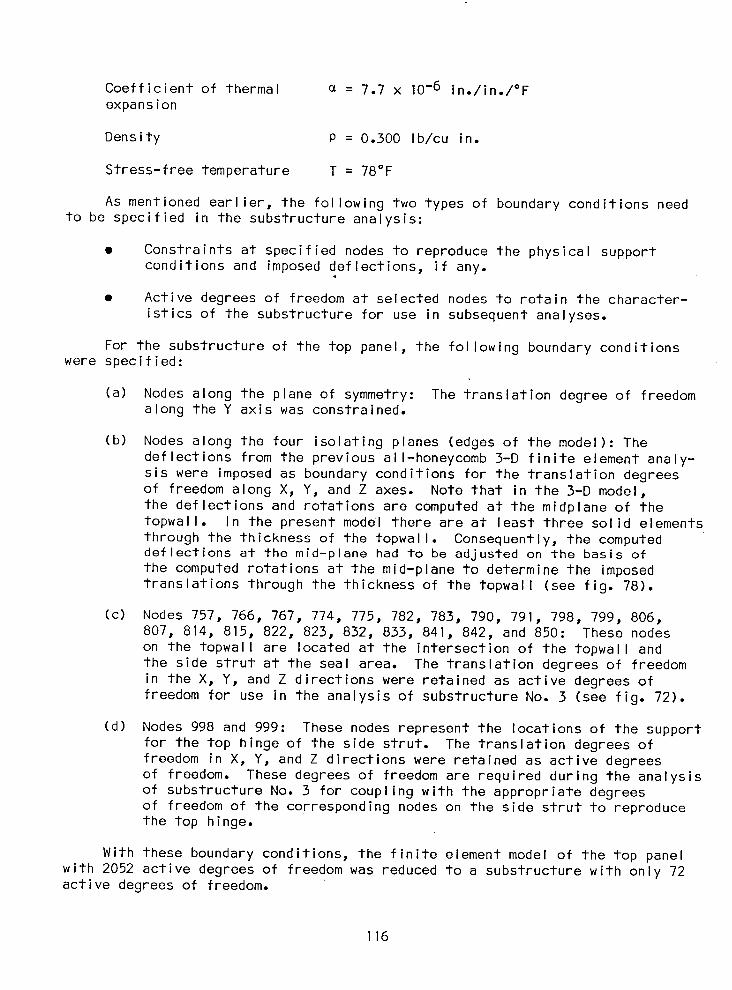
Coefficient of thermal _ = 7.7 x I0-6 in./in./°Fexpansion
Density P = 0.300 Ib/cu in.
Stress-free temperature T = 78°F
As mentioned earlier, the following two types of boundary conditions needto be specified in the substructure analysis:
• Constraints at specified nodes to reproduce the physical supportconditions and imposed deflections, if any.4
• Active degrees of freedom at selected nodes to retain the character-istics of the substructure for use in subsequent analyses.
For the substructure of the top panel, the following boundary conditionswere specified:
(a) Nodes along the plane of symmetry: The translation degree of freedomalong the Y axis was constrained.
(b) Nodes along the four isolating planes (edges of the model): Thedeflections from the previous all-honeycomb 3-D finite element analy-sis were imposed as boundary conditions for the translation degreesof freedom along X, Y, and Z axes. Note that in the 3-D model,the deflections and rotations are computed at the midplane of thetopwall. In the present model there are at least three solid elementsthrough the thickness of the topwall. Consequently, the computeddeflections at the mid-plane had to be adjusted on the basis ofthe computed rotations at the mid-plane to determine the imposedtranslations through the thickness of the topwall (see fig. 78).
(c) Nodes 757, 766, 767, 774, 775, 782, 783, 790, 791, 798, 799, 806,807, 814, 815, 822, 823, 832, 833, 841, 842, and 850: These nodeson the topwall are located at the intersection of the topwall andthe side strut at the seal area. The translation degrees of freedomin the X, Y, and Z directions were retained as active degrees offreedom for use in the analysis of substructure No. 3 (see fig. 72).
(d) Nodes 998 and 999: These nodes represent the locations of the supportfor the top hinge of the side strut. The translation degrees offreedom in X, Y, and Z directions were retained as active degreesof freedom. These degrees of freedom are required during the analysisof substructure No. 3 for coupling with the appropriate degreesof freedom of the corresponding nodes on the side strut to reproducethe top hinge.
With these boundary conditions, the finite element model of the top panelwith 2052 active degrees of freedom was reduced to a substructure with only 72active degrees of freedom.
116
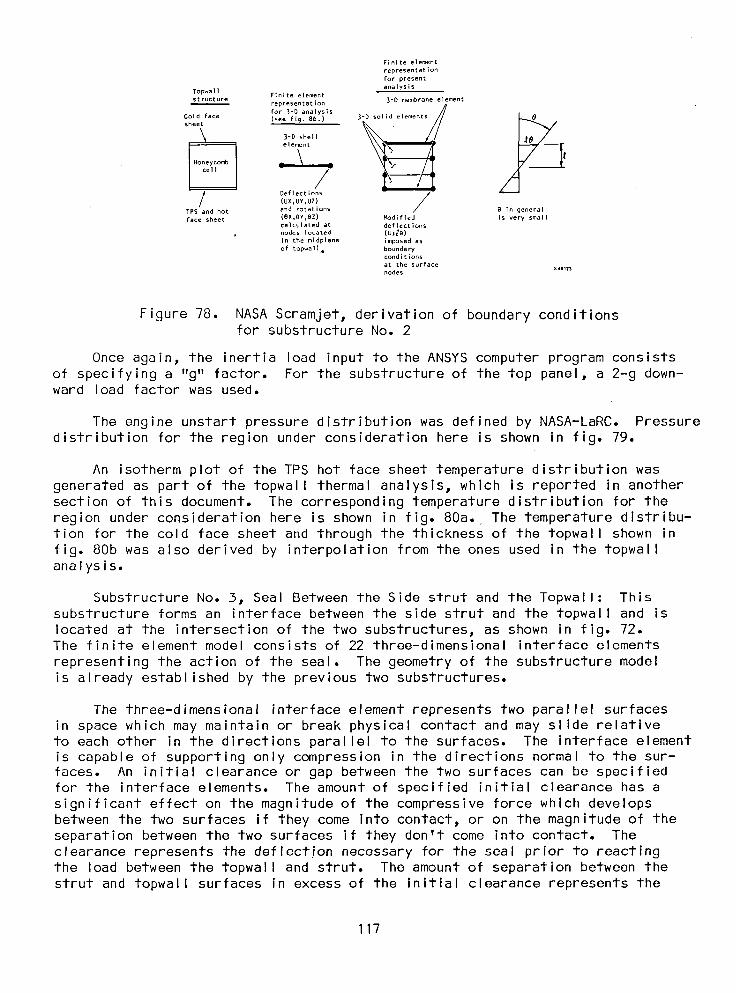
Finite e|ementrepresentation
for presentanalysis
Topwall Finite elen_nt
structure representation 3-O membrane element
Cold face (see fig. 86.) 3- i e m n 0sheet
ele_nt
! oefleot,oo,- /-(UX,UY,UZ)
TPS and hot and rotations e in generalface sheet (BX,BY,BZ) _dlf]ed is very small
calculated at deflectionsnodes located (U_@)
in the midplane imposed as
of topwall4 boundaryconditions
at the surfacenodes s 461Z3
Figure 78. NASA Scramjet, derivation of boundary conditionsfor substructure No. 2
Once again, the inertia load input to the ANSYS computer program consistsof specifying a "g" factor. For the substructure of the top panel, a 2-g down-ward load factor was used.
The engine unstart pressure distribution was defined by NASA-LaRC. Pressuredistribution for the region under consideration here is shown in fig. 79.
An isotherm plot of the TPS hot face sheet temperature distribution wasgenerated as part of the topwall thermal analysis, which is reported in anothersection of this document. The corresponding temperature distribution for theregion under consideration here is shown in fig. 80a. The temperature distribu-tion for the cold face sheet and through the thickness of the topwall shown infig. 80b was also derived by interpolation from the ones used in the topwallanalysis.
Substructure No. 3, Seal Between the Side strut and the Topwall: Thissubstructure forms an interface between the side strut and the topwall and islocated at the intersection of the two substructures, as shown in fig. 72.The finite element model consists of 22 three-dimensional interface elements
representing the action of the seal. The geometry of the substructure modelis already established by the previous two substructures.
The three-dimensional interface element represents two parallel surfacesin space which may maintain or break physical contact and may slide relativeto each other in the directions parallel to the surfaces. The interface elementis capable of supporting only compression in the directions normal to the sur-faces. An initial clearance or gap between the two surfaces can be specifiedfor the interface elements. The amount of specified initial clearance has asignificant effect on the magnitude of the compressive force which developsbetween the two surfaces if they come into contact, or on the magnitude of theseparation between the two surfaces if they don't come into contact. Theclearance represents the deflection necessary for the seal prior to reactingthe load between the topwall and strut. The amount of separation between thestrut and topwall surfaces in excess of the initial clearance represents the
117

e_l _ .-1" o o4 u_ o u-_ o er_ Lr_ 0 _NOu'_O u'_O _0 _r_ ..I"-.I- _ _ u_ u'_ u'_ _,o _o r-_ r--.r-_ cO cOOO r-,.r,-._0_0 Lr_ Lr_ LI_
/ I I /I 1_4 ]E 16_ II --__-'=.-.-,-,.-..._Z--Center strut slot _g 3[ 114]_1_ 443 I I 4184 _"i S11i 781 '/_-_.-__._ , .' 187/',2,, ._ .... S i°___ , ,[ i. I |
i il _"'-"-"L--:-.I--._J ; -/ t_7 q°?./"-I:_'_L-.S-1_--""-'[.r'T'-4__ _ i4g'P 438 I,! 4791- ' . lS81 '18_ --I.32011 344,1 I 3_-_': __9 [! ; 'J
" I I ? _1-1 -].[ I II ! ! I-I--/ pU._ 433 Ii 474/|
I2 I'? IS' ",, 4kx,,
V'!'l _' ,,,,; II 1711 _lgSl _2191 2431 27_ .31t9 133311 ''1 ii iI I n . n n n_ . qll I 1, ,,I i ' I i _ , i I
• /[ ,, 16r ..... .. -- .__ .J[ - . ,,_, ',_ .....I _' n " 0 r_ Lt_ Lt_
1 2 I' I I I u_ _ o oo4 83 I_ . ..1" o_ •
o m m m " / PressureLr_ o i_ oo (3o /_o r_ r_ Isobar lb/sq in.
-_ "I" L--Typicalfinite element (typical) (typical)
A.3649
Figure 79.-NASA Scramjet, pressure distribution in substructure No. 2(topwall) for symmetrical unstart condition, Ib/sq in.
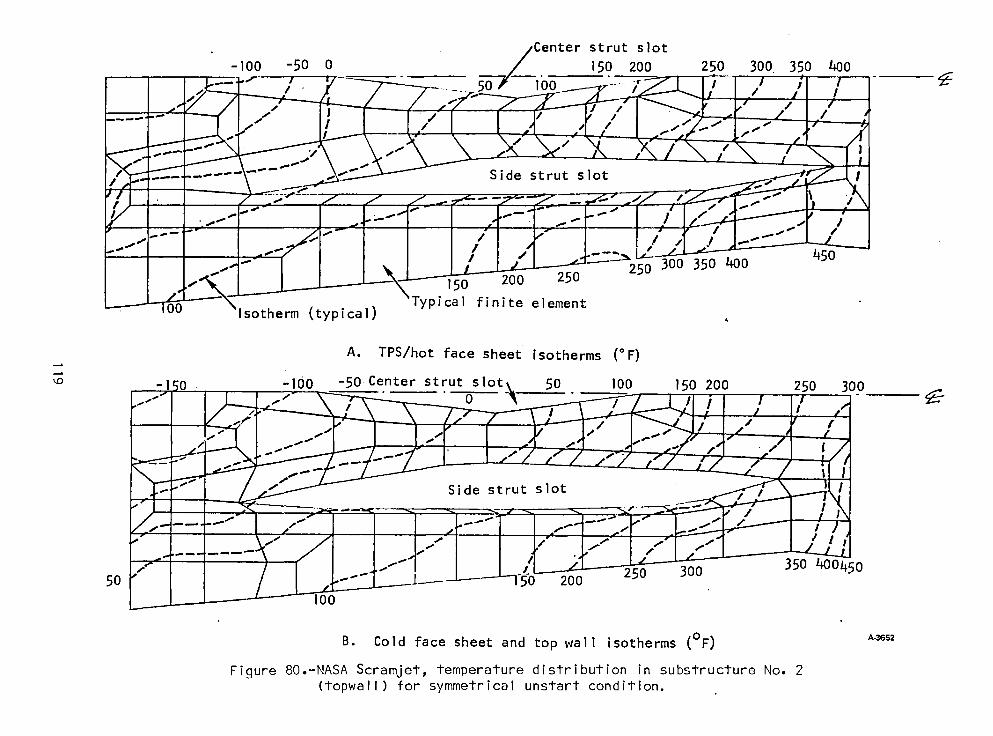
Center strut slot-I00 -50 0 150 200 250 300 350 400. _ • /
so?'- ib_ '__/_ i / / i
i _'" I \/ \ I
'IJ I. I -7-___---_.k "_--._'_--'/ -'._---:--'-------1_#g_-'_
_- 250 3 35
Typical finite element_--I O0 Isotherm (typical)
A. TPS/hot face sheet isotherms (°F)
-100 -50 Center strut slot, 50 I00 150 200 250 300..Y '_ " " 0 _k -- 7 i / i "/L_,._.,_..____.__.,,o -_ ,,.m._<.l " , I, ,'1
'-_-.--,---,r-- --.. --.. --=---#_ _ _"__ i I ! I",l
" "1 I l.--'/ / v L--'-I, 5-1_._____-LZ_Lsl/ .C.--"q / /,'L--ZI--_:_ _ sso_o_so
50 ______.._1---_3o 200 "--'_ -lO0
B. Cold face sheet and top wall isotherms (OF) A_652
Figure 80.-NASA Scramjet, temperature distribution in substructure No. 2(topwaII) for symmetrical unstart condition.
deflection the seal must accommodate to maintain sealing contact. To evaluateand to arrive at an acceptable performance of the seal, substructure No. 3was analyzed for three different cases of initial clearance as follows:
• Case I, initial clearance = 0.000 in.
• Case 2, initial clearance = 0.010 in.
• Case 3, initial clearance = 0.020 in.
With the use of interface elements, an iterative solution can be performedfor each case to achieve equilibrium in all the interface elements. The per-formance of the seal can be observed from the status of the interface elements
at equilibrium. The output for such elements includes the width of separationif the surfaces are not in contact, normal force if the surfaces are in contact,and the sliding movement.
This provides a definition of strut and topwall deflections in the sealarea which must be accommodated by the seal and st_ut and seal reactions fordifferent seal deflections.
The only material property required for an interface element is the coef-ficient of friction, which in the present analysis is assumed to be zero.
The following boundary conditions were specified:
(a) Node 287: As mentioned earlier, this node represents the locationof the sliding ball joint at the bottom of the side strut and thecowl. The deflections from the previous all-honeycomb 3-D finiteelement analysis were imposed as boundary conditions for the trans-lation degrees of freedom along X, Y, and Z directions.
(b) Nodes 293/998 and 305/999: These pairs of nodes correspond to thelocation of the top hinge between the strut and the topwall. Thetranslation degrees of freedom along X, Y, and Z directions werecoupled between each pair of nodes to simulate the hinge effect.
The initial clearance between the side strut and the topwall is included asa real constant specification for each element.
The inertia, pressure, and temperature loading on the side strut and thetopwall are already included in the analysis of substructure Nos. I and 2,respectively, and no addiitonal loading needs to be specified for analyzingsubstructure No. 3.
Results and Conclusions: The analysis results for the three cases aresummarized in Tables 14 through 16 and in fig. 81. The tables list a compres-sion load or clearance in the directions normal to the surfaces and relativesliding displacements in the directions parallel to the surfaces for each pair.
120
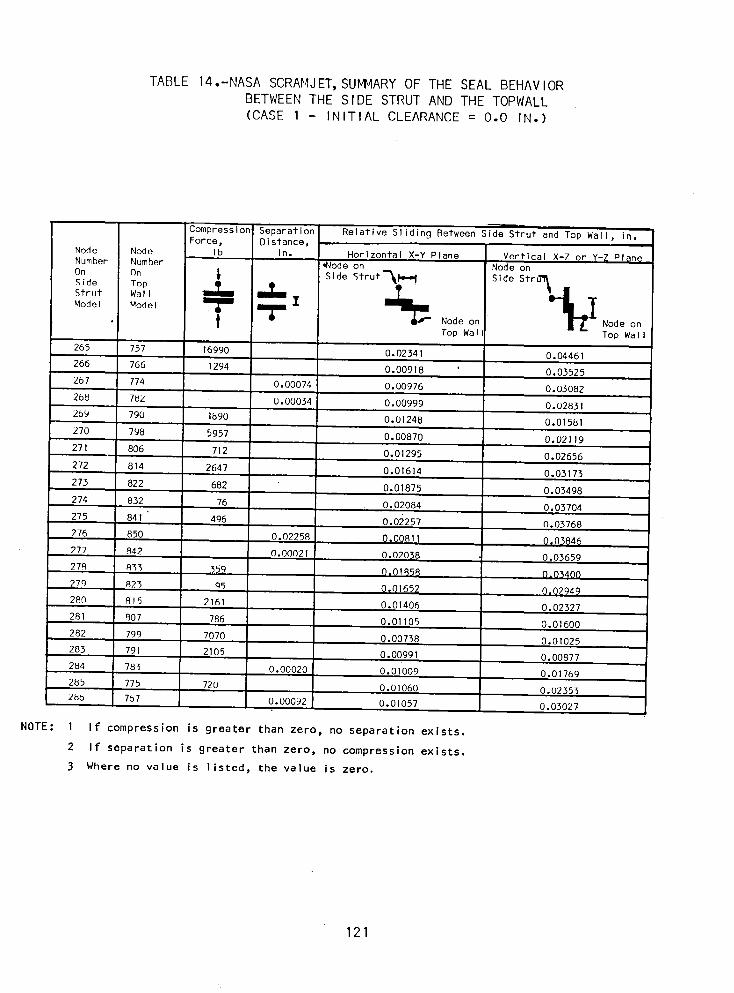
TABLE 14.-NASA SCRAMJET,SUIVMARYOF THE SEAL BEHAVIORBETWEEN THE SIDE STRUT AND THE TOPWALL(CASE I - INITIAL CLEARANCE = 0.0 IN.)
Compression Separation Relative Sliding Between Side Strut and Top Wall, in.Force, D istance,
Node Node Ib in. Horizontal X-Y Plane Vertical X-Z or Y-Z Pl_n_Number Number ,Node on Node on
On On _ Side Strut_lllq-eI Side Stru'_
,0e t-Strut WallModeI ModeI
f Node on Node onTop Wa Top Wal
265 757 16990 O.02341 0.04461
266 766 1294 O.00918 O.03525
267 774 O.00074 0.00976 O.03082
268 7t_Z O.00034 O. 00999 O.02831
209 790 1890 0.01248 0.01581
270 798 5957 0•00870 O.02119
27! 806 712 O.01295 0•02656
272 814 2647 0.01614 0.03173
273 822 682 O.01875 0.03498
274 832 76 O.02084 O.03704
275 841 496 O.03257 0.03768
276 850 0.02258 0,0081I 0.03846
277 842 O.00021 O.02038 O.03659
278 833 359 O. 0185_ O. 03400
270 R23 05 0,0165_ 0.02949
28q 815 2161 O.01406 0.02327
281 807 786 0.01105 0.01600
282 799 7070 O.00738 O.01025
283 791 2105 O. 00991 O. 00877
284 783 0.00020 0,01009 0.01769
285 775 720 0.01060 0.02353
2UO 7O7 O. 00092 O. 01057 O. 0_0"27
NOTE: 1 If compression is greater than zero, no separation exists.
2 If separation is greater than zero, no compression exists.
3 Where no value is listed, the value is zero.
121
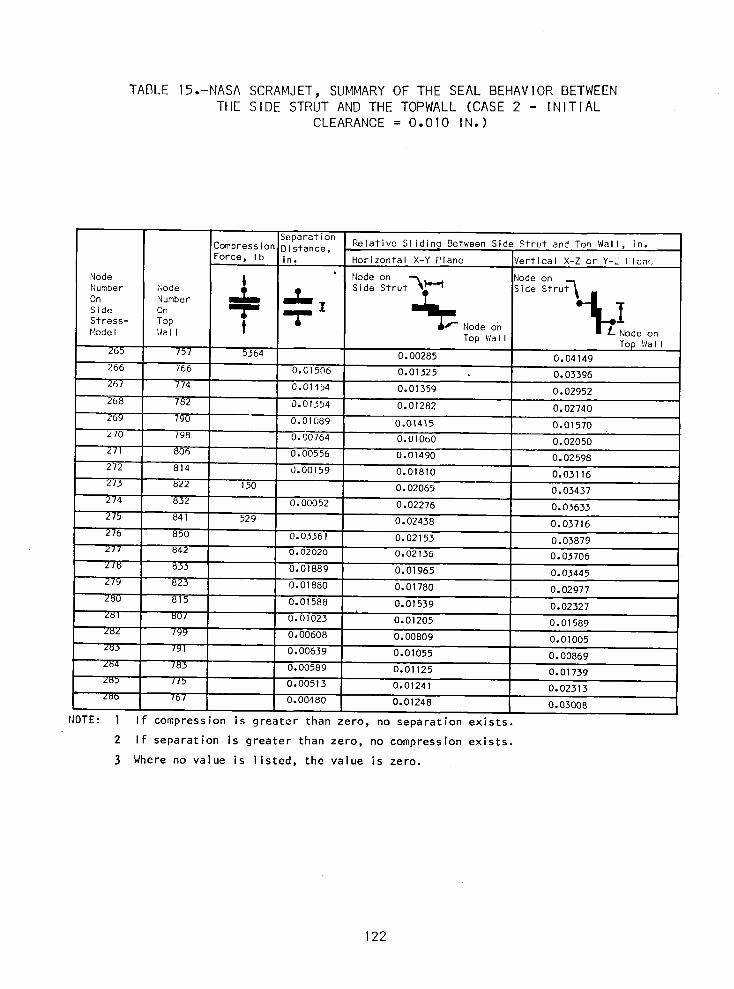
TABLE 15.-NASA SCRAMJET, SUMMARY OF THE SEAL BEHAVIOR BETWEENTHE SIDE STRUT AND THE TOPWALL (CASE 2 - INITIAL
CLEARANCE = 0.010 IN.)
Separation Relative Sliding Between Side Strut and Ton Wall, in.Compression D istance,Force, Ib in. Horizontal X-Y Plane Certical X-Z Y-_ [ lone;
Node _ Node on Node onNumber Node Side Strut _ide Strut _ ,
Number
Stress-Side TopOn _r ElI Node on _-_
Model Wall Top Vlall Node onTop Wel I
265 757 5364 O.00285 0.04!49
266 766 O.C1506 0.01325 0.03396
267 774 0.G1454 0.01359 0.02952
288 782 0.01354 0.01282 0.02740
269 790 0.01089 O.01415 O.01570
270 798 0.00764 O.U!060 0•02050
271 806 0.00556 O.01490 O.02598
272 814 0.00159 0.01810 0.03116
273 822 150 O.02065 O.03437
274 832 O.00052 0.02276 O.03633
275 841 529 O.02438 O.03716
276 850 O.0336! O.02153 0.03879
277 842 0.02020 0.02136 0.03706
Z18 853 0.01889 0.01965 0.03445
279 823 O.O!880 O.Of780 O.02977
280 815 O.O1588 O.01539 O.02327
ZUl 807 0.01023 ' 0.01205 0.01589
z_z 799 O. 00608 O. 00809 O. 01005
z_b 79! 0.00639 0.01055 0.00869
ZU4 783 0.00589 0.01125 0.01739
Z_) II) 0.00513 0.01241 0.02313
z_b 767 0.00480 0.01248 0.03008
1 If compression is greater than zero, no separation exists.
2 If separation is greater than zero, no compression exists.
3 Where no value is listed, the value is zero.
122
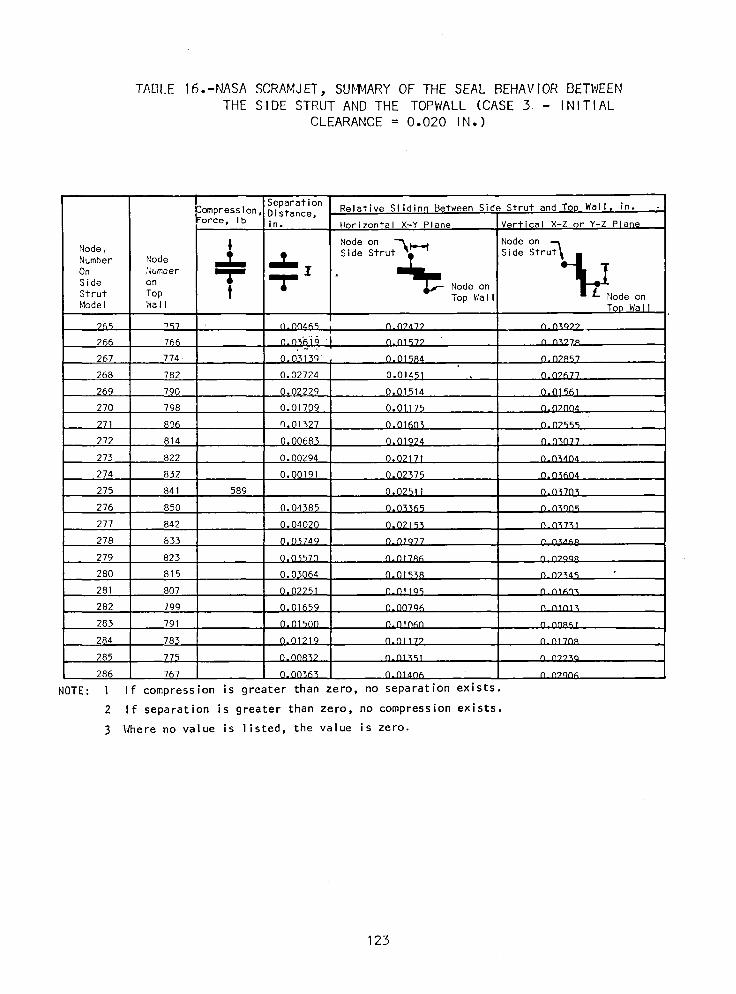
TABLE 16.-NASA SCRAMJE7, SUIVlVIARYOF THE SEAL BEHAVIOR BETWEENTHE SIDE STRUT AND THE TOPWALL (CASE 3 - INITIAL
CLEARANCE = 0.020 IN.)
Separation Relative Slidinq Between Side Strut and Top WallI in.Compress ion, Distance,Force, Ib in. Horizontal X-Y Plane Vertiqal X-Z or Y-Z Plan_
°n t_ Node on °n uAq I
Node. _ Node NodeNumber Node Side Stru Side Str
_umber _ , ISide on A
Strut Top T Top Wall Node onModel Wal I TQp Wal I
769 '97 n.nn4_ ft. nTq77 n_n-_q_?
266 766 O,O}_i9 n.ns_7? n nx_7_
267 774 O. 03130 O. 015_4 O.07657
268 782 0.02724 0.01451 0,n7677
269 790 0.02229 0.01514 0.01561
270 798 0.01709 Q,O1.175 0-0?004
271 806 q. O1%27 0.01603 O.D7999
272 814 0,00683 0.01924 0.D3f177
273 822 O. 00294 O. 02171 n. nf4o 4
274 832 O.O0191 O.02375 O.03604
275 841 589 0.0251 I o.057n3
276 850 O.04385 O.03365 n n_on9
277 842 0.04020 Q,Q2 ]_} n_n_7_l
278 833 0.03749 0.01977 0 _xa_9
279 823 Q,03570 0,fi1785 n ngoQq
280 815 O.03064 O.0153{} 0.07_49
281 807 Q,02251 N.o! 19_ n_nl_n_
282 199 0,016_9 0-00796 n nlnt_
283 791 O.01500 O,01060 n_nnmmi
284 783 0.01219 N.N1177 n.nl7NR
285 775 o.on_57 fl,01_91 n n99xq
286 767 0.0056% 0-01406 n ngon6
1 f compression is greater than zero, no separation exists.
2 If separation is greater than zero, no compression exists.
3 Where no value is listed, the value is zero.
123
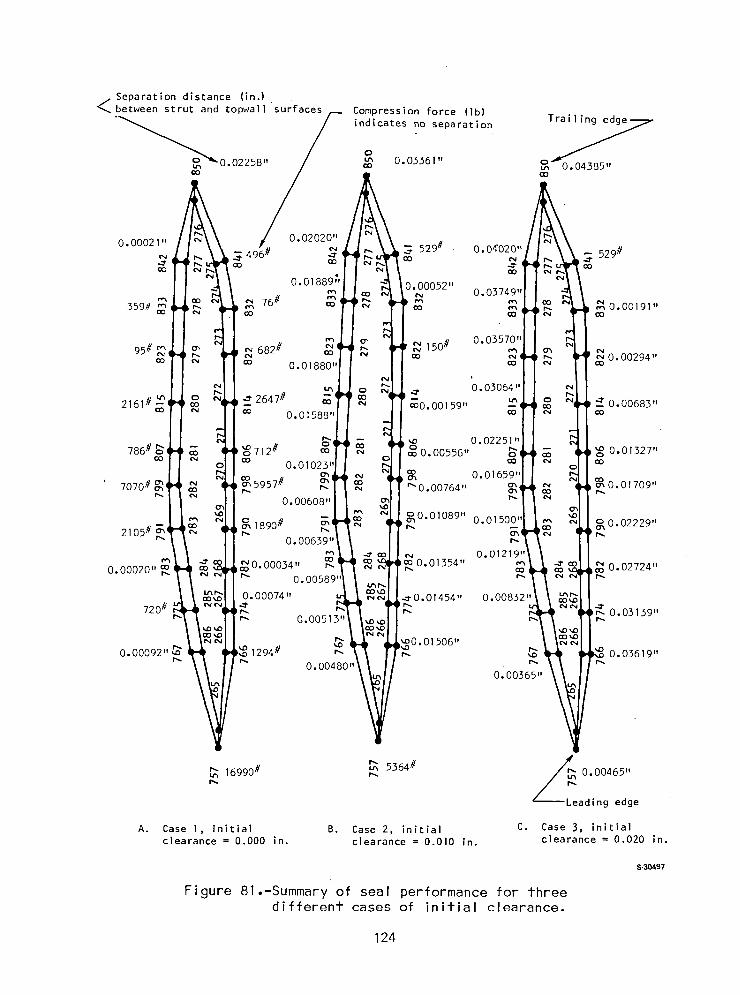
~5?, 0.04385"co
0.00365"
o:£ 0.03361"
Compression force lib)indicates no separation
0.00021" 0.02020"529# 0.04"020" 529#
N.:rco
0.00052" 0.03749"76#
N...... ...... ......~ 0.00191"359# ...... co ......co co co
......N 150# 0.03570"
95# ~ 0" NN ...... C"I N..... co co N ..... ~ 0.00294"co N 0.01880" co N
N
VI..... 0.03064"N .:r
2161# ~ 0 co VI :: 0.00683"co coO.00159"co N 0.01588" co co
.....~ 0.02251"
786# E:;-o co g 0.00556" ..... '(g 0.01327"co co N 0co N co co
co 0.01659"C"I~0.01709"7070# ~ ..... 0.00764" C"I
C"I ..........0.00608" .....
C"I~0.01089" 0.01500" ~ 0.02229"
2105# ;; ..... ..... ..........N
~ 0.00034" 'ie. 0.01354" ~ 0.02724"..... 0.00589" .....
0.00074" .:r O. 01454".:r .....
;:t. 0.03139"..... .......... .....
< Separat ion distance (in.)between strut and topwall surfaces
'~0'02258"co
~ 0.00465"
:ading edge
A. Case I, initialclearance = 0.000 in.
B. Case 2, initialclearance = 0.010 in.
C. Case 3. initialclearance = 0.020 in.
S-30497
Figure 81.-Summary of seal performance for threedifferent cases of initial clearance.
124
of nodes on the strut and topwall surfaces. The displacements parallel to the
surfaces are more readily accommodated than those normal to the surfaces; assuch, the latter are discussed in more detail. For the first two cases withinitial clearance of 0.000 in. and 0.010 in., respectively, the side strut andthe topwall come in contact at the leading edge and develop a high contact force.This situation could occur either due to an actual clearance of the value speci-fied or by a rather rigid seal which would support the interface load with adeflection of the value specified. A force of this magnitude could cause surfacedamage over the small surface area of the leading edge. However, if the initialclearance is increased to 0.020 in., the side strut and the topwall remain separ-ated by 0.0046 in., and no contact force is developed. This is a much moredesireable situation. However, at the trailing edge, the side strut and thetopwall are separated by 0.044 in_.,indicating that in addition to the initialspecified clearance of 0.020 in., the two surfaces have moved further apart by0.024 in. In this case, the seal must be capable of accommodating the extraseparation of 0.024 in. in order to prevent leakage.
Any increase in initial clearance larger than 0.020 in. aggravates thesituation by the resulting increase in the separation of the side strut andthe topwall at the trailing edge. Thus, a seal design that represents an initialclearance of around 0.020 in. appears to offer an acceptable and near optimumsolution. A seal that will provide sealing over a deflection range of 0.02in. in compression to 0.024 in. in expansion while maintaining some resiliencywill meet this requirement. Although details of the seal design have not beendefined, the seal requirements identified in this analysis appear consistentwith the seal design concept depicted in the layout drawings.
The deflections at the nodes equivalent to the top edge of the SPAR sidestrut model summarized in Table 17 are included from the Case 3 analysis,having an initial clearance of 0.020 in. These deflections can be specifiedas imposed deflections on the SPAR strut model for further analysis if desired.
Primary Structure
Three-dimensional finite element models.--The original reference designof the primary structure used a combination of beams and honeycomb to containthe high-pressure airflow. The concept, shown in fig. 82, included sevenbeams located parallel to the engine sweep line. Details shown in fig. 82include the clip concept used to secure the beams to the honeycomb (the clipconcept is discussed in ref. 3).
Two other structural concepts were considered in this study. The firstis similar to the reference design except that the beams are oriented verti-cally (normal to the airflow). The second is an all-honeycomb design in whichmost of the beams were eliminated in favor of a thicker honeycomb structure.
125
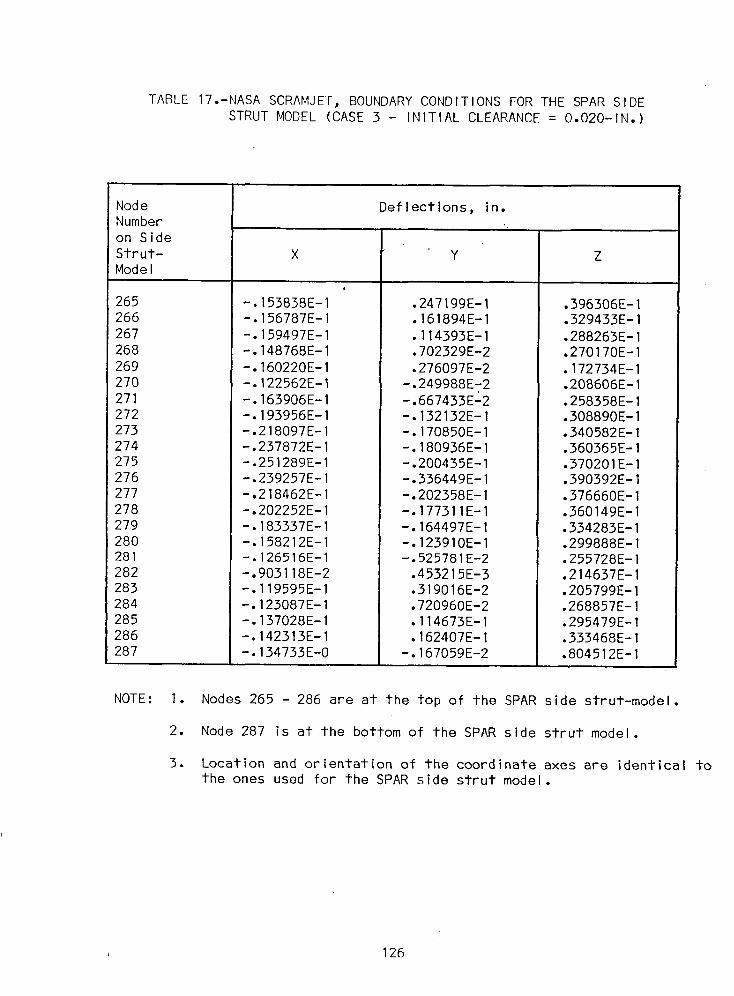
TABLE 17.-NASA SCRAMJEF, BOUNDARY CONDITIONS FOR THE SPAR SIDESTRUT MODEL (CASE 3 - INITIAL CLEARANCE = O.020-1N.)
Node Deflections, in.Numberon Side
Strut- X Y ZModel
265 -.153838E-I .247199E-I .396306E-I266 -.156787E-I .161894E-I .329433E-I267 -.159497E-I .114393E-I .288263E-I268 -.148768E-I .702329E-2 .270170E-I269 -.160220E-I .276097E-2 .172734E-I270 -.122562E-1 -.249988E-2 .208606E-1271 -.163906E-1 -.667433E-2 .258358E-1272 -.193956E-1 -.132132E-1 .308890E-1273 -.218097E-1 -.170850E-1 .340582E-1274 -.237872E-1 -.180936E-1 .360365E-1275 -.251289E-I -.200435E-I .370201E-I276 -.239257E-I -.336449E-I .390392E-I277 -.218462E-I -.202358E-I .376660E-I278 -.202252E-I -.177311E-I .360149E-I279 -.183337E-I -.164497E-1 .334283E-I280 -.158212E-I -.123910E-I .299888E-I281 -.126516E-I -.525781E-2 .255728E-I282 -.903118E-2 .453215E-3 .214637E-I283 -.119595E-I .319016E-2 .205799E-I284 -.123087E-I .720960E-2 .268857E-I285 -.137028E-I .114673E-I .295479E-I286 -.142313E-I .162407E-I .333468E-I287 -.134733E-0 -.167059E-2 .804512E-I
NOTE: I. Nodes 265 - 286 are at the top of the SPAR side strut-model.
2. Node 287 is at the bottom of the SPAR side strut model.
3. Location and orientation of the coordinate axes are identical tothe ones used for the SPAR side strut model.
126
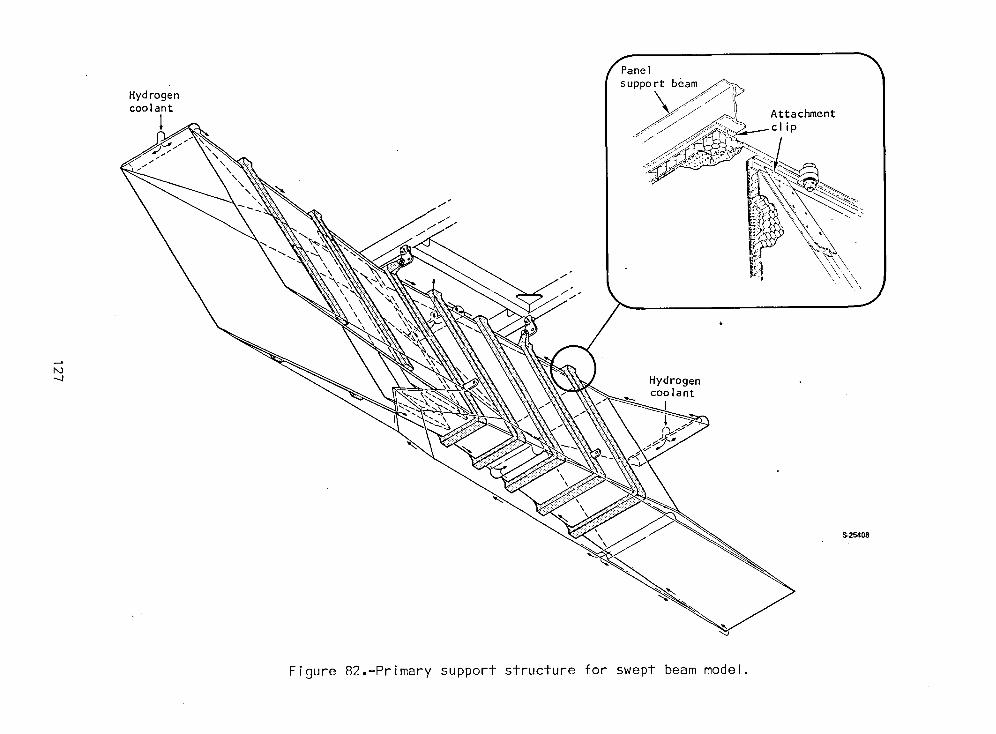
_aPane Isupport beam
Hydrogencoolant Attachment
l ip
_a Hydrogencoolant
,%254O8
Figure 82.-Primary support structure for swept beam model.
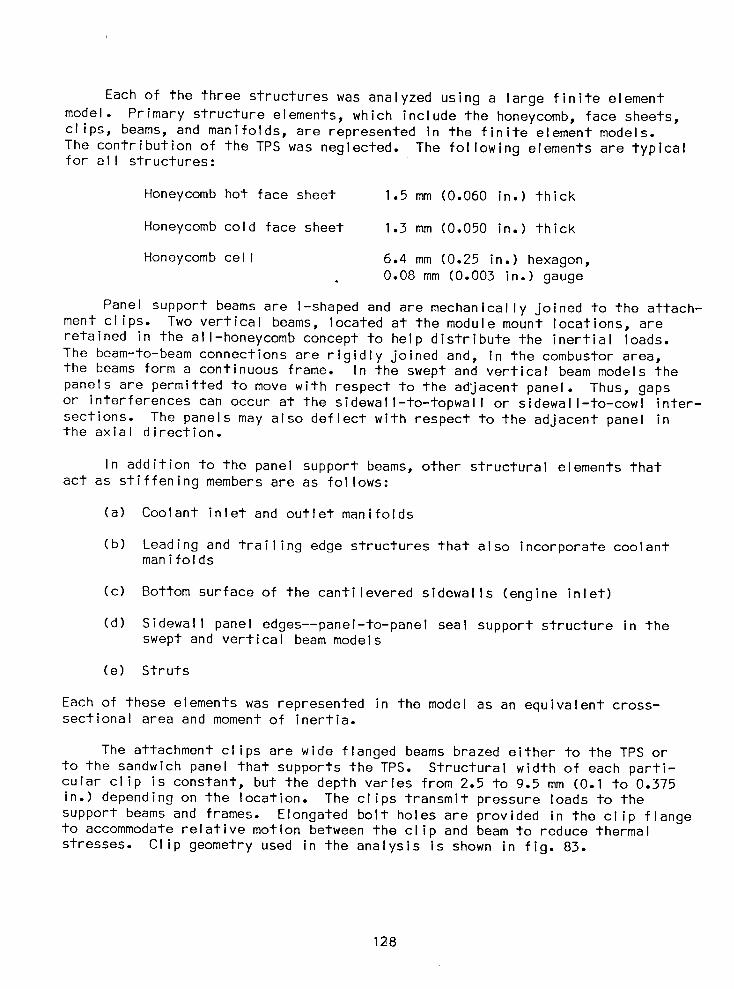
Each of the three structures was analyzed using a large finite element
model. Primary structure elements, which include the honeycomb, face sheets,clips, beams, and manifolds, are represented in the finite element models.The contribution of the TPS was neglected. The following elements are typicalfor all structures:
Honeycomb hot face sheet 1.5 mm (0.060 in.) thick
Honeycomb cold face sheet 1.3 mm (0.050 in.) thick
Honeycomb cell 6.4 mm (0.25 in.) hexagon,. 0.08 mm (0.003 in.) gauge
Panel support beams are l-shaped and are mechanically joined to the attach-ment clips. Two vertical beams, located at the module mount locations, areretained in the all-honeycomb concept to help distribute the inertial loads.The beam-to-beam connections are rigidly joined and, in the combustor area,the beams form a continuous frame. In the swept and vertical beam models thepanels are permitted to move with respect to the adjacent panel. Thus, gapsor interferences can occur at the sidewall-to-topwall or sidewall-to-cowl inter-sections. The panels may also deflect with respect to the adjacent panel inthe axial direction.
In addition to the panel support beams, other structural elements thatact as stiffening members are as follows:
(a) Coolant inlet and outlet manifolds
(b) Leading and trailing edge structures that also incorporate coolantmanifolds
(c) Bottom surface of the cantilevered sidewalls (engine inlet)
(d) Sidewall panel edges--panel-to-panel seal support structure in theswept and vertical beam models
(e) Struts
Each of these elements was represented in the model as an equivalent cross-sectional area and moment of inertia.
The attachment clips are wide flanged beams brazed either to the TPS orto the sandwich panel that supports the TPS. Structural width of each parti-cular clip is constant, but the depth varies from 2.5 to 9.5 mm (0.1 to 0.375in.) depending on the location. The clips transmit pressure loads to the
support beams and frames. Elongated bolt holes are provided in the clip flangeto accommodate relative motion between the clip and beam to reduce thermalstresses. Clip geometry used in the analysis is shown in fig. 83.
128
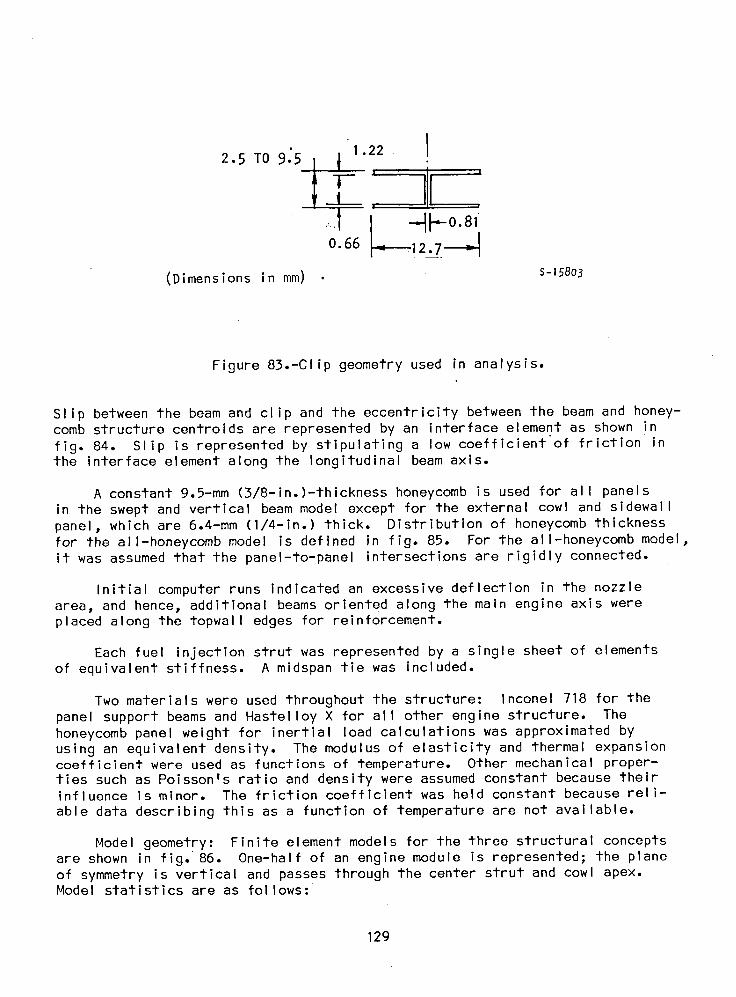
2.5To9:5 i .22 ]t....I ql--o.8,0.66 -'-'-----I 2 •7----_
(Dimensions in mm) , s-158o3
Figure 83.-Clip geometry used in analysis.
Slip between the beam and clip and the eccentricity between the beam and honey-comb structure centroids are represented by an interface element as shown in
fig. 84. Slip is represented by stipulating a low coefficient of friction inthe interface element along the longitudinal beam axis.
A constant 9.5-mm (3/8-in.)-thickness honeycomb is used for all panelsin the swept and vertical beam model except for the external cowl and sidewallpanel, which are 6.4-mm (1/4-in.) thick. Distribution of honeycomb thicknessfor the all-honeycomb model is defined in fig. 85. For the all-honeycomb model,it was assumed that the panel-to-panel intersectiens are rigidly connected.
Initial computer runs indicated an excessive deflection in the nozzlearea, and hence, additional beams oriented along the main engine axis wereplaced along the topwall edges for reinforcement.
Each fuel injection strut was represented by a single sheet of elementsof equivalent stiffness. A midspan tie was included.
Two materials were used throughout the structure: Inconel 718 for thepanel support beams and Hastelloy X for all other engine structure. Thehoneycomb panel weight for inertial load calculations was approximated byusing an equivalent density. The modulus of elasticity and thermal expansioncoefficient were used as functions of temperature. Other mechanical proper-ties such as Poisson's ratio and density were assumed constant because theirinfluence is minor. The friction coefficient was held constant because reli-
able data describing this as a function of temperature are not available.
Model geometry: Finite element models for the three structural conceptsare shown in fig. 86. One-half of an engine module is represented; the planeof symmetry is vertical and passes through the center strut and cowl apex.Model statistics are as follows:
129
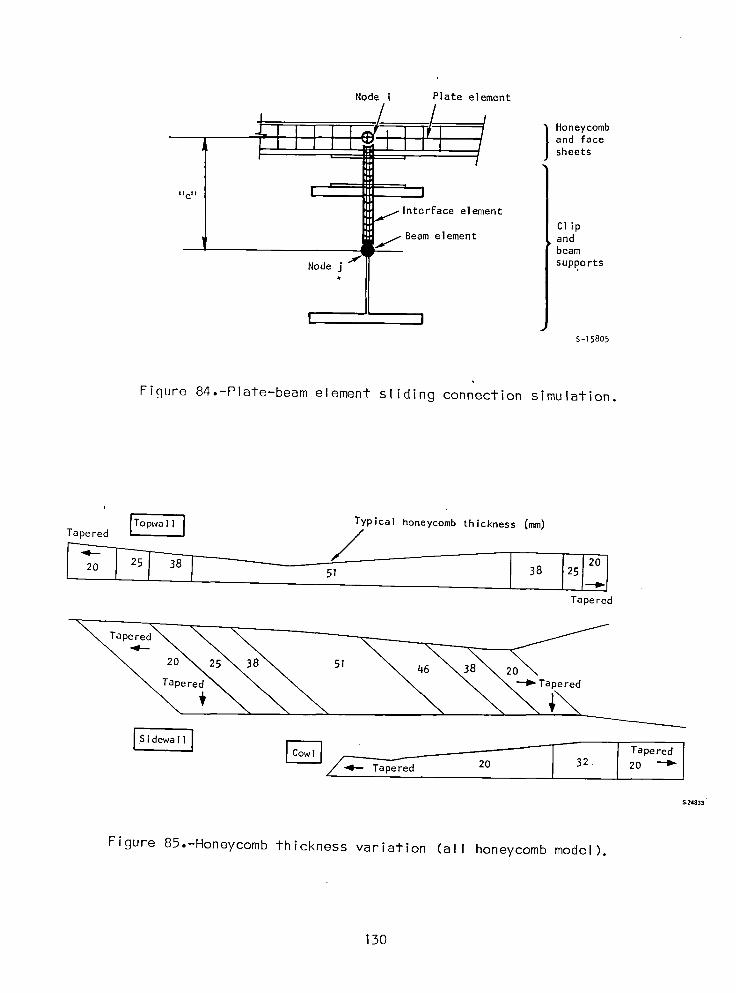
Node i Plate element
Honeycomb
and facesheets
ilell
Interface el ement
CIipBeam element and
beam
Node j supports
I IS-15805
Figure 84.-Plate-beam element sliding connection simulation.
i
Tapered I T°pwa]] I Typical honeycomb thickness (ram)
1,8i.,1:o!Tapered
ISidewall 1 Tapered
_///_'-_a pered 20 32. 20
$24833
Figure 85.'Honeycomb thickness variation (all honeycomb model).
130
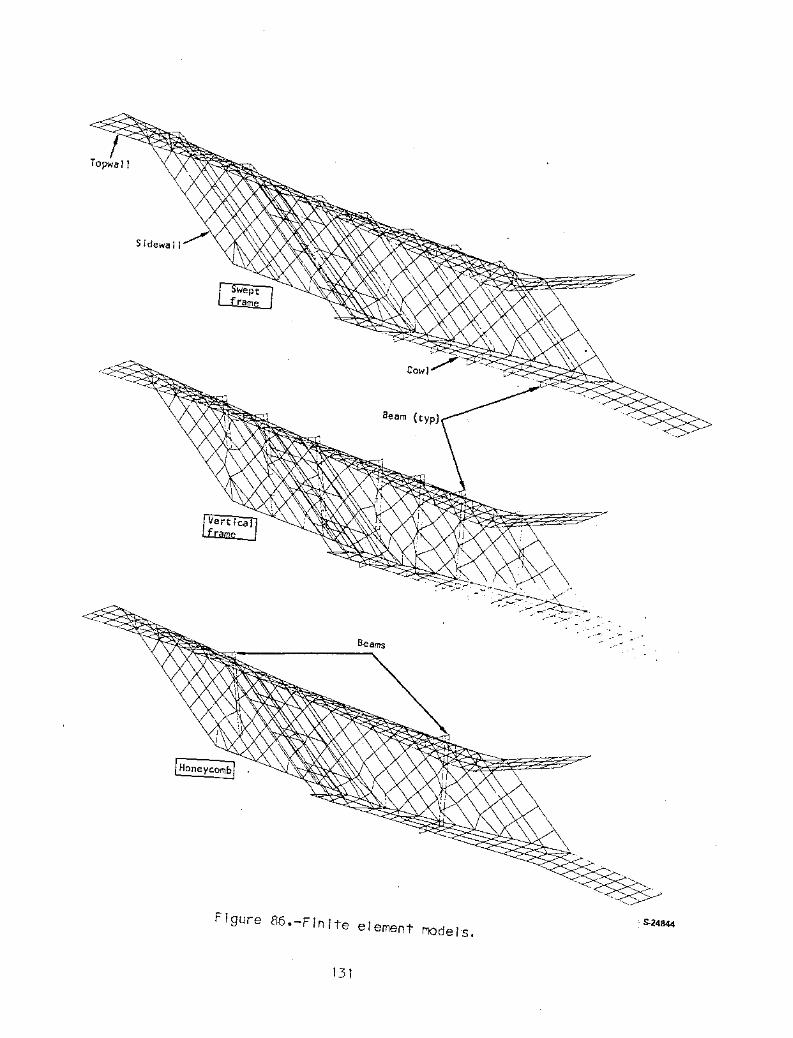
Figure 86.-Finite element models.
131
i 5-24844
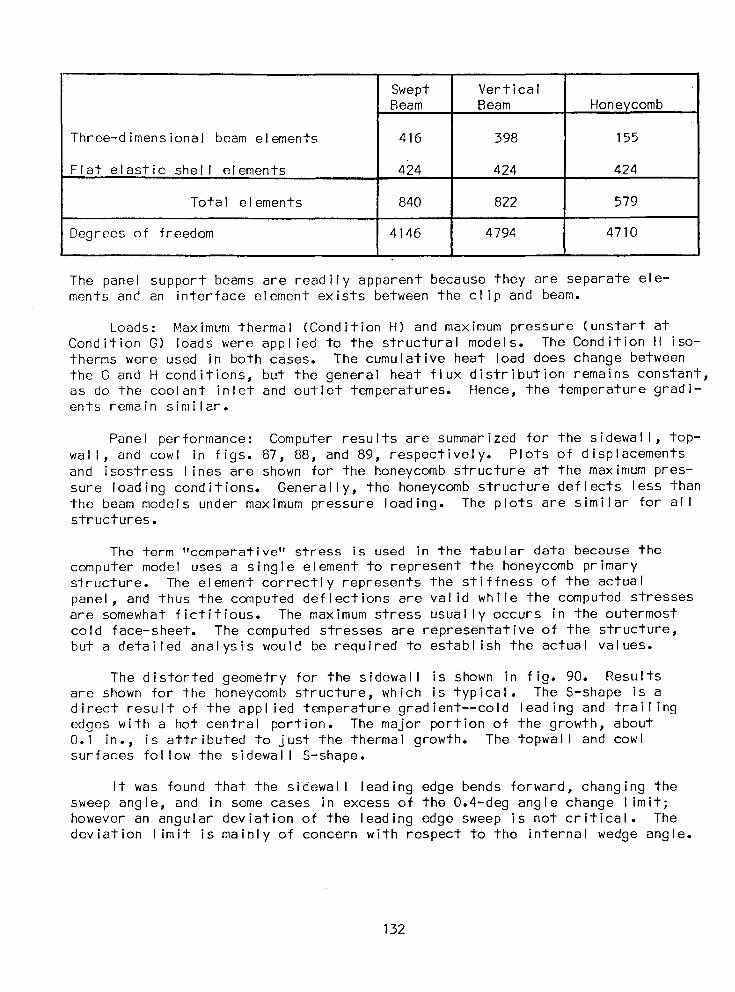
Swept VerticalBeam Beam Honeycomb
Three-dimensional beam elements 416 398 155
Flat elastic shell elements 424 424 424
Total elements 840 822 579
Degrees of freedom 4146 4794 4710l
The panel support beams are readily apparent because they are separate ele-ments and an interface element exists between the clip and beam.
Loads: Maximum thermal (Condition H) and maximum pressure (unstart atCondition G) loads were applied to the structural models. The Condition H iso-therms were used in both cases. The cumulative heat load does change betweenthe G and H conditions, but the general heat flux distribution remains constant,as do the coolant inlet and outlet temperatures. Hence, the temperature gradi-ents remain similar.
Panel performance: Computer results are summarized for the sidewall, top-wall, and cowl in figs. 87, 88, and 89, respectively. Plots of displacementsand isostress lines are shown for the honeycomb structure at the maximum pres-sure loading conditions. Generally, the honeycomb structure deflects less thanthe beam models under maximum pressure loading. The plots are similar for allstructures.
The term "comparative" stress is used in the tabular data because thecomputer model uses a single element to represent the honeycomb primarystructure. The element correctly represents the stiffness of the actualpanel, and thus the computed deflections are valid while the computed stressesare somewhat fictitious. The maximum stress usually occurs in the outermostcold face-sheet. The computed stresses are representative of the structure,but a detailed analysis would be required to establish the actual values.
The distorted geometry for the sidewall is shown in fig. 90. Resultsare shown for the honeycomb structure, which is typical. The S-shape is adirect result of the applied temperature gradient--cold leading and trailingedges with a hot central portion. The major portion of the growth, about0.1 in., is attributed to just the thermal growth. The topwall and cowlsurfaces follow the sidewall S-shape.
It was found that the sidewall leading edge bends forward, changing thesweep angle, and in some cases in excess of the 0.4-deg angle change limit;however an angular deviation of the leading edge sweep is not critical. Thedeviation limit is mainly of concern with respect to the internal wedge angle.
132
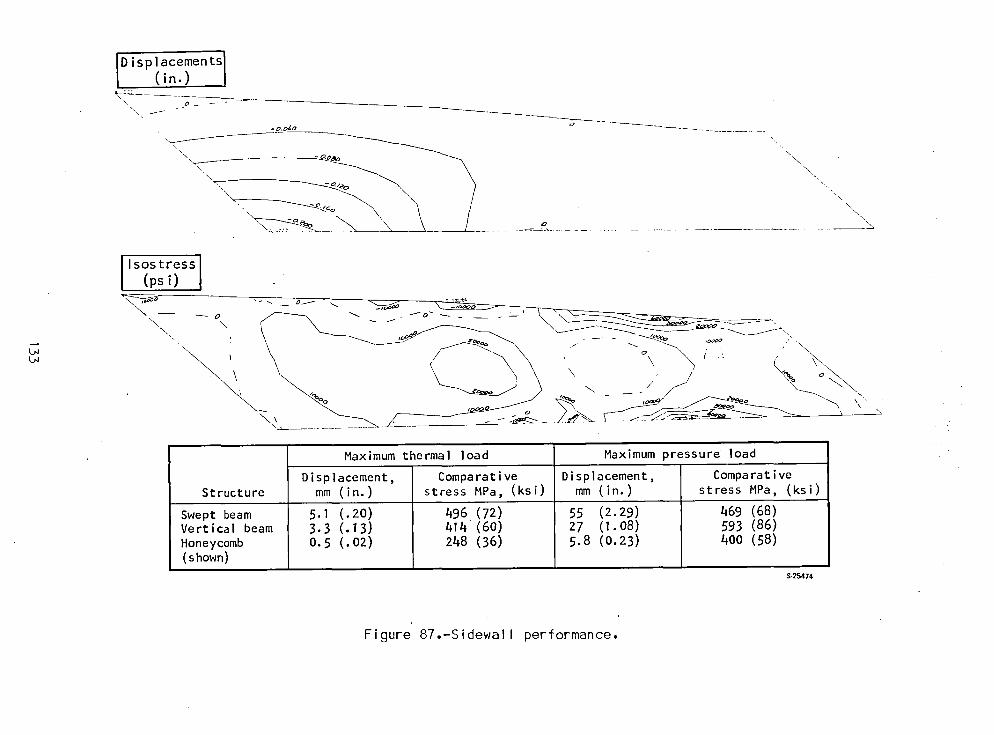
ID ispIacemen tsI(in.) I\
\
. -o.o4o o
"\ x z_ '\'\\
llsostress I(ps i)
\ \ < \ \ \x _ \_
\_ - ..
Maximum thermal load Maximum pressure load
Displacement, Comparative Displacement, ComparativeStructure mm (in.) stress MPa, (ksi) mm (in.) stress MPa, (ksi)
Swept beam 5.1 (.20) 496 (72) 55 (2.29) 469 (68)Vertical beam 3.3 (.13) 414 (60) 27 (1.08) 593 (86)
Honeycomb 0.5 (.02) 248 (36) 5.8 (0.23) 400 (58)(shown)
S-2_74
Figure 87.-Sidewall performance.
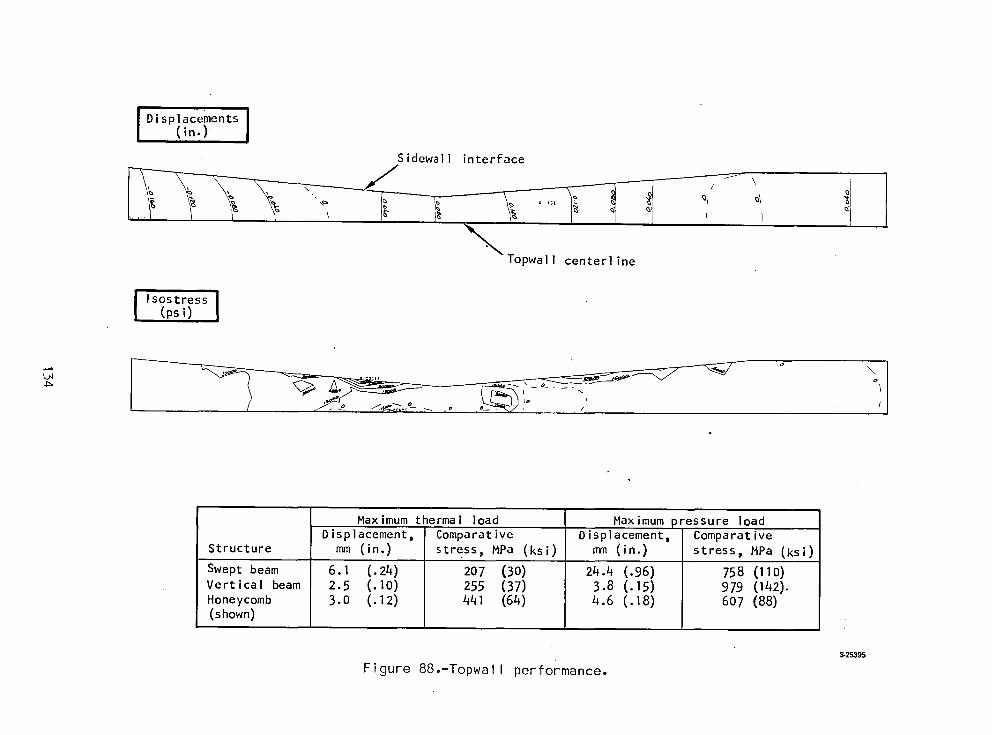
Displacements(in.) ISidewall interface
/
I II
_N'_ Topwall centerl ine
I Isostress(ps i) I
Maximum thermal load Maximum pressure loadDisplacement, Comparative Displacement, Comparative
Structure mm (in.) stress, MPa (ksi) mm (in.) stress, MPa (ksi)
Swept beam 6.1 (.24) 207 (3O) 24.4 (.96) 758 (110)Vertical beam 2.5 (.10) 255 (37) 3.8 (.15) 979 (142).Honeycomb 3.0 (.12) 441 (64) 4.6 (.18) 607 (88)(shown)
S-25395
Figure 88.-Topwall performance.

Sidewall interface
I Displacementsl(in.) _ _._
_"Topwall centerline
I lsostressI
(psi) II_ 0
\ oi\ 0
Ln
Maximum thermal load Maximum pressure load
Displacement, Comparative Displacement, Comparative
Structure mm (in.) stress,-MPa (ksi) mm (in.) stress, MPa (ksi)
• Swept beam 2.0 (.08) 724 (105) 2.5 (.I0) 1090 (I58)Vert4cal beam 1.0 (.04) 634 (92) 1.0 (.04) 607 (88)"Honeycomb 1.0 (.04) 1160 (168) 1.0 (.04) 1150 (167)(shown)
IS-25475
Figure 89.-Cowl performance.
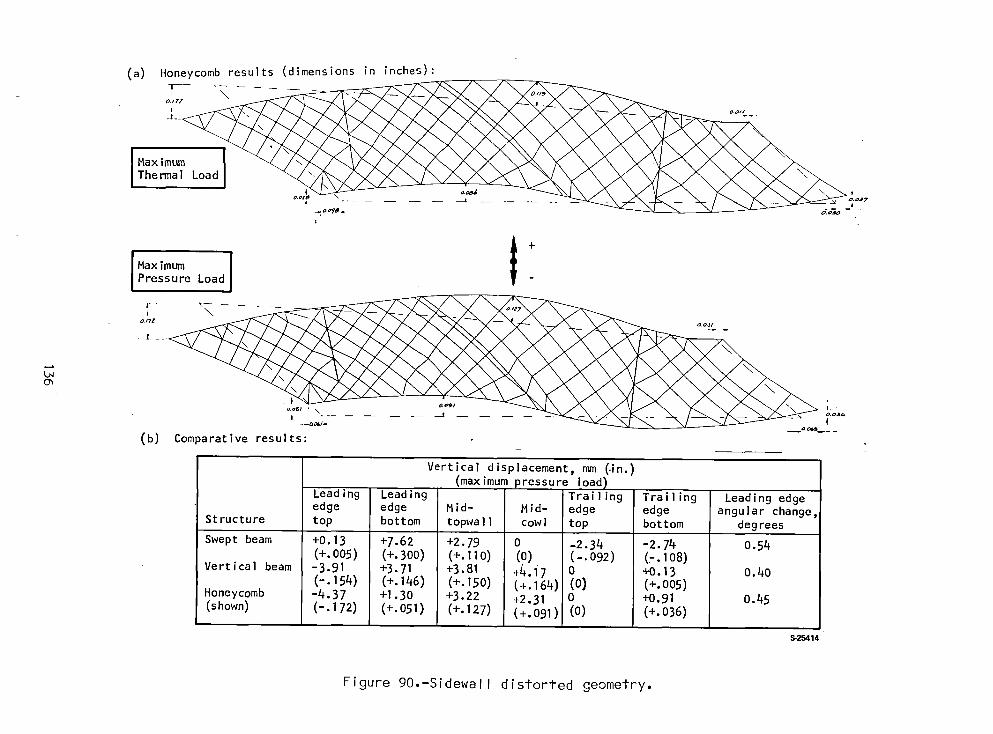
(a) Honeycomb results (dimensions in inches):
, \I o.o/i
.j_ ---
l Max imum IThermal Load
o.ol_ i
t+Max imumPressure Load
I " t_T'- -- -- -- --I \
OITZ OoJl
I.
L_
I.
J I
(b) Comparative results:
Vertical displacement, mm (.in.)(maximum pressure load)
Leading Leading Trailing Trailing Leading edgeedge edge Mid- Mid- edge edge angular change,
Structure top bottom topwa ]I cowl top bottom degrees
Swept beam +0.13 +7.62 +2.79 0 -2.34 -2.74 0.54(+. 005) (+. 300) (+.II0) (0) (-.092) (-. I08)
Vertical beam -3.91 +3.71 +3.81 +4.17 0 +O.13 0.40(-. 154) (+. 146) (+.150) (+.164) (0) (+.005)
Honeycomb -4.37 +I.30 +3.22 +2.31 0 +0.91 0.45
(shown) (-.172) (+.051) (+.127) (+.091) (0) (+.036)
S-25414
Figure 90.-Sidewall distorted geometry.
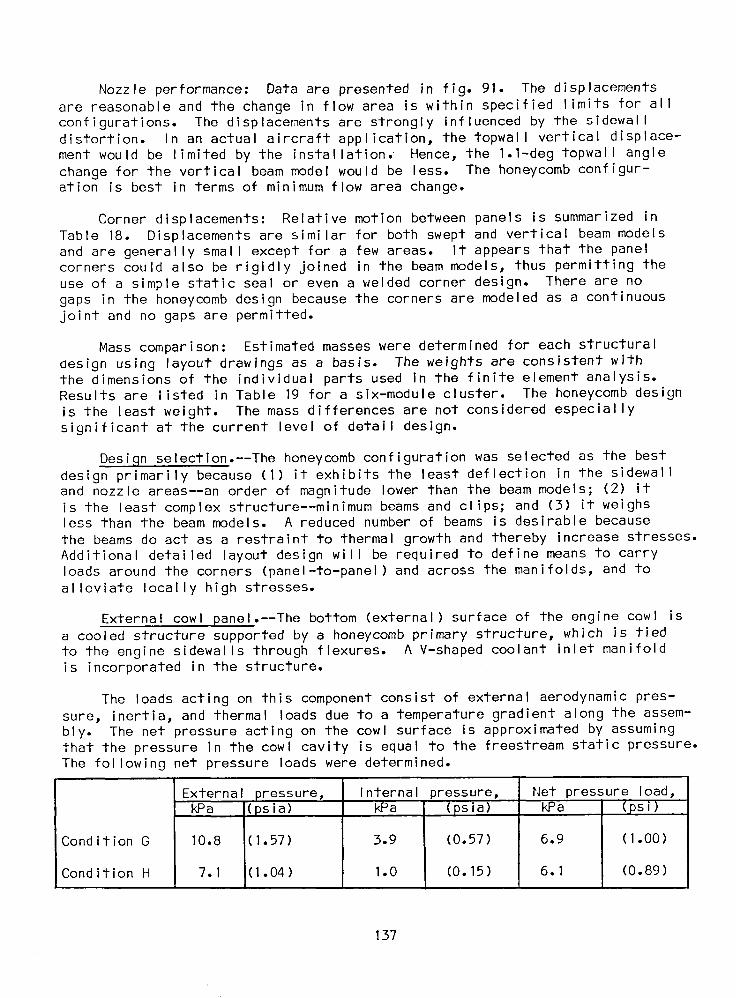
Nozzle performance: Data are presented in fig. 91. The displacementsare reasonable and the change in flow area is within specified limits for allconfigurations. The displacements are strongly influenced by the sidewalldistortion. In an actual aircraft application, the topwall vertical displace-ment would be limited by the installation. Hence, the 1.1-deg topwall anglechange for the vertical beam model would be less. The honeycomb configur-ation is best in terms of minimum flow area change.
Corner displacements: Relative motion between panels is summarized inTable 18. Displacements are similar for both swept and vertical beam modelsand are generally small except for a few areas. It appears that the panelcorners could also be rigidly joined in the beam models, thus permitting theuse of a simple static seal or even a welded corner design. There are nogaps in the honeycomb design because the corners are modeled as a continuousjoint and no gaps are permitted.
Mass comparison: Estimated masses were determined for each structural_esign using layout drawings as a basis. The weights are consistent withthe dimensions of the individual parts used in the finite element analysis.Results are listed in Table 19 for a six-module cluster. The honeycomb design
is the least weight. The mass differences are not considered especiallysignificant at the current level of detail design.
Design selection.--The honeycomb configuration was selected as the bestdesign primarily because (I) it exhibits the least deflection in the sidewalland nozzle areas--an order of magnitude lower than the beam models; (2) itis the least complex structure--minimum beams and clips; and (3) it weighsless than the beam models. A reduced number of beams is desirable because
the beams do act as a restraint to thermal growth and thereby increase stresses.Additional detailed layout design will be required to define means to carryloads around the corners (panel-to-panel) and across the manifolds, and toalleviate locally high stresses.
External cowl panel.--The bottom (external) surface of the engine cowl isa cooled structure supported by a honeycomb primary structure, which is tiedto the engine sidewalls through flexures. A V-shaped coolant inlet manifoldis incorporated in the structure.
The loads acting on this component consist of external aerodynamic pres-sure, inertia, and thermal loads due to a temperature gradient along the assem-bly. The net pressure acting on the cowl surface is approximated by assumingthat the pressure in the cowl cavity is equal to the freestream static pressure.The following net pressure loads were determined.
External pressure, Internal pressure, Net pressure load,kPa (psia) kPa (psia) kPa (psi)
Condition G 10.8 (1.57) 3.9 (0.57) 6.9 (1.00)
Condition H 7.1 (1.04) 1.0 (0.15) 6.1 (0.89)
137
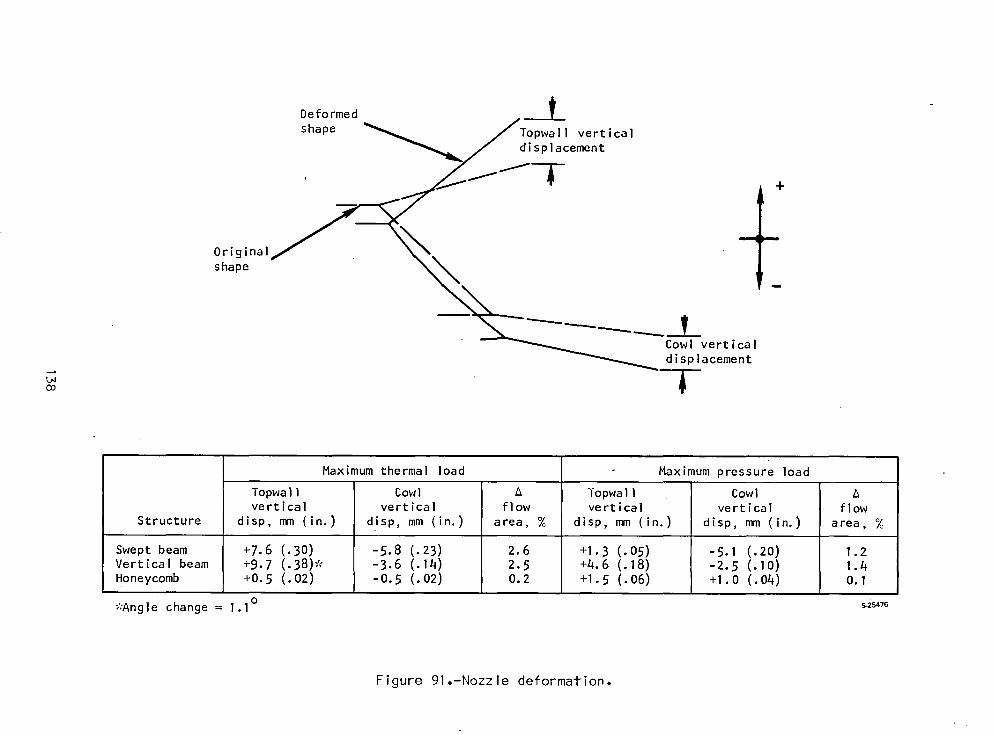
Deformed _ -_L
shape _ JTopwa ]I vertical
displacement
.
---Originalshape
Cowl verticaldisplacement
Maximum thermal load Maximum pressure load
TopwaI1 Cowl A TopwaI1 Cowl Avertical vertical flow vertical vertical flow
Structure disp, mm (in.) disp, mm (in.) area, % disp, mm (in.) disp, mm (in.) area,
Swept beam +7.6 (.30) -5.8 (.23) 2.6 +1.3 (.05) -5.1 (.20) 1.2Vertical beam +9.7 (.38)* -3.6 (.14) 2.5 +4.6 (.18) -2.5 (.10) 1.4Honeycomb +0.5 (.02) -0.5 (.02) 0.2 +1.5 (.06) +1.0 (.04) 0.1
*Angle change = 1.1 ° s_is4_6
Figure 91.-Nozzle deformation.
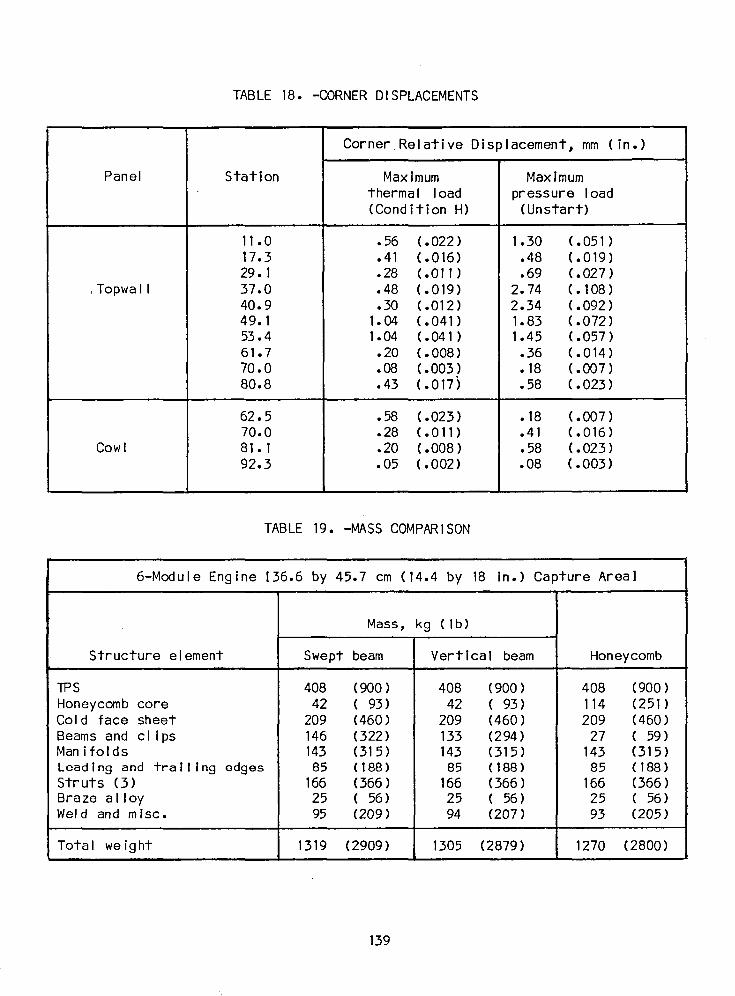
TABLE 18. -CORNER DISPLACEMENTS
Corner Relative Displacement, mm (in.)
Panel Station Max imum Max imumthermal load pressure load(Condition H) (Unstart)
11.0 .56 (.022) 1.30 (.051)17.3 .41 (.016) .48 (.019)29. I .28 (.011) .69 (.027)
Topwall 37.0 .48 (.019) 2.74 (.108)40.9 .30 (.012) 2.34 (.092)49.1 1.04 (.041) 1.83 (.072)53.4 1.04 (.041) 1.45 (.057)61.7 .20 (.008) .36 (.014)70.0 .08 (.003) •18 (.007)80.8 .43 (.017) .58 (.023)
62.5 .58 (.023) •18 (.007)70.0 .28 (.011) .41 (.016)
Cowl 81.1 .20 (.008) .58 (.023)92.3 .05 (.002) .08 (.003)
TABLE 19. -MASS COMPARISON
6-Module Engine 136.6 by 45.7 cm (14.4 by 18 in.) Capture Areal
Mass, kg (Ib)
Structure element Swept beam Vertical beam Honeycomb,H ,,,
TPS 408 (900 ) 408 (900) 408 (900)Honeycomb core 42 (93) 42 (93) 114 (251)Cold face sheet 209 (460) 209 (460) 209 (460)Beams and clips 146 (322) 133 (294) 27 (59)Manifolds 143 (315) 143 (315) 143 (315)Lead i ng and tra i I i ng edges 85 ( 188) 85 ( 188 ) 85 ( 188 )Struts (3) 166 (366) 166 (366) 166 (366)Braze alloy 25 (56) 25 (56) 25 (56)Weld and misc. 95 (209) 94 (207) 93 (205)
Total weight 1319 (2909) 1305 (2879) 1270 (2800)
139

Thermal analysis indicate_ that the temperature of the airflow-exposedsurfaces will vary between 222 and 389 K (400° to 700°R) and the back side willbe approximately 111K (200°R) cooler.
The inplane temperature gradients are low and thermal stresses due toeither the 111K (200°R) AT between the hot and cold skin or the cowl in-planetemperature distribution will remain below the elastic limit of the material.Inertial loads were found to be negligible.
Topwall nonuniform heat flux analysis.--The heat flux on the inlet portionof the topwall is variable because the flow properties change between wave bays.The resulting nonuniform heating rate produces nonlinear temperature gradientsand a corresponding thermal stress in the cooled structure. For the topwall,tileproblenlis more complex because the surface is multiplanar. An analysis wasconducted to predict the nonlinear, two-dimensional in-plane temperature profilesalong the topwall surface. The corresponding thermal stresses were then computedand the critical stresses identified.
Two-dimensional aerodynamic heating analyses were performed on inlet andcombustor sections of the topwall surface. Earlier analyses presented resultsbased on a one-dimensional approach where the various inlet streamlines producedby the complex shock bay pattern were reduced to one streamline. This one stream-line was a composite of those producing maximum heating along the engine axis.The purpose of this task was to determine the more realistic two-dimensionalthermal loading by analyzing six distinct streamlines that best represent theshock bay pattern in the engine inlet (fig. 92). Heat fluxes were computed bythe adiabatic wall reference enthalpy method (ref. 9). This method is consistentwith the results of previous aerodynamic heating analysis, as was the engineoperating condition, Condition H.
The basic features of the top surface flow field are presented in fig. 92.The complex structure of shock wave impingements end reflections on the sidewalland struts, as well as the intersection of two shock waves, result in 16 distinctbay areas with 16 different flow properties at the engine inlet upstream to thefuel injector struts. For a comprehensive 2-D thermal analysis, various flowpaths were chosen to cover all of these bay areas. Six fluid streamlines shownin fig. 92 were chosen as representative flow paths to cover all of the 16 bayswith the exception of Bay 7, which could be dispensed with since its flow pro-perties are very close to those in Bay 6.
The shock (compression) or Mach (expansion) waves each of the streamlinesencounters and the shock bays each passes through is indicated. Table 20delineates the sequence of events for each of these streamlines. The directionof each streamline is controlled by the shock bay area and the adjacent wallsurfaces. Bay 13 (fig. 92) is an exception to this because it results fromthe intersection of two shock waves. When the intersecting waves are of differ-ent strengths, a slip line will result in the bay with two different velocities.One velocity is defined for Bay 13, which implies the absence of a slip line.The flow direction in Bay 13 is therefore taken to be parallel to the axis ofsymmetry. The one-dimensional consideration in the combustor area is noted infig. 92 for all stream lines.
140
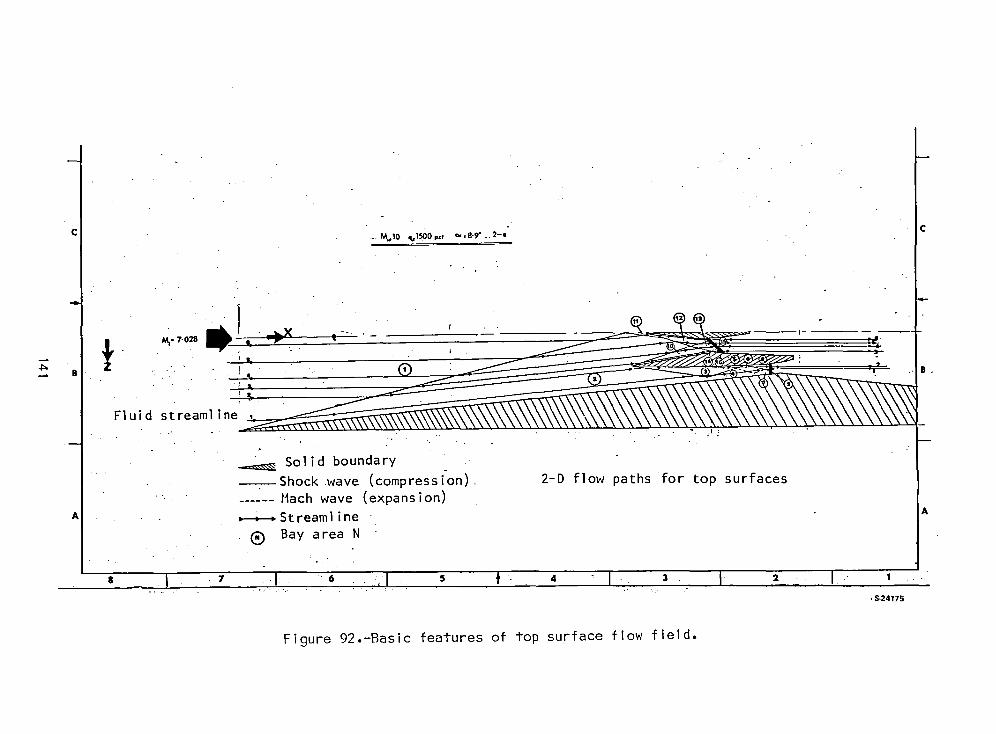
c +_.m.+,,o,,..,Imo,,,,_+,_-9"+2-. c
.' ,,1.,..-i,.
_.7-o_ ;,,4I |l
"_ B "_+"+ " ! 4, B
_._.
Fluid streamline+. . • +1
_ Solid boundary--Shock wave (compression) 2-D flow paths for top surfaces......Mach wave (expansion)
A _ Streamline A
(_) Bay area N• .
" I +7 _I + ._I s t 4 " I 3 I 2 I I, PP24175
Figure 92.-Basic features of top surface flow field.

TABLE 20.-STREAMLINE SEQUENCE OF EVENTS
Ii .....i. i.......i.....l
_'°+_ +_"_i _....1._ .....__+,o_I _.._., _a+. : !_a,,o_ : i _ .d, !_,io_ ! .... ,_ , , _,,+_ .. .,_._.r.. : ! -i+---! i..l .... _! -. :., :..................... : • _ + i :+
I i ,i i '
' . _ +-.. '. • i -! i = ' i I = ' '. , i ' ' [_ ....
.... ,.:-..... _- -:--:....... : " _ -- . ,=p_._i-_-=.......... ; -:_ _-_ot-t_m'+S_we:........ : -- " S_=f,_e__n_-_ ......
i ' i r _ . ! i . !.. :_. , , , .. i : ..
. :_-!........_. _,_._._.............__ .__d=-_=r,,,=_._.:.... _ ,.._ _'+-',_......... +....... S_=_,U-....... ____ s,_.S_r_t_o_to=l l ' ' I !RO_._lll_l_'f_l_ . __ i!l=pl_3_¢_l: i Surface Impingement 8:2 1... . . = . _ .... _ : i . _ . • -- .€')
i! .... _.i* _larompres$1on) ; : +1 (_Compr,esslon) : ...... ]_[F._.l______o_n)!..... i_. ==" (C_l_r ,Ion) :(Compression)i ' j , ,
' ¢gj_ ........... $1_d¢.WSII L,_-..i ......... 2-.._ =,.-_Id_._t.rut_L.[ ....... 10-- =. , .$1deS£rut. ; ..... I__1.... Cent.at Strut=L.L 15 __ _. ,_Ide.,Strut Top . 16Ix3 ! ]. --_.- ---- ' • : • i . : : " _ ! , Top Surface ' . t __ Surface Impingement ' _"
: (€ompress oh) : ' _ ('Co_tesslbn) 'i (Expansion) i ' _ (Compression) (Cor_ress on)"", .... I ..... _ - -- :.-._ ........... , .......... : ..... - :..... :...... _................................................,, : rn
°..... !_ 13 ........ .Slide. W_il' L;E, : . . # __ --'.SJ"m S_;rut;LeE. . 1(_ .... Cenlte_ St rut; ..... '
_" (romprL'slon).-- : ,..,r_omp;esslon\ . [Compression) .
i
i '• '. Sl:de W_ll L,E._i. ..... Z -- =..Center Strut .L.:E,. 12 __ _. Side StruZ .... t3
]' 5 ------==" • L'E. -- _ _r(_pre_lon) ......... (r.o_resslon) : (CompreSsion).-
[. i . . -; : :
• ..S_l:,de.W_.]].L,E, : ].-_ _ I_- I_,E, S|de _a[_l ..... 1_-- Center Strut 126 --_,- I, - Shock:intersect:ion _" " "I-.E. " _ _--_ " _ ........ ' _:
" (O_pre.ss I an) i ' _C_pr e_s.slon) . • .:.. .(Compze_slon) . : .............+' : : + |. . .
|
:' : .... :...i. : ............. _24176
B
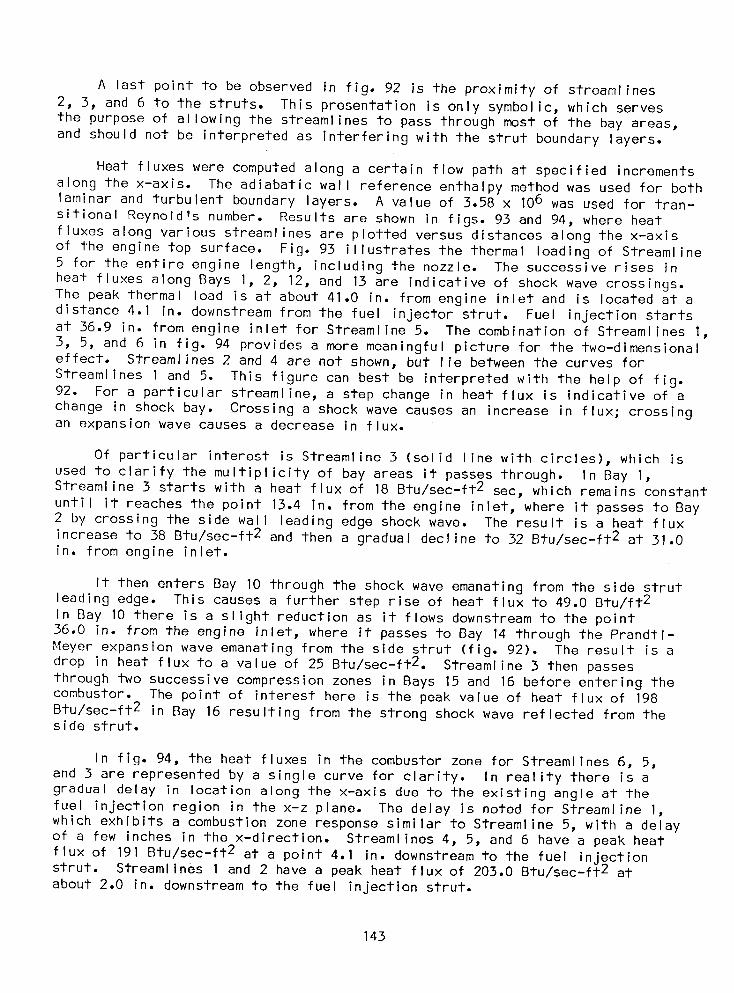
A last point to be observed in fig. 92 is the proximity of streamlines2, 3, and 6 to the struts. This presentation is only symbolic, which servesthe purpose of allowing the streamlines to pass through most of the bay areas,and should not be interpreted as interfering with the strut boundary layers.
Heat fluxes were computed along a certain flow path at specified increments
along the x-axis. The adiabatic wall reference enthalpy method was used for bothlaminar and turbulent boundary layers. A value of 3.58 x 10⁶ was used for tran-sitional Reynold's number. Results are shown in figs. 93 and 94, where heatfluxes along various streamlines are plotted versus distances along the x-axisof the engine top surface. Fig. 93 illustrates the thermal loading of Streamline5 for the entire engine length, including the nozzle. The successive rises inheat fluxes along Bays I, 2, 12, and 13 are indicative of shock wave crossings.The peak thermal load is at about 41.0 in. from engine inlet and is located at adistance 4.1 in. downstream from the fuel injector strut. Fuel injection startsat 36.9 in. from engine inlet for Streamline 5. The combination of Streamlines I,3, 5, and 6 in fig. 94 provides a more meaningful picture for the two-dimensionaleffect. Streamlines 2 and 4 are not shown, but lie between the curves for
Streamlines I and 5. This figure can best be interpreted with the help of fig.92. For a particular streamline, a step change in heat flux is indicative of achange in shock bay. Crossing a shock wave causes an increase in flux; crossingan expansion wave causes a decrease in flux.
Of particular interest is Streamline 3 (solid line with circles), which isused to clarify the multiplicity of bay areas it passes through. In Bay I,Streamline 3 starts with a heat flux of 18 Btu/sec-ft2 sec, which remains constantuntil it reaches the point 13.4 in. from the engine inlet, where it passes to Bay2 by crossing the side wall leading edge shock wave. The result is a heat fluxincrease to 38 Btu/sec-ft2 and then a gradual decline to 32 Btu/sec-ft2 at 31.0in. from engine inlet.
It then enters Bay 10 through the shock wave emanating from the side strutleading edge. This causes a further step rise of heat flux to 49.0 Btu/ft2In Bay 10 there is a slight reduction as it flows downstream to the point36.0 in. from the engine inlet, where it passes to Bay 14 through the Prandtl-Meyer expansion wave emanating from the side strut (fig. 92). The result is adrop in heat flux to a value of 25 Btu/sec-ft2. Streamline 3 then passesthrough two successive compression zones in Bays 15 and 16 before entering thecombustor. The point of interest here is the peak value of heat flux of 198Btu/sec-ft2 in Bay 16 resulting from the strong shock wave reflected from theside strut.
In fig. 94, the heat fluxes in the combustor zone for Streamlines 6, 5,and 3 are represented by a single curve for clarity. In reality there is agradual delay in location along the x-axis due to the existing angle at thefuel injection region in the x-z plane. The delay is noted for Streamline I,which exhibits a combustion zone response similar to Streamline 5, with a delayof a few inches in the x-direction. Streamlines 4, 5, and 6 have a peak heatflux of 191Btu/sec-ft 2 at a point 4.1 in. downstream to the fuel injectionstrut. Streamlines I and 2 have a peak heat flux of 203.0 Btu/sec-ft2 atabout 2.0 in. downstream to the fuel injection strut.
143
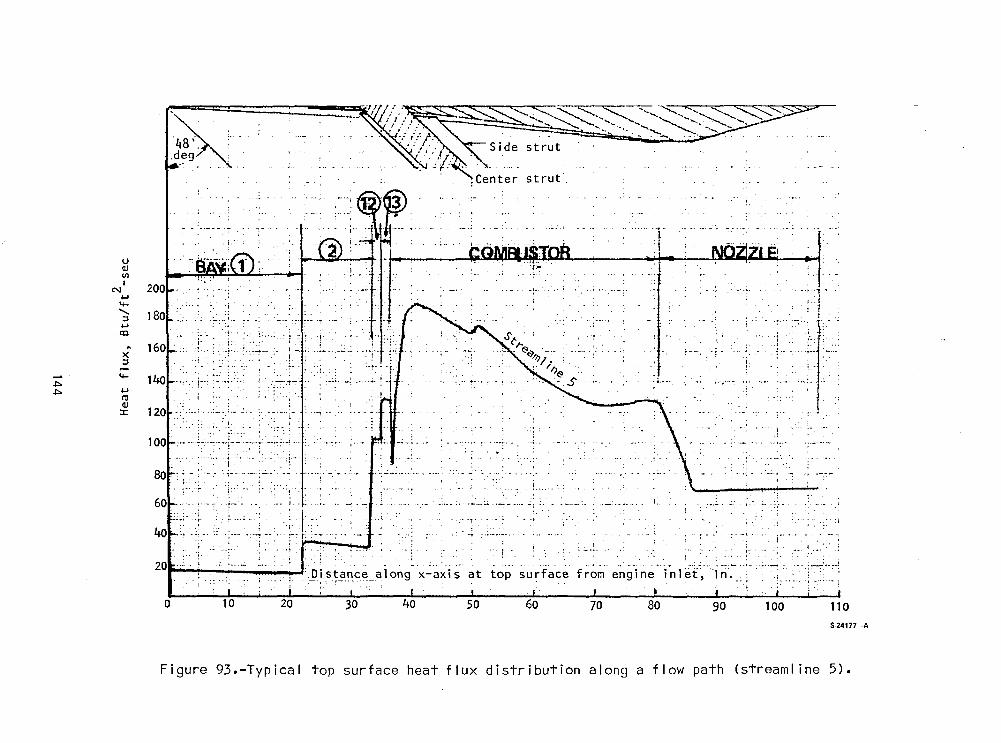
110
·1 . ,.1.1
I--:-.-'
···,:i~:--:'-!,
100
_..'
..-.....": ...
._.'
.'
...•......
80 90
.J'l
... :
e~g-i ne -i 'n I~{;"i n.
i
. . -...: •.~~
70
from
strut ..
.. L...
•• j
._._;..;. .._.- .. ,. - ...
30
,.,
...... - .. - -..-, .
.,.
. . - ..' . . ..!.- -.- -.. ·:-i~·
.~ •. j
. ,., ._.- ..
~ii:N8".deg.... ~ .. ..
- _.O' .. _r--.,..-----..........,J Distance along x-axis at---:-j -. -r:----·-·~~--· . , .
uQ)VlI
N ...4-.......:l...
·CD
ft
X:l
4-./'>../'>. ...
IIIQ)
:I:
8·24177 ·A
Figure 93.-Typical top surface heat flux distribution along a flow path (streaml ine 5).
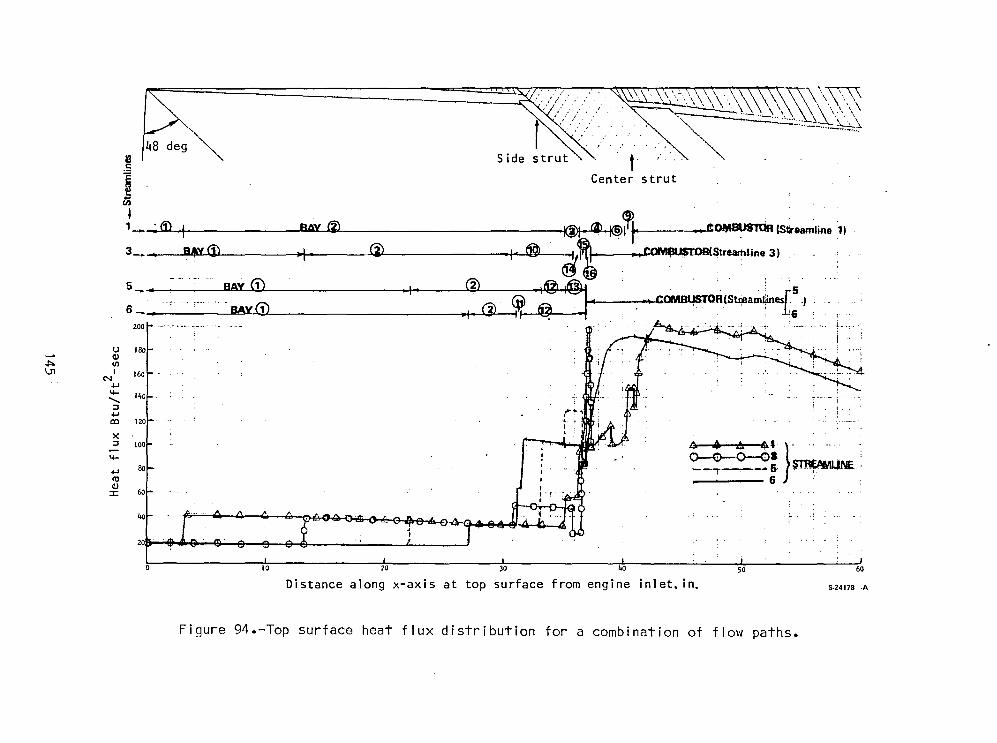
o 10 20 30
,-Center strut
... 1_ ..... _
6. .. ts ~, J'''. _.- .,- ~~I .•. :- I .-6-~·-
! 6- !
60
Distance along x-axis at top surface from engine inlet. in. 5-24178 -A
Figure 94.-Top surface heat flux distribution for a combination of flow paths.
The maximum topwall heat flux from the previous analysis was 200 Btu/sqft-sec and occurred at 41 in. from start of inlet. This corresponds directlywith the peak value of 191Btu/sec-ft2 in figs. 93 and 94. This slightdifference of 5 percent is the result of procedural calculation differencesbetween this and the previous analysis. This is considered to be in closeagreement and is within acceptable tolerance for this type of analysis.
A three-dimensional steady-state thermal performance analysis was conductedon the forward topwall TPS panel using the new aerodynamic heating inputs. Thegeometry of the TPS panel surface is shown in fig. 95. Calculations were per-formed using an AiResearch computer program (PCM Channel Thermal PerformanceProgram). Hastelloy X was used as the TPS material in this analysis.
The hydrogen coolant enters the engine inlet end of the top surface at100°R and I000 psia. It flows through the machined channel passages in adirection parallel to the main airstream for a distance of 58.83 in. from the
engine inlet, where it is joined by the aft topwall coolant before enteringthe outlet manifold. The objective of the analysis was to calculate the temper-ature distribution along each of the six streamlines at prescribed axial incre-ments (from 0.I0 to 0.50 in.) One restriction was to limit the maximum TPSstructural temperature to below 1600°R (1140°F). The condition was met follow-
ing a parametric study using the computer program for the maximum heating path.Results of the study indicate that a value of about 0.0655 Ib/sec produces amaximum TPS structural temperature of 1598°R at the outlet manifold location
for the maximum heating path, Streamline I. This flow compares closely with avalue of 0.065 Ib/sec from the previous analysis.
The metal temperatures at three locations within the TPS at axial stations
along each of the fluid streams was calculated. These in-depth locations aredefined in fig. 95 as TWO, TWI, and TSt and are used in the subsequent structuralperformance analysis.
The temperature distribution of the aerodynamically heated surface (TWO) ispresented in fig. 96 for the maximum heating path, Streamline I. Fig. 96 alsoshows the TPS AT (TWO-TS) distribution for this path. Results of the previousanalysis are shown for comparative purposes. This previous thermal performanceanalysis was based on aerodynamic heating that was reduced to one streamlineonly. This streamline had constant flow properties across the top panel widthand was a composite of those that produced maximum heating along the engine axis.The higher temperatures of this previous case are attributed to this compositemaximum heating and to a higher coolant inlet temperature of 200°R as comparedto 100°R. The present analysis is more realistic in this respect. The previousanalysis used an offset plate-fin TPS passage geometry as compared to machinedchannels.
The combined temperature distributions of streamlines I, 3, and 6 shown infig. 97 provide a better perspective for the two-dimensional aerodynamic effect.Streamlines 2, 4, and 5 have been omitted for clarity of the streamlines shown.The omitted streamlines fall within the range of streamlines shown. The tem-perature steps are the result of crossing shock or Mach waves. The two-dimen-sional aerodynamic effect is particularly noticeable in the area upstream of the
146
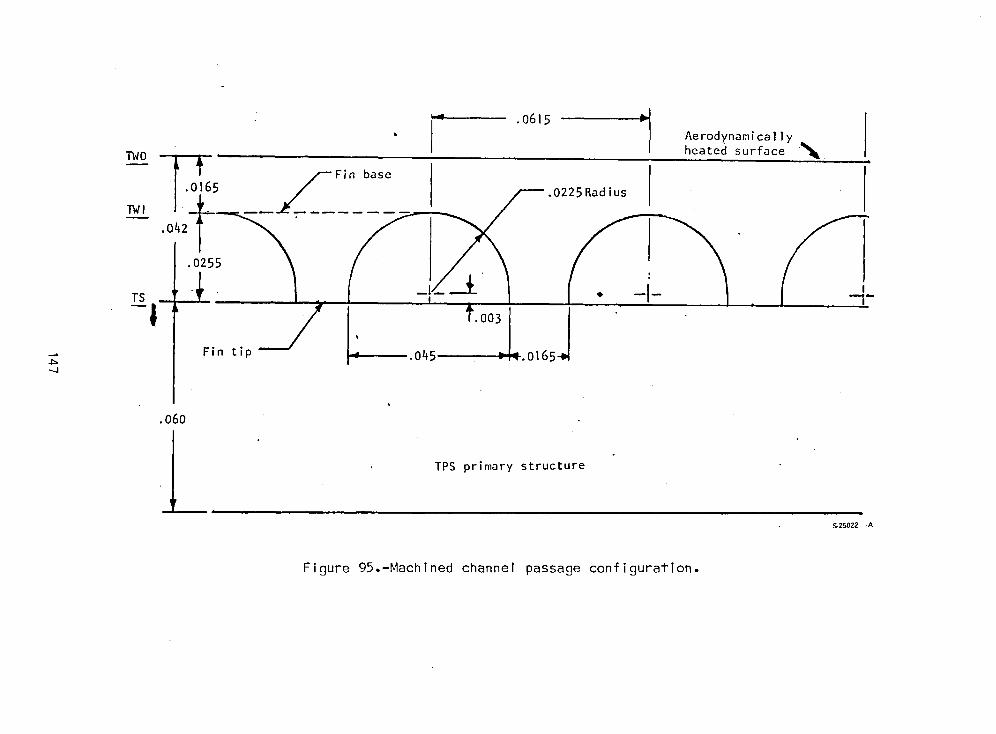
V i IAerodynamica| ly
heated surface
_o _ _ .... I 0225 Radius
TWI. 0142t-._-_.-- --. _ _ _I
I, j .Fin tip i_ .045 _ .0165
•060
L TPS primary structureS-25022 -A
Figure 95.-Machined channel passage configuration.
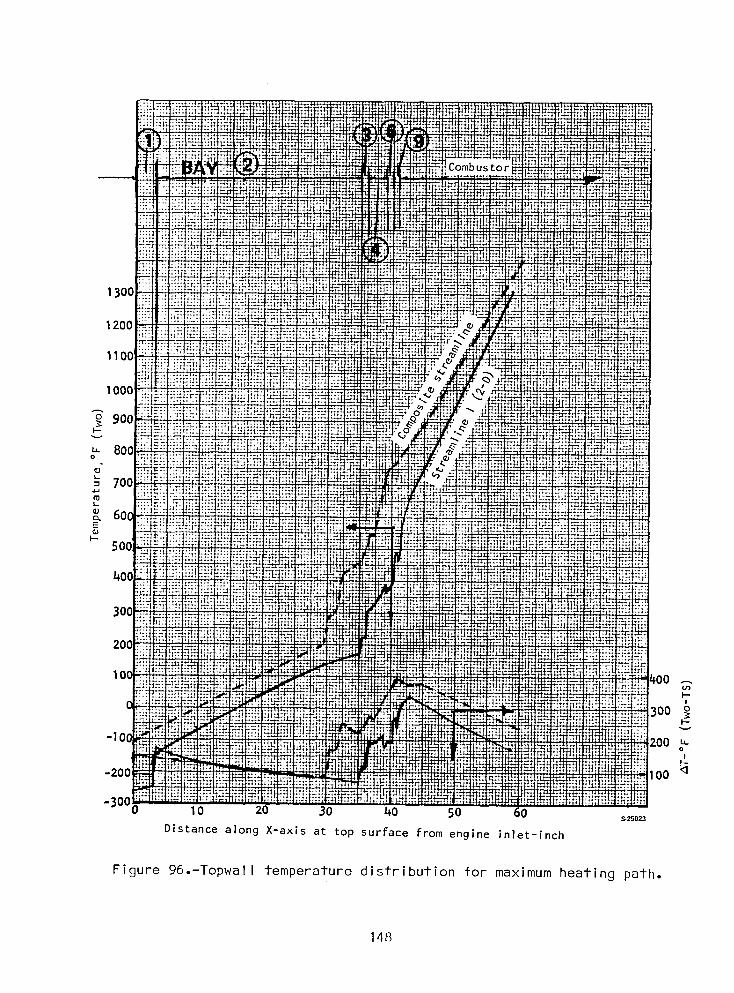
13oo
1200
1100
1
F--
300 _.
-I01 200 "o
,L-20( Ioo _
"3°°0 10 20 30 40 50 _25o23Distance along X-axis at top surface from engine inlet-lnch
Figure 96.-Topwall temperature distribution for maximum heating path.
148
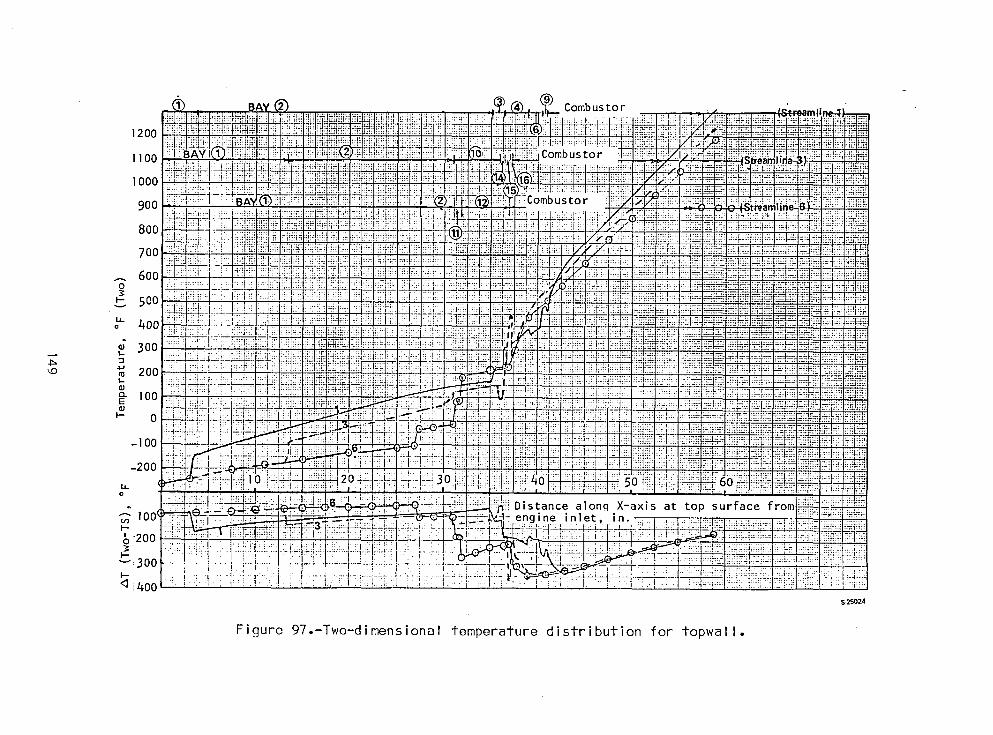
-I00
-200
h0
Distance along X-axis at top surface fromlO0
I--
'200
_:300I- ; ! {_ _400
S-2_24
Figure 97.-Two-dimensional temperature distribution for topwall.

combustor zone, while downstream of the strut the one-dimensional effect isnoted by the near parallel temperature lines for the streamlines. The resultsof the two-dimensional analysis are shown in fig. 98 as an isotherm plot on thetopwall hot surface. Maximum temperature level and T's are summarized inTable 21 for the six streamlines. The temperature data presented here were usedas a load condition for the stress analysis.
The all-honeycomb engine topwall stress analysis was performed using theANSYS finite element computer program. A model was constructed to representthe significant stiffness and geometric features of the topwall. The modelhas 673 quadrilateral isoparametric membrane elements, 40 triangular membraneelements, 302 eight-noded isoparametric solids, and 2 six-noded solids. Fig.99 shows an isometric view of the model. The model is basically three layersof elements as defined in fig. 76.
Solid elements were used to represent the properties of the honeycomb cells.Full orthotropic properties of the hexagonal honeycomb cells were calculatedusing the configuration in fig. iO0.
A supplementary computer model shown in fig. I01 was used to determine con-stants where no formula was available. The model consists of 216 quadrilateralisoparametric shell elements. The basic definitions of the material propertieswere input as boundary conditions to the model to determine moduli and Poisson'sratio for the ribbon and non-ribbon directions.
In the topwall model, the stiffness of the TPS and hot face sheet of thehoneycomb cell were combined and represented as a single, isoparametric membraneelement (O.08-in.-thick). The cold face sheet of the honeycomb cell is repre-sented by an isoparametric membrane element (O.06-in.-thick). The membraneelements are expected to reproduce the membrane stresses that would exist inthe outermost fibers of the inside and outside surfaces of the engine topwall,
The model accurately reproduces overall bending stresses of the layeredcomposite. Bending stresses due to temperature differentials across the TPS-hot face sheet are not reproduced by this modeling technique. Bending stresseswere hand-calculated and linearly superimposed onto the stresses derived fromthe finite element model to obtain the effect of the temperature differential.
Each local cutout for the struts is modeled by a row of isoparametricsolids which represent the stiffness of structure surrounding the strut cutouts.The stiffness of the leading edge manifold was not represented in the leadingedge model. Since the leading edge area is relatively lightly loaded, the mani-fold has little effect on the stresses and would unduly complicate the model.
Young's moduli were input to the program as a function of temperature.Shear moduli and Poisson's ratio were held constant because less is known about
the nature of these constants with respect to temperature. The entire enginetopwall was assumed to be Hastelloy X.
Loads to the model are in the form of imposed boundary conditions and nodaltemperatures. The Y-displacements (see fig. 99) from the all-honeycomb, three-dimensional model were used as boundary conditions at the sidewall/topwall inter-face. The interface edge was not permitted to rotate. A built-in (fixed) edge
150
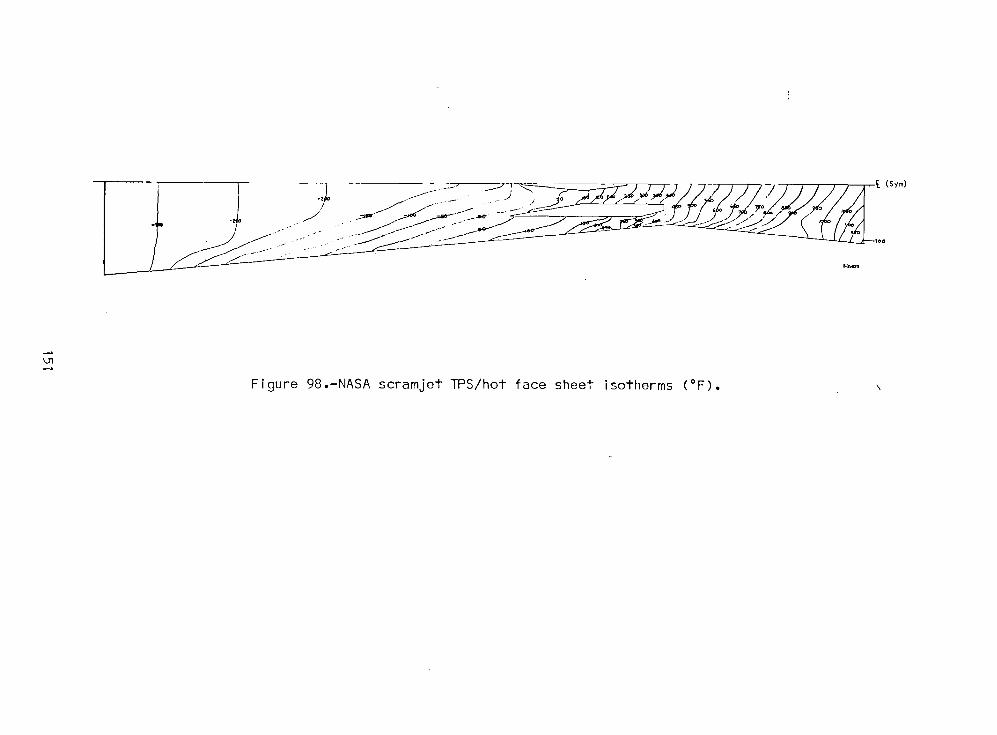
Figure 98.-NASA scramjet TPS/hot face sheet isotherms (°F).
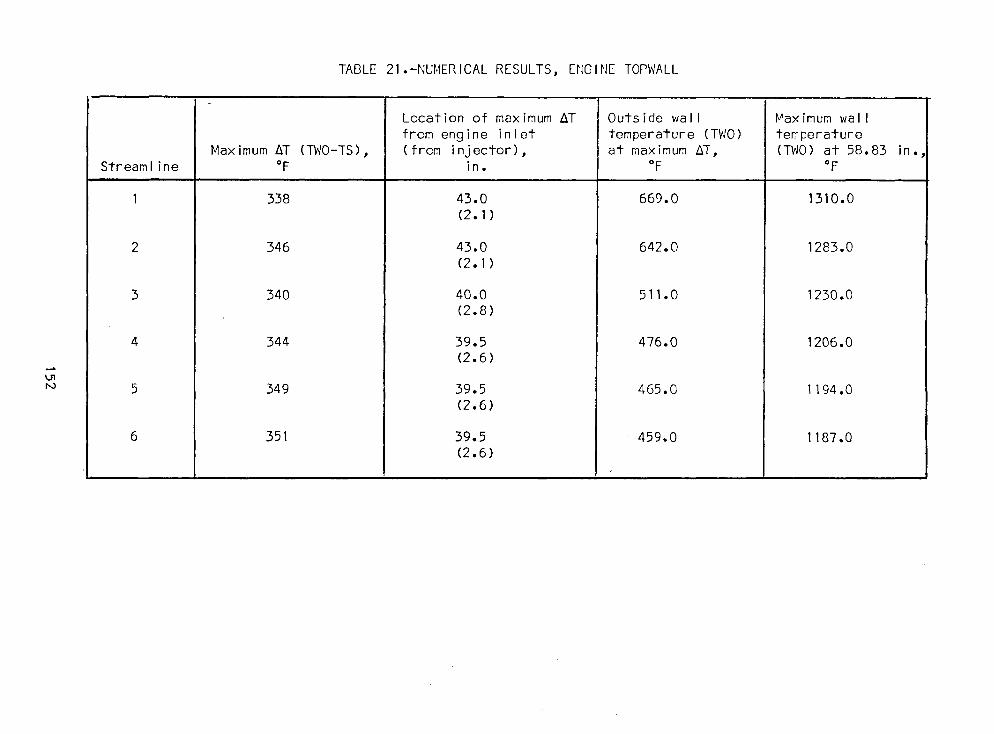
TABLE 21.-NUMERICAL RESULTS, ENGINE TOPWALL
I
Location of maximum AT Outside wall Maximum wall
from engine inlet temperature (TWO) temperatureMaximum AT (TWO-TS), (from injector), at maximum AT, (TWO) at 58.83 in.
Streamline °F in. °F °F
I 338 43.0 669.0 1310.0(2.1)
2 346 43.0 642.0 1283.0(2.1)
3 340 40.0 511.0 1230.0(2.8)
4 344 39.5 476.0 1206.0(2.6)
5 349 39.5 465.0 1194.0(2.6)
6 351 39.5 459.0 1187.0(2.6)
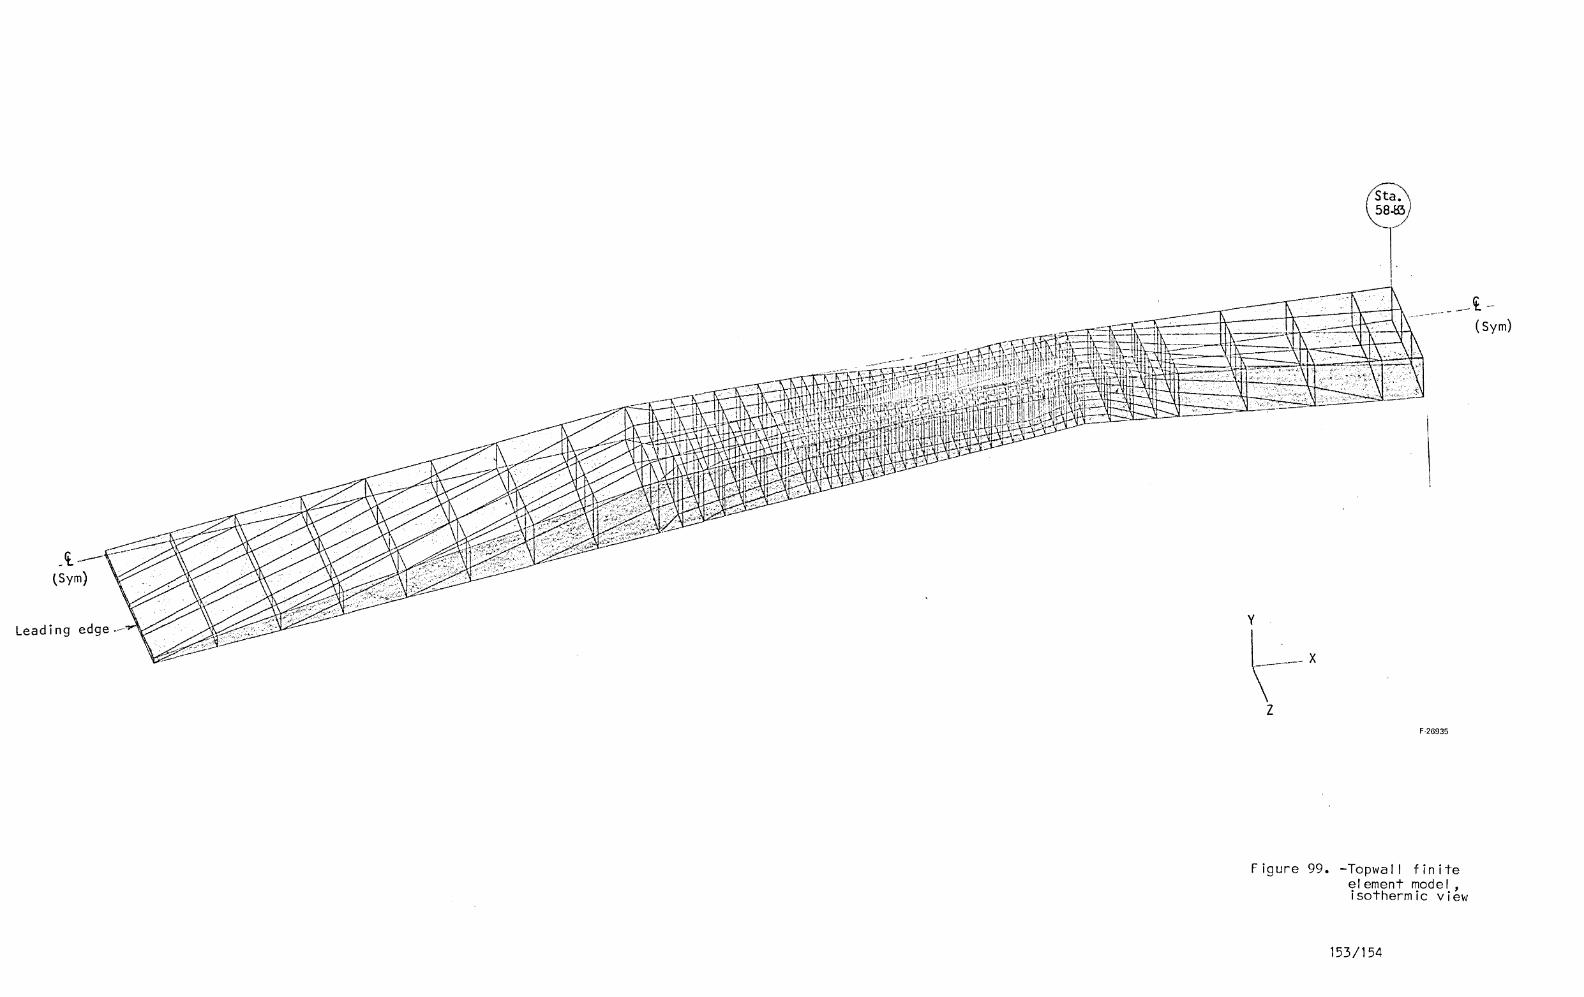
Figure 99. -Topwall finiteelement model,isothermic view
153/154


.003 in.Ribbondirection
ack welded (typ)
Nonribbon
direction ___2_26 -A
Figure 100.-Honeycomb cell conf'iguration.
Figure 101.-Honeycomb cell finite element model.
155

is thus simulated. Rotations f_om the three-dimensional analysis were not usedas boundary conditions because they were too heavily influenced by pressure loadsand would unduly bias the thermal stress analysis. Conditions of symmetry wereused as boundary conditions (along the centerline of symmetry). Three layers oftemperature were input to the model. An average temperature of the TPS/hot facesheet was used for the inside layer. The honeycomb cells and the cold facesheet constituted the other four layers.
Computer plots of the stresses and configuration changes obtained fromthe analysis are shown in figs. 102 through I11. The von Mises stresses onthe TPS hot face sheet and the cold face sheet are shown in fig. 112. Thecomputer analysis calculated the nominal middle surface stresses of the TPShot face sheet and the cold face sheet of the honeycomb cell. The criticalnominal stresses for the topwall are shown in Table 22.
Some yielding occurs at the middle surfaces, but these levels of stressare tolerable for 1000 cycles of operation. The stresses in the table will addto those produced by the temperature differential across the TPS. This temper-ature differential is 360°F at Station 38-40. The resulting combined stressesat Sections 41 and 25 will be less than two times yield strength. As a result,LCF life will remain above I000 cycles. Since there is no combustion in thisarea, transient stresses are not of concern. The stresses at Stations 55 and58 were assessed as part of the 2-D transient analysis.
Thermal transient analysis.--During an off-design transient condition, e.g.,at engine ignition, the temperature gradients developed in the structure canbecome controlling with regard to structural design. Analyses were thereforeperformed to assess the magnitude of the transient temperature gradients andtheir effect on the selected design concepts. An initial analysis was conductedon the original reference primary structure designs (combination beam and honey-comb). A second analysis was conducted on the selected primary structure design(all-honeycomb).
Reference structure transient analysis: A typical structure, shown in fig.113, was subjected to a two-dimensional nodal point thermal transient analysis.The beam material was Inconel 718. The honeycomb and TPS were either Hastelloy Xor Nickel-200. The network forcing function was a time-varying coolant convec-tive heat transfer coefficient and TPS metal temperature. Conditions near thecoolant outlet manifold were specified because the metal temperatures reach amaximum here.
The primary source of heating is aerodynamic heating, which will almostentirely be absorbed by the TPS coolant, which in turn will dissipate to thestructure during transients. The time constant of the TPS and the adjacent1.5 mm (O.060-in.)-thick plate is a few seconds so that these parts will essen-tially track the coolant temperature.
156
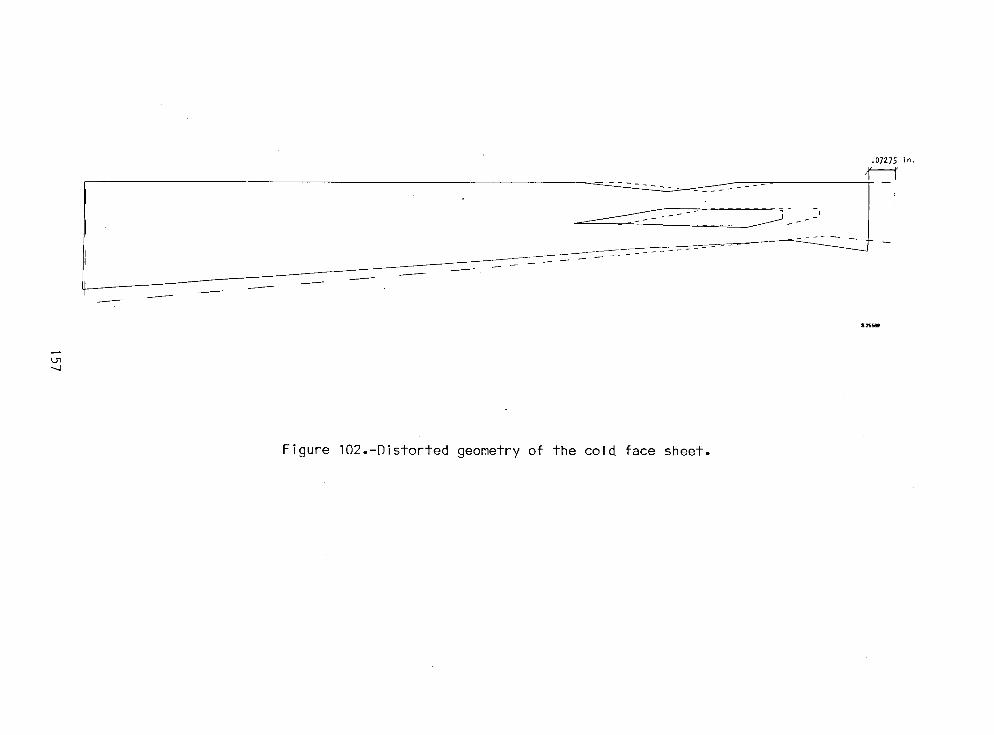
.07275 in.
4----1
_ _--2 ....... =_
__.___.--
..,j
Figure 102.-Distorted geometry of the cold face sheet.
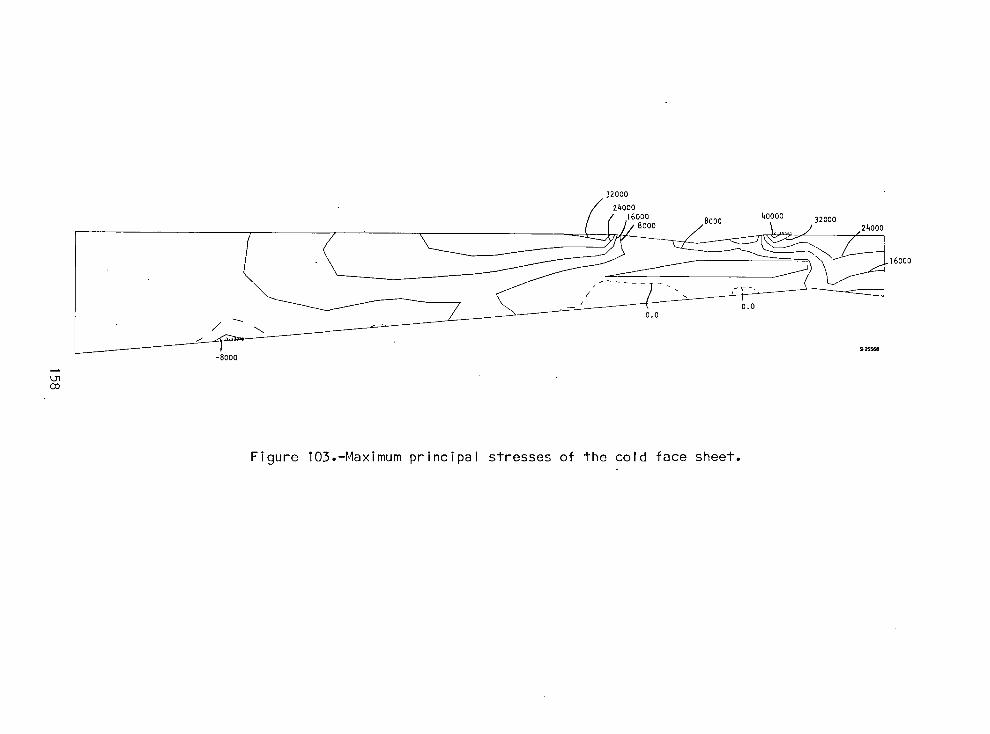
32000
24000
/ 160oo^^ 8000 40o00 32000
o.o-8000
tnco
Figure 103.-Maximum principal stresses of the cold face sheet.
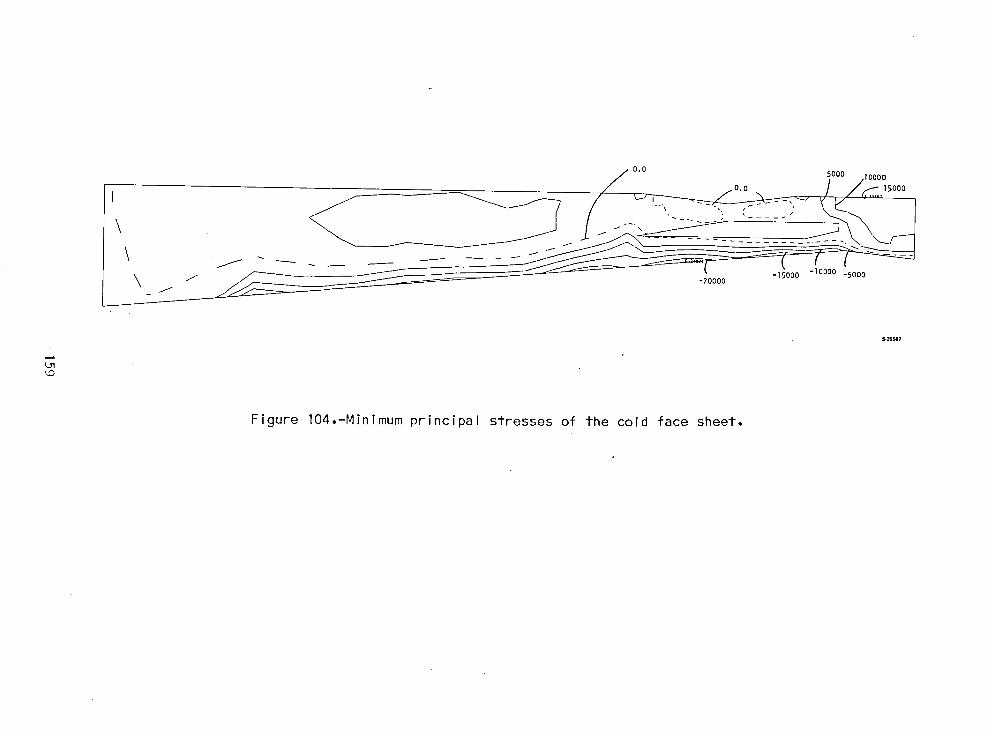
0.0 5000 Io00o
0.o 15000
\ / _ _ _ _ _-15000 -I0000 -5000
\ _ _ __ -2oooo
Figure 104.-Minimum principal stresses of the cold face sheet.
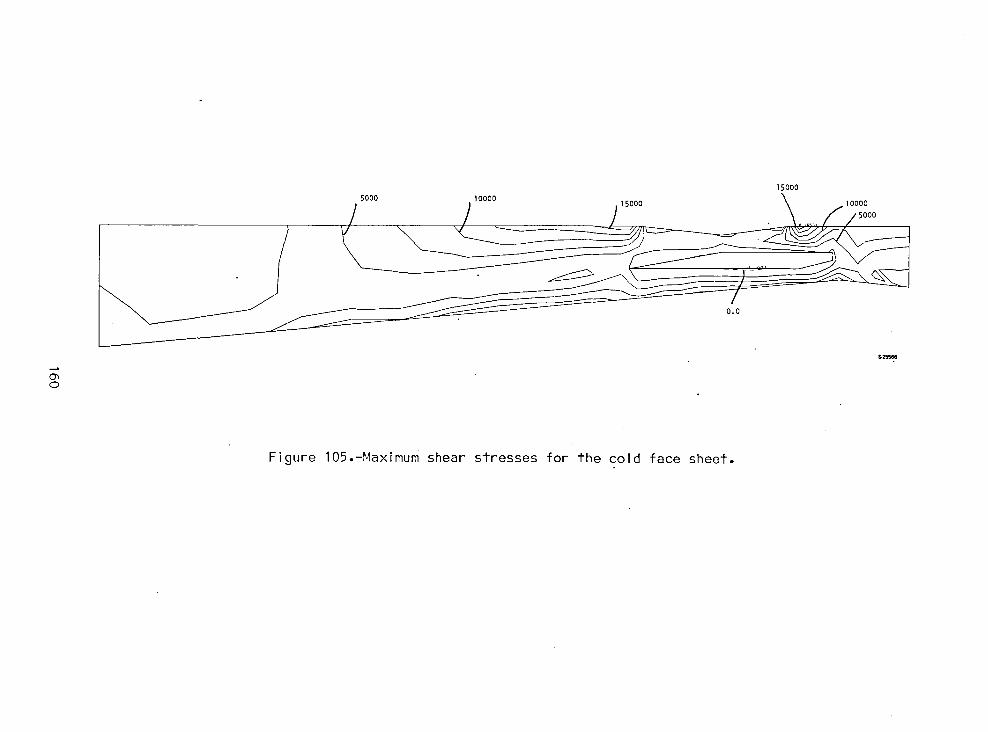
150005000 IOO00
15000 ,10000
\
0.0
Figure 105.-Maximum shear stresses for the cold face sheet.
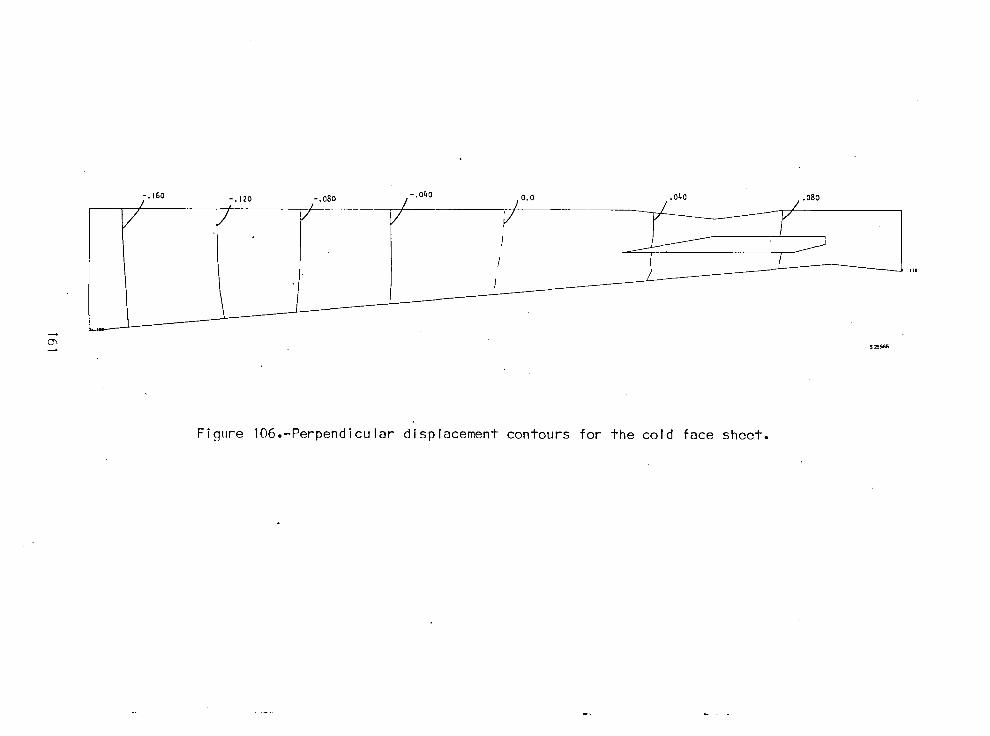
-.160 -.120 -.080 -.040 0.0 .040 .080
Figure 106.-Perpendicular displacement contours for the cold face sheet.
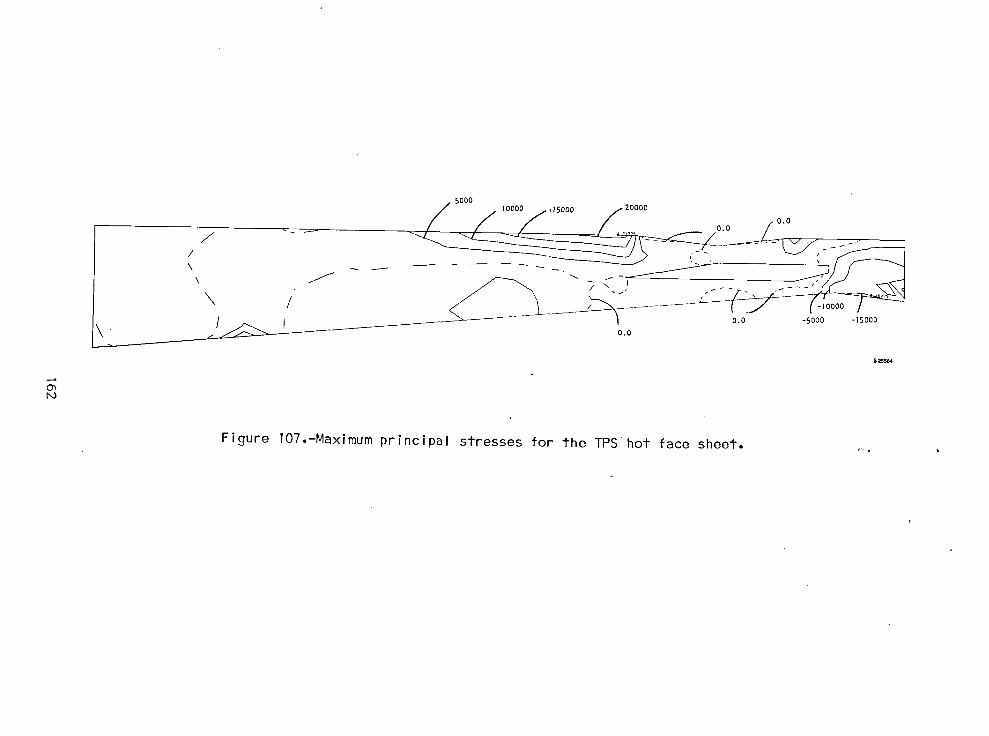
_ 5000
/ / Ioooo_,isooo _ 2oooo
_/ .j_____ /. ..... o.o/o.of
o.o -sooo-,sooo\. I o.o
o'_
Figure 107.-Maximum principal stresses for the TPS hot face sheet.

.06229In.
__ I
I
_ I
Figure 108.-Distorted geometry for the TPS hot face sheet.
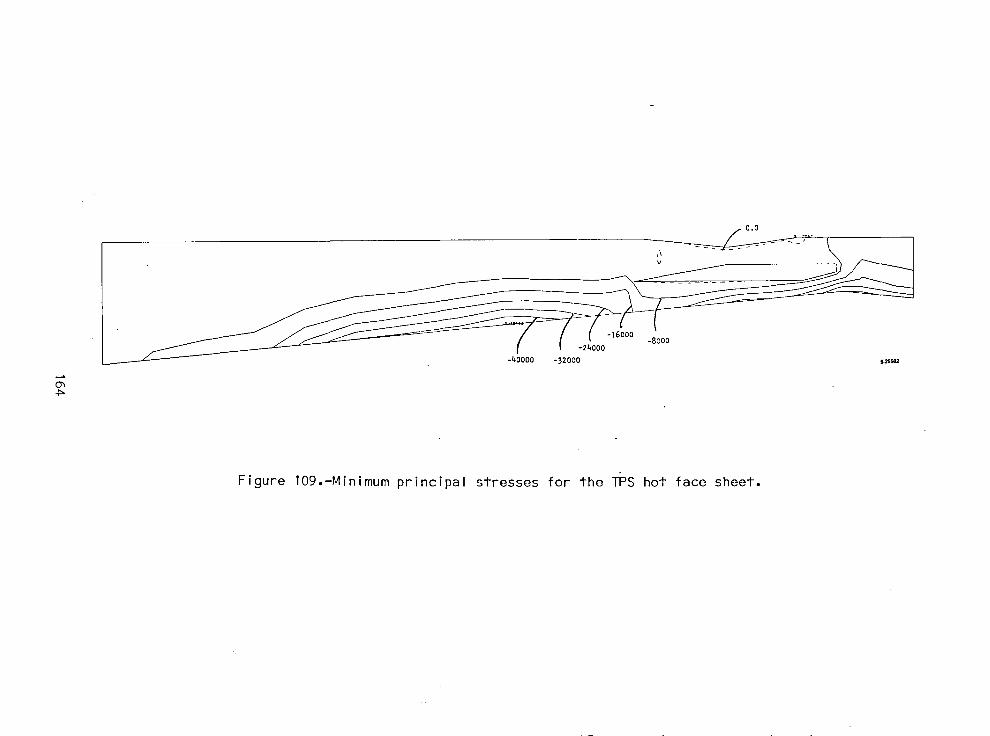
0.0
- 0000 -32000 _'_
Figure 109.-Minimum principal stresses for the TPS hot face sheet.
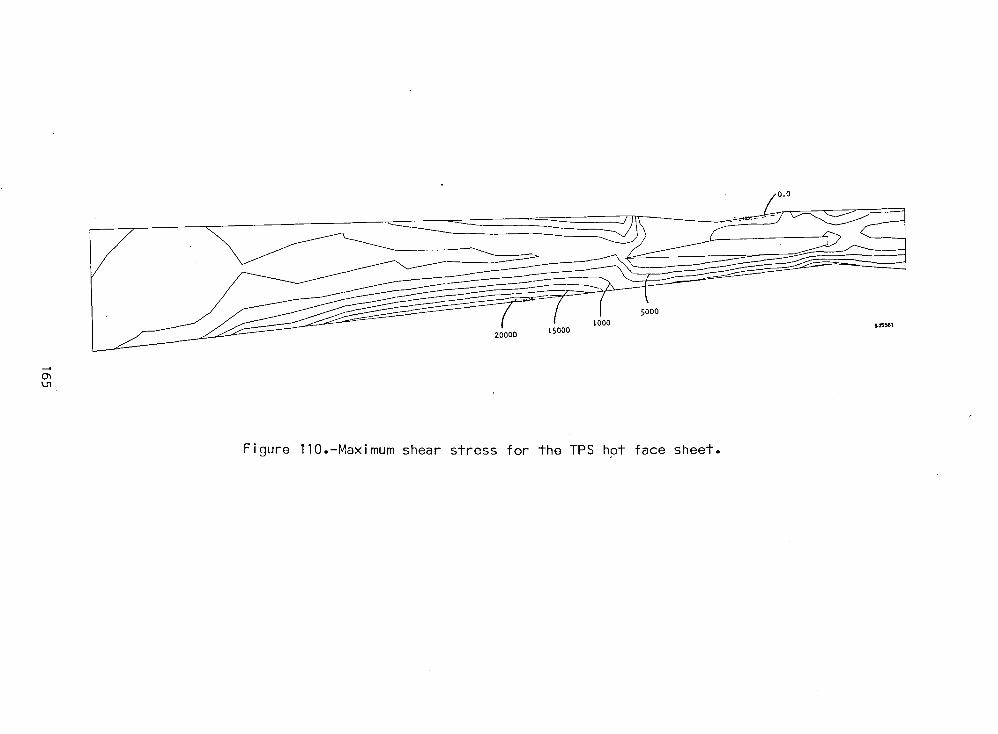
Figure 110.-Maximum shear stress for the TPS hot face sheet.
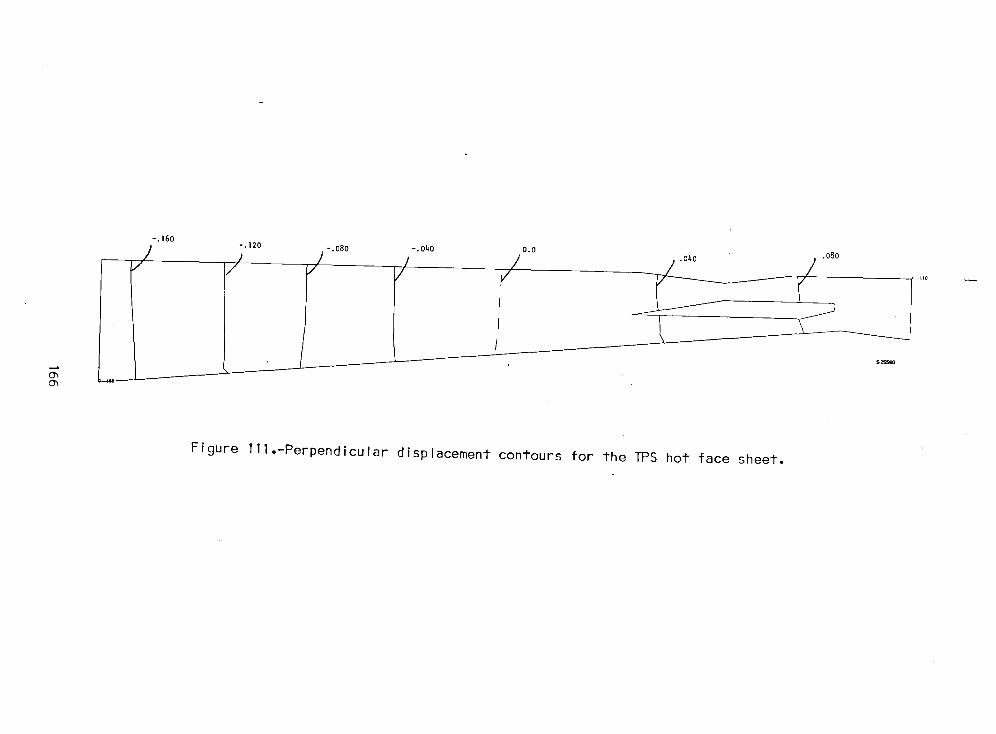
-.160
-.120 -.080 -.o4o o.o .080
/ ,, / / ,/ ....
Figure 111.-Perpendicular displacement contours for the TPS hot face sheet.
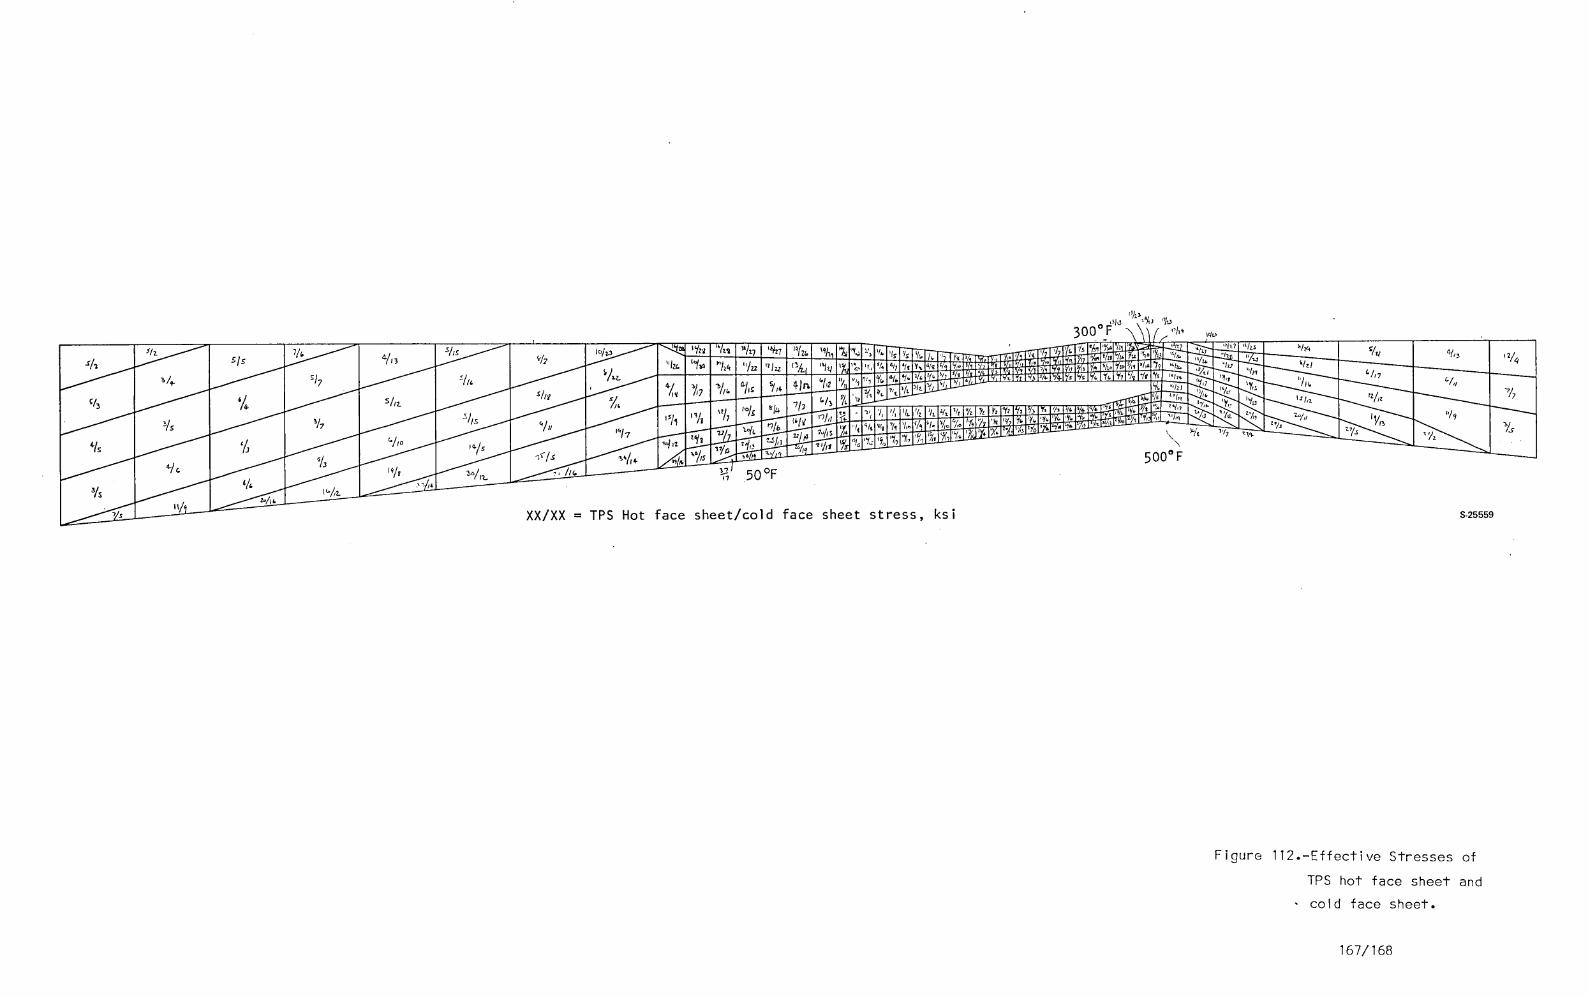
XX/XX = TPS Hot face sheet/cold face sheet stress, ksi s-2ssse
Figure 112.-Effective Stresses of
TPS hot face sheet and
cold face sheet.
167/168


TABLE 22.-CRITICAL TOPWALLSTRESSES
Middle l-percentsurface Minimum creep instress, Temperature, yield, 1000 hr,
Station Location ksi °F ksi ksi
41 Cold face sheet 45 169 43 -
25 TPS hot face sheet -49 31 45 -
55 TPS hot face sheet 21 1000 34 -
58 TPS hot face sheet 7 1100 32 35
_ _Coolapt temperature
Convective heat transfer
_TPS .... _,
Clip ____ ---_ -.-O.8
Thermal/ I.O ! .5
network
nodal point
(typical )
Beam 38. l
_ 1.5
Note: Dimens ions
are in mm
i///.AV/ /V// ///_'//_'//,_
33.0 "I
.o76
1.0
F-20.3-dHoneycomb detail
TPS detail "
S-158_,3 -A
Figure 113.-Model for transient temperature analysis
169
A mission profile typical for a research airplane was used and is shown
in fig. 114. An estimate of the coolant temperature is shown in fig. 115.The engine is uncooled below Mach 3 and the effective temperature is equal tothe freestream recovery temperature. At 75 sec, the coolant flow begins andthe engine is initially over-cooled. The coolant flow and temperature grad-ually increases as the airplane accelerates. Combustion occurs at 120 sec,at which point the coolant has reached a maximum design condition of 889 K(1600°R). At this same instant, the coolant flow is doubled because the heatload with combustion is about twice the unlit value. The inverse of theseoperations occurs during deceleration.
Structural temperature response is shown in fig. 116 for a Hastelloy Xstructure. The TPS temperature essentially tracks the local coolant tempera-ture. At the midbeam position, the response is slow compared with the TPS;the maximum temperature rise for the 300-sec mission is 88°C (190°F). Themaximum honeycomb AT is 500 K (900°R) for Hastelloy X and 378 K (680°R) fornickel. Both of these high temperature gradients occur just at the onset ofcombustion when the II_Sprime structure is at 889 K (1600°R) and the honeycombcold side is just beginning to respond.
As indicated, the midbeam temperature is unresponsive to the several
operations of this mission. When accelerating to Mach 6 and maintaining along cruise at this speed, the midbeam will take approximately 0.5 to I hrto reach steady state at a value near the local coolant temperature. Con-versely, the opposite effect will occur on a deceleration from a long-durationMach 6 cruise. The midbeam temperature will take approximately 0.5 to I hrto cool to ambient conditions.
Because the midbeam response is slow, the temperature difference from topsurface midbeam to sidewall midbeam and from sidewall midbeam to cowl midbeamat a particular cross-section should be small (less than 111K (200°R)). It isconcluded, therefore, that sliding beam-to-beam connections are not requiredbecause the differential thermal growth between beams will not be excessive.A rigid joint can be made between beams and the resultant stresses can be heldwithin the elastic limit.
As noted above, a high temperature gradient can be developed across thehoneycomb primary structure during a thermal transient and this will produce ahigh stress. Estimated temperature gradients in the honeycomb panel are shownin fig. 117. Maximum temperature differential across the panel is 514 K (925°R)and occurs at 125 sec. Panel temperatures across the width are assumed constant.
All-honeycomb structure transient analysis: A more detailed transientthermal and stress analysis was conducted on the selected primary structuredesign, the all-honeycomb configuration. An engine cross-section where thehighest temperature gradients occur was analyzed. The transient performancewas assessed by considering the thermal response for a mission representativeof a research airplane. Two cruise durations were investigated: I minuteand I hr. The l-hr cruise duration is representative of a commercial applica-tion; however, the times to reach cruise altitude and for descent would begreater. The mission profile and coolant schedules, shown in figs. 114 andI15, are the same as were used in the previous thermal-structural transient
170
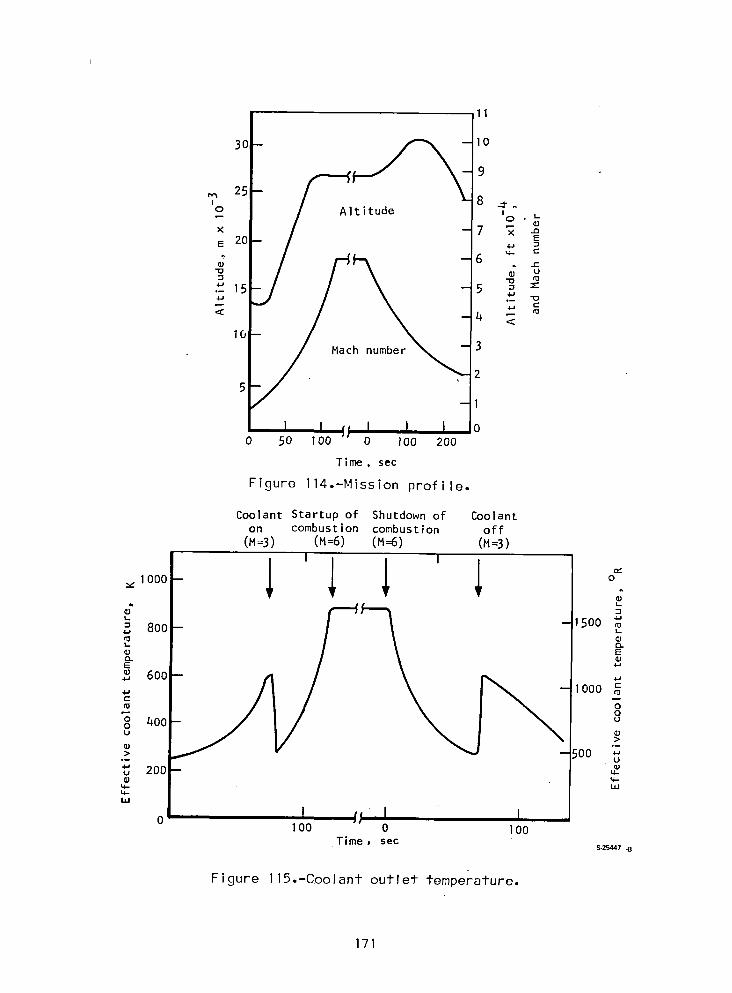
1130, 10
9
m 25, 8 _.o Altitude ,
O " L¢)X 7 _ .oe 20 _ E=
"_ ¢j u"O
_ 15 5 _ _:•-- _.j
4J
< -4 <I0
3
25
1
I _! I I I 00 50 1O0 0 lO0 200
Time , sac
Figure ll4.-Mission profile.
Coolant Startup of Shutdown of Coolant
on combustion combustion off(M=3) (M=6) (M=6) (M=3)
.. ,000_.. 4J
= 800 --15004.a L
_ EE_ 600
.,_, -- 1000 m
o"° 400 uOu ¢J
>(L) "--
.>_ - 50014-
0 I ,100 0 100
Time, sacS-25447 -B
Figure ll5.-Coolant outlet temperature.
171
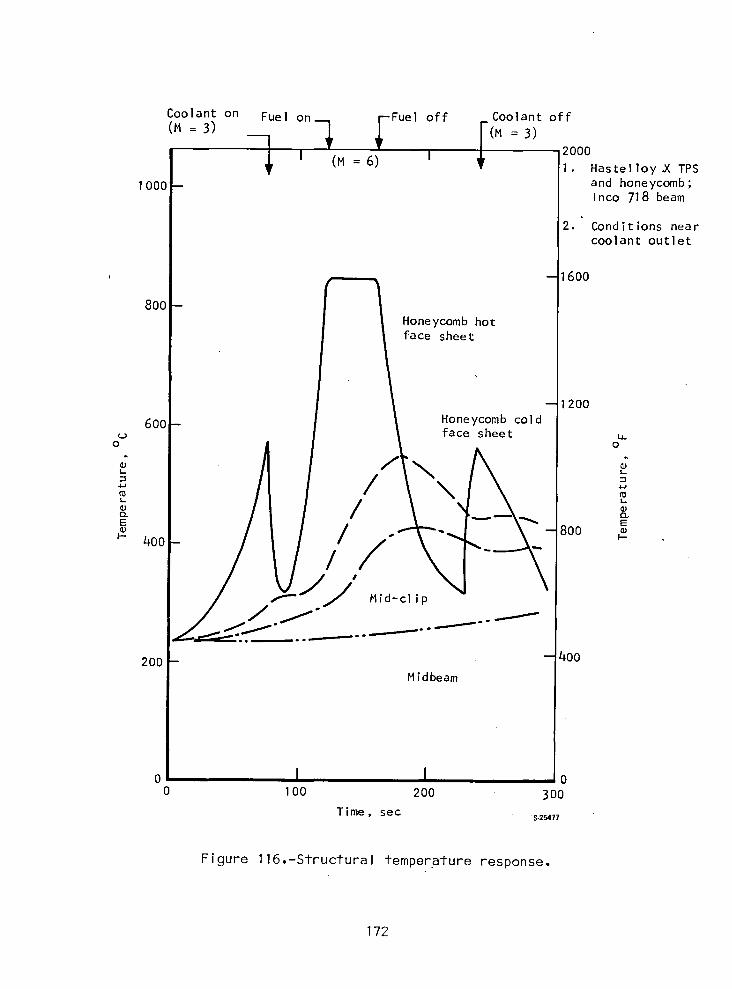
Coolant on Fuel on Fuel off Coolant off
(M = 3) ---_ _- I(m = 3)I (M = 6) I
2OO0
I• Hastelloy _XTPSI000 -- and honeycomb;
Inco 718 beam
2. Conditions nearcoolant outlet
600
800
Honeycomb hotface sheet
200
600 Honeycomb col dface sheet ,,
O O
l_ L
= / \ °4-1 4-J
E / 300 E400 ° _//I
Mid-clip
200 - --400Midbeam
o I I o0 100 200 300
Time, sec 5-25477
Figure 116.-Structural temperature response.
172
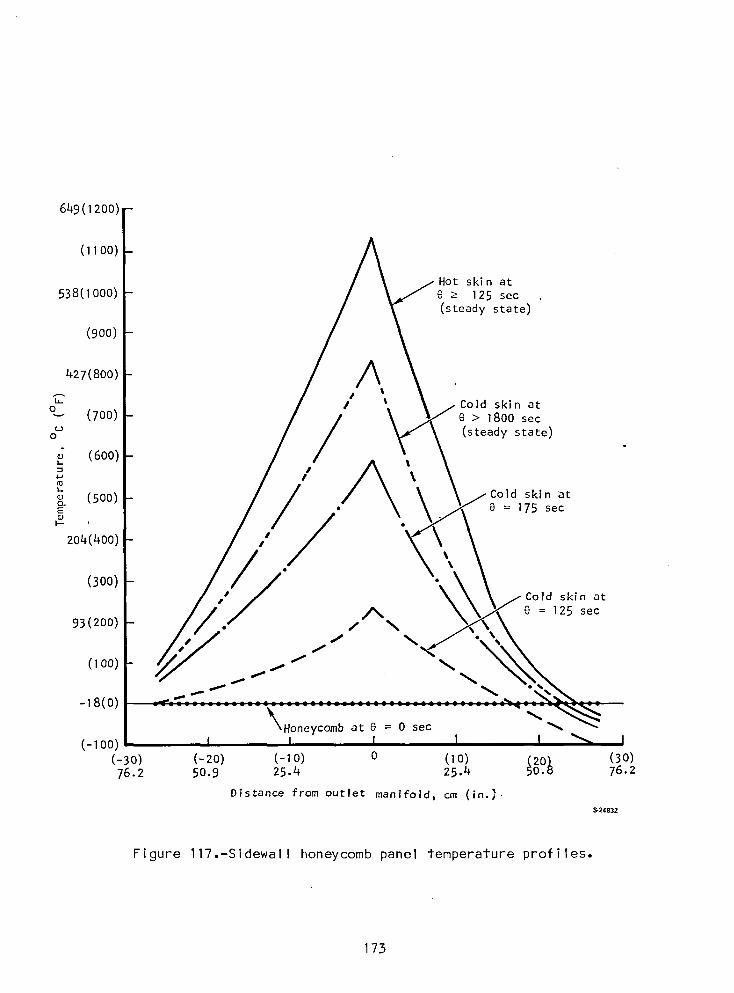
649(i200)_
(11oo)
Hot skin at
538(I000) e _ 125 sec
(steady state)
(900)
4-27(800) A%
to I _ Cold skin at
(700) / e > 1800 sec
_J / (steady state)
0
o (600)L %
¢0
o (500) Cold skin att_E • O = 175 sec
° / ,,I-- •
204(400) 11
(300)•X Cold skin at
0 = 125 sec93 (200) . l
f/
(I00) _
-18(0)
Honeycomb at 0 = 0 sec
(-I00)(-30) (-20) (-I O) 0 (I0) (30)762 509 25. 25. to_°_ 76
Distance from outlet manifold_ cm (in._.S-24832
Figure 117.-Sidewall honeycomb panel temperature profiles.
173
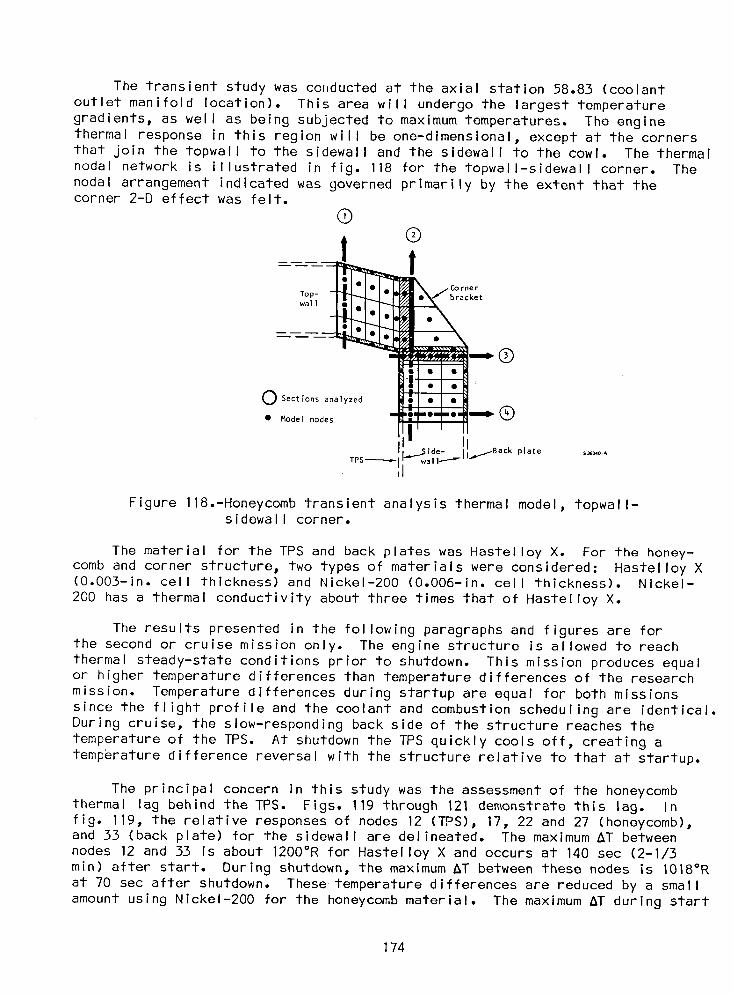
The transient study was conducted at the axial station 58.83 (coolantoutlet manifold location). This area will undergo the largest temperaturegradients, as well as being subjected to maximum temperatures. The enginethermal response in this region will be one-dimensional, except at the cornersthat join the topwall to the sidewall and the sidewall to the cowl. The thermalnodal network is illustrated in fig. 118 for the topwall-sidewall corner. Thenodal arrangement indicated was governed primarily by the extent that thecorner 2-D effect was felt.
®®
1Top- bracketwall
Sections analyzed
• 14ode1 nodes _ Q
I/Backide- plateTPS_ _Swa I 1---_ I s_.o_
I
Figure 118.-Honeycomb transient analysis thermal model, topwall-sidewall corner.
The material for the TPS and back plates was Hastelloy X. For the honey-comb and corner structure, two types of materials were considered: Hastelloy X(O.O03-in. cell thickness) and Nickel-200 (O.O06-in. cell thickness). Nickel-
200 has a thermal conductivity about three times that of Hastelloy X.
The results presented in the following paragraphs and figures are forthe second or cruise mission only. The engine structure is allowed to reachthermal steady-state conditions prior to shutdown. This mission produces equalor higher temperature differences than temperature differences of the researchmission. Temperature differences during startup are equal for both missionssince the flight profile and the coolant and combustion scheduling are identical.During cruise, the slow-responding back side of the structure reaches thetemperature of the TPS. At shutdown the TPS quickly cools off, creating atemperature difference reversal with the structure relative to that at startup.
The principal concern in this study was the assessment of the honeycombthermal lag behind the TPS. Figs. 119 through 121 demonstrate this lag. Infig. 119, the relative responses of nodes 12 (TPS), 17, 22 and 27 (honeycomb),and 33 (back plate) for the sidewall are delineated. The maximum AT betweennodes 12 and 33 is about 1200°R for Hastelloy X and occurs at 140 sec (2-I/3min) after start. During shutdown, the maximum AT between these nodes is I018°Rat 70 sec after shutdown. Thesetemperature differences are reduced by a smallamount using Nickel-200 for the honeycomb material. The maximum AT during start
174
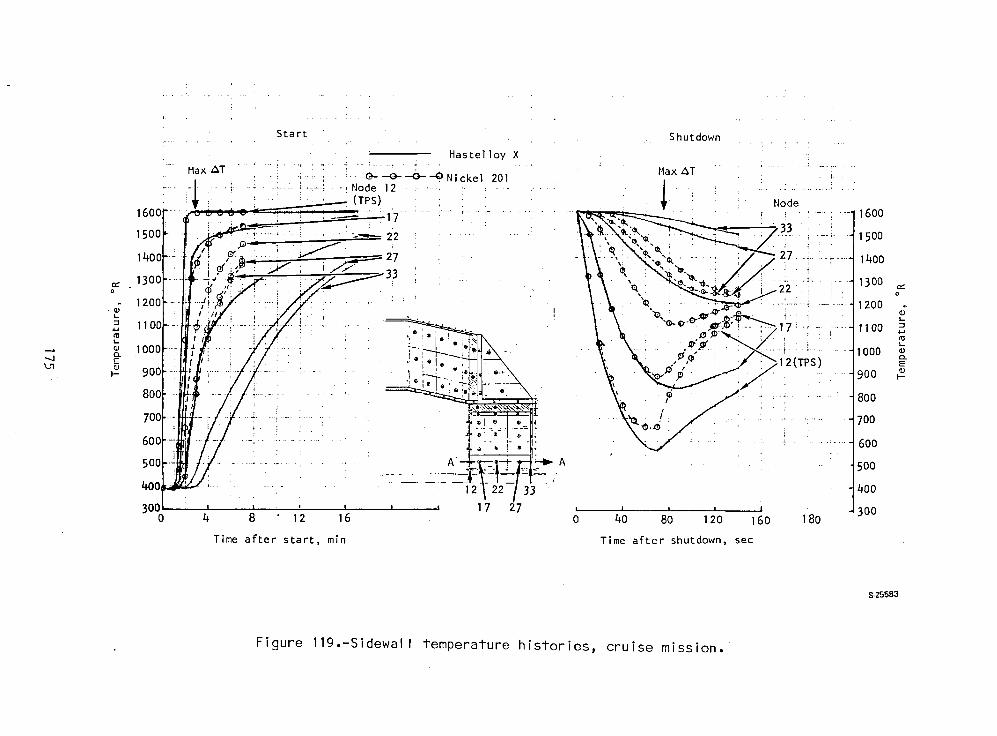
_25583
Figure 119.-Sidewall temperature histories, cruise mission.
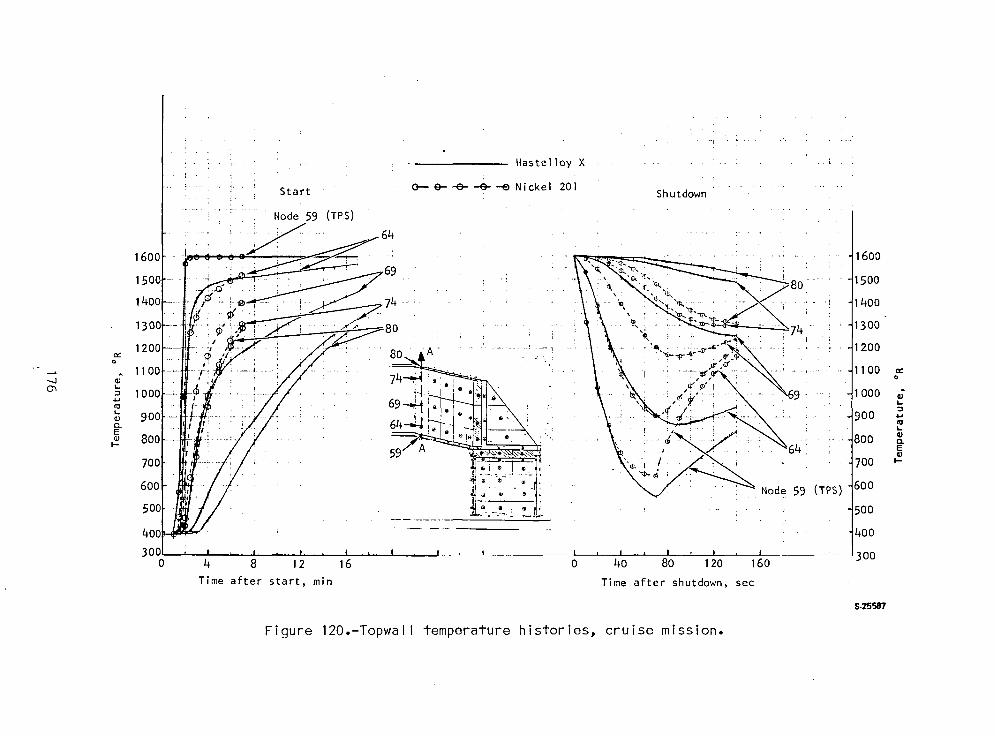
HI
Start
Hastelloy X
~ -e Nickel 201()- e- -&- . Shutdown
a::o .IIJI:J...I1lI011a.E011I-
500
400
300
1600
1500
1400
1300
1200
1100
1000
900
800
700
600(TPS)Node 59
I
160I
120
- "
.J-I--41,',\ 80
o 0 seca fter shutdown,Time
I. _
1612
···-r-·
4 8start, minTime after
59 (TPS)Node 64
·~·~.69'-. ~74";dr~_!.~.:_.:~
I' dr~.. : ....~.... /..-::. ,.80ID",:~ .~ .:.\D.~:~. '.' .. ; . ... 80
. I ~-', • '~--:-J;",",,:,,~~~,r'i:;"H'nr';1
700
600
500
400
300o
QIt-
900-:" 1--",. "
, H
,f
800
1600 .
1500 ..
1400
.IIJI:J...I1lIIIJa.EIIJI-
0:::Q
120.-Topwa IIFigure 'se mission.. crulhistories,temperature
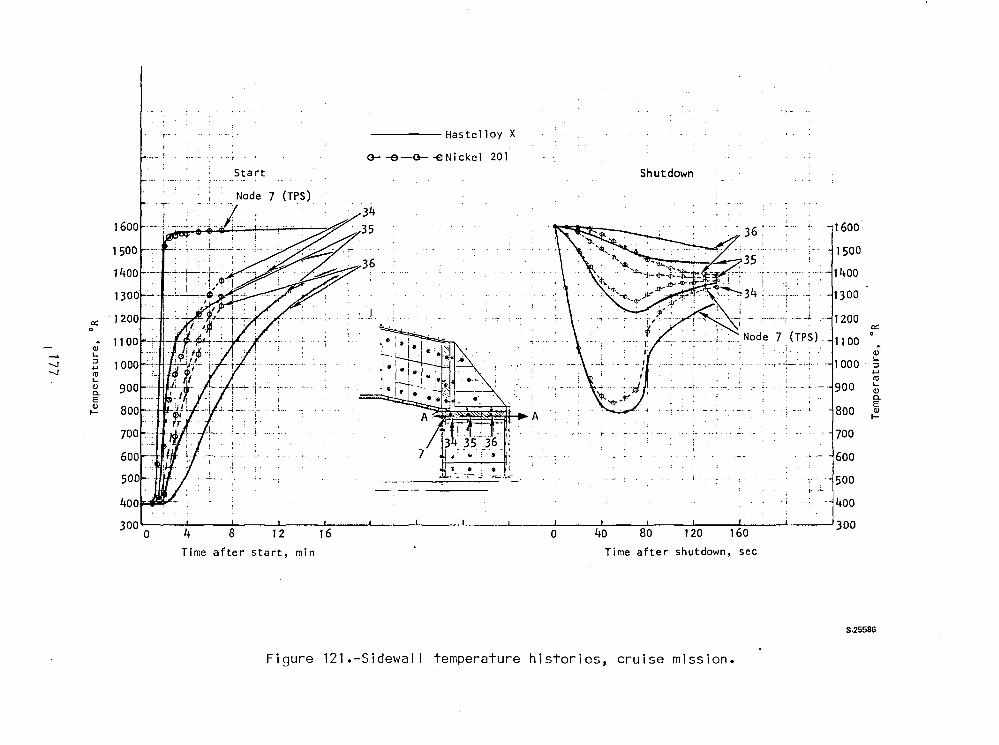
Start
----- Hastelloy X
G- -e -G- -El Ni eke 1 201
Shutdown
__! Node 7 (TPS)
Ql....:J.....I1l....Ql0.EQlt-
1300
-- 1200
"-. , -1600
1500
1400
. ,1000... _~--_. _..•. -.. ' ;
.. 900
, 800
700
600
500.L
·-t- 400
300
ex:~ ... Node 7 (TPS) _ 1100 0
, ;I
7
----------'-----::.--- ----- ----
.. .I.
300 ........--..L..---~---I----....L.,----L----'------'L-.·--L----'----,..J---,J__----l---~-----J-----Ja 4 8 12 16 a 40 80 120 160
1600
1500
1400
1300
ex:o
Time after start, min Time after shutdown, see
8-25586
Figure 121.-Sidewal I temperature histories, cruise mission.

for Nickel-200 is now 1119°R at 120 sec after start and 826°R at 50 sec after
shutdown. In figs. 120 and 121, the responses for the topwall and sidewallcorner plate are shown. While there is only a minor reduction in AT withNickel 200 (0.006-in. cell thickness), the response is faster (_T's diminishmore quickly) than with Hastelloy X (0.O03-in. cell thickness).
In fig. 122, the temperature distribution is depicted for the topwall atspecific times. A slight improvement in AT results from using Nickel-200 insteadof Hastelloy X. The 2-D effect of the corner structure is shown in fig. 123for the sidewall.
The results given above indicate that there are large temperature gradientsduring mission startup. The honeycomb lags behind the TPS by as much as 1200°Rwith Hastelloy X and 1119°R using Nickel 200. The implications of these temper-ature differences for structural performance are evaluated in the stress analysis.
A finite element model of a slice of the all-honeycomb engine at station58.83 was constructed on the ANSYS computer program. The model consists of 205elements and is shown in fig. 124. There are five elements through the thicknessof the cowl, sidewall, and topwall. Both the TPS/hot-face sheet and the cold-face sheet are isoparametric shell elements (6 deg of freedom/node). The honey-comb was modeled as three isoparametric solid elements (2 deg of freedom/node)through the thickness to obtain a good aspect ratio. The attachment bracket ofthe topwall and sidewall honeycomb cells have isoparametric shell elements to
•close out the edge for bolting purposes.
The engine was assumed to be all Hastelloy X. Material properties for allof the shell elements were input as a function of temperature. The honeycombcells are orthotropic in nature and material properties were input as constantswith exception of the modulus and coefficient of thermal expansion, which wereinput as functions of temperature. Boundary conditions were as nearly as possibleplane stress in the engine axial direction. The elements were free to deformon the plane taken through station 58.83. Three conditions were analayzed:140 sec into the startup, steady-state, and 80 sec into the shutdown. Theseconditions yield the highest stress amplitude and are sufficient to performa cyclic life analysis. Distortions as a result of the analysis are shownin figs. 125 through 127.
The peak stresses are shown in fig. 128 for each of the major surfaces. Thesestresses are such that a reduction in AT across the honeycomb is in order. Toreduce these stresses, a reduction in AT can be accomplished by the following.
(a) Use less severe start and shutdown transient conditions. This wouldoccur with a less severe mission.
(b) Control the coolant flow during startup and shutdown to damp out thetransients.
(c) Incorporate a heat exchanger on the back side of the honeycomb in thecritical area to reduce the AT across the honeycomb (see fig. 129).
_78

1600
1500
1400
1300
1200 a:0 .
1100CI)...:::I...III
1000 ...Q)a.EQ)
900 I-
800
700
600
500
400
3002.0
;;
Ni cke1 201
Haste110y X
. ·.1.
Shutdown
1 . ; •. '
, , ' ':r.\~,.,-'/;; .,."...,'. i' () /',. ,
.- - ! -'. " ",'lJ I 'oK,, :,,'~ /' ',r-H
, . / "',-- /':"..,'lJ:/P <o~j.: ,.il;
Ii j'
...-;- '\"0..:-0--0 ---0
..,--. _.
, '
.. __ ~__. fl.
!,
,h ~. __:_:_ ._.~
300 .....__......-A- ............ ....._-'-_--''---J-- -'- -"- t --lI L--L... -l1ul L_..La 0.5 1.0 1·5 2.0 a 0.5 1.0 1·5
1600 , ......:.1'. ~ . :.
1400
1500
a:0
CI)...:::I 1000...III...CI)
-..J a. 900\.0 E
CI)I-
800
700f
i600
11
500 ! .
400
Distance, in. in direction A-A Distance, in. in direction A-A
5·25585
Figure 122.-Topwal I temperature distribution, cruise mission.
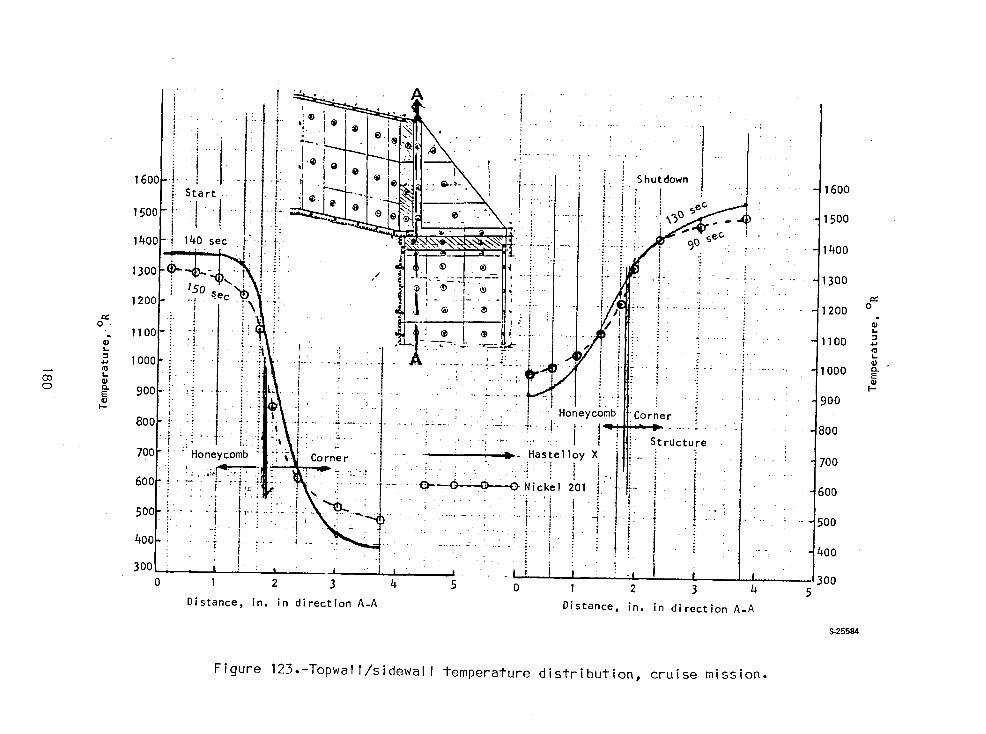
l .. ....I
ji1 _ J ] ( Shutdown (• . _ _ I ; " " 1600
• ' " - : :' I
1500 : ( ® \ .... i, i =': %_B - . - 500, ' .:. _. _ !, -
1400 140 sec F!... (. <_._,_,_._ :- : :. _e_c . .": " ' !i " :.!:". : _ :: : :" 1400
'e ® . i, i.
lso0-_- -_ " : _-.--_ I" .t. ...... 13oo_)'1 : ...... : . ..' :.,
1200 I ;-_'-"_ -o_. .. - .............. 1200 o.• :• 1100 " ® [ • ...] " " ...... 1100
:i i : i1000 .................. :- _: ,_.. : _ ,
!..i 1 i i .....i - : ': . . :..; / l ;o _ -" 000 o.
,- t . , i.... , " '_ " i-": i: ...... oo[ .i / ! ._'_ i . 'i " " _ . .•. . " ' Honeycomb Corner I
8oo-:-...! -t.. i: ii\ :....,_.............:........":----:.....t I. t ....l"i'::r i.: -..... 8oo_:' _!': '-'" ; " '.... ' "L ": " ] i" Strdcture
700" !"' Honeycomb _;'{_ Corner .... , " " :. _ - Hastelloy X _._ i -• _:, ---"-_, _-,_ ..... - ;: • ' - " ..._ " 1 " ", " " 700
60_ ....... ,;:- _Y o-_ ' ' '
• - I "f " ' " _........... • ' -O-Nickel 201 ] { : "i 600i. "i I'_-!-='_.I_..._L .... ,,--.. .: : _i _ i ._ , i "
-: .... :_ _._..: ..__ ] \ -_.,. ' • ' • _. .I ' iJ II "-.
t50C . _ _" :" " " _:-_ "- "_-_ '. ...... • ......... ; ............. _ -i _ f " _ . '
i.,. t i ' \. _ . , t ; i I ' " ;00
400 : - ! I " ' _ _"'_ .............. :-.-.:- i. i-. _ i "
: : ' : I , _00_oo , ' , , I , . ,. ._i J , _ _ -, i soo0 1 2 3 4 5 0 I 2 3 4 5
Distance, in. in direction A-A Distance, in. in direction A-A
S-25584
Figure 123.-Topwall/sidewall temperature distribution, cruise mission.
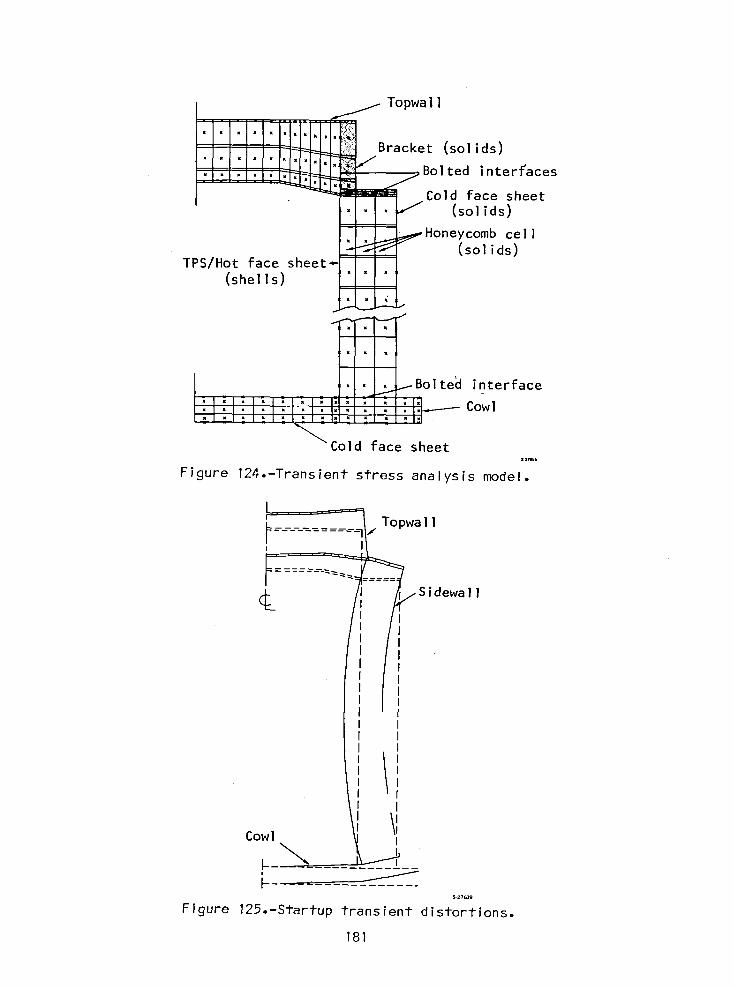
TopwaI1
_ Br_ ket solids
"l'I'l" _ _,__ _Bolted interfaces..... __m_l_ Cold face sheet
" "1" tt (solids). , _Honeycomb cell
'S/H°t facesheet"-?T_(shells). (solids)J
• • , IBoltecl interface
_Cold face sheet
Figure 124.-Transient stress analysis model.
TopwaIl
___ Sidewa I l
I
cow,I jlI
S.27639
Figure 725.-Startup transient distortions.
181
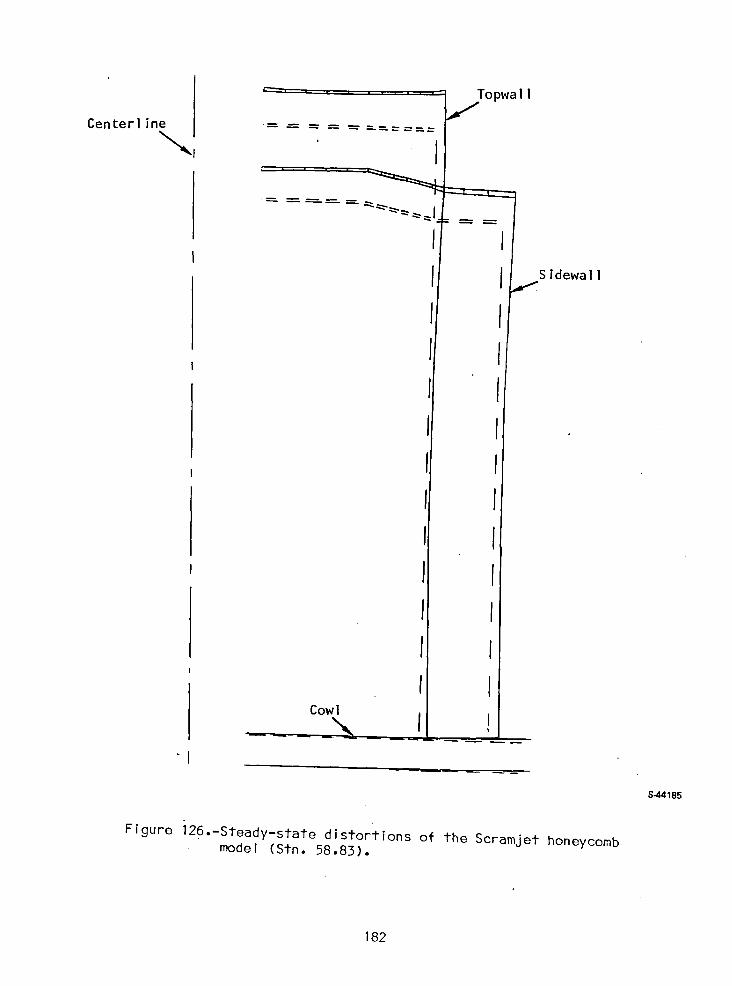
I
Centerl ine
"', I
II
Sidewa I l
I
Ii
I
IIII
I!
I ICow I
I f"I
S-44185
Figure i26.-Steady-state distortions of the Scramjet honeycombmodel (Stn. 58.83).
182
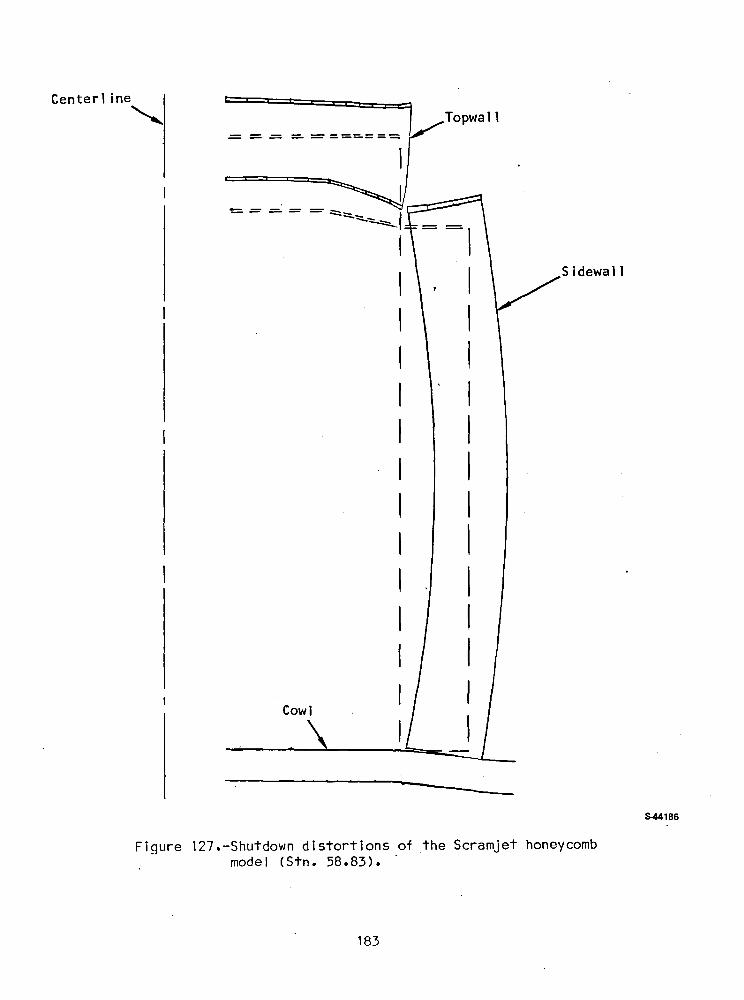
Sidewall
Topwa 11
Cowl
'= = = '= =======lII
= = =- = =- ':::::::'~l~~'\
IIIIIIIIIIIIII
Centerl ine
'"
544186
Figure 127.-Shutdown distortions of the Scramjet honeycombmodel (Stn. 58.83) •.
183
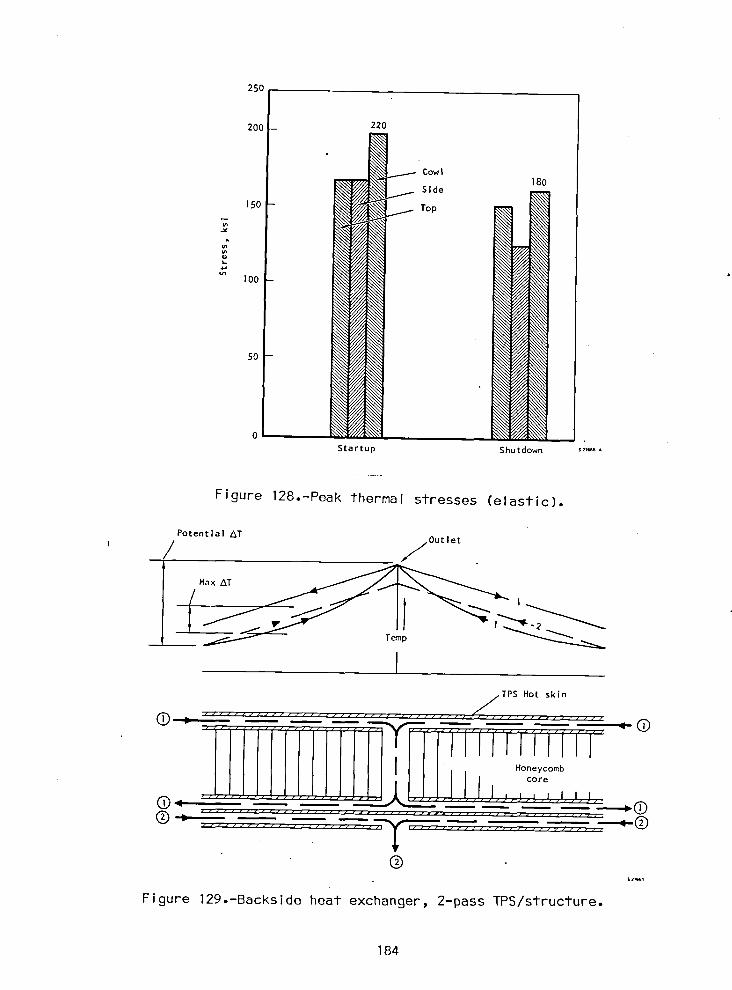
250
200 -- 220
Cowl180
Side
150 Top
i__J
I00 -
5O
0
Startup Shutdown s2_s_
Figure 128.-Peak thermal stresses (elastic).
Potential z_T
I / jOutlet
i I Max AT lTemp I_
I
(i)"* _ _
®sz_sl
Figure 129o-Backside heat exchanger, 2-pass TPS/structure.
184
Concepts (a) and (b) listed above are operational changes, while (c) involvesdesign changes and unwanted complexity. Studies indicate that the requiredreduction in AT can be accomplished entirely by the operational changes. Thehigh transient &T's that occur because of rapid starting and stopping ofcoolant and fuel flows can be controlled by ramping of temperature and flow.
In performing the transient stress analysis, the shear modulus of the hexa-gonal honeycomb configuration appeared to be too small by at least an order ofmagnitude for the thickness honeycomb being used. The shear modulus was increasedto a higher value (840 ksi) and the analysis completed. This increase inmodulus can be accomplished physically by changing the honeycomb cell configura-tion to rectangular instead of hexagonal, as shown in fig. 130.
Engine layout design--Layout drawings of the selected primary structureengine design were prepared both as a result of, and in support of, the studyanalysis. The drawings reflect the current engine design and show detailsof primary structure, TPS, struts, coolant flow routing, and engine-aircraft
interface. No backside heat exchanger for limiting 6T's across the primarypanel structure has been incorporated in the drawings. The need for this hasnot yet been established because the AT's may be sufficiently reduced by opera-tional considerations.
The drawings for the all-honeycomb engine design are listed below and pre-sented on the following pages.
Drawing 194112 Engine installation, airframe-integrated Scramjet
Drawing 194113 Engine assembly airframe-integrated Scramjet(6 module)
Drawing 194223 Strut assembly, airframe integrated Scramjet
Drawing 192224 Top panel assembly, airframe-integrated Scramjet
185
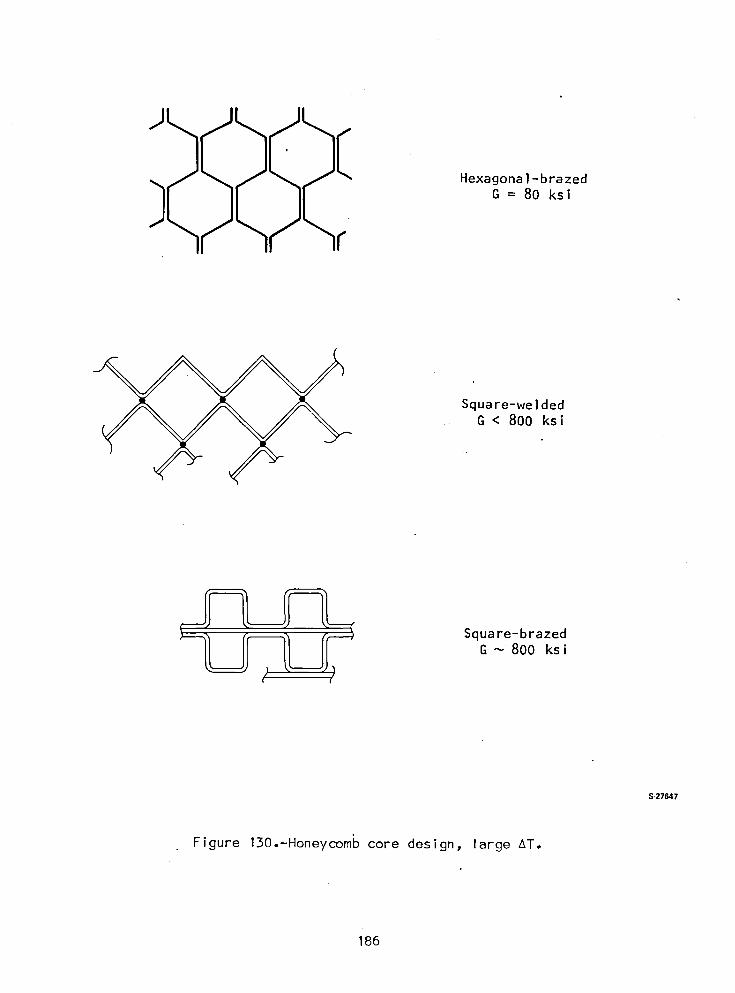
Hexagonal-brazedG = 80 ksi
Square-weldedG < 800 ksi
Square-brazed
G ~ 800 ksi
S-27647
Figure 130.-Honeycomb core design, large AT.
186
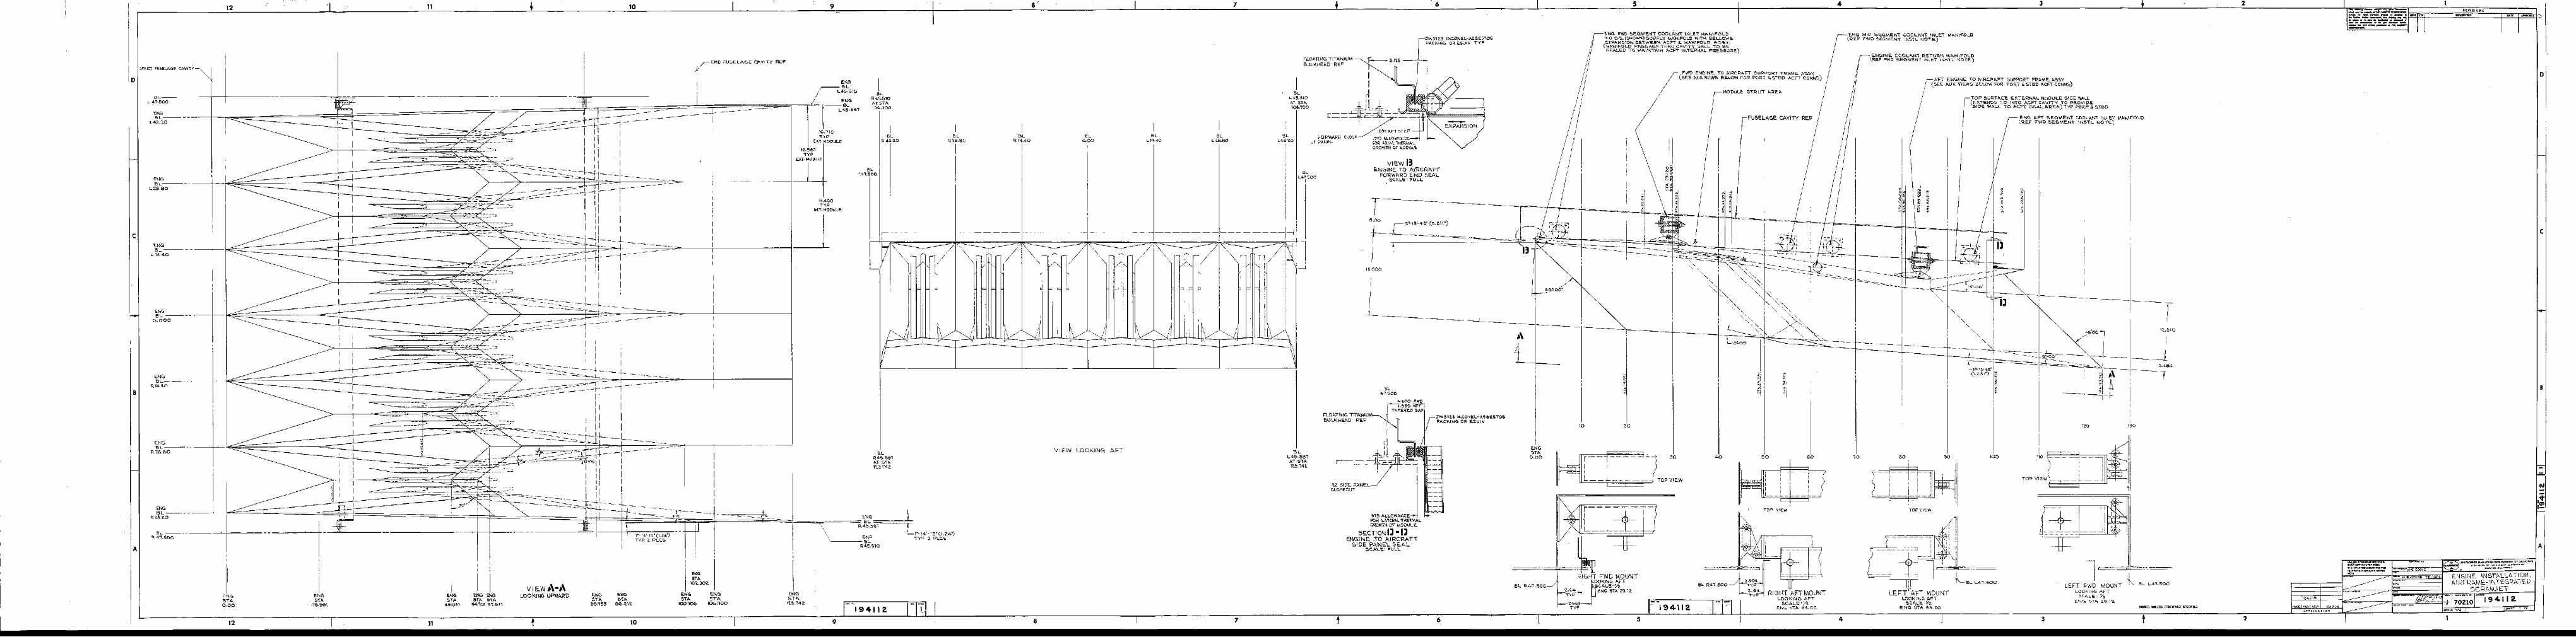
B
c
o
A
-,i,~
.....T 1 a, I
REVISIONS
•• -_•• --I 9 '" I I 2.Noaa NOXT ASSV USEQ
APPUCATlaN
2
1'2..5\0
130
,~
l =.~..~.,~-=
l-Bl. L41.500LEFT FWD MOUNTLOOK\NG AFT
00lES, UNLESS OTHEIlWlSE SI'I:CIflED
SCALE.' ~ENe. STA '2.9.1'2.
---"----1---,, ,, ,, ,, ,
__ L __ J
~====_=_=--,=n-.M"" '
-+ i____ "--_-----J
3
TO? VIEW
~=t==
E\\l.G A.FT SEG.IJIE,I--IT COOLA.\\l.T \N.LET M./>..\.I,\I=OLOlRE-\'" 'FWD '5E:.r:.IJIE.I-<T lI'ol,S,L NOTE-!
'00
TOP 5LJRFI\CE EXTE.RKJl.L MoDULE. 5\DE. WALL{E.'ll"TEN.DS 1.0 \\>I"TO AcFT CA,VIT'( "TO PROVIDE.SIDE WALL TO A,C1=T 5~L.ARE""')"TYP PORT&ST8D
A.FT E.N.GIN.E "TO A,\RCRA,FT SUPPORT FRf.l.,lt\.E. f.l.,-:'S,<(SE.E. A.U';(. '{lEW!:> BE.LOW FOR PORT a. STBlJ AeFT CON.l"\-:')
TOP VIEW
BO
LEFT' An MOUNTLOOKING AH
SCAL1:.=Y'2.ENe. $"TA 84 ·00
'0
EN.G. MID ""EGMENT COOLA.N' INLE.T WlAN1FOL.D(RE.F l=WD SEGME.'lJ.T lNSiL. NO'TE)
4
4
-FUSELAc:.E CAVITY REF
MOOUL~ 5TRUT A.REA.
40
FWD ENG.INE. TO A1RCRi'.FT .!:>UPPORT FRA.ME. .....~S'<(SEE A,u)(. VIEWS BELOW FOR PORT 5,ST'2>O "'eFT C:ONNS)
30
TOP VIEW
5
5
-,,
I,
_L
20
"ENG 1"\110 SE.G.ME.NT COOLA,\·,J,T INLET MANIFOLO3·0 0.0. (5t1.QWN) SUPPLY MAt-\\FOLD WITH BELLOWS,
(E.XPANSION. BE..'WE.EN, .....CPT l1;, M .....K1FO\..O ''''$'OY,M....NIFOLO Ptu;SAGE TI-I.RU CA.V1T'( W....LL TO. el:.SE.A~D TO \A .....\I'lTAIN ACF> ,1N"E.R\.l.AL ~E.$SURE.)
10
ENG'TA0.00
,--I L.--_±cc_
~~o l .~1
RIGHT FWD MOU"!T
~000K.ING AFT
Bl. 1<.4-1.500 e.CALE Yz'2..<04 EJ~G 5TA '2.9 1'2.;yp
'"'TW
VIEW I!ENGINE TO AIRCRAFT
FORWARD E.ND SEALSCALE' FULL
r:rM512.3 INCONEL-AS5E:STOSPACKING OR EQOIV TYP
~ 3.1'!.5-----;---j
-~
i
"2.'2. SIDE. PANE.L _CLOSEOUT
,)'15 ALLOWAI-ICE!=OR LATEIlAI.. THERMI>.LGROI'f1"1'i 01" MODULE.
SECTIO"! Il -IlENG,INETO AIRCRAFt
SIDE PANEL SEAL5CAt..E' l"UL\..
FLOATING TtTAI-1IUMBLlLK'HEAD RE.F
IIIIIi
n'
4:;:~4t '~__ .::: :L_~_j~~l...__.t::...; ~~-=.:':..
k C~
EXPAJ-!SIO\,\0,,>,<. AFT ST EP
FORWARD CLOSE S1S ALI...OWI>.N.CE~ f PANEL FOR .6-.XIA\.. "HERlAAL
GROWTH OF \l,OtlUL~
FLOATING TITANIUMBULKHEA-Q RE.F
BLL41.'5oo
IBL
L45.510AT 5T....lOi>-'!OO
BLL45.5B'A,5iA1'25.,4'2.
BLL43:Z.0
IV
BLLZe.80
BLL 14-40
\/~1.
BL0...00
I\/~/:
VI EW LOOKING AFT
8'
I
'LR 14.4-0
I
I"R'28.'00
~I
,---- ---------- --------1-----------------------1'
BLR45.38'1AT 5TA1'2.3.'14"2.
IBL
R 43.'2.0
I'LR45.510ATST....1000.700
Be41.'300
1941\2.
EB~====:=:\::-=:;\~-~ .::45.~e,1 -----r--L 1·- 14'-15"(I.'2..4·)
ENG TYP "2. PLCSBL
R4S.SlO
9
14.400-ryp
INT· MODULE.
E"G
fBL
1..45.510
E"G- BLt L45.~€>'
lG."Tl0TYP
e.:n. MODULE.
11<>.551,YP
EXT"""
ENG5-rA
1'2.3.,42.
"
I
I
I
II
~
i
II
I
i
ENG'TA
106."100
,
: 1
I'"0STA
10UO.
"NGOTA
100.10<0
-- ~
IE"G',A
aG"~.l'2.
10
I.>lG5-rA
80."155
VIEW ~\.~\LOOKIN.G UPWARDENG EOO
STA 5TA54.102. 51.1<;11
I IIENGOTA
48.031
11
ENGSTA0.00
12
~~-+-
~~--+--
ENG'L
R'2.B.IOO
ENGBL
L 14-.40
ENGBL
R 144.0
ENG'L
0·000
ENG'LR43.'Z.O
ENGBL
L43.'2.0
E"GBL
L2.8·eo
A
B
c
o

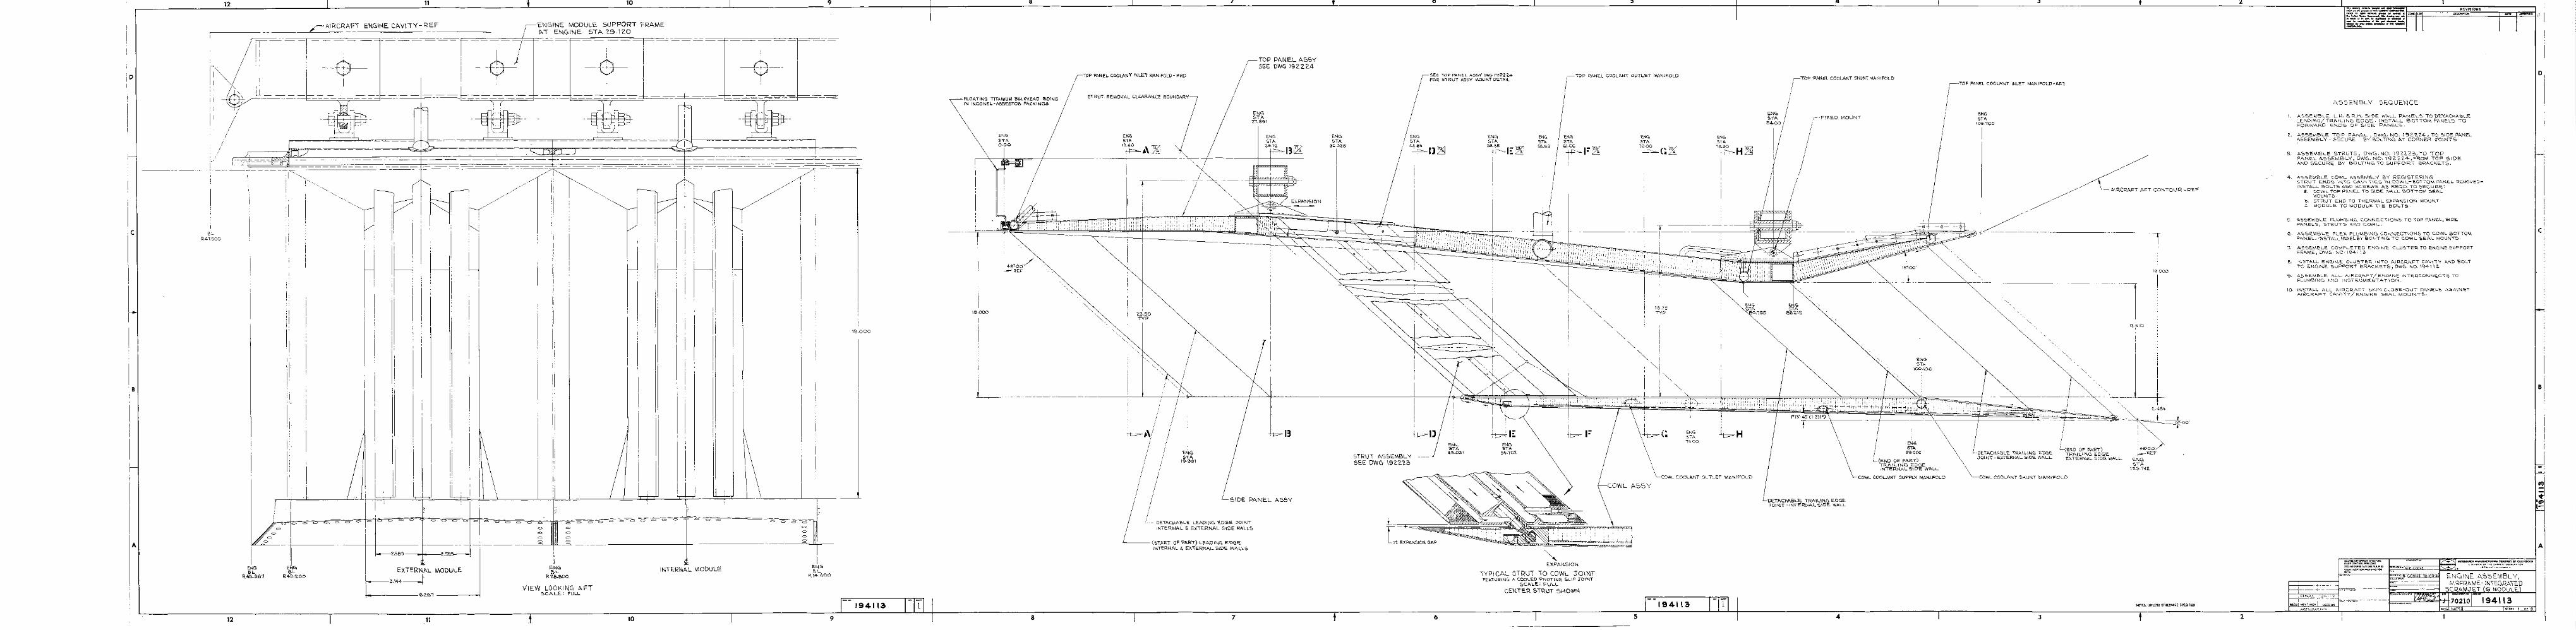
A
D
B
c
REVISIONS
AII:UUItCN loloUlU'.CTURIIolIi COMPANY Dr CAUflIRNIA.. o'V,.'ON Dr ... £ " ..~.£,.,. CO...O....,.'DN-
yD.~..NcL. c>'U"QRN'"
1 OF a
• N.,.'E..COOKE
~~~~A~~~~='ED:$TO IJ«EII~IIETATIOHS""A"86
rtlENTIFlCA"ION ""'~l(ING!'EA
~"
REao NEXT ASS\( USED ONAPPLICATION
1. ASSEMBLE L.I-\. ~ R.\-\. SIDE WALL P-"NE.LS TO DE'I\CI-\ABLELE."DING/TRAILlNC'; EDGE. INSTALL BOTTOM PI\NELS TOFORWARD ENOS OF SIDE. PANELS.
2. ASSEMBLE. TOP PAl--lEL, DWG-. NO. 192.'2.24, TO SiDE PANELASSEMBLY - SECURE 13'/ BOLTING AT CORNER ;rOINTS.
ASSEMBLY SEQUENCE
4. ASSEMBLE COWL i'.SSEMBLY BY REGISTERING5TRUT E.NDS INIO CAV I TIES 1'-1 COWL-BOITOM PANEL REMOVEDINSTALL e,OLTS AND SCREWS AS REOD. TO 5ECURE'
"_ COWL TOP PANIO.L TO slDIO. WALL BOTTOM SEALMOUNTS·
b. STRUT END TO Tf.\ ..RMAL E1\PANSIOl--l MOUNTc. MODULE TO MODULE TIE BOLTS·
5. ASSEMBLE PLUMBING CONfo.IECTIOfo.lS TO TOP PANEL, SIDEPAfo.IELS, STRUTS AND COWL.
G. ASSE\,\BLE l'LE."- PLUMBING CON>-.IIO.CIIOfo.lS TO COWL BOTTOMPANEL. 'N-STALL Pl>.NELBY e,OL,ING TO COWL SEAL "IOUNTS.
7. ASSEMBLE CO"lPLETED E.NGINE CLUSTER TO H\G,'NE SUPPORTi=RAME, DWG. NO· 194113
8. INSTALL ENGI>-.IE CLUSTIO.R INTO AIRCRAFT CAVI,V AND BOLlTO ENG,INE SUPPORT BRACKETS, DWG. NO.194112.
9. ASSE.MBLE ALL AIRCRAFT/ENGINE INTERCONNECTS TOPLUMBIN", AND INSTRU"'E.NTATION.
10. I"!STALL ALL AIRCRAFT SKI"" CLOSE-OUT PANELS AGAINSTAIRCRAFT CAVITY/ENGINE SEAL MOUNTS.
3_ ASSEMBLE STRUTS, DW<O.NO. 1'3'2.'2.23/'10 TOPPAl--lE.L AssENlBL,/, DWG. NO. 1'32. 2. '104·, l'ROM TOP SIDE.AND SECUI<.E BY BOLTI'-IG TO SUPPOR, BRACKEIS.
NOTES: UNLESS OTHERWISE SPECIFIED
18.000
ENGSTA
1'2.3.142.
I12.510
(END OF PART)TRAILING EDGEEXTERNAL SIDE WALL
~~.----"-
~; ii, • I I
DETACHABLE TRAILING EDGEJOIl-\T-E1\TERNAL SIDE WALL
COWL COOLJ\NI 514UNT MANIFOLD
EN'"5TI\
10G.700
TOP PAN.L COOL"NT INLET MANIFOLD-AFT
ENG5TA
lOO·\OG
\lS"..(X)'
iENGSTA
'l9.0oo
(END OF PART)TRAILING EDGEI,,!,ERNAL SIDE. WALL
COWL COOLANT SUPPLY I\\I\N\FOLD
FIXED MOUNT
TO!" 'PANEL COOLANT 5>-1UNT "IANIFOLD
ENG5TA
86.2.12.
DETAC>-II\BLE TRAIL\N-G, EDGIO.:rOIl-\T -INTERNAL 51DE. WALL
EN'"STA
BO.755
ENG5TA
T'-H~
194113
113.75TYP
I
I
f.... ENG\. 5TA
\
1500
COWL COOLAllT OUTLET MANIFOLD
ENG5TA
10.0.0 ... W-~(~L::6.:
TOP PANEL COOLANl" OUTLET MANIFOLD
ENGSTI\58.133
""E)(PA\-\SIOl--l
TyPICAL STRUT 10 COWL :JO\NT'FEATURIN.G A. C.OOLED PIVOTING ~LlP J"O\NT
5CALE: FULL
CENTER STRUT SHOWN
SE. TOP PANe.L AS5Y DWG 192224.OR STRUT A5SY "'OUNT D~TAIL
I)
5TRU"T ASSEMBLY5EE OWe:, 19'2.'2.'2.3
ENG.5TA
3<;·3'2.8
--=-=-~-:-~--o
13~
13
EN<OsTA
2"1.691
II
ENe,STA
19.991
23.50TYP
I I
TOP PANEL ASSYSEE DWe 1922.24
LfI~
51 DE PANEL A5SY
DETACHABLE LEADI\'\G EDGE JOINTINTERNAL 5, EXTER\-\AL SIDE WALLS
(STI\RT OF PAI<.') LEADING EDGEINTERl--lAL G. EX'ERNA\... 51DE WALLS
STRUT REMOVAL CLEARANCE BOUNDARY
'TOP PANEL COOLANT INLEl" MANIFOLD-FWD
':;11.1::::;11111::::::::1::;:11::
ENE. ENGSTA 5TA
r-----",..-:.O--;.,j"o""O....:;",r-;;=~---t'-------u-f" ~
18.000
FLOATING TITAI\iIUM BULKHEAD RIDIi'JGIN INCONEL-ASBESTOS PACKINGS
194113
18.000
ENGBL
R14.400
= == = =
l,:INTERNAL MODULE
I--
= =
II
II
ilIil
II
II
II
II
II
II
II
II
ENGBL
R2.8.BOO
VIEW LOOKING AFT5CALE: FULL
I--
= c,= =
1---2.589 -_+---Z.SB3'---
1--------6:2.B1 ----~__4
EXTERNAL MODULE
1-----3.,44---l
I~~,~
I ~
II.
IIj
I
E"'"BLR43.2.00
r-'!\
I
12
~ ~~_A_\R_C_RA_F_T ENGIi'lE CAVliy-R_EF______ jENGINE MODULE SUPPORi FRAME,..------.-- - L- - / . Ai ENGINE 5TA '2.9.120 _
'rT
1--- -- ---_-,---:::=-===-==--==.=0_.,----------c--- ,f---------7-1f--...,I-.~-- - I-- --.-_r-_-----,,..------t--=-=_~-=
i + -~~ -~ +~, ~ll'--------=-= f--_-=-_--=-- _- _ -=-=- =1- ----=-_ L_=-=-=--'=""_---==--=-=-=-==--=1- ----:._ .- -==--==--=-_-=--= .=1- - -==- =* ------ = =-_-=-~--=-_-=f-- ---=_-=
;/ ~~R' rt -r::i--rJ~ __ Rl--W-~ ry:1 / - ~~~~- i ~g~ ~M~ I
! II 7 '- _ . ~ ..J =~=-1F'"'*
8LR41.500
A
B
c
D

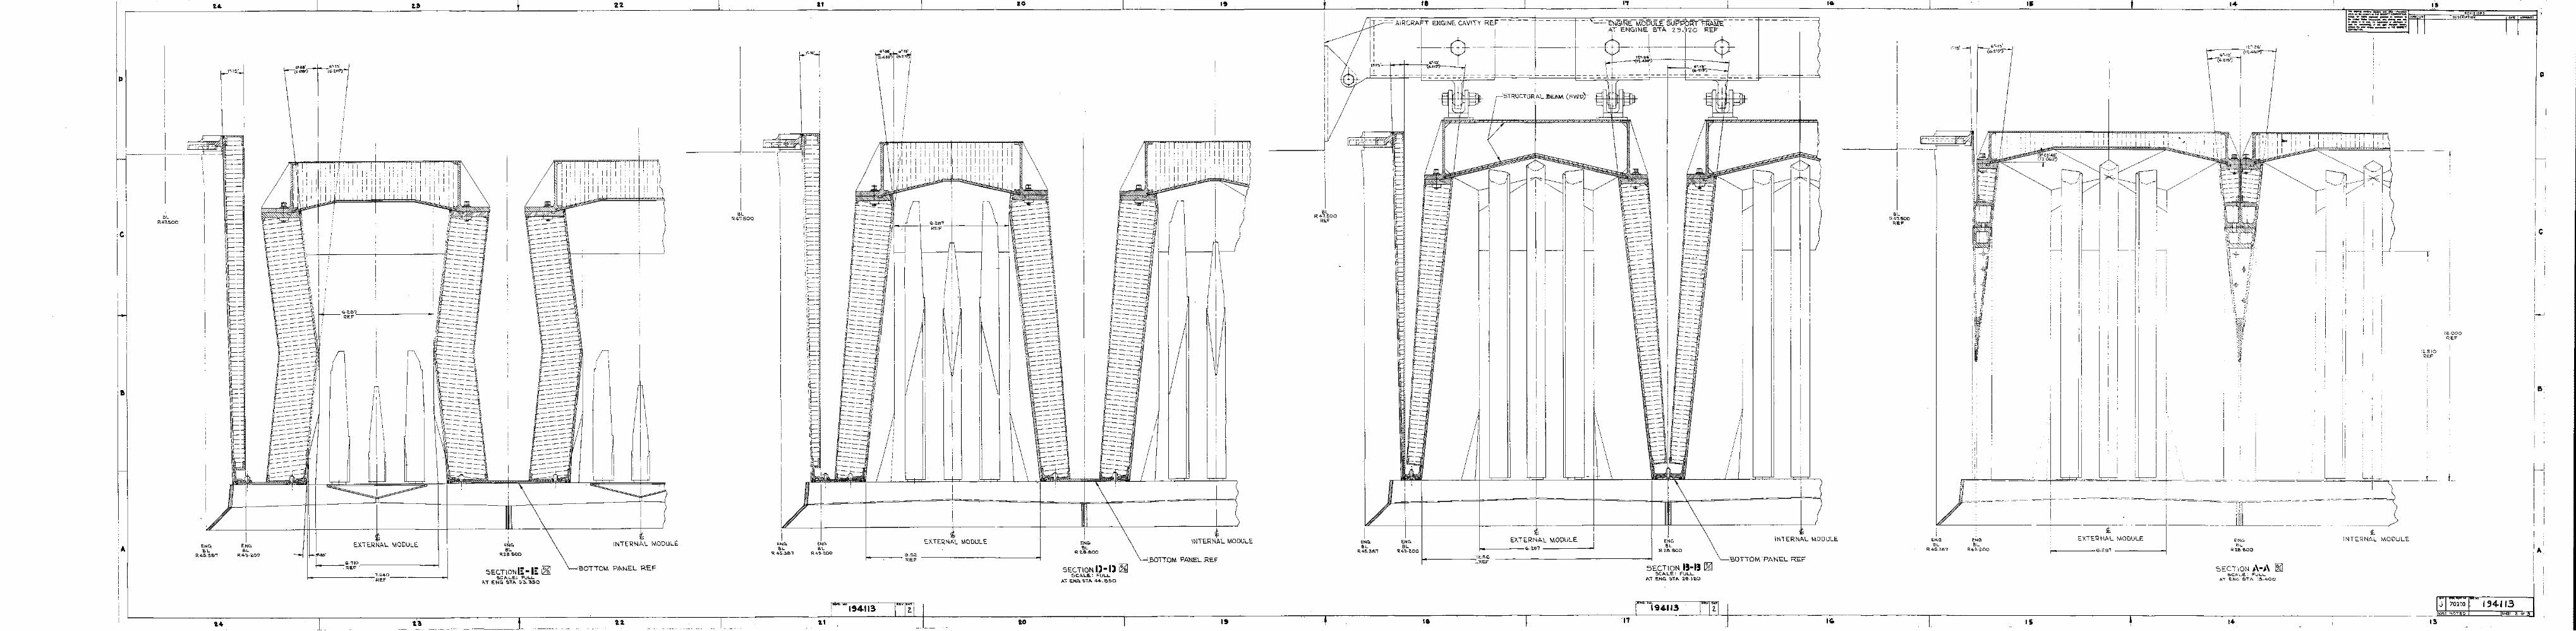
Ie
DATE""""""
15REVISIONS
DESCRIPTION
l~.OOO
REF
12..510REF
tINTERNAL MODULE
Ii I
~-~
I
I '
H
ENG5L
R'2.\O.\OOO
SECTION #\-#\ ~5CALE~ FULL
A'T ENG 51A 1~.400
EXTERNtL MODULE I
!------6.2B7~I
ENGEll
R411.'2,OO
m-===----.. -..~-
""l
I"NGBL
R45.387
ElLR47.5oo
RE.F
I.
~IN1ERl-oIA.L MODULEI
ENGElL
.1<'2.B.800
SECTiON 15-15 ~5CALE: FULL
Al El-lG 5TA '2.<;1.1'2.0
STRUCTLJR ALBEAlJe_(FW OJ-I
---~~~----
EXlERNAL MODULE1-----_tO.2.51 ------<
--...=.::....:,
~II!I
.l
II 'I I, I
- IIIIII
II
II
'1'2..56I---------""::.."E.F
ENGBL
R43.2.00
---
1-- - -A,1RCRAFT ENGINE. CAVITY REl=' -_~-
IIII
,i15"-I-+---h
1ENGElL
R4S.381
EllR41.500
R"F
"
-~-~----
---
INTERNAl-MODULE
-:.BOTTDM~£.AMELREF
-------------====-~--- J
---_ J
--- "------
-----------------------------------------.:-
--
---
-----
---
IENG
. 5lR'2.8.5oo
--.
---
---------------
---
--------------'-----------~-
---------------------
------------
20
-JJ.II_+-\--"'·'2.87·---j----+---+'--.-.HR--=-=-=___ RE.F_ -
El\TER1'lAL MODULE
f-------~.~~ ----------------l
SECTION I) -IJ ~SCALE.: FULL
....1 E.N.Go. STA 44. eSQ
--~----~--'-~.-
---------
---
---
---
---
------------------------------------
---
---
---
EJ:lGBIL
R43.'2.00
I"l1\GB'l
R 45.351
BLR41.500
BOTTOM PAN.EL REF
---
------
------
------
------------------------------------------------------
------------------
--------
------
------------------------------
ENGelL
R'2.El.800
5ECTIONI~-I~ ~SCALE.: FULL
....T ENG ~T"" 53.350
------
---
-----
---
---
---------------
---
------------
---
EXTERNAL MODULE
'MA'
1-'~--~'i~Q~---------<-1
---------
--------------------
--------
----=.
---
------------
--------------------
E.NGBL
R4'!>·'2.00
BlR41.500
A
c
D
L--.--------=-=-------~----,----------=-c_--~----..,___-------'---___:_o:::__-------r_----__~_..L....._.·_""_I'_4_'_1_3_-L...L..y .__--,.,.- ---__---T------.,.-----------.,..,....:.-r--~ ~- __r__-----'-_-._c-:I'7,-J--I·w-4·-""i-9--.:4-Fl~3~r--------~I~~--------r---------:-::---------.--------I~4_-------~ I!Eill:::§l~==1=9=4:::I'SH§!":!II'2.~OF:d

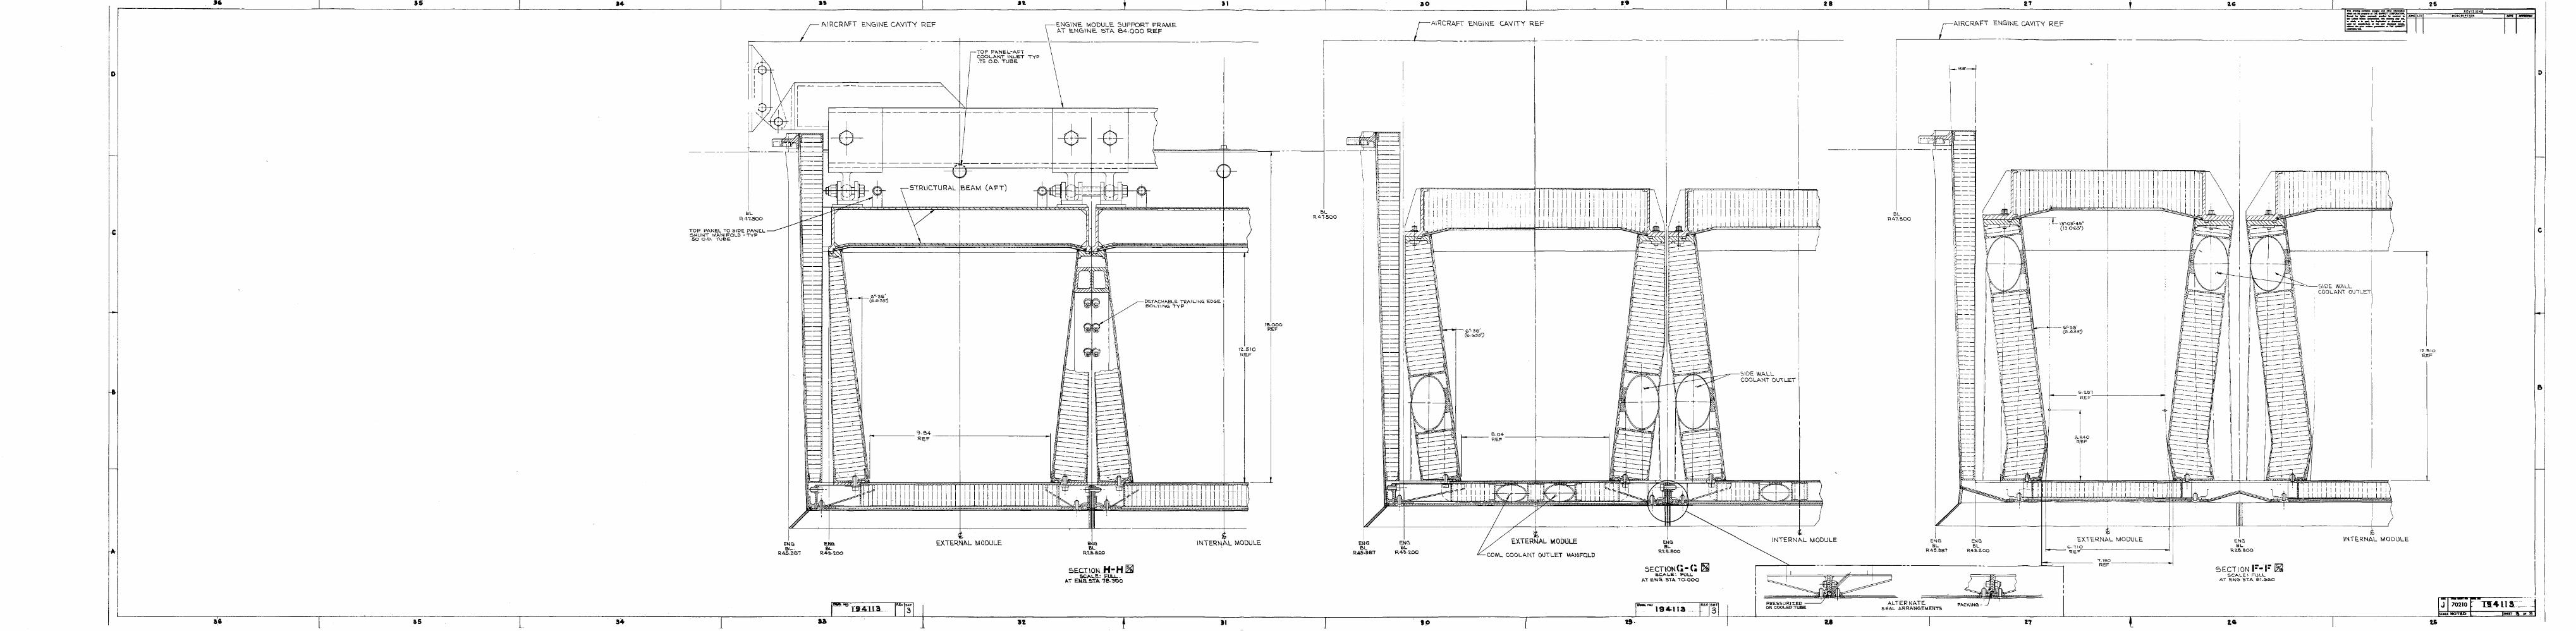
D
c
~INTERNAL MODULE
SIDE WALLCDOLANi OUiLEi
!
1'1..510R.EF
I
\e, I,
11111111]111 II [11\] I. II I,!, ',. l. I, !'" ' ! !l I I ! ~ I ; I I I I I IIi; I II ;, ,!; I I I'
'I
!
mm I
IENG8L
R2.8.800
SECTION 1:'·1::' ~SCALE: FULL
AT Elo!G STA 61./OGO
r r r Ii i i II II, ! 11
11
11
1
11 1, I
! 1 i I: :
"'R'~?------.j
I1III II1I I
I! III III1,~ I! If j I! Ii
-r~----~--·--- f-
EXTERNAL MODULEf-- ;~~o~ ----I
t;:--~~==
',ci\!r------+-----IIb#( \
";"-1---~ !Ii! ! : ! I j : 1 I II I I' I I :, J I : i·1 : I : :1:1: ~ ! I. ~L '-, I I I : I 11 I : I I I I I I : I II III I11I1I1 II iI;I;~ Irrjh ~ ~ ,m, ,il"I' I "i 'II
I--+--
IalG5L
R43.2.00
~:il~
1/I
HIGBL
R45.aB7
_____________t=:=::::;---
I
8LR41.500
1---
-1--
-1--
I Ir-1--'~- '1'- ~~!_n~ ,L-_~--=-=
1--1--1--l------1---
It.-:~it="-==,1--1---
I='-:~If==~:1--11-:,,1---
I,C_''':::'1--r----!j---
'\===---:)
'I~~:\1-C ==I, --.~It-I --l==I~==111---It=l---::1--
'E=it-I =Ii==--1"1--,!-'1--
1-~-
INTERNAL MODULE
--,--
--
,----,---
----'------------~-,...----r---"
-'------c-----------
1.1'----
'E""--.---==-,~ --, -'----rt=====11-====c------
COWL COOLANT OUiLE.T MA.NIFQLD
ao .9 28 Z' t6 25. L..........-_t-----~' -l.--_~__--'-- ..l...__~=__==~=~----L------=-=---_~-I~~~~~~~~~::..~=...-=-~-~ REVISIONS
~ __ ....... '" _ .. ZONE LTR DESCRIPTION '-11 ...-.
RC---.- ..... - .....L AI RAF~_ ENGINE CAVITY R1EF____ CAIRCRAFT EI'{GINE CAVITY REF E1~':E'!=--==
BLR41.S00
113.000REF
1'2..510REF
L MODULE
D"'-TACH...BLE T'RAIL\lo!G EDGEBOLTING TYP
------
alG51..
R'Z.lI.aoo
----,------
E.NGINE. MODULE. SUPPORT FRI>.ME.AT E.NGINE. oTA 84·000 RE.F
TOP PA.NEL-AF1"COOL"'NT INLET TYP.15 0.0. TU8E
-_---.:.......-_---------
STRUCTURAL BEAM (AFT)
------ ---------" ,
-----
--I~S-.
--
EN6.BI..
R4~.200
1='Ii--1',11-,11--;':.1--
~I~=1'-
A.1RCRt>.FT ENGINE CA.VITY REF
,----------------II
IIL __
BLR47.500
TOP PANEL TO SIDE PAt-lELSHUNT MANIFOLD -T''o'P.50 0·0. TUBE
J6 15 14 .. II.' 31r--------'-----------L------------__...l-- ......:...:... ~__ L_ ...L- ~ l -'-~ ...,_L... _
5ECTION(:·<: ~SCALE'. FULL
'T ••GST' 'MOO ~
_NO 194;:1 fa 6~~~~~~ !iE====~===;S;E;~t=-T~R~~~~~M~'a1~TS~~P~~= ~====:=. ~·n:4113:-':"'-jL----------~.,.~---------T-~--~---'--u----------r---------:--~--'-------I---------_;ils...L-----;------l--.l.=.J.._t_---------~:_---------_.~--------_::'::__---------_r_----------=-----------____:r_----------_=_.L-....:...::~_=_.:..=__=..:.:.J:.....J~_+---'-l-------~---------_,-------------...L------__._--- -,-----------~ ISHEET j OF [f
.. as 34 la n II ,p $- 2.8 2., t& ts

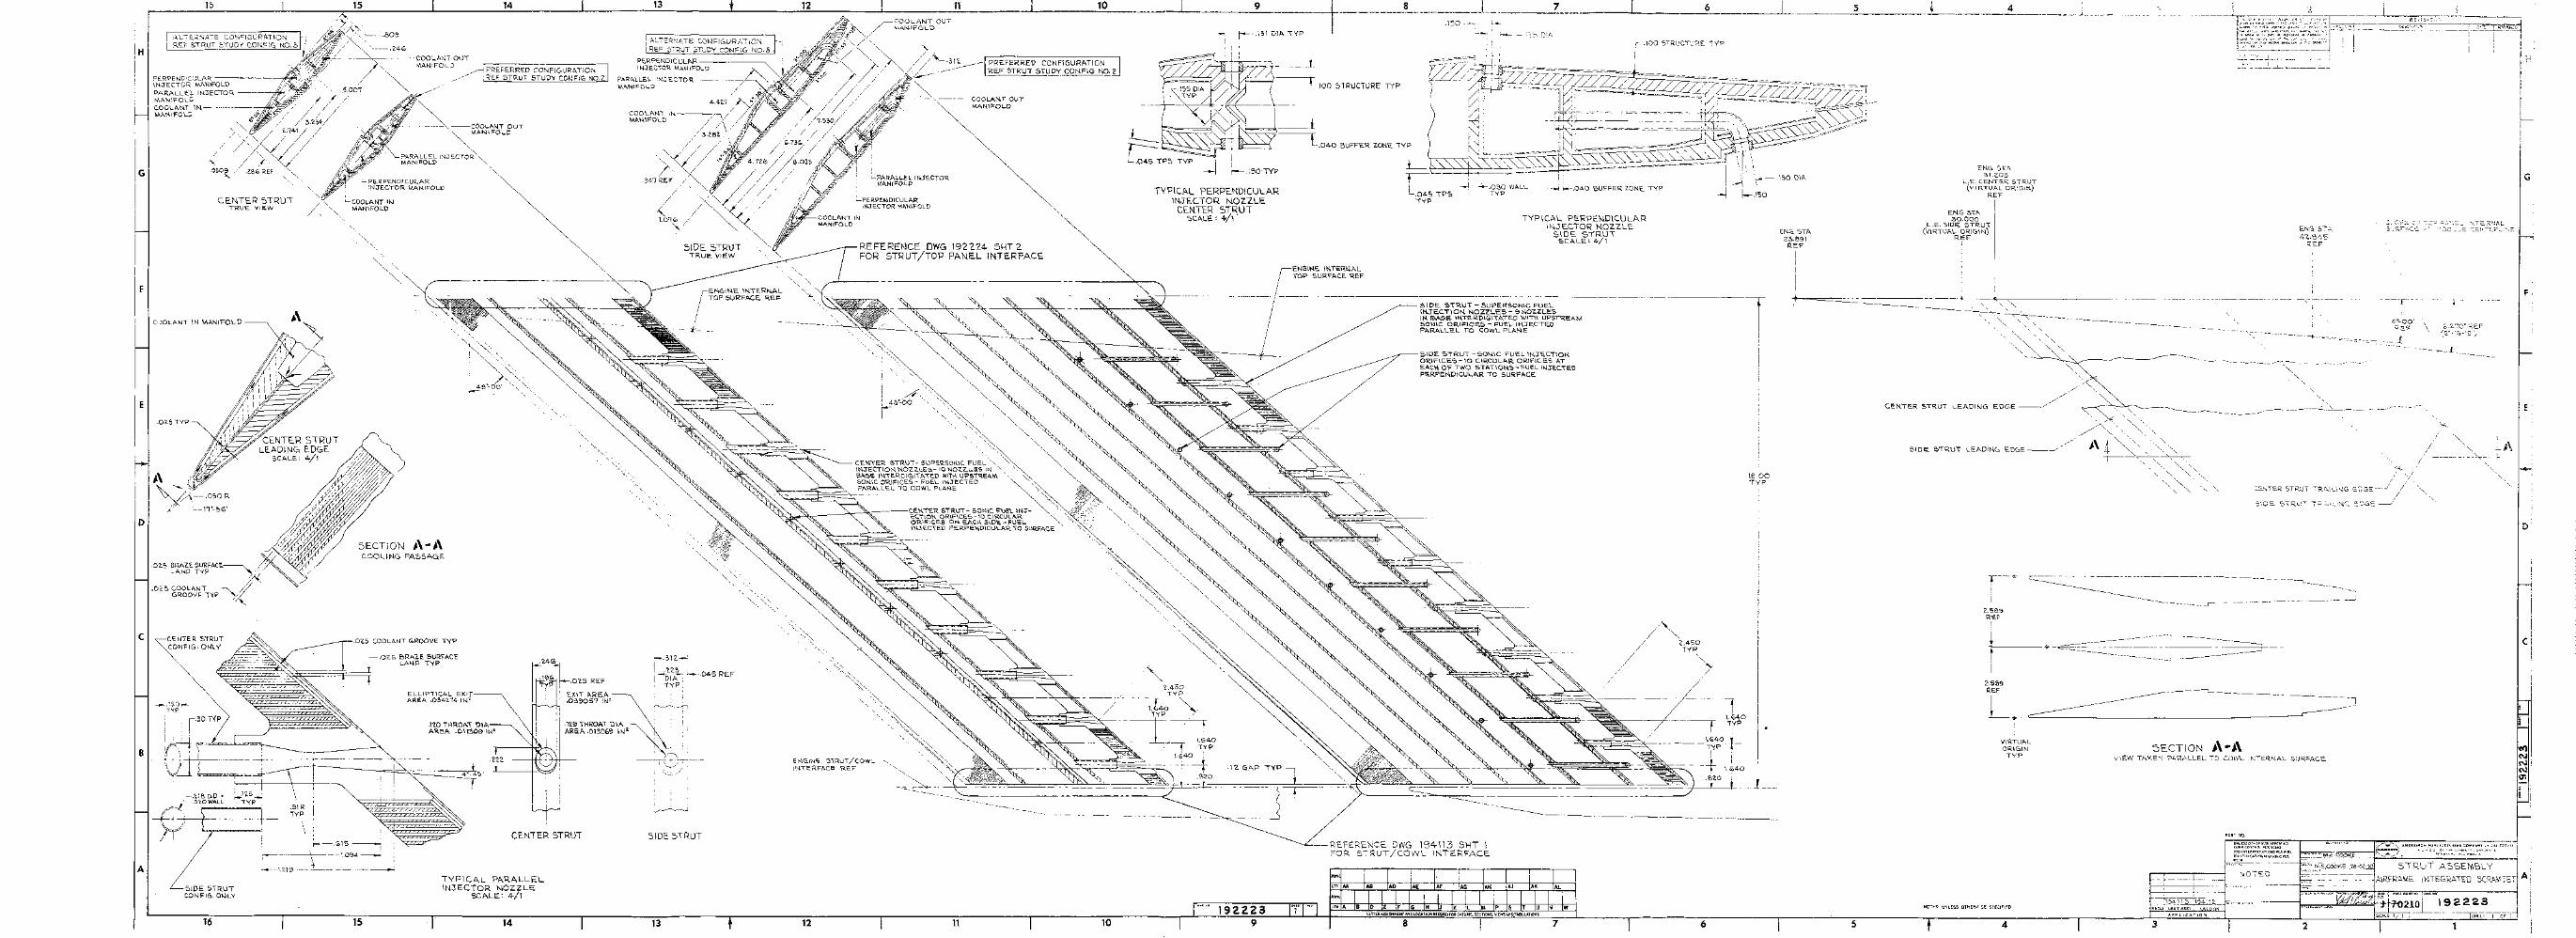
F
G,
D
c
I't)NN'NIO'l'_I,!
'NiERNAL':'E.NiER .• ,:,·.::::
c:2..70" :-<.E.F(G'-'C;:'1'Y')
--~I·-------.-
~~~--------
4"'-00'R2.~
-----r----
ENG ST.t:..4"2..3"",.5
REF
I
NOTED
UtlLUSOT~~RW\SESI'ECIFI£O
BUKR CO~TF;OL PER SC6S3STCINHRPRETA,T10NSPERPIBSIOENTlfICA,TICNMARKltlGPER"'C16
PART NO.
._----~--~--~
. ..1
···'~~~triH~~=iYLr=4'-.C2· LJ....~U__.i..J I·"
I~I
,134113 194112.
REOD NEXT ASSY USE;(;N
5ECTION j\ -j\VIEW TAKEN ?AR.A.LLEL TO COWL INTERNAL SURFACE
:===.l'----------------------'
4
VIRTUALORIGIN,yp
2..569
REF ============~L.I
2..559RE.F
t-I
-----'-------------.
---+~---=-~
Et{G 5TA31.2.03
i....E. CENTER STRU"T(V I RTUAL OR 10.1 N)
REF
+
.. 5 L._._.__.._---''---
ENG STA23.691REF
16.00TYP
1III
iI
6
:_100 SiRlICTUi-<E T,{P
/~/ 2.450
/ l"YP
// '>
.040 BUFFER ZONE. TYPf--.OSO WALLTYP
i 8 I 7
~------------~~.-'._~.=--==_._._---
L 100 SIRUCTURE TYP
---------REFERENCE. DWG 194113 SHT 1FOR 5TRUT/COWL INTERFACE
TYPICAL PERPEI-.lDICUlAR,\-\JECTOR NOZZLE.
SIDE STRUTSC"'LE: 4/1
~SIDE STRUT -5UPERSO>lIC FUEL11'UECT\Ot{ t{OZZLES - 9 NOZZLES-IN e.o..se. \NTE.RDIGI'TATED WITH UPSTREAMSONIC. ORIFICES - FUE.L 1l'\~ECTED
P"'R"'LLEL TO COWL PLMlE
SIDE STRUT -50t{1C FUEL \t{JECTIO"ORIFICES-10CIRCULII.R ORIF'ICES ATEACfl OF TWO STATIO>lS-FUEL llolJECTEDPERPE>.\DICULAR TO SURFACE.
ENG11-lE INTERlolALTOP SURF'ACE REF
'j"
9
r·131 DIA TYP
I,r-~--I-__-i----1.040 BUFFER 20NE IYP
192223
TYPICAL PERPENDICULARINJECTOR NOZZLE
CE.NTER 5TRUiSCALE; 4/1'
10
PREFERRED CONFIGURATIONREF STRUT STUDY CONFIG NO.2
---
11
lPARALLEL INJECTORMANfFOLD
REFERENCE OWG 19222.4 5HT 2.FOR STRUT/TOP PANEL INTERFACE
12
ENGINE 5TRUT/COWL-____INTERFACE REF '~
~
~~~--''<*---'---== -----
,-.31'2.J--.'<23
IrOIA'1 .045 REF
TYPi I
Iii i, I
13
SIDE 5TRUi
4.4~7
COOLAt{T IN----/\/lAAt{lFOLD ~ /\ /
/ 5Z8~/\
I ALTERN'ATE CONFIGURATIOi'\REF STRUT STUDY CONFIG NO.3
PERPENDICULi'R - _INJE.C'OR "'ANI FOLD
P"'R~LLE.L INJE.nOR ------,M,\NIFOLD
.12.9 THROAT DIAAREA .013069 llol'
CEtHER STRUi
PREFERRED CONFIGURATIONREF 5TRUT STUDY CONFIG NO.'2.
TYPICAL PARALLELINJECTOR NOZZLE
SCALE.; 4/1
14
.1'<0 THRO....T DIAARE.....011309 IN'
ELLIPTICAL EXITAREA .034'2.74 I N'Z
~ --COOLANT OUT
~ANIFOLD
PARALLEL INJECTORMAN1'l=QLD ,
.O'<S BRA2E SURFACELAND TYP
:"'-PE.RPENDICULARINJECTOR MANIFOLD
.0'<5 COOL"'NT GROOVE TYP
15
COOLANT 1>-1MANIFOLD
;,.L----"'----COOLAN1 mJl"AANIFOL)
\.91RTYP
\ [
. l--'G1S I'\ 109-:=J
16
SIDE STRUTCOt{FIG. ONLY
~~~NTER S,RUT~NFIG'ONLY
~
ALIE.RNA: E CONFIGURAIIONI REF STRUT STUDY CONFIG 1'\0.3 !,
.0'<5 TYP
CENTER 5iRUTTRUE VIEW
j\ I,
~~
0-·050R
X ~-I7"-SC;;'
PERPENDICULAR .------INJECTOR MA\-tIFOLDPAR.ALLE.L IN'JECTORMANIFOLc.COOLANT 1>.\-----\J\A.N.\FOLC
C-)OLAN, IN MANIFOLD
F
E
B
o
c
G
H
A

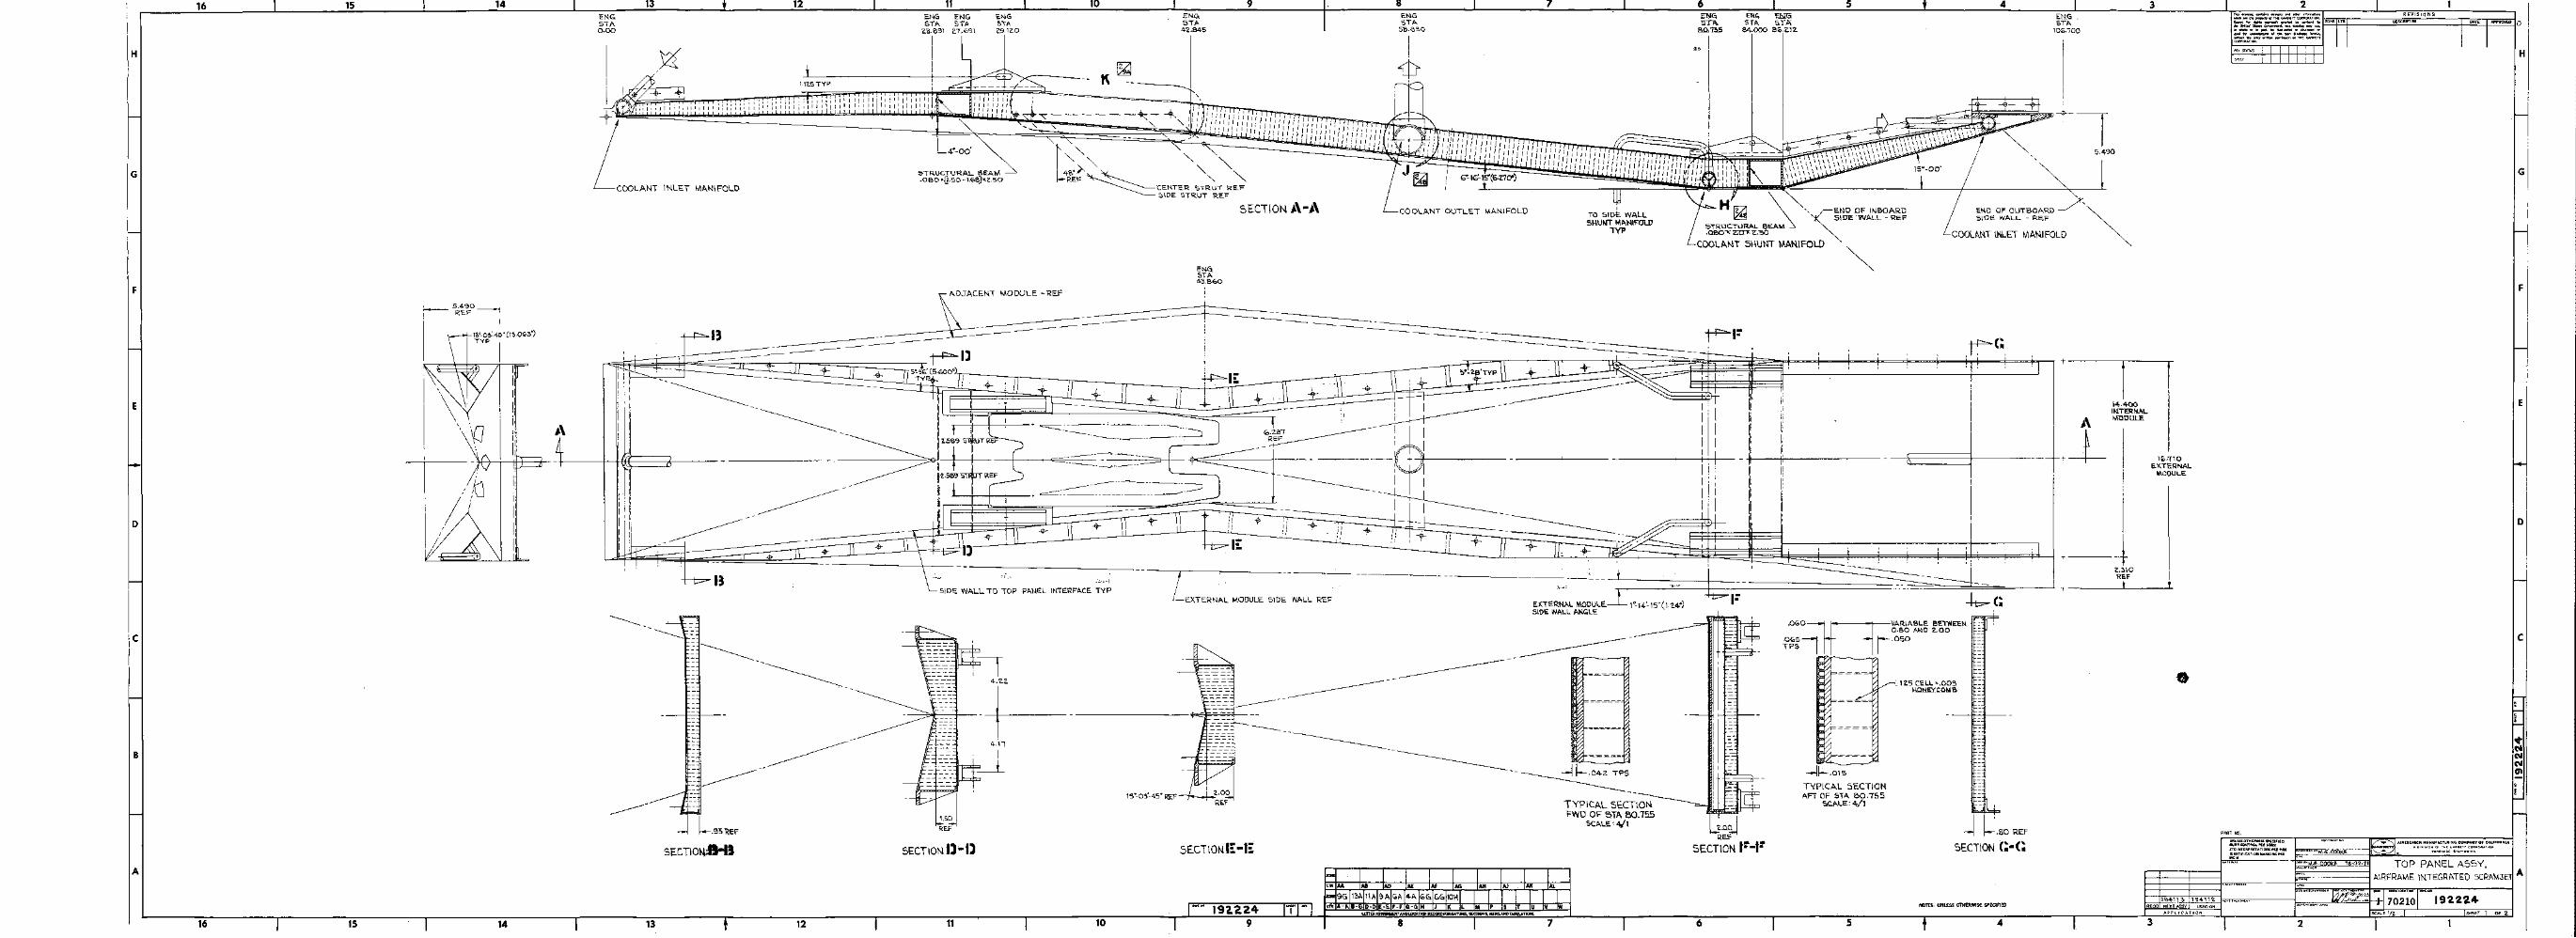
E
F
G
o
c
" OIV'S'CN ,,~ ~N~ ~ ..~~£TY CD~POR..~,C"
~ORR"NC£. ""t.or"R"''''
2
UNLESSOnlERWlSEsPf;ClfIED:BUltRCOf(TROLP'ERSC11113liTDlJiI'EAPRETATlONSI'l!RPIl'1S
::~FlCATIONMARKING PER
PART NO.
16:110EXTER"lAL
l/IODULE
3
19411'3 1~4"'2.REaD NEXT ASSY useD ON
APPLICATION
2..310REF
+-----T
-j---------'----~
::
-j-----.-----r
14.400IIHERfiA.LMODULE.
=
=-
4
j h'80 REF
SECTION <:-G
J'END OF OUTBOARD ~SIDE WA.LL - REF
COOLA.N.T rnLET MAl'-IlFOLD
NOTES: UNlEss OTHERWISE SPECIFIED
F~~~~
-J~.OIS
TYPICAL 5ECTIONAFT OF 51A eO.'755
"'C.A.LE'4/1
56
I ! I I , J ... - - =----::;-.:", I ,/, J I I J ! I I ; I I J I I J /I I I J I J ,'. _
I , I , , I J J I I: I !I, II; I II Iiii Ii i!f!Ii f !i!ii!f Ii Ii If Ii I!U;:Jill" J I
J I I I II, J I II , I " I I I J J I I I I :! :lit: : '., ~ I ~1G'-15"(6.'Z.70')
COOLANT OUTLET MANIFOLD
~I:-------.:::---~-- I·----::::---- --==-==--
--~--."::T":__--
192.2249
SECTIONI::-I::
LEXTERN~L MODULE SIDE-WALL REF
ENGSTA.43.860
,,
~K -- _
10
t<'" "" "-"" '" "-410°)-.. '" ""REF ~CEto\TER~TRUT REF~ 51 DE STRUT REF
SECTION j.\-j.\
_-iL - -----o:b I ,'"I II r III 11', r I' I"" I'""' - - - - - " "" I J, I I , , , I , I '
11
51DE WALL TO TOP PANEL INTERFACE TYP
4°-00'
STRUCTURAL BEAM.oeo ·(l.50 -1.G8]<2..50
SECTION 1]-1)
13
13
5ECTIOtie-B
13
III
'IIIII
141516
E
B
F
c
A
o
G
H

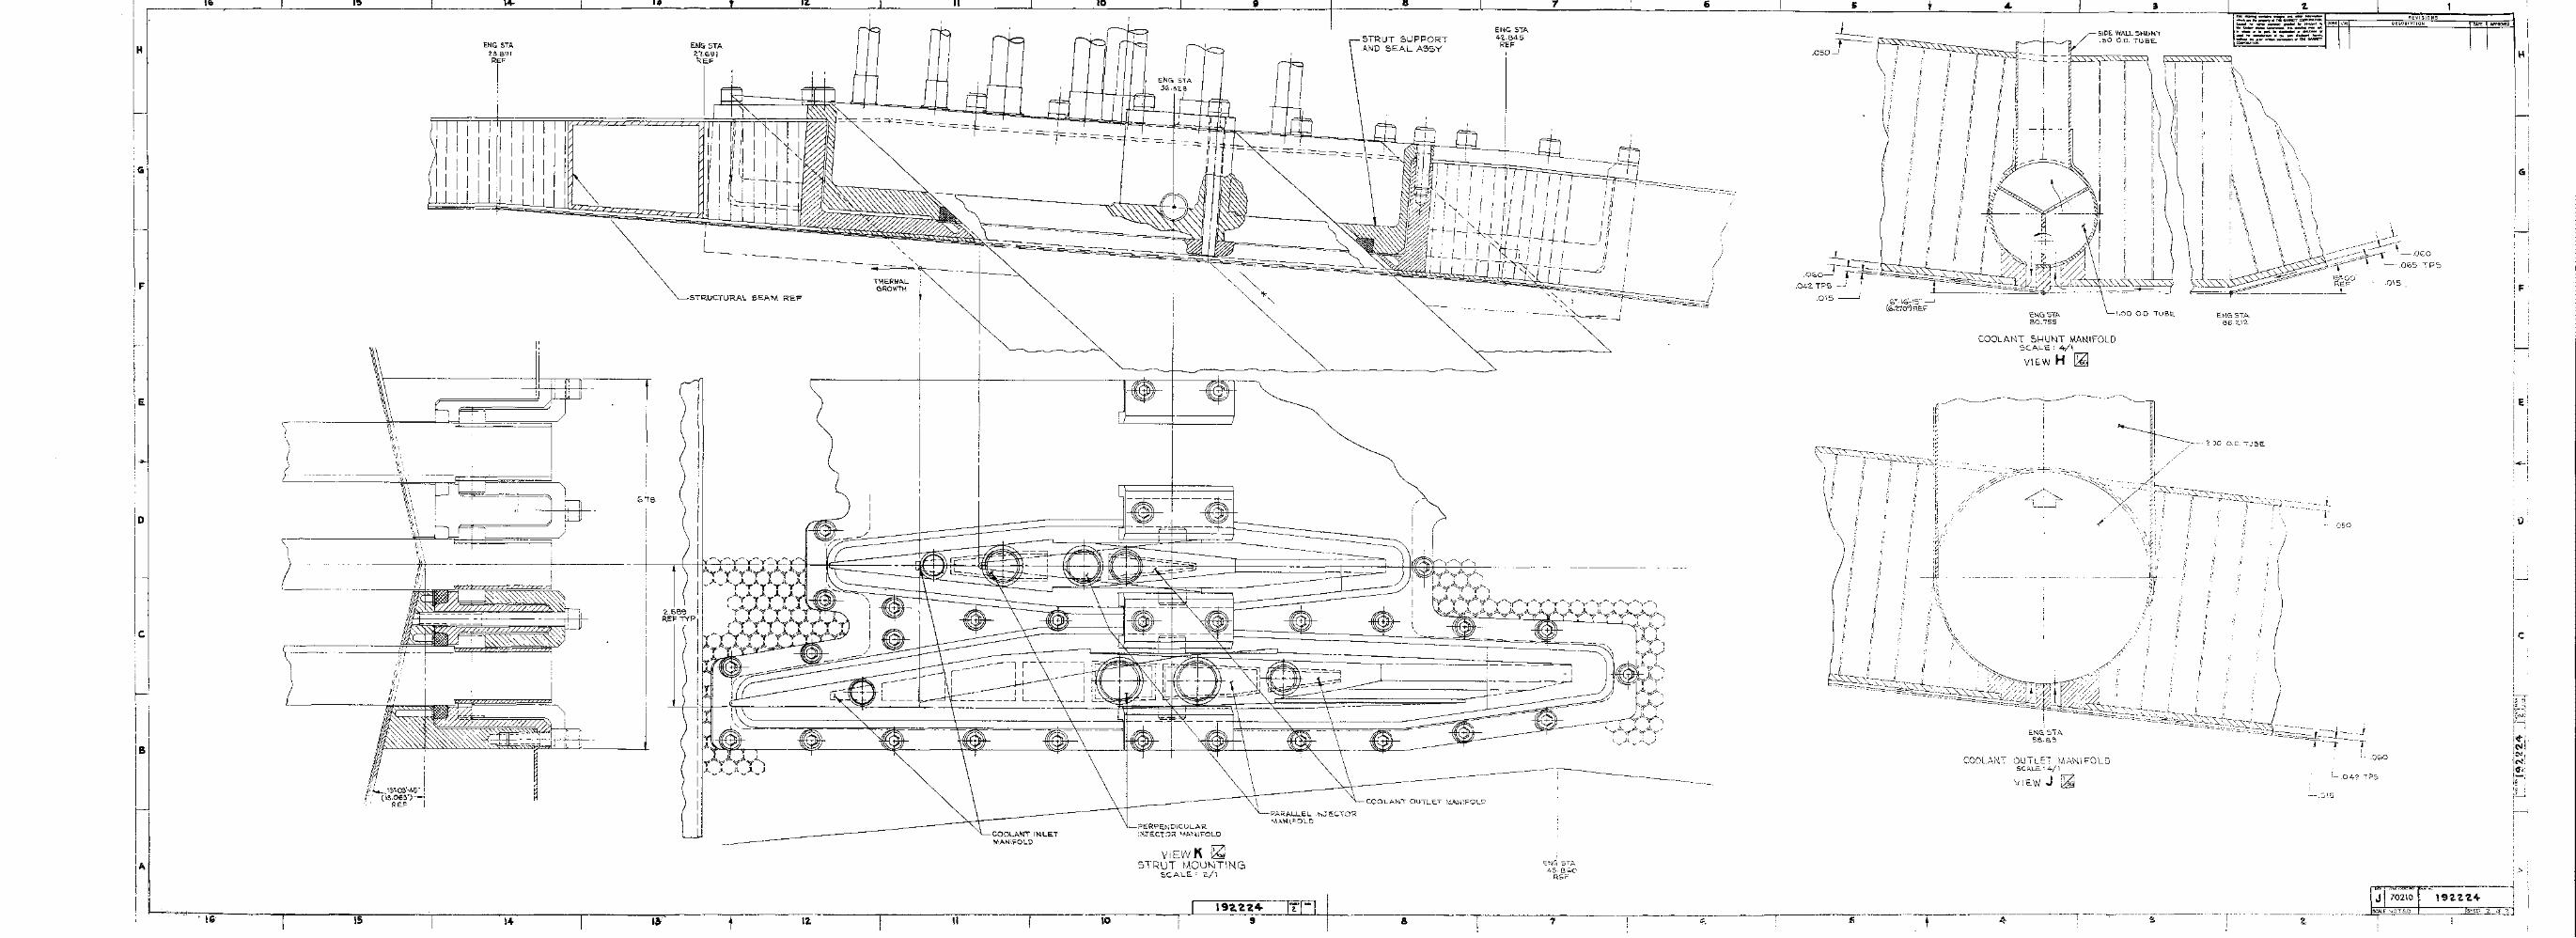
H
F
E
III 'I I,--j
!II
iIeI-
Ii
Lld"Hr~
I~,!i.~e-;[;-i,~ I:,> 'I
,r~
I
REVISIONSDESCRIPTION
~.(j15
;.~-
r=""".,.",.,~.;::;-------~-~
'9'a'a'l4 IT .__.J~~~t==~S"~,E[rl:.:I'2.:JCLF..::d--I 'Z.,
El-IG5TI'.80.755
COOL AN, 5f-\lJN, MANIFOLD5CI'.LE: 4/1
VIEW H ~
IiIi"II
IIIIIIIiI'IIII"
ii/~
I-~_:=
ii1II/
ST,,,43·8GO
REF
T--------7-------'---I.---- ;;-,-----T-----5·---I ; I
9
ViEW 1'\ ~STRUT MOUNTING
SCALE: 2./1
10
COOLANT Il-lLETMANIFOLD
II
THERMALI:lROWTH
, , ,--.-~,
12.t
-
I
L_
Etl/GSTAZ1.G91REF
'STRUCTURAL BEI'.M ReF
II
6.'7B
1415, \,
o
E
H
IIeI
r
I"
IFI


ENGINE-AIRCRAFT INTERFACE
A separate mounting frame is used to join the engine modules to the air-craft. Module loads are transmitted through the topwall honeycomb structureto the mounting frame. The frame transmits engine thrust, drag, and inertialloads to the aircraft and should prevent excessive deflections. The airframe
attachment links should be greater than three to satisfy fail-safe criteria.Truss arrangements are effective in meeting the stiffness/weight goals, butthe cross members interfere with the hydrogen ducting. The frame must accom-modate module thermal growth and must not impose excessive thermal deflectionson the airframe.
The selected concept is shown in fig. 131. In this case, a total of sixmodules comprise the engine assembly. The frame is rectangular with crossmembers at the module split line. It was assumed that the maximum temperatureof the mounting frame will not exceed 316°C (600°F). This temperature is basedon calculations made for the HRE environment and assumes the use of flow baffles
to limit convective heating by leakage flow in the engine compartment. Inconel718 was selected as the preferred material.
Six mounts join the engine frame to the airframe. All mounts carryvertical loads; thrust loads are through the three forward mounts; the twocenter mounts carry lateral loads (see fig. 131b). Swing and sliding linksare used to accommodate thermal growth. An alternative is to use only thefour outboard mounts. This may be necessary because of limited accessibilityto the center mounts.
The spacing between the fore and aft mounting frame beams ("wheelbase")should be maximized to reduce deflections between leading and trailing edgesand aircraft outer skin. The corresponding fore and aft module attachmentpoints should be located where the primary structure temperatures are equal.This locating scheme will minimize differential thermal growth between foreand aft mount points, thereby keeping the module axial centerlines parallelduring operation. These criteria can be met by locating the frame beams shownin fig. 131a at stations 29 and 85, where the topwall primary structure isabout 24°C (75°F) during normal operation.
As shown in fig. 131c, the aft module mount is fixed axially whilethe forward mount is free to slide axially. The central modules are fixedlaterally along the inboard sidewall at both fore and aft mounts. Lateral
growth of an individual module is outward from the engine centerline, andis cumulative.
The engine compartment must be sealed to prevent ingress of hot gas.Required sliding seals are indicated in fig. 131d. The fore and aft sealsmust also accommodate vertical deflection due to fuselage bending. As pre-viously noted, the effect of this deflection is minimized by increasing themounting frame wheelbase.
201
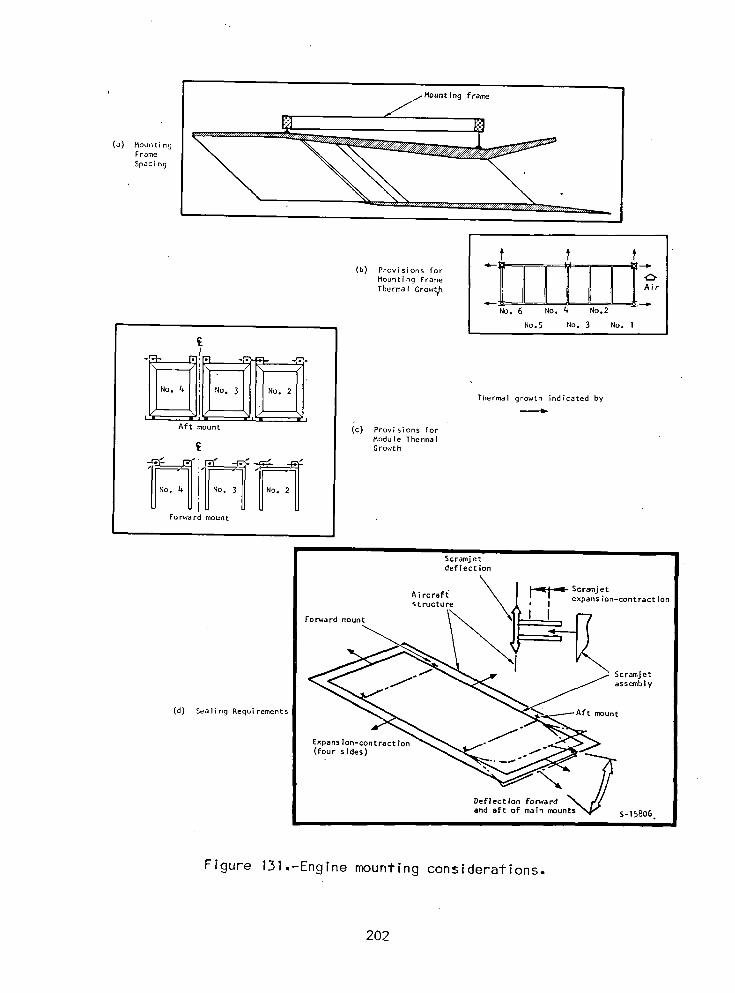
_ounting 'frame
(a) MountingSpacingFrame
f t f
rovlsonsfor-[IIillIMounting Frame
ThermaI Grow_h
No. 6 No. 4 No.2
No.5 No° 3 No. l
Aft ic) Provisions formount
Module ThermalGrov_th
Forward mount
Scramjetdeflection
A ircraft" Scram]et
expansion-cantractionstructure 1
Forward mount_ "I __Scramjetassembly
(d) Sealing Requirements mOunt
Expansion-canttaction J
(four sides)
and aft of main mounts S-15806
Figure 131.-Engine mounting considerations.
202

The space surrounding the r_ountingframe must be kept clear for hydrogenmanifolding. An additional area above the mounting frame, about 15 to 30 cm(6 to 12 in.) in height, is desirable for installation of the hydrogen fuel andcoolant valves. These valves should be installed close to the engine modulesto obtain optimum control response and to minimize the plumbing and the numberof firewall penetrations. The entire engine compartment cavity should bepurged for safety. Overboard vents will be required for dumping hydrogenduring engine shutdown, i.e., whenever coolant flow rates exceed combustionfuel flow rates.
The engine is modularized; however, because common sidewall leading andtrailing edges are used and because of limited access in general, a completesingle module assembly cannot be separated from the engine cluster. Repair ofan individual panel, except for the external cowl, will also require removalof the engine assembly from the aircraft. Strut removal is through the top-wall only. Access to the cowl interior and the space between sidewalls withthe engine installed on the aircraft is possible by removing a panel on theexternal cowl.
HYDROGEN FLOW CONTROL
Coolant Flow Routing
As previously discussed, the proportion of the total heat load absorbed byany individual flow circuit is not constant throughout the flight envelope. Toachieve maximum coolant utilization, active controls will be required to main-tain the coolant outlet temperature close to the 890 K (1600°R) limit. Thenumber of controls (coolant flow regulating valves) is dependent on how closelythe 890 K (1600°R) limit must be met. A minimum number of valves will be
required to ensure that the desired interpanel temperature differentials arenot exceeded and that the matching is close to that shown in fig. 14.
Maximum coolant utilization can be achieved by using a valve to controlcoolant flow to each individual module flow route--at least seven valves permodule; a total of 42 valves for a six-module engine. Mission analyses arenecessary to assess the resulting savings in coolant utilization as comparedwith control concepts using fewer valves.
The least complex approach is to valve all forward-flow routes in paralleland all aft-flow routes in parallel among the six modules. A third valve con-trols all strut flow routes. This concept divides the engine into three sec-tions: (1) the inlet section, (2) the combustor/nozzle section, and (3) thestruts. It is assumed that there is no large difference in heating ratebetween modules.
Calibrated orificing is used to establish the basic flow split betweenthe topwall, sidewalls, and cowl within the forward and aft circuits. Thisapproach presumes that the heat load split between panels will remain in areasonably fixed proportion for all flight conditions. Temperature sensors
203
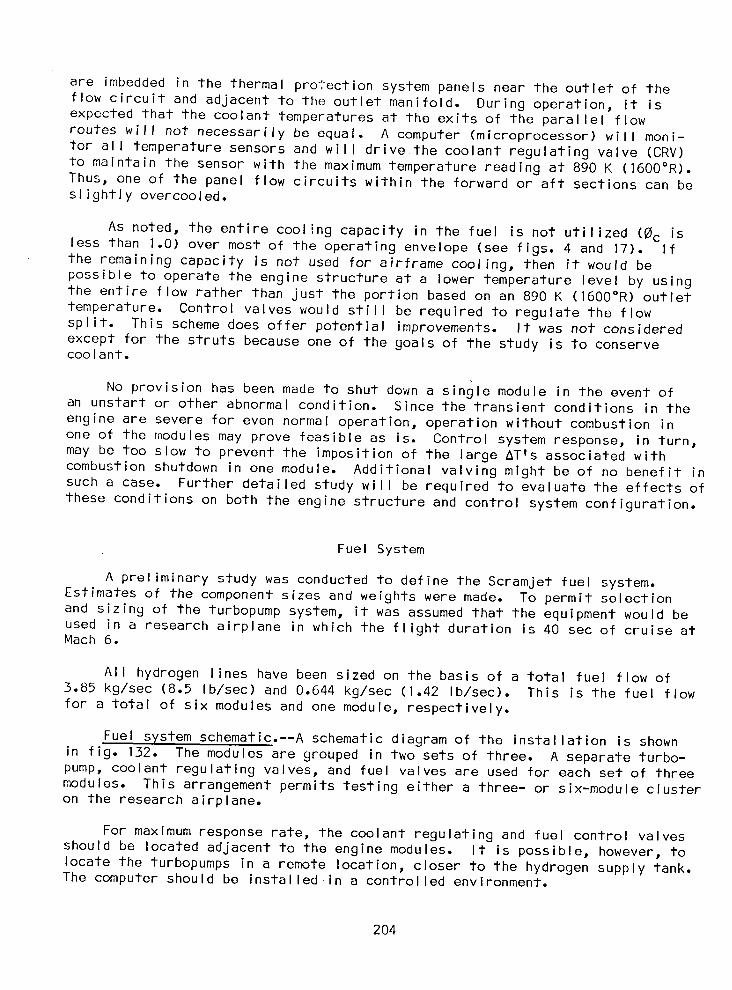
are imbedded in the thermal protection system panels near the outlet of theflow circuit and adjacent to the outlet manifold. During operation, it isexpected that the coolant temperatures at the exits of the parallel flowroutes will not necessarily be equal. A computer (microprocessor) will moni-tor all temperature sensors and will drive the coolant regulating valve (CRV)to maintain the sensor with the maximum temperature reading at 890 K (1600°R).Thus, one of the panel flow circuits within the forward or aft sections can beslightly overcooled.
As noted, the entire cooling capacity in the fuel is not utilized (_c isless than 1.0) over most of the operating envelope (see figs. 4 and 17). Ifthe remaining capacity is not used for airframe cooling, then it would bepossible to operate the engine structure at a lower temperature level by usingthe entire flow rather than just the portion based on an 890 K (1600°R) outlettemperature. Control valves would still be required to regulate the flowsplit. This scheme does offer potential improvements. It was not consideredexcept for the struts because one of the goals of the study is to conservecoolant.
No provision has been made to shut down a single module in the event ofan unstart or other abnormal condition. Since the transient conditions in theengine are severe for even normal operation, operation without combustion inone of the modules may prove feasible as is. Control system response, in turn,may be too slow to prevent the imposition of the large _T's associated withcombustion shutdown in one module. Additional valving might be of no benefit insuch a case. Further detailed study will be required to evaluate the effects of
these conditions on both the engine structure and control system configuration.
Fuel System
A preliminary study was conducted to define the Scramjet fuel system.Estimates of the component sizes and weights were made. To permit selectionand sizing of the turbopump system, it was assumed that the equipment would beused in a research airplane in which the flight duration is 40 sec of cruise atMach 6.
All hydrogen lines have been sized on the basis of a total fuel flow of3.85 kg/sec (8.5 Ib/sec) and 0.644 kg/sec (1.42 Ib/sec). This is the fuel flowfor a total of six modules and one module, respectively.
Fuel system schematic.--A schematic diagram of the installation is shownin fig. 132. The modules are grouped in two sets of three. A separate turbo-pump, coolant regulating valves, and fuel valves are used for each set of threemodules. This arrangement permits testing either a three- or six-module clusteron the research airplane.
For maximum response rate, the coolant regulating and fuel control valvesshould be located adjacent to the engine modules. It is possible, however, tolocate the turbopumps in a remote location, closer to the hydrogen supply tank.The computer should be installed in a controlled environment.
204
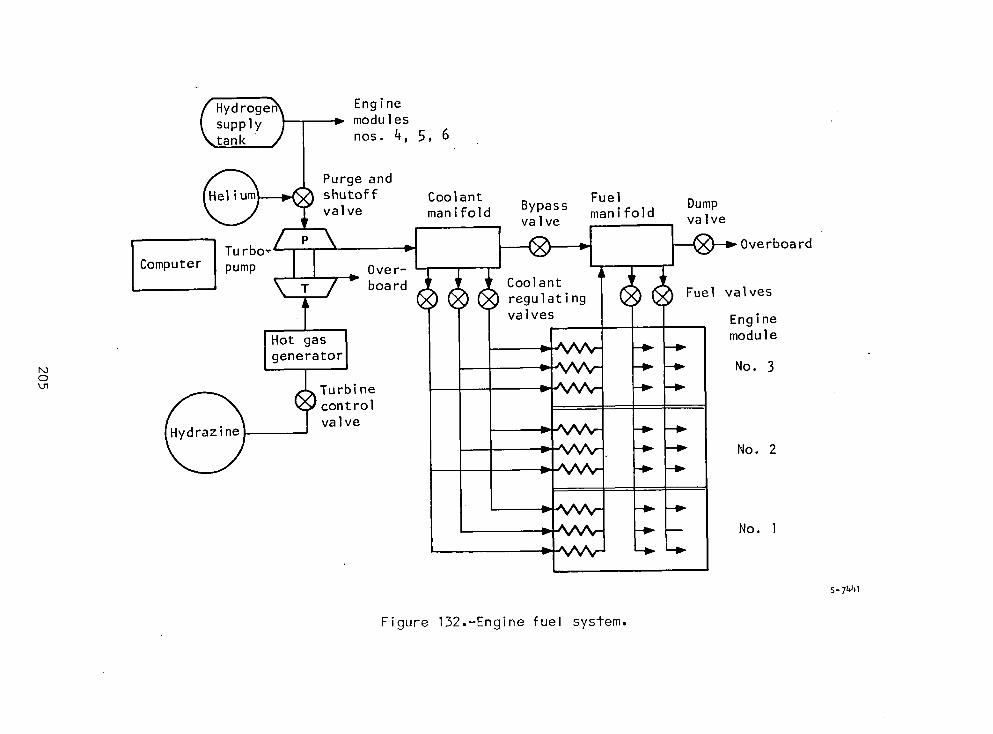
Hydrogen_ Enginesupply _ _ modulestank / nos. 4, 5, 6
Purge and
shutoff Coolant FuelT valve manifold Bypass Dumpvalve manifold valve
Computer pump _ Over-
- board Fuel valves
Engine
I I moduleHot gas I -_generatorI -I_ No. 3
o Turbine -D_
_/controlvalve -D_
-P" No. 2
s- 7hh]
Figure 132.-Engine fuel system.

Overall dimensions and weights of the system components are summarized inTable 23. Each valve will consume 2.7 watts except for the purge and shutoffvalve that will consume 35 watts when energized. Component descriptions arepresented below.
HydEggensuppl_.--The hydrogen supply in the tank is very close to satura-tion. It has been assumed that the turbopump can be designed to operate atthis condition by using a specially designed inducer. A separate boost pumpmay be required. Alternatively, the hydrogen supply tank could be maintainedat 0.34 MPa (50 psig).
Helium su_p!¥.--A separate helium supply tank is utilized to purge thehydrogen system after use and to provide a flow of purge gas in the payloadbay after the research airplane drops from the B-52. A helium supply line isalso routed to the engine compartment to supply helium to the fuel controlvalve actuators.
The tank is assumed to be spherical with an operating pressure of 34.5 MPa(5000 psia). The volume is 42.5 liters (1.5 cuft) and the tank mass is
72.5 kg (160 Ib), including 4.5 kg (10 Ib) of helium.
Computer.--The basic control system approach is to utilize a central pro-grammable digital computer that will handle upwards of 300 input parameters andcontrol some 30 output control variables. All valves in the various hydrogencircuits will be under the command of the digital computer. The computer pro-vides all logic and control signals necessary for (I) operating the combustorfuel feed and distribution as required by speed and altitude for desired equiv-alence ratios, (2) regulating coolant flows to the engine module panels tomaintain the desired skin temperatures, and (3) performing numerous safety andself-checking functions.
Estimated size is that of a I/2-ATR (short) standard size case, 12.4 cm(4.88 in.) wide by 31.8 cm (12.52 in.) long by 19.4 cm (7.62 in.) high. Totevolume is equal to 8500 cc (0.3 cu ft). Estimated power requirement is 40 watts,28 vdc. The estimated mass is 13.6 kg (30 Ib).
Turbopump sub___ss_s_tem.--Ahot-gas-driven turbopump is recommended ratherthan a bootstrap-type design as used on the HRE. The reasons are:
(a) The coolant _ is less than 1.0 compared to about 3.0 on the HRE.Hence, additional hydrogen would be required to drive the turbopump.A bootstrap design may be feasible if the coolant _ is maintained atunity at all conditions.
I
(b) The plumbing required to supply hot hydrogen from the modules to theturbopump is eliminated. This is especially important if the turbo-pump is in a remote location.
(c) A separate hot gas supply may still be required to start the turbo-pump in addition to the bootstrap arrangement.
(d) Greater flexibility for research testing.
2O6
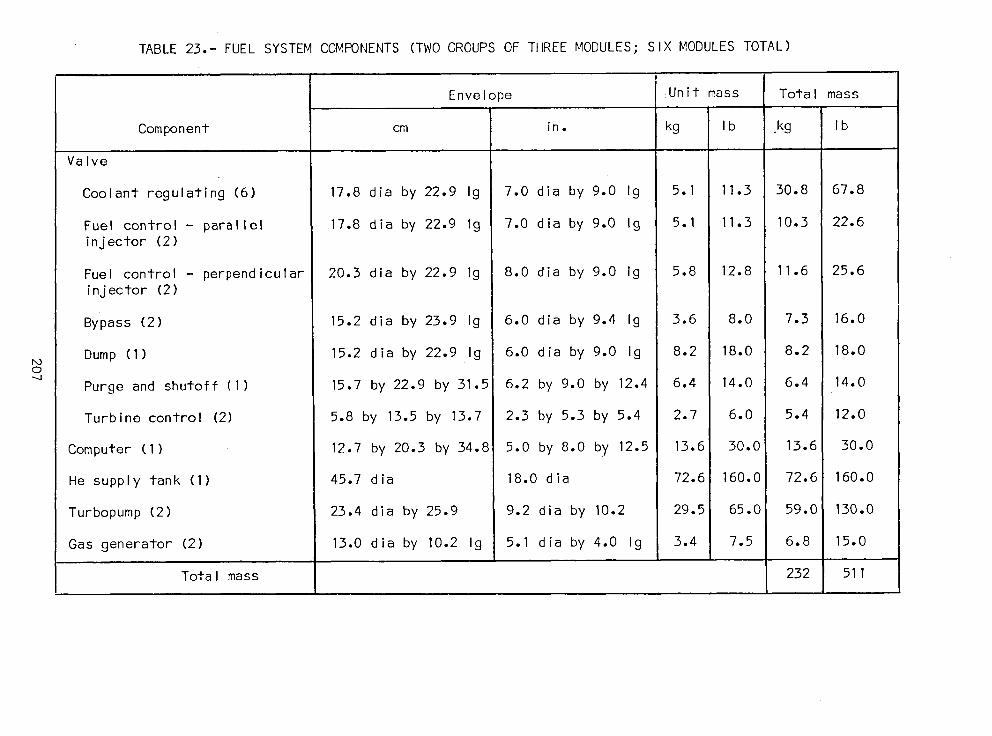
TABLE 23.- FUEL SYSTEM COMPONENTS (TWO GROUPS OF THREE MODULES; S X MODULES TOTAL)
Envelope [:Unit mass Total mass
Component cm in. kg Ib kg Ib
Valve
Coolant regulating (6) 17.8 dia by 22.9 Ig 7.0 dia by 9.0 Ig 5.1 11.3 30.8 67.8
Fuel control - parallel 17.8 dia by 22.9 Ig 7.0 dia by 9.0 Ig 5.1 11.3 10.3 22.6injector (2)
Fuel control - perpendicular 20.3 dia by 22.9 Ig 8.0 dia by 9.0 Ig 5.8 12.8 11.6 25.6injector (2)
Bypass (2) 15.2 dia by 23.9 Ig 6.0 dia by 9.4 Ig 3.6 8.0 7.3 16.0
_a Dump (I) 15.2 dia by 22.9 Ig 6.0 dia by 9.0 Ig 8.2 18.0 8.2 18.0o
Purge and shutoff (I) 15.7 by 22.9 by 31.5 6.2 by 9.0 by 12.4 6.4 14.0 6.4 14.0
Turbine control (2) 5.8 by 13.5 by 13.7 2.3 by 5.3 by 5.4 2.7 6.0 5.4 12.0
Computer (I) 12.7 by 20.3 by 34.81 5.0 by 8.0 by 12.5 13.6 30.0 13.6 30.0
He supply tank (I) 45.7 dia 18.0 dia 72.6 160.0 72.6 160.0
Turbopump (2) 23.4 dia by 25.9 9.2 dia by 10.2 29.5 65.0 59.0 _ 130.0
Gas generator (2) 13.0 dia by 10.2 Ig 5.1 dia by 4.0 Ig 3.4 7.5 6.8 15.0
Total mass 232 511
The characteristics of the hydrogen turbopump and hot gas generator aresummarized in Table 24. This particular design is for a fuel flow of 2.56 kg/sec(5.65 Ib/sec), which occurs with four modules at a Mach 6 condition. Thus, theturbopump has growth capability and would be suitable for an 8-module enginecluster.
Two different hot gases were considered--hydrazine* (H2N2) and hydrogenperoxide (H202). The resultant turbine and gas generator sizes are about equal.For a given mission duration, less hydrazine is required, and considering thatoxygen is a decomposition product of hydrogen peroxide, it is believed thathydrazine is safer to use with hydrogen.
It was determined that by using two turbopumps in parallel rather than asingle unit for all six modules, a mass savings of 10.4 kg (23 Ib) could beachieved.
Valyes.--The designs are electropneumatic poppet valves and were scaledfrom existing designs originally developed for the HRE program.
Coolant regulating valves: Three CRV's are shown in fig. 118, with onevalve controlling the same flow circuit in each module (a parallel-flowarrangement).
Fuel control valves: For minimum complexity, only one valve is used foreach set of parallel and perpendicular injectors. With a single set of fuelvalves, however, it will be necessary to shut down the entire set of threemodules in the event of an off-_imit condition (e.g., unstart). The cost ofa research flight as well as flight safety considerations in any ultimateapplication will probably dictate the ability to shut down an individualmodule. Hence, two fuel control valves will be required for each module.
Bypass valve: A bypass valve is utilized because the fuel flow requiredby the Scramjet exceeds the coolant #low requirement (_c < 1.0). The coolantregulating valves will be contr_lled to maintain the hydrogen outlet temper-ature (at the fuel manifold) at 889 K (_600°R). The bypass valve will becontrolled to maintain the fuel manifold pressure at 5.2 MPa (750 psia).
Fuel dump valve: The fuel dump valve has been sized to handle the totalcoolant flow requirement. It has been assumed that at the end of the Scramjetcruise, the fuel flow will be turned off, but the engine will still requirefull cooling for a short period of time.
Line size: Line size and hydrogen conditions for each location are sum-_marized in Table 25. The helium supply line to the engine compartment is 9.5mm (3/8 in.) diameter.
*Hydrazine is currently used by the Concorde and F-16 emergency power units andthe Space Shuttle APU.
208
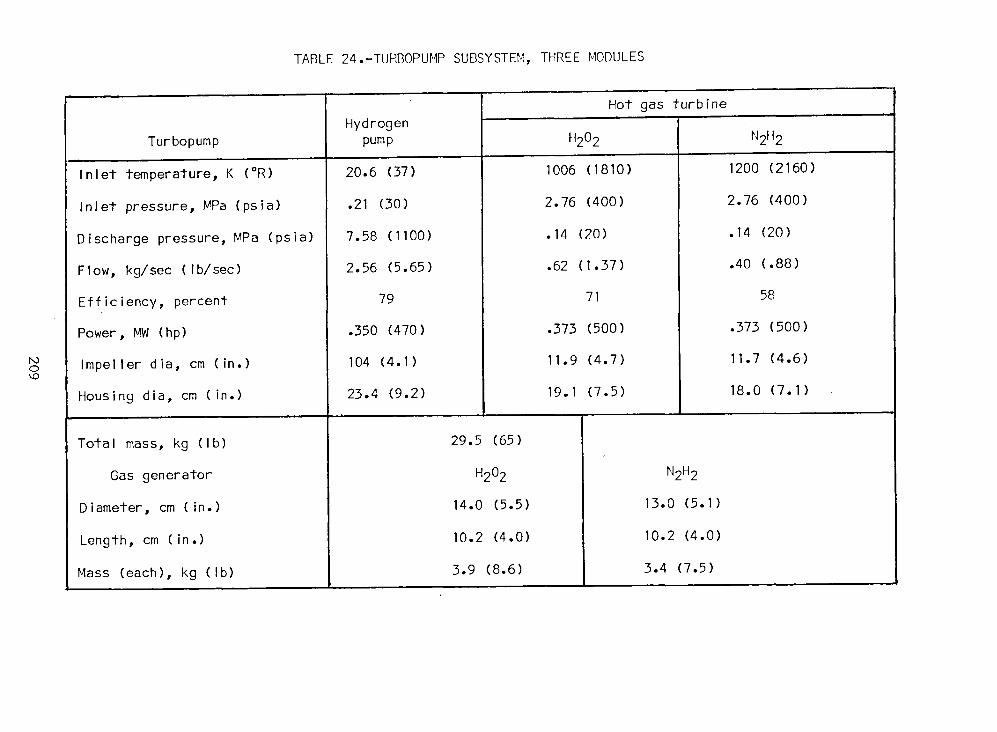
TABLE 24.-TURBOPUMP SUBSYSTEM, THREE MODULES
Hot gas turbinei i i
HydrogenTurbopump pump H202 N2H2
Inlet temperature, K (°R) 20.6 (37) 1006 (1810) 1200 (2160)
Inlet pressure, MPa (psia) .21 (30) 2.76 (400) 2.76 (400)
Discharge pressure, MPa (psia) 7.58 (1100) .14 (20) .14 (20)
Flow, kg/sec (Ib/sec) 2.56 (5.65) .62 (1.37) .40 (.88)
Efficiency, percent 79 71 58
Power, MW (hp) .350 (470) .373 (500) .373 (500)
o Impeller dia, cm (in.) 104 (4.1) 11.9 (4.7) 11.7 (4.6)
Housing dia, cm (in.) 23.4 (9.2) 19.1 (7.5) 18.0 (7.1)i
Total mass, kg (Ib) 29.5 (65)
Gas generator H202 N2H2
Diameter, cm (in.) 14.0 (5.5) 13.0 (5.1)
Length, cm (in.) 10.2 (4.0) 10.2 (4.0)
Mass (each), kg (Ib) 3.9 (8.6) 3.4 (7.5)
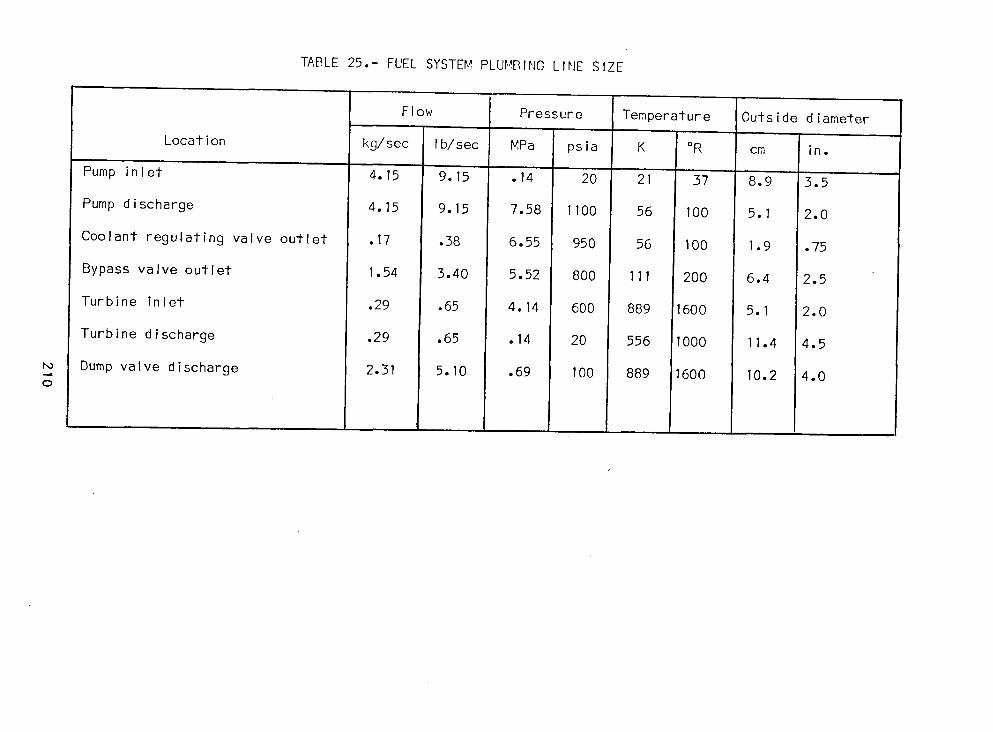
TABLE 25.- FUEL SYSTEMPLUMIBIlYOLIt'IE SIZE
Flow Pressure Temperature Outside diameter
Location kg/sec Ib/sec MPa psia K °R cm in.
Pump inlet 4.15 9.15 .14 20 21 37 8.9 3.5
Pump discharge 4.15 9.15 7.58 1100 56 100 5.1 2.0
Coolant regulating valve outlet .17 .38 6.55 950 56 100 1.9 .75
Bypass valve outlet 1.54 3.40 5.52 800 111 200 6.4 2.5
Turbine inlet .29 .65 4.14 600 889 1600 5.1 2.0
Turbine discharge .29 .65 .14 20 556 1000 11.4 4.5
Dump valve discharge 2.31 5.10 .69 100 889 600 10.2 4.0o

CONCLUDING REMARKS
Overall objectives for the Scramjet engine design can be met. It ispossible to attain a life of 100 hr and I000 cycles, which is the goal forthe intended research application. The coolant equivalence ratio is less than1.0 throughout the engine operating envelope; however, at the maximum altitudeand Mach number conditions a fuel equivalence ratio of 1.5 was used. Estimatedcoolant equivalence ratios for stoichiometric combustion at these conditionsindicated a coolant equivalence ratio increase to 1.239. Thus, stoichiometriccombustion requires the use of additional fuel for cooling at the Mach 10 condi-tion with a 2-g turn. The mechanical design is feasible for manufacture usingconventional materials. For the cooled structures in a six-module engine, themass per unit capture area is 1328 kg/m2 (259 Ib/ft2). The total mass of asix-module engine assembly including the fuel system is 1502 kg (3311 Ib).
Cooled Structure
An all-honeycomb primary structure is better than beam and honeycombcombinations in terms of minimum deflection and complexity for equal mass.The required honeycomb material, cell dimensions, overall size, and contourare feasible for manufacture. The engine panels (i.e., the topwall, sidewall,and cowl) may be rigidly joined at the corners and no dynamic hot gas sealsare required. Selected materials are Hastelloy X for the honeycomb primarystructure, Inconel 718 for the strut primary structure, Hastelloy X or Nickel-200for the TPS, and Nickel-200 for the leading edges.
The transient performance of the TPS/structure during engine startup andshutdown governs the design. For the most severe assumptions concerning missiontrajectory and engine operating procedures, _T's can range to 670 K (1200°R).Reduction of T's to acceptable levels is possible by changes in operating pro-cedures and, if required, in design of the TPS.
Specific structural design solutions have been identified for the engine.These have been incorporated in layout drawings of the engine. Analyses haveverified that there are no basic structural problems once the transient opera-tion is accommodated.
The design objectives for the engine, given control of the temperaturesduring transients, are feasible: 1000 cycles and 100 hr of engine operation.TPS temperatures are being limited to 1140 K (1600°F) on the surface and 890 K(1600°R) at the prime structure. Deflections during normal engine operation canbe limited to the specified values and remain acceptable during the severe Ioad-ings assumed for engine unstart.
Coolant Flow Routing
It is best to introduce coolant at the leading and trailing edges and letit flow toward the engine throat, where it is withdrawn. This basic flow scheme
211
must be adjusted, however, to achieve temperature matching between panels.Uniformity in temperature gradients between panels is crucial in meeting thermalstress limitations. Active controls will be required to obtain maximum coolantutilization. The minimum number of flow routes to be controlled is three--forward and aft portions of the panels and a separate control for the struts.
Thermal Protection System
In the HRE program, low-cycle fatigue of the offset-fin plate fin TPSwas identified as the primary limitation on structural life. For the Scramiet,two heat exchanger geometries were determined to yield significantly better_fatigue life. For the panels, topwall, sidewalls, and cowl, a machined channeldesign is specified. For the struts, a pin-fin surface is recommended. Experi-mental data are required to substantiate the predicted low-cycle fatigue lifeand creep-rupture behavior of the selected TPS structures. A NASA-sponsoredfabrication and material technology development program presently in progressis expected to provide such data. Test data are also required to confirm thatthe corner heat flux is not significantly higher than that at the enginecenterline.
Leading Edges
Low-cycle fatigue is the controlling design parameter. High performanceis achieved by impinging the entire panel flow at the minimum supply temperature,tOO°R, on the respective leading edges. Nickel-200 was specified because ofits high thermal conductivity and ductility, two factors that contribute toincreased fatigue life. The one-dimensional analysis (on which results in thisreport are based) should be extended to two dimensions to more precisely definethe problem. Experimental data are required because of the intensity of theheat flux, complexity of the flow path, and the impact of brazing and othermanufacturing operations on fatigue life.
Fuel Injection Struts
External pressure loads, such as occur during an unsymmetrical unstart,combined with thermal stresses, impose major design problems for the slenderstruts. Design feasibility was proven, however. A midspan tie between strutsis necessary to withstand unstart loads using minimal coolant flow. A prefer-able alternate that eliminates the tie is to overcool the struts.
The limited space within the struts dictates the fuel and coolant flowrouting. Integral manifolding with flow from one end of the strut remainsas the most feasible approach.
The dynamic response of the struts to the unstart transient should be
evaluated. Significant load amplification could occur because the pressurepulse period is close to the strut natural frequency.
212
Engine-AircraftInterface
Hydrogen flow control valves and manifolding should be located on themodule mounting frame to provide an integral assembly, especially for a researchapplication, and to achieve optimum control response. Behavior of the overallmodule cluster and the assembly response to an individual module shutdowndeserve further attention to define the sealing problem and interface thermalstresses.
Hydrogen Flow Control
The minimum number of valves has been specified. Additional valves may berequired to provide for shutdown of an individual module or closer regulationof coolant temperatures.
REFERENCES
I. Staff of Langley Research Center and AiResearch Manufacturing Company,The Garrett Corporation: Hypersonic Research Engine Project Status 1971.NASA TM X-2572, 1972.
2. Flieder, W. G., Richard, C. E., Buchmann, O. A., and Walters, F. M.: AnAnalytical Study of Hydrogen Cooled Panels for Application to HypersonicAircraft. NASA CR-1650, April 1971.
3. Richard, C. E., Duncan, J. D., Gellersen, E. W., and Demogenes, C.:Thermal and Structural Tests of a Hydrogen Cooled Panel. NASA-CR-2105,May 1972.
4. Wieting, Allan R., and Guy, Robert W: Thermal-Structural Design/Analysisof an Airframe-lntegrated Hydrogen-Cooled Scramjet. J. of Aircraft,Vol. 13, No. 3, March 1976, pp. 192 to 197.
5. Buchmann, O.A.: Summary Report, Thermal-Structural Design Study of anAirframe-lntegrated Scramjet. NASA CR-3141, December 1978.
6. Hearth, Donald P., and Preyss, Col. Albert E., USAF: HypersonicTechnology--Approach to an Expanded Program, Astronautics and AeronauticsVol. 14, No. 12, Dec 1976, pp. 20 to 37.
7. Kelly, H. Neale, Wieting, Allan R., Shore, Charles P., and Nowak, Robert J.:Recent Advances in Convectively Cooled Engine and Airframe Structures forHypersonic Flight. 11th Congress of the International of the AeronauticalSciences, Lisbon, Portugal, Sept. 10 to 16, 1978.
8. Wieting, Allan R.: Exploratory Study of Transient Unstart Phenomena ina Three-Dimensional Fixed Geometry Scramjet Engine. NASA Technical NoteTN D-8156, March 1976.
213

9. Engineering Staff, Hypersonic Research Engine Project - Phase IIA:Structures and Cooling Development, Second Interim Technical DataReport. Data Item 55-7.02, AiResearch Report No. AP-67-2537,August 23, 1967, NASA CR 11770.
10. Fay, J. A., and Riddell, F. R.: Theory of Stagnation Point Heat Transferin Dissociated Air. J. of the Aeronautical Science, Feb. 1959, p. 17.
11. Stainback, P., and Weinsten, L.: Aerodynamic Heating in the Vicinity ofCorners at Hypersonic Speeds. NASA TN D-4130, Nov. 1967.
12. Kays, William, and London, A. L.: Compact Heat Exchangers. 2nd ed.,McGraw-Hill Book Co., New York, 1964.
13. Sines, G., and Waisman J.L., editors: Metal Fatigue. McGraw Hill Co.,1959.
14. Halford, G. R., Hirschberg, H. M., and Manson, S. S.: Temperature Effectson the Strainrange Partitioning Approach for Creep Fatigue Analysis. Fatigueat Elevated Temperatures, American Society for Testing and Materials (ASTM)STP 520, 1973, pp. 658 to 669.
15. Whetstone, W.D.: SPAR Structural Analysis System. NASA CR 145098-I,February 1977.
16. De Salvo, G. J., and Swanson, J. A.: ANSYS Engineering Analysis SystemUser's Manual. Swanson Analysis Systems, Elizabeth, Pa. 15037, March I,1975.
17. Spera, D. A.: Calculation of Thermal-Fatigue Life Based on AccumulatedCreep Damage. NASA TN-D-5489, Oct. 1969.
18. Spera, D. A.: The Calculation of Elevated-Temperature Cyclic LifeConsidering Low-Cycle Fatigue and Creep. NASA TN-D-5317, July 1969.
19. Manson, S. S.: The Challenge to Unify Treatment of High TemperatureFatigue--A Partisan Proposal Based on Strainrange Partitioning. Fatigueat Elevated Temperatures, American Society for Testing and Materials(ASTM) STP 520, 1973, pp. 744 to 782.
20. Spera, D. A.: Comparison of Experimental and Theoretical Thermal FatigueLives for Five Nickel-Base Alloys. Fatigue at Elevated temperatures,American Society for Testing and Materials (ASTM) STP 520, 1972, pp. 648 to657.
21. Perlmutter, M.: inlet and Exit-Header Shapes for Uniform Flow Through aResistance Parallel to the Main Stream. Trans. ASME, J. of BasicEngineering, Vol. 83, September 1961, pp. 361 to 370.
22. Heyda, J.F.: An Analytical Study of a Balanced Reverse-Folded Flow. XDC60-I-158, General Electric Company Report, reprinted by Dept. of Commerce,January 1960.
214
23. Wolf, S.: Flow Losses for Heat Exchangers with Oblique Flow Headers.TR Ho. 60, Department of Mechanical Engineering, Stanford University, June1964.
24. London, A.L.: Flow Losses for Heat Exchangers with Oblique Flow Headers.Supplement to TR No. 60, Department of Mechanical Engineering, StanfordUniversity, September 1964.
25. London, A.L., Klopfer, G., and Wolf, S.: Oblique Flow Headers for Heat
Exchangers--The Ideal Geometries and the Evaluation of Losses. TR No. 63,Department of Mechanical Engineering, Stanford University, August i966.
26. Liepmann, H. W., and Roshko, A.: Elements of Gasdynamics. John Wiley andSons, Inc., New York, New York, 1957.
27. Klopfer, G.: Oblique Flow Headers for Heat Exchangers--The Influence ofInlet Velocity Profiles. TR No. 65, Department of Mechanical Engineering,Stanford University, July 1967.
28. National Rureau of Standards: Thermodynamic Properties of Para HydrogenFrom the Freezing Liquid Line to 5000°R for Pressures to 10,000 psia. MBSTechnical Note 617.
215
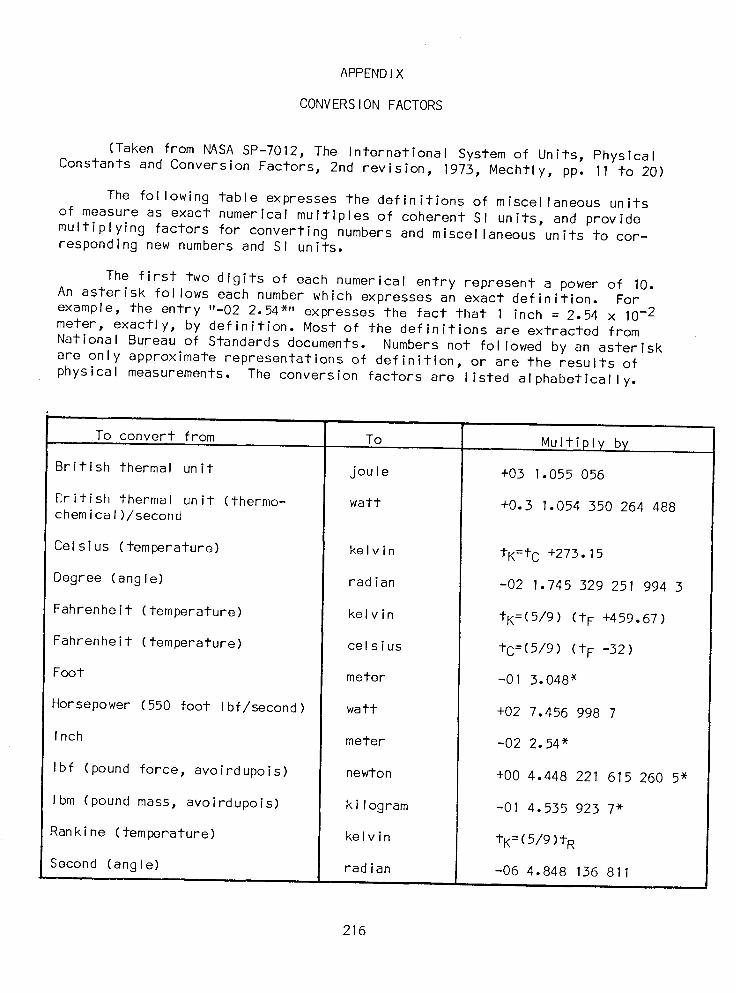
APPENDIX
CONVERSION FACTORS
(Taken from NASA SP-7012, The International System of Units, PhysicalConstants and Conversion Factors, 2nd revision, 1973, Mechtly, pp. 11 to 20)
The following table expresses the definitions of miscellaneous units
of measure as exact numerical multiples of coherent SI units, and providemultiplying factors for converting numbers and miscellaneous units to cor-responding new numbers and SI units.
The first two digits of each numerical entry represent a power of 10.An asterisk follows each number which expresses an exact definition. Forexample, the entry "-02 2.54*" expresses the fact that I inch = 2.54 x 10⁻²meter, exactly, by definition. Most of the definitions are extracted from
National Bureau of Standards documents. Numbers not followed by an asteriskare only approximate representations of definition, or are the results of
physical measurements. The conversion factors are listed alphabetically.
To convert from To Multiply by
British thermal unit joule +03 1.055 056
_ritish thermal unit (thermo- watt +0.3 1.054 350 264 488chemical)/second
Celsius (temperature) kelvin tK=tC +273.15
Degree (angle) radian -02 1.745 329 251 994 3
Fahrenheit (temperature) kelvin tK=(5/9) (tF +459.67)
Fahrenheit (temperature) celsius tc=(5/9) (tF -32)
Foot meter -01 3.048*
Horsepower (550 foot Ibf/second) watt +02 7.456 998 7
Inch meter -02 2.54*
Ibf (pound force, avoirdupois) newton +00 4.448 221 615 260 5*
Ibm (pound mass, avoirdupois) kilogram -01 4.535 923 7*
Rankine (temperature) kelvin tK=(5/9)tR
Second (angle) radian -06 4.848 136 811
216
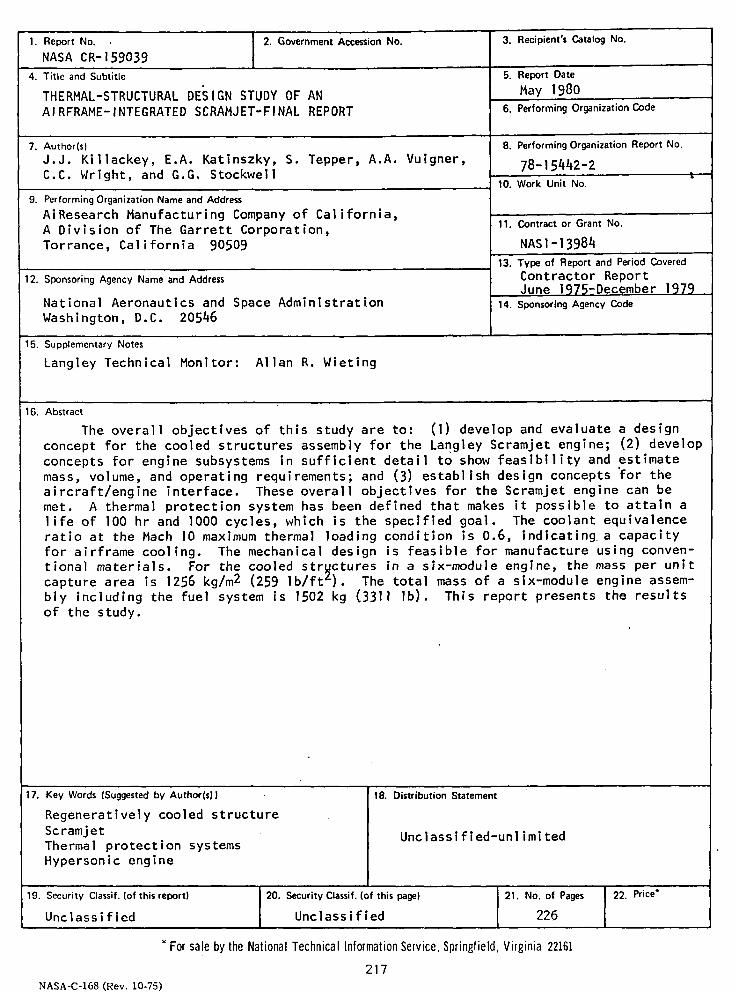
1. Report No. J 2. Government Accession No. 3. Recipient's Catalog No.NASA CR-159039 I
--4. Title and Subtitle 5. Report Date
THERMAL-STRUCTURALDE_;IGNSTUDY OF AN May 1980A IRFRAME-INTEGRATEDSCRAHJET-FINAL REPORT 6.PerformingOrganizationCode
7. Author(s) 8. Performing Organization Report No.
J.J. Killackey, E.A. Katinszky, S. Tepper, A.A. Vuigner, 78-15442-2C.C. Wright, and G.G. Stockwell 10. work Unit No. t
9. PerformingOrganizationName and Address
AiResearch Manufacturing Company of California,A Division of The Garrett Corporation, 11.ContractorGrantNo.
Torrance, California 90509 NAS1-1398413. Type of Report and Period Covered
12. Sponsoring Agency Name and Address Contractor ReportJune 1975-December 1979
National Aeronautics and Space Administration 14. SponsoringAgencyCode
Washington, D.C. 20546
15. Supplementary Notes
Langley Technical Monitor: Allan R. Wieting
16, Abstract
The overall objectives of this study are to: (I) develop and evaluate a designconcept for the cooled structures assembly for the Langley Scramjet engine; (2) developconcepts for engine subsystems in sufficient detail to show feasibility and estimatemass, volume, and operating requirements; and (3) establish design concepts for theaircraft/engine interface. These overall objectives for the Scramjet engine can bemet. A thermal protection system has been defined that makes it possible to attain alife of lO0 hr and 1000 cycles, which is the specified goal. The coolant equivalenceratio at the Mach I0 maximum thermal loading condition is 0.6, indicating a capacityfor airframe cooling. The mechanical design is feasible for manufacture using conven-tional materials. For the cooled strgctures in a six-module engine, the mass per unitcapture area is 1256 kg/m2 (259 lb/ft_). The total mass of a six-module engine assem-bly including the fuel system is 1502 kg (3311 lb). This report presents the resultsof the study.
17. Key Words (Suggested by Author(s}) 18. Distribution Statement
Regeneratively cooled structure
Scramjet Unclassified-unlimitedThermal protection systemsHypersonic engine
19. S_urity Classif. (of this report) 20. Security Classif. (of this _ge) 21. No. of Pages 22. Price*
Unclassified Unclassified 226
*F0rsalebytheNati0nalTechnicallnf0rmati0nService,Springfield,Virginia22161
217NASA-C-168(Rev. 10-75)
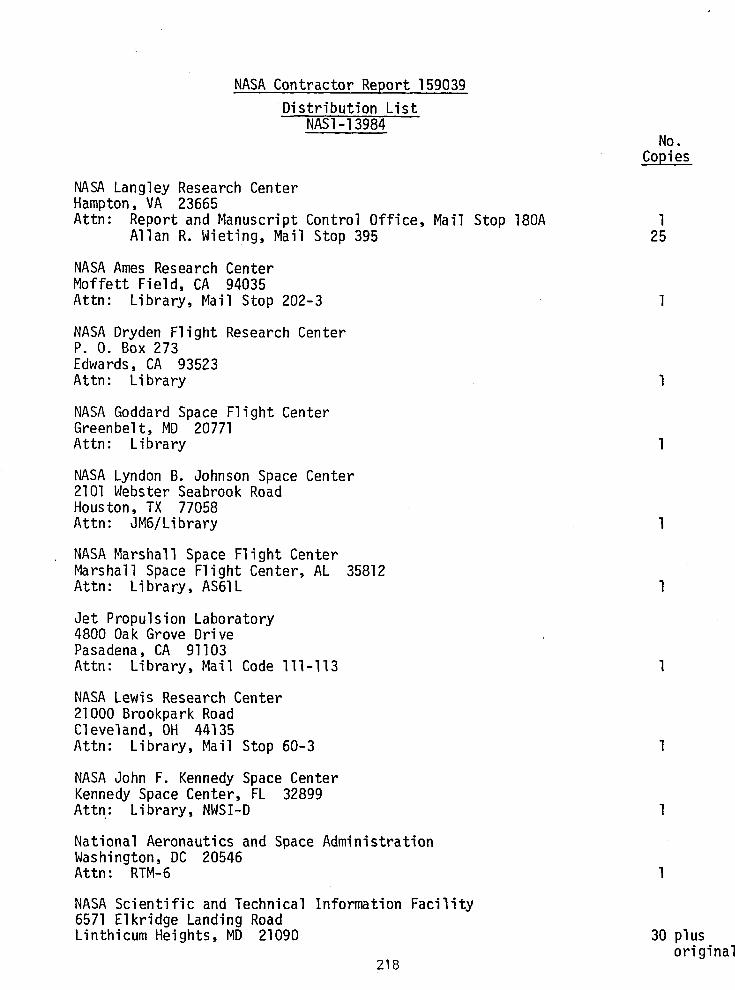
NASA ContractorReport 159039
DistributionListNASI'13984
No.
Copies
NASALangleyResearchCenterHampton,VA 23665Attn: Reportand ManuscriptControlOffice,MailStop 180A l
AllanR. Wieting,MailStop 395 25
NASAAmes ResearchCenterMoffettField,CA 94035Attn: Library,Mail Stop202-3 l
NASA DrydenFlightResearchCenterP. O. Box 273Edwards,CA 93523Attn: Library l
NASA GoddardSpace FlightCenterGreenbelt,MD 20771Attn: Library l
NASALyndonB. JohnsonSpaceCenter2101WebsterSeabrookRoadHouston,TX 77058Attn: JM6/Library l
NASAMarshallSpaceFlightCenterMarshallSpaceFlightCenter,AL 35812Attn: Library,AS61L l
Jet PropulsionLaboratory4800 Oak Grove DrivePasadena,CA 91103Attn: Library,Mail Code lll-ll3 l
NASA Lewis ResearchCenter21000 BrookparkRoadCleveland,OH 44135Attn: Library,Mail Stop 60-3 l
NASA John F. KennedySpace CenterKennedySpace Center, FL 32899Attn: Library,NWSI-D l
NationalAeronauticsand Space AdministrationWashington,DC 20546Attn: RTM-6 l
NASA Scientificand TechnicalInformationFacility6571Elkridge LandingRoadLinthicumHeights,MD 21090 30 plus
original218