Embed Size (px)
Citation preview

Copyright © 2012 Pearson Education Inc.
PowerPoint® Lectures for
University Physics, Thirteenth Edition
– Hugh D. Young and Roger A. Freedman
Lectures by Wayne Anderson
Chapter 18
Thermal Properties
of Matter

Copyright © 2012 Pearson Education Inc.
Goals for Chapter 18
• To relate the pressure, volume, and temperature of a gas
• To see how molecular interactions determine the properties of a substance
• To relate temperature and pressure to the kinetic energy of gas molecules
• To learn what the heat capacities of a gas tell us about the motion of its molecules
• To discover what determines if a substance is a gas, liquid, or solid

Copyright © 2012 Pearson Education Inc.
Introduction
• How does the speed of the
molecules in the air above
the frying pan compare
with that of the ones in the
rest of the kitchen?
• How do the atoms of a gas
determine its temperature
and pressure?
• We’ll see how the
microscopic properties of
matter determine its
macroscopic properties.
Copyright © 2012 Pearson Education Inc.
Equations of state and the ideal-gas law
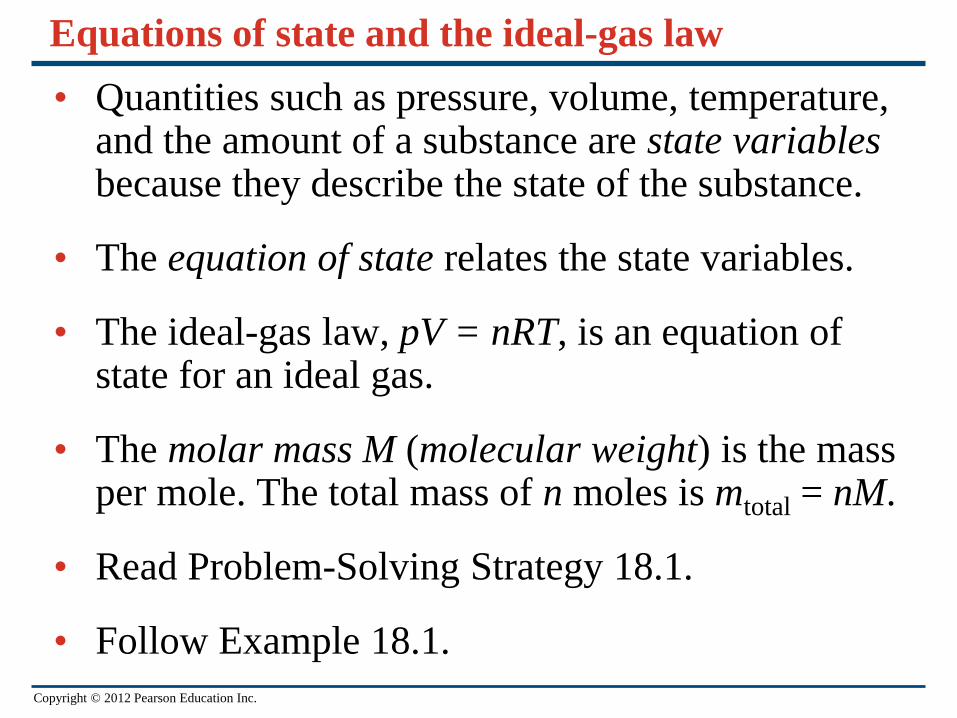
• Quantities such as pressure, volume, temperature, and the amount of a substance are state variables because they describe the state of the substance.
• The equation of state relates the state variables.
• The ideal-gas law, pV = nRT, is an equation of state for an ideal gas.
• The molar mass M (molecular weight) is the mass per mole. The total mass of n moles is mtotal = nM.
• Read Problem-Solving Strategy 18.1.
• Follow Example 18.1.
Copyright © 2012 Pearson Education Inc.
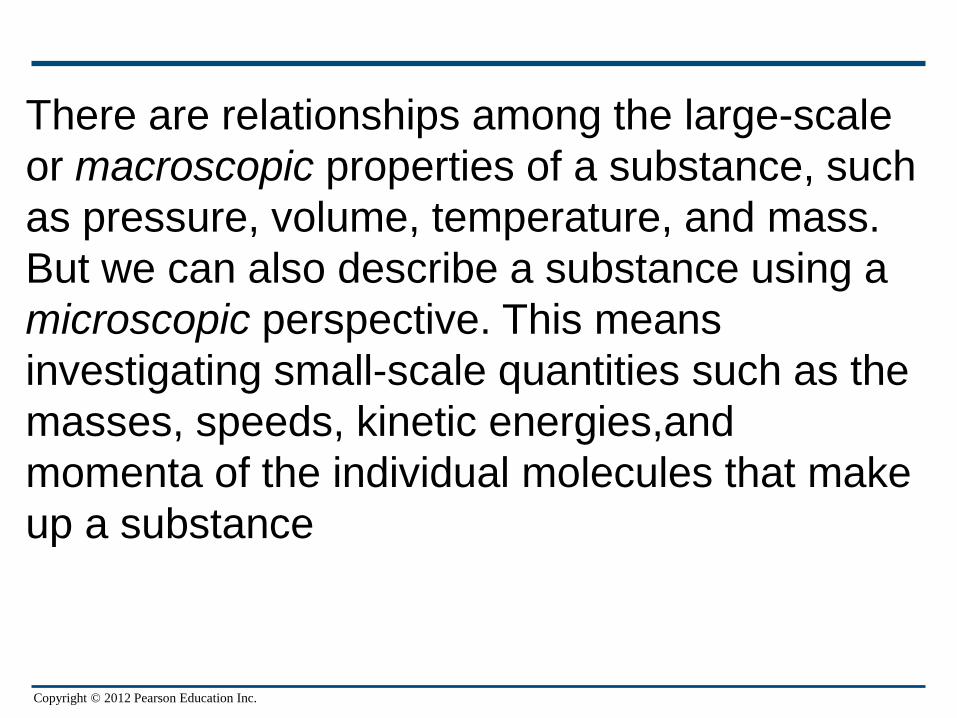
There are relationships among the large-scale
or macroscopic properties of a substance, such
as pressure, volume, temperature, and mass.
But we can also describe a substance using a
microscopic perspective. This means
investigating small-scale quantities such as the
masses, speeds, kinetic energies,and
momenta of the individual molecules that make
up a substance
Copyright © 2012 Pearson Education Inc.
Copyright © 2012 Pearson Education Inc.
In this chapter we’ll begin our study of the thermal
properties of matter by looking at some macroscopic
aspects of matter in general. We’ll pay special
attention to the ideal gas, one of the simplest types of
matter to understand. Using our knowledge of
momentum and kinetic energy, we’ll relate the
macroscopic properties of an ideal gas to the
microscopic behavior of its individual molecules.

Copyright © 2012 Pearson Education Inc.
The variables like pressure, volume, temperature,
and amount of substance describe the state of the
material and are called state variables. These
variables are not independent. In a few cases the
relationship among p, V, T, and m (or n) is simple
enough that we can express it as an equation
called the equation of state. When it’s too
complicated for that, we can use graphs or
numerical tables. Even then, the relationship
among the variables still exists; we call it an
equation of state even when we don’t know the
actual equation.
Copyright © 2012 Pearson Education Inc.
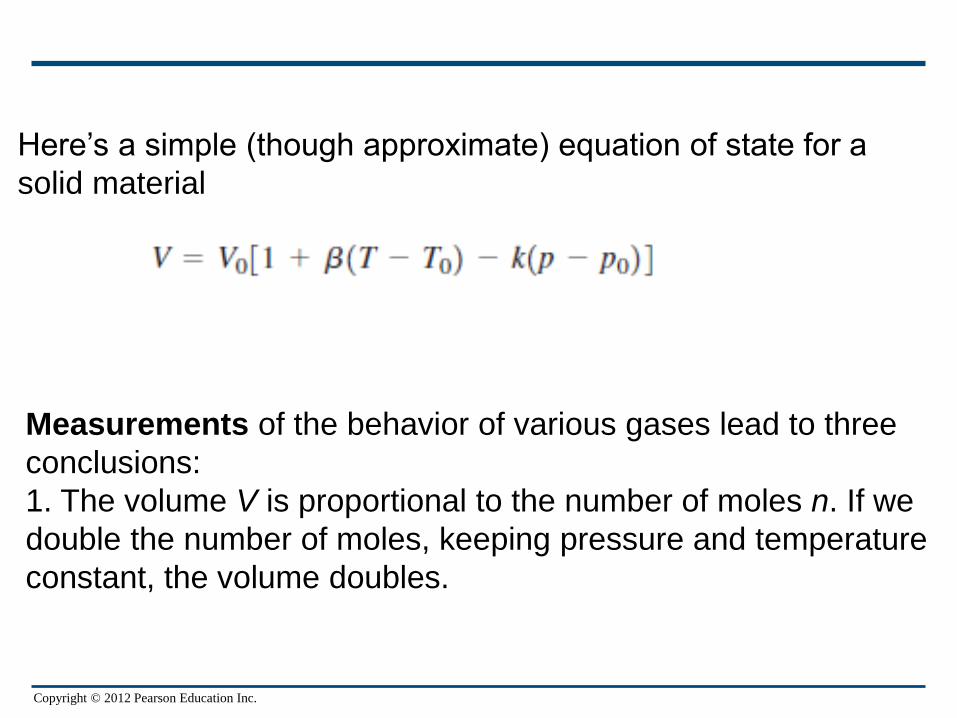
Here’s a simple (though approximate) equation of state for a
solid material
Measurements of the behavior of various gases lead to three
conclusions:
1. The volume V is proportional to the number of moles n. If we
double the number of moles, keeping pressure and temperature
constant, the volume doubles.

Copyright © 2012 Pearson Education Inc.
2. The volume varies inversely with the absolute
pressure p. If we double the pressure while holding the
temperature T and number of moles n constant, the gas
compresses to one-half of its initial volume. In other
words, pV = constant when n and T are constant.
3. The pressure is proportional to the absolute
temperature. If we double the absolute temperature,
keeping the volume and number of moles constant, the
pressure doubles. In other words, p = (constant) T
when n and V are constant. These three relationships
can be combined neatly into a single equation, called
the ideal-gas equation:
pV = nRT (ideal-gas equation) (18.3)
Copyright © 2012 Pearson Education Inc.
This is an idealized model; it works best at very low pressures
and high temperatures, when the gas molecules are far apart
and in rapid motion. Why?
We might expect that the constant R in the ideal-gas equation
would have different values for different gases, but it turns
out to have the same value for all gases, at least at
sufficiently high temperature and low pressure. It is called the
gas constant (or ideal-gas constant). The numerical value of
R depends on the units of p, V, and T. In SI units, in which the
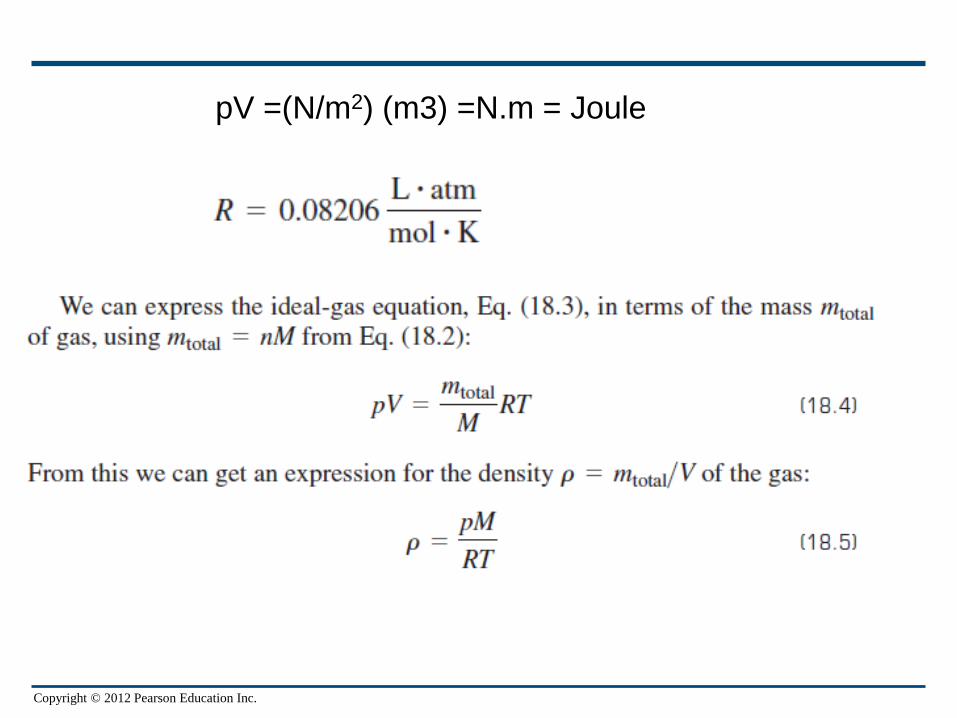
unit of p is Pa ( N/m2) and the unit of V is m3 ,the current best
numerical value of R is
R = 8.314472(15) J/mol. K
Copyright © 2012 Pearson Education Inc.
pV =(N/m2) (m3) =N.m = Joule
Copyright © 2012 Pearson Education Inc.
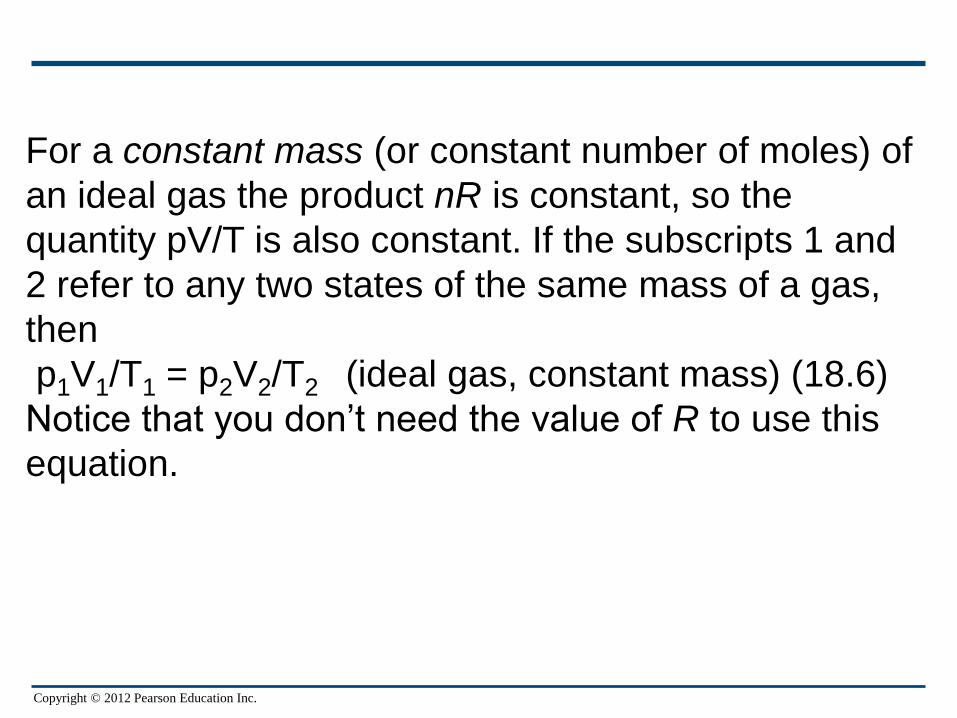
For a constant mass (or constant number of moles) of
an ideal gas the product nR is constant, so the
quantity pV/T is also constant. If the subscripts 1 and
2 refer to any two states of the same mass of a gas,
then
p1V1/T1 = p2V2/T2 (ideal gas, constant mass) (18.6)
Notice that you don’t need the value of R to use this
equation.
Copyright © 2012 Pearson Education Inc.
Copyright © 2012 Pearson Education Inc.
Copyright © 2012 Pearson Education Inc.

Copyright © 2012 Pearson Education Inc.
Copyright © 2012 Pearson Education Inc.
• .

Copyright © 2012 Pearson Education Inc.
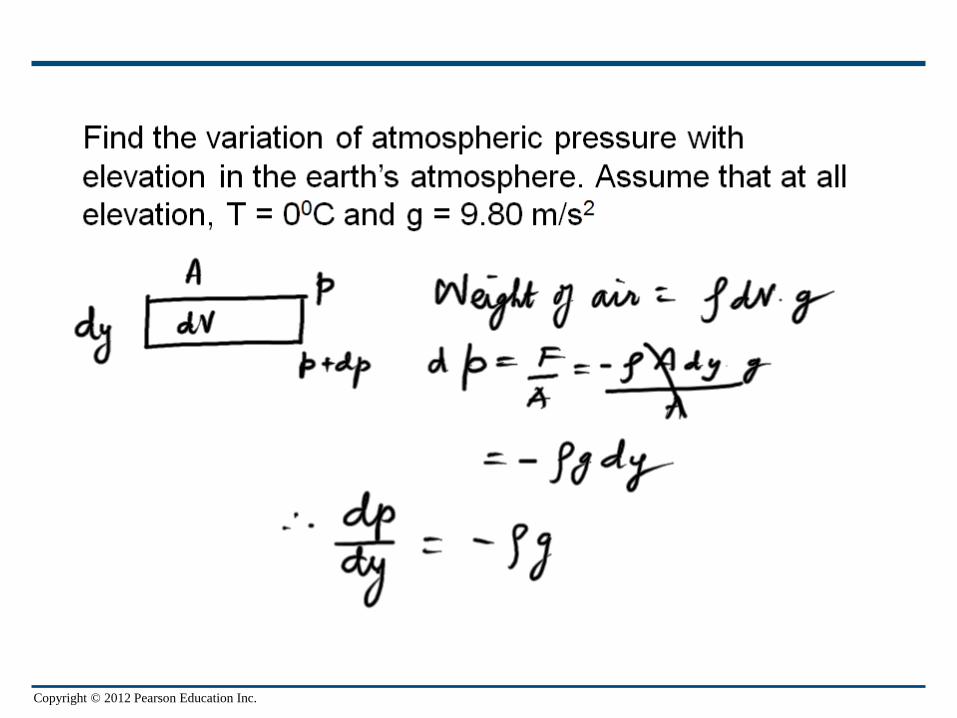
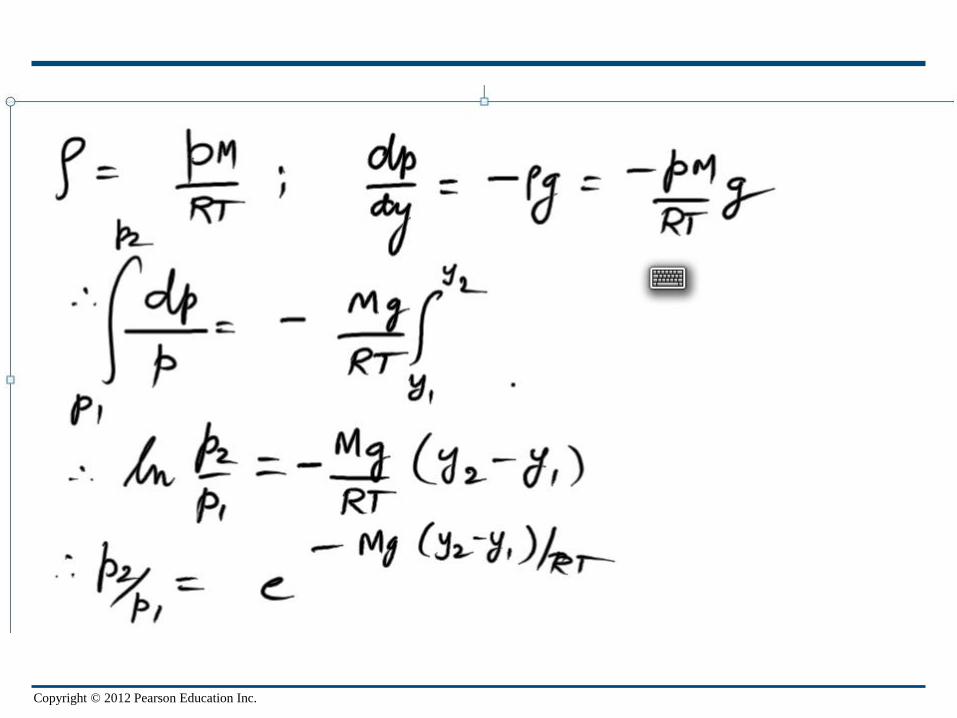
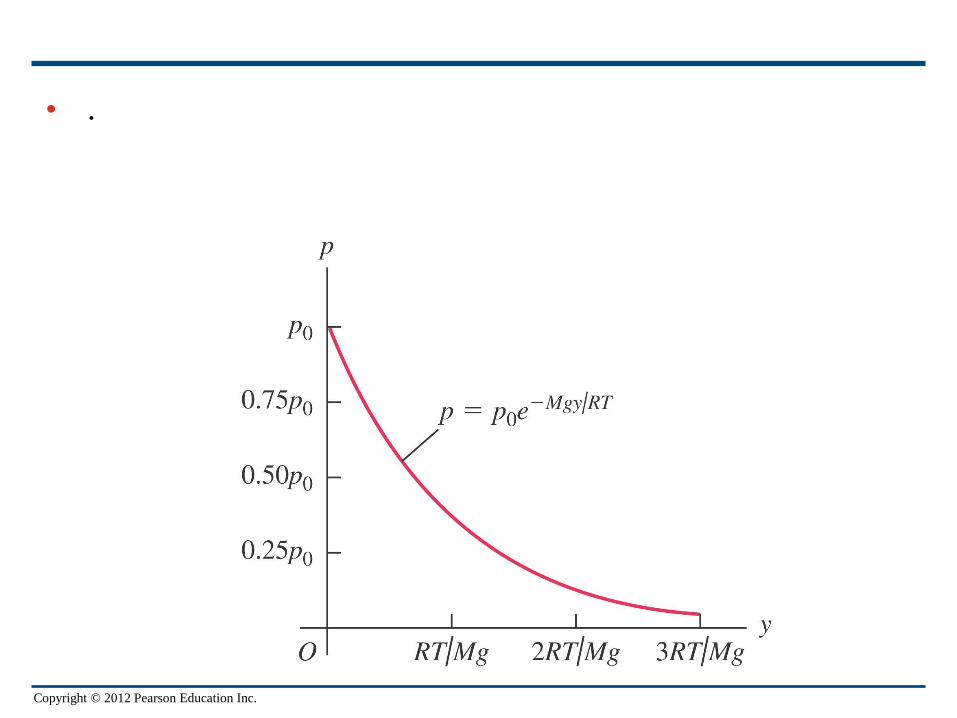
At the summit of Mount Everest, where y = 8863m,
Mgy/RT
= (28.8x10 -3 kg/mol)(9.80
m/s2)/(8863m)/(8.314J/mol.K)(273K)
= 1.10
p = (1.013 x 10 5 Pa) e-1.10 = 0.337x 10 5 Pa = 0.33 atm
The assumption of constant temperature isn’t realistic,
and g decreases a little with increasing elevation. Even
so, this example shows why mountaineers need to carry
oxygen on Mount Everest. It also shows why jet
airliners, which typically fly at altitudes of 8000 to 12,000
m, must have pressurized cabins for passenger comfort
and health.
Copyright © 2012 Pearson Education Inc.
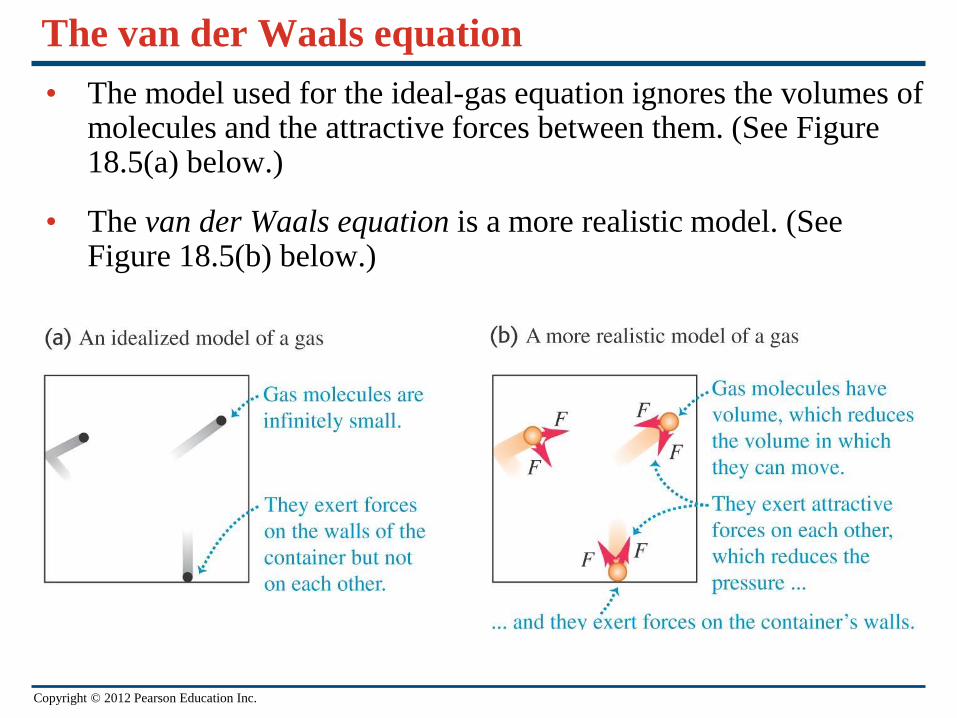
The van der Waals equation
• The model used for the ideal-gas equation ignores the volumes of molecules and the attractive forces between them. (See Figure 18.5(a) below.)
• The van der Waals equation is a more realistic model. (See Figure 18.5(b) below.)

Copyright © 2012 Pearson Education Inc.
The ideal-gas equation can be obtained from a simple
molecular model that ignores the volumes of the molecules
themselves and the attractive forces between them (Fig.
18.5a). Meanwhile, we mention another equation of state, the
van derWaals equation, that makes approximate corrections
for these two omissions (Fig. 18.5b). This equation was
developed by the 19th-century Dutch physicist J. D. van der
Waals; the interaction between atoms that we discussed in
Section 14.4 was named the van der Waals interaction after
him. The van der Waals equation is
Copyright © 2012 Pearson Education Inc.
The constants a and b are empirical
constants, different for different gases.
Roughly speaking, b represents the volume of
a mole of molecules; the total volume of the
molecules is then nb, and the volume
remaining in which the molecules
can move is V-nb
Copyright © 2012 Pearson Education Inc.
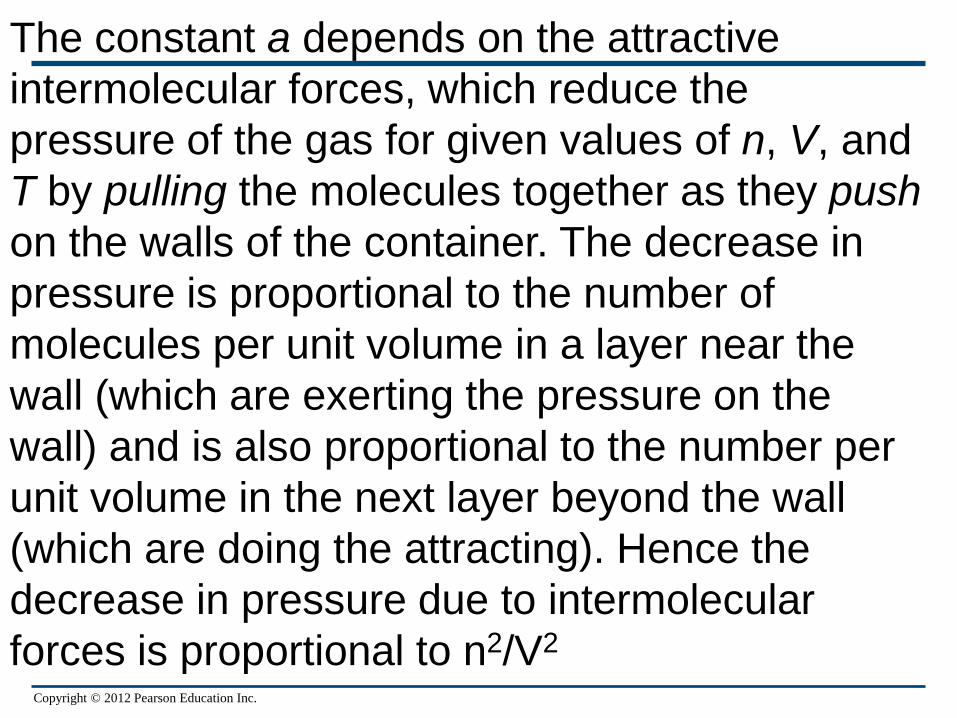
The constant a depends on the attractive
intermolecular forces, which reduce the
pressure of the gas for given values of n, V, and
T by pulling the molecules together as they push
on the walls of the container. The decrease in
pressure is proportional to the number of
molecules per unit volume in a layer near the
wall (which are exerting the pressure on the
wall) and is also proportional to the number per
unit volume in the next layer beyond the wall
(which are doing the attracting). Hence the
decrease in pressure due to intermolecular
forces is proportional to n2/V2

Copyright © 2012 Pearson Education Inc.

Copyright © 2012 Pearson Education Inc.
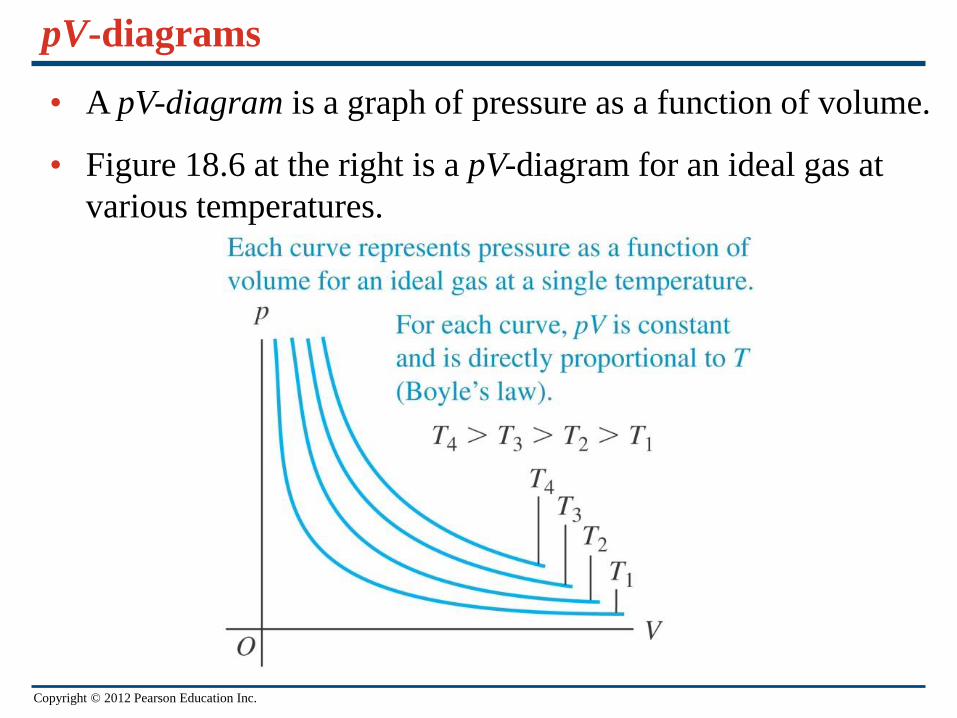
We could in principle represent the p-V-T
relationship graphically as a surface in a three-
dimensional space with coordinates p, V, and T.
This representation sometimes helps us grasp
the overall behavior of the substance, but
ordinary two-dimensional graphs are usually
more convenient. One of the most useful of these
is a set of graphs of pressure as a function of
volume, each for a particular constant
temperature. Such a diagram is called a pV-
diagram. Each curve, representing behavior at a
specific temperature, is called an isotherm, or a
pVisotherm.
Copyright © 2012 Pearson Education Inc.
pV-diagrams
• A pV-diagram is a graph of pressure as a function of volume.
• Figure 18.6 at the right is a pV-diagram for an ideal gas at
various temperatures.

Copyright © 2012 Pearson Education Inc.

Copyright © 2012 Pearson Education Inc.
At temperatures below the isotherms develop flat
regions in which we can compress the material (that
is, reduce the volume V) without increasing the
pressure p. Observation shows that the gas is
condensing from the vapor (gas) to the liquid phase.
The flat parts of the isotherms in the shaded area of
Fig. 18.7 represent conditions of liquid-vapor phase
equilibrium. As the volume decreases, more and
more material goes from vapor to liquid, but the
pressure does not change. (To keep the
temperature constant during condensation, we have
to remove the heat of vaporization, discussed in
Section 17.6.)
Copyright © 2012 Pearson Education Inc.
When we compress such a gas at a constant
temperature T2 in Fig. 18.7, it is vapor until point a is
reached. Then it begins to liquefy; as the volume
decreases further, more material liquefies, and both
the pressure and the temperature remain
constant. At point b, all the material is in the liquid
state. After this, any further compression requires a
very rapid rise of pressure, because liquids are in
general much less compressible than gases. At a
lower constant temperature T1 similar behavior occurs,
but the condensation begins at lower pressure and
greater volume than at the constant temperature T2

Copyright © 2012 Pearson Education Inc.
At temperatures greater than Tc no phase
transition occurs as the material is compressed;
at the highest temperatures, such as T4 the
curves resemble the ideal-gas curves of Fig.
18.6. We call Tc the critical temperature for this
material. In Section 18.6 we’ll discuss what
happens to the phase of the gas above the
critical temperature.

Copyright © 2012 Pearson Education Inc.
We will use pV-diagrams often in the next two
chapters. We will show that the area under a
pV-curve (whether or not it is an isotherm)
represents the work done by the system during
a volume change. This work, in turn, is directly
related to heat transfer and changes in the
internal energy of the system

Copyright © 2012 Pearson Education Inc.
Molecules and Intermolecular Forces
Any specific chemical compound is made up of identical
molecules. The smallest molecules contain one atom
each and are of the order of 10 -10 in size; the largest
contain many atoms and are at least 10,000 times
larger. In gases the molecules move nearly
independently; in liquids and solids they are held
together by intermolecular forces. These forces arise
from interactions among the electrically charged
particles that make up the molecules. Gravitational
forces between molecules are negligible in comparison
with electrical forces.
Copyright © 2012 Pearson Education Inc.

Copyright © 2012 Pearson Education Inc.
Copyright © 2012 Pearson Education Inc.
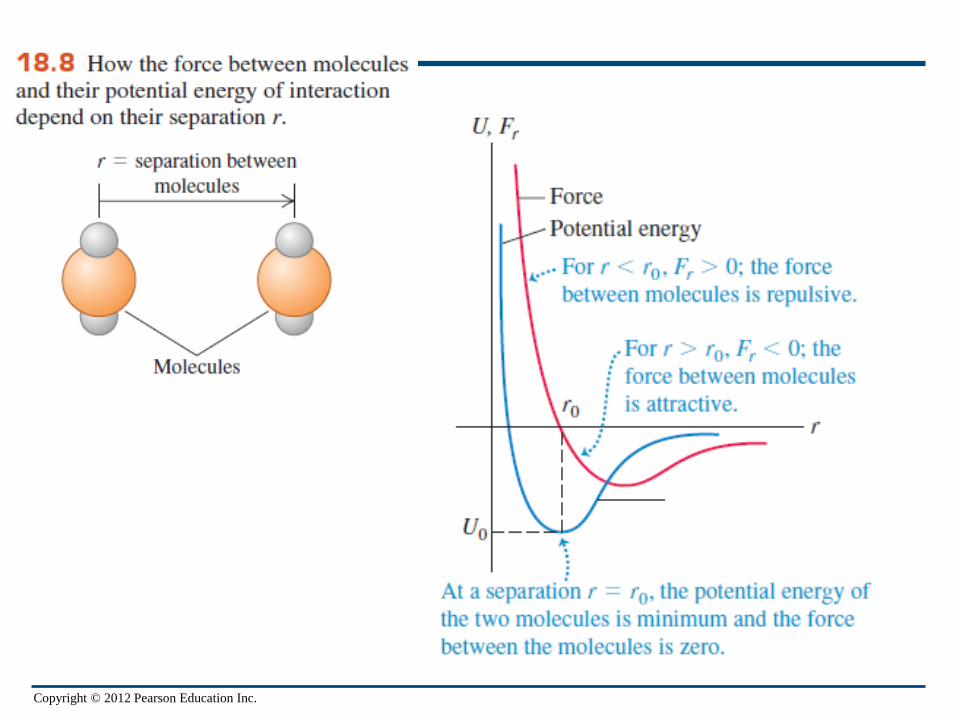
Molecules are always in motion; their kinetic energies
usually increase with temperature. At very low
temperatures the average kinetic energy of a molecule
may be much less than the depth of the potential well.
The molecules then condense into the liquid or solid
phase with average intermolecular spacings of about r0
But at higher temperatures the average kinetic energy
becomes larger than the depth IU0I of the potential well.
Molecules can then escape the intermolecular force
and become free to move independently, as in the
gaseous phase of matte
Copyright © 2012 Pearson Education Inc.
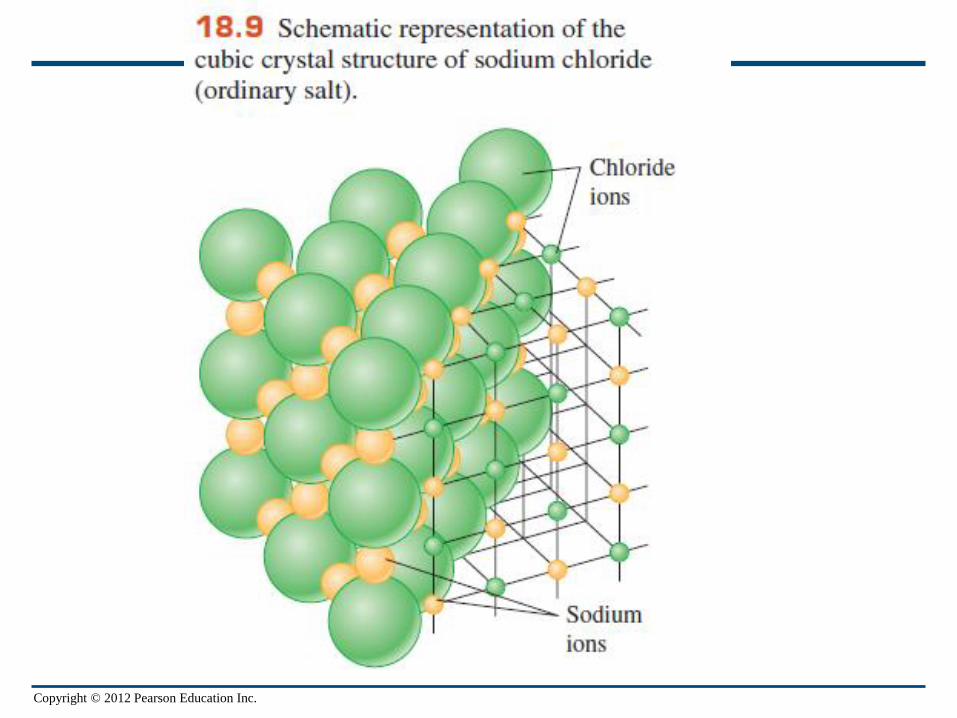
In solids, molecules vibrate about more or less
fixed points. In a crystalline solid these points
are arranged in a crystal lattice. Figure 18.9
shows the cubic crystal structure of sodium
chloride, and Fig. 18.10 shows a scanning
tunneling microscope image of individual silicon
atoms on the surface of a crystal.
Copyright © 2012 Pearson Education Inc.

Copyright © 2012 Pearson Education Inc.

Copyright © 2012 Pearson Education Inc.
One mole is the amount of substance that contains as many
elementary entities as there are atoms in 0.012 kilogram of
carbon-12.

Copyright © 2012 Pearson Education Inc.
Moles and Avogadro’s number
• One mole of a substance contains as many elementary entities (atoms or molecules) as there are atoms in 0.012 kg of carbon-12.
• One mole of a substance contains Avogadro’s number NA of molecules.
• NA = 6.022 x 10²³ molecules/mol
• The molar mass M is the mass of one mole.
• M = NAm, where m is the mass of a single molecule.
• Follow Example 18.5, which illustrates atomic and molecular mass.
Copyright © 2012 Pearson Education Inc.
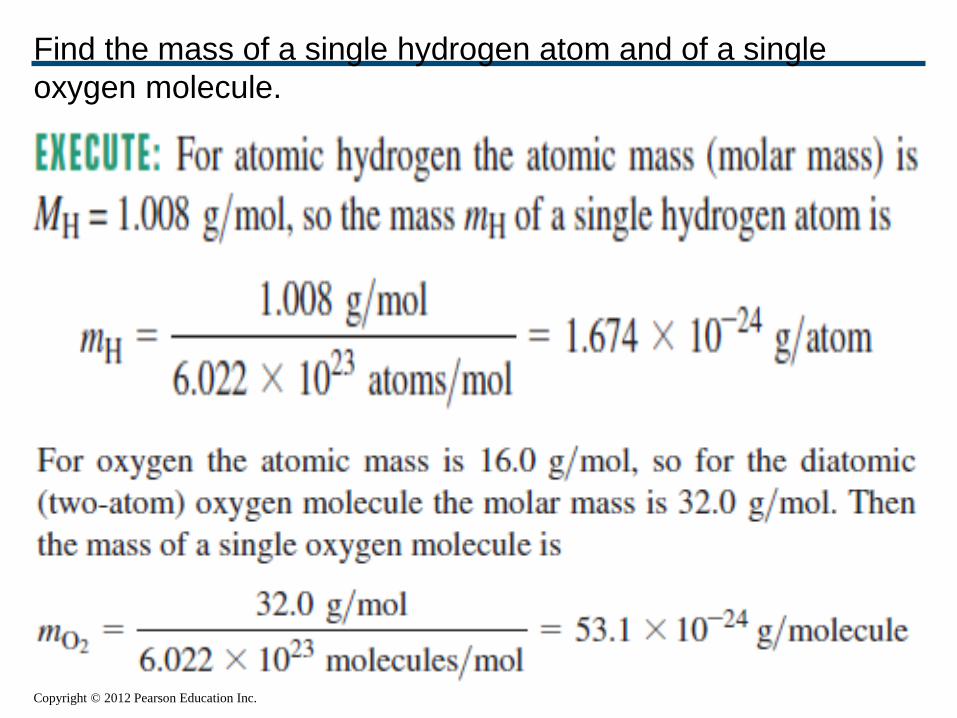
Find the mass of a single hydrogen atom and of a single
oxygen molecule.

Copyright © 2012 Pearson Education Inc.
Kinetic-molecular model of an ideal gas
• The assumptions of the kinetic-molecular model are:
1. A container contains a very large number of identical molecules.
2. The molecules behave like point particles that are small compared to the size of the container and the average distance between molecules.
3. The molecules are in constant motion and undergo perfectly elastic collisions.
4. The container walls are perfectly rigid and do not move.
Copyright © 2012 Pearson Education Inc.
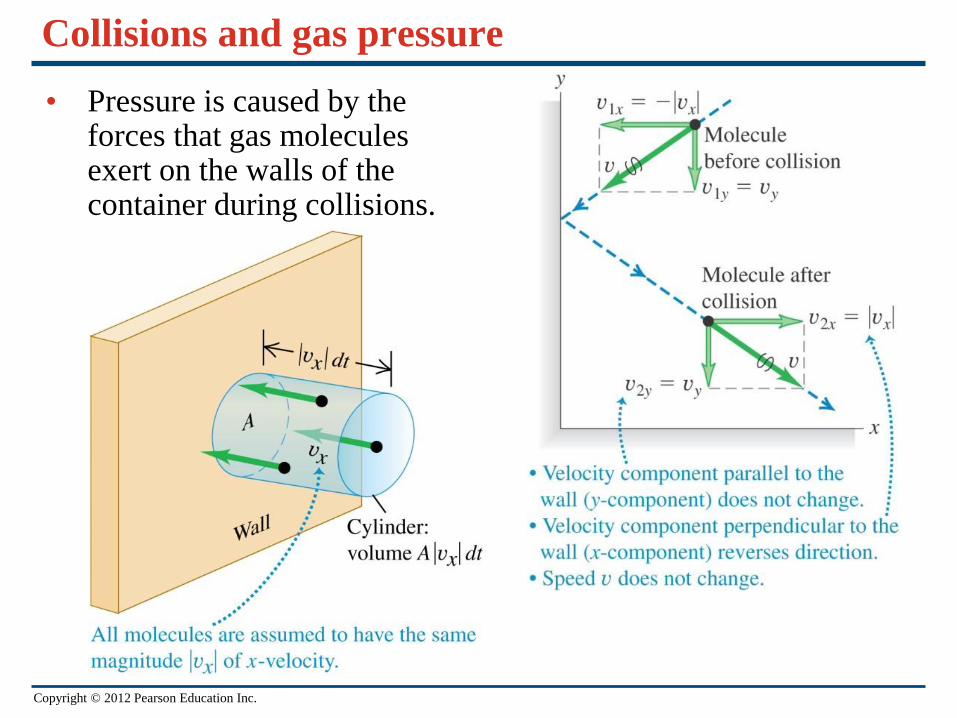
Collisions and gas pressure
• Pressure is caused by the forces that gas molecules exert on the walls of the container during collisions.

Copyright © 2012 Pearson Education Inc.
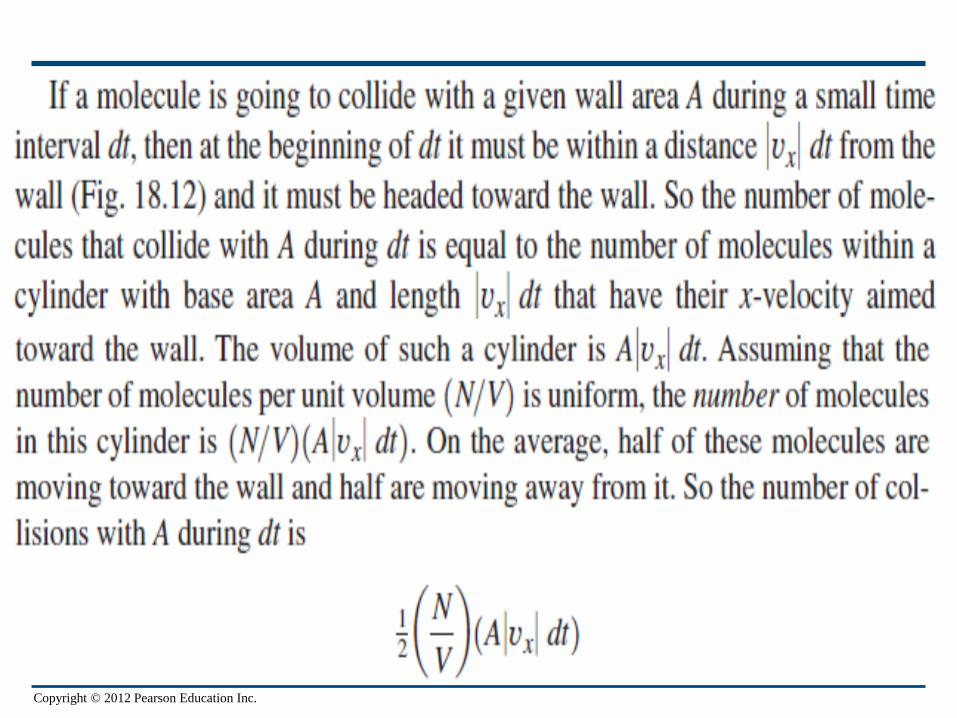
Our program is first to determine the number
of collisions that occur per unit time for a
certain area A of wall. Then we find the total
momentum change associated with these
collisions and the force needed to cause this
momentum change. From this we can
determine the pressure, which is force per unit
area, and compare the result to the ideal-gas
equation.

Copyright © 2012 Pearson Education Inc.
Copyright © 2012 Pearson Education Inc.

Copyright © 2012 Pearson Education Inc.

Copyright © 2012 Pearson Education Inc.

Copyright © 2012 Pearson Education Inc.

Copyright © 2012 Pearson Education Inc.

Copyright © 2012 Pearson Education Inc.

Copyright © 2012 Pearson Education Inc.
Copyright © 2012 Pearson Education Inc.
Copyright © 2012 Pearson Education Inc.

Copyright © 2012 Pearson Education Inc.

Copyright © 2012 Pearson Education Inc.
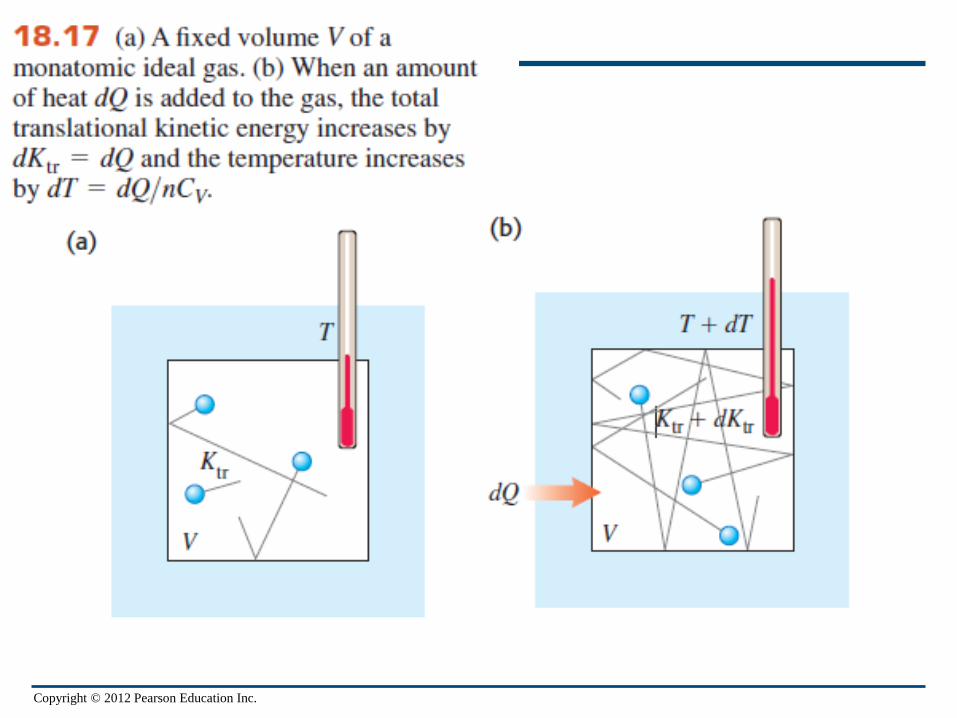
Heat Capacities of Gases
The basis of our analysis is that heat is
energy in transit. When we add heat to a
substance, we are increasing its molecular
energy. In this discussion the volume of the
gas will remain constant so that we don’t
have to worry about energy transfer
through mechanical work

Copyright © 2012 Pearson Education Inc.
Copyright © 2012 Pearson Education Inc.
Copyright © 2012 Pearson Education Inc.

Copyright © 2012 Pearson Education Inc.
Copyright © 2012 Pearson Education Inc.
Copyright © 2012 Pearson Education Inc.
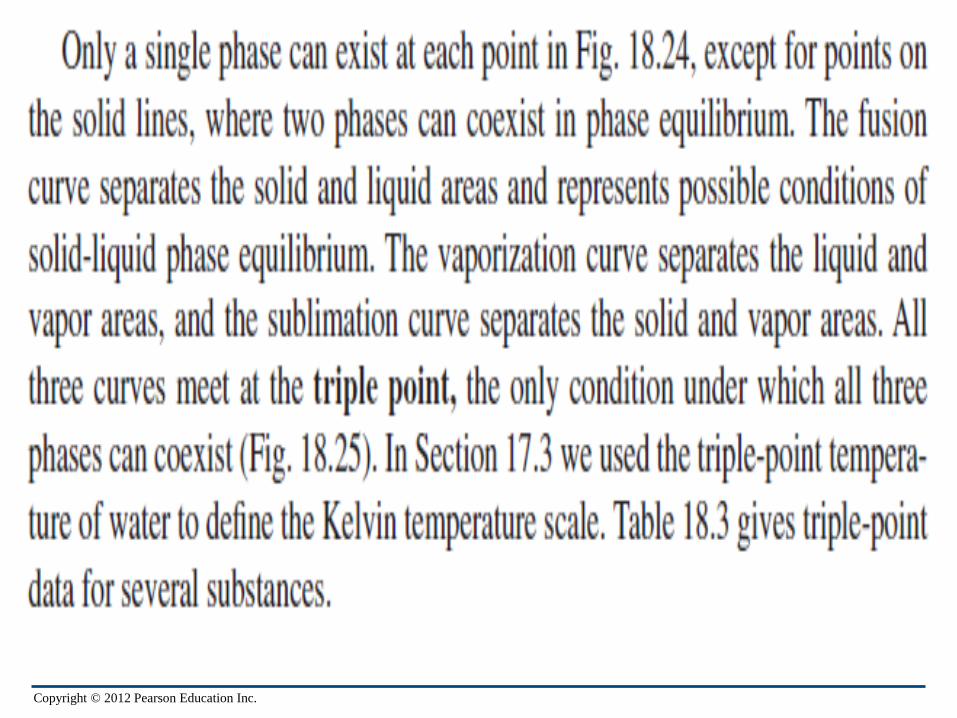
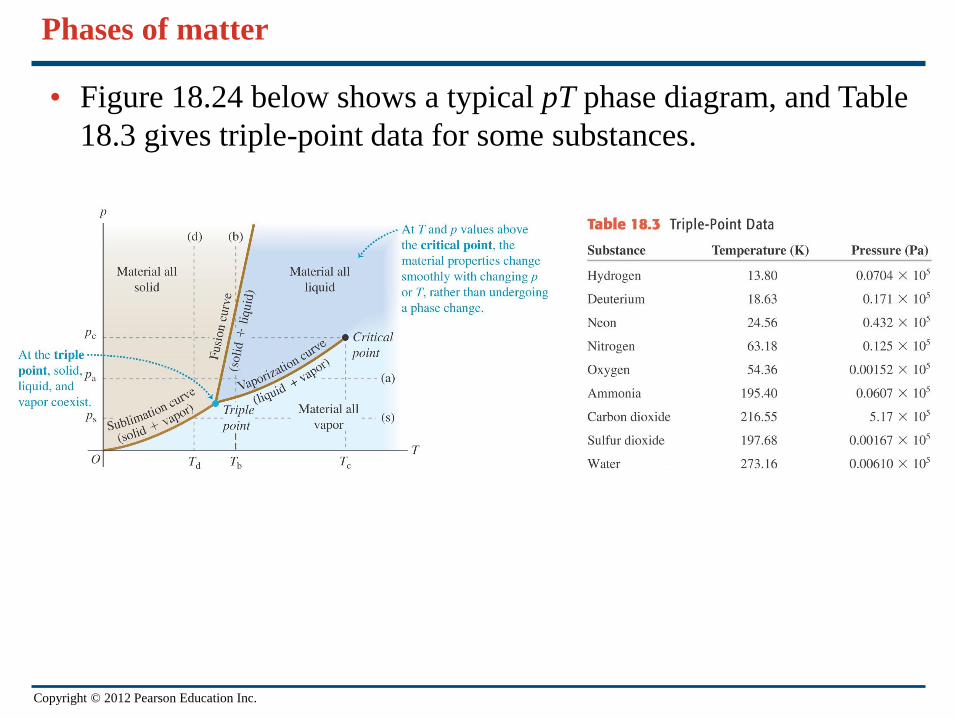
A transition from one phase to another ordinarily
requires phase equilibrium between the two
phases, and for a given pressure this occurs at
only one specific temperature. We can represent
these conditions on a graph with axes p and T,
called a phase diagram; Fig. 18.24 shows an
example. Each point on the diagram represents
a pair of values of p and T.

Copyright © 2012 Pearson Education Inc.
Phases of matter
• Figure 18.24 below shows a typical pT phase diagram, and Table
18.3 gives triple-point data for some substances.
Copyright © 2012 Pearson Education Inc.
Copyright © 2012 Pearson Education Inc.
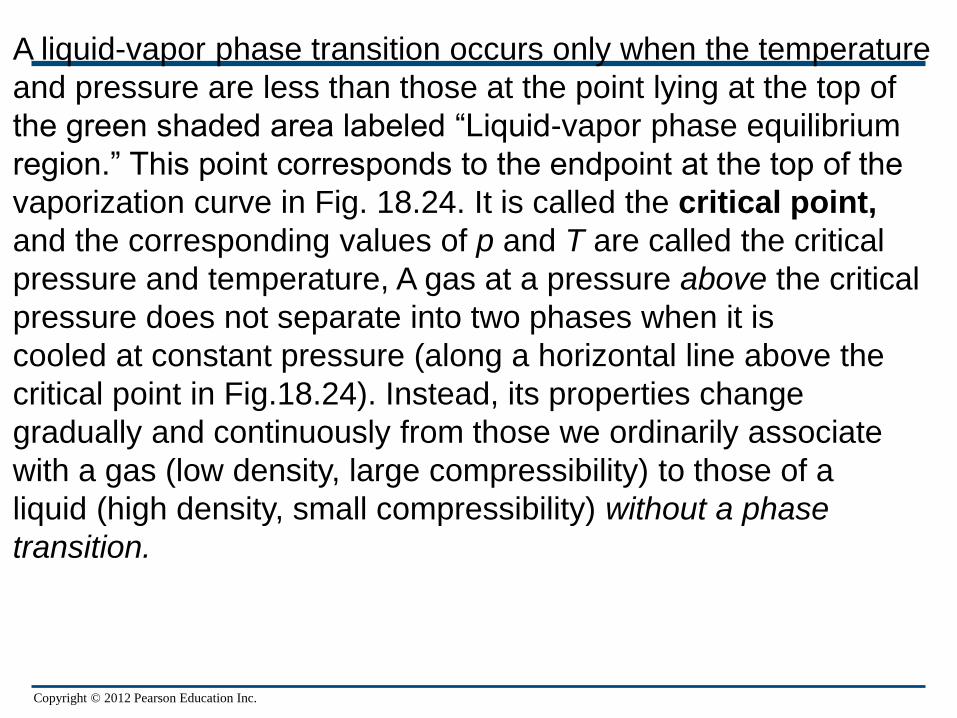
A liquid-vapor phase transition occurs only when the temperature
and pressure are less than those at the point lying at the top of
the green shaded area labeled “Liquid-vapor phase equilibrium
region.” This point corresponds to the endpoint at the top of the
vaporization curve in Fig. 18.24. It is called the critical point,
and the corresponding values of p and T are called the critical
pressure and temperature, A gas at a pressure above the critical
pressure does not separate into two phases when it is
cooled at constant pressure (along a horizontal line above the
critical point in Fig.18.24). Instead, its properties change
gradually and continuously from those we ordinarily associate
with a gas (low density, large compressibility) to those of a
liquid (high density, small compressibility) without a phase
transition.
Copyright © 2012 Pearson Education Inc.
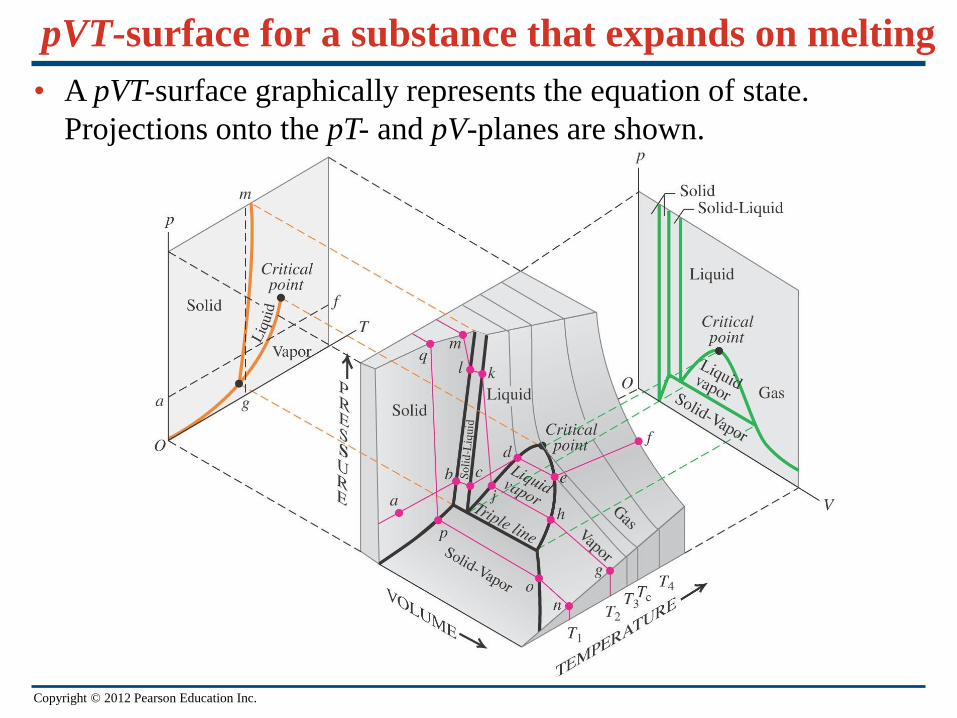
pVT-surface for a substance that expands on melting
• A pVT-surface graphically represents the equation of state.
Projections onto the pT- and pV-planes are shown.
Copyright © 2012 Pearson Education Inc.
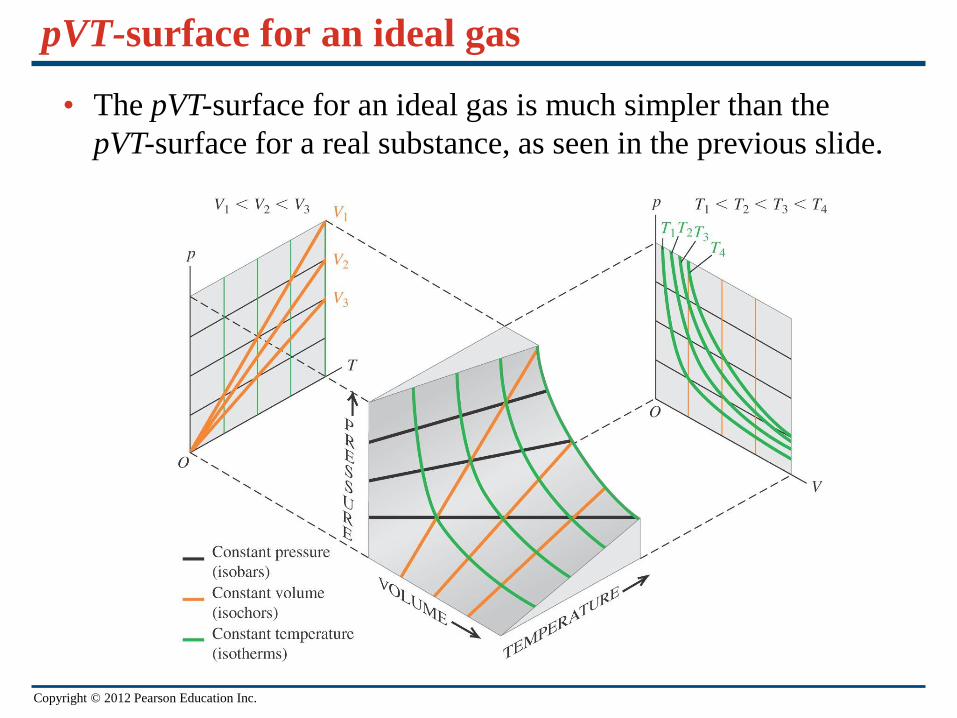
pVT-surface for an ideal gas
• The pVT-surface for an ideal gas is much simpler than the
pVT-surface for a real substance, as seen in the previous slide.

Copyright © 2012 Pearson Education Inc.
Collisions between molecules
• We model molecules as rigid spheres of radius r as shown at the right.
• The mean free path of a molecule is the average distance it travels between collisions.
• The average time between collisions is the mean free time.
• Follow the derivation of the mean free path.
• Follow Example 18.8.

Copyright © 2012 Pearson Education Inc.
Heat capacities of gases
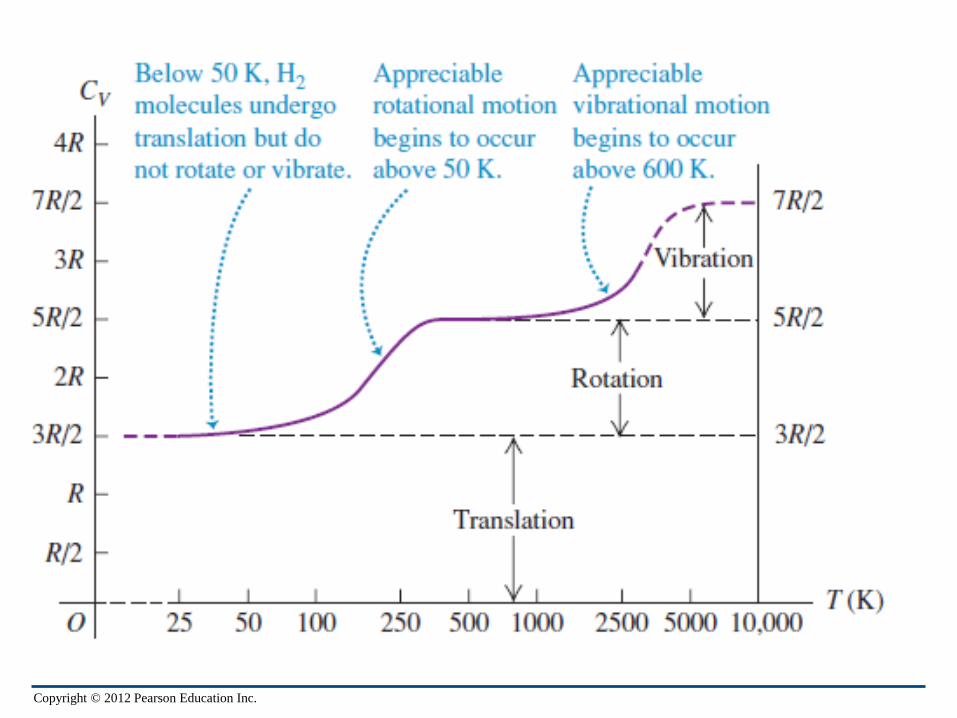
• The degrees of freedom are the number of velocity components needed to describe a molecule completely. A monatomic gas has three degrees of freedom and a diatomic gas has five. Figure 18.18 at the right illustrates the motions of a diatomic molecule.
• The equipartition of energy principle states that each degree of freedom has 1/2 kT of kinetic energy associated with it.
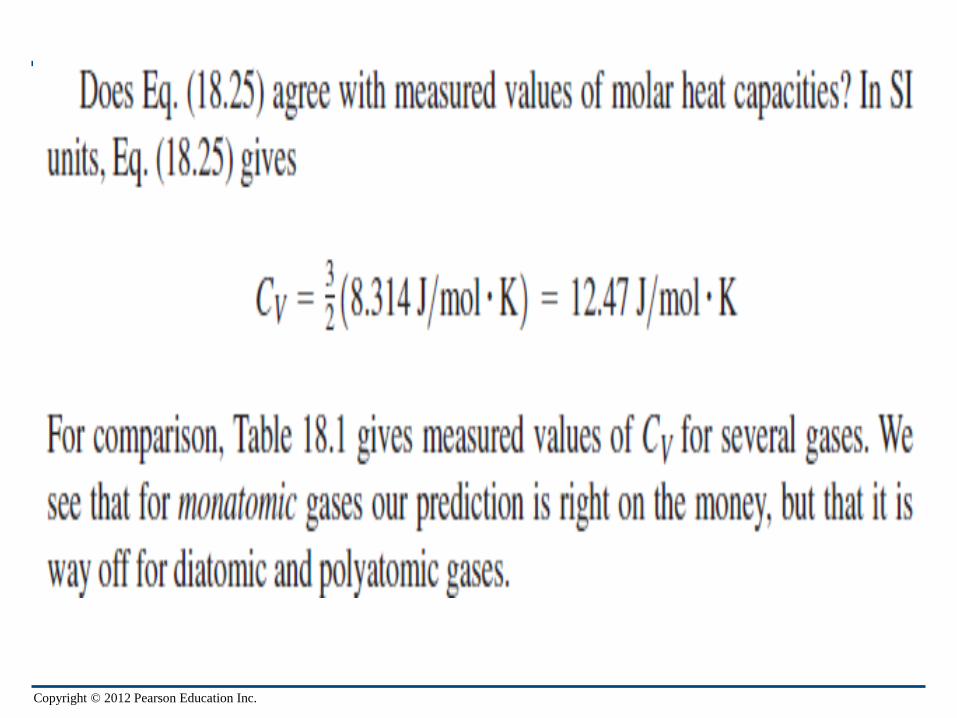
• Follow the derivation of the molar heat capacity at constant volume, CV, for monatomic and diatomic gases and for solids. The results are CV = 3/2 R for an ideal monatomic gas, CV = 5/2 R for a diatomic gas, and CV = 3R for an ideal monatomic solid.

Copyright © 2012 Pearson Education Inc.
Compare theory with experiment
• Table 18.1 shows that the calculated values for CV for monatomic gases and diatomic gases agree quite well with the measured values.

Copyright © 2012 Pearson Education Inc.
Molecular speeds
• The Maxwell-Boltzmann distribution f(v) gives the distribution of molecular speeds.
• Figure 18.23 at the right helps to interpret f(v). Part (a) shows how the shape of the curve depends on temperature. Part (b) shows the fraction of molecules within certain speed ranges. The most probable speed for a given temperature is at the peak of the curve.
Copyright © 2012 Pearson Education Inc.
Phases of matter
• Figure 18.24 below shows a typical pT phase diagram, and Table
18.3 gives triple-point data for some substances.