Embed Size (px)
Citation preview
5604 | Soft Matter, 2018, 14, 5604--5614 This journal is©The Royal Society of Chemistry 2018
Cite this: SoftMatter, 2018,
14, 5604
Thermal processing of thermogellingnanoemulsions as a route to tune materialproperties†
Li-Chiun Cheng, P. Douglas Godfrin, James W. Swan andPatrick S. Doyle *
Many soft matter systems have properties which depend on their processing history. It is generally
accepted that material properties can be finely tuned by carefully directing self-assembly. However, for
gelling colloidal systems, it is difficult to characterize such path-dependent effects since the colloidal
attraction is often provided by adding another component to the system such as salts or depletants.
Therefore, studies of and an understanding of the role of processing on the material properties of attractive
colloidal systems are largely lacking. In this work, we systematically studied how processing greatly
influences the properties and the microstructures of model attractive colloidal systems. We perform
experiments using a thermogelling nanoemulsion as a model system where the isotropic attraction can be
precisely tuned via the temperature. The effects of processing conditions on gel formation and properties
is tested by performing well-designed sequential temperature jumps. By properly controlling the thermal
history, we demonstrate that properties of colloidal gels can be beyond the limit set by direct quenching,
which has been a major focus in literature, and that otherwise slow aging of the system associated with a
decrease in elasticity can be prevented. Our results provide new experimental evidence of path-dependent
rheology and associated microstructures in attractive colloidal systems and provide guidance to future
applications in manufacturing complex colloid-based materials.
Introduction
Properties of many materials are affected by how they areprocessed. Perhaps the oldest and most common example ismetal forging: after the metal is shaped into the desiredgeometry, it is subsequently heated and maintained at anelevated temperature, and then cooled (quenched) to achieve thefinal state. This intermediate step, known as thermal annealing,allows the metallic atoms to relocate themselves and form specificmicrostructures. By manipulating time and temperature,annealing can effectively alter mechanical properties of themetallic materials, such as ductility and toughness.1,2 Suchthermal treatments can be also used in glasses or ceramicmaterials to remove internal stresses and prevent material failure.1
In modern technology, thermal annealing is also important insemiconductor manufacturing. Thermal treatment significantlyimproves the electric,3 optical,4,5 magnetic6 and mechanicalproperties.7 Annealing can be also applied to graphene-based
materials to improve mechanical strength and electric conduc-tivity due to improved atomic ordering.8
In addition to hard condensed matter, (thermal) processing canalso be applied to soft matter. Kim et al. found that poly(isoprene)-b-poly(lactide) copolymer melts can form aperiodic quasicrystallinestates that are commonly found in metal alloys.9 By rapidlyquenching the copolymer melt from the disordered state usingliquid nitrogen, then reheating it to T o TODT (where TODT is theorder–disorder transition temperature), the self-assembled polymermicelles can form hexagonal C14 and cubic C15 Laves phases. Sheet al. studied the self-assembly of polystyrene-b-poly(L-lactide) copo-lymer thin films grafted on silicon wafers.10 By thermally annealingthe polymer film, large-scale perpendicular cylinder structurescould be obtained. Moreover, such alignment of block copolymerfilms can also be controlled via an electric field. Olszowka et al.applied an in-plane electric field to process a triblock copolymerthin film composed of polystyrene-b-poly(2-hydroxyethyl metha-crylate)-b-poly(methyl methacrylate) copolymer.11 A highlyordered stripe pattern perpendicular to the film plane couldbe achieved. Lu et al. studied how thermal processing controlspolyamide 66/clay nanocomposite crystals.12 By carefully con-trolling the thermal history (melt, slow cooling, annealing),high crystallinity could be obtained.
Department of Chemical Engineering, Massachusetts Institute of Technology,
Cambridge, MA 02139, USA. E-mail: [email protected]
† Electronic supplementary information (ESI) available. See DOI: 10.1039/c8sm00814k
Received 19th April 2018,Accepted 12th June 2018
DOI: 10.1039/c8sm00814k
rsc.li/soft-matter-journal
Soft Matter
PAPER
Ope
n A
cces
s A
rtic
le. P
ublis
hed
on 2
0 Ju
ne 2
018.
Dow
nloa
ded
on 1
0/12
/201
8 2:
33:0
0 A
M.
Thi
s ar
ticle
is li
cens
ed u
nder
a C
reat
ive
Com
mon
s A
ttrib
utio
n-N
onC
omm
erci
al 3
.0 U
npor
ted
Lic
ence
.
View Article OnlineView Journal | View Issue

This journal is©The Royal Society of Chemistry 2018 Soft Matter, 2018, 14, 5604--5614 | 5605
There have been relatively few experimental studies examininghow processing via temporal modulation of inter-particleinteractions affects the material properties of gelling colloidalsuspensions. A promising approach is to use electric13 andmagnetic fields14,15 to direct self-assembly. In such systems, theexternal fields induce polarization that results in anisotropicinter-particle dipole–dipole interactions. The advantage of usingsuch fields is that the interaction can be temporally modulatedand is reversible, such that annealing strategies (e.g. AC electricfields or toggled magnetic fields) can be implemented to achieveequilibrium crystalline structures. However, the induced dipole–dipole interaction scales with the particle volume and becomesweak when the particles approach the nanoscale.16 Wagner andcoworkers studied the properties of octadecyl-coated silicananoparticles (which gel when the system is cooled) subjectto different thermal histories.17,18 However, they found therheological response of the system was independent of itsthermal history. Sherman et al. employed simulations to studythe self-assembly of nanoparticles under a toggled depletionattraction.19,20 Interestingly, by using time-dependent, periodicallytoggled attractions, particles could self-assemble into well-orderedcrystalline structures without kinetic trapping in a disordered state.However, it is difficult to experimentally implement time varyingcolloidal interactions in gelling systems which rely on the additionof a third component (such as depletants or salts) as a means tovary inter-particle interactions. Recently, our group has developed athermally gelling oil-in-water nanoemulsion consisting of surfactantstabilized, nano-sized polydimethylsiloxane droplets suspendedin a poly(ethylene glycol)diacrylate (PEGDA) aqueous continuousphase.21 At elevated temperatures, the hydrophobic end groupsof the PEGDA partition into the oil/water interface and bridgedroplets, which results in isotropic attractive interactions thatcan be temporally tuned ‘‘at will’’ without adding anothercomponent. Initial work22 has shown that different heating ratesresult in different rheological responses, though thermal proces-sing as a means to tune microstructure and mechanics has notbeen studied. We have also developed a technique that enablesus to directly visualize the gel microstructure at any state usingconfocal microscopy,22–24 allowing us to study how processingcontrols the gel structures. Additionally, the major changes inthe macroscopic (rheological) properties and microstructure ofthe nanoemulsion can be captured within DT = 30 to 40 1C (fromroom temperature to T = 50–60 1C).24,25 Such advantages makethis nanoemulsion a suitable model system to understand howthermal processing affects the behavior of colloidal gels withquantifiable experimental evidence.
In this work, we experimentally investigate sequential thermalprocessing of thermogelling nanoemulsions as a means tocontrol material properties. We use rheological propertiesand real-space microstructural correlations as our canonicalmetrics to characterize the material behaviors. By changingthermal processing routes, we show that properties of colloidalgels can be beyond the limit set by direct quenching. Forexample, under certain thermal processing conditions, the gelstrength of the nanoemulsion can increase by 47% compared toa step-jump in temperature, and the thermal processing can
effectively prevent a decrease in gel strength due to slowrelaxation resulting from directly quenching the system at hightemperatures. The path-dependent properties of our attractivecolloidal systems motivate the concept that one should thinkbeyond just varying chemical composition as a means tocontrol material properties and should expand to considerprocessing as an equally important parameter. Indeed, severalworks have shown that even a single material system showsdiverse structures and complex properties by carefully directingthe self-assembly.26–28 In addition to being model colloidalsystems, nanoemulsions are widely used in applications suchas food products, cosmetics, pharmaceuticals, and enhancedoil recovery for which the ability to engineer material propertiesthrough processing conditions is desirable.29
Results and discussionsThermally responsive nanoemulsions
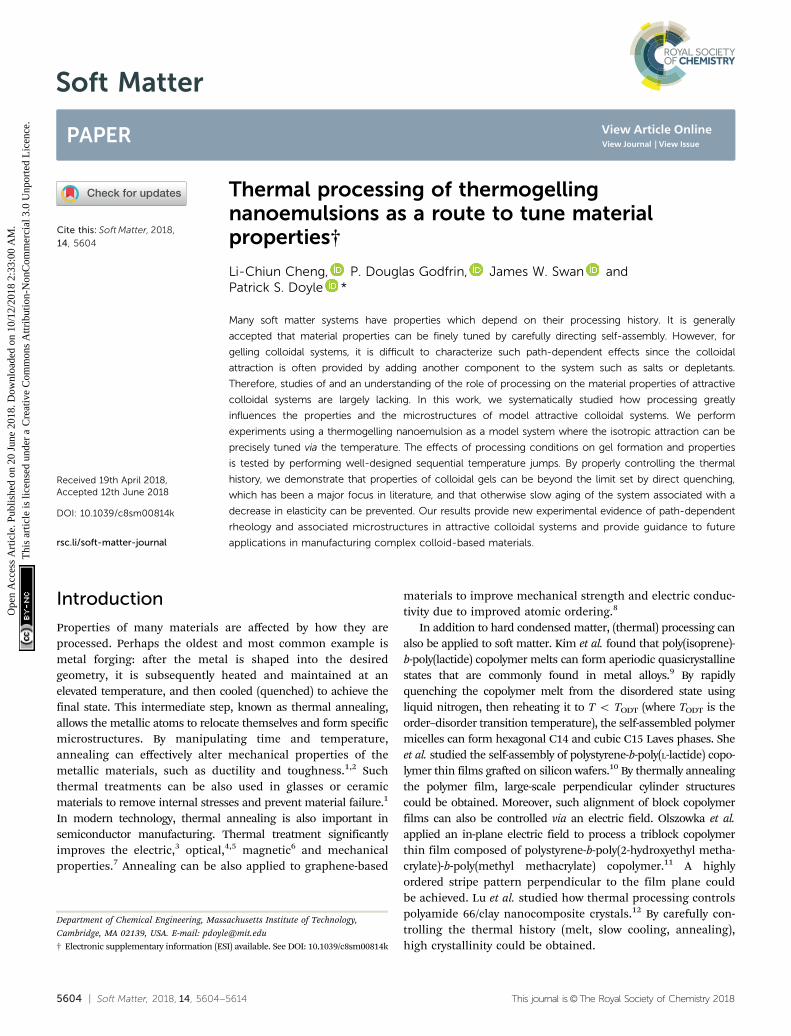
Self-assembly of the nano-sized polydimethylsiloxane (PDMS)droplets is driven by molecular-scale poly(ethylene glycol)dia-crylate (PEGDA) bridging at elevated temperatures, as shown inFig. 1a. The oil-in-water nanoemulsions were prepared usinghigh-pressure homogenization, which allows easy preparationof large quantities of emulsions with a range of droplet sizes(Fig. S1, ESI†). The canonical nanoemulsion formulation used inthis work contains PDMS droplets (droplet diameter 2a = 37 nm)of volume fraction = 0.15 suspended in the aqueous continuousphase consisting of PEGDA of volume fraction 0.33 and sodiumdodecyl sulfate (SDS) of concentration 0.175 M. For this formula-tion, the changes in rheology and microstructure of the nano-emulsion throughout the gelation process can be capturedwithin DT = 30 1C (Fig. 1c and d, from T = 20.0 to 50.0 1C).
At room temperature (20.0 1C), the droplets are well dispersed inthe continuous phase due to the electrostatic repulsion provided bySDS on the droplet surface and small Peclet number (Pe = pD4Drg/12kBT B 10�7, where D is the droplet diameter, Dr is the densitydifference between the oil and continuous phase, g is gravitationalacceleration, kB is the Boltzmann constant and T is absolutetemperature) of the nano-sized droplets.29 Accordingly, thenanoemulsion has a liquid-like behavior, which can been seenfrom direct observation (Fig. 1b) and the rheological response(Fig. 1c). As temperature rises, the hydrophobic end groups ofPEGDA partition into the oil/water interface and form inter-droplet bridging. The gelation results in the increase of visco-elastic moduli (Fig. 1c), and ultimately gives a sample-spanninggel network and solid-like behavior of the sample.
One-step temperature jump rheology
We first investigated the sample with a single temperaturejump (from T = 20.0 1C to a higher temperature). The one-step temperature jump can be viewed as directly quenchingthe nanoemulsion to a certain state, which is analogous to theformation of depletion gels by addition of small moleculedepletants into a colloidal suspension. Although this simplequenching mechanism (i.e. one-step temperature jump) has
Paper Soft Matter
Ope
n A
cces
s A
rtic
le. P
ublis
hed
on 2
0 Ju
ne 2
018.
Dow
nloa
ded
on 1
0/12
/201
8 2:
33:0
0 A
M.
Thi
s ar
ticle
is li
cens
ed u
nder
a C
reat
ive
Com
mon
s A
ttrib
utio
n-N
onC
omm
erci
al 3
.0 U
npor
ted
Lic
ence
.View Article Online
5606 | Soft Matter, 2018, 14, 5604--5614 This journal is©The Royal Society of Chemistry 2018
been studied in our prior work,22,24 we will describe newinsights in the following section which will guide our sub-sequent thermal processing.
Fig. 1c shows the results of small amplitude oscillatory shear(SAOS) rheological responses of the nanoemulsion at various
temperatures throughout gelation from T = 20.0 to 50.0 1C. Thefigure records the measurements just after the samples reachthe target temperature (see Fig. S2, ESI† for complete responseincluding the initial temperature increasing stage). The lengthof measurement was chosen to be 20 minutes which is long
Fig. 1 (a) Schematic of thermally responsive self-assembly. At rising temperatures, the hydrophobic groups of PEGDA partition into the oil/waterinterface and form droplet bridging. (b) Direct observation of the thermogelling nanoemulsion at T = 20 and T = 50 1C. (c) Rheological responses of thenanoemulsion through one-step temperature jumping from T = 20.0 1C. The measurement records the moduli right after T reaches the targettemperature at an oscillatory frequency of 20 rad s�1. Closed symbols: G0 (elastic modulus). Open symbols: G00 (viscous modulus). (d) Direct visualizationof the nanoemulsion microstructures using confocal microscopy at various times, t, at T = 32.5, 40.0 and 50.0 1C. Scale bars = 5 mm.
Soft Matter Paper
Ope
n A
cces
s A
rtic
le. P
ublis
hed
on 2
0 Ju
ne 2
018.
Dow
nloa
ded
on 1
0/12
/201
8 2:
33:0
0 A
M.
Thi
s ar
ticle
is li
cens
ed u
nder
a C
reat
ive
Com
mon
s A
ttrib
utio
n-N
onC
omm
erci
al 3
.0 U
npor
ted
Lic
ence
.View Article Online

This journal is©The Royal Society of Chemistry 2018 Soft Matter, 2018, 14, 5604--5614 | 5607
enough to capture the major changes in rheology and micro-structure at the selected temperatures (Fig. 1c and d). AtT = 20 1C, both moduli remain nearly constant and the lossmodulus G00 (measuring viscous dissipation) is larger than storagemodulus G0 (measuring elasticity) throughout the measurement.This liquid-like behavior holds when the temperature is increasedup to 30.0 1C (Fig. S2, ESI†).
The moduli significantly increase when the temperatureis raised to 32.5 1C. As time proceeds, G0 E G00 and bothmoduli continue growing throughout the measurement. Thefrequency sweep measurement further confirms T = 32.5 1C isthe gelation temperature where G0(o) and G00(o) are parallel onthe frequency spectrum (after the sample is held at 32.5 1C for10 min, Fig. S3, ESI†), according to the classic Chambon–Winter criterion.30,31 When further increasing the temperature,the moduli grow dramatically with G04 G00 by over one order ofmagnitude. At T = 40.0 1C, the elastic modulus G0 is larger thanthat at T = 32.5 1C by nearly two orders of magnitude, thoughG0 and G00 continue to increase in time. Fig. S4 (ESI†) shows along-time characterization (up to 50 min) at 32.5 1C wherechanges in microstructures and the rheological response canbe easily observed. The result shows the gelled system willeventually reach a pseudo-steady state as time proceeds. AboveT = 40 1C, the moduli reach a plateau, and the increase in themoduli with respect to temperature is limited (Fig. S3, ESI†). Atsuch high temperatures, G0 and G00 are nearly constant on thefrequency spectrum (Fig. S3, ESI†).
Hierarchal microstructures
We captured high-resolution images of nanoemulsion micro-structures at various states using confocal microscopy. Welabeled the oil droplets with a red, lipophilic dye (PKH26).Crosslinking the PEGDA in the continuous phase locks the self-assembled droplets in place at various states, and allows us todirectly visualize the internal structures of the nanoemulsion
gel at room temperature. Previous work has shown that theaddition of small amounts of these chemicals has negligibleinfluence on the nanoemulsion rheology and microstructure.22
Readers interested in investigation of the fractal dimensionsare referred to previous work by our group.25
Fig. 1d shows the microstructures at different temperaturesand various times, t. The times were chosen to be 2, 5, 10 and20 minutes in order to capture the major rheological changes.Interestingly, at T = 32.5 1C large strands coexist with clusters(see Fig. S2, ESI† for the discussion that these clusters are notstress-bearing structures). As time proceeds, strands increase innumber and size, and fewer clusters are present (see Fig. S4,ESI† for long-time characterization). These microstructuraltrends are consistent with the rheology in Fig. 1c, where G0
and G00 increase in time, since the larger strands are believed tobe responsible for the viscoelastic response.24
In order to quantitatively study the microstructures inFig. 1d, we measured correlation lengths from scattering plots.The raw confocal images were first processed via fast Fouriertransform (FFT) using image processing software ImageJ. Wethen calculated the radially averaged light intensity, I(q), of theFFT images, where q is the wave vector (see Fig. S5, ESI† for anexample of extracting correlation length).23,32 A representativescattering spectrum is shown in Fig. 2a. We can define threecorrelation lengths (LC = 2p/q) at T = 32.5 1C: primary correla-tion length (LC,1) from the primary peak, secondary correlationlength (LC,2) from the secondary peak and tertiary correlationlength (LC,3) from the inflection point. The calculated resultsare listed in Table 1.
The physical meaning of three correlation lengths is eluci-dated in Fig. 2b–d. LC,1 extracted from the strongest scatteringintensity corresponds to the averaged distance of the droplet-richdomains separated by the droplet-poor domains, shown as Fig. 2b.This primary correlation length (calculated as 2p/qmax, whereqmax is the wave vector corresponding to the strongest intensity)
Fig. 2 (a) Representative scattered intensity as a function of the wave vector, q, at T = 32.5 1C (t = 5 min) and 50.0 1C (t = 20 min) from FFT images. TheI–q data is then used to quantify the correlation lengths, LC, as shown in (b) correlation length of droplet-rich domains separated by droplet-poordomains, (c) correlation length of freely suspended clusters and (d) correlation length inside the droplet-rich domains. Images (b)–(d) are nanoemulsionsat T = 32.5 1C at t = 20 min. (e) Schematic of the hierarchical microstructures formed by the nanoemulsion droplets.
Paper Soft Matter
Ope
n A
cces
s A
rtic
le. P
ublis
hed
on 2
0 Ju
ne 2
018.
Dow
nloa
ded
on 1
0/12
/201
8 2:
33:0
0 A
M.
Thi
s ar
ticle
is li
cens
ed u
nder
a C
reat
ive
Com
mon
s A
ttrib
utio
n-N
onC
omm
erci
al 3
.0 U
npor
ted
Lic
ence
.View Article Online

5608 | Soft Matter, 2018, 14, 5604--5614 This journal is©The Royal Society of Chemistry 2018
has been investigated in previous work.22,33 On the other hand,LC,2 and LC,3 have not been reported before. LC,2 correspondsto the correlation length of the clusters suspended in thecontinuous phase, as shown in the Fig. 2c, which is furtherconfirmed by calculating the LC of cropped images where onlythe freely suspended clusters are considered (Fig. S6, ESI†).Therefore, it is not surprising that LC,2 is absent at T = 40.0 and50.0 1C since no coexisting clusters are observed (Fig. 1d). Thetertiary correlation length (LC,3) is at a smaller length scale (i.e.larger q), suggesting a ‘secondary’ structure inside the droplet-rich domains, as represented in Fig. 2d. This is also validatedby analyzing the intensity profile just within the droplet-richdomain shown in Fig. S6 (ESI†).
These secondary length scales (LC,1 and LC,3) are a manifesta-tion of a hierarchical structure (see Fig. S7, ESI† for two-stageyielding which also suggests a hierarchical network), which wasnot analyzed in our earlier publication. Such hierarchy has beenfound in a depletion gel by Lu et al.34 where they found that afterintroducing depletants into a colloidal suspension, the colloidsfirst form clusters, then form a spanning gel network, whichis then arrested. Moreover, Schurtenberger and coworkers alsofound ‘multiple steps’ in depletion gel formation using simula-tions and showed that the higher order gel structures are builton ‘meta-particles’ composed of few particles.35 Interestingly, intheir work, a scattering spectrum showing multi-stages was alsoreported, similar to Fig. 2a in this work.
At T = 32.5 1C, LC,3 remains nearly constant as time proceedsas shown in Table 1, and LC,3 E 1.17 mm is consistent with themicron-sized clusters seen in Fig. 1d and Fig. S6a (ESI†).Additionally, at later times, more and thicker strands areformed while fewer freely suspended clusters are present (seeFig. S8, ESI† for the changes in the scattered intensity spec-trum). Therefore, it is reasonable to postulate that the strandsare formed from the aggregation of clusters (as supported bydata in Fig. S4, ESI†), which is consistent with what has beendescribed in the literature for other systems.34–36 The proposedmechanism is shown in Fig. 2e. Upon increasing the tempera-ture, droplets aggregate and form clusters, and the clusters
serve as ‘building blocks’ which then self-assemble and spanthe macroscopic sample. The decrease in LC,1 correlates with anincrease in strands as time proceeds. As reported in Table 1,at T = 32.5 1C LC,1 decreases with time, which is consistentwith the qualitative observation in Fig. 1d where the strandsincrease in number.
At T = 40.0 and 50.0 1C, we were not able to capture theaggregation of such building blocks since the assemblydynamics are faster at these higher temperatures. However,we can still observe changes in LC,3. At T = 50 1C, LC,3 remainsconstant for the first 10 min, and the sample maintains a nearlyconstant elastic modulus. The decreasing G0 and increasing LC,3
at longer times will be discussed in detail in the next sectionand compared with the thermally processed samples. AtT = 40 1C, LC,3 decreases as time proceeds, which suggests theclusters still can re-assemble themselves even after they aggre-gate into a network. This reconstruction is reasonable becausethe characteristic diffusion time for 1 mm clusters is roughly5 seconds, which suggests rearrangement over the rheologicaltimescale is likely even after the bridging is formed. At suchmoderate temperature, the attraction is also weak enough not toinduce strong dynamical arrest, such as what is seen at T = 50 1C.
Two-step thermal processing
The thermal processing demonstration in this work was con-ducted at T = 32.5, 40.0 and 50.0 1C. After the pre-shear(conditioning step) at T = 20.0 1C, the sample was first broughtto T1 = 32.5 or 40.0 1C. After holding at T1 for thold = 2, 5 or10 min, the temperature was then jumped to T2 = 40.0 or50.0 1C. Therefore, a total of nine processing histories wereexplored: three sets of progressive temperature jumps (T1 to T2:32.5 to 40.0 1C, 32.5 to 50.0 1C and 40.0 to 50.0 1C) with threedifferent thold at each corresponding T1. The total measurementtime was kept constant at 20 min for consistency with the one-step temperature jump experiments.
Fig. 3 shows the results of the rheological responses of thethermally processed samples (see Fig. S9, ESI† for the temperaturehistory). Both moduli, G0 and G00, show the same trend underthermal processing, and only G0 is plotted here for discussion (G00
can be found in Fig. S10, ESI†). The results from the one-steptemperature jump are also plotted for comparison. Fig. 3a shows therheology of thermal processing between T = 32.5 to 40.0 1C.Comparing with one-step jump at T = 40.0 1C, holding at 32.5 1Chinders the development of the gel strength, and a smaller modulusis obtained when remaining at 32.5 1C longer. Additionally,similar to the one-step jump at T = 40.0 1C, the moduli ofprocessed samples are still increasing at the end of the measure-ment, suggesting that the gel is not fully arrested. The shape andthe trend of the curves suggest the possibility of a master curveby rescaling the time. The rescaled data is shown in Fig. 3b, inwhich time has been rescaled to be zero when the temperaturereaches T2. All processed samples collapse onto a master curve,suggesting the microstructures are self-similar, while the one-step jump sample is slightly above the master curve.
To investigate the microstructure of the processed sample aswell as the structural self-similarity, we also performed confocal
Table 1 Correlation lengths (LC) and the elastic moduli (G0) of thenanoemulsions with a one-step temperature jump at various timestamps.Error bars = 1 standard deviation from 9–15 images
Temperature(1C)
Time(min) G0 (Pa) LC,1 (mm) LC,2 (mm) LC,3 (mm)
32.5 2 0.635 23.3 � 10.1 1.38 � 0.07 1.15 � 0.055 0.895 15.9 � 11.6 1.46 � 0.08 1.17 � 0.09
10 1.628 8.49 � 2.01 1.71 � 0.12 1.18 � 0.0420 3.254 6.42 � 1.80 1.86 � 0.11 1.17 � 0.05
40.0 2 151.9 3.90 � 0.24 — 1.10 � 0.115 192.2 3.88 � 0.47 — 1.01 � 0.06
10 216.8 3.32 � 0.19 — 0.87 � 0.0520 258.9 3.34 � 0.15 — 0.86 � 0.03
50.0 2 445.3 2.30 � 0.14 — 0.64 � 0.035 463.4 2.42 � 0.21 — 0.63 � 0.01
10 461.4 2.50 � 0.19 — 0.65 � 0.0120 428.8 2.44 � 0.10 — 0.73 � 0.03
Soft Matter Paper
Ope
n A
cces
s A
rtic
le. P
ublis
hed
on 2
0 Ju
ne 2
018.
Dow
nloa
ded
on 1
0/12
/201
8 2:
33:0
0 A
M.
Thi
s ar
ticle
is li
cens
ed u
nder
a C
reat
ive
Com
mon
s A
ttrib
utio
n-N
onC
omm
erci
al 3
.0 U
npor
ted
Lic
ence
.View Article Online

This journal is©The Royal Society of Chemistry 2018 Soft Matter, 2018, 14, 5604--5614 | 5609
microscopy to visualize the microstructures. We used thePeltier plate equipped on the rheometer to make sure theimaging samples underwent exactly the same temperaturehistory as the samples used for rheological measurements.We then focused on the microstructures after the thermalprocessing was complete (i.e. the microstructures at t = 20min). The imaging results and the corresponding analyses forall thermal processed samples are shown in Fig. 4 and Table 2,respectively. The elastic moduli are also listed in Fig. 4.
For convenience in later discussion, the correlation length ofa one-step jump to temperature T will be denoted as LT
C.Fig. 4a–c show the microstructures of the processed
samples from T = 32.5 to 40.0 1C with different holding times.Surprisingly, the microstructures are significantly differentfrom both nanoemulsions with direct holding at T = 32.5 1Cand T = 40.0 1C. For the processed samples, the internalstructures fall between T = 32.5 1C and T = 40.0 1C, which isfurther confirmed by the LC,1 of the processed sample, which
Fig. 3 Temporal elastic modulus, G0, of the nanoemulsion undergoing two-step temperature jump with (a) to (b) 32.5 to 40.0 1C, (c) to (d) 32.5to 50.0 1C and (e) to (f) 40.0 to 50.0 1C. (a, c and e) Record the raw measurements. (b, d and f) Plot the G0 versus rescaled time. Rescaled time is equalto t � thold � tramp where tramp is the time needed for the temperature to adjust from T1 to T2 (limited by the Peltier plate). Typical values of tramp are45–55 seconds (see Fig. S6, ESI† for details).
Paper Soft Matter
Ope
n A
cces
s A
rtic
le. P
ublis
hed
on 2
0 Ju
ne 2
018.
Dow
nloa
ded
on 1
0/12
/201
8 2:
33:0
0 A
M.
Thi
s ar
ticle
is li
cens
ed u
nder
a C
reat
ive
Com
mon
s A
ttrib
utio
n-N
onC
omm
erci
al 3
.0 U
npor
ted
Lic
ence
.View Article Online

5610 | Soft Matter, 2018, 14, 5604--5614 This journal is©The Royal Society of Chemistry 2018
falls between L32.5C,1 and L40.0
C,1 , and a similar trend for LC,3. On theother hand, comparing amongst the thermally processed sam-ples, LC,1 slightly decreases with longer holding time (but thischange is insignificant if the standard deviation is considered),and LC,3 remains nearly constant. The nearly unchanged LC,1
and LC,3 suggest the difference in final moduli (after 20 min)after different holding times might result from either a smallerlength scale that cannot be clearly resolved in our currentmicroscopy setup (due to the resolution limit) or the numberdensity of gel strands formed by residual clusters in solution(that is difficult to quantify from individual microscopyimages). However, the self-similar structures of the samplesexplain the superposition behavior in Fig. 3b.
Interestingly, here we also observed an additional inflectionpoint from the intensity spectrum, similar to the secondarypeak in the one-step temperature jump at T = 32.5 1C. The LC,2
in the processed samples results from the microstructureassociated with finer, cluster-like structures, as highlighted inthe inset of Fig. 4e. We believe this smaller structure is aremnant of the freely suspended clusters from 32.5 1C, whichcan be found in the processed samples jumping from T = 32.5to 40.0 1C and T = 32.5 to 50.0 1C, while no signal is found forT = 40.0 to 50.0 1C. Note that even though there are only twocorrelation lengths that can be determined from processedsamples from T = 40.0 to 50 1C, we still use LC,1 and LC,3 forconsistency with other samples.
Fig. 3c shows the rheological response of the processedsamples from T = 32.5 to 50.0 1C. Interestingly, the processedsamples possess similar moduli as the sample with one-steptemperature jump at T = 50.0 1C, while they have significantlydifferent microstructures, as shown in Fig. 4d–f and Table 2.
Again, the processed samples show intermediate values of LC,1
and LC,3 (i.e. LT1C;1 oLC;1 oLT2
C;1 and LT1C;3 oLC;3 oLT2
C;3), and the
moduli collapse onto a master curve shown in Fig. 3d. Bycomparing among the processed samples, LC,1 and LC,3 stillremain nearly constant, and the moduli are also relativelyinsensitive to the holding time, as observed when processingfrom T = 32.5 to 40.0 1C. The relative insensitivity is reasonablesince a stronger attraction is induced at T = 50.0 1C, wherethe structure is dynamically arrested. Readers interested in anestimation of attractive potential energy are referred to theprevious work by our group.21 This stronger attraction can bealso qualitatively observed in Fig. 4 where the cluster associatedmicrostructures (LC,2, signifying the remanence of the clustersfrom 32.5 1C) can be more easily seen in the T = 32.5 to 50.0 1Csample due to dynamic arrest, compared to the T = 32.5 to40.0 1C. Additionally, by observing LC,3 (manifestation of the
Fig. 4 Microstructures of the nanoemulsion processed with a two-step temperature jump with thold = 2, 5 and 10 min. All images were taken at the endof thermal processing at t = 20 min. The elastic modulus at each condition is listed at the bottom left corner of each image. All scale bars = 5 mm.
Table 2 Correlation lengths (LC) and the elastic moduli (G0) of thenanoemulsions with a two-step temperature jump from T1 to T2 at variousholding time at T1. Error bars = 1 standard deviation from 9–15 images
Temperature(1C)
thold(min) G0 (Pa) LC,1 (mm) LC,2 (mm) LC,3 (mm)
32.5 to 40.0 2 240.1 5.46 � 0.61 1.48 � 0.06 0.97 � 0.045 214.7 5.19 � 0.50 1.41 � 0.10 0.97 � 0.04
10 195.5 5.17 � 0.52 1.53 � 0.07 1.00 � 0.05
32.5 to 50.0 2 470.6 5.42 � 0.68 1.41 � 0.10 0.85 � 0.025 474.4 5.65 � 0.92 1.40 � 0.09 0.84 � 0.02
10 485.5 5.64 � 0.61 1.45 � 0.06 0.88 � 0.05
40.0 to 50.0 2 610.4 3.06 � 0.18 — 0.79 � 0.045 660.8 3.01 � 0.21 — 0.77 � 0.01
10 662.3 3.08 � 0.34 — 0.72 � 0.02
Soft Matter Paper
Ope
n A
cces
s A
rtic
le. P
ublis
hed
on 2
0 Ju
ne 2
018.
Dow
nloa
ded
on 1
0/12
/201
8 2:
33:0
0 A
M.
Thi
s ar
ticle
is li
cens
ed u
nder
a C
reat
ive
Com
mon
s A
ttrib
utio
n-N
onC
omm
erci
al 3
.0 U
npor
ted
Lic
ence
.View Article Online

This journal is©The Royal Society of Chemistry 2018 Soft Matter, 2018, 14, 5604--5614 | 5611
aggregated cluster with the droplet-rich domains), LC,3 of theT = 32.5 to 50.0 1C sample is smaller than that of T = 32.5 to40.0 1C. Indeed, LC,3 is gradually reduced from the one-stepjump at 32.5 1C (LC,3 E 1.2 mm) to the two-step jump (LC,3 E 1.0 mmfor 32.5 to 40.0 1C and LC,3 E 0.85 mm for 32.5 to 50.0 1C). Thedecrease in LC,3 suggests the aggregated clusters become tighterduring the temperature jump.
Fig. 3e shows the rheological response of the processedsamples from T = 40.0 to 50.0 1C. Interestingly, the moduluscan be increased by 36 to 47%, depending on the holding time.The processed samples again have intermediate values of LC,1
and LC,3 (i.e. LT1C;1 oLC;1 oLT2
C;1 and LT1C;3 oLC;3 oLT2
C;3), while
LC,2 is absent since there are no freely suspended clusters atT = 40.0 1C. However, from Table 2, G0 with thold = 2 min isunexpectedly smaller than G0 with thold = 5 and 10 min, sinceLC,1 and LC,3 remain nearly constant across different holdingtimes. This difference in G0 is reproducible when repeating themeasurement (Fig. S11, ESI†). We hypothesize the difference inmoduli might result from a smaller length scale that cannot becaptured in our current microscopy setup. However, despite theslight difference, the processed samples do show the sametrend that G0 is larger than that of the one-step jump sample atT = 50.0 1C.
In addition to the increase in moduli (see Fig. S10 for G00,ESI†), we also note that thermal processing can prevent the gelfrom aging, which can be seen for the one-step jump toT = 50.0 1C. As shown in Fig. 3e, G0 starts to decrease aftert E 10 min (black dots). We hypothesize that such aging is dueto a slow structural relaxation because the nanoemulsion isdirectly and deeply quenched to a non-equilibrium state.37 Thisage-dependent viscoelasticity associated with an internal stressrelaxation in out-of-equilibrium systems has also been observedin depletion gels38 and actin/fascin bundle networks.39 To testour hypothesis, we performed a SAOS + LAOS measurement. Ifthe relaxation is responsible for aging and the associateddecrease in G0, yielding (by using LAOS) the gel should facilitatesuch relaxation and achieve the same final state. The results areshown in Fig. 5. The blue data shows the aging behavior of thenanoemulsion gel and the modulus eventually reached a plateauafter E6000 s using only SAOS. On the other hand, in the blackdata we used LAOS to yield the gel for 30 s at t = 600 s and themodulus still reached the same plateau as seen in the long timeSAOS experiment, but the entire process only took E1000 s. Itthus takes approximately one-sixth the amount of time for themeasurement with yielding to reach the final state. Additionally,similar to T = 40.0 to 50.0 1C processing (Fig. 3e), the samplesprocessed from T = 32.5 to 50.0 1C also show that the decrease inG0 can be effectively reduced by thermal processing, which ishighlighted by the inset in Fig. 5 (this is not easily observed inFig. 3c due to the scale of the y-axis).
Fig. 6 summarizes how the gel strength (G0) and the micro-structure (LC,1) can be controlled via thermal processing. Theblack dots are the results of the traditional direct quenching(single temperature jump) of the nanoemulsion gel—G0 increasesas LC,1 decreases. This inverse relation of G0 to LC,1 has been
reported in prior studies.33,40 On the other hand, with morecomplex thermal processing, properties beyond the limit set bydirect quenching (indicated by the black dashed line) canbe accessed. For example, with two-step processing we canmaintain the same gel strength (e.g. G0 E 450 Pa), but createmuch more open microstructures (more than doubling ofLC,1 to E5.5 mm). We can also have gels with the same LC,1
(E 5.5 mm) but with different G0 (E200 to 480 Pa). Additionally,two-step thermal processing can increase the gel strengthbeyond that attainable by directly quenching the system with a
Fig. 5 Temporal decrease in G0 due to the slow relaxation when thenanoemulsion is directly quenched at T = 50.0 1C (blue). Yielding thenanoemulsion can effectively reduce the time needed to reach the finalstate (black). The yielding step is performed using LAOS with a strain = 15%at a frequency = 20 rad s�1. Inset plot highlights the thermal processingsample from T = 32.5 to 50.0 1C (which is difficult to notice in Fig. 3 due tothe scale of the y-axis) can also prevent the decrease in modulus asprocessing from T = 40.0 to 50.0 1C.
Fig. 6 G0 versus LC,1 of one-step and two-step temperature jump thermalprocessing. Black dots are from the one-step jump at T = 40.0 and 50.0 1Cat various time points. Red, green and blue symbols are the data after two-step jump processing is complete (t = 20 min). Black dashed line is drawnto guide the eye and denotes the limit set by direct quenching.
Paper Soft Matter
Ope
n A
cces
s A
rtic
le. P
ublis
hed
on 2
0 Ju
ne 2
018.
Dow
nloa
ded
on 1
0/12
/201
8 2:
33:0
0 A
M.
Thi
s ar
ticle
is li
cens
ed u
nder
a C
reat
ive
Com
mon
s A
ttrib
utio
n-N
onC
omm
erci
al 3
.0 U
npor
ted
Lic
ence
.View Article Online

5612 | Soft Matter, 2018, 14, 5604--5614 This journal is©The Royal Society of Chemistry 2018
strong attraction potential. Overall, we find that thermal proces-sing allows us to access states above the dashed line depicted forthe one-step temperature jumps.
The properties of the nanoemulsion gels are highly depen-dent on how they reach the final state, even though the samefinal temperature is reached. The gels have significantly differ-ent rheology and microstructures depending on their thermalhistory, and these properties can be beyond the limit set bydirect quenching, which has been a major focus in literature.We postulate that when undergoing thermal processing fromT1 to T2, the system has a memory of the structures at T1 andreconstructs these intermediate structures when switched to T2.This postulate is consistent with the observation that thecluster-associated structures (LC,2) are found in processed sam-ples from T = 32.5 to 40.0 1C and from T = 32.5 to 50.0 1C, whichindicates the remanence of the clusters from 32.5 1C. A holdingstep at T1 seems to be similar to thermal annealing. Thermalannealing is often used as an additional step in materialmanufacturing processes that allows a system to reach theglobal free energy minimum without being kinetically trapped.It is therefore often used in order to create a regular order on amolecular scale and to improve and control the macroscopicproperties.1 However, contrary to the results of thermal anneal-ing, colloidal gel systems are often associated with a kineticallyarrested disordered state, such as percolation18 or spinodaldecomposition,34 whereas the global energy minimum corre-sponds to the bulk phase separation.29,41 Moreover, our ther-mal processing results are relatively insensitive to the length oftime holding at T1, and the thermal processing does notfacilitate a regular pattern of colloidal order. Both behaviorsare contrary to what has been reported in the literature, wherethe properties of the material are strongly dependent on theannealing time.10,11 Future work using simulations will helpelucidate the mechanism on the nanometer scale (i.e. singledroplet) and the droplet diffusive time scale (droplet diffusivetime E a2/D = 6pZa3/kBT B 10�4 s, where a is the dropletdiameter, D is the droplet diffusivity, Z is the viscosity of thecontinuous phase kB is the Boltzmann constant and T isabsolute temperature). We will study both dynamics andmechanisms of the effect of thermal processing and the evolu-tion of the microstructures, which will bring more insights intothe spatial and temporal evolution of the system, as experi-mentally demonstrated in this work.
Conclusion
We have demonstrated that thermal processing conditions canbe used to tune both the mechanical and structural propertiesof a thermally gelling nanoemulsion suspension. Under certainthermal processing conditions, the gel strength can be increasedup to 47% compared to a single temperature jump. Additionally,the thermal processing can effectively prevent a decrease in gelstrength due to a slow relaxation. By combining the results fromone-step and two-step temperature jumps, properties of gels canbe beyond the limit set by direct quenching, which has been a
major focus in literature. We have also shown that the nano-emulsion gel is a hierarchical structure comprised of multiplelength scales which are in turn related to the rheologicalproperties. Our results suggest that the mechanistic reasonfor such control is that the system sequentially forms hierarch-ical microstructures and dynamic tuning of the droplet inter-actions through temperature can influence the trajectorytaken through phase-space. Our work also provides new experi-mental evidence which relates the path-dependent rheologicalproperties to associated microstructures in attractive colloidalsystems. Future work using simulations will help validate thepostulated mechanisms and role of hierarchical assembly.Concepts from our work could be applied to other attractivecolloidal systems which can improve the understanding ofsuch systems, and can be utilized in colloid-based materialdesign. Translation of model systems to products requires thedevelopment of industrial processes. Here we demonstratedthat the process itself is an important tool to be leveraged totune material properties.
Materials and methodsMaterials
Sodium dodecyl sulfate (SDS), poly(ethylene glycol)diacrylate(PEGDA, Mn = 700 g mol�1), silicone oil (polydimethylsiloxane,PDMS, viscosity = 5 cSt at 25 1C), lipophilic dye PKH26 (excitationand emission wavelengths lex/lem = 551/567 nm) and photo-initiator 2-hydroxy-2-methylpropiophenone (Darocur 1173) werepurchased from Sigma-Aldrich. All chemicals were used withoutfurther purification.
Synthesis of nanoemulsions
The nanoemulsion system studied in this work was composedof a disperse phase PDMS of volume fraction = 0.15, an aqueouscontinuous phase consisting of PEGDA of volume fraction =0.33, SDS of concentration = 0.175 M and deionized water.
The nanoemulsions were synthesized by the followingprocedure. First, a pre-emulsion was prepared by adding PDMSto the aqueous continuous phase composed of PEGDA and SDSusing magnetic stirring with a speed of 700 rpm. Stirring wasmaintained for 20 min or until no macroscopic phase separationwas observed. A high-pressure homogenizer (EmulsiFlex-C3,Avestin) was used to process the pre-emulsion into the corres-ponding nanoemulsion. The homogenization was conducted ata pressure of 18 kpsi for 14 passes. The emulsion was cooled to4 1C between each pass and the final nanoemulsion was storedat 4 1C until further use.
The size of PDMS droplets was monitored using dynamiclight scattering (90Plus PALS, Brookhaven Instruments). Fig. S1(ESI†) shows the evolution of droplet size after each pass. Thedroplet size was measured by diluting the oil volume fraction ofthe emulsion from 0.15 to 0.002 using an aqueous dilutingagent consisting of PEGDA with volume fraction = 0.33. It hasbeen reported previously that dilution using this diluent does notaffect the droplet size and polydispersity.21 The nanoemulsion
Soft Matter Paper
Ope
n A
cces
s A
rtic
le. P
ublis
hed
on 2
0 Ju
ne 2
018.
Dow
nloa
ded
on 1
0/12
/201
8 2:
33:0
0 A
M.
Thi
s ar
ticle
is li
cens
ed u
nder
a C
reat
ive
Com
mon
s A
ttrib
utio
n-N
onC
omm
erci
al 3
.0 U
npor
ted
Lic
ence
.View Article Online
This journal is©The Royal Society of Chemistry 2018 Soft Matter, 2018, 14, 5604--5614 | 5613
suspension used in this work has a droplet size equal to 37 nmwith polydispersity equal to 0.187.
Rheology
Rheological characterization was performed by using a stress-controlled rheometer (ARG2, TA instrument) equipped with a21 60 mm aluminum upper-cone and a temperature-controlledPeltier lower-plate. For each measurement, the nanoemulsion wasloaded onto the Peltier plate at 20 1C. A wetted solvent trap wasused and a few drops of deionized water were added on top of thecone to control the evaporation. Before each measurement, apreshear step with a constant rotation at a rate of 20 rad s�1 for 30seconds followed by a 90 seconds period where the sampleremained quiescent at T = 20 1C, was performed. Thermalprocessing measurements (one-step and two-step jumping)were carried out at an oscillatory frequency = 20 rad s�1 withstrain = 0.1%. The speed of temperature increase was set to be themaximum rate that the rheometer was able to achieve. Fig. S2b(ESI†) shows the actual temperature history during the measure-ment. Large amplitude oscillatory shear (LAOS) at an oscillatoryfrequency = 20 rad s�1 with strain = 15% was performed to yieldthe nanoemulsion at 50 1C for the gel aging (Fig. 5). LAOS wasapplied at t = 600 s for 30 seconds. Freshly loaded nanoemulsionswere used for each measurement.
Confocal microscopy
Direct visualization of the gel microstructures was carried outby using a confocal laser scanning microscope (LSM 700, Zeiss)quipped with a 63� oil-immersion objective (numericalaperture = 1.4). Samples for imaging were prepared as follows.First, the nanoemulsion was mixed with 1 vol% fluorescent dyeand 1 vol% photoinitiator. It has been shown previously thatthe addition of this small amount of chemicals does not affectthe microstructures.22 Subsequently, 150 mL of the mixture wasloaded into a glass chamber (Lab-Tekt #155411, Thermo FisherScientific). Pipetting samples into glass chambers for micro-scopy mimics the preshear step on the rheometer. Then, thesample-loaded glass chamber was put onto the Peltier plate onthe rheometer at 20 1C for 90 seconds, and the sample under-went the same thermal history as during the rheologicalcharacterization. The time scale of the heat transfer from thePeltier plate to the sample through the glass is negligible. Thethickness of the glass microscope slide is 0.15 mm accordingto the vendor. The thermal diffusivity of the glass slide isabout 0.55 mm2 s�1.42 Therefore, The diffusive time scale is0.152/0.55 = 0.04 s, which is negligible compared to the experi-mental time scale. After thermal processing, the sample wasexposed to UV-light (l = 365 nm) for 50 seconds. The crosslinkingof the PEGDA in the continuous phase locks the pristine micro-structure in place, which allows one to directly visualize the gelstructure at room temperature using confocal microscopy.
Conflicts of interest
There are no conflicts to declare.
Acknowledgements
This research was primarily supported by NSF through theMassachusetts Institute of Technology Materials ResearchScience and Engineering Center DMR – 1419807. L.-C. Chengwas supported in part by a scholarship from Think GlobalEducation Trust (Taiwan). The authors thank G. H. McKinleyand L. Chen for insightful discussions.
References
1 W. D. Callister and D. G. Rethwisch, Materials science andengineering: An Introduction, John Wiley and Sons, 9th edn,2013.
2 M. Chen, Annu. Rev. Mater. Res., 2008, 38, 445–469.3 S. Nakamura, T. Mukai, M. Senoh and N. Iwasa, Jpn. J.
Appl. Phys., 1992, 31, 139–142.4 S. Malik, C. Roberts, R. Murray and M. Pate, Appl. Phys. Lett.,
1997, 71, 1987–1989.5 T. Kitatani, K. Nakahara, M. Kondow, K. Uomi and
T. Tanaka, J. Cryst. Growth, 2000, 209, 345–349.6 W. Prellier, A. Fouchet and B. Mercey, J. Phys.: Condens.
Matter, 2003, 15, 1583–1601.7 G. Ziegler, J. Heinrich and G. Wotting, J. Mater. Sci., 1987,
22, 3041–3086.8 H. Chen, M. B. Muller, K. J. Gilmore, G. G. Wallace and
D. Li, Adv. Mater., 2008, 20, 3557–3561.9 K. Kim, M. W. Schulze, A. Arora, R. M. Lewis III, M. A. Hillmyer,
K. D. Dorfman and F. S. Bates, Science, 2017, 356, 520–523.10 M.-S. She, T.-Y. Lo and R.-M. Ho, ACS Nano, 2013, 7, 2000–2011.11 V. Olszowka, M. Hund, V. Kuntermann, S. Scherdel,
L. Tsarkova and A. Boker, ACS Nano, 2009, 3, 1091–1096.12 Y. Lu, Y. Zhang, G. Zhang, M. Yang, S. Yan and D. Shen,
Polymer, 2004, 45, 8999–9009.13 S. O. Lumsdon, E. W. Kaler and O. D. Velev, Langmuir, 2004,
20, 2108–2116.14 J. W. Swan, P. A. Vasquez, P. A. Whitson, E. M. Fincke,
K. Wakata, S. H. Magnus, F. D. Winne, M. R. Barratt,J. H. Agui, R. D. Green, N. R. Hall, D. Y. Bohman,C. T. Bunnell, A. P. Gast and E. M. Furst, Proc. Natl. Acad.Sci. U. S. A., 2012, 109, 16023–16028.
15 J. W. Swan, J. L. Bauer, Y. Liu and E. M. Furst, Soft Matter,2014, 10, 1102–1109.
16 M. Grzelczak, J. Vermant, E. M. Furst and L. M. Liz-Marzan,ACS Nano, 2010, 4, 3591–3605.
17 M. B. Gordon, C. J. Kloxin and N. J. Wagner, J. Rheol., 2017,61, 23–34.
18 A. P. R. Eberle, R. Castaneda-Priego, J. M. Kim and N. J. Wagner,Langmuir, 2012, 28, 1866–1878.
19 Z. M. Sherman, H. Rosenthal and J. W. Swan, Langmuir,2018, 34, 1029–1041.
20 Z. M. Sherman and J. W. Swan, ACS Nano, 2016, 10,5260–5271.
21 M. E. Helgeson, S. E. Moran, H. Z. An and P. S. Doyle, Nat.Mater., 2012, 11, 344–352.
22 L. C. Hsiao and P. S. Doyle, Soft Matter, 2015, 11, 8426–8431.
Paper Soft Matter
Ope
n A
cces
s A
rtic
le. P
ublis
hed
on 2
0 Ju
ne 2
018.
Dow
nloa
ded
on 1
0/12
/201
8 2:
33:0
0 A
M.
Thi
s ar
ticle
is li
cens
ed u
nder
a C
reat
ive
Com
mon
s A
ttrib
utio
n-N
onC
omm
erci
al 3
.0 U
npor
ted
Lic
ence
.View Article Online

5614 | Soft Matter, 2018, 14, 5604--5614 This journal is©The Royal Society of Chemistry 2018
23 L. C. Hsiao, A. Z. M. Badruddoza, L.-C. Cheng and P. S. Doyle,Soft Matter, 2017, 13, 921–929.
24 L.-C. Cheng, L. C. Hsiao and P. S. Doyle, Soft Matter, 2017,13, 6606–6619.
25 M. E. Helgeson, Y. Gao, S. E. Moran, J. Lee, M. Godfrin,A. Tripathi, A. Bose and P. S. Doyle, Soft Matter, 2014, 10,3122–3133.
26 E. Wetterskog, C. Jonasson, D.-M. Smilgies, V. Schaller,C. Johansson and P. Svedlindh, ACS Nano, 2018, 12, 1403–1412.
27 C. Yilmaz, A. Sirman, A. Halder and A. Busnaina, ACS Nano,2017, 11, 7679–7689.
28 L. Lin, X. Peng, M. Wang, L. Scarabelli, Z. Mao, L. M. Liz-Marzan, M. F. Becker and Y. Zheng, ACS Nano, 2016, 10,9659–9668.
29 A. Gupta, H. B. Eral, T. A. Hatton and P. S. Doyle, Soft Matter,2016, 12, 2826–2841.
30 H. H. Winter and F. Chambon, J. Rheol., 1986, 30, 367–382.31 F. Chambon and H. H. Winter, J. Rheol., 1987, 31, 683–697.32 S. Wassen, N. Loren, K. van Bemmel, E. Schuster, E. Rondeau
and A.-M. Hermansson, Soft Matter, 2013, 9, 2738–2749.
33 Y. Gao, J. Kim and M. E. Helgeson, Soft Matter, 2015, 11,6360–6370.
34 P. J. Lu, E. Zaccarelli, F. Ciulla, A. B. Schofield, F. Sciortinoand D. A. Weitz, Nature, 2008, 453, 499–503.
35 T. Gibaud, N. Mahmoudi, J. Oberdisse, P. Lindner, J. S.Pedersen, C. L. P. Oliveira, A. Stradner and P. Schurtenberger,Faraday Discuss., 2012, 158, 267.
36 P. J. Lu and D. A. Weitz, Annu. Rev. Condens. Matter Phys.,2013, 4, 217–233.
37 L. Cipelletti and L. Ramos, Curr. Opin. Colloid Interface Sci.,2002, 7, 228–234.
38 L. Ramos and L. Cipelletti, Phys. Rev. Lett., 2001, 87, 245503.39 O. Lieleg, J. Kayser, G. Brambilla, L. Cipelletti and
A. R. Bausch, Nat. Mater., 2011, 10, 236–242.40 R. N. Zia, B. J. Landrum and W. B. Russel, J. Rheol., 2014, 58,
1121–1157.41 M. E. Helgeson, Curr. Opin. Colloid Interface Sci., 2016, 25,
39–50.42 H. Mehling, G. Hautzinger, O. Nilsson, J. Fricke, R. Hofmann
and O. Hahn, Int. J. Thermophys., 1998, 19, 941–949.
Soft Matter Paper
Ope
n A
cces
s A
rtic
le. P
ublis
hed
on 2
0 Ju
ne 2
018.
Dow
nloa
ded
on 1
0/12
/201
8 2:
33:0
0 A
M.
Thi
s ar
ticle
is li
cens
ed u
nder
a C
reat
ive
Com
mon
s A
ttrib
utio
n-N
onC
omm
erci
al 3
.0 U
npor
ted
Lic
ence
.View Article Online


![2011-Godfrin-Cryogenic fluids.ppt [Mode de compatibilité]cryocourse2011.grenoble.cnrs.fr/IMG/file/Lectures/2011-Godfrin... · Tc = 126 K T (K) 1000 . European ... (Avogadro’s number)](https://img.dokumen.tips/doc/110x75/5a9e2cf97f8b9a39338e0b2e/2011-godfrin-cryogenic-mode-de-compatibilitcryocourse2011grenoblecnrsfrimgfilelectures2011-godfrintc.jpg)