Embed Size (px)
Citation preview

NREL is a national laboratory of the U.S. Department of Energy, Office of Energy Efficiency and Renewable Energy, operated by the Alliance for Sustainable Energy, LLC.
Thermal Management of Power Semiconductor Packages – Matching Cooling Technologies with Packaging Technologies
IMAPS 2nd Advanced Technology Workshop on Automotive Microelectronics and Packaging
Kevin BennionGilbert Moreno
Dearborn, MIApril 27, 2010
NREL/PR-540-48147

National Renewable Energy Laboratory Innovation for Our Energy Future
Acknowledgements
2
• Jason Lustbader, National Renewable Energy laboratory (NREL)
• Advanced Power Electronics and Electric Machines Benchmarking, Oak Ridge National Laboratory (ORNL)
Funding Provide by:Susan Rogers, Office of Vehicle Technology, U.S. Department of Energy

National Renewable Energy Laboratory Innovation for Our Energy Future
Objective
1. Efficient heat transfer technologies can enable increased power density and specific power.
2. Thermal management is a path to reduce cost and maintain robust operation.
3. Thermal management should not be an afterthought but should involve an integrated systems approach.
4. Cost-effective solutions require integration of capabilities for cooling, packaging (materials/geometry), and reliability prediction.
3
Power ElectronicsModule
Battery
ElectricMachines
Other
Toyota Camry - 2007
Source: Technology and Cost Report of the MY2007 Toyota Camry - ORNL

National Renewable Energy Laboratory Innovation for Our Energy Future
Relevance of Thermal Management
4
Thermal management directly relates to improvements in cost, power density, and specific power.
Impacts: Lower cost, volume, and weight“Easy ways to increase output power are paralleling more silicon chips and/or step-up the die size to increase current capacity. But this strategy is unaffordable in terms of both increased chip cost and packaging space.”
Concern: Heat“The most significant concern for increasing current is intensified heat dissipation.”
Source: Yasui, H., et al, “Power Control Unit of High Power Hybrid System” – EVS23
Prius PE MY 2004 Camry PE MY 2007 LS 600h PE MY 2008
Double-sided Cooling

National Renewable Energy Laboratory Innovation for Our Energy Future
Outline
Background• Department of Energy’s Advanced Power Electronics and
Electric Machines (APEEM) activity.• Thermal management for power electronics cooling.
Problem• Quantify trade-off interaction between packaging configuration
and cooling technology.• Identify effective packaging and cooling combinations.
Approach
Results
5

National Renewable Energy Laboratory Innovation for Our Energy Future
Background
DOE’s Advanced Power Electronics and Electric Machines (APEEM)
6

National Renewable Energy Laboratory Innovation for Our Energy Future
Background
7
APEEMThermal Control Subsystem
integration, performance, reliability
APEEMTechnology
Development
Potential Thermal Management Technologies
Advanced Vehicle Systems
Syst
em Im
pact
s
Perf
orm
ance
Tar
gets
• Heat load• Heat flux• Thermal
resistance
• Cost • Weight• Volume• Efficiency• Robustness
• NREL Advanced Power Electronics Thermal Overview
Industry Collaboration
Research Community

National Renewable Energy Laboratory Innovation for Our Energy Future
Background
8
• NREL Advanced Power Electronics Thermal Focus Areas

National Renewable Energy Laboratory Innovation for Our Energy Future
Background
9
• Defines thermal requirements• Links thermal technologies to electric
traction drive systems

Problem
National Renewable Energy Laboratory Innovation for Our Energy Future10
How do developments in cooling impact APEEM technology selection?
How do developments in APEEM technologies influence cooling technology selection?
APEEMThermal Control Subsystem
integration, performance, requirements
APEEMTechnology
Development
Potential Thermal Management Technologies
Advanced Vehicle Systems
HEATER
δt
Stagnation Zone
Wall Jet Zone
d
Ud ,Tl
L: heater diameter
S
Twall

National Renewable Energy Laboratory Innovation for Our Energy Future
Approach
11
Hea
t Tra
nsfe
r & F
luid
Fl
ow C
hara
cter
izat
ion
1Cooling Technologies
Cooling Performance
Experimental Correlations, CFD Results, & Analytical
Heat Exchanger Characterization
Effectiveness – NTU Method
Fins & Jets
2
3
System Performance Trade-offs
10
100
1000
0.001 0.010 0.100 1.000 10.000
IGBT
Flu
x (W
/cm
2 )
Heat Exchanger Thermal Resistance, Rhx (K/W)
Heat Exchanger
B
Heat Exchanger
A
Quantify interaction between package configuration and cooling technology on total thermal performance.

National Renewable Energy Laboratory Innovation for Our Energy Future
Approach
12
Hea
t Tra
nsfe
r & F
luid
Fl
ow C
hara
cter
izat
ion
1Cooling Technologies
Cooling Performance
Experimental Correlations, CFD Results, & Analytical
Heat Exchanger Characterization
Effectiveness – NTU Method
Fins & Jets
2
3
System Performance Trade-offs
3
2
1
PE P
acka
ge T
herm
al
Cha
ract
eriz
atio
n
3D Package Configuration
3D Parametric FEA
Thermal Characterization
Heat Flux vs.
Heat Exchanger Thermal Resistance
10
100
1000
0.001 0.010 0.100 1.000 10.000
IGBT
Flu
x (W
/cm
2 )
Heat Exchanger Thermal Resistance, Rhx (K/W)
Package A
Package B
Quantify interaction between package configuration and cooling technology on total thermal performance.

National Renewable Energy Laboratory Innovation for Our Energy Future
Approach
13
Hea
t Tra
nsfe
r & F
luid
Fl
ow C
hara
cter
izat
ion
1Cooling Technologies
Cooling Performance
Experimental Correlations, CFD Results, & Analytical
Heat Exchanger Characterization
Effectiveness – NTU Method
Fins & Jets
2
3
System Performance Trade-offs
3
2
1
PE P
acka
ge T
herm
al
Cha
ract
eriz
atio
n
3D Package Configuration
3D Parametric FEA
Thermal Characterization
Heat Flux vs.
Heat Exchanger Thermal Resistance
10
100
1000
0.001 0.010 0.100 1.000 10.000
IGBT
Flu
x (W
/cm
2 )
Heat Exchanger Thermal Resistance, Rhx (K/W)
Package A
Package B
PerformanceImprovement
Required heat exchanger improvement for equivalent performance gain.
Quantify interaction between package configuration and cooling technology on total thermal performance.

National Renewable Energy Laboratory Innovation for Our Energy Future
Approach
14
Applied process to range of package configuration examples approximated from in-use commercial packages with different geometries.
Toyota Prius 2004Semikron SKM Toyota Camry
Semikron SKAI Lexus LS 600h
IGBT and diode pair

National Renewable Energy Laboratory Innovation for Our Energy Future
Approach
15
Baseline Package Configurations
Layer SK
M
SK
AI
Priu
s
Cam
ry
Ls 6
00H
IGBT/Diode (Si) x x x x
See
refe
renc
ed p
aper
bel
owSolder x x x xCu x x x** x**
Substrate AlN NA* x x xAl2O3 x NA NA NA
Cu x x x xSolder x NA x x
Heat Spreader Cu x NA NA NACu-Mo-Cu NA NA x x
TIM x x+ x xHeat Sink x x x x
Cooled Surface Footprint Area: [cm2] 15.34 3.90 16.86 7.68 15.00++
* Included additional model variation with AlN.+ Modeled with reduced thermal interface material thickness of 0.05 mm.** Assumed copper metallization layer.++ Listed area is for one side of the package, and it is the same on each side of the package.
Reference:K. Bennion and K. Kelly, “Rapid Modeling of Power Electronics Thermal Management Technologies,” IEEE Vehicle Power and Propulsion Conference, Sept. 7-11, 2009.

National Renewable Energy Laboratory Innovation for Our Energy Future
Results
16
* Sample single-sided and double-sided total thermal resistance. (Source: Y. Sakai, H. Ishiyama, and T. Kikuchi, “Power control unit for high power hybrid system,” SAE 2007 World Congress, Detroit, MI, April 16-19, 2007, SAE Paper 2007-01-0271.)
** Sample cooling performance. (Source: I. Mudawar, "Assessment of high-heat-flux thermal management schemes," IEEE Transactions on Components and Packaging Technologies, vol. 24, no. 2, pp. 122-141, June 2001.

National Renewable Energy Laboratory Innovation for Our Energy Future
Results
• All curves flatten as the heat exchanger performance improves (R’’h,h-a decreases).
• Package becomes thermal limitation.
• Difference in total thermal performance (R’’th,j-a) is affected by the footprint area available for cooling.
• Method for comparing alternative heat exchanger technologies and package configurations.
17
* Sample single-sided and double-sided total thermal resistance. (Source: Y. Sakai, H. Ishiyama, and T. Kikuchi, “Power control unit for high power hybrid system,” SAE 2007 World Congress, Detroit, MI, April 16-19, 2007, SAE Paper 2007-01-0271.)
** Sample cooling performance. (Source: I. Mudawar, "Assessment of high-heat-flux thermal management schemes," IEEE Transactions on Components and Packaging Technologies, vol. 24, no. 2, pp. 122-141, June 2001.

National Renewable Energy Laboratory Innovation for Our Energy Future
Results
18
100
1,000
10,000
1 10 100 1,000 10,000
R" th
, j-a
(m
m2
-K-/
W)
R"th, h-a (mm2 -K/W)
CamryPriusSKMSKAILexus (d)
• Weight the total thermal performance (Rth,j-a) by the total footprint area available for cooling.
• Curves collapse onto a single curve as the heat exchanger resistance increases.
• Removes effect of different package footprint areas.

National Renewable Energy Laboratory Innovation for Our Energy Future
Results
19
Baseline Direct Cooled Baseplate
(DCB)
Direct Cooled
DBC (DCD)
Package geometry, material, and cooling trade-offs

National Renewable Energy Laboratory Innovation for Our Energy Future
Results
20
BaselineDirect Cooled
DBC (DCD)
Baseline • At low Rth,h-a , the separation between
AL203 and AlN package resistance is more significant.
• Trade-off between material cost and heat exchanger performance cost.
• At about 100 mm2-K/W, switching to AlN would have a similar benefit to a 10X heat exchanger improvement.
Direct Cooled DBC (DCD)• At high Rth,h-a , the cooling area footprint
and heat exchanger resistance dominate thermal performance.
• As the cooling technology improves, the thermal characteristics of the package become more important.

National Renewable Energy Laboratory Innovation for Our Energy Future
Results
21
10
100
1,000
10,000
1 10 100 1,000 10,000
R" th
, j-a
(m
m2 -
K/W
)
R"th, h-a (mm2 -K/W)
Al2O3
AlN
open symbol: Baselinegray symbol: DCBblack symbol: DCD
• Weight the total thermal performance (Rth,j-a) by the total footprint area available for cooling.
• Curves collapse onto a single curve as the heat exchanger resistance increases.
• Removes effect of different package footprint areas.
• Highlights impact of package.

National Renewable Energy Laboratory Innovation for Our Energy Future
Results
22
1.00
1.25
1.50
1.75
2.00
1 10 100 1,000 10,000
R th,
j-a
(Al 2O
3) /
R th,
j-a
(AlN
)
R"th, h-a (mm2 -K/W)
BaselineDCBDCD

National Renewable Energy Laboratory Innovation for Our Energy Future
Results
23
1.00
1.25
1.50
1.75
2.00
1 10 100 1,000 10,000
R th,
j-a
(Al 2O
3) /
R th,
j-a
(AlN
)
R"th, h-a (mm2 -K/W)
BaselineDCBDCD
• The impact of a material with improved thermal conductivity depends on the package configuration and heat exchanger performance.
• The cost/benefit trade-off improves for more aggressive cooling and packages with fewer thermal bottlenecks.
• Relationship between package thermal performance and cooling technology can lead to a more expensive system than necessary if the relationship is not used properly.
National Renewable Energy Laboratory Innovation for Our Energy Future
Results
24
0.01
0.10
1.00
1 10 100 1,000 10,000
R th
, j-a
(K/
W)
R"th, h-a (mm2 -K/W)
Lexus
Camry (DCD)
0.203*
0.452*
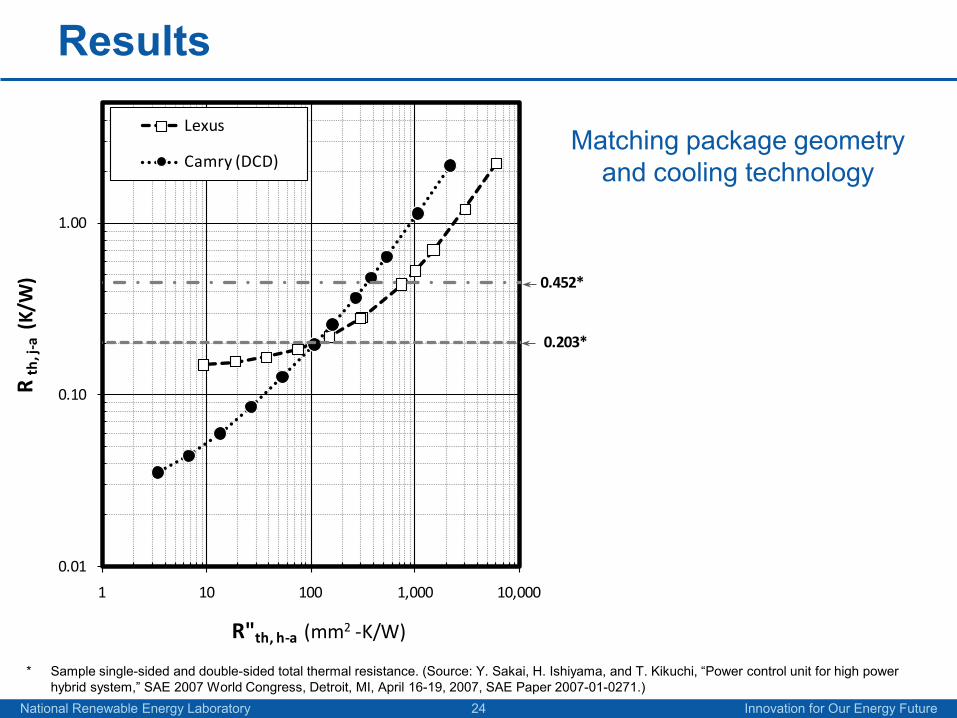
* Sample single-sided and double-sided total thermal resistance. (Source: Y. Sakai, H. Ishiyama, and T. Kikuchi, “Power control unit for high power hybrid system,” SAE 2007 World Congress, Detroit, MI, April 16-19, 2007, SAE Paper 2007-01-0271.)
Matching package geometry and cooling technology

National Renewable Energy Laboratory Innovation for Our Energy Future
Results
25
0.01
0.10
1.00
1 10 100 1,000 10,000
R th
, j-a
(K/
W)
R"th, h-a (mm2 -K/W)
Lexus
Camry (DCD)
0.203*
0.452*
* Sample single-sided and double-sided total thermal resistance. (Source: Y. Sakai, H. Ishiyama, and T. Kikuchi, “Power control unit for high power hybrid system,” SAE 2007 World Congress, Detroit, MI, April 16-19, 2007, SAE Paper 2007-01-0271.)
• To maximize the thermal performance, the package and heat exchanger technology should be investigated together.
• Identify appropriate cooling methods for a given package technology.
• Identify appropriate packaging options for a given cooling approach.
Matching package geometry and cooling technology

National Renewable Energy Laboratory Innovation for Our Energy Future
Conclusion
26
• Thermal management plays an important part in the cost of electric drives in terms of power electronics packaging.
• Cost-effective solutions require an appropriate balance between package and thermal management design.
• Appropriate cooling technology depends on• Package application
• Reliability
• Integration of capabilities for cooling, packaging(materials/geometry), and reliability prediction provide a system view of technology developments.


![[Translation] FOR IMMEDIATE RELEASE · Sumitomo Bakelite Co., Ltd. ... EME," a encapsulating material for semiconductor packages in the 1960s, released "SUMILITE CEL," a sheet for](https://img.dokumen.tips/doc/110x75/60ca7298119dad6d9e1f2c16/translation-for-immediate-sumitomo-bakelite-co-ltd-eme-a-encapsulating.jpg)