Embed Size (px)
Citation preview

drones
Article
Thermal Imaging of Beach-Nesting Bird Habitat withUnmanned Aerial Vehicles Considerations forReducing Disturbance and Enhanced Image Accuracy
Kerry L Mapes 1 Narcisa G Pricope 1 J Britton Baxley 1 Lauren E Schaale 23 andRaymond M Danner 2
1 Department of Earth and Ocean Sciences University of North Carolina Wilmington 601 S College RdWilmington NC 28403 USA jb8509uncwedu
2 Department of Biology and Marine Biology University of North Carolina Wilmington 601 S College RdWilmington NC 28403 USA laurenbhicorg (LES) dannerruncwedu (RMD)
3 Bald Head Island Conservancy PO Box 3109 700 Federal Rd Bald Head Island NC 28461 USA Correspondence mapeskuncwedu (KLM) pricopenuncwedu (NGP)
Tel +1-610-761-8213 (KLM) +1-910-962-3499 (NGP)
Received 26 March 2020 Accepted 22 April 2020 Published 24 April 2020
Abstract Knowledge of temperature variation within and across beach-nesting bird habitat and howsuch variation may affect the nesting success and survival of these species is currently lackingThis type of data is furthermore needed to refine predictions of population changes due to climatechange identify important breeding habitat and guide habitat restoration efforts Thermal imagerycollected with unmanned aerial vehicles (UAVs) provides a potential approach to fill current knowledgegaps and accomplish these goals Our research outlines a novel methodology for collecting andimplementing active thermal ground control points (GCPs) and assess the accuracy of the resultingimagery using an off-the-shelf commercial fixed-wing UAV that allows for the reconstruction ofthermal landscapes at high spatial temporal and radiometric resolutions Additionally we observedand documented the behavioral responses of beach-nesting birds to UAV flights and modificationsmade to flight plans or the physical appearance of the UAV to minimize disturbance We found strongevidence that flying on cloudless days and using sky-blue camouflage greatly reduced disturbanceto nesting birds The incorporation of the novel active thermal GCPs into the processing workflowincreased image spatial accuracy an average of 12 m horizontally (mean root mean square error ofcheckpoints in imagery with and without GCPs was 059 m and 2375 m respectively) The finalthermal indices generated had a ground sampling distance of 2510 cm and a thermal accuracy of lessthan 1 C This practical approach to collecting highly accurate thermal data for beach-nesting birdhabitat while avoiding disturbance is a crucial step towards the continued monitoring and modelingof beach-nesting birds and their habitat
Keywords thermal imagery thermal GCPs unmanned aerial vehicles UAVs habitat imageryremote sensing wildlife colonial nesting waterbirds anthropogenic disturbance
1 Introduction
Recently the use of unmanned aerial vehicles (UAVs) has increased across many scientific disciplinesand rapidly so among the fields of environmental biology conservation and ecology The proliferation ofthis technology has been driven in part by the relatively low cost of the systems small size ability tocarry various imaging and non-imaging payloads and ability to monitor environments or phenomenain a timely and responsive manner [1] The ability of small UAVs to collect imagery and data at highspatial and temporal resolutions has led to the popularization of this tool for a multitude of environmental
Drones 2020 4 12 doi103390drones4020012 wwwmdpicomjournaldrones
Drones 2020 4 12 2 of 18
applications including land cover and vegetation mapping [2] soil erosion [3] invasive species detectionand monitoring [4] and wildlife research and management [5]
Within the context of wildlife research UAVs have proven to be efficient tools for evaluating wildlifebehavior [67] abundance [8ndash15] and habitat [1617] Habitat evaluation may be done using visiblespectrum cameras to classify habitat by land cover type [16] or through analysis of light detection andranging (LiDAR) data to examine not only spatial extent of habitat type but also information on verticalcomponents of the habitat such as tree height [17] One potential benefit of using UAVs in wildlifestudies is the reduction in disturbances to wildlife caused by the presence of human observers [18ndash20]or other traditional survey methods such as manned aircraft [21] However UAVs themselves havebeen shown to be a source of disturbance to many types of animals thus the number of scientificstudies that specifically evaluate the effects of UAVs on both terrestrial [22ndash24] and aquatic [52526]target species has increased in recent years The majority of studies that evaluate the effects of UAVson wildlife involve observing behavioral responses from video footage obtained by the UAV [2627]video obtained by a standard camera [132328] direct observations in the wild [13142329ndash31] or bymeasuring nesting success [32] A few studies have also measured physiological responses to UAVactivity such as changes in heart rate [2733] and considered the aural capacity of the target species inevaluating the response to the UAV [2433] These studies have considered responses to specific featuresor characteristics of the flight plan or of the UAV itself including launch distance [23] distance ofthe UAV from target species while in flight [252932] flight angle or movement [2631] speed [31]flight altitude [182325262830] exposure frequency [3233] color [31] and noise level emitted fromthe UAV [1833]
Research that can lead to specific recommendations for using UAVs near target species isfundamental to ensuring continued and responsible use of UAVs in wildlife studies This is especiallytrue for species of conservation concern such as many species of waterbirds that nest in colonies [2034]Short-term or repeated anthropogenic disturbances are known to cause negative impacts on colonialnesting waterbirds Anthropogenic disturbance can cause these birds to flush (ie leave theirnests) and increase time spent away from the nest which can lead to nest predation overheatingdecreases in parental care or in more extreme cases complete abandonment of eggs young or nestinghabitat [35ndash39] Therefore developing methods to study nesting birds and their habitat withoutcausing disturbance remains a top priority for waterbird biologists and conservation managers
A rapidly expanding area of research in avian biology seeks to understand how high temperaturesaffect survival and reproductive success in order to predict population persistence Recent heatwaveshave caused widespread mortality in birds [40] and heat-related mortality is predicted to locallyextinguish bird populations in the southwestern United States [41] and southern Africa [42] in responseto continued climate change Nearly all of North Americarsquos bird species are expected to experienceincreased extreme heat events in the future which contributes to predictions that two-thirds of NorthAmerican birds are at increased risk of extinction as a result of climate change [43] Colonial waterbirdsthat nest on beaches may be particularly susceptible to the effects of high temperatures many speciesnest directly on the beach where they are fully exposed to full sun and high temperatures [3644]We still know little however about how temperature varies within and across bird habitats at finespatial scales and how such variation might influence birds this information could allow us to refinepredictions of population changes in the face of climate change identify valuable breeding locationsand plan habitat restoration Thermal imagery from a UAV provides a potential approach to describetemperature variation across the landscape and accomplish these important goals
In thermal remote sensing radiation emitted from surface objects in the region of 3 to 35 microm onthe electromagnetic spectrum is measured to estimate radiant (or actual) temperature The amountof energy radiated is dependent on the objectrsquos emissivity and kinetic temperature Emissivity is theemitting ability of a real material compared to that of a black body (a theoretical object that absorbsand then emits all incident energy at all wavelengths) Kinetic temperature is the surface temperatureof an object and is a measure of the amount of heat energy contained in it Measured temperatures can
Drones 2020 4 12 3 of 18
be influenced by environmental factors such as air temperature or humidity data is also influenced bythe time of day it is collected due to differential thermal heating [45] Because the spatial resolution ofthermal data is often coarser than other imagery types (visible spectrum or multispectral) the abilityto register it to other data can be a challenge due to the unacceptable transformations that may resultif reliable control points cannot be identified [45] though this approach is commonly employedTherefore alternative approaches of image registration and co-registration must be developed
With UAV imagery specifically locational accuracy is extremely important when imaging smallfeatures to ensure that the feature is placed within the correct pixel Alternative processing workflowsexist such as that described by Wakeford et al where both visible spectrum (RGB) and thermalimagery were collected and processed using common natural markers as ground control points(GCPs) before overlaying the thermal texture on the RGB point cloud [46] However in many casesnatural markers may not have sufficient contrast to be apparent during processing or in homogenouslandscapes may not be present to begin with Additionally the use of commercially available GCPsreferenced to very-high-accuracy spatial coordinates is common for visible RGB and multispectralimagery but much less so for thermal imagery mostly due to the fact that thermal cameras cannot ldquoseerdquostandard GCP targets as can other sensor types Within the field of thermography alternative ldquopassiverdquoGCPs or GCPs made from materials with different emissivity than the surrounding environmenthave been used including aluminum targets [47ndash51] as well as gray tarp [52] black polypropelyne [48]and wood panels painted gray [53] Less commonly utilized in thermal data collection with UAVsare ldquoactiverdquo GCPs or GCPs that are warmed or cooled to a temperature that is different than thebackground temperature
When conducting UAV surveys where wildlife is present tradeoffs between the desired finalproduct and disturbance of the target species are made when lower altitude UAV flights are requiredto achieve a specific ground sample size and that altitude is likely to cause a disturbance This isespecially true when the features being imaged are very small such as the nests of some species ofshore-nesting birds because the imagery must be collected at an altitude that can resolve the featuresof interest in final products [54] In other words the pixel size of the final product must be able tocapture the target feature within a certain minimum size otherwise the resulting pixel will be a blendof the target feature and any other features within that pixel [54]
In this study we conduct a series of flights above a beach-nesting bird colony using an off-the-shelfcommercial fixed-wing UAV in order to collect high resolution location and thermal landscape data insupport of habitat monitoring and modeling The research focuses on the least tern (Sternula antillarum)which is found in North Central and South America is listed as a species of conservation concernin several states in the USA and is listed as federally endangered in the interior USA and CaliforniaThe research discussed here was the initial phase within a project that will assess the influence ofhabitat surface temperatures on bird nesting location and success The specific objectives of thework reported here were to (1) observe and document the behavior of beach-nesting birds to UAVflights and modifications made to flight plans or physical modifications to the UAV in order tominimize disturbance and (2) assess the quality of the derived imagery products by assessing thespatial accuracy of both RGB and thermal imagery and the temperature accuracy of thermal imageryboth important prerequisites for bird habitat mapping and modeling Specifically given the extremelysmall spatial footprint of individual least tern nests (7 to 10 cm) it was important to collect both highlydetailed and highly accurate nest locations as well as thermal imagery in order to effectively match thefine-grain levels of both datasets while ensuring habitat and population disturbance minimizationAs such we structure this paper into two sections one that details the necessary strategies to minimizepopulation disturbance and a second that details the imagery accuracy considerations necessary toobtain highly accurate thermal data that matches the spatial footprint of nest locations
Drones 2020 4 12 4 of 18
2 Materials and Methods
21 Study Area
Lea-Hutaff Island (LHI) is a 228 km2 uninhabited barrier-island marsh complex of the coast ofNorth Carolina USA (Figure 1) LHI is separated from Topsail Island to the north by New TopsailInlet from Figure Eight Island to the South by Rich Inlet and from the mainland by Topsail SoundOnce two islands the landmasses were joined in 1998 when a powerful storm filled in the channel inbetween them The geomorphology of the island is characterized by dunes swales and overwash fansThe vegetation is comprised of grassy flats high and low marsh grass communities and eelgrass bedswith very little vegetation of substantial height The climate is Koppen Climate Class Cfa which is awarm temperate climate characterized by full humidity and hot summers [55] The island is a prominentnesting spot for several species of conservation concern including loggerhead turtles (Caretta caretta)least terns american oystercatchers (Haematopus palliates) piping plovers (Charadrius melodus) andclapper rails (Rallus crepitans) Due to the protected status of some of the bird species using thisisland as nesting habitat Audubon North Carolina manages land encompassing these critical nestinghabitats in collaboration with landowners We secured permissions from local managing stakeholdersto undertake this collaborative research project
Drones 2020 4 x FOR PEER REVIEW 4 of 18
Lea-Hutaff Island (LHI) is a 228 km2 uninhabited barrier-island marsh complex of the coast of North Carolina USA (Figure 1) LHI is separated from Topsail Island to the north by New Topsail Inlet from Figure Eight Island to the South by Rich Inlet and from the mainland by Topsail Sound Once two islands the landmasses were joined in 1998 when a powerful storm filled in the channel in between them The geomorphology of the island is characterized by dunes swales and overwash fans The vegetation is comprised of grassy flats high and low marsh grass communities and eelgrass beds with very little vegetation of substantial height The climate is Koppen Climate Class Cfa which is a warm temperate climate characterized by full humidity and hot summers [55] The island is a prominent nesting spot for several species of conservation concern including loggerhead turtles (Caretta caretta) least terns american oystercatchers (Haematopus palliates) piping plovers (Charadrius melodus) and clapper rails (Rallus crepitans) Due to the protected status of some of the bird species using this island as nesting habitat Audubon North Carolina manages land encompassing these critical nesting habitats in collaboration with landowners We secured permissions from local managing stakeholders to undertake this collaborative research project
Figure 1 Lea-Hutaff Island North Carolina (A) Study area showing colony extent and nest locations (B) Locator map (C) Close up view of bird nest points in SODA imagery The imagery is viewed at near-pixel resolution and is meant to show that the bird nests are not visible in the RGB imagery (D) Photograph of least tern nest with eggs nests are in an approximately 2-cm deep depression about 7 to 10 cm across and are made directly on the sand Sand is the main substrate but occasionally shells may be present either being there before construction or being placed by the bird [56]
22 Mission Planning Considerations
We conducted a series of five test flights using a senseFly eBee plus (hereafter referred to as eBee) fixed-wing drone to assess the impacts of the UAV on disturbance of least tern and other species of colonial beach-nesting birds as well as to thermally image the nesting habitat to ultimately understand the influence of beach thermal landscapes and other environmental variables on nesting location and success (Figure 2 Table 1) The eBee features an interchangeable sensor housing and can
Figure 1 Lea-Hutaff Island North Carolina (A) Study area showing colony extent and nest locations(B) Locator map (C) Close up view of bird nest points in SODA imagery The imagery is viewedat near-pixel resolution and is meant to show that the bird nests are not visible in the RGB imagery(D) Photograph of least tern nest with eggs nests are in an approximately 2-cm deep depression about7 to 10 cm across and are made directly on the sand Sand is the main substrate but occasionally shellsmay be present either being there before construction or being placed by the bird [56]
Drones 2020 4 12 5 of 18
22 Mission Planning Considerations
We conducted a series of five test flights using a senseFly eBee plus (hereafter referred to as eBee)fixed-wing drone to assess the impacts of the UAV on disturbance of least tern and other species ofcolonial beach-nesting birds as well as to thermally image the nesting habitat to ultimately understandthe influence of beach thermal landscapes and other environmental variables on nesting location andsuccess (Figure 2 Table 1) The eBee features an interchangeable sensor housing and can accommodatea variety of sensor types including visible wavelengths (RGB) multispectral and thermal For thisstudy both the senseFly thermoMap thermal sensor and the SODA RGB sensor were utilizedThe thermoMap features a 03 megapixel sensor recording infrared wavelengths from 7500ndash13500 nmwith a sensor resolution of 01 C The sensor performs a radiometric calibration automatically in-flightand collects images in timelapse mode at a rate of 75 images per second [48] The SODA camerahas a 20 megapixel sensor global shutter and collects RGB imagery simultaneously on a singleCMOS (complementary metal-oxide-semiconductor sensor) [48] We used the senseFly eMotion flightplanning and mission implementation software for all phases of planning and data collection (v 350senseFly 2019) For all flights we selected a launchlanding location at least 350 m northeast outside ofthe nesting area (Figure 2) Flight blocks were designed so that the nesting area was imaged in as fewpasses as possible to minimize potential chances of causing disturbances Additionally we designedflight blocks so that all UAV in-flight turns were taken outside the study area to minimize changes inmovement that would be observable to the colony The mission was designed so that the first waypointwas outside of the boundaries of the colony and so that upon reaching the first waypoint the UAVwould circle for at least 30 to 60 s so that the UAV was observable to the birds before entering theairspace over the colony
Because the eBee is shaped similarly to a predatory bird it might be mistaken as such when it isin flight and this fact was immediately evident during our very first flights which led to widespreadcolony flushing As such we determined that modifications to the UAV had to be made in order forthe project to be continued and we then assessed the response of the birds to the unmodified UAVas well as multiple physical modifications to its color including the use of dazzle camouflage andpainting the underside of the UAV (Figure 3) Dazzle camouflage was created using a combination ofblue painterrsquos tape and light blue cardstock paper to break up the solid black color The solid sky-bluecamouflage was created by taping paper to the underside of the eBee and painting it with light blue paintBecause no modifications were made to the weight balance sensors or engineering characteristics ofthe UAV these cosmetic modifications do not violate Federal Aviation Administration Part 107 Rulesand Regulations [57] However laws governing UAV operations may vary by country thus researchersshould familiarize themselves with pertinent laws to ensure legal compliance Additionally violation ofUAV manufacturersrsquo warranties or insurance policies should be considered in conducing these typesof experiments We did not assess impacts of UAV noise on the colony due to lack of data relating tonoise levels of the eBee or aural capacities of the bird species within the colony
Table 1 Flight mission data from Flights 1 through 5 using senseFly eBee plus with thermoMap orSODA sensors See Figure 2 for visualization of flight plans
Flight Sensor Altitude(m AED)
Estimated GSD(cmpx)
LongitudinalOverlap ()
LatitudinalOverlap ()
EstimatedDuration (mmss)
1 thermoMap 85 160 90 80 13462 thermoMap 116 220 90 80 10483 thermoMap 116 160 90 80 10483 SODA 119 280 60 70 08124 thermoMap 116 160 90 80 10484 SODA 119 280 60 70 08125 thermoMap 116 160 90 80 1036
Drones 2020 4 12 6 of 18
Drones 2020 4 x FOR PEER REVIEW 5 of 18
accommodate a variety of sensor types including visible wavelengths (RGB) multispectral and thermal For this study both the senseFly thermoMap thermal sensor and the SODA RGB sensor were utilized The thermoMap features a 03 megapixel sensor recording infrared wavelengths from 7500ndash13500 nm with a sensor resolution of 01 degC The sensor performs a radiometric calibration automatically in-flight and collects images in timelapse mode at a rate of 75 images per second [48] The SODA camera has a 20 megapixel sensor global shutter and collects RGB imagery simultaneously on a single CMOS (complementary metal-oxide-semiconductor sensor) [48] We used the senseFly eMotion flight planning and mission implementation software for all phases of planning and data collection (v 350 senseFly 2019) For all flights we selected a launchlanding location at least 350 m northeast outside of the nesting area (Figure 2) Flight blocks were designed so that the nesting area was imaged in as few passes as possible to minimize potential chances of causing disturbances Additionally we designed flight blocks so that all UAV in-flight turns were taken outside the study area to minimize changes in movement that would be observable to the colony The mission was designed so that the first waypoint was outside of the boundaries of the colony and so that upon reaching the first waypoint the UAV would circle for at least 30 to 60 seconds so that the UAV was observable to the birds before entering the airspace over the colony
Figure 2 Flight missions using the senseFly eBee plus equipped with thermoMap or SODA sensors on Lea-Hutaff Island See Table 1 for additional mission parameter information SODA flights use
Figure 2 Flight missions using the senseFly eBee plus equipped with thermoMap or SODA sensors onLea-Hutaff Island See Table 1 for additional mission parameter information SODA flights use thesame flight block Thermal flights 2ndash4 used the same flight block and thermal flight 3 is not shown inthe figure
Drones 2020 4 x FOR PEER REVIEW 6 of 18
the same flight block Thermal flights 2ndash4 used the same flight block and thermal flight 3 is not shown in the figure
Table 1 Flight mission data from Flights 1 through 5 using senseFly eBee plus with thermoMap or SODA sensors See Figure 2 for visualization of flight plans
Flight Sensor Altitude (m AED)
Estimated GSD
(cmpx)
Longitudinal Overlap ()
Latitudinal overlap ()
Estimated Duration (mmss)
1 thermoMap 85 160 90 80 1346 2 thermoMap 116 220 90 80 1048 3 thermoMap 116 160 90 80 1048 3 SODA 119 280 60 70 0812 4 thermoMap 116 160 90 80 1048 4 SODA 119 280 60 70 0812 5 thermoMap 116 160 90 80 1036
Because the eBee is shaped similarly to a predatory bird it might be mistaken as such when it is in flight and this fact was immediately evident during our very first flights which led to widespread colony flushing As such we determined that modifications to the UAV had to be made in order for the project to be continued and we then assessed the response of the birds to the unmodified UAV as well as multiple physical modifications to its color including the use of dazzle camouflage and painting the underside of the UAV (Figure 3) Dazzle camouflage was created using a combination of blue painterrsquos tape and light blue cardstock paper to break up the solid black color The solid sky-blue camouflage was created by taping paper to the underside of the eBee and painting it with light blue paint Because no modifications were made to the weight balance sensors or engineering characteristics of the UAV these cosmetic modifications do not violate Federal Aviation Administration Part 107 Rules and Regulations [57] However laws governing UAV operations may vary by country thus researchers should familiarize themselves with pertinent laws to ensure legal compliance Additionally violation of UAV manufacturersrsquo warranties or insurance policies should be considered in conducing these types of experiments We did not assess impacts of UAV noise on the colony due to lack of data relating to noise levels of the eBee or aural capacities of the bird species within the colony
Figure 3 senseFly eBee Plus fixed-wing drone (A) Flight 1 - No modifications (B) Flight 2 ndash dazzle camouflage (C) Flights 3 through 5 ndash solid sky-blue camouflage
Figure 3 senseFly eBee Plus fixed-wing drone (A) Flight 1mdashNo modifications (B) Flight 2mdashdazzlecamouflage (C) Flights 3 through 5mdashsolid sky-blue camouflage
Drones 2020 4 12 7 of 18
23 Imagery Collection and Accuracy Assessment
Accurate geolocation of imagery was of the utmost importance for this project because least ternnests are only about 7 to 10 cm in diameter (Figure 1D) while the expected ground sample distance(GSD) of the thermal imagery ranged from 16 to 22 cmpx based on flight height (Table 1) If the thermalimagery were not geolocated with high accuracy this could mean that a nest point could be placed inan incorrect pixel (therefore matching nest points with incorrect thermal ranges) It was necessary toalign the thermal imagery to ground control points (GCPs) collected with RTK and implement theGCPs in the imagery processing workflow for multiple reasons including (1) the thermoMap sensoris incompatible with both RTK and PPK (post-processing kinematics) and (2) the thermoMap does notsimultaneously collect RGB imagery by which to georeference the thermal imagery as other commercialthermal sensors do (eg FLIR) However it would also be possible to georeference thermal imagery byfirst conducting an RGB flight using RTK or PPK then performing a thermal flight using the sameeMotion flight plan After processing the RGB flight and thermal flight the thermal orthoimage couldbe co-registered to the RGB orthoimage We chose not to utilize this methodology as we could not becertain that two flights could be conducted during each survey if disturbance of the bird populationswere observed during a flight in addition to the lack of natural GCPs available in the study area
Nest points points for fence posts marking the boundary of the colony and thermal GCP locationswere collected using a survey grade RTK system that has a horizontal accuracy of +minus 1 cm andvertical accuracy of +minus 2 cm The equipment includes a Trimble R8 GNSS receiver TSC2 surveycontroller and jet pack MiFi modem Because there are no industry standard thermal GCPs (such asthe colored tiles or targets used for RGB imagery) that exist and are able to be detected by thermalsensors and because other materials such as aluminum may not be distinguishable enough in thisenvironment we propose one of the first known use cases of an active thermal GCP in a thermal UAVcollection and processing workflow As the thermal sensor cannot ldquoseerdquo visible wavelengths as anRGB or multispectral sensor can we created an active thermal GCP by placing a bag of ice on top ofstandard GCP tiles (Figure 4) The temperature contrast between the hot sand and cold ice is easilydistinguishable in thermal imagery and serves as a cost-effective and easy-to-implement solution toaccurately geolocate thermal UAV imagery For each flight we collected active thermal GCPs at threelocations along the beach side of the study area The placement of GCPs was limited to the beach sideoutside the extent of the colony due to restrictions on entering the colony or other sensitive areas suchas the marsh habitats or sand dunes (Figure 1)
During Flight 4 we collected thermal imagery with the senseFly thermoMap to assess theeffect of using GCPs vs not using GCPs in the processing workflow on accuracy of point locationsAdditional GCPs and checkpoints were subsequently incorporated into the thermal processingworkflow using point data collected at the fence posts marking the boundaries of the colony to achievehigher spatial accuracy (the point was collected at the base of the post) The fence posts are highlyvisible in the RGB imagery and much less so in the thermal imagery however the fence post locationswere used to locate groupings of pixels that were of sufficient uniqueness and clarity to be identifiablein the images within the Pix4Dmapper ray cloud GCP editor We first completed initial processingusing only the active thermal GCPs to increase the accuracy in automatic detection of the additionalGCPs then marked the additional passive GCPs Additionally we collected RGB imagery using thesenseFly SODA camera to create an orthomosaic using both the on-board RTK for the eBee andthe same number (and locations) of GCPs and check points used in the thermal imagery processingBoth RGB and thermal imagery were processed using Pix4Dmapper (V 4125 Pix4D SA 2019)referred to hereafter as Pix4D All post-processing spatial and temperature accuracy assessments wereperformed in ArcMap (V 107 ESRI 2011)
Drones 2020 4 12 8 of 18
Drones 2020 4 x FOR PEER REVIEW 8 of 18
remained stable 2) target and ambient temperatures were not extreme 3) the emissivities of imaged objects were close to 10 and 4) post-processingphotogrammetry was applied correctly (Daniel Murphy senseFly personal communication 7 June 2018) We tested the thermal accuracy of the thermoMap sensor under the specific conditions which existed during Flight 4 by comparing the processed thermal imagery to ground reference temperature measurements collected with an ennoLogic eT650D hand-held infrared thermometer alongside an RTK point This dual laser thermometer measures temperatures from minus50 degC to 650 degC with 01 degC temperature resolution Temperature points were collected 2 m to the west of the thermal GCP We did not directly measure the GCP target given that the ice represents an extreme difference from ambient temperatures For each temperature point we collected three measurements which were subsequently averaged We compared this ground reference average to the average temperature in the thermoMap data within a 1 m buffer around the RTK point where the temperature was collected
Figure 4 (A) Active thermal GCP created by temperature contrast of ice against the beach backdrop as seen in ArcMap indicated by the cooler temperature blob (blue) The actual temperature of the active thermal GCP is inaccurate due to the drastic difference from ambient temperature under which the thermoMap was calibrated (B) Standard RGB GCP tile as seen in ArcMap
A total of three initial test flights were conducted before a satisfactory response from least tern and other beach-nesting bird species was observed though observations were continued until Flight 5 Within the context of this study we define a satisfactory response as one that includes minimal to no flushing All flights and observations were conducted with permission of the North Carolina Wildlife Resources Commission (permit 18-ES00497) Audubon North Carolina and UNCW IACUC (permit A1617-010) Field studies were conducted under the supervision of an avian biologist from Audubon North Carolina who assisted with behavioral monitoring and flight planning to ensure minimization of disturbance to the birds We describe specifics of weather conditions flight missions and UAV modification in the Results section alongside the observed responses of nesting shorebirds as we believe this information is best interpreted when considered simultaneously
2 4 Disturbance Measurements
We monitored disturbance to beach-nesting birds using continuous behavioral observations for Flights 1 through 5 Specifically 2ndash4 researchers positioned themselves around the perimeter of the
Figure 4 (A) Active thermal GCP created by temperature contrast of ice against the beach backdrop asseen in ArcMap indicated by the cooler temperature blob (blue) The actual temperature of the activethermal GCP is inaccurate due to the drastic difference from ambient temperature under which thethermoMap was calibrated (B) Standard RGB GCP tile as seen in ArcMap
There is no standard thermal accuracy that exists for the thermoMap sensor by which to assess theaccuracy of the temperatures obtained from the imagery in comparison to the ground truth temperatureBecause the sensor is used in dynamic environmental and imaging conditions it is not possible toaccurately account for the variety of conditions under which the sensor is used However it would notbe uncommon to expect temperature accuracies of +minus 2 C if (1) camera temperatures remained stable(2) target and ambient temperatures were not extreme (3) the emissivities of imaged objects wereclose to 10 and (4) post-processingphotogrammetry was applied correctly (Daniel Murphy senseFlypersonal communication 7 June 2018) We tested the thermal accuracy of the thermoMap sensor underthe specific conditions which existed during Flight 4 by comparing the processed thermal imagery toground reference temperature measurements collected with an ennoLogic eT650D hand-held infraredthermometer alongside an RTK point This dual laser thermometer measures temperatures fromminus50 C to 650 C with 01 C temperature resolution Temperature points were collected 2 m to thewest of the thermal GCP We did not directly measure the GCP target given that the ice representsan extreme difference from ambient temperatures For each temperature point we collected threemeasurements which were subsequently averaged We compared this ground reference average tothe average temperature in the thermoMap data within a 1 m buffer around the RTK point where thetemperature was collected
A total of three initial test flights were conducted before a satisfactory response from least ternand other beach-nesting bird species was observed though observations were continued until Flight5 Within the context of this study we define a satisfactory response as one that includes minimalto no flushing All flights and observations were conducted with permission of the North CarolinaWildlife Resources Commission (permit 18-ES00497) Audubon North Carolina and UNCW IACUC(permit A1617-010) Field studies were conducted under the supervision of an avian biologist fromAudubon North Carolina who assisted with behavioral monitoring and flight planning to ensureminimization of disturbance to the birds We describe specifics of weather conditions flight missionsand UAV modification in the Results section alongside the observed responses of nesting shorebirds aswe believe this information is best interpreted when considered simultaneously
Drones 2020 4 12 9 of 18
24 Disturbance Measurements
We monitored disturbance to beach-nesting birds using continuous behavioral observations forFlights 1 through 5 Specifically 2ndash4 researchers positioned themselves around the perimeter of thenesting area before the UAV was launched The observers continuously recorded the activities ofbirds throughout the flights including launch ascent transects descent and landing The observersrecorded the approximate number of each bird species in the nesting area that responded to the UAVObservers remained in contact with two-way radios If more than 10 of the birds flushed the UAVwas returned to the launch location and flight mission parameters reassessed before the next launchFollowing a flight with observed disturbance the UAV was not launched again on the same day
25 RGB and Thermal Imagery Processing
RGB imagery was processed to generate a visual reference for the study area and the location ofnests within the colony RGB imagery from Flights 3 and 4 were processed using a modified Pix4D3D Maps template with the inclusion of three commercial GCP targets (Figure 4) seven additionalGCPs at fence post locations and 40 checkpoints at fence post locations in the processing workflowto increase imagery location accuracy and accurately reference the spatial location of bird nestsThis software utilizes a structure-from-motion workflow to reconstruct three-dimensional surfacesfrom still images [58] We used the default keypoint image scale for initial feature extraction andmatching to full image scale to ensure there was no reduction in final orthomosaic resolution We alsoused the alternative calibration method for imagery calibration based on camera parameters which isoptimized for nadir images with accurate geolocation and low texture content such as a sandy beachThe default image scale for point cloud densification is half (12) image size which was also notmodified The primary output created from processing the RGB imagery was the orthomosaic which isobtained from the digital surface model (DSM) and corrected for perspective with the RGB value of anindividual pixel being calculated as an average of the pixels in the corresponding original images [59]
Thermal imagery was processed using a modified Pix4D thermoMap template with the inclusionof GCPs within the processing workflow to increase location accuracy of imagery This templateuses full image scale and alternative calibration for computing image matches and generating thesparse point cloud and full keypoints image scale for densifying the point cloud We have chosen toutilize a large number of GCPs in the workflow to ensure high geolocation accuracy of the imageryas previously discussed We used a total of three active thermal GCPs seven additional passiveGCPs and 40 checkpoints The initial processing was completed by first using the active thermalGCPs to increase overall imagery alignment and autodetection of additional passive GCPs by Pix4DThe primary output from the thermal processing workflow is the thermal index (essentially anorthoimage where each pixel is characterized by the temperature value for that pixel) The thermalindex is computed from what Pix4D refers to as the reflectance map which for thermal data is actuallyan orthoimage of the raw values for thermal emittance We computed the thermal index in C
3 Results and Discussion
31 Observed Bird Colony Responses to UAV Flights
311 Flight 1
The first test flight was conducted in the morning on 8 May 2018 at 1000 h when there was 100cloud cover in the sky (Table 2) During this first flight no physical modifications were made to theUAV (ie the coloration was the original black color of the eBee Figure 3A) The flight occurred at aheight of 85 m above ground level (AGL) using the thermoMap sensor (Table 1) Flight transects wereoriented roughly east to west Our launch location was situated approximately 350 m northeast of thecolony extent (Figure 2) The eBee was hand-launched facing away from the colony ensuring its initialascent was not towards the colony During Flight 1 the UAV made several eastndashwest transects as it
Drones 2020 4 12 10 of 18
approached the tern colony from the launch location (Figure 2) This was due in part to the strongcrosswinds which challenged the UAVrsquos ability to stay on track causing it to make many unplannedpasses in order to hit the predetermined waypoints
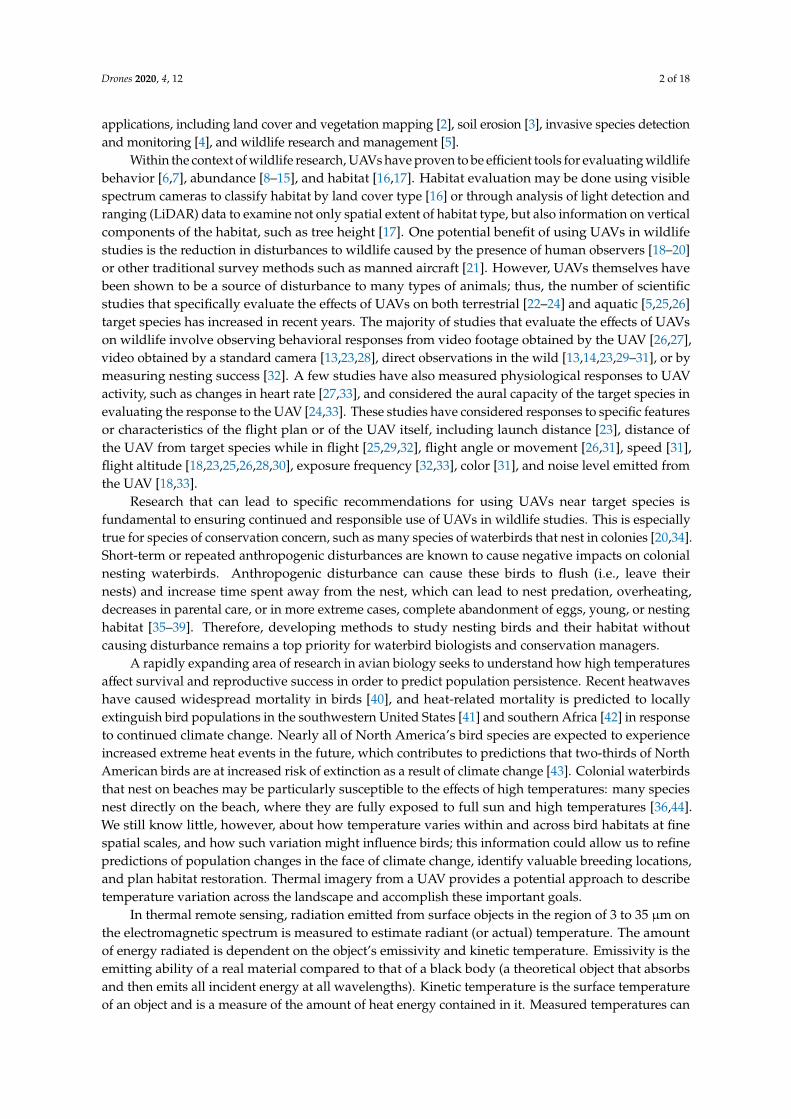
Table 2 Observed responses of nesting shorebirds to UAV flights
FlightNumber Date Camouflage Cloud
Cover () Observed Response Impact
1 8 May 2018 None (black) 100Substantial flushing
birds flew out in a semi-circleover water and returned
Considerabledisturbance
2 22 May 2018 Dazzle 50Substantial flushing
birds flew out in a semi-circleover water and returned
Considerabledisturbance
3 6 June 2018 Solid sky blue 0 No flushing No disturbance
4 2 July 2018 Solid sky blue 0 No flushing No disturbance
5 11 July 2018 Solid sky blue 0 No flushing No disturbance
Birds showed no responses during approach or while the UAV flew over the northern edge ofthe colony (Figure 2) We noted that the initial passes farther from the colony provided additionaltime for the terns to assess the UAV as a potential non-threat When the UAV flew directly overthe colony individuals it passed directly above flushed These included least terns black skimmersand common terns Black skimmers appeared to flush for the longest period and least terns for theshortest Some incubating individuals (it was difficult to estimate a percentage) remained on nestsand others flushed It is likely that most of the non-incubating birds flushed As the UAV approachedthe interior of the colony birds in that area were disturbed Flights of interior birds appeared to disturbother birds causing colony-wide disturbance (ie flights) We hypothesize that the birds in the interiorof the colony were unable to see the UAV approach because of the low dunes surrounding that locationand that this prevented the interior birds from assessing the UAV as a non-threat before it flew overthem The apparent response to UAV overflights tended to be stronger during earlier passes whentypically 100 or more birds would flush up to half of which would fly beyond the colony boundaries(Figure 1) Later passes of the UAV typically caused flushing in only a few dozen individuals with veryfew to no birds flying beyond the colony boundaries Disturbance consisted of birds flying up fromthe ground circling over the nesting site and then landing Bird flights typically lasted less than 10 sSome birds flew out beyond the colony boundaries but returned in under 10 s Birds flushed whenthe UAV flew overhead and then settled soon after the UAV passed by The non-colonial Americanoystercatcher in the middle area of the colony stood in response to at least one over-pass but did not fly
312 Flight 2
Flight 2 took place at midday on 22 May 2018 at approximately 1300 h which was a partiallysunny day with scattered cloud cover (Table 2) Modifications were made to the coloration of the UAVusing blue painterrsquos tape and sky-blue cardstock to create irregular lines and coloration across theunderside of the UAV (Figure 2B) This ldquodazzle camouflagerdquo pattern served to break up the shape andoutline of the UAV so that it would be less likely to resemble a predatory bird No modification wasmade to the yellow fins on the underside of the eBee to ensure that components of the UAV remainedvisible to observers We conducted Flight 2 at 116 m AGL using the thermoMap sensor (Table 1)we hypothesized that the increase in flight altitude from Flight 1 would help minimize disturbance tothe birds Transects were oriented on a northndashsouth axis or approximately 90 from transect duringFlight 2 (Figure 2) This was done so that fewer passes would be made by the UAV over the colony andtherefore disturb the center of the colony less than during Flight 1 The UAV flight path began on thewestern edge of the colony and moved in an overall eastward direction
Drones 2020 4 12 11 of 18
It was immediately observed after launch that the UAV stood out against the white cloudsDespite the modifications made to color (dazzle camouflage Figure 3B) it appeared black as in Flight 1It is likely that because both flights took place on overcast days the contrast between the UAV andsky was higher and made the UAV more visible to the birds The modification made to the flightpath caused the UAV to ascend directly from the launch location and fly over the northern edge ofthe colony before starting the north-south transects (Figure 2) When the UAV flew over the colonymost of the birds flushed immediately They settled relatively quickly as the UAV turned to fly backnorth This initiated a regular sequence where birds flushed on southbound passes and settled as theUAV finished the southbound transect and headed north Just as the birds settled the UAV returnedsouth causing them to flush once again On the last few transects where the UAV was over the easternedge of the colony many birds did not flush It is unclear if this was because they ha habituated to theUAV presence or if their position with clear view of the sky reduced startling The birds showed noresponses as the UAV left the colony and descended to land
313 Flights 3ndash5
We conducted Flights 3ndash5 at midday on clear cloudless sunny days between 1200 and 1400 h at116 m AGL for the thermal flights and 119 m AGL for the RGB flights (Table 1) Specifically Flight 3occurred on 6 June 2018 Flight 4 on 2 July 2018 and Flight 5 on 11 July 2018 For these flightswe completely covered the black underside of the eBee using blue painterrsquos tape and sky-blue cardstock(Figure 3C) We then painted over the blue painterrsquos tape so it closely matched the color of the cardstockThe intent with the use of the blue color was to camouflage the eBee so that it would blend in with thesky as much as possible when observed from below Again no modification was made to the yellowfins to ensure that the components of the UAV remained visible to observers The flight plan wasslightly modified to begin passes at the waypoint closest to the launch location (Figure 2) This allowedthe UAV to make several passes outside the colony extent before passing over the colony as it wasobserved in Flight 2 that the direct ascent and initial pass over the colony caused high disturbanceand flushing
During Flights 3ndash5 we observed no disturbance The behavioral response to the UAV was lessintense than in response to observers walking through the colony Birds were quiet or vocalized lightlyin response to the UAV Behavioral response from the UAV appeared to be less intense than to otherforms of disturbance Specifically bird vocalizations in response to the UAV were quieter and theyreturned to their nest sites more quickly than in response to natural nest predators including a gullthat we observed fly over the colony during one of the flights We did not observe any gulls or otheravian predators entering the colony during the flights There are multiple possibilities that exist toexplain the minimal behavioral responses of the birds to the UAV during Flights 3ndash5 First the solidsky-blue camouflage alone or in conjunction with the cloudless sky made the UAV less visible to birdswhere it was not perceived as a threat or predatory bird Second the additional flight time of the UAVoutside of the colony before entering the colony allowed the birds to assess the UAV from a distanceand were either able to interpret it as a non-threat or to habituate to its presence
32 Discussion of Bird Behavioral Response
Previous studies provide mixed advice on optimal UAV launch locations including launchingthe UAV out of sight of the target species [60] Launch sites only 50 m away will induce disturbancereactions in some species [23] while in other species a minimum distance of 100 m was enough todecrease disturbance [27] Our launch location was situated far enough outside the colony to ensurethat it was not visible to birds nor was the actual launch of the drone visible However it has beensuggested that allowing the birds to observe the launch of both fixed-wing and rotocopter UAVs mayaid them in assessing the UAV as a non-threat [61] Additionally it has been noted that the initialapproach of the UAV may not cause flushing if the approach is from a location visible to the targetspecies [60] Our observations support this finding in that there was less disturbance and flushing
Drones 2020 4 12 12 of 18
when the UAV was programmed to make additional passes further from the colony such as in Flight 1and Flights 3ndash5 During Flight 2 the specific flight path led to the UAV passing directly over thecolony following its ascent leading to substantial disturbance and flushing We therefore recommendthat UAV flight paths should allow the target bird species additional time to observe the UAV inflight outside of the colony boundaries or habitat area therefore allowing the UAV to be assessed as anon-threat or allowing birds to habituate to its presence
UAV flight altitude can influence bird behavioral response [6061] McEvoy et al [60] foundthat flying a fixed-wing UAV at 60 m and higher did not induce flushing in a variety of waterfowl ifthe birds were approached from a visible location (ie parallel to the beach habitat) AlternativelyBierlich et al [61] found that a fixed-wing UAV flying at 60 m did cause flushing in birds inhabiting beachhabitat though birds returned quickly after making one flight In addition Bierlich et al [61] point outthat they did not provide sufficient time for the birds to habituate to the presence of the UAV before theapproach Our observations do not conclusively demonstrate whether or not increasing the UAV flightaltitude had any impact on bird behavior During our study the only time flight altitude was increasedwas after Flight 1 at 85 m with all other flights being conducted at 116ndash119 m (Table 1) During bothFlights 1 and 2 flown at different altitudes birds demonstrated strong disturbance reactions Flights 34 and 5 resulted in no disturbance reaction from birds Birds demonstrated very different behavioralresponses between Flight 2 and Flights 3ndash5 (all were flown at similar altitude) thus we conclude thatbehavioral reactions were likely influenced more by other factors such as cloud cover or specific UAVflight path Overall we noticed the biggest reduction in bird disturbance occurred when flying oncloudless days and when the UAV was camouflaged with solid sky blue We hypothesize that the typeof camouflage used may be dependent on cloud cover where camouflage that helps the UAV blendinto the sky will reduce or eliminate disturbance to the birds The modifications made to our flightsresulted in less of a behavioral reaction than that of traditional methods such as physically entering thenesting area Our findings may not be transferrable to surveys using rotocopter-style UAVs
33 Spatial and Temperature Accuracy Assessment for Thermal Imagery
In our assessment of spatial accuracy of thermal imagery collected with and without GCPswe observe that active thermal GCPs offer multiple benefits including ease of detection during imageryprocessing (Figure 4) as well as contribute to overall increases in spatial accuracy of UAV imagery(Table 3) In imagery processed without GCPs the actual location of the thermal GCPs varied by about5 to 6 m horizontally (Figure 5) The average root-mean-square (RMS) error indicates localizationaccuracy per GCP and mean errors in the three coordinate (X Y Z) directions We compare the meanRMS error of the checkpoints in imagery processed with and without GCPs (Table 3) Mean RMS errorfor imagery without GCPs was 2375 m with about 12 m inaccuracy in both the X and Y componentsand over 465 m inaccuracy in the Z component In imagery processed with GCPs the mean RMSerror for checkpoints was 059 m with less than 02 m inaccuracy in the X and Y components andabout 14 m in the Z component This indicates that the nest points could be drastically misplaced ifGCPs are not used resulting in inaccurate relationships being established between nest location andground temperature for example Additionally we observe that the direction of displacement is notuniform between points (Figure 5) thus standard imagery registration and alignment techniques areunlikely to improve the spatial accuracy of thermal imagery collected without GCPs In addition toinaccuracies in spatial location we also observe a net difference of +073 cm in actual ground sampledistance between imagery processed with and without GCPs (Table 3) despite using the same imageryprocessing parameters in Pix4D (the only difference being the inclusion or exclusion of GCPs) For bothproducts processed with and without GCPs we observe differences in the expected GSD of 220 cm(Table 3)
Drones 2020 4 12 13 of 18
Table 3 RGB and thermal imagery processing spatial accuracy assessment using Flight 4 imagery(2 July 2018) Calibration percent represents the percentage of total images successfully matched andcalibrated with camera parameters and used in subsequent point cloud densification Actual groundsample distance (GSD) differed from a predicted GSD of 220 cm in thermal imagery (Table 1)Mean root-mean-square (RMS) error represents the localization accuracy per GCP and mean errors inthe three coordinate (X Y Z) directions
GCPs Used CheckPoints Used
ImageryCalibration ()
ActualGSD (cm)
Mean RMS Error(m) of GCPs
Mean RMS Error(m) of Check Points
10 40 90 274 005 0230 40 94 2437 NA 237510 40 94 2510 029 059Drones 2020 4 x FOR PEER REVIEW 13 of 18
Figure 5 Comparison of thermal imagery processed with and without ground control points (GCPs) using Flight 4 imagery In thermal imagery processed with no GCPs the actual location of the active thermal GCP (indicated by the triangle) differs by over six meters (6 m) straight-line distance from the GCP location in the imagery (indicated by the cooler temperature blob see top left where it is also indicated with an arrow) The thermal imagery is overlaid with a 40 transparency over the RGB orthomosaic Imagery and GCP points were collected on 2 July 2018 Active thermal GCP points were evenly distributed around the outside of the colony along the beach (for reference see Figure 6)
Table 3 RGB and thermal imagery processing spatial accuracy assessment using Flight 4 imagery (2 July 2018) Calibration percent represents the percentage of total images successfully matched and calibrated with camera parameters and used in subsequent point cloud densification Actual ground sample distance (GSD) differed from a predicted GSD of 220 cm in thermal imagery (Table 1) Mean root-mean-square (RMS) error represents the localization accuracy per GCP and mean errors in the three coordinate (X Y Z) directions
GCPs used
Check Points used
Imagery Calibration ()
Actual GSD (cm)
Mean RMS error (m) of GCPs
Mean RMS error (m) of check points
10 40 90 274 005 023 0 40 94 2437 NA 2375 10 40 94 2510 029 059
Our assessment of the thermal accuracy of the thermoMap sensor collected under the specific
environmental conditions and flight parameterization of Flight 4 indicates good agreement (over 90 ) of thermoMap temperature data and ground reference temperature measurements (Figure 6) The measurements obtained from the thermoMap were generally within +- 2 oC variation from ground reference data (Figure 6) We conclude that the data collected with the thermoMap under these specific conditions are accurate and suitable for incorporating into further analysis and assessment of habitat conditions however we recommend that researchers conduct independent thermal accuracy assessments especially in areas with strong thermal contrasts or if a given degree of thermal accuracy is required for a research project When it comes to least tern nests specifically the final GSD of thermal imagery achieved within the course of this study (Table 3) was insufficient to resolve the nest size of the least tern (7 to 10 cm) but this does not detract from using the dataset for habitat
Figure 5 Comparison of thermal imagery processed with and without ground control points (GCPs)using Flight 4 imagery In thermal imagery processed with no GCPs the actual location of the activethermal GCP (indicated by the triangle) differs by over six meters (6 m) straight-line distance from theGCP location in the imagery (indicated by the cooler temperature blob see top left where it is alsoindicated with an arrow) The thermal imagery is overlaid with a 40 transparency over the RGBorthomosaic Imagery and GCP points were collected on 2 July 2018 Active thermal GCP points wereevenly distributed around the outside of the colony along the beach (for reference see Figure 6)
Our assessment of the thermal accuracy of the thermoMap sensor collected under the specificenvironmental conditions and flight parameterization of Flight 4 indicates good agreement (over 90)of thermoMap temperature data and ground reference temperature measurements (Figure 6)The measurements obtained from the thermoMap were generally within +minus 2 C variation fromground reference data (Figure 6) We conclude that the data collected with the thermoMap under thesespecific conditions are accurate and suitable for incorporating into further analysis and assessment ofhabitat conditions however we recommend that researchers conduct independent thermal accuracyassessments especially in areas with strong thermal contrasts or if a given degree of thermal accuracyis required for a research project When it comes to least tern nests specifically the final GSD of thermalimagery achieved within the course of this study (Table 3) was insufficient to resolve the nest sizeof the least tern (7 to 10 cm) but this does not detract from using the dataset for habitat analysis
Drones 2020 4 12 14 of 18
Thus the higher altitudes required to limit disturbance reactions in shore-nesting birds are a potentiallimitation of future applications of these datasets if the intent is detection of individual nests
Drones 2020 4 x FOR PEER REVIEW 14 of 18
analysis Thus the higher altitudes required to limit disturbance reactions in shore-nesting birds are a potential limitation of future applications of these datasets if the intent is detection of individual nests
Figure 6 Thermal accuracy assessment of thermoMap imagery Average temperatures taken with the handheld infrared (IR) thermometer (represented by the star) were compared to average temperature from the thermoMap within a one (1) m radius around the IR point Imagery and thermal IR data collected on 2 July 2018 (Flight 4) Temperature points were collected two (2) m West of the thermal GCP points (not shown)
4 Conclusions
In this paper we present a practical approach to collecting high-resolution thermal data for beach-nesting bird habitat monitoring and modeling that relies on UAVs to collect spatially continuous data while avoiding bird population and habitat disturbance Not only does field collection using appropriately camouflaged UAVs decrease disturbance to nesting birds it also allows for the reconstruction of thermal landscapes at high spatial temporal and radiometric resolutions during critical stages of breeding and nesting We found evidence that a combination of sky-blue camouflage and flying on cloudless days eliminated disturbance in nesting birds at our study site though we recommend more testing to conclusively validate which one plays a larger role in reducing disturbance In addition the novel active thermal ground control point collection and implementation methodology we propose in this research is both cost-effective easily transferable and has the potential to greatly improve spatial accuracy of thermal imagery where passive GCPs cannot be implemented or are less effective
Author Contributions Conceptualization NGP LES and RMD methodology NGP JBB LES and RMD software NGP validation KLM and NGP formal analysis KLM and JBB investigation JBB
Figure 6 Thermal accuracy assessment of thermoMap imagery Average temperatures taken with thehandheld infrared (IR) thermometer (represented by the star) were compared to average temperaturefrom the thermoMap within a one (1) m radius around the IR point Imagery and thermal IR datacollected on 2 July 2018 (Flight 4) Temperature points were collected two (2) m West of the thermalGCP points (not shown)
4 Conclusions
In this paper we present a practical approach to collecting high-resolution thermal data forbeach-nesting bird habitat monitoring and modeling that relies on UAVs to collect spatially continuousdata while avoiding bird population and habitat disturbance Not only does field collectionusing appropriately camouflaged UAVs decrease disturbance to nesting birds it also allows forthe reconstruction of thermal landscapes at high spatial temporal and radiometric resolutions duringcritical stages of breeding and nesting We found evidence that a combination of sky-blue camouflageand flying on cloudless days eliminated disturbance in nesting birds at our study site though werecommend more testing to conclusively validate which one plays a larger role in reducing disturbanceIn addition the novel active thermal ground control point collection and implementation methodologywe propose in this research is both cost-effective easily transferable and has the potential to greatlyimprove spatial accuracy of thermal imagery where passive GCPs cannot be implemented or areless effective
Drones 2020 4 12 15 of 18
Author Contributions Conceptualization NGP LES and RMD methodology NGP JBB LESand RMD software NGP validation KLM and NGP formal analysis KLM and JBB investigation JBBKLM LES and RMD resources NGP LES and RMD data curation JBB writingmdashoriginal draftpreparation KLM NGP JBB LES and RMD writingmdashreview and editing KLM NGP LESand RMD visualization KLM project administration RMD funding acquisition LES and RMDAll authors have read and agreed to the published version of the manuscript
Funding This research was funded by a grant from the Cape Fear Audubon Society to Lauren E Schaalea University of North Carolina Wilmington (UNCW) Center for Marine Sciences Pilot Grant to Raymond M Dannerand with support from the UNCW College of Arts and Sciences to Raymond M Danner and Narcisa G Pricope
Acknowledgments We would like to thank senseFly USA Raleigh North Carolina office and especially senseFlyUSA General Manager Troy Hittle for their support for our research and lending us the thermoMap sensor usedin this research This work would not have been possible without their continued support We would also like toextend a special thank you to Lindsay Addison of Audubon North Carolina for her willingness to facilitate andcontribute to this new approach for monitoring shoreline habitats We thank Anna Parot and Robert Snowden forassistance with field logistics and data collection We kindly thank our anonymous reviewers for their feedbackand comments that ultimately have strengthened our communication of our research and findings
Conflicts of Interest The authors declare no conflict of interest
References
1 Anderson K Gaston KJ Lightweight unmanned aerial vehicles will revolutionize spatial ecologyFront Ecol Environ 2013 11 138ndash146 [CrossRef]
2 Ahmed OS Shemrock A Chabot D Dillon C Williams G Wasson R Franklin SE Hierarchical landcover and vegetation classification using multispectral data acquired from an unmanned aerial vehicle Int JRemote Sens 2017 38 2037ndash2052 [CrossRef]
3 Peter KD drsquoOleire-Oltmanns S Ries JB Marzolff I Ait Hssaine A Soil erosion in gully catchmentsaffected by land-levelling measures in the Souss Basin Morocco analysed by rainfall simulation and UAVremote sensing data CATENA 2014 113 24ndash40 [CrossRef]
4 Samiappan S Turnage G Hathcoch LA Morehead R Mapping of invasive phragmites (common reed)in Gulf of Mexico coastal wetlands using multispectral imagery and small unmanned aerial systems Int JRemote Sens 2017 38 2861ndash2882 [CrossRef]
5 Jones GP Pearlstine LG Percival HF An assessment of small unmanned eerial vehicles for wildliferesearch Wildl Soc Bull 2006 34 750ndash758 [CrossRef]
6 Clarke LJ Hill RA Ford A Herbert RJH Esteves LS Stillman RA Using remote sensing to quantifyfishing effort and predict shorebird conflicts in an intertidal fishery Ecol Inform 2019 50 136ndash148 [CrossRef]
7 Sardagrave-Palomera F Bota G Padilla N Brotons L Sardagrave F Unmanned aircraft systems to unravel spatialand temporal factors affecting dynamics of colony formation and nesting success in birds J Avian Biol 201748 1273ndash1280 [CrossRef]
8 Barr JR Green MC DeMaso SJ Hardy TB Detectability and visibility biases associated with using aconsumer-grade unmanned aircraft to survey nesting colonial waterbirds J Field Ornithol 2018 89 242ndash257[CrossRef]
9 Drever MC Chabot D OrsquoHara PD Thomas JD Breault A Millikin RL Evaluation of an unmannedrotorcraft to monitor wintering waterbirds and coastal habitats in British Columbia Canada J UnmannedVeh Syst 2015 3 256ndash267 [CrossRef]
10 Hodgson JC Mott R Baylis SM Pham TT Wotherspoon S Kilpatrick AD Raja Segaran R Reid ITerauds A Koh LP Drones count wildlife more accurately and precisely than humans Methods Ecol Evol2018 9 1160ndash1167 [CrossRef]
11 Lyons MB Brandis KJ Murray NJ Wilshire JH McCann JA Kingsford RT Callaghan CTMonitoring large and complex wildlife aggregations with drones Methods Ecol Evol 2019 10 1024ndash1035[CrossRef]
12 McClelland GTW Bond AL Sardana A Glass T Rapid population estimate of a surface-nesting seabirdon a remote island using a low-cost unmanned aerial-vehicle Mar Ornithol 2016 44 215ndash220
13 Rush GP Clarke LE Stone M Wood MJ Can drones count gulls Minimal disturbance andsemiautomated image processing with an unmanned aerial vehicle for colony-nesting seabirds Ecol Evol2018 8 12322ndash12334 [CrossRef]
Drones 2020 4 12 16 of 18
14 Valle RG Scarton F Effectiveness efficiency and safety of censusing Eurasian Oysteratchers Haematopusostralegus by unmanned aircraft Mar Ornithol 2019 47 81ndash87
15 Afaacuten I Maacutentildeez M Diacuteaz-Delgado R Drone Monitoring of Breeding Waterbird Populations The Case of theGlossy Ibis Drones 2018 2 42 [CrossRef]
16 Kamm M Reed JM Use of visible spectrum sUAS photography for land cover classification at nest sites ofa declining bird species (Falco sparverius) Remote Sens Ecol Conserv 2019 5 259ndash271 [CrossRef]
17 Tattoni C Rizzolli F Pedrini P Can LiDAR data improve bird habitat suitability models Ecol Model2012 245 103ndash110 [CrossRef]
18 Reintsma KM McGowan PC Callahan C Collier T Gray D Sullivan JD Prosser DJ Preliminaryevaluation of behavioral response of nesting waterbirds to small unmanned aircraft flight Waterbirds 201841 326ndash331 [CrossRef]
19 Weissensteiner MH Poelstra JW Wolf JBW Low-budget ready-to-fly unmanned aerial vehiclesAn effective tool for evaluating the nesting status of canopy-breeding bird species J Avian Biol 2015 46425ndash430 [CrossRef]
20 Borrelle SB Fletcher AT Will drones reduce investigator disturbance to surface-nesting birds Ornithology2017 45 89ndash94
21 Christie KS Gilbert SL Brown CL Hatfield M Hanson L Unmanned aircraft systems in wildliferesearch Current and future applications of a transformative technology Front Ecol Environ 2016 14241ndash251 [CrossRef]
22 Kays R Sheppard J Mclean K Welch C Paunescu C Wang V Kravit G Crofoot M Hot monkeycold reality Surveying rainforest canopy mammals using drone-mounted thermal infrared sensors Int JRemote Sens 2019 40 407ndash419 [CrossRef]
23 Ruumlmmler M-C Mustafa O Maercker J Peter H-U Esefeld J Sensitivity of Adeacutelie and Gentoo penguinsto various flight activities of a micro UAV Polar Biol 2018 41 2481ndash2493 [CrossRef]
24 Scobie CA Hugenholtz CH Wildlife monitoring with unmanned aerial vehicles Quantifying distance toauditory detection Wildl Soc Bull 2016 40 781ndash785 [CrossRef]
25 Bevan E Whiting S Tucker T Guinea M Raith A Douglas R Measuring behavioral responses of seaturtles saltwater crocodiles and crested terns to drone disturbance to define ethical operating thresholdsPLoS ONE 2018 13 e0194460 [CrossRef] [PubMed]
26 Ramos EA Maloney B Magnasco MO Reiss D Bottlenose dolphins and antillean manatees respond tosmall multi-rotor unmanned aerial systems Front Mar Sci 2018 5 316 [CrossRef]
27 Weimerskirch H Prudor A Schull Q Flights of drones over sub-Antarctic seabirds show species- andstatus-specific behavioural and physiological responses Polar Biol 2018 41 259ndash266 [CrossRef]
28 Barnas A Newman R Felege CJ Corcoran MP Hervey SD Stechmann TJ Rockwell RFEllis-Felege SN Evaluating behavioral responses of nesting lesser snow geese to unmanned aircraft surveysEcol Evol 2018 8 1328ndash1338 [CrossRef]
29 Junda JH Greene E Zazelenchuk D Bird DM Nest defense behaviour of four raptor species (ospreybald eagle ferruginous hawk and red-tailed hawk) to a novel aerial intrudermdashA small rotary-winged droneJ Unmanned Veh Syst 2016 4 217ndash227 [CrossRef]
30 Fettermann T Fiori L Bader M Doshi A Breen D Stockin KA Bollard B Behaviour reactions ofbottlenose dolphins (Tursiops truncatus) to multirotor Unmanned Aerial Vehicles (UAVs) Sci Rep 2019 98558 [CrossRef]
31 Vas E Lescroeumll A Duriez O Boguszewski G Greacutemillet D Approaching birds with dronesFirst experiments and ethical guidelines Biol Lett 2015 11 20140754 [CrossRef] [PubMed]
32 Brisson-Curadeau Eacute Bird D Burke C Fifield DA Pace P Sherley RB Elliott KH Seabird speciesvary in behavioural response to drone census Sci Rep 2017 7 17884 [CrossRef] [PubMed]
33 Ditmer MA Werden LK Tanner JC Vincent JB Callahan P Iaizzo PA Laske TG Garshelis DLBears habituate to the repeated exposure of a novel stimulus unmanned aircraft systems Conserv Physiol2019 7 [CrossRef] [PubMed]
34 Rebolo-Ifraacuten N Grantildea Grilli M Lambertucci SA Drones as a threat to wildlife YouTube complementsscience in providing evidence about their effect Environ Conserv 2019 46 205ndash210 [CrossRef]
35 Burger J The effect of human activity on birds at a coastal bay Biol Conserv 1981 21 231ndash241 [CrossRef]
Drones 2020 4 12 17 of 18
36 Oswald SA Bearhop S Furness RW Huntley B Hamer KC Heat stress in a high-latitude seabirdEffects of temperature and food supply on bathing and nest attendance of great skuas Catharacta skuaJ Avian Biol 2008 39 163ndash169 [CrossRef]
37 Van de Voorde S Witteveen M Brown M Differential reactions to anthropogenic disturbance by twoground-nesting shorebirds Ostrich 2015 86 43ndash52 [CrossRef]
38 Tremblay J Ellison LN Effects of human disturbance on breeding of Black-Crowned Night Heron Auk1979 96 364ndash369
39 Snowden RS Least Tern Nest Thermoregulation in Response to Environmental Temerature and HumanDisturbance Masterrsquos Thesis University of North Carolina Wilmington Wilmington NC USA 2018
40 McKechnie AE Wolf BO Climate change increases the likelihood of catastrophic avian mortality eventsduring extreme heat waves Biol Lett 2010 6 253ndash256 [CrossRef]
41 Albright TP Mutiibwa D Gerson AR Smith EK Talbot WA OrsquoNeill JJ McKechnie AE Wolf BOMapping evaporative water loss in desert passerines reveals an expanding threat of lethal dehydrationProc Natl Acad Sci USA 2017 114 2283ndash2288 [CrossRef]
42 Conradie SR Woodborne SM Cunningham SJ McKechnie AE Chronic sublethal effects of hightemperatures will cause severe declines in southern African arid-zone birds during the 21st century Proc NatlAcad Sci USA 2019 116 14065ndash14070 [CrossRef] [PubMed]
43 Wilsey C Bateman B Taylor L Wu JX LeBaron G Shepherd R Koseff C Friedman S Stone RSurvival by Degrees 389 Bird Species on the Brink National Audubon Society New York NY USA 2019
44 Amat JA Masero JA How Kentish plovers Charadrius alexandrinus cope with heat stress during incubationBehav Ecol Sociobiol 2004 56 26ndash33 [CrossRef]
45 Prakash A Thermal remote sensing Concepts issues and applications Int Arch Photogramm Remote Sens2000 43 5
46 Wakeford ZE Chmielewska M Hole MJ Howell JA Jerram DA Combining thermal imaging withphotogrammetry of an active volcano using UAV An example from Stromboli Italy Photogramm Rec 201934 445ndash466 [CrossRef]
47 Dlesk A Vach K Point Cloud Generation of A Building from Close Range Thermal Images ISPRS IntArch Photogramm Remote Sens Spat Inf Sci 2019 XLII-5W2 29ndash33 [CrossRef]
48 Brooke C Clutterbuck B Mapping Heterogeneous Buried Archaeological Features Using Multisensor Datafrom Unmanned Aerial Vehicles Remote Sens 2019 12 41 [CrossRef]
49 Hartmann W Tilch S Eisenbeiss H Schindler K Determination of the uav position by automaticprocessing of thermal images ISPRS Int Arch Photogramm Remote Sens Spat Inf Sci 2012 XXXIX-B6111ndash116 [CrossRef]
50 Tucci G Parisi E Castelli G Errico A Corongiu M Sona G Viviani E Bresci E Preti FMulti-Sensor UAV Application for Thermal Analysis on a Dry-Stone Terraced Vineyard in Rural TuscanyLandscape ISPRS Int J Geo-Inf 2019 8 87 [CrossRef]
51 Park S Nolan AP Ryu D Chung H Estimation of crop water stress in a nectarine orchard usinghigh-resolution imagery from unmanned aerial vehicle (UAV) In Proceedings of the MODSIM201521st International Congress on Modelling and Simulation Modelling and Simulation Society of Australiaand New Zealand Gold Coast Australia 29 Novemberndash4 December 2015
52 Sagan V Maimaitijiang M Sidike P Eblimit K Peterson K Hartling S Esposito F Khanal KNewcomb M Pauli D et al UAV-Based High Resolution Thermal Imaging for Vegetation Monitoringand Plant Phenotyping Using ICI 8640 P FLIR Vue Pro R 640 and thermoMap Cameras Remote Sens 201911 330 [CrossRef]
53 Maes W Huete A Steppe K Optimizing the Processing of UAV-Based Thermal Imagery Remote Sens2017 9 476 [CrossRef]
54 Burke C Rashman M Wich S Symons A Theron C Longmore S Optimising observing strategies formonitoring animals using drone-mounted thermal infrared cameras Int J Remote Sens 2019 40 439ndash467[CrossRef]
55 Kottek M Grieser J Beck C Rudolf B Rubel F World Map of the Koumlppen-Geiger climate classificationupdated Meteorol Z 2006 15 259ndash263 [CrossRef]
56 Thompson BC Jackson JA Burger J Hill LA Kirsch EM Atwood JL Least Tern (Sternula antillarum)Version 10 In Birds of the World Cornell Lab of Ornithology Ithaca NY USA 2020
Drones 2020 4 12 18 of 18
57 Federal Aviaiton Administration Advisory Circular 107-2 Federal Aviaiton Administration Washington DCUSA 2016
58 Westoby MJ Brasington J Glasser NF Hambrey MJ Reynolds JM lsquoStructure-from-Motionrsquophotogrammetry A low-cost effective tool for geoscience applications Geomorphology 2012 179 300ndash314[CrossRef]
59 Pricope NG Mapes KL Woodward KD Olsen SF Baxley JB Multi-Sensor Assessment of the Effectsof Varying Processing Parameters on UAS Product Accuracy and Quality Drones 2019 3 63 [CrossRef]
60 McEvoy JF Hall GP McDonald PG Evaluation of unmanned aerial vehicle shape flight path and cameratype for waterfowl surveys Disturbance effects and species recognition PeerJ 2016 4 e1831 [CrossRef]
61 Bierlich K Johnston D Using Unoccupied Aerial Systems (UAS) for Surveying Shorebirds in North CarolinaMarine Conservation Ecology Unoccupied Systems Facility Duke University Durham NC USA 2016 p 23
copy 2020 by the authors Licensee MDPI Basel Switzerland This article is an open accessarticle distributed under the terms and conditions of the Creative Commons Attribution(CC BY) license (httpcreativecommonsorglicensesby40)
Drones 2020 4 12 2 of 18
applications including land cover and vegetation mapping [2] soil erosion [3] invasive species detectionand monitoring [4] and wildlife research and management [5]
Within the context of wildlife research UAVs have proven to be efficient tools for evaluating wildlifebehavior [67] abundance [8ndash15] and habitat [1617] Habitat evaluation may be done using visiblespectrum cameras to classify habitat by land cover type [16] or through analysis of light detection andranging (LiDAR) data to examine not only spatial extent of habitat type but also information on verticalcomponents of the habitat such as tree height [17] One potential benefit of using UAVs in wildlifestudies is the reduction in disturbances to wildlife caused by the presence of human observers [18ndash20]or other traditional survey methods such as manned aircraft [21] However UAVs themselves havebeen shown to be a source of disturbance to many types of animals thus the number of scientificstudies that specifically evaluate the effects of UAVs on both terrestrial [22ndash24] and aquatic [52526]target species has increased in recent years The majority of studies that evaluate the effects of UAVson wildlife involve observing behavioral responses from video footage obtained by the UAV [2627]video obtained by a standard camera [132328] direct observations in the wild [13142329ndash31] or bymeasuring nesting success [32] A few studies have also measured physiological responses to UAVactivity such as changes in heart rate [2733] and considered the aural capacity of the target species inevaluating the response to the UAV [2433] These studies have considered responses to specific featuresor characteristics of the flight plan or of the UAV itself including launch distance [23] distance ofthe UAV from target species while in flight [252932] flight angle or movement [2631] speed [31]flight altitude [182325262830] exposure frequency [3233] color [31] and noise level emitted fromthe UAV [1833]
Research that can lead to specific recommendations for using UAVs near target species isfundamental to ensuring continued and responsible use of UAVs in wildlife studies This is especiallytrue for species of conservation concern such as many species of waterbirds that nest in colonies [2034]Short-term or repeated anthropogenic disturbances are known to cause negative impacts on colonialnesting waterbirds Anthropogenic disturbance can cause these birds to flush (ie leave theirnests) and increase time spent away from the nest which can lead to nest predation overheatingdecreases in parental care or in more extreme cases complete abandonment of eggs young or nestinghabitat [35ndash39] Therefore developing methods to study nesting birds and their habitat withoutcausing disturbance remains a top priority for waterbird biologists and conservation managers
A rapidly expanding area of research in avian biology seeks to understand how high temperaturesaffect survival and reproductive success in order to predict population persistence Recent heatwaveshave caused widespread mortality in birds [40] and heat-related mortality is predicted to locallyextinguish bird populations in the southwestern United States [41] and southern Africa [42] in responseto continued climate change Nearly all of North Americarsquos bird species are expected to experienceincreased extreme heat events in the future which contributes to predictions that two-thirds of NorthAmerican birds are at increased risk of extinction as a result of climate change [43] Colonial waterbirdsthat nest on beaches may be particularly susceptible to the effects of high temperatures many speciesnest directly on the beach where they are fully exposed to full sun and high temperatures [3644]We still know little however about how temperature varies within and across bird habitats at finespatial scales and how such variation might influence birds this information could allow us to refinepredictions of population changes in the face of climate change identify valuable breeding locationsand plan habitat restoration Thermal imagery from a UAV provides a potential approach to describetemperature variation across the landscape and accomplish these important goals
In thermal remote sensing radiation emitted from surface objects in the region of 3 to 35 microm onthe electromagnetic spectrum is measured to estimate radiant (or actual) temperature The amountof energy radiated is dependent on the objectrsquos emissivity and kinetic temperature Emissivity is theemitting ability of a real material compared to that of a black body (a theoretical object that absorbsand then emits all incident energy at all wavelengths) Kinetic temperature is the surface temperatureof an object and is a measure of the amount of heat energy contained in it Measured temperatures can
Drones 2020 4 12 3 of 18
be influenced by environmental factors such as air temperature or humidity data is also influenced bythe time of day it is collected due to differential thermal heating [45] Because the spatial resolution ofthermal data is often coarser than other imagery types (visible spectrum or multispectral) the abilityto register it to other data can be a challenge due to the unacceptable transformations that may resultif reliable control points cannot be identified [45] though this approach is commonly employedTherefore alternative approaches of image registration and co-registration must be developed
With UAV imagery specifically locational accuracy is extremely important when imaging smallfeatures to ensure that the feature is placed within the correct pixel Alternative processing workflowsexist such as that described by Wakeford et al where both visible spectrum (RGB) and thermalimagery were collected and processed using common natural markers as ground control points(GCPs) before overlaying the thermal texture on the RGB point cloud [46] However in many casesnatural markers may not have sufficient contrast to be apparent during processing or in homogenouslandscapes may not be present to begin with Additionally the use of commercially available GCPsreferenced to very-high-accuracy spatial coordinates is common for visible RGB and multispectralimagery but much less so for thermal imagery mostly due to the fact that thermal cameras cannot ldquoseerdquostandard GCP targets as can other sensor types Within the field of thermography alternative ldquopassiverdquoGCPs or GCPs made from materials with different emissivity than the surrounding environmenthave been used including aluminum targets [47ndash51] as well as gray tarp [52] black polypropelyne [48]and wood panels painted gray [53] Less commonly utilized in thermal data collection with UAVsare ldquoactiverdquo GCPs or GCPs that are warmed or cooled to a temperature that is different than thebackground temperature
When conducting UAV surveys where wildlife is present tradeoffs between the desired finalproduct and disturbance of the target species are made when lower altitude UAV flights are requiredto achieve a specific ground sample size and that altitude is likely to cause a disturbance This isespecially true when the features being imaged are very small such as the nests of some species ofshore-nesting birds because the imagery must be collected at an altitude that can resolve the featuresof interest in final products [54] In other words the pixel size of the final product must be able tocapture the target feature within a certain minimum size otherwise the resulting pixel will be a blendof the target feature and any other features within that pixel [54]
In this study we conduct a series of flights above a beach-nesting bird colony using an off-the-shelfcommercial fixed-wing UAV in order to collect high resolution location and thermal landscape data insupport of habitat monitoring and modeling The research focuses on the least tern (Sternula antillarum)which is found in North Central and South America is listed as a species of conservation concernin several states in the USA and is listed as federally endangered in the interior USA and CaliforniaThe research discussed here was the initial phase within a project that will assess the influence ofhabitat surface temperatures on bird nesting location and success The specific objectives of thework reported here were to (1) observe and document the behavior of beach-nesting birds to UAVflights and modifications made to flight plans or physical modifications to the UAV in order tominimize disturbance and (2) assess the quality of the derived imagery products by assessing thespatial accuracy of both RGB and thermal imagery and the temperature accuracy of thermal imageryboth important prerequisites for bird habitat mapping and modeling Specifically given the extremelysmall spatial footprint of individual least tern nests (7 to 10 cm) it was important to collect both highlydetailed and highly accurate nest locations as well as thermal imagery in order to effectively match thefine-grain levels of both datasets while ensuring habitat and population disturbance minimizationAs such we structure this paper into two sections one that details the necessary strategies to minimizepopulation disturbance and a second that details the imagery accuracy considerations necessary toobtain highly accurate thermal data that matches the spatial footprint of nest locations
Drones 2020 4 12 4 of 18
2 Materials and Methods
21 Study Area
Lea-Hutaff Island (LHI) is a 228 km2 uninhabited barrier-island marsh complex of the coast ofNorth Carolina USA (Figure 1) LHI is separated from Topsail Island to the north by New TopsailInlet from Figure Eight Island to the South by Rich Inlet and from the mainland by Topsail SoundOnce two islands the landmasses were joined in 1998 when a powerful storm filled in the channel inbetween them The geomorphology of the island is characterized by dunes swales and overwash fansThe vegetation is comprised of grassy flats high and low marsh grass communities and eelgrass bedswith very little vegetation of substantial height The climate is Koppen Climate Class Cfa which is awarm temperate climate characterized by full humidity and hot summers [55] The island is a prominentnesting spot for several species of conservation concern including loggerhead turtles (Caretta caretta)least terns american oystercatchers (Haematopus palliates) piping plovers (Charadrius melodus) andclapper rails (Rallus crepitans) Due to the protected status of some of the bird species using thisisland as nesting habitat Audubon North Carolina manages land encompassing these critical nestinghabitats in collaboration with landowners We secured permissions from local managing stakeholdersto undertake this collaborative research project
Drones 2020 4 x FOR PEER REVIEW 4 of 18
Lea-Hutaff Island (LHI) is a 228 km2 uninhabited barrier-island marsh complex of the coast of North Carolina USA (Figure 1) LHI is separated from Topsail Island to the north by New Topsail Inlet from Figure Eight Island to the South by Rich Inlet and from the mainland by Topsail Sound Once two islands the landmasses were joined in 1998 when a powerful storm filled in the channel in between them The geomorphology of the island is characterized by dunes swales and overwash fans The vegetation is comprised of grassy flats high and low marsh grass communities and eelgrass beds with very little vegetation of substantial height The climate is Koppen Climate Class Cfa which is a warm temperate climate characterized by full humidity and hot summers [55] The island is a prominent nesting spot for several species of conservation concern including loggerhead turtles (Caretta caretta) least terns american oystercatchers (Haematopus palliates) piping plovers (Charadrius melodus) and clapper rails (Rallus crepitans) Due to the protected status of some of the bird species using this island as nesting habitat Audubon North Carolina manages land encompassing these critical nesting habitats in collaboration with landowners We secured permissions from local managing stakeholders to undertake this collaborative research project
Figure 1 Lea-Hutaff Island North Carolina (A) Study area showing colony extent and nest locations (B) Locator map (C) Close up view of bird nest points in SODA imagery The imagery is viewed at near-pixel resolution and is meant to show that the bird nests are not visible in the RGB imagery (D) Photograph of least tern nest with eggs nests are in an approximately 2-cm deep depression about 7 to 10 cm across and are made directly on the sand Sand is the main substrate but occasionally shells may be present either being there before construction or being placed by the bird [56]
22 Mission Planning Considerations
We conducted a series of five test flights using a senseFly eBee plus (hereafter referred to as eBee) fixed-wing drone to assess the impacts of the UAV on disturbance of least tern and other species of colonial beach-nesting birds as well as to thermally image the nesting habitat to ultimately understand the influence of beach thermal landscapes and other environmental variables on nesting location and success (Figure 2 Table 1) The eBee features an interchangeable sensor housing and can
Figure 1 Lea-Hutaff Island North Carolina (A) Study area showing colony extent and nest locations(B) Locator map (C) Close up view of bird nest points in SODA imagery The imagery is viewedat near-pixel resolution and is meant to show that the bird nests are not visible in the RGB imagery(D) Photograph of least tern nest with eggs nests are in an approximately 2-cm deep depression about7 to 10 cm across and are made directly on the sand Sand is the main substrate but occasionally shellsmay be present either being there before construction or being placed by the bird [56]
Drones 2020 4 12 5 of 18
22 Mission Planning Considerations
We conducted a series of five test flights using a senseFly eBee plus (hereafter referred to as eBee)fixed-wing drone to assess the impacts of the UAV on disturbance of least tern and other species ofcolonial beach-nesting birds as well as to thermally image the nesting habitat to ultimately understandthe influence of beach thermal landscapes and other environmental variables on nesting location andsuccess (Figure 2 Table 1) The eBee features an interchangeable sensor housing and can accommodatea variety of sensor types including visible wavelengths (RGB) multispectral and thermal For thisstudy both the senseFly thermoMap thermal sensor and the SODA RGB sensor were utilizedThe thermoMap features a 03 megapixel sensor recording infrared wavelengths from 7500ndash13500 nmwith a sensor resolution of 01 C The sensor performs a radiometric calibration automatically in-flightand collects images in timelapse mode at a rate of 75 images per second [48] The SODA camerahas a 20 megapixel sensor global shutter and collects RGB imagery simultaneously on a singleCMOS (complementary metal-oxide-semiconductor sensor) [48] We used the senseFly eMotion flightplanning and mission implementation software for all phases of planning and data collection (v 350senseFly 2019) For all flights we selected a launchlanding location at least 350 m northeast outside ofthe nesting area (Figure 2) Flight blocks were designed so that the nesting area was imaged in as fewpasses as possible to minimize potential chances of causing disturbances Additionally we designedflight blocks so that all UAV in-flight turns were taken outside the study area to minimize changes inmovement that would be observable to the colony The mission was designed so that the first waypointwas outside of the boundaries of the colony and so that upon reaching the first waypoint the UAVwould circle for at least 30 to 60 s so that the UAV was observable to the birds before entering theairspace over the colony
Because the eBee is shaped similarly to a predatory bird it might be mistaken as such when it isin flight and this fact was immediately evident during our very first flights which led to widespreadcolony flushing As such we determined that modifications to the UAV had to be made in order forthe project to be continued and we then assessed the response of the birds to the unmodified UAVas well as multiple physical modifications to its color including the use of dazzle camouflage andpainting the underside of the UAV (Figure 3) Dazzle camouflage was created using a combination ofblue painterrsquos tape and light blue cardstock paper to break up the solid black color The solid sky-bluecamouflage was created by taping paper to the underside of the eBee and painting it with light blue paintBecause no modifications were made to the weight balance sensors or engineering characteristics ofthe UAV these cosmetic modifications do not violate Federal Aviation Administration Part 107 Rulesand Regulations [57] However laws governing UAV operations may vary by country thus researchersshould familiarize themselves with pertinent laws to ensure legal compliance Additionally violation ofUAV manufacturersrsquo warranties or insurance policies should be considered in conducing these typesof experiments We did not assess impacts of UAV noise on the colony due to lack of data relating tonoise levels of the eBee or aural capacities of the bird species within the colony
Table 1 Flight mission data from Flights 1 through 5 using senseFly eBee plus with thermoMap orSODA sensors See Figure 2 for visualization of flight plans
Flight Sensor Altitude(m AED)
Estimated GSD(cmpx)
LongitudinalOverlap ()
LatitudinalOverlap ()
EstimatedDuration (mmss)
1 thermoMap 85 160 90 80 13462 thermoMap 116 220 90 80 10483 thermoMap 116 160 90 80 10483 SODA 119 280 60 70 08124 thermoMap 116 160 90 80 10484 SODA 119 280 60 70 08125 thermoMap 116 160 90 80 1036
Drones 2020 4 12 6 of 18
Drones 2020 4 x FOR PEER REVIEW 5 of 18
accommodate a variety of sensor types including visible wavelengths (RGB) multispectral and thermal For this study both the senseFly thermoMap thermal sensor and the SODA RGB sensor were utilized The thermoMap features a 03 megapixel sensor recording infrared wavelengths from 7500ndash13500 nm with a sensor resolution of 01 degC The sensor performs a radiometric calibration automatically in-flight and collects images in timelapse mode at a rate of 75 images per second [48] The SODA camera has a 20 megapixel sensor global shutter and collects RGB imagery simultaneously on a single CMOS (complementary metal-oxide-semiconductor sensor) [48] We used the senseFly eMotion flight planning and mission implementation software for all phases of planning and data collection (v 350 senseFly 2019) For all flights we selected a launchlanding location at least 350 m northeast outside of the nesting area (Figure 2) Flight blocks were designed so that the nesting area was imaged in as few passes as possible to minimize potential chances of causing disturbances Additionally we designed flight blocks so that all UAV in-flight turns were taken outside the study area to minimize changes in movement that would be observable to the colony The mission was designed so that the first waypoint was outside of the boundaries of the colony and so that upon reaching the first waypoint the UAV would circle for at least 30 to 60 seconds so that the UAV was observable to the birds before entering the airspace over the colony
Figure 2 Flight missions using the senseFly eBee plus equipped with thermoMap or SODA sensors on Lea-Hutaff Island See Table 1 for additional mission parameter information SODA flights use
Figure 2 Flight missions using the senseFly eBee plus equipped with thermoMap or SODA sensors onLea-Hutaff Island See Table 1 for additional mission parameter information SODA flights use thesame flight block Thermal flights 2ndash4 used the same flight block and thermal flight 3 is not shown inthe figure
Drones 2020 4 x FOR PEER REVIEW 6 of 18
the same flight block Thermal flights 2ndash4 used the same flight block and thermal flight 3 is not shown in the figure
Table 1 Flight mission data from Flights 1 through 5 using senseFly eBee plus with thermoMap or SODA sensors See Figure 2 for visualization of flight plans
Flight Sensor Altitude (m AED)
Estimated GSD
(cmpx)
Longitudinal Overlap ()
Latitudinal overlap ()
Estimated Duration (mmss)
1 thermoMap 85 160 90 80 1346 2 thermoMap 116 220 90 80 1048 3 thermoMap 116 160 90 80 1048 3 SODA 119 280 60 70 0812 4 thermoMap 116 160 90 80 1048 4 SODA 119 280 60 70 0812 5 thermoMap 116 160 90 80 1036
Because the eBee is shaped similarly to a predatory bird it might be mistaken as such when it is in flight and this fact was immediately evident during our very first flights which led to widespread colony flushing As such we determined that modifications to the UAV had to be made in order for the project to be continued and we then assessed the response of the birds to the unmodified UAV as well as multiple physical modifications to its color including the use of dazzle camouflage and painting the underside of the UAV (Figure 3) Dazzle camouflage was created using a combination of blue painterrsquos tape and light blue cardstock paper to break up the solid black color The solid sky-blue camouflage was created by taping paper to the underside of the eBee and painting it with light blue paint Because no modifications were made to the weight balance sensors or engineering characteristics of the UAV these cosmetic modifications do not violate Federal Aviation Administration Part 107 Rules and Regulations [57] However laws governing UAV operations may vary by country thus researchers should familiarize themselves with pertinent laws to ensure legal compliance Additionally violation of UAV manufacturersrsquo warranties or insurance policies should be considered in conducing these types of experiments We did not assess impacts of UAV noise on the colony due to lack of data relating to noise levels of the eBee or aural capacities of the bird species within the colony
Figure 3 senseFly eBee Plus fixed-wing drone (A) Flight 1 - No modifications (B) Flight 2 ndash dazzle camouflage (C) Flights 3 through 5 ndash solid sky-blue camouflage
Figure 3 senseFly eBee Plus fixed-wing drone (A) Flight 1mdashNo modifications (B) Flight 2mdashdazzlecamouflage (C) Flights 3 through 5mdashsolid sky-blue camouflage
Drones 2020 4 12 7 of 18
23 Imagery Collection and Accuracy Assessment
Accurate geolocation of imagery was of the utmost importance for this project because least ternnests are only about 7 to 10 cm in diameter (Figure 1D) while the expected ground sample distance(GSD) of the thermal imagery ranged from 16 to 22 cmpx based on flight height (Table 1) If the thermalimagery were not geolocated with high accuracy this could mean that a nest point could be placed inan incorrect pixel (therefore matching nest points with incorrect thermal ranges) It was necessary toalign the thermal imagery to ground control points (GCPs) collected with RTK and implement theGCPs in the imagery processing workflow for multiple reasons including (1) the thermoMap sensoris incompatible with both RTK and PPK (post-processing kinematics) and (2) the thermoMap does notsimultaneously collect RGB imagery by which to georeference the thermal imagery as other commercialthermal sensors do (eg FLIR) However it would also be possible to georeference thermal imagery byfirst conducting an RGB flight using RTK or PPK then performing a thermal flight using the sameeMotion flight plan After processing the RGB flight and thermal flight the thermal orthoimage couldbe co-registered to the RGB orthoimage We chose not to utilize this methodology as we could not becertain that two flights could be conducted during each survey if disturbance of the bird populationswere observed during a flight in addition to the lack of natural GCPs available in the study area
Nest points points for fence posts marking the boundary of the colony and thermal GCP locationswere collected using a survey grade RTK system that has a horizontal accuracy of +minus 1 cm andvertical accuracy of +minus 2 cm The equipment includes a Trimble R8 GNSS receiver TSC2 surveycontroller and jet pack MiFi modem Because there are no industry standard thermal GCPs (such asthe colored tiles or targets used for RGB imagery) that exist and are able to be detected by thermalsensors and because other materials such as aluminum may not be distinguishable enough in thisenvironment we propose one of the first known use cases of an active thermal GCP in a thermal UAVcollection and processing workflow As the thermal sensor cannot ldquoseerdquo visible wavelengths as anRGB or multispectral sensor can we created an active thermal GCP by placing a bag of ice on top ofstandard GCP tiles (Figure 4) The temperature contrast between the hot sand and cold ice is easilydistinguishable in thermal imagery and serves as a cost-effective and easy-to-implement solution toaccurately geolocate thermal UAV imagery For each flight we collected active thermal GCPs at threelocations along the beach side of the study area The placement of GCPs was limited to the beach sideoutside the extent of the colony due to restrictions on entering the colony or other sensitive areas suchas the marsh habitats or sand dunes (Figure 1)
During Flight 4 we collected thermal imagery with the senseFly thermoMap to assess theeffect of using GCPs vs not using GCPs in the processing workflow on accuracy of point locationsAdditional GCPs and checkpoints were subsequently incorporated into the thermal processingworkflow using point data collected at the fence posts marking the boundaries of the colony to achievehigher spatial accuracy (the point was collected at the base of the post) The fence posts are highlyvisible in the RGB imagery and much less so in the thermal imagery however the fence post locationswere used to locate groupings of pixels that were of sufficient uniqueness and clarity to be identifiablein the images within the Pix4Dmapper ray cloud GCP editor We first completed initial processingusing only the active thermal GCPs to increase the accuracy in automatic detection of the additionalGCPs then marked the additional passive GCPs Additionally we collected RGB imagery using thesenseFly SODA camera to create an orthomosaic using both the on-board RTK for the eBee andthe same number (and locations) of GCPs and check points used in the thermal imagery processingBoth RGB and thermal imagery were processed using Pix4Dmapper (V 4125 Pix4D SA 2019)referred to hereafter as Pix4D All post-processing spatial and temperature accuracy assessments wereperformed in ArcMap (V 107 ESRI 2011)
Drones 2020 4 12 8 of 18
Drones 2020 4 x FOR PEER REVIEW 8 of 18
remained stable 2) target and ambient temperatures were not extreme 3) the emissivities of imaged objects were close to 10 and 4) post-processingphotogrammetry was applied correctly (Daniel Murphy senseFly personal communication 7 June 2018) We tested the thermal accuracy of the thermoMap sensor under the specific conditions which existed during Flight 4 by comparing the processed thermal imagery to ground reference temperature measurements collected with an ennoLogic eT650D hand-held infrared thermometer alongside an RTK point This dual laser thermometer measures temperatures from minus50 degC to 650 degC with 01 degC temperature resolution Temperature points were collected 2 m to the west of the thermal GCP We did not directly measure the GCP target given that the ice represents an extreme difference from ambient temperatures For each temperature point we collected three measurements which were subsequently averaged We compared this ground reference average to the average temperature in the thermoMap data within a 1 m buffer around the RTK point where the temperature was collected
Figure 4 (A) Active thermal GCP created by temperature contrast of ice against the beach backdrop as seen in ArcMap indicated by the cooler temperature blob (blue) The actual temperature of the active thermal GCP is inaccurate due to the drastic difference from ambient temperature under which the thermoMap was calibrated (B) Standard RGB GCP tile as seen in ArcMap
A total of three initial test flights were conducted before a satisfactory response from least tern and other beach-nesting bird species was observed though observations were continued until Flight 5 Within the context of this study we define a satisfactory response as one that includes minimal to no flushing All flights and observations were conducted with permission of the North Carolina Wildlife Resources Commission (permit 18-ES00497) Audubon North Carolina and UNCW IACUC (permit A1617-010) Field studies were conducted under the supervision of an avian biologist from Audubon North Carolina who assisted with behavioral monitoring and flight planning to ensure minimization of disturbance to the birds We describe specifics of weather conditions flight missions and UAV modification in the Results section alongside the observed responses of nesting shorebirds as we believe this information is best interpreted when considered simultaneously
2 4 Disturbance Measurements
We monitored disturbance to beach-nesting birds using continuous behavioral observations for Flights 1 through 5 Specifically 2ndash4 researchers positioned themselves around the perimeter of the
Figure 4 (A) Active thermal GCP created by temperature contrast of ice against the beach backdrop asseen in ArcMap indicated by the cooler temperature blob (blue) The actual temperature of the activethermal GCP is inaccurate due to the drastic difference from ambient temperature under which thethermoMap was calibrated (B) Standard RGB GCP tile as seen in ArcMap
There is no standard thermal accuracy that exists for the thermoMap sensor by which to assess theaccuracy of the temperatures obtained from the imagery in comparison to the ground truth temperatureBecause the sensor is used in dynamic environmental and imaging conditions it is not possible toaccurately account for the variety of conditions under which the sensor is used However it would notbe uncommon to expect temperature accuracies of +minus 2 C if (1) camera temperatures remained stable(2) target and ambient temperatures were not extreme (3) the emissivities of imaged objects wereclose to 10 and (4) post-processingphotogrammetry was applied correctly (Daniel Murphy senseFlypersonal communication 7 June 2018) We tested the thermal accuracy of the thermoMap sensor underthe specific conditions which existed during Flight 4 by comparing the processed thermal imagery toground reference temperature measurements collected with an ennoLogic eT650D hand-held infraredthermometer alongside an RTK point This dual laser thermometer measures temperatures fromminus50 C to 650 C with 01 C temperature resolution Temperature points were collected 2 m to thewest of the thermal GCP We did not directly measure the GCP target given that the ice representsan extreme difference from ambient temperatures For each temperature point we collected threemeasurements which were subsequently averaged We compared this ground reference average tothe average temperature in the thermoMap data within a 1 m buffer around the RTK point where thetemperature was collected
A total of three initial test flights were conducted before a satisfactory response from least ternand other beach-nesting bird species was observed though observations were continued until Flight5 Within the context of this study we define a satisfactory response as one that includes minimalto no flushing All flights and observations were conducted with permission of the North CarolinaWildlife Resources Commission (permit 18-ES00497) Audubon North Carolina and UNCW IACUC(permit A1617-010) Field studies were conducted under the supervision of an avian biologist fromAudubon North Carolina who assisted with behavioral monitoring and flight planning to ensureminimization of disturbance to the birds We describe specifics of weather conditions flight missionsand UAV modification in the Results section alongside the observed responses of nesting shorebirds aswe believe this information is best interpreted when considered simultaneously
Drones 2020 4 12 9 of 18
24 Disturbance Measurements
We monitored disturbance to beach-nesting birds using continuous behavioral observations forFlights 1 through 5 Specifically 2ndash4 researchers positioned themselves around the perimeter of thenesting area before the UAV was launched The observers continuously recorded the activities ofbirds throughout the flights including launch ascent transects descent and landing The observersrecorded the approximate number of each bird species in the nesting area that responded to the UAVObservers remained in contact with two-way radios If more than 10 of the birds flushed the UAVwas returned to the launch location and flight mission parameters reassessed before the next launchFollowing a flight with observed disturbance the UAV was not launched again on the same day
25 RGB and Thermal Imagery Processing
RGB imagery was processed to generate a visual reference for the study area and the location ofnests within the colony RGB imagery from Flights 3 and 4 were processed using a modified Pix4D3D Maps template with the inclusion of three commercial GCP targets (Figure 4) seven additionalGCPs at fence post locations and 40 checkpoints at fence post locations in the processing workflowto increase imagery location accuracy and accurately reference the spatial location of bird nestsThis software utilizes a structure-from-motion workflow to reconstruct three-dimensional surfacesfrom still images [58] We used the default keypoint image scale for initial feature extraction andmatching to full image scale to ensure there was no reduction in final orthomosaic resolution We alsoused the alternative calibration method for imagery calibration based on camera parameters which isoptimized for nadir images with accurate geolocation and low texture content such as a sandy beachThe default image scale for point cloud densification is half (12) image size which was also notmodified The primary output created from processing the RGB imagery was the orthomosaic which isobtained from the digital surface model (DSM) and corrected for perspective with the RGB value of anindividual pixel being calculated as an average of the pixels in the corresponding original images [59]
Thermal imagery was processed using a modified Pix4D thermoMap template with the inclusionof GCPs within the processing workflow to increase location accuracy of imagery This templateuses full image scale and alternative calibration for computing image matches and generating thesparse point cloud and full keypoints image scale for densifying the point cloud We have chosen toutilize a large number of GCPs in the workflow to ensure high geolocation accuracy of the imageryas previously discussed We used a total of three active thermal GCPs seven additional passiveGCPs and 40 checkpoints The initial processing was completed by first using the active thermalGCPs to increase overall imagery alignment and autodetection of additional passive GCPs by Pix4DThe primary output from the thermal processing workflow is the thermal index (essentially anorthoimage where each pixel is characterized by the temperature value for that pixel) The thermalindex is computed from what Pix4D refers to as the reflectance map which for thermal data is actuallyan orthoimage of the raw values for thermal emittance We computed the thermal index in C
3 Results and Discussion
31 Observed Bird Colony Responses to UAV Flights
311 Flight 1
The first test flight was conducted in the morning on 8 May 2018 at 1000 h when there was 100cloud cover in the sky (Table 2) During this first flight no physical modifications were made to theUAV (ie the coloration was the original black color of the eBee Figure 3A) The flight occurred at aheight of 85 m above ground level (AGL) using the thermoMap sensor (Table 1) Flight transects wereoriented roughly east to west Our launch location was situated approximately 350 m northeast of thecolony extent (Figure 2) The eBee was hand-launched facing away from the colony ensuring its initialascent was not towards the colony During Flight 1 the UAV made several eastndashwest transects as it
Drones 2020 4 12 10 of 18
approached the tern colony from the launch location (Figure 2) This was due in part to the strongcrosswinds which challenged the UAVrsquos ability to stay on track causing it to make many unplannedpasses in order to hit the predetermined waypoints
Table 2 Observed responses of nesting shorebirds to UAV flights
FlightNumber Date Camouflage Cloud
Cover () Observed Response Impact
1 8 May 2018 None (black) 100Substantial flushing
birds flew out in a semi-circleover water and returned
Considerabledisturbance
2 22 May 2018 Dazzle 50Substantial flushing
birds flew out in a semi-circleover water and returned
Considerabledisturbance
3 6 June 2018 Solid sky blue 0 No flushing No disturbance
4 2 July 2018 Solid sky blue 0 No flushing No disturbance
5 11 July 2018 Solid sky blue 0 No flushing No disturbance
Birds showed no responses during approach or while the UAV flew over the northern edge ofthe colony (Figure 2) We noted that the initial passes farther from the colony provided additionaltime for the terns to assess the UAV as a potential non-threat When the UAV flew directly overthe colony individuals it passed directly above flushed These included least terns black skimmersand common terns Black skimmers appeared to flush for the longest period and least terns for theshortest Some incubating individuals (it was difficult to estimate a percentage) remained on nestsand others flushed It is likely that most of the non-incubating birds flushed As the UAV approachedthe interior of the colony birds in that area were disturbed Flights of interior birds appeared to disturbother birds causing colony-wide disturbance (ie flights) We hypothesize that the birds in the interiorof the colony were unable to see the UAV approach because of the low dunes surrounding that locationand that this prevented the interior birds from assessing the UAV as a non-threat before it flew overthem The apparent response to UAV overflights tended to be stronger during earlier passes whentypically 100 or more birds would flush up to half of which would fly beyond the colony boundaries(Figure 1) Later passes of the UAV typically caused flushing in only a few dozen individuals with veryfew to no birds flying beyond the colony boundaries Disturbance consisted of birds flying up fromthe ground circling over the nesting site and then landing Bird flights typically lasted less than 10 sSome birds flew out beyond the colony boundaries but returned in under 10 s Birds flushed whenthe UAV flew overhead and then settled soon after the UAV passed by The non-colonial Americanoystercatcher in the middle area of the colony stood in response to at least one over-pass but did not fly
312 Flight 2
Flight 2 took place at midday on 22 May 2018 at approximately 1300 h which was a partiallysunny day with scattered cloud cover (Table 2) Modifications were made to the coloration of the UAVusing blue painterrsquos tape and sky-blue cardstock to create irregular lines and coloration across theunderside of the UAV (Figure 2B) This ldquodazzle camouflagerdquo pattern served to break up the shape andoutline of the UAV so that it would be less likely to resemble a predatory bird No modification wasmade to the yellow fins on the underside of the eBee to ensure that components of the UAV remainedvisible to observers We conducted Flight 2 at 116 m AGL using the thermoMap sensor (Table 1)we hypothesized that the increase in flight altitude from Flight 1 would help minimize disturbance tothe birds Transects were oriented on a northndashsouth axis or approximately 90 from transect duringFlight 2 (Figure 2) This was done so that fewer passes would be made by the UAV over the colony andtherefore disturb the center of the colony less than during Flight 1 The UAV flight path began on thewestern edge of the colony and moved in an overall eastward direction
Drones 2020 4 12 11 of 18
It was immediately observed after launch that the UAV stood out against the white cloudsDespite the modifications made to color (dazzle camouflage Figure 3B) it appeared black as in Flight 1It is likely that because both flights took place on overcast days the contrast between the UAV andsky was higher and made the UAV more visible to the birds The modification made to the flightpath caused the UAV to ascend directly from the launch location and fly over the northern edge ofthe colony before starting the north-south transects (Figure 2) When the UAV flew over the colonymost of the birds flushed immediately They settled relatively quickly as the UAV turned to fly backnorth This initiated a regular sequence where birds flushed on southbound passes and settled as theUAV finished the southbound transect and headed north Just as the birds settled the UAV returnedsouth causing them to flush once again On the last few transects where the UAV was over the easternedge of the colony many birds did not flush It is unclear if this was because they ha habituated to theUAV presence or if their position with clear view of the sky reduced startling The birds showed noresponses as the UAV left the colony and descended to land
313 Flights 3ndash5
We conducted Flights 3ndash5 at midday on clear cloudless sunny days between 1200 and 1400 h at116 m AGL for the thermal flights and 119 m AGL for the RGB flights (Table 1) Specifically Flight 3occurred on 6 June 2018 Flight 4 on 2 July 2018 and Flight 5 on 11 July 2018 For these flightswe completely covered the black underside of the eBee using blue painterrsquos tape and sky-blue cardstock(Figure 3C) We then painted over the blue painterrsquos tape so it closely matched the color of the cardstockThe intent with the use of the blue color was to camouflage the eBee so that it would blend in with thesky as much as possible when observed from below Again no modification was made to the yellowfins to ensure that the components of the UAV remained visible to observers The flight plan wasslightly modified to begin passes at the waypoint closest to the launch location (Figure 2) This allowedthe UAV to make several passes outside the colony extent before passing over the colony as it wasobserved in Flight 2 that the direct ascent and initial pass over the colony caused high disturbanceand flushing
During Flights 3ndash5 we observed no disturbance The behavioral response to the UAV was lessintense than in response to observers walking through the colony Birds were quiet or vocalized lightlyin response to the UAV Behavioral response from the UAV appeared to be less intense than to otherforms of disturbance Specifically bird vocalizations in response to the UAV were quieter and theyreturned to their nest sites more quickly than in response to natural nest predators including a gullthat we observed fly over the colony during one of the flights We did not observe any gulls or otheravian predators entering the colony during the flights There are multiple possibilities that exist toexplain the minimal behavioral responses of the birds to the UAV during Flights 3ndash5 First the solidsky-blue camouflage alone or in conjunction with the cloudless sky made the UAV less visible to birdswhere it was not perceived as a threat or predatory bird Second the additional flight time of the UAVoutside of the colony before entering the colony allowed the birds to assess the UAV from a distanceand were either able to interpret it as a non-threat or to habituate to its presence
32 Discussion of Bird Behavioral Response
Previous studies provide mixed advice on optimal UAV launch locations including launchingthe UAV out of sight of the target species [60] Launch sites only 50 m away will induce disturbancereactions in some species [23] while in other species a minimum distance of 100 m was enough todecrease disturbance [27] Our launch location was situated far enough outside the colony to ensurethat it was not visible to birds nor was the actual launch of the drone visible However it has beensuggested that allowing the birds to observe the launch of both fixed-wing and rotocopter UAVs mayaid them in assessing the UAV as a non-threat [61] Additionally it has been noted that the initialapproach of the UAV may not cause flushing if the approach is from a location visible to the targetspecies [60] Our observations support this finding in that there was less disturbance and flushing
Drones 2020 4 12 12 of 18
when the UAV was programmed to make additional passes further from the colony such as in Flight 1and Flights 3ndash5 During Flight 2 the specific flight path led to the UAV passing directly over thecolony following its ascent leading to substantial disturbance and flushing We therefore recommendthat UAV flight paths should allow the target bird species additional time to observe the UAV inflight outside of the colony boundaries or habitat area therefore allowing the UAV to be assessed as anon-threat or allowing birds to habituate to its presence
UAV flight altitude can influence bird behavioral response [6061] McEvoy et al [60] foundthat flying a fixed-wing UAV at 60 m and higher did not induce flushing in a variety of waterfowl ifthe birds were approached from a visible location (ie parallel to the beach habitat) AlternativelyBierlich et al [61] found that a fixed-wing UAV flying at 60 m did cause flushing in birds inhabiting beachhabitat though birds returned quickly after making one flight In addition Bierlich et al [61] point outthat they did not provide sufficient time for the birds to habituate to the presence of the UAV before theapproach Our observations do not conclusively demonstrate whether or not increasing the UAV flightaltitude had any impact on bird behavior During our study the only time flight altitude was increasedwas after Flight 1 at 85 m with all other flights being conducted at 116ndash119 m (Table 1) During bothFlights 1 and 2 flown at different altitudes birds demonstrated strong disturbance reactions Flights 34 and 5 resulted in no disturbance reaction from birds Birds demonstrated very different behavioralresponses between Flight 2 and Flights 3ndash5 (all were flown at similar altitude) thus we conclude thatbehavioral reactions were likely influenced more by other factors such as cloud cover or specific UAVflight path Overall we noticed the biggest reduction in bird disturbance occurred when flying oncloudless days and when the UAV was camouflaged with solid sky blue We hypothesize that the typeof camouflage used may be dependent on cloud cover where camouflage that helps the UAV blendinto the sky will reduce or eliminate disturbance to the birds The modifications made to our flightsresulted in less of a behavioral reaction than that of traditional methods such as physically entering thenesting area Our findings may not be transferrable to surveys using rotocopter-style UAVs
33 Spatial and Temperature Accuracy Assessment for Thermal Imagery
In our assessment of spatial accuracy of thermal imagery collected with and without GCPswe observe that active thermal GCPs offer multiple benefits including ease of detection during imageryprocessing (Figure 4) as well as contribute to overall increases in spatial accuracy of UAV imagery(Table 3) In imagery processed without GCPs the actual location of the thermal GCPs varied by about5 to 6 m horizontally (Figure 5) The average root-mean-square (RMS) error indicates localizationaccuracy per GCP and mean errors in the three coordinate (X Y Z) directions We compare the meanRMS error of the checkpoints in imagery processed with and without GCPs (Table 3) Mean RMS errorfor imagery without GCPs was 2375 m with about 12 m inaccuracy in both the X and Y componentsand over 465 m inaccuracy in the Z component In imagery processed with GCPs the mean RMSerror for checkpoints was 059 m with less than 02 m inaccuracy in the X and Y components andabout 14 m in the Z component This indicates that the nest points could be drastically misplaced ifGCPs are not used resulting in inaccurate relationships being established between nest location andground temperature for example Additionally we observe that the direction of displacement is notuniform between points (Figure 5) thus standard imagery registration and alignment techniques areunlikely to improve the spatial accuracy of thermal imagery collected without GCPs In addition toinaccuracies in spatial location we also observe a net difference of +073 cm in actual ground sampledistance between imagery processed with and without GCPs (Table 3) despite using the same imageryprocessing parameters in Pix4D (the only difference being the inclusion or exclusion of GCPs) For bothproducts processed with and without GCPs we observe differences in the expected GSD of 220 cm(Table 3)
Drones 2020 4 12 13 of 18
Table 3 RGB and thermal imagery processing spatial accuracy assessment using Flight 4 imagery(2 July 2018) Calibration percent represents the percentage of total images successfully matched andcalibrated with camera parameters and used in subsequent point cloud densification Actual groundsample distance (GSD) differed from a predicted GSD of 220 cm in thermal imagery (Table 1)Mean root-mean-square (RMS) error represents the localization accuracy per GCP and mean errors inthe three coordinate (X Y Z) directions
GCPs Used CheckPoints Used
ImageryCalibration ()
ActualGSD (cm)
Mean RMS Error(m) of GCPs
Mean RMS Error(m) of Check Points
10 40 90 274 005 0230 40 94 2437 NA 237510 40 94 2510 029 059Drones 2020 4 x FOR PEER REVIEW 13 of 18
Figure 5 Comparison of thermal imagery processed with and without ground control points (GCPs) using Flight 4 imagery In thermal imagery processed with no GCPs the actual location of the active thermal GCP (indicated by the triangle) differs by over six meters (6 m) straight-line distance from the GCP location in the imagery (indicated by the cooler temperature blob see top left where it is also indicated with an arrow) The thermal imagery is overlaid with a 40 transparency over the RGB orthomosaic Imagery and GCP points were collected on 2 July 2018 Active thermal GCP points were evenly distributed around the outside of the colony along the beach (for reference see Figure 6)
Table 3 RGB and thermal imagery processing spatial accuracy assessment using Flight 4 imagery (2 July 2018) Calibration percent represents the percentage of total images successfully matched and calibrated with camera parameters and used in subsequent point cloud densification Actual ground sample distance (GSD) differed from a predicted GSD of 220 cm in thermal imagery (Table 1) Mean root-mean-square (RMS) error represents the localization accuracy per GCP and mean errors in the three coordinate (X Y Z) directions
GCPs used
Check Points used
Imagery Calibration ()
Actual GSD (cm)
Mean RMS error (m) of GCPs
Mean RMS error (m) of check points
10 40 90 274 005 023 0 40 94 2437 NA 2375 10 40 94 2510 029 059
Our assessment of the thermal accuracy of the thermoMap sensor collected under the specific
environmental conditions and flight parameterization of Flight 4 indicates good agreement (over 90 ) of thermoMap temperature data and ground reference temperature measurements (Figure 6) The measurements obtained from the thermoMap were generally within +- 2 oC variation from ground reference data (Figure 6) We conclude that the data collected with the thermoMap under these specific conditions are accurate and suitable for incorporating into further analysis and assessment of habitat conditions however we recommend that researchers conduct independent thermal accuracy assessments especially in areas with strong thermal contrasts or if a given degree of thermal accuracy is required for a research project When it comes to least tern nests specifically the final GSD of thermal imagery achieved within the course of this study (Table 3) was insufficient to resolve the nest size of the least tern (7 to 10 cm) but this does not detract from using the dataset for habitat
Figure 5 Comparison of thermal imagery processed with and without ground control points (GCPs)using Flight 4 imagery In thermal imagery processed with no GCPs the actual location of the activethermal GCP (indicated by the triangle) differs by over six meters (6 m) straight-line distance from theGCP location in the imagery (indicated by the cooler temperature blob see top left where it is alsoindicated with an arrow) The thermal imagery is overlaid with a 40 transparency over the RGBorthomosaic Imagery and GCP points were collected on 2 July 2018 Active thermal GCP points wereevenly distributed around the outside of the colony along the beach (for reference see Figure 6)
Our assessment of the thermal accuracy of the thermoMap sensor collected under the specificenvironmental conditions and flight parameterization of Flight 4 indicates good agreement (over 90)of thermoMap temperature data and ground reference temperature measurements (Figure 6)The measurements obtained from the thermoMap were generally within +minus 2 C variation fromground reference data (Figure 6) We conclude that the data collected with the thermoMap under thesespecific conditions are accurate and suitable for incorporating into further analysis and assessment ofhabitat conditions however we recommend that researchers conduct independent thermal accuracyassessments especially in areas with strong thermal contrasts or if a given degree of thermal accuracyis required for a research project When it comes to least tern nests specifically the final GSD of thermalimagery achieved within the course of this study (Table 3) was insufficient to resolve the nest sizeof the least tern (7 to 10 cm) but this does not detract from using the dataset for habitat analysis
Drones 2020 4 12 14 of 18
Thus the higher altitudes required to limit disturbance reactions in shore-nesting birds are a potentiallimitation of future applications of these datasets if the intent is detection of individual nests
Drones 2020 4 x FOR PEER REVIEW 14 of 18
analysis Thus the higher altitudes required to limit disturbance reactions in shore-nesting birds are a potential limitation of future applications of these datasets if the intent is detection of individual nests
Figure 6 Thermal accuracy assessment of thermoMap imagery Average temperatures taken with the handheld infrared (IR) thermometer (represented by the star) were compared to average temperature from the thermoMap within a one (1) m radius around the IR point Imagery and thermal IR data collected on 2 July 2018 (Flight 4) Temperature points were collected two (2) m West of the thermal GCP points (not shown)
4 Conclusions
In this paper we present a practical approach to collecting high-resolution thermal data for beach-nesting bird habitat monitoring and modeling that relies on UAVs to collect spatially continuous data while avoiding bird population and habitat disturbance Not only does field collection using appropriately camouflaged UAVs decrease disturbance to nesting birds it also allows for the reconstruction of thermal landscapes at high spatial temporal and radiometric resolutions during critical stages of breeding and nesting We found evidence that a combination of sky-blue camouflage and flying on cloudless days eliminated disturbance in nesting birds at our study site though we recommend more testing to conclusively validate which one plays a larger role in reducing disturbance In addition the novel active thermal ground control point collection and implementation methodology we propose in this research is both cost-effective easily transferable and has the potential to greatly improve spatial accuracy of thermal imagery where passive GCPs cannot be implemented or are less effective
Author Contributions Conceptualization NGP LES and RMD methodology NGP JBB LES and RMD software NGP validation KLM and NGP formal analysis KLM and JBB investigation JBB
Figure 6 Thermal accuracy assessment of thermoMap imagery Average temperatures taken with thehandheld infrared (IR) thermometer (represented by the star) were compared to average temperaturefrom the thermoMap within a one (1) m radius around the IR point Imagery and thermal IR datacollected on 2 July 2018 (Flight 4) Temperature points were collected two (2) m West of the thermalGCP points (not shown)
4 Conclusions
In this paper we present a practical approach to collecting high-resolution thermal data forbeach-nesting bird habitat monitoring and modeling that relies on UAVs to collect spatially continuousdata while avoiding bird population and habitat disturbance Not only does field collectionusing appropriately camouflaged UAVs decrease disturbance to nesting birds it also allows forthe reconstruction of thermal landscapes at high spatial temporal and radiometric resolutions duringcritical stages of breeding and nesting We found evidence that a combination of sky-blue camouflageand flying on cloudless days eliminated disturbance in nesting birds at our study site though werecommend more testing to conclusively validate which one plays a larger role in reducing disturbanceIn addition the novel active thermal ground control point collection and implementation methodologywe propose in this research is both cost-effective easily transferable and has the potential to greatlyimprove spatial accuracy of thermal imagery where passive GCPs cannot be implemented or areless effective
Drones 2020 4 12 15 of 18
Author Contributions Conceptualization NGP LES and RMD methodology NGP JBB LESand RMD software NGP validation KLM and NGP formal analysis KLM and JBB investigation JBBKLM LES and RMD resources NGP LES and RMD data curation JBB writingmdashoriginal draftpreparation KLM NGP JBB LES and RMD writingmdashreview and editing KLM NGP LESand RMD visualization KLM project administration RMD funding acquisition LES and RMDAll authors have read and agreed to the published version of the manuscript
Funding This research was funded by a grant from the Cape Fear Audubon Society to Lauren E Schaalea University of North Carolina Wilmington (UNCW) Center for Marine Sciences Pilot Grant to Raymond M Dannerand with support from the UNCW College of Arts and Sciences to Raymond M Danner and Narcisa G Pricope
Acknowledgments We would like to thank senseFly USA Raleigh North Carolina office and especially senseFlyUSA General Manager Troy Hittle for their support for our research and lending us the thermoMap sensor usedin this research This work would not have been possible without their continued support We would also like toextend a special thank you to Lindsay Addison of Audubon North Carolina for her willingness to facilitate andcontribute to this new approach for monitoring shoreline habitats We thank Anna Parot and Robert Snowden forassistance with field logistics and data collection We kindly thank our anonymous reviewers for their feedbackand comments that ultimately have strengthened our communication of our research and findings
Conflicts of Interest The authors declare no conflict of interest
References
1 Anderson K Gaston KJ Lightweight unmanned aerial vehicles will revolutionize spatial ecologyFront Ecol Environ 2013 11 138ndash146 [CrossRef]
2 Ahmed OS Shemrock A Chabot D Dillon C Williams G Wasson R Franklin SE Hierarchical landcover and vegetation classification using multispectral data acquired from an unmanned aerial vehicle Int JRemote Sens 2017 38 2037ndash2052 [CrossRef]
3 Peter KD drsquoOleire-Oltmanns S Ries JB Marzolff I Ait Hssaine A Soil erosion in gully catchmentsaffected by land-levelling measures in the Souss Basin Morocco analysed by rainfall simulation and UAVremote sensing data CATENA 2014 113 24ndash40 [CrossRef]
4 Samiappan S Turnage G Hathcoch LA Morehead R Mapping of invasive phragmites (common reed)in Gulf of Mexico coastal wetlands using multispectral imagery and small unmanned aerial systems Int JRemote Sens 2017 38 2861ndash2882 [CrossRef]
5 Jones GP Pearlstine LG Percival HF An assessment of small unmanned eerial vehicles for wildliferesearch Wildl Soc Bull 2006 34 750ndash758 [CrossRef]
6 Clarke LJ Hill RA Ford A Herbert RJH Esteves LS Stillman RA Using remote sensing to quantifyfishing effort and predict shorebird conflicts in an intertidal fishery Ecol Inform 2019 50 136ndash148 [CrossRef]
7 Sardagrave-Palomera F Bota G Padilla N Brotons L Sardagrave F Unmanned aircraft systems to unravel spatialand temporal factors affecting dynamics of colony formation and nesting success in birds J Avian Biol 201748 1273ndash1280 [CrossRef]
8 Barr JR Green MC DeMaso SJ Hardy TB Detectability and visibility biases associated with using aconsumer-grade unmanned aircraft to survey nesting colonial waterbirds J Field Ornithol 2018 89 242ndash257[CrossRef]
9 Drever MC Chabot D OrsquoHara PD Thomas JD Breault A Millikin RL Evaluation of an unmannedrotorcraft to monitor wintering waterbirds and coastal habitats in British Columbia Canada J UnmannedVeh Syst 2015 3 256ndash267 [CrossRef]
10 Hodgson JC Mott R Baylis SM Pham TT Wotherspoon S Kilpatrick AD Raja Segaran R Reid ITerauds A Koh LP Drones count wildlife more accurately and precisely than humans Methods Ecol Evol2018 9 1160ndash1167 [CrossRef]
11 Lyons MB Brandis KJ Murray NJ Wilshire JH McCann JA Kingsford RT Callaghan CTMonitoring large and complex wildlife aggregations with drones Methods Ecol Evol 2019 10 1024ndash1035[CrossRef]
12 McClelland GTW Bond AL Sardana A Glass T Rapid population estimate of a surface-nesting seabirdon a remote island using a low-cost unmanned aerial-vehicle Mar Ornithol 2016 44 215ndash220
13 Rush GP Clarke LE Stone M Wood MJ Can drones count gulls Minimal disturbance andsemiautomated image processing with an unmanned aerial vehicle for colony-nesting seabirds Ecol Evol2018 8 12322ndash12334 [CrossRef]
Drones 2020 4 12 16 of 18
14 Valle RG Scarton F Effectiveness efficiency and safety of censusing Eurasian Oysteratchers Haematopusostralegus by unmanned aircraft Mar Ornithol 2019 47 81ndash87
15 Afaacuten I Maacutentildeez M Diacuteaz-Delgado R Drone Monitoring of Breeding Waterbird Populations The Case of theGlossy Ibis Drones 2018 2 42 [CrossRef]
16 Kamm M Reed JM Use of visible spectrum sUAS photography for land cover classification at nest sites ofa declining bird species (Falco sparverius) Remote Sens Ecol Conserv 2019 5 259ndash271 [CrossRef]
17 Tattoni C Rizzolli F Pedrini P Can LiDAR data improve bird habitat suitability models Ecol Model2012 245 103ndash110 [CrossRef]
18 Reintsma KM McGowan PC Callahan C Collier T Gray D Sullivan JD Prosser DJ Preliminaryevaluation of behavioral response of nesting waterbirds to small unmanned aircraft flight Waterbirds 201841 326ndash331 [CrossRef]
19 Weissensteiner MH Poelstra JW Wolf JBW Low-budget ready-to-fly unmanned aerial vehiclesAn effective tool for evaluating the nesting status of canopy-breeding bird species J Avian Biol 2015 46425ndash430 [CrossRef]
20 Borrelle SB Fletcher AT Will drones reduce investigator disturbance to surface-nesting birds Ornithology2017 45 89ndash94
21 Christie KS Gilbert SL Brown CL Hatfield M Hanson L Unmanned aircraft systems in wildliferesearch Current and future applications of a transformative technology Front Ecol Environ 2016 14241ndash251 [CrossRef]
22 Kays R Sheppard J Mclean K Welch C Paunescu C Wang V Kravit G Crofoot M Hot monkeycold reality Surveying rainforest canopy mammals using drone-mounted thermal infrared sensors Int JRemote Sens 2019 40 407ndash419 [CrossRef]
23 Ruumlmmler M-C Mustafa O Maercker J Peter H-U Esefeld J Sensitivity of Adeacutelie and Gentoo penguinsto various flight activities of a micro UAV Polar Biol 2018 41 2481ndash2493 [CrossRef]
24 Scobie CA Hugenholtz CH Wildlife monitoring with unmanned aerial vehicles Quantifying distance toauditory detection Wildl Soc Bull 2016 40 781ndash785 [CrossRef]
25 Bevan E Whiting S Tucker T Guinea M Raith A Douglas R Measuring behavioral responses of seaturtles saltwater crocodiles and crested terns to drone disturbance to define ethical operating thresholdsPLoS ONE 2018 13 e0194460 [CrossRef] [PubMed]
26 Ramos EA Maloney B Magnasco MO Reiss D Bottlenose dolphins and antillean manatees respond tosmall multi-rotor unmanned aerial systems Front Mar Sci 2018 5 316 [CrossRef]
27 Weimerskirch H Prudor A Schull Q Flights of drones over sub-Antarctic seabirds show species- andstatus-specific behavioural and physiological responses Polar Biol 2018 41 259ndash266 [CrossRef]
28 Barnas A Newman R Felege CJ Corcoran MP Hervey SD Stechmann TJ Rockwell RFEllis-Felege SN Evaluating behavioral responses of nesting lesser snow geese to unmanned aircraft surveysEcol Evol 2018 8 1328ndash1338 [CrossRef]
29 Junda JH Greene E Zazelenchuk D Bird DM Nest defense behaviour of four raptor species (ospreybald eagle ferruginous hawk and red-tailed hawk) to a novel aerial intrudermdashA small rotary-winged droneJ Unmanned Veh Syst 2016 4 217ndash227 [CrossRef]
30 Fettermann T Fiori L Bader M Doshi A Breen D Stockin KA Bollard B Behaviour reactions ofbottlenose dolphins (Tursiops truncatus) to multirotor Unmanned Aerial Vehicles (UAVs) Sci Rep 2019 98558 [CrossRef]
31 Vas E Lescroeumll A Duriez O Boguszewski G Greacutemillet D Approaching birds with dronesFirst experiments and ethical guidelines Biol Lett 2015 11 20140754 [CrossRef] [PubMed]
32 Brisson-Curadeau Eacute Bird D Burke C Fifield DA Pace P Sherley RB Elliott KH Seabird speciesvary in behavioural response to drone census Sci Rep 2017 7 17884 [CrossRef] [PubMed]
33 Ditmer MA Werden LK Tanner JC Vincent JB Callahan P Iaizzo PA Laske TG Garshelis DLBears habituate to the repeated exposure of a novel stimulus unmanned aircraft systems Conserv Physiol2019 7 [CrossRef] [PubMed]
34 Rebolo-Ifraacuten N Grantildea Grilli M Lambertucci SA Drones as a threat to wildlife YouTube complementsscience in providing evidence about their effect Environ Conserv 2019 46 205ndash210 [CrossRef]
35 Burger J The effect of human activity on birds at a coastal bay Biol Conserv 1981 21 231ndash241 [CrossRef]
Drones 2020 4 12 17 of 18
36 Oswald SA Bearhop S Furness RW Huntley B Hamer KC Heat stress in a high-latitude seabirdEffects of temperature and food supply on bathing and nest attendance of great skuas Catharacta skuaJ Avian Biol 2008 39 163ndash169 [CrossRef]
37 Van de Voorde S Witteveen M Brown M Differential reactions to anthropogenic disturbance by twoground-nesting shorebirds Ostrich 2015 86 43ndash52 [CrossRef]
38 Tremblay J Ellison LN Effects of human disturbance on breeding of Black-Crowned Night Heron Auk1979 96 364ndash369
39 Snowden RS Least Tern Nest Thermoregulation in Response to Environmental Temerature and HumanDisturbance Masterrsquos Thesis University of North Carolina Wilmington Wilmington NC USA 2018
40 McKechnie AE Wolf BO Climate change increases the likelihood of catastrophic avian mortality eventsduring extreme heat waves Biol Lett 2010 6 253ndash256 [CrossRef]
41 Albright TP Mutiibwa D Gerson AR Smith EK Talbot WA OrsquoNeill JJ McKechnie AE Wolf BOMapping evaporative water loss in desert passerines reveals an expanding threat of lethal dehydrationProc Natl Acad Sci USA 2017 114 2283ndash2288 [CrossRef]
42 Conradie SR Woodborne SM Cunningham SJ McKechnie AE Chronic sublethal effects of hightemperatures will cause severe declines in southern African arid-zone birds during the 21st century Proc NatlAcad Sci USA 2019 116 14065ndash14070 [CrossRef] [PubMed]
43 Wilsey C Bateman B Taylor L Wu JX LeBaron G Shepherd R Koseff C Friedman S Stone RSurvival by Degrees 389 Bird Species on the Brink National Audubon Society New York NY USA 2019
44 Amat JA Masero JA How Kentish plovers Charadrius alexandrinus cope with heat stress during incubationBehav Ecol Sociobiol 2004 56 26ndash33 [CrossRef]
45 Prakash A Thermal remote sensing Concepts issues and applications Int Arch Photogramm Remote Sens2000 43 5
46 Wakeford ZE Chmielewska M Hole MJ Howell JA Jerram DA Combining thermal imaging withphotogrammetry of an active volcano using UAV An example from Stromboli Italy Photogramm Rec 201934 445ndash466 [CrossRef]
47 Dlesk A Vach K Point Cloud Generation of A Building from Close Range Thermal Images ISPRS IntArch Photogramm Remote Sens Spat Inf Sci 2019 XLII-5W2 29ndash33 [CrossRef]
48 Brooke C Clutterbuck B Mapping Heterogeneous Buried Archaeological Features Using Multisensor Datafrom Unmanned Aerial Vehicles Remote Sens 2019 12 41 [CrossRef]
49 Hartmann W Tilch S Eisenbeiss H Schindler K Determination of the uav position by automaticprocessing of thermal images ISPRS Int Arch Photogramm Remote Sens Spat Inf Sci 2012 XXXIX-B6111ndash116 [CrossRef]
50 Tucci G Parisi E Castelli G Errico A Corongiu M Sona G Viviani E Bresci E Preti FMulti-Sensor UAV Application for Thermal Analysis on a Dry-Stone Terraced Vineyard in Rural TuscanyLandscape ISPRS Int J Geo-Inf 2019 8 87 [CrossRef]
51 Park S Nolan AP Ryu D Chung H Estimation of crop water stress in a nectarine orchard usinghigh-resolution imagery from unmanned aerial vehicle (UAV) In Proceedings of the MODSIM201521st International Congress on Modelling and Simulation Modelling and Simulation Society of Australiaand New Zealand Gold Coast Australia 29 Novemberndash4 December 2015
52 Sagan V Maimaitijiang M Sidike P Eblimit K Peterson K Hartling S Esposito F Khanal KNewcomb M Pauli D et al UAV-Based High Resolution Thermal Imaging for Vegetation Monitoringand Plant Phenotyping Using ICI 8640 P FLIR Vue Pro R 640 and thermoMap Cameras Remote Sens 201911 330 [CrossRef]
53 Maes W Huete A Steppe K Optimizing the Processing of UAV-Based Thermal Imagery Remote Sens2017 9 476 [CrossRef]
54 Burke C Rashman M Wich S Symons A Theron C Longmore S Optimising observing strategies formonitoring animals using drone-mounted thermal infrared cameras Int J Remote Sens 2019 40 439ndash467[CrossRef]
55 Kottek M Grieser J Beck C Rudolf B Rubel F World Map of the Koumlppen-Geiger climate classificationupdated Meteorol Z 2006 15 259ndash263 [CrossRef]
56 Thompson BC Jackson JA Burger J Hill LA Kirsch EM Atwood JL Least Tern (Sternula antillarum)Version 10 In Birds of the World Cornell Lab of Ornithology Ithaca NY USA 2020
Drones 2020 4 12 18 of 18
57 Federal Aviaiton Administration Advisory Circular 107-2 Federal Aviaiton Administration Washington DCUSA 2016
58 Westoby MJ Brasington J Glasser NF Hambrey MJ Reynolds JM lsquoStructure-from-Motionrsquophotogrammetry A low-cost effective tool for geoscience applications Geomorphology 2012 179 300ndash314[CrossRef]
59 Pricope NG Mapes KL Woodward KD Olsen SF Baxley JB Multi-Sensor Assessment of the Effectsof Varying Processing Parameters on UAS Product Accuracy and Quality Drones 2019 3 63 [CrossRef]
60 McEvoy JF Hall GP McDonald PG Evaluation of unmanned aerial vehicle shape flight path and cameratype for waterfowl surveys Disturbance effects and species recognition PeerJ 2016 4 e1831 [CrossRef]
61 Bierlich K Johnston D Using Unoccupied Aerial Systems (UAS) for Surveying Shorebirds in North CarolinaMarine Conservation Ecology Unoccupied Systems Facility Duke University Durham NC USA 2016 p 23
copy 2020 by the authors Licensee MDPI Basel Switzerland This article is an open accessarticle distributed under the terms and conditions of the Creative Commons Attribution(CC BY) license (httpcreativecommonsorglicensesby40)
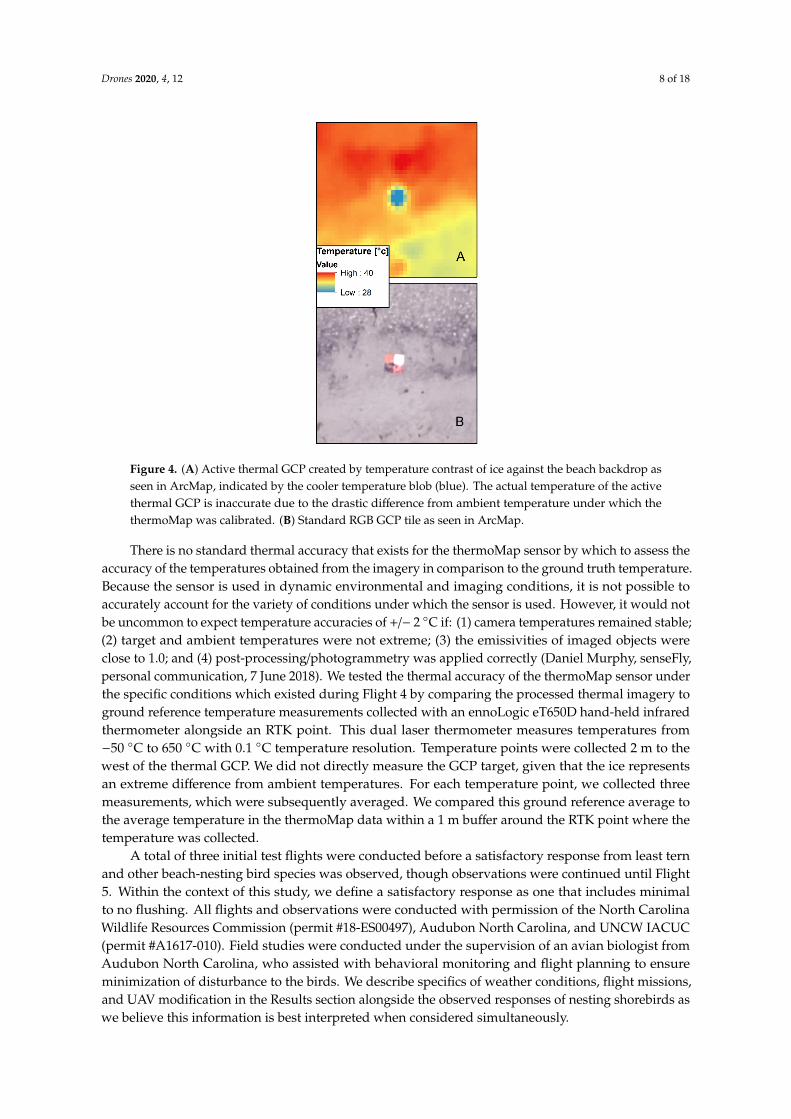
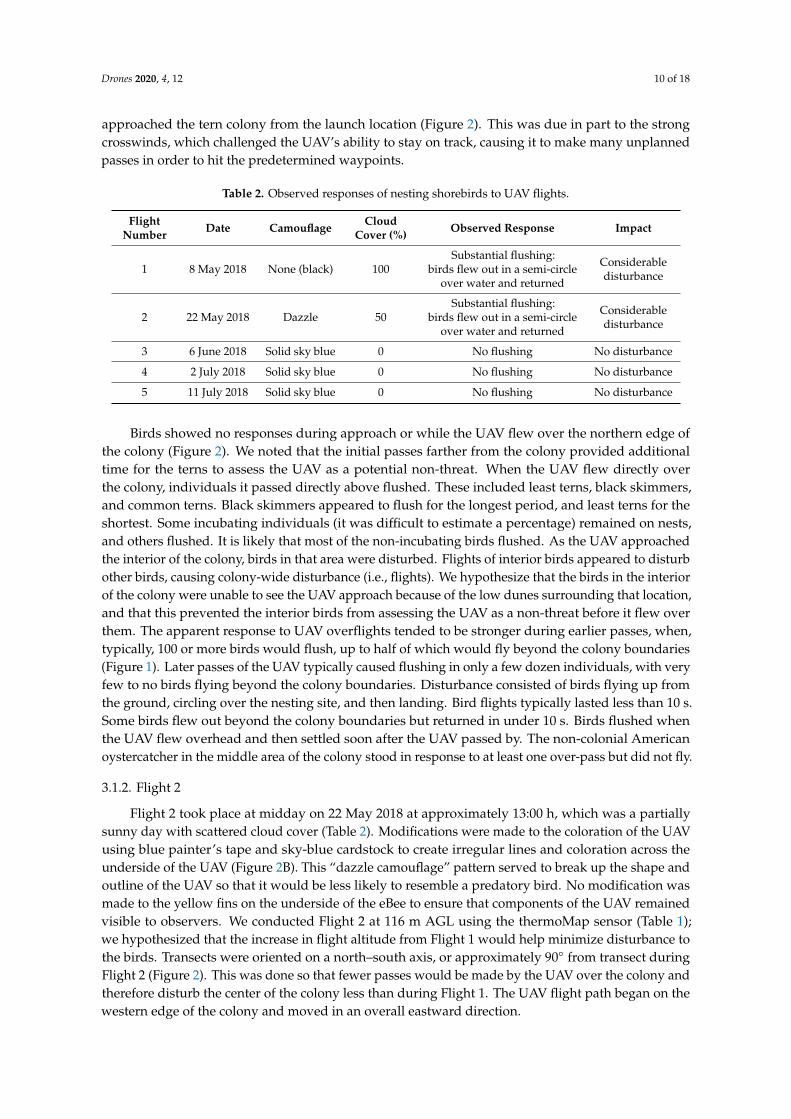
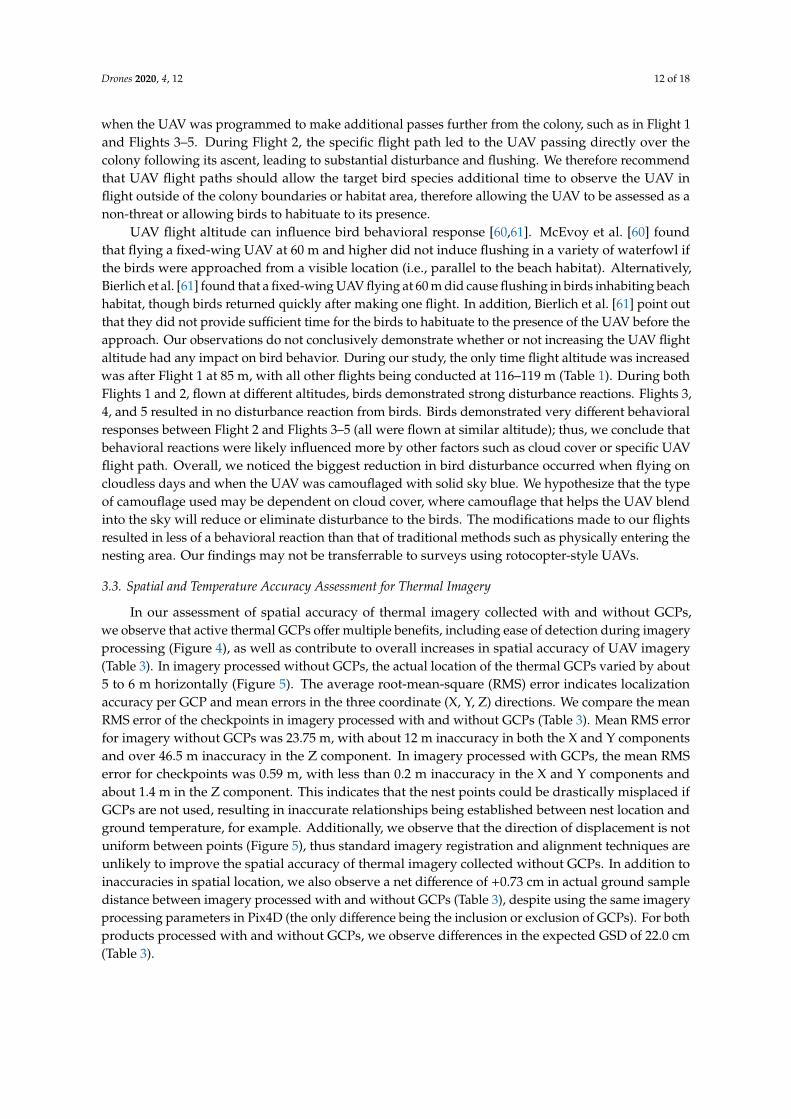
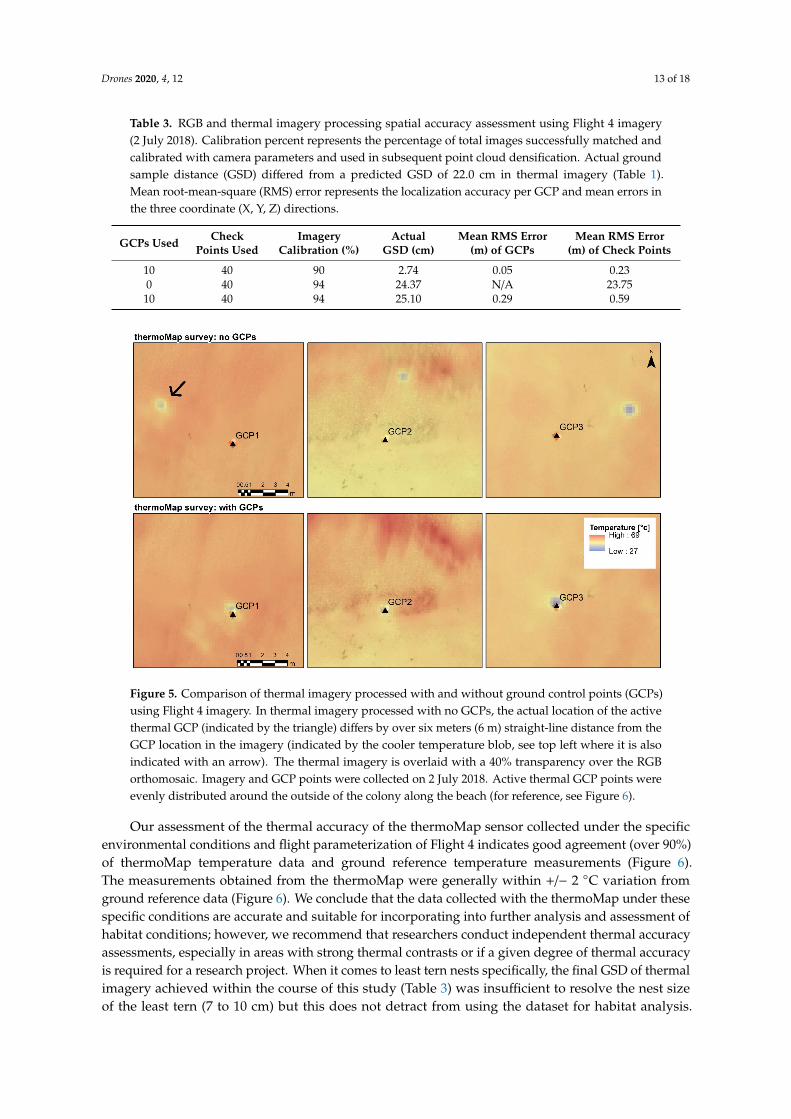
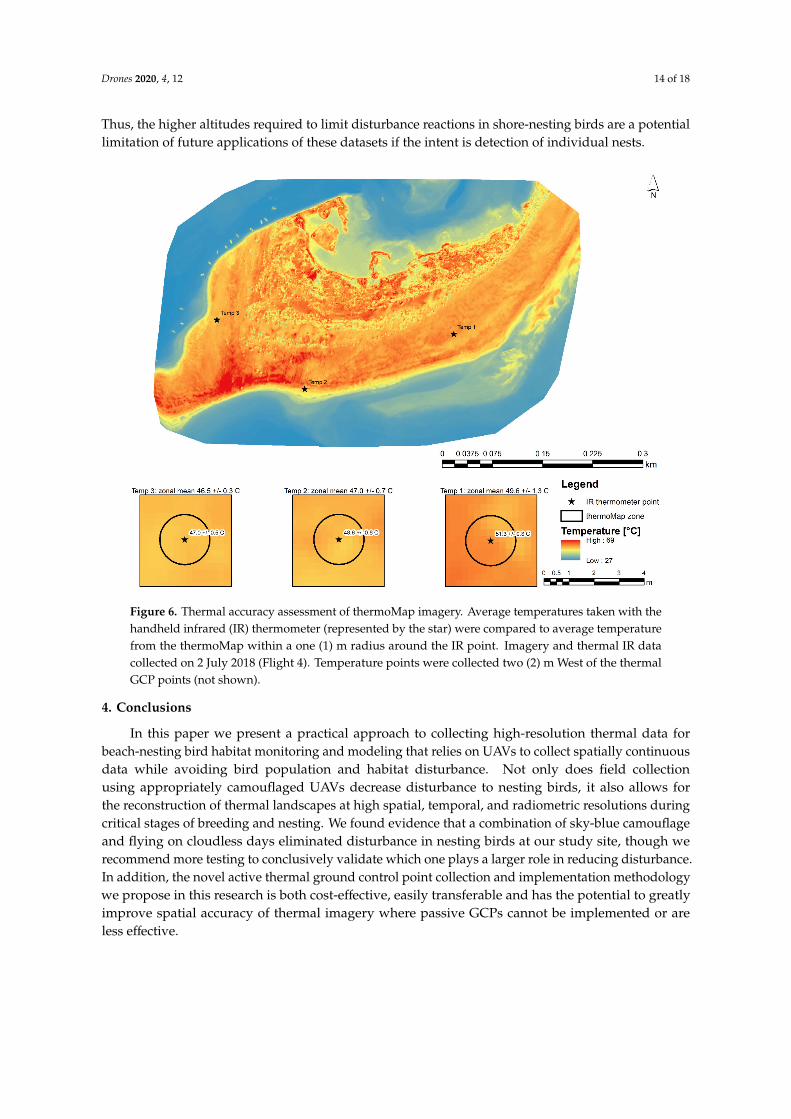


![Cavity-Nesting Bird Habitat and Populations Ponderosa Pine ... · Ponderosa pine forests typically occur at low- to mid-elevations (650-2,000 m [2,100-6,500 ft]), often representing](https://img.dokumen.tips/doc/110x75/5ec4eaa62d6ea64d964e0a3a/cavity-nesting-bird-habitat-and-populations-ponderosa-pine-ponderosa-pine-forests.jpg)