Embed Size (px)
Citation preview

Thermal Imaging and
Surface Turbulence
Characteristics
Tim Price, Vigneshwaran Kulandaivelu, Derek Jensen,
Eric Pardyjak, Sebastian Hoch, H. J. S. Fernando
Mechanical EngineeringEnvironmental Fluid Dynamics Laboratory
This research is supported by the Office of Naval Research Award # N00014-11-1-0709

Table of Contents
• MATERHORN Introduction
• Research Question / Opportunity
• Selected IOP Characteristics
• FLIR Camera and Theory Introduction
• Dataset and averaging techniques
• Video of surface temperature fluctuations
• Spatial and temporal temperature variations
• Sensible heat flux correlations
• Conclusions

Many Scales of MATERHORN

MATERHORN-X Spring Summary

Playa Site Introduction
• Playa at Dugway is a real-world idealized flat plate turbulence experiment (M. Metzger, The near-neutral atmospheric surface layer: Turbulence and non-stationarity, 2007)
• 0.2<zo<0.5mm roughness for 35-140 km (21-87 mi)
• Thermal camera co-located with hotwire-cold wire, tethered balloon, soil sampling, radiation balance, and 30m flux tower
• Near surface flux and turbulence measurements should yield important clues to fundamental physics involved in surface energy balance

Research Question
• Temporal and spatial variations in surface
temperature measured from a thermal camera
correlate directly with atmospheric turbulence at the
surface.
• Better understand small scale surface processes both
temporally and spatially. Linking surface energy
balance with small scale turbulence processes.
• Fishing Expedition…

IOP 9 Conditions
• Moderately strong SW winds, clear
skies
• Selected period: 20:57:22 – 21:17:22
UTC
• L = -4 m to -8.5 m (unstable)
• Avg U mag (0.61 m) = 5.46 m/s

Thermal Imagery Introduction
• FLIR Systems ThermoCAM SC4000 IR Camera
• 320x256 resolution, 20 Hz
• Sensitivity +/- 0.1°C
• Preliminary data: Non-calibrated images, can be post calibrated from radiation measurements
• Absolute temperatures are not as critical as relative sensitivity
• Dataset: 18 hours FLIR video, ~215 GB raw video, ~700 GB MAT files

Theory Introduction
• Semi-Infinite solid thermal conduction problem provides framework for understanding thermal camera signal
• Very near the surface, thermal conductivity in the air and soil interact to determine surface temp
• Thermal admittance difference acts as a weighting factor for the interface temperature
• If thermal admittances and temperatures sufficiently differ, subtle changes in air temperature (turbulence) will be visible in the surface temperature
• Asoil=5314 W m-2 K-1 Aair = 162.17 W m-2 K-1
Soil Air
Cengal and Ghajar, 2005
Asoil Aair

Thermal Image Processing Methods
Camera Perspective Correction
Before Correction After Correction
Image was then transformed into
constant mesh grid for calculations

Image Processing Methods
Temperature
Deviations
• Temperature deviation
calculated by subtracting 20
min pixel mean from each
pixel in each frame
• Full-field de-trending
required for transition
periods
Spatial-Temporal
Correlation
• Correlation is calculated for
each pixel as a function of
Δx and Δy
• This correlation is spatially
averaged, then time
averaged
Reference: A. Garai et al, 2012

Temperature Fluctuation Video
Link to online video: http://youtu.be/s-tLMti_Tmk
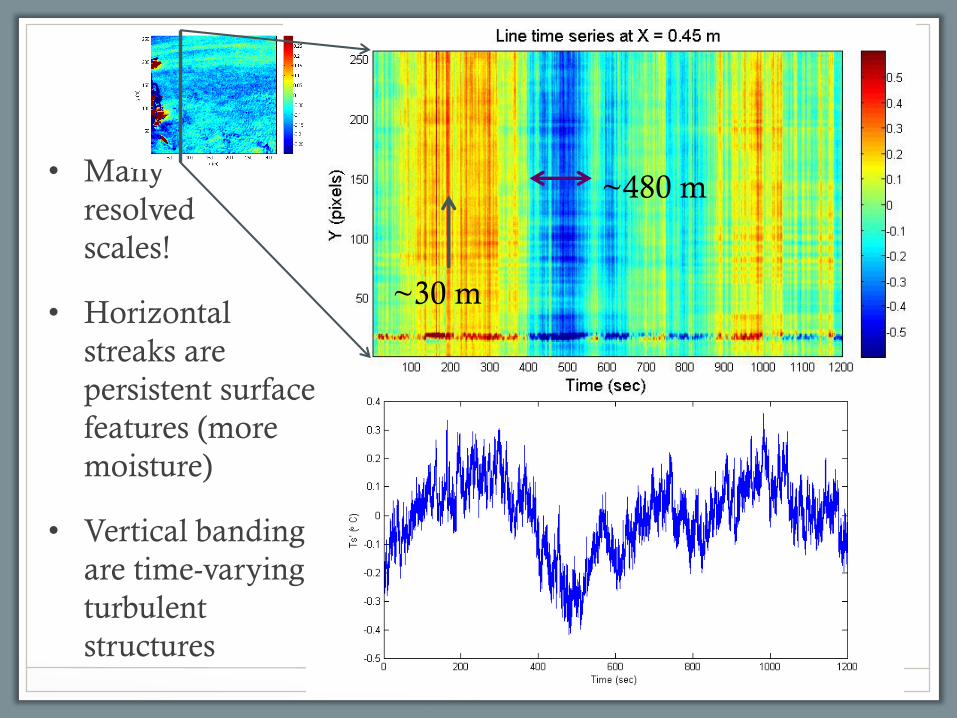
• Many
resolved
scales!
• Horizontal
streaks are
persistent surface
features (more
moisture)
• Vertical banding
are time-varying
turbulent
structures
~480 m
~30 m

• Cooling periods are
associated with high
winds
• Sonic anemometer
(~100 m downwind)
shows obvious
correlations
• Sonic 1 min avg H
shows some trends, but
not as conclusive

Cross correlation with hotwire measured sensible heat flux

25%
L = -5.34 m

25%
L = -4.29 m

Conclusions
• Surface temperature responds measurably to turbulent fluctuations
• Time averaged spatial turbulence structures are elongated in the streamwise direction (see A. Garai et al. 2013)
• Round shapes correspond to unstable convective structures while elongated shapes relate to more neutral conditions
• Correlation with near-surface sensible heat flux demonstrates complex lag, further investigation required…
Future Work
• Process more data from different stability regimes
• Transient conduction model to quantify time lag and other dynamics of FLIR signal

Acknowledgements
• This research is supported by the Office of Naval
Research Award # N00014-11-1-0709
• Many thanks to Holly Oldroyd from EPFL and Prof.
Andreas Christen from UBC for their insight into
surface thermal imagery
• Thank you to Anirban Garai and Jan Kleissl for lens
perspective and statistical approach guidance

References• Metzger, M., McKeon, B. J., & Holmes, H. (2007). The near-neutral atmospheric
surface layer: turbulence and non-stationarity. Philosophical Transactions of the Royal Society A: Mathematical, Physical and Engineering Sciences, 365(1852), 859-876.
• Garai, A., Pardyjak, E., Steeneveld, G. J., & Kleissl, J. (2013). Surface Temperature and Surface-Layer Turbulence in a Convective Boundary Layer.Boundary-Layer Meteorology, 1-22.
Questions?
Tim Price
University of UtahMechanical Engineering
Environmental Fluid Dynamics [email protected]


![THERMAL IMAGING GUIDEBOOK - flirmedia.com · THERMAL IMAGING GUIDEBOOK FOR FACILITIES MAINTENANCE. Table of Contents: 1] How thermal imaging cameras work 2 ... and water intrusion](https://img.dokumen.tips/doc/110x75/5b47a1fc7f8b9a252e8b889b/thermal-imaging-guidebook-thermal-imaging-guidebook-for-facilities-maintenance.jpg)