Embed Size (px)
Citation preview

M. Siman-Tov M. W. Wendel J. R. Haines M. Rogers
Prepared for Presentation at The Second Advanced Reactors Safety Conference (ARS'97)
June 1-4, 1997, Orlando, Florida
Prepared by OAK RIDGE NATIONAL LABORATORY
Oak Ridge, Tennessee 37831-8045 managed by
LOCKHEED MARTIN ENERGY RESEARCH COW. for the
U.S. DEPARTMENT OF ENERGY under contract DE-AC05-960R22464
J
THERMAL-HYDRAULIC ANALYSIS OF THE LIQUID MERCURY TARGET FOR THE NATIONAL SPALLATION NEUTRON SOURCE

DISCLAIMER
This report was prepared as an account of work sponsored by an agency of the United States Government. Neither the United States Government nor any agency thereof, nor any of their employees, make any warranty, express or implied, or assumes any legal liabili- ty or mponsibility for the accuracy, completeness, or usefulness of any information, appa- ratus, product, or process disclosed, or represents that its use would not infringe privately owned rights. Reference herein to any specific commercial product, process, or service by trade name, trademark, manufacturer, or otherwise does not necessarily constitute or imply its endorsement, recommendation, or favoring by the United States Government or any agency thereof. The views and opinions of authors expressed herein do not necessar- ily state or reflect those of the United States Government or any agency thereof.

Portions of this document may be iIiegiile in electronic imnpe products. Images are produced from the best available original docmnent.

THERMAL-HYDRAULIC ANALYSIS OF THE LIQUID MERCURY TARGET FOR THE NATIONAL SPALLATION NEUTRON SOURCE
Moshe Siman-Tov Mark Wendel John Haines Oak Ridge National Laboratory P. 0. Box 2009 Oak Ridge, TN 37830
Oak Ridge National Laboratory P. 0. Box 2008 Oak Ridge, TN 37830
Oak Ridge National Laboratory P. 0. Box 2009 Oak Ridge, TN 37830
(423) 574-65 15 (423) 574-2825 (423) 574-0966
Martin Rogers Oak Ridge National Laboratory P. 0. Box 2009 Oak Ridge, TN 37830
ABSTRACT
The National Spallation Neutron Source (NSNS) is a high-energy, accelerator-based spallation neutron source being designed by a multi-laboratory team led by Oak Ridge National Laboratory (ORNL) to achieve very high fluxes of neutrons for scientific experiments. The NSNS is proposed to have a 1 MW beam of high-energy (-1 GeV) protons upgradable to 5 MW and operating at 60 Hz with a pulse duration of 0.5 ps. Peak steady-state power density in the target is about 640 MW/m3 for I MW, whereas the pulse instantaneous peak power density is as high as 22,000 GW/m3. The local peak temperature rise for a single pulse over it’s the-averaged value is only 6°C but the rate of this temperature rise during the pulse is extremely fast (-12 million ‘CIS). In addition to the resulting thermal shock and materials compatibility concerns, key feasibility issues for the target are related to its thermal-hydraulic performance. These include proper flow distribution, flow reversals and stagnation zones, possible “hot spots”, cooling of the beam “window”, and the challenge of mitigating the effects of thermal shock through possible injection of helium bubbles.
An analytic approach was used on the PC spreadsheet EXCEL to evaluate target design options and to determine the global T/H parameters in the current concept. The general computational fluid dynamics (CFD) code CFX was used to simulate the detailed time-averaged two-dimensional thermal and flow distributions in the liquid mercury. In this paper, an overview of the project and the results of this preliminary work are presented. Heat transfer
characteristics of liquid mercury under wetting and non- wetting conditions are discussed, and future directions of the program in T/H analysis and R&D are outlined.
I. INTRODUCTION
The National Spallation Neutron Source (NSNS) is a high-power, accelerator-based spallation neutron source being designed by a multi-laboratory team led by Oak Ridge National Laboratory (ORNL) to achieve very high fluxes of neutrons for scientific experiments. The NSNS is proposed to have a 1 M w beam of high-energy (-1 GeV) protons upgradable to 5 MW and operating at 60 Hz with a pulse duration of 0.5 ps. About 60% of the proton beam power is deposited in a target based on a flowing liquid mercury, a new concept for spallation targets. The liquid mercury in the target simultaneously serves as the target spallation medium and transports away the heat deposited within it to cool the target structure. Mercury was selected as the liquid target material because of its heat transport and neutronic advantages (Gabriel, et al., 1996). The target design configuration, shown in Figure 1, has a width of 400 mm, a height of 100 mm, and a length of 650 mm for a total volume of about 20 L. The mercury is contained within a structure made from 316-type stainless steel. Mercury enters from the side of the target firthest from the incoming proton beam, flows along a 206 mm x 80 rnm rectangular passage in the middle of the target to the front of the target, and returns back through the two side channels. The target window, the portion of the target structure in the direct path of the proton beam, is cooled by mercury which flows through a separate cooling jacket that wraps around the target lengthwise. In this way, the window cooling and
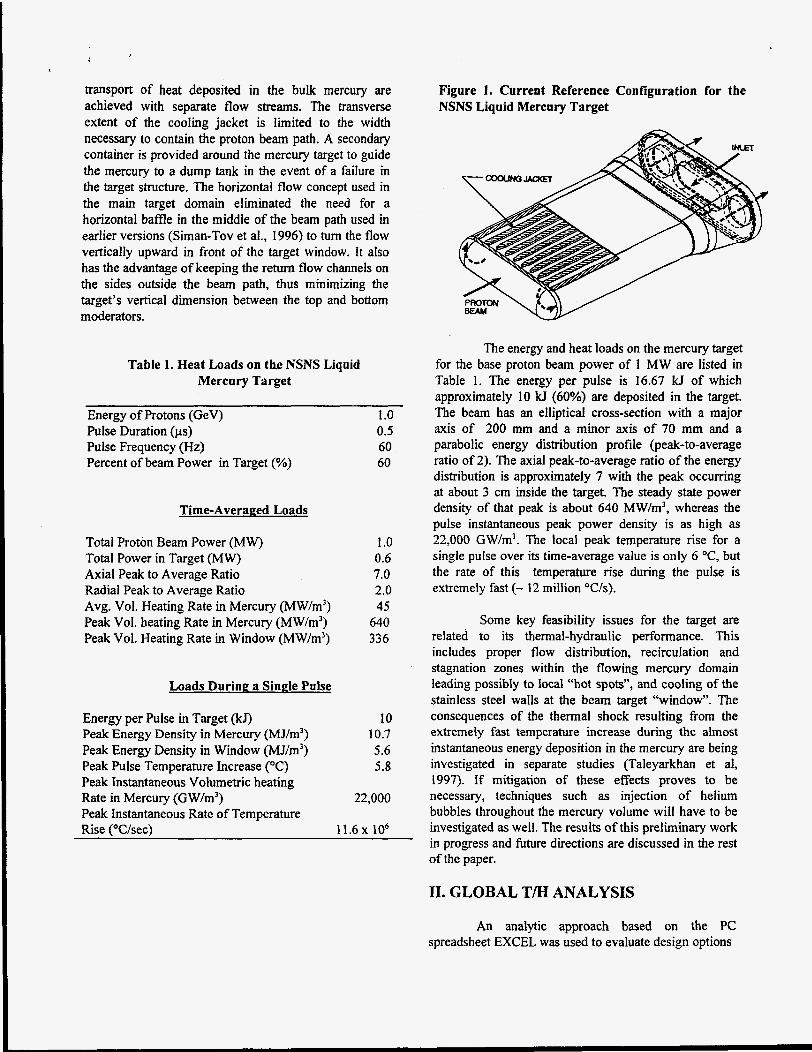
transport of heat deposited in the bulk mercury are achieved with separate flow streams. The transverse extent of the cooling jacket is limited to the width necessary to contain the proton beam path. A secondary container is provided around the mercury target to guide the mercury to a dump tank in the event of a failure in the target structure. The horizontal flow concept used in the main target domain eliminated the need for a horizontal baffle in the middle of the beam path used in earlier versions (Siman-Tov et al., 1996) to turn the flow vertically upward in front of the target window. It also has the advantage of keeping the return flow channels on the sides outside the beam path, thus minimizing the target's vertical dimension between the top and bottom moderators.
Table 1. Heat Loads on the NSNS Liquid Mercury Target
Energy of Protons (GeV) 1 .o Pulse Duration (ps) 0.5 Pulse Frequency (Hz) 60 Percent of beam Power in Target (YO) 60
Time-Averaped Loads
Total Proton Beam Power (MW) Total Power in Target (MW) Axial Peak to Average Ratio Radial Peak to Average Ratio Avg. Vol. Heating Rate in Mercury (MW/m3) Peak Vol. heating Rate in Mercury (MW/m3) Peak Vol. Heating Rate in Window (MW/m3)
Loads During a Sinde Pulse
I .o 0.6 7.0 2.0 45
640 336
Energy per Pulse in Target (kJ) Peak Energy Density in Mercury (MJ/m3) Peak Energy Density in Window (MJ/m3) Peak Pulse Temperature Increase ("C) Peak Instantaneous Volumetric heating Rate in Mercury (GW/m3) Peak Instantaneous Rate of Temperature Rise ("C/sec)
10 10.7 5.6 5.8
22,000
Figure 1. Current Reference Configuration for the NSNS Liquid Mercury Target
The energy and heat loads on the mercury target for the base proton beam power of 1 MW are listed in Table 1. The energy per pulse is 16.67 kJ of which approximately 10 kJ (60%) are deposited in the target. The beam has an elliptical cross-section with a major axis of 200 mm and a minor axis of 70 mm and a parabolic energy distribution profile (peak-to-average ratio of 2). The axial peak-to-average ratio of the energy distribution is approximately 7 with the peak occurring at about 3 cm inside the target. The steady state power density of that peak is about 640 MW/m3, whereas the pulse instantaneous peak power density is as high as 22,000 GW/m3. The local peak temperature rise for a single pulse over its time-average value is only 6 "C, but the rate of this temperature rise during the pulse is extremely fast (- 12 million "C/s).
Some key feasibility issues for the target are related to its thermal-hydraulic performance. This includes proper flow distribution, recirculation and stagnation zones within the flowing mercury domain leading possibly to local "hot spots", and cooling of the stainless steel walls at the beam target "window77. The consequences of the thermal shock resulting from the extremely fast temperature increase during the almost instantaneous energy deposition in the mercury are being investigated in separate studies (Taleyarkhan et ai, 1997). If mitigation of these effects proves to be necessary, techniques such as injection of helium bubbles throughout the mercury volume will have to be investigated as well. The results of this preliminary work in progress and future directions are discussed in the rest of the paper.
1 1 . 6 ~ lo6
11. GLOBAL T/H ANALYSIS
An analytic approach based on the PC spreadsheet EXCEL was used to evaluate design options
and to determine the global T/H parameters in the current concept, whereas the general computational fluid dynamics (CFD) code CFX (AEA Technology, 1995) was used to simulate the detailed time-averaged thermal and flow distribution in the liquid mercury. In the global system analysis, the overall pressure drop, average mercury temperatures along the flow, and maximum temperatures at the beam window walls were estimated for both the target main flow area and the external cooling jacket.
A. Reference Design Parameters
Nominal design parameters used for these studies are summarized in Table 2. The inlet pressure and temperature, which are common for both the main flow and the cooling jacket, were set at 0.3 MPa and 80 “C, respectively, An average temperature increase of 30 “C was set for the primary mercury flow and a nominal velocity of 2 m/s for the mercury flow at the entrance of the cooling jacket. This provides an outlet temperature of
Table 2. NSNS Liquid Mercury Target Reference
Bulk Mercury Flow Domain
Cooling Jacket Configuration Double Wall Duplex Structure
Coolant Mercury WindowNessel Material Stainless Steel-3 16 Wall Thickness (except window) (mm) 3.0 Mass Flow (kgh) 116 Avg. Inlet Velocity ( d s ) 0.66 Reynolds Number at Inlet Channel 7.73Et05 Peclet Number at Inlet Channel 1.42Ei-04 Nusselt Number at Inlet Channel 24 Heat Transfer coefficient (W/m2K) 2,050 Avg. Outlet Velocity ( d s ) 0.71 Reynolds Number at Exit Channel 6.94E+05 Peclet Number at Exit Channel 1.28EH4
I .9 Inlet Temperature (“C) 80
Peak Mercury Temperature (“C) [Updated CFD] 204 Inlet Pressure (MPa) 0.3 Outlet Pressure (MPa) 0.28
Max. Velocity in Mercury ( d s ) [Updated CFD]
Outlet Temperature (“C) 110
Theoretical Pumping Power (kW) 0.2
Target Window (cooling jacket)
Number of Subchannels (top and bottom) Jacket Coolant Wall Thickness (mm) WindowNessel material Mass Flow (kg/s) Avg. Inlet Velocity (ds)
7 Mercury
1.5 Stainless-Steel-3 16
28 2.0
Reynolds Number Peclet Number Nusselt Number Heat Transfer Coefficient (W/rn2K) Avg. Outlet Velocity ( d s ) Inlet Temperature (“C) Outlet Temperature (“C) Inlet Pressure (Mpa) Outlet Pressure (Mpa) Theoretical Pumping Power (kW) Peak SS VHG in Stainless
AT Across the outer SS Wall (“C) Max. Interface Temp. on outer wall (“C) Max Temp. Inside the outer wall (“C) Max. Interface Temp. on inner wall (“C) Max. Temp. Inside the inner Wall (“C)
Steel Front Wall (MW/rn3)
1.97EM5 3.638+03
14.5 14,610
2.0 80
109 0.3
0.12 0.37
336 26
135 162 140 174
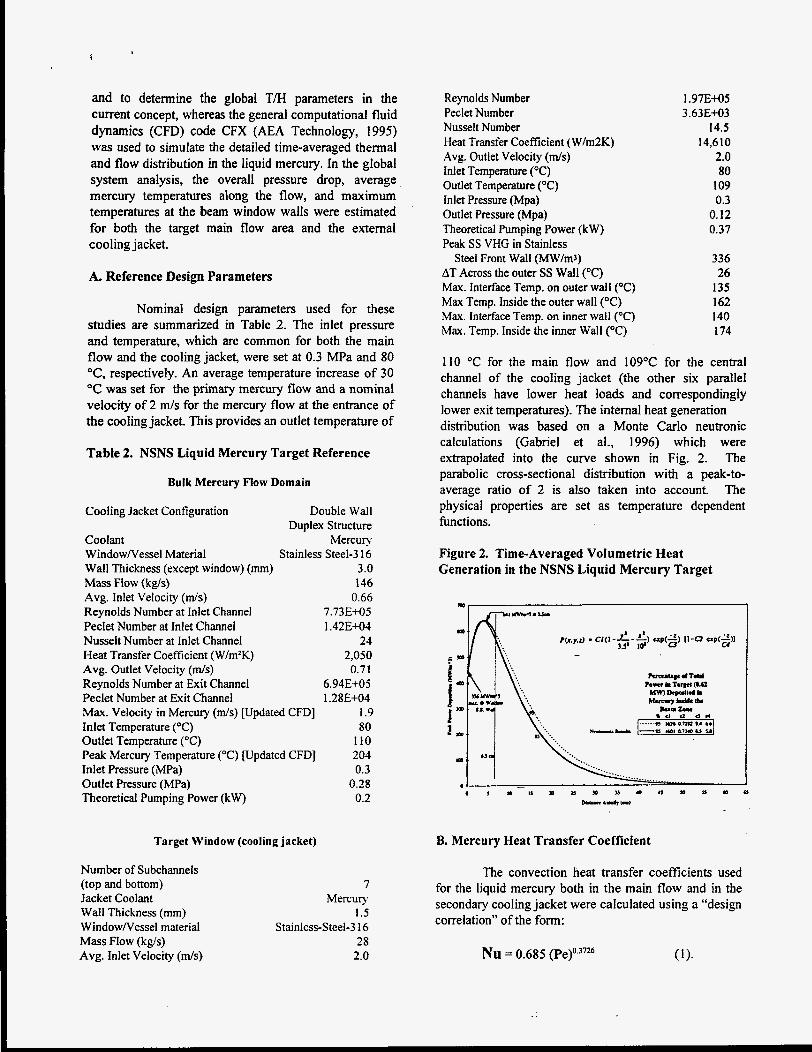
110 “C for the main flow and 109°C for the central channel of the cooling jacket (the other six parallel channels have lower heat loads and correspondingly lower exit temperatures). The internal heat generation distribution was based on a Monte Carlo neutronic calculations (Gabriel et al., 1996) which were extrapolated into the curve shown in Fig. 2. The parabolic cross-sectional distribution with a peak-to- average ratio of 2 is also taken into account. The physical properties are set as temperature dependent functions.
Figure 2. Time-Averaged Volumetric Heat Generation in the NSNS Liquid Mercury Target
B. Mercury Heat Transfer Coefficient
The convection heat transfer coefficients used for the liquid mercury both in the main flow and in the secondary cooling jacket were calculated using a “design correlation” of the form:
Nu = 0.685 (pe)o.3n6
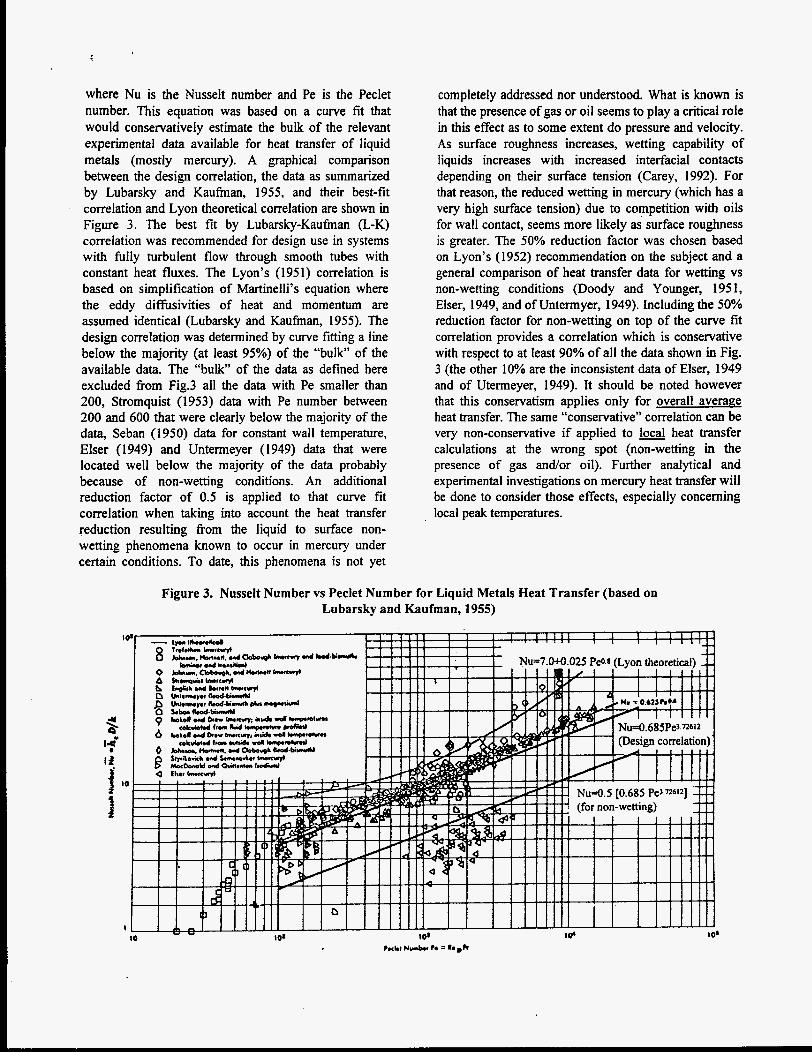
where Nu is the Nusselt number and Pe is the Peclet number. This equation was based on a curve fit that would conservatively estimate the bulk of the relevant experimental data available for heat transfer of liquid metals (mostly mercury). A graphical comparison between the design correlation, the data as summarized by Lubarsky and Kaufman, 1955, and their best-fit correlation and Lyon theoretical correlation are shown in Figure 3. The best fit by Lubarsky-Kaufman (L-K) correlation was recommended for design use in systems with fully turbulent flow through smooth tubes with constant heat fluxes. The Lyon’s (1951) correlation is based on simplification of Martinelli’s equation where the eddy difisivities of heat and momentum are assumed identical (Lubarsky and Kaufman, 1955). The design correlation was determined by curve fitting a line below the majority (at least 95%) of the “bulk” of the available data The “bulk” of the data as defined here excluded from Fig.3 all the data with Pe smaller than 200, Stromquist (1953) data with Pe number between 200 and 600 that were clearly below the majority of the data, Seban (1950) data for constant wall temperature, Elser (1949) and Untermeyer (1949) data that were located well below the majority of the data probably because of non-wetting conditions. An additional reduction factor of 0.5 is applied to that curve fit correlation when taking into account the heat transfer reduction resulting from the liquid to surface non- wetting phenomena known to occur in mercury under certain conditions. To date, this phenomena is not yet
completely addressed nor understood. What is known is that the presence of gas or oil seems to play a critical role in this effect as to some extent do pressure and velocity. As surface roughness increases, wetting capability of liquids increases with increased interfacial contacts depending on their surface tension (Carey, 1992). For that reason, the reduced wetting in mercury (which has a very high surface tension) due to competition with oils for wall contact, seems more likely as surface roughness is greater. The 50% reduction factor was chosen based on Lyon’s (1952) recommendation on the subject and a general comparison of heat transfer data for wetting vs non-wetting conditions (Doody and Younger, 195 1, Elser, 1949, and of Untermyer, 1949). Including the 50% reduction factor for non-wetting on top of the curve fit correlation provides a correlation which is conservative with respect to at least 90% of all the data shown in Fig. 3 (the other 10% are the inconsistent data of Elser, 1949 and of Utermeyer, 1949). It should be noted however that this conservatism applies only for overall average heat transfer. The same “conservative” correlation can be very non-conservative if applied to heat transfer calculations at the wrong spot (non-wetting in the presence of gas and/or oil). Further analytical and experimental investigations on mercury heat transfer will be done to consider those effects, especially concerning local peak temperatures.
Figure 3. Nusseit Number vs Peclet Number for Liquid Metals Heat Transfer (based on Lubarsky and Kaufman, 1955)

t
C. Pressure Drops
The pressure drop calculations performed for the target main flow and cooling jacket were conservatively based on maximum values of coefficients or representative equations from experimental results (Blevins, 1984; Idelchik, 1994). For the inlet and outlet form losses , maximum form coefficients values of 0.5 and 1.0 were chosen, respectively. For the horizontal viscous losses in the inlet channel of the main flow, an experimental friction factor for rectangular geometry was used (Idelchik, 1994). In the outlet channel, the horizontal viscous losses were based on an extrapolated friction factor from experimental results and the cross- sectional area ratios of the geometries involved (Blevins, 1984). The equivalent diameter, defined in Blevins (1984) as a corrected hydraulic diameter for non-circular flow areas, was used in place of the hydraulic diameter. This decision was made based on the low Prandtl number of mercury (conduction through the liquid metal being more relevant), the non-circularity of the inlet channel, and the non-uniformity of the outlet channels (Blevins, 1984 and Kakac, 1995). In the outlet channels, an extrapolation technique was used to define the equivalent diameter based on the percentage of cross- sectional area occupied by the various types of geometries (Blevins, 1984). The pressure drop from mixing and directional change occurring in the 180' turn from inlet channel to outlet channel, was calculated from available experimental data for similar geometry and flow direction (Idelchik, 1994). The optimum internal dimensions (not shown in Fig.1) were assumed for the 180" turn calculations, resulting in minimum possible pressure drop. The design .alterations necessary in the
. . . . . . . . . . . . . . . . . . . . . . . . . :p;oron -&wl . . . . . . . . . . . . . . . . . . . . . . . . . . . . . .
target to yield this situation will be considered in future configurations.
In the cooling jacket, the friction factor for the horizontal viscous losses was based on an approximation of the Moody Plot (Blevins, 1984). The loss coefficient for the front wall was based on a characteristic equation for directional changes and includes the potential energy losses due to height change (Crane Co., 1988).
D. Window Cooling
Cooling of the target window, i.e. the portion of the target structure in the direct path of the proton beam, is very critical since the intensity of the energy deposition at the center of the beam is the highest. The window is cooled by mercury which flows through the cooling jacket, a passage formed between two walls of a duplex structure. In this way, the window cooling and the transport of heat deposited in the bulk mercury are achieved with two separate flow streams. This approach is judged to be more reliable and efficient (minimal pressure drop and pumping power) than depending on the bulk mercury to cool the window. The secondary container itself is filled with non-flowing helium and is externally water-cooled. The sequence of metallic walls and cooling mediums in the target window along the beam centerline path and the related temperatures are shown in Fig. 4. Conduction heat transfer equations for one-dimensional walls, cooled asymmetrically on both sides (different heat transfer coefficients different boundary temperatures), were developed and included in the analysis.
Figure 4. NSNS Target Window Configuration
5 lOO(Hg) 140 174T
L -.- A

E. Results of Global Analysis 111. DETAILED CFD AI' 'SIS
The results of the system T/H calculations are summarized in Table 2. The mercury mass flow rate in the main target is 146 kg/s and the total mass flow rate in the cooling jacket mercury is 28 kg/s. The average velocity in the central inlet is approximately 0.66 m/s and 0.71 m / s in the two returning side channels. The pressure drop across the main flow is only 17.2 Wa, resulting in an exit pressure of -0.28 MPa. The pressure drop in the cooling jacket is much larger, about 180 kPa, resulting in an exit pressure of 0.12 MPa. The pumping power is only 0.2 kW in the main flow and about 0.37 kW in the cooling jacket. These pressure drops and pumping powers are for the target itself and must be added to the frictional losses and pumping powers in the remaining portions of their respective loops.
Based on average mercury bulk temperature of 95 "C in the main flow near the window, the maximum temperature in the target window walls occurs at the safety shroud side of the stainless steel wall between the cooling jacket (mercury at 100 "C) and the safety shroud, and is calculated to be 162°C. The corresponding peak wall interface temperature is 135 "C, occurring at the same location but on the cooling jacket mercury side (Fig. 4). However, recognizing that on a level, the main mercury flow ''bulk" temperature could be as high as 204 "C (from updated CFD analysis of the main flow) rather than the 95 "C average, it is realized that the main mercury flow may locally heat up the window wall at that location rather than cool it. In this case, the maximum temperature in the target window walls is higher (1 74 "C) and occurs at the opposing wall on the main mercury flow side, The corresponding wall interface temperature is 140 "C, occurring at the same location but on the cooling jacket mercury side (Fig.4).
The possibility of using helium as the cooling medium for the cooling jacket was also considered, resulting in a peak wall temperature of 321 OC at the exterior wall of the cooling jacket, assuming a helium velocity of 50 m/s. Both the velocity and the resulting wall temperature were considered too high and that option was dropped. Consideration was also given to non-wetting conditions. Even if complete thermal non- wetting occurs at the beam window wall in the main mercury flow side, the maximum steady state wall temperature will still be about 162°C (the same as in the exterior wall of the cooling jacket). However, thermal wetting of mercury in the cooling jacket will be necessary to maintain proper cooling. Studies are currently underway for other possible scenarios related to non-wetting (see the section on uncertainties).
The general-purpose CFD code CFX 4.1 (AEA Technology Inc., 1995), which uses a finite-volume, pressure-correction method, was used to simulate the incompressible, time-averaged, two-dimensional temperature and velocity distributions in the current concept of the liquid mercury target. The flow is already time-averaged in the model (as in all current CFD models) with regard to turbulent fluctuations about a mean flow. The additional level of averaging is accomplished by spreading the pulse energy evenly throughout the entire pulse period of 0.01667 s, allowing the simulation to be performed as a steady state. The steady-state solution should provide a reasonable estimate for the overall flow pattern and temperature distribution within the target enclosure because of the relatively small additional time-dependent temperature increase (-6°C) during the pulse itself ( 0 . 5 ~ ~ ) . Also of concern, but not included in the present work, are transient effects which occur on the microsecond time scale (thermal shock). Those effects may impact the target flow performance and will be analyzed at a later stage based on results fiom the thermal shock analysis being performed separately (Taleyarkhan et al, 1997).
A. The CFD Model \
The CFD simulations reported here were performed on a number of earlier versions of the target configuration that led to the current NSNS specific design described earlier (Fig.1). It is expected that the CFD results (especially flow distribution) for this latest design will not be substantially different. Nevertheless, that difference in configuration and the lower local peak energy depositions should be kept in mind when comparing the CFD results with those of the global analytic calculations (Table 2). The computational domain for the simulated target design is shown in Fig. 5 through a central horizontal cross-section view. Because of symmetry in the geometry, only one-half of the target was simulated. The correct (within 3%) cross-sectional flow area was applied to both channels by specifying a channel depth of 0.0823m. The two-dimensional approximation neglects the curvature and narrowing of the outer semicircular channels near the periphery for which a 3-D model is required. The model includes solid conducting regions that represent the stainless steel target walls and internal baffles. Straight I-m entrance and exit lengths are included in the model to establish fully developed flow, but they are not shown in Fig. 5
A renormalization-group isotropic, two- equation turbulence model provided by CFX is used in
combination with the standard law-of-the-wall boundary condition for imposing wall heat fluxes in the energy equation and shear stresses in the momentum equations. The boundary conditions include no-slip at the walls and specified pressure at the inlet and outlet boundaries to achieve a given flow. The density was assumed to be constant, but the viscosity and thermal conductivity were allowed to vary with temperature. The temperature variation of the viscosity was included only for its impact in the law-of-the-wall formulation (outside the boundary layer, the eddy viscosity dominates); however, the variation had very little significance in the results. With a liquid metal such as mercury, the temperature gradient (and corresponding property variation) near the wall is much less severe because of high thermal conductivity and low Prandtl number.
Four CFD simulations were performed in a progression toward a more efficient target design. The first two simulations use the basic design to determine the best flow direction. Since the mercury flow could enter the target through either the center rectangular channel or through the two side channels. The last two simulations assess possible design changes to improve the target performance. All four simulations assumed an inlet temperature of 80°C and total heat loading of 0.6 MW, corresponding to the I-MW proton beam. The internal heat generation distribution is based on neutronics calculations performed for an earlier design (Gabriel et al., 1996). Volumetric heat deposition (VHG)
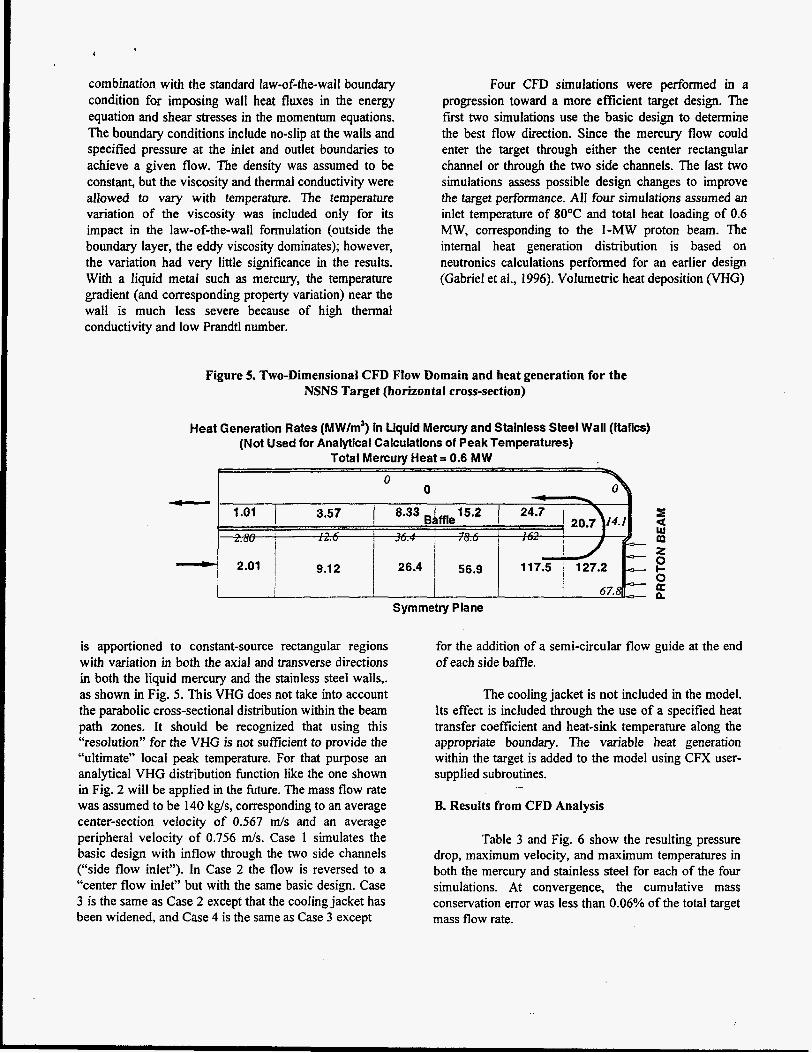
Figure 5. Two-Dimensional CFD Flow Domain and heat generation for the NSNS Target (horizontal cross-section)
Heat Generation Rates (MWlm’) in Liquid Mercury and Stainless Steel Wall (Italics) (Not Used for Analytical Calculations of Peak Temperatures)
Total Mercury Heat = 0.6 MW
2
0 a n
e Symmetry Plane
is apportioned to constant-source rectangular regions with variation in both the axial and transverse directions in both the liquid mercury and the stainless steel walls,. as shown in Fig. 5. This VHG does not take into account the parabolic cross-sectional distribution within the beam path zones. It should be recognized that using this “resolution” for the VHG is not sufficient to provide the “ultimate” local peak temperature. For that purpose an analytical VHG distribution hnction like the one shown in Fig. 2 will be applied in the future. The mass flow rate was assumed to be 140 kg/s, corresponding to an average center-section velocity of 0.567 m / s and an average peripheral velocity of 0.756 m/s. Case 1 simulates the basic design with inflow through the two side channels (“side flow inlet”). In Case 2 the flow is reversed to a “center flow inlet” but with the same basic design. Case 3 is the same as Case 2 except that the cooling jacket has been widened, and Case 4 is the same as Case 3 except
for the addition of a semi-circular flow guide at the end of each side baffle.
The cooling jacket is not included in the model. Its effect is included through the use of a specified heat transfer coefficient and heat-sink temperature along the appropriate boundary. The variable heat generation within the target is added to the model using CFX user- supplied subroutines.
B. Results from CFD Analysis -
Table 3 and Fig. 6 show the resulting pressure drop, maximum velocity, and maximum temperatures in both the mercury and stainless steel for each of the four simulations. At convergence, the cumulative mass conservation error was less than 0.06% of the total target mass flow rate.

Table 3. Key results for four CFD simulated cases.
*Results should not be directly compared with results in Table 2 because of differences in configuration and peak energy depositions Case I Description I Irreversible Pressure1 Maximum Fluid I Maximum Fluid I Maximum Stainless Steel I I Loss I Speed I Temperature I Temperature
(Pa) (m/s) (“C) (“C) -- 1 Side flow inlet 9222 1.73 192 I70 2 Center flow inlet 7962 1.78 172 I72 3 Center flow inlet with 8029 1.79 I57 157
extended jacket
with extended jacket and flow guides
4 Center flow inlet 1768 1.53 147 151
The simulation of the first case with the “side flow inlet” shows a large recirculation zone downstream of the flow baffle around which the liquid mercury makes the U-turn (Fig. 6, case 1). This large zone obstructs about one-half of the cross-sectional area in the central rectangular channel. Two smaller stagnation zones are also predicted in the comers of the target volume and near the stagnation point on the center line. The recirculating flow contributes to higher pressure drops in the target and elevated local temperatures resulting from higher local residence time of the fluid. The problem is compounded because the location of the large recirculation zone lies directly in the beam path.
In the simulation of the “center flow inlet” (Case 2) the flow direction was reversed. In this case, the recirculation zones moved outside of the beam path (where neutronic heating is much lower) and got somewhat smaller, as shown in Fig. 6, Case 2. As a. result, the peak mercury temperatures decreased by about 20 “C. A second advantage to using the center flow direction is that the pressure drop is predicted to be lower by 14%. Fig. 6, Case 2 shows that a substantial recirculation zone exists downstream from and near the comer of the cooling jacket. The reduced flow in the comer next to the jacket is close to a zone of high heat generation in the beam path, such that the temperatures in the stainless steel wall are somewhat elevated near the comer, as is shown in Table 3.
In the third simulation, the cooling jacket was extended in the transverse direction so that the comer was well outside the beam path. As shown in Table 3 and Fig. 6, case 3, this modification to the design resulted in dropping the mercury and stainless steel temperatures by 1S0C, in spite of the time-averaged stagnation zone in the center of the target.
To further reduce recirculation zones and the pressure drop in the target, the addition of internal flow guides around the baffles was investigated. The thin-walled U- shaped flow guide reinforces the steamline turns and reduces separation of streamlines behind the flow baffle. Results shown in Fig. 6, case 4, and Table 3 indicate a considerable reduction in pressure drop (to less than a fourth) and an additional 10°C reduction in the maximum fluid temperature, The recirculation zone behind the flow baffle has been reduced considerably.
In spite of the clear advantages of using flow guides in the fourth case, the third case configuration was selected as a basis for the current NSNS target reference design to avoid the presence of additional metallic wails in the beam cross section path and considering that the recirculation zones in Case 3 are basically outside of the beam path. It should be noted that the indicated recirculation and stagnation zones are not in reality regions of zero flow velocity, but rather regions of flow where, because of the general turbulence in the mercury flow, the local velocity fluctuates about a zero time-averaged value. Even so, the peak temperature of 157°C for this “hot spot” stagnation zone shown for Case 3 in Table 3 and the close-up of Fig. 7, (subject to the limited resolution of VHG distribution shown in Fig. 5 ) is quite manageable. The flow distribution for Case 3 shows relatively smooth streamlines with time-averaged peak velocities in the target not exceeding 1.8 m/s. The pressure drop and the size of the recirculation zones for Case 3 can be further reduced, if necessary, by at least a factor of four by adding the flow guides as indicated for Case 4.

Cue 3: 8.uliw Dab. wllh Fbr ImW a1 tW Cnler Ckaaaol
3 .. y
Figure 6. Streamline Distributions from four cases of CFD Simulations
SPEED (mls) , 1.8 mls Max. Speed
ki 8 2
. . . . . . . . . . . . . . . .. . . -. .. . .. .. . .... 0.6.. . . . . . . . . .
3TREAMLINES
.. . - . __
ISOTHERMS ("C) 1 157 "C Maximum Temperature
Figure 7. Details of Streamlines, Speedlines, and isotherms for the Adopted Third Case.

J
I1 UNCERTAINTIES AND FUTURE R&D
The T/H results for the target reported above are subject to major variations because of the many uncertainties due to the early stage of the project. Uncertainties can be grouped into a number of categories: general assumptions, operating conditions, physical correlations, failure scenarios, modeling capabilities, and model uncertainties. Of major concern is the uncertainty in proton beam energy deposition (including its positioning, size, shape and distribution, all of which are still subject to change) which cannot be resolved before further defmition of the project parameters is made. Another major concern is the effect of mercury non-wetting on the effectiveness of liquid mercury heat transfer as discussed earlier. Additional separate analytical and experimental studies are in progress in this area.
The model’s sensitivity to its grid discretization was also evaluated (Wendel and Siman-Tov, 1997). Refming the fmite volume discretization of the model by a factor of four resulted in a 2.3% change in total pressure drop, 0.6% change in maximum velocity, and about 1°C change in the maximum liquid mercury temperature. This comparison indicates that the original discretization was adequate for predicting the two- dimensional flow field.
The wall heat transfer and shear stress boundary conditions are particularly important to the key results of the target simulations. For this reason, assessments were made of the capability of the CFX code to predict correctly forced convective turbulent heat transfer and total pressure drop by comparing the CFD predictions to corresponding empirical correlations and available data (Wendel and Siman-Tov, 1997). The CFD Nu numbers for an axisymmetric circular pipe with a diameter of 0.01 m and a length of 0.50 m were 5-25% higher than the Lyon-Martinelli theoretical correlation (Lyon, 1949). At a Peclet number of 12,000, corresponding to the actual target flow and temperature difference, the computed Nusselt number is only 5% higher than the theoretical prediction. There is therefore a reasonable agreement between the CFX results and the theory, but both overpredict the measured Nusselt numbers. This is an expected result, because the experiments include, as discussed above, effects not accounted for in the governing equations of continuum mass, momentum, and energy conservation on which CFX is based (e.g. impurities in the liquid metal, nonuniform wall effects, and the well-known non-wetting characteristics of mercury discussed earlier).
The second check on the computed results involves the calculation of the total pressure drop based on empirically derived loss coeficients as provided by Idelchik (1994) for a similar but not identical configurations. The CFX results underpredict the pressure drop by about 30%. Part of this discrepancy can be attributed to three-dimensional effects that are not modeled, uncertainty in the turbulence model used, and lack of exact dimensions for the configuration used in the correlation reported by Idelchik (Wendel and Siman- Tov, 1997).
As indicated, the analyses performed so far were restricted in their objectives. Future T/H analysis and R&D will expand on this work to include the following:
(1). Detailed 3-D CFD simulation of the target cooling jacket using a single central channel which has the highest energy deposition. This work will allow investigation of potential recirculation and “stagnation” zones, velocity and temperature distributions, pressure drops, and cooling of the beam target window.
(2). Detailed 3-D CFD of the whole target integrated with the multi-channel cooling jacket. This model will allow investigation of eddies, recirculation and “stagnation” zones in the main mercury flow domain near the semicircular cylindrical channels and the two quarter-spherical corners connecting them. These 3-D corner effects could not be represented in the 2-D CFD simulations described earlier.
(3). Effects of thermal non-wetting on mercury heat transfer and pressure drop both analytically and experimentally. This will include overall effect (average heat transfer coefficient), localized effects (which depend on the phenomena’s characteristics such as size, shape, distribution, fluctuations frequency, etc.), effects of temperature, pressure and velocity, and effects of impurities in the mercury (gases, magnesium, sodium, titanium).
(4). Transient CFD simulation of the actual real-time pulsed energy deposition taking into account pressure wave and wall displacement effects resulting from the intense thermal shock.
(5). Quantitative evaluation of the T/H parameters upper limits based on the uncertainties discussed earlier.

a
V. SUMMARY AND CONCLUSIONS ’ k
Preliminary T/H analysis of the NSNS liquid mercury target was performed and key T/H parameters were determined. The analytic approach was used on the PC spreadsheet EXCEL to evaluate target design options and to determine the global T/H parameters in the current concept. This analysis showed that the target can be cooled with reasonable flow rates, velocities, pressure drops, and pumping power. Cooling of the beam target window walls can readily be accomplished (subject to the stated uncertainties) using mercury in a secondary cooling jacket structure around the main target. The possibility of helium cooling was found to be marginally feasible and was therefore dropped as an option.
Two-dimensional CFD modeling of the spallation neutron source was performed to characterize the flow field in four alternate configurations. Recirculation zones and “hot spots” were identified, and improvements were investigated and recommended. Results indicate very large recirculation regions downstream of the flow-baffle separator plate no matter which direction the flow is oriented. If the flow inlet to the target is down the center, then the recirculation zones are somewhat smaller in size and fall outside the proton beam path. In these zones of lower heat generation, the higher residence time for the liquid mercury in the recirculation region is less of a factor than when the recirculation zone lays in the central channel. The maximum temperatures in the improved design are not limiting and quite low even in the recirculation zones.
Evaluation of the model was performed to assess both its numerical and physical accuracy and the results are reported in detail by Wendel and Siman-Tov (1997). The computed flow field based on the original mesh was shown to be insensitive to the grid refinement. The mercury Nu number was within 5-25% of the published theoretical values (with better accuracy at the Peclet numbers of interest in this application), and the pressure drop was underpredicted by as much as 30% compared to data from similar but not identical configurations.
Future T/H analysis and R&D for the target will expand the work to cover the uncertainties discussed and move toward more detailed and comprehensive analysis for both steady state and transient conditions. The CFX model will be expanded to include the three-dimensional geometry, non-wetting effects on mercury heat transfer and pressure drop, potential for cavitation around comers, and local flow transients resulting from the
pulsed nature of the energy deposition (thermal shock and pressure waves).
ACKNOWLEDGMENT
The authors would like to acknowledge the support of the NSNS Project Office at Oak Ridge National Laboratory and the contribution of Lowell A. Charlton, Tony A. Gabriel, Jeffrey 0. Johnson, and Thomas J. McManamy.
REFERENCES
AEA Technology, 1995, “CFX 4.1 Flow Solver User Guide,” Computational Fluid Dynamic Services, AEA Technology, Harwell Laboratory, Oxfordshire, United Kingdom, October 1995.
Blevins, R.D., 1984, Applied Fluid Dynamics Handbook, Van Nortraud Reinhold Co., New York, pp. 43-5 1.
Carey, V. P., 1992, “Liquid-Vapor Phase Change Phenomena”, Taylor & Francis, pp. 57-83.
Crane Co., 1988, “Flow of Fluids through Valves, Fittings, and Pipe,” Crane Co., King of Prussia, PA, pp. A-29
Doody, T. C., and Younger, A.H., 195 1, “Heat Transfer Coefficients for Liquid Mercury and Dilute Solutions of Sodium in Mercury in Forced Convection,” Preprints of papers presented at meeting of Am. Inst. of Chem. Eng. in Atlantic City, NJ, pp. 77-98.
Elser, D., 1949, “Heat Transfer Measurements With Mercury,” Forced Convection Engineering Research Projects, University of California, Berkeley, pp. 330- 336.
Gabriel, T. A., et al., 1996, “Spallation Neutron Source Target Station Issues,” Symposium on the Savannah River Accelerator Project and Complementary Spallation Neutron Sources, University of South Carolina, Columbia, South Carolina, May 14- 15, 1996.
Idelchik, I. E., 1994, Handbook of Hydraulic Resistance, 3rd ed., CRC Press, Inc., Boca Raton, Florida, pp. 110, 118,353-356.
Kakac, S., and Yener, Y., 1995, Convective Heat Transfer, 2”d ed., CRC Press, Inc., Boga Raton, Florida, pp. 303.
Lubarsky, B. and Kaufman, S. J., 1955. Review of Experimental Investigations of Liquid-Metal Heat Transfer, NACA-TN-3336, Lewis Flight Propulsion Laboratory, March 1955.
Lyon, R. N., 1951, Liquid Metal Heat Transfer Coefficient, Chemical Engineering Progress, Vol. 47, pp. 75-79.
Lyon, R. N., 1952. Liquid-Metals Handbook, The Atomic Energy Commission, Washington, pp. 207
Seban, R. A., Shimazaki, T., 1950, Heat Transfer to a Fluid Flowing Turbulently in a Smooth Pipe with WaIls at Constant Temperature, Paper No. 50-A-128, A.S.M.E.
Siman-Tov, M., Wendel, M., and Haines, J., 1966, “Thermal-Hydraulic Simulation of Mercury Target Concepts for a Pulsed Spallation Neutron Source,” Proceedings of the International Workshop on the Technology and Thermal Hydraulics of Heavy Liquid Metals, Schruns, Montafon Valley, Austria, March 25- 28, 1996.
Taleyarkhan, R. P., Kim, S. H., and, Haines, J. R., 1997, “Thermal-Shock Assessments for National Spallation Neutron Source Target System,” The Second Advanced Reactors Safety Conference (ARS’97), Orlando, Florida, June 1-4, 1997.
Stromquist, W.K., 1953, “Effect of Wetting on Heat Transfer Characteristics of Liquid Metals (thesis),” ORO-93, Oak Ridge Natl. Lab., Oak Ridge, TN, 1953.
Untermeyer, S., 1949, Heat Transfer Experiments With Bismuth Alloys, Argonne National Laboratory. Personal communication with Richard N. Lyon.
Wendel, M. W. and Siman-Tov, M., 1997. “CFD Analysis Of A Liquid Mercury Target For The National Spallation Neutron Source,” ASME 1997 Fluids Engineering Division Summer Meeting, Vancouver, British Columbia, July 22-26, 1997