Embed Size (px)
Citation preview

Thermal Exchange from Bangkok Subsoil to
Household Air conditioner
Advisor : Associate Professor Srilert Chotpantarat, Ph.D.
Co-Advisors : Associate Professor Punya Charusiri, Ph.D.
By Sasimook Chokchai 5772162923
* Seminar II: March 6, 2016
Department of Geology
Faculty of Science, Chulalongkorn University
1

2
Introduction
&
Literature
reviews
Selected area
Installation
Results
Discussion
Conclusion(5)
(6)
(4)
(3)
(2)
(1)
Outlines of my seminar topic

3
Analyze subsurface temperature in study area;
Compare soil profile between Bangkok and study area and
Compare energy saving between normal air - conditioner and GSHP
1
2
3
Objectives: are to
Introduction

15 ºC
10 ºC 30 ºC
15 ºC
Source; http://www.kellehers.com.au/wp-content/uploads/Diagram.jpg
heat source
in the winter
heat sink
in the summer
1.1) Fridleifson (2001)
Ground Source Heat Pump (GSHP), also known as Geothermal Heat Pump
(GHP), GeoExchange, earth-coupled.
The Ground Source Heat
Pump or geothermal heat pump
(GHP) system is the heating and/or
cooling system that transfers heat to
or from the ground.
(A) (B)
4
I. Introduction: Literature Reviews
Source: Fridlefson, I.G., (2001), Geothermal energy
for the benefit of the people. Renewable and Sustainable Energy Reviews 5: 299-312.

Source: https://energydesignresources.com/resources/e-news/e-news-73-ground-source-heat-pumps.aspx
A: Like air-source heat pumps (in normal air conditioners), GSHP uses a reversible refrigeration cycle to
provide heating and cooling (dual system).
Introduction
5
Q: How to use GEO heat pump ?
1
2
3
4
5

GSHP indoor unit
GSHP outdoor unit
Inside GSHP outdoor unit
GSHP (Chula case)
Q: How’s GSHP look ?
A: Like air-source heat pump in the normal air-conditioner, but the difference is that GHSP does not have a
fan coil system.
1 meter
Introduction
(A)
(B)
Pump
Heat exchange plate
6

Open loop system Closed loop system
1.2) Lund et al. (2004)
The closed loop systems operated by circulating a water or
water/antifreeze fluid through a sealed water-circulating
pipe network.
The open loop systems operated by extracting fluid directly
from the environment, either as surface water or
groundwater.
(A) (B)
Ground Source Heat Pump (GSHP) or geo-heat pump can be classified on the basis of system installation
into closed loop and open loop system.
Introduction
7
Chula case
Source: Lund, J., Sanner, B., Rybach, L., Curtis, R., and Hellström, G., (2004), Geothermal (Ground-Source) Heat Pumps - a World Overview, GHC Bulletin, September.

Introduction1.3) Yasukawa et al. (2009)
+
0
50
100
150
200
250
300
350
25 30 35 40 45
Dep
th (
m)
Temperature (℃)
DMR104
NB7
NB8
NB28
NB29
NB77
DMW4
NB65
NB84
TE542
TE540
TV390
TBR578
NB74
Map of Chao Phraya Plain showing subsurface temperature.
Temperatures
are stable
8
Source: Yasukawa, K. et al., (2009b), Groundwater Temperature Survey for
Geothermal Heat Pump Application in Tropical Asia. Bulletin of the Geological Survey of Japan 60. 9/10: 459-467.

1.3) Yasukawa et al. (2009)
In Bangkok, subsurface temperature
is lower than monthly mean maximum
temperature almost through a year. Thus
underground may be used as cold heat-source
even in parts of tropical regions
Introduction
9
Maximum temperature
Minimum temperature
Source: Yasukawa, K. et al., (2009b), Groundwater Temperature Survey for Geothermal Heat
Pump Application in Tropical Asia. Bulletin of the Geological Survey of Japan 60. 9/10: 459-467.

Introduction1.4) Balasubramaniam, et al. (2004).
Clay
Sand
Clay
Sand
1st
2nd
3rd
4th
Typical deep soil profiles at depths 0 to 60 meters. 10
First sand layer
Second sand
layerSecond sand
layer
Soft grey clay
Source: Balasubramaniam, A.S., Oh, E.Y.N., and Phienwej, N. (2004), Bored and driven pile testing in bangkok sub-soils. LOWLAND TECHNOLOGY
INTERNATIONAL Vol. a, No. b, pp-pp, date International Association of Lowland Technology (IALT), ISSN 1344-9656.

• CoP ratio between energy transferred for heating or energy removed for cooling to the system input electric energy.
Heat
Pump
Electrical input
(W)
Heat from
environment (QC)Heat to
house (QH)
𝐶𝑜𝑃𝑐𝑜𝑜𝑙𝑖𝑛𝑔 =𝑄𝐻𝑊
=𝑄𝐶 +𝑊
𝑊
Heat
Pump
Electrical input
(W)
Heat to
environment (QH)Heat from
house (QC)
𝐶𝑜𝑃𝑐𝑜𝑜𝑙𝑖𝑛𝑔 =𝑄𝐶𝑊
=𝑄𝐻 −𝑊
𝑊
Room Cooling Room Heating
1.5) Widiatmojo et al. (2017, in prep.)Introduction
11
(A)

In Thailand
• According to Raksasakulwong (2015)’s report, Prof. Takashima (Akita University) is the first
person who introduced GHP to Thailand.
• Kamphaengphet in north-central Thailand is the first place where GHP was installed.
• The research is aimed to extract subsurface energy for GHP,
• Utilization of GHP in Kamphaengphet province was published in Bulletin Geological
Survey of Japan, vol. no. 9/10 (whole volume) in 2009.
• However, the amount of energy was not enough to produce GHP system to work successfully.
12
Introduction

Bangkok
Gulf of Thailand
Detail of GSHP system: Index map of Thailand (A) showing
the location of Chulalongkorn University (star) in Bangkok (B)
Low: 0 m
High: 1,350 m
(A)
(B)
13
II. Selected area

Selected area
Dormitory of
Chulalongkorn University
Parot Racha building
Well no.1Well no.2
Chulalongkorn University
Dhamma Centre
Well of DGR
Google Earth Map showing the location of Paraot Racha, well nos. 1 & 2 in Chulalongkorn University and the
nearest artesian well (Chulalongkorn University Dharma Centre).14

Selected area
In Bangkok, the land area is very expensive so the best type is the
vertical loop to save the land surface.
Remember: 2 units – in-door and out-door
GSHP indoor unit
Experimental room
GSHP outdoor unit
4 m6 m
Well no. 2Well no. 1Experimental room: the second floor of Parot
Racha building (2.84 x 4.74 x 3.50 m).
(A)(B)
15

3.1) Drilling 3.2) Pipes settingHigh-density polyethylene
(HDPE) pipe
Starting with drilling 2 wells (50 m- long) and inserting HDPE pipes in
U-shape into these wells.
Drill pipe
Well no. 1
16
III. installation

3.2) Pipes settingInstallation
Connecting HDPE pipe of well no.1 to HDPE pipe
of well no.2. Preparing HDPE of well nos.1&2 for connect
to GHP outdoor unit.
Well no. 1
Well no. 2
Position of GHP
outdoor unit
(A)
(B)
17

3.3) Landfills
After that filling with local soil into dug wells.
Installation
Well no. 1
Well no. 2
6 m4 m
Position of GHP
outdoor unit
Position of GHP
indoor unit
18

GSHP outdoor unit
Next step is - connecting inlet and outlet HDPE pipes
to the HDPE pipes in both wells and to the GHP
outdoor unit. Make sure that there is no any leakage.
Outlet pipe
Inlet pipe
3.4) GSHP outdoor unit connecting
Installation
19
Anti-corrosion
Note: Thermistor no.-
1 = Inlet temp.
8 = Outlet temp.
10 = ATM (outside air) temp.
1 8
10

GSHP indoor
unit
5. GSHP indoor unit setting
Electricity
Meter
GSHP
indoor unitNormal air-
conditioner
Data logger
Finally, connected the GSHP outdoor unit to the GHP indoor unit with data logger, electricity
meter in the experimental room.
Installation
20
Thermistor for
room temp.9

The circulation pipes stay without
any leakage.
Installation
Schematic installation of geothermal
heat pump system at Parot Racha
laboratory room.
Note: HDPE pipe in well no.1 was
broken. Therefore two new HDPE
pipes with the lengths of 10 and 15
meters were inserted and connected
to the well no. 2.21
X3 m
10 mX
X25 m
X50 m

22
Data logger figure in the
experimental room
Installation
Data logger

Recording temperature, humidity and flow rate by Data Logger every 20 minutes in 24 hours.
InstallationRoom temperature
Atmospheric (outside air)
temperature
Inlet liquid temperature
Outlet liquid temperature
Flow rate of water
circulation
Subsurface temperature at
depth of 8 m
Subsurface temperature at
depth of 10 m
Subsurface temperature at
depth of 3 m
Subsurface temperature at
depth of 1.5 m
23

IV. Results
24
4.1 Cenozoic stratigraphy
4.2 Temperature and flow rate measurements
4.3 Energy saving

Results
1 cm
C
1 cm
D
1 cm
E
1 cm
A
1 cm
B
Lithologic log showing lithostratigraphy of Quaternary deposit,
well no. 1 at Parot Racha building.
A
B
D
E
C
Well no.1
25
4.1 Based on drilling
data, Cenozoic
subsurface
stratigraphy of the
study area was made.

Results
Lithologic log showing lithostratigraphy of Quaternary deposit,
well no. 2 at Parot Racha building.
1 cm
A
1 cm
B
1 cm
C
1 cm
D
1 cm
E
1 cm
F
A
B
C
D
E
F
Well no.2
26
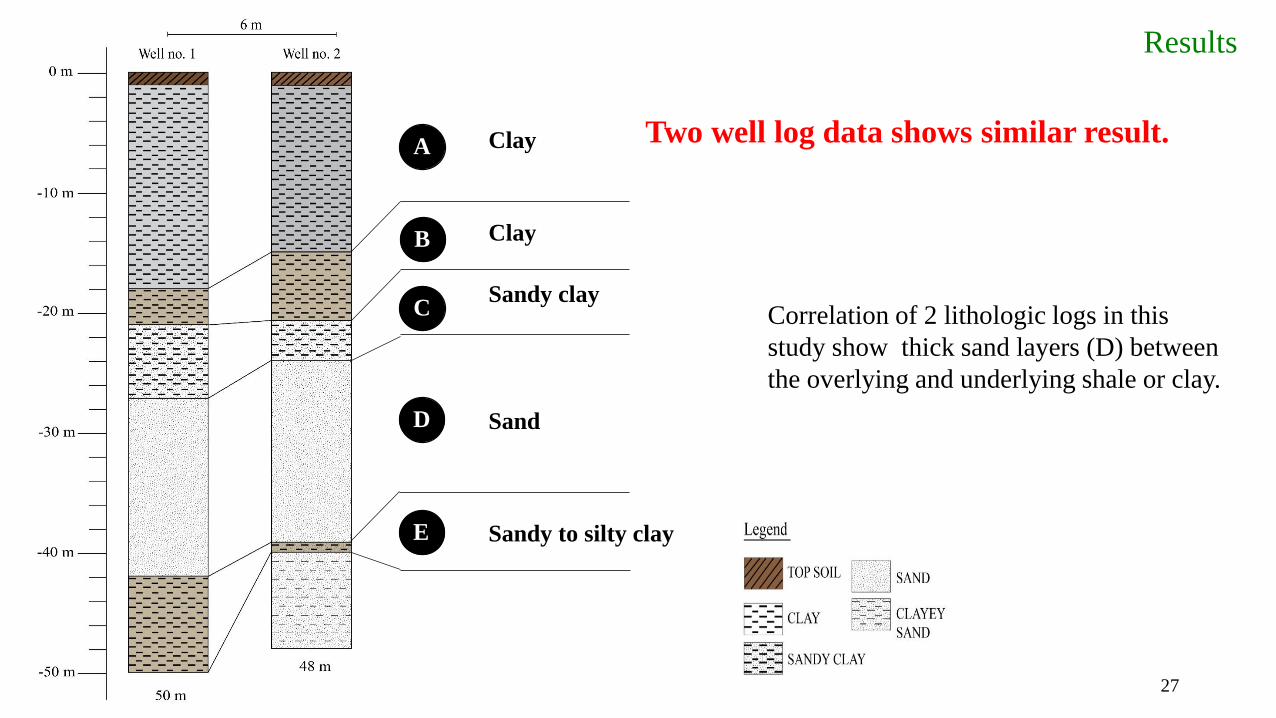
Results
Correlation of 2 lithologic logs in this
study show thick sand layers (D) between
the overlying and underlying shale or clay.
Clay
Clay
Sandy clay
Sand
Sandy to silty clay
A
B
C
D
E
27
Two well log data shows similar result.

Temperature profiles of observation well
nos.1 and 2 at depths of 8, 10, 25 and 50 m.
The graphs show a slight increase in
temperatures at depth and are fairly
consistent almost all the year.
Note that data logger was installed in August 2014 together
with a thermistor at depth of 1.5 m (thermistor no. 2), but
thermistors at depth of 10, 25 and 50 m were broken before
that.
4.2 Temperature measurement Results
0
10
20
30
40
50
29 30 31
Dep
th (
m)
Temperature (℃)
(1) 15 May 2014
(2) 27 May 2014
(3) 4 Jun 2014
(4) 10 Jun 2014
(5) 19 Jun 2014
(6) 24 Jun 2014
(1)
(2)
(3)
(5)
(4) (6)
Subsurface temperature
28

10
20
30
40
50
May Jul Sep Nov Jan Mar May Jul Sep Nov Jan Mar May Jul Sep
Tem
per
atu
re (
ºC)
Month
A subsurface temperature at depth of 1.5 m A subsurface temperature at depth of 3 m
A subsurface temperature at depth of 8 m A subsurface temperature at depth of 10 m
A subsurface temperature at depth of 25 m A subsurface temperature at depth of 50 m
Results
Average subsurface temperature in long-term measurement at depths of 1.5, 3 and 8 m at Parot Racha Building, Chulalongkorn
University from July 2014 to September 2016
A Effect from ATM
8 m (Av. = 29.9 ± 0.2)A
3 m (Av. = 29.0 ± 0.3) 1.5 m (Av. = 29.2 ± 0.4)10 m (Av. = 29.7)
25 m (Av. = 29.9 ± 0.02)
50 m (Av. = 30.7 ± 0.07)
2014 2015 2016
29
4.2 Subsurface temperature

24
26
28
30
32
34
Jul Sep Nov Jan Mar May Jul Sep Nov Jan Mar May Jul Sep
Tem
per
atu
re (
ºC)
MonthAvgerage atmospheric temperature Subsurface temperature at depths of 1.5-8 m
Average atmospheric maximum temperature Average atmospheric minimum temperature
Results
Comparison of atmospheric (outside air) temperatures and subsurface temperatures in long-term measurement at Parot Racha
Building, Chulalongkorn University from July 2014 to September 2016.
Average atmospheric
maximum temperature
Average atmospheric
minimum temperature
Subsurface temperature at depths of 1.5 - 8 m Const. subsurface T⁰
2014 2015 2016
30
Average atmospheric
maximum temperature
4.2 Subsurface temperature

15
20
25
30
35
40T
emp
erat
ure
(ºC
)
14 January 2016
Outside air temperature Inlet liquid temperatureOutlet liquid temperature Underground temperature at 1.5 mUnderground temperature at 8 m
Less fluctuated and highest
temperature curves through times
Very fluctuated curves and high
temperature through times
Turn on Turn off
Turn on = starting GSHP operation, Turn off = finishing GSHP operation
8 AM 9 AM 10 AM 11 AM 12 PM 1 PM 2 PM 3 PM 4 PM 5 PM
Before operation, all
temperature curves are
smooth except outside
temperature curve
No fluctuated and very
low temperature curve
Results
Range of inlet-, outlet-, subsurface- and outside-air temperatures from 8 am to 5 pm of 14 January 2016 showing different styles of
temperature excursion.
Less fluctuated and lower
temperatures through times
31
4.2 Subsurface temperature

24.0
26.0
28.0
30.0
32.0
34.0
36.0
5.0
9.0
13.0
17.0
21.0
25.0
Jul Aug Sep Oct Nov Dec Jan Feb Mar Apr May Jun Jul Aug Sep
Inle
t &
o
utl
et l
iqu
id t
emp
erat
ure
(°C
)
Flo
w r
ate
(l/m
in)
Month
2015 2016
Left axis
Flow rate Average inlet liquid temperature Average outlet liquid temperature
Right axis
Lower flow rate Lower inlet
& outlet liquid temp.
Higher flow rate Higher inlet
& outlet liquid temp.
Results
Comparison of flow rate and atmospheric (outside air) temperatures in long-term measurement of GHP during operation from July
2015 to September 2016.
4.2 Flow rate
32

33
For convenience, we select 25 ºC for the room temperature and 1-hour operation for both air-
conditioners.
Formula for calculation of electricity reducing of GHP as shown in (1).
100 - Electricity consumption of GHP x 100 ………………. (1)
Electricity consumption of AC
4.3 Energy saving
Results
GHPNormal air-
conditioner (AC)

39.6042.29
32.36
45.70
14.05
28.02
20.06
28.84
7.81
30.87
22.99
8.94
0
5
10
15
20
25
30
35
40
45
50
0.1
0.2
0.3
0.4
0.5
0.6
0.7
0.8
Jul Aug Sep Dec Jan Mar Apr May Jun Jul Aug Sep
% R
edu
cin
g o
f G
HP
Ele
ctri
city
co
nsu
mp
tio
n (
kW
h)
Electricity consumption of GHP (B) Electricity consumption of AC % Reducing (B-A)
Comparison of electricity consumption between GSHP and normal air-conditioner (AC)
Results
A
Left axis Right axis
AA
A
A
A
A
AA
A
AA
B B
B
B
B
B
B
B
BB
B
B
2015 2016
34
It is clear that GHP can consume less electricity than the normal air conditioner (AC)
4.3 Energy saving

t-Test Two –Sample Assuming Equal Variances of atmospheric (outside air) temperature in June 2016
GSHP Normal air-conditioner (AC)
Mean 30.10939477 30.28533743
Variance 3.582936782 3.574003403
Observations 7 7
Pooled Variance 3.578470093
Hypothesized Mean
Difference 0
df 12
t Stat -0.174002899
P(T<=t) one-tail 0.432382057
t Critical one-tail 1.782287556
P(T<=t) two-tail 0.864764114
t Critical two-tail 2.17881283
Results
| t Stat | < t Critical two-tail
= Accept H0
35
4.3 Energy saving

GSHP Normal air-conditioner (AC)
Mean 56.5086414 52.17644143
Variance 87.28751638 75.97876063
Observations 7 7
Pooled Variance 81.6331385
Hypothesized Mean
Difference 0
df 12
t Stat 0.897034755
P(T<=t) one-tail 0.19367152
t Critical one-tail 1.782287556
P(T<=t) two-tail 0.38734304
t Critical two-tail 2.17881283 36
t-Test Two –Sample Assuming Equal Variances of Humidity in June 2016
Results
| t Stat | < t Critical two-tail
= Accept H0
4.3 Energy saving

V. Discussion
37
5.2 Characteristics of subsurface temperatures
5.3 CoP
5.1 Importance of subsurface stratigraphy

Correlation of lithologic logs
of well nos. 1, 2 and
Chulalongkorn University
Dharma Centre log (well of
Department of Groundwater
Resources).
V. Discussion
1
2
3
4
38
DGR log5.1 Importance of subsurface
stratigraphy

Discussion
Groundwater of
Lower Chao Phraya
Plain modified after
Department of
Mineral Resources
(2007).
39
Sand better than shale
Thicker sand is better than thinner
5.1 Importance of subsurface stratigraphy

Discussion
Index map of Lower Chao Phraya Plain showing the locations of temperature observation wells around Bangkok (black triangle) and
nearest lithologic logs of temperature observation wells (green circle).
A
A’
40
Legend
Lithologic log of DGR
Temperature observation
wells
Cross-section line
5.1 Importance of subsurface
stratigraphy

DiscussionA’
1
2
3
SW NE
Correlation of
lithologic logs of well nos.
1, & 2 and lithologic logs
of Department of Mineral
Resources (DGR): LH-
BKT, LH-BKP-1 and LH-
MBR.
41
A
Study area
Minburi need more deeper
5.1 Importance of subsurface
stratigraphy

42
0
10
20
30
40
50
60
70
28 29 30 31 32D
epth
(m
)
Temperature (℃)
Maximum temperature
range of study area
Minimum temperature
range of study area
T-LKB
T-BKT
T-BKP-1
T-BKP-2
T-MBR
T-BKP-1
T-BKP-2
T-BKT
T-MBR
T-LKB
Legend
Temperatures tend to increase
very slightly at
deeper depth
Minimum temperature
range of study area
Maximum temperature
range of study area
Comparison between well temperature profiles
around Bangkok including the study area.
Discussion
5.2 Characteristics of subsurface temperatures

10.0
15.0
20.0
25.0
30.0
35.0
2.0
3.0
4.0
5.0
6.0
7.0
8.0
9.0
10.0
Jul Aug Oct Dec Jan Mar May Jun Aug Oct
Tem
per
atu
re (
°C)
CO
P 0
f G
HP,
CO
P o
f A
C
Month
Value of COP of GHP when operating at 25°C in long-term measurement at Parot Racha Building, Chulalongkorn University from July
2015 to September 2016. 43
5.3 Coefficient of Performance (COP)---compared with ATM (outside air) temp.
2015 2016
Left axis
COP of GHP COP of AC Trend line of GHP’s COP
Right axis
Outside air temperature
Lower outside air temperature Higher CoP
AC (COP = 3.45)
GHP (average = 4.46 ± 1.01)
Discussion

0
20
40
60
80
2.0
3.0
4.0
5.0
6.0
7.0
8.0
9.0
10.0
Jul Aug Oct Dec Jan Mar May Jun Aug Oct
Hu
mid
ity
(%
)
CO
P 0
f G
HP,
CO
P o
f A
C
Month
Discussion
Value of COP of GHP when operating at 25°C in long-term measurement at Parot Racha Building, Chulalongkorn University from July
2015 to September 2016. 44
5.3 Coefficient of Performance (COP)---compare with humidity
2015 2016
Left axis
COP of GHP COP of AC Trend line of GHP’s COP
Right axis
Humidity
AC (COP = 3.45)
GHP (average = 4.46 ± 1.01)
Lower humidity and ATM Higher CoP

Comparison of atmospheric and subsurface temperatures of Bangkok area (modified after Yasukawa et al., 2009).
Discussion
45
5.4 How Bangkok area is good for GHP
Observed the bold line
Maximum temperature
Minimum temperature

Discussion
Comparison of atmospheric and subsurface temperatures of Sukhothai area (modified after Yasukawa et al., 2009)
46
The answer is that Sukhothai region is
not good for GHP installment !!
Maximum temperature
Minimum temperature
At present there is no good answer to
support the unsuccessful installation of
GHP in Sukhothai. However, the plausible
answer is that the subsurface must not be
the same and this is why subsurface
temperature is so high in Sukhothai area.
5.5 Is Sukhothai area good for GHP?

General control setting temperature is @ 25°C. GSHP system can give high reduction of
electricity consumption (kWh) such as 30% in the case of our study in Bangkok (and
many places in other tropical countries) .
In normal situation, underground temperature is relatively stable and always lower than
atmospheric temperature (such as our study in Bangkok case).
Data on underground temperature measurement around Bangkok allow the high
possibility of using geo heat pump in this Bangkok and nearby area where subsurface
geology is almost the same.
47
VI. Conclusions

48
VII. Acknowledgements
The Food and Water Cluster, Ratchadaphisek Somphot Endowment Fund (Prof. Somsak
Panha), Chulalongkorn University for grant support to this research work.
Geological Survey of Japan (GSJ, Drs. Uchida and Takashima)
for providing GSHP instrument.
Thanks for Assoc. Prof. Chakapan for searching for good laboratory room for GHP
instalment.
DGR for providing all the subsurface data.

49
VIII. About my short abstracts and paper to
Conferences & Workshops
1) 5th GEOINDO 2015 International Conference
2) Department of Mineral Resources (DMR) Special talk#2
3) The Thematic Session at the 52nd CCOP Annual Session
4) The Third Asia Renewable Energy Workshop (3rd AREW)

50
1) The 5th GEOINDO 2015 International Conference" Geology, Geotechnology, and Mineral Resources of INDOCHINA "Technical Conference : November 23-24, 2015, Khon Kaen, Thailand

51
2) Department of Mineral Resources (DMR) Special talk#2February 9, 2016
GSHP system at National Geological
Museum, Pathum Thani, Thailand.

52
3) The Thematic Session at the 52nd CCOP Annual Session“GEOSCIENCE FOR THE SOCIETY”1st November 2016, The Berkeley Hotel, Bangkok, Thailand

53
4) The 3rd Asia Renewable Energy Workshop (3rd AREW)Hanoi, Vietnam from December 7 - 9, 2016
GSHP system at Vietnam Institute of
Geoscience and Mineral Resources
(VIGMR), Hanoi, Vietnam.

54
Thanks a lot for your kind attention
Now times for questions and
comments