Embed Size (px)
Citation preview

THERMAL AND ENERGY PERFORMANCE OF NANOFLUID
OPERATED HEAT RECOVERY EXCHANGER
LEONG KIN YUEN
THESIS SUBMITTED IN FULFILMENT
OF THE REQUIREMENTS
FOR THE DEGREE OF DOCTOR OF PHILOSOPHY
FACULTY OF ENGINEERING
UNIVERSITY OF MALAYA
KUALA LUMPUR
2013

ii
UNIVERSITY OF MALAYA
ORIGINAL LITERARY WORK DECLARATION
Name of Candidate: Leong Kin Yuen
Registration/Matric No: KHA100008
Name of Degree: Doctor of Philosophy
Title of Project Paper/Research Report/Dissertation/Thesis (“this Work”):
Thermal and Energy Performance of Nanofluid Operated Heat Recovery Exchanger
Field of Study: Heat Transfer and Energy
I do solemnly and sincerely declare that:
(1) I am the sole author/writer of this Work; (2) This Work is original; (3) Any use of any work in which copyright exists was done by way of fair dealing
and for permitted purposes and any excerpt or extract from, or reference to or reproduction of any copyright work had been disclose expressly and sufficiently and the title of the Work and its authorship had been acknowledge in this Work;
(4) I do not have any actual knowledge nor ought I reasonably to know that the making of this work constitutes an infringement of any copyright work;
(5) I hereby assign all and every right in the copyright to this Work to the University of Malaya (“UM”), who henceforth shall be owner of the copyright in this Work and that any reproduction or use in any form or by any means whatsoever is prohibited without the written consent of UM having been first had and obtained;
(6) I am fully aware that if in the course of making this Work I have infringed any copyright whether intentionally or otherwise, I may be subject to legal action or any other action as may be determined by UM.
Candidate’s Signature Date:
Subscribed and solemnly declared before,
Witness’s Signature Date:
Name:
Designation:

iii
Abstract
In recent years, there has been a substantial increase in energy demand due to
industrialization. This raises concern on issues such as depletion of fossil based energy
and emission of green house gasses. It is reported that a high portion of industrial
energy is wasted as flue gas/hot gas from heating plants, boilers, etc. Hence,
optimization of energy use through heat recovery device is one of the possible
approaches to address this problem. However, conventional heat transfer fluids feature
low thermal conductivity.
The development in nanotechnology has enabled the introduction of nanofluids
as a new generation of heat transfer fluid. Nanofluids are suspensions of nanoparticles
in a base fluid. The inclusion of nanoparticles into a base fluid significantly increases
the thermal conductivity of the base fluid. This study attempts to investigate the thermal
and energy performance of a shell and tube heat exchanger and thermosyphon air-
preheater operated with nanofluids. It focuses on recovering waste heat from hot gases/
flue gas produced by a heating plant. The analysis was conducted based on the thermo-
physical properties of nanofluids obtained from literatures, mathematical correlations
and present experimental data.
The thermo-physical properties measured in this study include thermal
conductivity, viscosity and density. The study reveales that, the thermal conductivity of
ethylene glycol/water based Al2O3 (0.5vol.%, partice size: 13nm) increases about 8.9%
compared to base fluid. About 12.9% augmentation is also observed for water based
Al2O3 (0.5vol.%, particle size :13nm). Thermal conductivity of nanofluids increases
with the increase of particle volume percentage or decrease of particle size. Viscosity
and density also show increasing trend with the addition of nanoparticles.
The thermal performance of shell and tube heat recovery exchanger improved
with the addition of nanoparticles. About 7.8% heat transfer augmentation was observed

iv
for the ethylene glycol-based nanofluids containing 1 vol.% of copper nanoparticles at
26.3 kg/s flue gasses’ mass flow rate and 111.6 kg/s coolant’s mass flow rate. For
water containing 2 vol.% of copper, 4.5% heat transfer enhancement was recorded. At
constant coolant mass flow rate, lower pumping power is needed when nanofluids are
applied. About 10.99% less power was observed at 1vol. % of copper nanoparticle
compared to ethylene glycol base fluid.The study on the size reduction of heat
exchanger, implied that nanofluids provide opportunity to reduce the size of heat
exchanger without decreasing its thermal performance.
Analysing the total dimensionless entropy generation revealed that, 10.8%
reduction is observed with an addition of 7 vol.% of Al2O3 into water. About 9.7%
reduction is observed for water-based TiO2 (4 vol.%) nanofluid. Other factors that
influence total dimensionless entropy generation are dimensionless temperature
difference, fluid mass flow rate, tube diameter and length.
Moreover, the study revealed that the change of nanofluid thermo-physical
properties only plays a minor role in improving the thermal performance of the
thermosyphon heat exchanger. Slight increase of overall heat transfer coefficient and
cold air outlet temperatures are observed with increasing nanoparticle volume fraction.
However, the thermal performance of thermosyphon heat exchanger increases when the
hot air velocity elevates from 2.5 to 4.75m/s.

v
Abstrak
Kebelakangan ini, terdapat peningkatan dalam permintaan tenaga akibat dari
pembangunan industri. Ini telah meningkatkan perhatian terhadap isu-isu seperti
kekurangan sumber tenaga berasaskan fosil dan pembebasan gas rumah hijau. Laporan
telah menunjukkan sebahagian besar tenaga industri dibazirkan dalam bentuk gas
serombong/gas panas dari loji pemanasan, dandang dan sebagainya. Oleh itu,
pengoptimunan tenaga melalui alat penukar haba merupakan salah satu cara untuk
menyelesaikan masalah ini. Walaubagaimanapun, bendalir haba konvensional
mempunyai ciri terma konduksi yang lemah.
Pembangunan dalam bidang nanoteknologi memungkinkan kewujudan bendalir
nano sebagai bendalir haba generasi baru. Bendalir nano terdiri dari campuran
nanopartikel dan bendalir asas. Penambahan nanopartikel ini ke dalam bendalir asas
dapat meningkatkan ciri-ciri konduksi terma. Oleh yang demikian, projek ini bertujuan
untuk mengkaji prestasi terma dan tenaga bagi penukar haba jenis shell dan tube serta
thermosifon udara pra-pamanas yang beroperasi mengunakan bendalir nano. Alat-alat
penukar haba ini berfungsi untuk mengembalikan baki haba dari gas serombong/gas
panas yang dihasilkan dari loji pemanasan. Analisa yang dijalankan adalah berpandu
kepada ciri-ciri terma dan fisikal bendalir nano yang didapati dalam literatur, korelasi
matematik dan juga eksperimen data dari projek ini.
Eksperimen terma fizikal yang dijalankan meliputi konduksi haba, kelikatan dan
ketumpatan. Projek ini mendapati bahawa konduksi haba bagi campuran ethylene
gycol/air yang mengandungi Al2O3 (0.5% konsentrasi isipadu, partike saiz: 13nm)
meningkat sebanyak 8.9% berbanding dengan bendalir asas. Peningkatan sebanyak
12.9% juga direkodkan pada bendalir nano berasakan air yang mengandungi Al2O3
(0.5% konsentrasi isipadu, partikel saiz: 13nm). Ia juga dilaporkan bahawa konduksi
haba bagi bendalir nano meningkat seiring dengan peningkatan konsentrasi isipadu

vi
nanopartikel. Ciri-ciri lain seperti kelikatan dan ketumpatan bendalir nano juga
meningkat apabila konsentrasi isipadu nanopartikel meningkat.
Kajian juga mendapati prestasi terma penukar haba shell and tube meningkat
dengan pertambahan nanopartikel ke dalam bendalir asas. Sebanyak 7.8% peningkatan
haba dicatatkan bagi ethylene glycol yang mengandungi 1% konsentrasi isipadu
nanopartikel jenis tembaga pada kadar alir jisim 26.3 kg/s (gas serombong) dan 111.6
kg/s (bendalir nano). Bagi air berasaskan 2% konsentrasi isipadu tembaga pula,
peningkatan haba sebanyak 4.5% dicatatkan pada pengaliran jenis laminar. Pada kadar
alir jisim bendalir yang tetap, kuasa pam yang lebih rendah diperlukan apabila bendalir
nano digunakan. 10.99% pengurangan kuasa pam didapati apabila ethyelene glycol
bendalir asas ditambahkan dengan 1% konsentrasi isipadu tembaga. Kajian juga
mendapati penggunaan bendalir nano menyediakan peluang bagi pengecilan saiz alat
penukar haba tanpa menjejaskan prestasinya.
Kajian juga mendapati jumlah entropi tanpa dimensi menurun sebanyak 10.8%
dicatatkan apabila 7% konsentrasi isipadu Al2O3 ditambahkan ke dalam bendalir asas
berasaskan air. Sebanyak 9.7% penurunan dicatatkan pula bagi bendalir nano
berasaskan 4% konsentrasi isipadu TiO2. Faktor-faktor lain seperti perbezaan suhu
tanpa dimensi, kadar alir jisim bendalir, paip diameter and panjang juga mempengaruhi
jumlah entropi tanpa dimensi.
Kajian juga mendapati bahawa perubahan dalam ciri-ciri termo-fizikal bendalir
nano hanya memainkan peranan kecil dalam peningkatan prestasi terma termosifon
penukar haba. Hanya sedikit peningkatan dari segi perolakan haba keseluruhan dan
suhu keluar gas sejuk dicatatkan. Walaubagaimanapun, prestasi terma termosifon
penukar haba meningkat apabila kadar alir udara panas meningkat dari 2.5 m/s ke 4.75
m/s.

vii
Acknowledgements
First and foremost, I would like to express heartiest thanks to my supervisors,
Professor Dr Saidur Rahman, Associate Professor Dr Yau Yat Huang and Professor
T.M.Indra Mahlia for their consistent encouragement, advice and invaluable guidance
throughout the course of this project.
I would also like to express my deepest appreciation and gratitude to my family
members and Miss Ng Lee Yin for their love, sacrifice, motivation and support during
the course of this project. I am thankful to and acknowledge the HIRG-MoHE for their
financial support under UM.C/HIR/MHE/ENG/40.
And last but not least, I would like to thank those who have contributed directly
or indirectly towards the success of this project.

viii
Table of Contents
Original Literary Work Declaration ii
Abstract (English) iii
Abstract (Malay) v
Acknowledgments vii
Table of Contents viii
List of Figures xiv
List of Tables xix
List of Abbreviations and Symbols xx
List of Appendices xxiv
CHAPTER 1- INTRODUCTION 1
1.1 Introduction 1
1.2 Background of problem 4
1.3 Overview of the study 6
1.4 Objectives of the study 9
1.5 Scope of the study 9
1.6 Outline of the thesis 10
CHAPTER 2- LITERATURE REVIEW 12
2.1 Introduction 12
2.2 Heat transfer with nanofluids 12
2.3 Preparation of nanofluids 13
2.4 Thermal conductivity of nanofluids 16
2.4.1 Experimental study of nanofluids’ thermal conductivity 17
2.4.1.1 Effect of particle volume fractions 18
2.4.1.2 Effect of particle size and shape 20

ix
2.4.1.3 Effect of temperature 21
2.4.1.4 Effect of surfactant and pH 22
2.4.2 Theoretical model of nanofluids’ thermal conductivity 23
2.5 Viscosity of nanofluids 25
2.5.1 Experimental study of nanofluids’ viscosity 25
2.5.2 Theoretical model of nanofluids’ viscosity 27
2.6 Density and specific heat of nanofluids 28
2.7 Convective heat transfer coefficient of nanofluids 29
2.8 Entropy generation 31
2.9 Nanofluids in heat pipe and shell and tube heat exchanger 32
2.10 Energy saving using nanofluids 33
2.11 Conclusion 35
CHAPTER 3- METHODOLOGY 36
3.1 Introduction 36
3.2 Thermal conductivity, viscosity and density measurements 36
3.2.1 Preparation of nanofluids 36
3.2.2 Measurement of thermal conductivity 38
3.2.3 Measurement of viscosity 39
3.2.3.1 Ethylene glycol/water mixture-based nanofluids 39
3.2.3.2 Water-based nanofluids 41
3.2.4 Measurement of density 42
3.3 Modelling of flue gas/hot gas waste heat recovery through shell
and tube heat exchanger
43
3.3.1 Shell and tube heat exchanger and operating conditions 43
3.3.1.1 Theoretical derivation on heat transfer and energy performance 46

x
of shell and tube heat recovery exchanger
3.3.1.2 Test procedures and conditions 52
3.3.2 Energy saving associated with size reduction of shell and tube
heat exchanger
53
3.3.2.1 Size estimation of shell and tube heat recovery exchanger 53
3.3.2.2 Convective heat transfer coefficient of flue gas and nanofluids 55
3.3.2.3 Energy savings 56
3.3.3 Entropy generation of a nanofluids flow through a circular tube
subjected to constant wall temperature
58
3.3.3.1 Geometry configuration of circular tube and thermo-physical
properties of nanofluids
58
3.3.3.2 Theoretical derivation on entropy generation of nanofluids flow
through a circular tube subjected to constant wall temperature
60
3.4 Modelling of hot gas waste heat recovery through
thermosyphon air preheater
64
3.4.1 Modelling characteristic and input data 64
3.4.2 Theoretical derivation on heat transfer and energy performance
in thermosyphon air preheater
65
3.4.2.1 Thermal resistance of air side 65
3.4.2.2 Thermal resistance of thermosyphon wall 67
3.4.2.3 Thermal resistance of working fluid at evaporator 67
3.4.2.4 Thermal resistance of working fluid at condenser 68
3.4.2.5 Overall effectiveness of thermosyphon air preheater 68
3.4.2.6 Outlet temperature at evaporator and condenser 69
3.4.2.7 Energy performance 69
3.4.2.8 Test characteristics 71

xi
3.5 Conclusion 72
CHAPTER 4- RESULTS AND DISCUSSION 73
4.1 Introduction 73
4.2 Thermal conductivity characteristic of nanofluid based
coolants.
73
4.3 Density characteristic of nanofluid based coolants 76
4.4 Viscosity characteristic of nanofluid based coolants 78
4.4.1 Viscosity of the ethylene glycol/water -based nanofluids 78
4.4.2 Viscosity of the water -based nanofluids 83
4.5 Discussion on flue gas waste heat recovery through shell and
tube heat exchanger
84
4.5.1 Effect of nanoparticle volume fraction on thermal and energy
performance of shell and tube heat recovery exchanger
85
4.5.2 Effect of flue gas mass flow rate on thermal performance of
shell and tube heat recovery exchanger
90
4.5.3 Effect of coolant mass flow rate on thermal performance of
shell and tube heat recovery exchanger
93
4.5.4 Comparison of studies 94
4.6 Energy saving associated with size reduction of shell and tube
heat recovery exchanger
96
4.6.1 Effect of ethylene glycol based copper nanofluids on
geometries of shell and heat recovery exchanger
96
4.6.2 Effect of water based copper nanofluids on the geometries of
shell and heat recovery exchanger
99
4.6.3 Energy saving 101

xii
4.7 Entropy generation analysis of nanofluid flow in a circular tube
subjected to constant wall temperature
105
4.7.1 Comparative studies 105
4.7.2 Water based aluminium oxidenanofluids 107
4.7.2.1 Total dimensionless entropy generation using different
aluminium oxid nanoparticles loading and dimensionless wall
and fluid temperature different
107
4.7.2.2 Total dimensionless entropy generation using laminar and
turbulent flow
109
4.7.2.3 Total dimensionless entropy generation using different
geometry configurations
111
4.7.2.4 Total dimensionless entropy generation of water based
aluminium oxide and titanium dioxide nanofluids
114
4.8 Performance investigation of nanofluids as working fluid in a
thermosyphon air preheater
116
4.8.1 Comparative studies 116
4.8.2 Influence of nanoparticles volume fraction and hot air velocity
on thermal and energy performance of thermosyphon heat
exchanger
119
4.8.2.1 Thermal performance of thermosyphon air preheater 119
4.8.2.2 Energy performance of thermyphon air preheater 122
CHAPTER 5- CONCLUSION AND RECOMMENDATIONS 125
5.1 Conclusion 125
5.2 Recommendations 127

xiii
REFERENCES 129
APPENDICES 142
Appendix A Curriculum Vitae 142
Appendix B List of publications 143
Appendix C Invitation as a reviewer 144
Appendix D Invitation to the 2nd Annual World Congress of Nano-SandT-
2012, China
149
Appendix E Invitation to submit paper to Frontiers in Heat Pipes (FHP) 150
Appendix F Speech invitation from Nanoscience and Technology 2013,
China
151
Appendix G Sample calculations 152

xiv
List of Figures
Figure 1.1 Typical energy balance of a boiler (Jayamaha, 2008) 4
Figure 1.2 Overview of the study 8
Figure 2.1 Typical Transmision electron microscopy (TEM) image of
titanium dioxide/water nanofluids (Duangthongsuk and
Wongwises, 2009) and carbon black /water(Hwang et al.,
2008)
14
Figure 2.2 Ultrasonication process of nanofluids 15
Figure 3.1 Ultrasonic cell disruptor KS-1200R 37
Figure 3.2 KD2 Pro Decagon 39
Figure 3.3 LVDV –III Ultra Brookfield Rheometer with water bath
circulator
40
Figure 3.4 Viscosity measurement concept of LVDV-III Ultra
Brookfield Rheometer
40
Figure 3.5 SV- 10 Viscometer 41
Figure 3.6 Major part of SV- 10 Viscometer 42
Figure 3.7 Density meter 43
Figure 3.8. Thermal conductivity ratio of ethylene glycol based copper
nanofluids (Eastman et al., 2001)
45
Figure 3.9 Thermal conductivity ratio of water based copper nanofluids
(Jang and Choi, 2006)
45
Figure 3.10 Mathematical flow chart (Thermal and energy performance of
shell and tube heat exchanger)
51
Figure 3.11 Mathematical flowchart of the size reduction and energy
savings of shell and tube heat exchanger
57
Figure 3.12 Circular tube under constant wall temperature (Sahin, 2000) 58
Figure 3.13 Thermal conductivity of water based TiO2 nanofluids
(Murshed et al., 2009)
59
Figure 3.14 Mathematical flowchart of the size reduction and energy
savings of shell and tube heat exchanger.
63

xv
Figure 3.15 Schematic diagram of an air preheater (Noie, 2006) 65
Figure 3.16 Mathematical flowchart of the thermosyphon air-preheater
analysis
70
Figure 4.1 Validation of KD2-Pro thermal conductivity analyzer
(~28oC)
73
Figure 4.2. Comparison of thermal conductivity between various water
and ethylene glycol/water -based nanofluids and
base fluid (~ 28oC)
74
Figure 4.3 Validation of density meter (~28oC) 77
Figure 4.4 Density of ethylene glycol/water and water base nanofluids
and base fluid (~28oC)
77
Figure 4.5 Theoretical and experimental viscosity of base fluids at
different temperature
79
Figure 4.6 Dynamic viscosity of ethylene glycol/water mixture with
respect to shear rate
79
Figure 4.7. Effect of the particle volume fractions and temperature on
the ethylene glycol/ water -based nanofluids
80
Figure 4.8 Viscosity of the ethylene glycol/water -based nanofluids
with respect to shear rate at 30oC
82
Figure 4.9 Viscosity of the ethylene /water -based nanofluids with
respect to shear rate at 40oC
82
Figure 4.10 Viscosity of water (experiment and reference values) 83
Figure 4.11 Viscosity of water -based nanofluids 84
Figure 4.12 Effect of copper volume fraction to coolant Reynolds number
at constant flue gas and coolant mass flow rate
85
Figure 4.13 Effect of copper volume fraction to coolant convective heat
transfer coefficient and overall heat transfer coefficient at
constant flue gas and coolant mass flow rate.
86
Figure 4.14 Effect copper volume fraction to heat transfer rate at constant
flue Gas (26.3kg/s) and coolant (111.6 kg/s) mass flow rate.
87
Figure 4.15 Effect copper volume fraction to coolant pressure drop and
pump power at constant flue gas (26.3kg/s) and coolant
(111.6 kg/s) mass flow rate.
88

xvi
Figure 4.16 Overall heat transfer coefficient of shell and tube heat
recovery exchanger operated with ethylene glycol/water-
based nanofluids
90
Figure 4.17 Effect of flue gas mass flow rate to flue gas convective heat
transfer coefficient
91
Figure 4.18. Effect of flue gas mass flow rate to overall heat transfer
coefficient
91
Figure 4.19. Effect of flue gas mass flow rate to heat transfer rate 92
Figure 4.20 Effect of coolant mass flow rate to overall heat transfer
coefficient
93
Figure 4.21. Effect of coolant mass flow rate to heat transfer rate 94
Figure 4.22. Comparison of studies 95
Figure 4.23 Effect of copper volume fraction to heat transfer area and
shell diameter of shell and tube heat exchanger operated with
ethylene glycol -based nanofluids
97
Figure 4.24 Effect of copper volume fraction to number of tubes in shell
and tube heat exchanger operated with ethylene glycol-based
nanofluids
98
Figure 4.25 Calculated tube side heat transfer coefficient for shell and
tube heat exchanger operated with ethylene glycol-based
nanofluids
99
Figure 4.26 Effect of copper volume fraction to heat transfer area and
shell diameter of shell and tube heat exchanger operated with
water-based nanofluids
100
Figure 4.27 Effect of copper volume fraction to number of tubes in shell
and tube heat exchanger operated with water-based nanofluids
100
Figure 4.28. Calculated tube side convective heat transfer coefficient of
shell and tube heat exchanger operated with water-based
nanofluids
101
Figure 4.29 Mass reduction of shell and tube heat recovery exchanger
operated with ethylene glycol-based copper nanofluids
102
Figure 4.30 Energy saving of material processing of shell and tube heat
recovery exchanger operated with ethylene glycol based-
102

xvii
copper nanofluids
Figure 4.31 Mass reduction of shell and tube heat recovery exchanger
operated with water based-copper nanofluids
103
Figure 4.32 Energy saving of material processing of shell and tube heat
recovery exchanger operated with water-based copper
nanofluids
104
Figure 4.33. Comparative studies 105
Figure 4.34 Contribution of heat transfer and fluid friction on the total
dimensionless entropy generation
107
Figure 4.35 Effect of dimensionless temperature different on total
dimensionless entropy generation of nanofluids flow
109
Figure 4.36 Total dimensionless entropy generation of nanofluids in
laminar flow
110
Figure 4.37. Total dimensionless entropy generation of nanofluids in
turbulent flow
111
Figure 4.38 Total dimensionless entropy generation of nanofluids with
respect to tube length
112
Figure 4.39. Total dimensionless entropy generation of nanofluids with
respect to tube diameter
113
Figure 4.40 Comparison of total dimensionless entropy generation
between aluminium oxide and titanium dioxide nanofluids
114
Figure 4.41. Total dimensionless entropy generation of various water -
based nanofluids
115
Figure 4.42 Relationship between hot air inlet and outlet temperature at
2.5 m/s hot air velocity
116
Figure 4.43 Relationship between hot air inlet and outlet temperature at
4.0 m/s hot air velocity
117
Figure 4.44 Relationship between hot air inlet and outlet temperature at
4.75 m/s hot air velocity
117
Figure 4.45 Effect of hot air inlet temperature and velocity to energy
absorbed at evaporator section
118
Figure 4.46. Effect of nanoparticles’ volume fraction and hot air velocity
to overall heat transfer coefficient of thermosyphon heat
exchanger
120

xviii
Figure 4.47 Effect of nanoparticles’ volume fraction and hot air velocity
to cold air outlet temperature of thermosyphon heat exchanger
122
Figure 4.48 Effect of Al2O3 nanoparticles’ volume fraction and hot air
velocity to energy performance of thermosyphon heat
exchanger
123
Figure 4.49 Effect of TiO2 nanoparticles, volume fraction and hot air
velocity to energy performance of thermosyphon heat
exchanger
123

xix
List of Tables
Table 2.1 Comparison between micro and nanoparticles (Sarit et al., 2008) 13
Table 2.2 Synthesis method of nanofluids formulation 16
Table 2.3 Nanofluids thermal conductivity related studies 17
Table 2.4 Market price of the nanoparticles (Sigma Aldrich, 2013; US
Research Nanomaterials, 2013)
35
Table 3.1 Composition of flue gas from biomass heating plant 44
Table 3.2 Specifications of shell and tube heat exchanger and operating
conditions for flue gas and nanofluids
44
Table 3.3 Thermo-physical properties of flue gas, ethylene glycol and water 46
Table 3.4 Specification of shell and tube heat exchanger for size reduction
estimation
55
Table 3.5 Specification and operating characteristic of circular tube 59
Table 3.6 Thermo-physical properties of water (Incropera et al., 2007) 60
Table 3.7. Specification of an air preheater (Noie, 2006) 64
Table 4.1 Thermal and energy performance of water -based nanofluids
containing 2% of copper nanoparticles compared to water base
fluid at 12kg/s mass flow rate
89

xx
List of Abbreviations and Symbols
Abbreviations
A Area, m2
As Total tube outside heat transfer area, m2 A�,� Cross flow area, m2 A�,� Tube side flow area per pass, m2
Al2O3 Aluminium oxide, alumina
Au Gold
B Baffle length, m
C Capacity rate, W/K
CO2 Carbon dioxide c� Specific heat, J/kgK
Cu Copper
CuO Copper oxide
Cu2O Copper(I)oxide
CL Tube layout constant
CTAB Cetyltrimethylammonium bromide
CTP Constant
D,d Diameter,m
DNP Diamond
dP pressure drop, Pa
dx length of the tube,m
EG Ethylene glycol
E Energy consumption (MWh) Energy consumption needed for 1 kg material
processing
Ec Eckert number �� fin spacing, mm
F,f Friction factor
Fe Ferum
Fe2O3 Iron(III)oxide
g Gravity acceleration, m/s2
h Convective heat transfer coefficient,W/m2K

xxi
H Height (m)
H2O Water
IEP Isoelectric point j Colburn factor
k Thermal conductivity, kW/mK
L Length of tube, m
l fin length for heat conduction from primary to
midpoint between plates, m
LMTD Log mean temperature different
m Mass, kg
MWCNT Multiwall carbon nanotube � Mass flow rate, kg/s
N2 Nitrogen
Nu Nusselt number
NTU Number of heat transfer units
Nt,p Number of tubes per pass
Nt Total number of tubes N�� ����
O2 Oxygen
P Pump power, kW
PEO Poly(ethylene oxide)
Pr Prandtl number
PR Pitch ratio
PVP Polyvinylpyrrolidone P� Square tube pitch, mm
Q, q Heat transfer rate, kW
R thermal resistance, m2K/W
Re Reynolds number
SWCNH Single wall carbon nanohorn S���
St
entropy generation (W/K)
Stanton number
�� transverse pitch, mm �� longitudinal pitch, mm

xxii
Subscripts
bf base fluid
c cross section
cond condenser
cf Cross flow
e Equivalent
SiO2 Silicon dioxide
SDBS Sodium Dodecyl Benzene Sulfonate
SDS Sodium Dodecyl Sulfate
T Temperature, oC
TEM Transmission electron microscopy
TiO2 Titanium dioxide
U, Uo Overall heat transfer coefficient, W/m2K
u Velocity,m/s
V Volumetric flow rate, m3/s
v Volume
WO3 Tungsten trioxide
W Weight (m)
ZnO Zinc oxide
Greek symbol ρ Density, kg/m3 � Volume fraction µ Dynamic viscosity, Ns/m2 ε Heat exchanger effectiveness ∆p Pressure drop,Pa η# Total surface temperature effectiveness α heat transfer area/ volume
ψ total dimensionless entropy generation S���/&Q/(T* + T,-. λ dimensionless length
τ dimensionless wall and fluid temperature different
[(Tw-Ti)/Tw]

xxiii
eff Effective
eva evaporator
f Fluid/ basefluid/fin
fg Flue gas
g Gas
h Hydraulic
i Inner or inlet
l longitudinal, liquid
m Mean
max Maximum
min Minimun
n Number of row
nf Nanofluids
o Outer, outlet, overall
p Particle
red Reduction
s Shell, spacing
sav Saving
t Tube, transverse, total
w Wall

xxiv
List of Appendices
Appendix A Curriculum Vitae 142
Appendix B List of Publications 143
Appendix C Inivitation as a reviewer 144
Appendix D Invitation to the 2nd Annual World Congress of
Nano-SandT-2012, China
149
Appendix E Invitation to submit paper to Frontiers in Heat
Pipes (FHP)
150
Appendix F Speech invitation from Nanoscience and
Technology 2013, China
151
Appendix G Sample calculations 152

1
CHAPTER 1 INTRODUCTION
1.1 Introduction
Challenges such as climate change, increase of fuel price and fuel security have
garnered significant attention from the international communities. There are growing
concerns on these issues as industrial revolution increases the demand for energy
substantially. Having said this, much attention has been focused towards introducing
highly efficient devices and heat recovery systems for better utilization of energy. It is
also reported that, 80% of the total energy consumption in the industry is originated
from fossil fuel based energy (Abdelaziz et al., 2011). United States Energy Information
Administration (2012) reported that 2.47×10¹⁵ Joule energy was consumed by the
industrial sector in 2009 while Teke et al., (2010) revealed that about 26% of the
industrial energy is wasted in the form of hot gas or fluid. Consequently, any small
improvement in the efficiency of heat recovery systems can result in significant energy
savings.
Heat recovery systems utilize heat exchangers to recover the waste heat. This
provides benefits in terms of energy and cost saving as well as reducing green house gas
emissions. Adding fins and increasing the heat transfer area are the common methods
used to enhance the efficiency of the heat recovery systems. However, these approaches
lead to a larger and bulkier heat exchanger. Furthermore, Kulkarni et al., (2008) have
concluded that the usage of fins and micro channels have reached the optimum limit of
its efficiency.
The efficiency of a thermal system correlates with the thermal conductivity of
heat transfer fluids (Murshed et al. 2008a). Conventional heat transfer fluids such as
water, ethylene glycol and engine oil are widely used in heat recovery systems. They
are cheap but possess low thermal conductivity. For instance, the thermal conductivity
of water and ethylene glycol are 0.613W/mK and 0.252W/mK, respectively (Incropera

2
et al., 2007). Choi (2009) revealed that the efforts to improve the performance and
design of compact engineering equipment are hindered by the low thermal conductivity
of conventional heat transfer fluids.
Therefore, there is an urgent need to develop a new generation of heat transfer
fluid with higher thermal conductivity. The development in nanotechnology has enabled
the suspension of nano-sized particles into a base fluid which results in a product known
as nanofluid. The pioneering works of nanofluids were started by Argonne laboratory in
the early 90’s. Nanofluid is a suspension of nanoparticles (Al2O3 , TiO2 , Cu, CuO, etc)
in conventional base fluids (water, ethylene glycol, engine oil, etc). Keblinski (2009)
stated that the typical size of nanoparticles used in nanofluids ranges from 1 – 100nm.
The base fluid thermal conductivity are substantially improved through the addition of
nano-sized particles (Eastman et al., 2001; Beck et al., 2008; Evans et al., 2008; Han,
2008; Murshed et al., 2008b; Nasiri et al., 2012; Paul et al., 2012). It is also known that
the thermal conductivity of the fluid is proportional to convective heat transfer.
Extensive studies found that convective heat transfer augmentation does correlate with
nanoparticles volume fractions (Daungthongsuk and Wongwises, 2007; He et al., 2007;
Kim et al., 2009). With these characteristics, nanofluids have the potential to replace
conventional heat transfer fluids in various heat exchanger applications.
Besides thermal conductivity, viscosity of nanofluids also plays an important
role in determining its performance. It is known that fluid’s viscosity determines the
pumping power of the system. Mahbubul et al., (2012) conducted a comprehensive
review on the nanofluids viscosity characteristics. The effects of particle loading, size
and shape, temperature on the nanofluids viscosity are discussed thoroughly in this
review. Most of the researchers indicate that nanofluids viscosity increases with particle
concentration (Duan et al., 2011; Yang et al., 2012; Fedele et al., 2012; Bobbo et al.,
2012).

3
However, other thermo-physical properties such as density and specific heat
have received limited attention. Vajjha et al., (2009) investigated three types of ethylene
glycol/water-based nanofluids: aluminium dioxide, antimony-tin oxide and zinc oxide
nanofluids. As expected, density of these nanofluids is higher than base fluid. It is also
found that the density slightly decreases with the increase of temperature. There are also
few experimental studies which focused on the specific heat of nanofluids. For instance,
Zhou and Ni (2008) studied water based aluminium oxide nanofluids. Findings implied
that the specific heat of water decreases when the aluminium oxides nanoparticles
volume fraction increases from 0 to 21.7%. Similar conclusion is derived by Zhou et al.,
(2010) who investigated the specific heat of copper oxide/ethylene glycol nanofluids.
Another researcher, Jung et al., (2010) investigated three types of water-based
nanofluids: silicon dioxide, titanium dioxide and aluminium oxide nanofluids. They
concluded that the specific heat of nanofluids decreases as the nanoparticles mass
loading increases from 0.5% to 20%. In addition, it is observed that nanoparticle size
has limited or minor effect on the nanofluids’ specific heat.
Because of its improved thermo-physical properties and its myriad of
applications, nanofluid has received substantial attention among researchers. The
applications include engine cooling system (Leong et al., 2010; Peyghambarzadeh et al.,
2011a; Peyghambarzadeh, 2011b, Charyulu et al.,1999), electronic cooling (Roberts
and Walker, 2010; Ijam and Saidur, 2012; Tsai and Chein, 2007), air conditioning (Park
and Jung, 2007), water heater (Kulkarni et al.,2009), solar collector (Yousefi et al.,
2012; Otanicar et al., 2010) and etc. Most of the studies indicated that the thermal
systems operated with nanofluids showed enhanced efficiency. This again shows that
nanofluids have the potential to emerge as a new generation of heat transfer fluid.

4
1.2 Background of problem
Hot gases are common by-products in the industrial sector especially through
operation of boilers or heating plants. During this operation fuel combustion releases its
chemical energy to produce combustion products with high temperature. Saidur et al.,
(2010) reported that the main source of heat loss (10–30%) in a boiler is through the
flue gasses. Figure 1.1 describes the typical energy balance of a boiler. It can be seen
that 10 to 30% of the energy content releases through flue gasses in operation of the
boiler.
Figure 1.1 Typical energy balance of a boiler (Jayamaha, 2008)
The remaining waste heat in the flue gasses can be recovered by using heat
recovery exchanger. Shell and tube heat exchanger and heat pipe or thermosyphon air-
preheater are commonly used for this purpose. For instance, Pandiyarajan et al., (2011)
utilized shell and tube exchanger to recover waste heat from the engine diesel exhaust.
Saneipoor et al., (2011) studied the same type of heat exchanger used in a cement plant.
Shi et al., (2011) used fin and tube heat exchanger to recover sensible and latent heat
from the heat recovery steam generator. Thermosyphon or heat pipe heat exchanger has
Boiler
Flue gas 10 to 30%
65 to 80 % Fuel heat 100%
Radiation losses 0.5 to
2% Blow down 1 to 2%

5
also been used in various heat recovery applications (Yang et al., 2003; Noie and
Majideian, 2000; Srimuang and Amatachaya, 2012).
The optimization of energy use in industry through heat recovery exchanger can
reduce the emission of green house gasses such as CO2 and lead to social and economy
benefits (Stijepovic and Linke, 2013; Xu et al., 2013). Therefore, this study investigates
the thermal and energy performance of heat recovery exchanger operated with
nanofluids. Nanofluids are selected due to its enhanced thermal conductivity compared
to that of base fluid. Application of this novel fluid will lead to thermal performance
improvement of the heat recovery exchanger.
The experimental study on thermal conductivity, viscosity and density of
nanofluids are included in the present study. It tried to evaluate nanofluid’s thermo-
physical characteristics as a heat transfer fluid. The selected heat recovery devices are
shell and tube heat exchanger and thermosyphon air preheater. It focuses on recovering
waste heat from hot flue gas produced by a heating plant. The recovered waste heat can
be used to pre-heat air for combustion process, building heating, and etc. Estimation on
size reduction of the shell and tube heat exchanger without altering its thermal
performance is also included. Furthermore, the energy required to heat the air for
combustion process have been estimated.
The advantages of using nanofluids compared to base fluid cannot be merely
judged by their thermal performance as viscosity should also be taken into
consideration. It is known that viscosity of the base fluid increases with the increase of
particle volume fractions; consequently, it will affect the friction loss characteristic.
There must be an optimum trade-off between both parameters to justify performance of
nanofluid as a new generation of heat transfer fluid. Entropy generation analysis
included in the present study is a powerful approach to study on this aspect. From here,
both heat transfer enhancement and friction loss are evaluated.

6
Overall, this study aims to answer the following questions
(a) What is the effect of adding nanoparticle on the thermo-physical properties of
base fluid?
(b) What is the thermal and energy performance of shell and tube heat recovery
exchanger and thermosyphon air-preheater operated with nanofluid used to
recover waste heat from flue gas/hot gas?
(c) What is the performance of nanofluids flowing in a circular tube under constant
wall temperature in terms of entropy generation?
To the best of author’s knowledge, there has not been any study which focuses
on using nanofluids for heat recovery application. Most studies focused on the
fundamental properties of the nanofluids such as thermal conductivity, viscosity and
convective heat transfer performance. On the entropy analysis aspect, author found that
up to now, none of the study focuses on the nanofluids flow through a circular tube
under constant wall temperature. Literatures revealed that most of the studies emphasize
on the constant heat flux condition. It is hope that the present study not only fills the gap
in this area but also provide alternative approach to optimize the energy consumption in
the industry.
1.3 Overview of the study
Schematic diagram as shown in Figure 1.2 depicts the overvall study on thermal
and energy performance of heat recovery exchanger operated with nanofluids. The first
section covers the investigation of thermo-physical properties of nanofluids which
includes thermal conductivity, viscosity and density. Thermo-physcical properties are
obtained from literatures, mathematical correlations and present experimental data. This
is because of the pure metallic (such as copper) based nanofluids are not suitable to be
produced via two-step method due to particles’ oxidation process. Particles’ oxidation

7
will affect its thermal conductivity characteristics. Therefore, data from literatures and
mathematical correlations are required. In the latter section, nanofluids were used as
heat transfer fluids in the heat exchanger. Kern and effective-NTU methods are
combined to conduct the analysis of shell and tube heat exchanger. These approaches
are rarely used in analysis of nanofluids operated heat exchanger. For the thermosyphon
heat exchanger, effective-NTU approach is used to investigate its thermal and energy
performance. The function of heat exchangers is to recover heat from flue gas/ hot gas
released. Entropy generation analysis to investigate the efficiency of nanofluids as heat
transfer fluid was also conducted in the present study.

8
Figure 1.2 Overview of the study
Thermo-physical
properties of nanofluids
• Experimental
measurements
• Literatures and
mathematical
correlations
Flue gas/hot gas waste
heat recovery through
heat exchanger
• Shell and tube
• Thermosyphon air
preheater
Modelling of thermosyphon
air-preheater heat exchanger
• Thermal performance
• Energy performance
Modelling of shell and tube
heat exchanger
• Thermal performance
• Energy performance
Entropy analysis of
nanofluids flow through a
circular tube
9
1.4 Objectives of the study
There are considerable nanofluid related researches found in the existing
literatures. It is noted that most of the works focused on the thermal conductivity,
viscosity and convective heat transfer characteristic of nanofluids. These studies found
that nanofluids have the potential to replace conventional heat transfer fluids in the
thermal systems. However, there is limited study focusing on recovering waste heat
from the flue gas or hot gas using nanofluids. The recovered heat can be used for many
other applications which eventually leads to energy saving and reduction of green house
gas emission. Keeping this in mind, the objectives of present study are as follows:-
(a) To investigate the effect of aluminium oxide and titanium dioxide based
nanoparticles on thermo-physical properties (thermal conductivity, viscosity and
density) of water and ethylene glycol/water mixtures-based fluids
(b) To extend a mathematical model for the heat transfer and energy performance of
shell and tube heat recovery exchanger operated with ethylene glycol and water-
based copper nanofluid and ethylene glycol/water mixtures based aluminium
oxide and titanium dioxide nanofluids
(c) To analyse the entropy generation of water-based aluminium oxide and titanium
dioxide nanofluids flow using circular tube with constant wall temperature
(d) To evaluate the performance of air-preheater operated with water-based
aluminium oxide and titanium dioxide nanofluids as a working fluid.
1.5 Scope of the study
The scope of the present study is as follows:
(a) Water and ethylene glycol/water mixture were used as base fluid in the
experimental works.

10
(b) Thermal conductivity, viscosity and density were the thermo-physical properties
measured in the present study. Aluminium oxide, Al2O3 (particle size: 13nm and
less than 50nm) and titanium dioxide, TiO2 (particle size: 21nm) were the
nanoparticle used in the experiment.
(c) Two types of heat recovery exchanger were used to recover the waste heat from
flue gas/hot gas. They are shell and tube and thermosyphon air-preheater heat
exchanger.
(d) Analysis of the nanofluids application in shell and tube and thermosyphon air-
preheater heat exchangers was done using mathematical modelling. Experiments
are not conducted since there is no experimental facility in University of
Malaya. Moreover, it is very expensive to establish a flue gas heat recovery
system. Ethylene glycol and water-based copper nanofluid and ethylene
glycol/water mixtures-based aluminium oxide and titanium dioxide were used in
the shell and tube heat exchanger modelling while, water-based titanium dioxide
and aluminium oxide nanofluids were considered in the thermosyphon air-
preheater and entropy generation modelling.
(e) In the mathematical modelling, nanofluids properties are assumed to remain
constant or invariant when applied to the heat recovery exchangers. It is
presumed that the nanoparticles in the base fluid are well dispersed and the
nanofluids exhibit optimum thermal properties.
1.6 Outline of the thesis
This thesis is divided into 5 chapters. Each of the chapters is briefly explained as
follows:
Chapter 1: Background of problem, overview, problem statement, purpose (objective)
and scope of the study are presented and discussed thoroughly in this chapter.

11
Chapter 2: This chapter covers in-depth literature on the nanofluids as heat transfer
fluid, its thermo-physical characteristics, convective heat transfer, entropy generation
and application of nanofluids in heat pipe and shell and tube heat exchanger. Potential
of energy saving using nanofluids is also discussed in this chapter.
Chapter 3: This chapter explains in detail the method used in the present study. It
includes the synthesis of nanofluids, nanofluids thermo-physical properties
measurement, modelling of thermal and energy performance of shell and tube heat
exchanger, size prediction of heat exchanger, entropy generation of nanofluids flow and
thermal performance of thermosyphon air pre-heater heat exchanger.
Chapter 4: The result and discussion of the project are included in this chapter. They
are presented in graphical form (graphs) which includes thermo-physical properties of
nanofluids, thermal and energy performance of heat recovery exchangers, and entropy
analysis of nanofluids flow. The results are critically analysed and discussed which
covers the theory and physical mechanism contributing to the results.
Chapter 5: This is the last chapter of the thesis where the conclusion deduced from this
project is presented. Apart from that, author also suggests few recommendations for
future research work.

12
CHAPTER 2 LITERATURE REVIEW
2.1 Introduction
This section reviews the preparation method of nanofluids, its thermo-physical
properties such as thermal conductivity, viscosity, density and specific heat. The
nanofluids convective heat transfer performances, entropy generation as well as the
application of nanofluids in heat pipe and shell and tube heat exchanger are discussed in
the later sections. In the last section, the potential of energy saving through nanofluids
researches are presented.
2.2 Heat transfer with nanofluids
The addition of small particles into base fluid to improve base fluid’s thermal
conductivity has been in use since the establishment of Maxwell treatise. However, this
effort is focused on the mili-micrometer sized particles. Murshed et al., (2008a) and
Sarit et al., (2008) revealed that the limitations of this method include the rapid settling
of particles, wear out of the heat transfer device’s surface and increase of pressure drop
and pumping power.
The concept of suspending nanoparticles in the base fluid (known as nanofluids)
was first presented in 1995 (Choi, 2009). The author revealed that nanofluids offer
improved thermal properties and are able to overcome the limitations posed by
suspension with mili- or micro-sized particles. Comparison between suspension with
nanoparticles and micro-sized particles is shown in Table 2.1. From Table 2.1, it is
found that nanoparticles offer greater advantages compared to the micro particles.

13
Table 2.1 Comparison between micro and nanoparticles (Sarit et al., 2008)
Micro particles Nanoparticles
Stability Settle Stable Surface/volume ratio 1 1000 times higher than
microparticles Conductivity (same volume fraction)
Low High
Clog in micro channel Yes No Erosion Yes No Pumping power Large Small Nanoscale phenomena No Yes
2.3 Preparation of nanofluids
Rapid development in nanotechnology has made it possible to produce materials
in nano dimension (nanoparticles). Nanoparticles are usually available in the form of
powder and have higher thermal conductivity than fluid. Being in nano scale,
nanoparticles exhibit unique and enhanced physical and chemical characteristics
compared to that of bulk materials (Murshed et al., 2008a; Yu et al., 2007). Nanofluid is
not just a simple mixture of nanoparticles and base fluids. The nanofluid must be a
stable and durable suspension, with no chemical reaction and minimum particles
agglomeration (Wang and Mujumdar, 2007). A stable nanoparticle suspension is
necessary to produce nanofluids with an optimum or enhanced thermal properties
(Keblinski et al., 2005; Ghadimi et al., 2011).
Nanofluids can be produced through a two-step or single-step method. In two-
step method, nanoparticle dry powders are produced either by physical or chemical
synthesis. Then, it will be dispersed into the base fluid using ultrasonic disruptor
(Murshed et al., 2005; Hwang et al., 2006; Duangthongsuk and Wongwises, 2009) or
high pressure homogenizer (Hwang et al., 2008). The limitations and disadvantages of
this method are sedimentation, clustering and aggregation of nanoparticles with respect
to length of time. Nanoparticles are prone to agglomeration due to the attractive force
between them known as van der Waals attractive force. Typical transmission electron

14
microscopy (TEM) images of nanoparticles in water base fluid are shown in Figure 2.1.
From Figure 2.1, it is observed that there is slight particle agglomeration existent in the
base fluid suspension.
(a) TiO2/water (b) Carbon black/water
Figure 2.1 (a) Typical Transmission electron microscopy (TEM) image of titanium
dioxide/water nanofluids (Duangthongsuk and Wongwises, 2009) (b) carbon black/
water nanofluids (Hwang et al., 2008)
A stabilizer agent which is able to provide repulsive force is needed to overcome
the attractive force. Apart from that, two-step method is preferable for oxide type
nanoparticles compared to that of metallic type (Mahbubul et al., 2012; Ghadimi et al.,
2011; Wang and Mujumdar, 2007). Sarit et al., (2008) emphasized that two-step method
is not an effective approach for metal nanoparticles such as copper. Figure 2.2 shows
the typical nanofluids subjected to ultrasonication process.

Figure 2.2
Single-step method is a technique where fabrication of nanoparticles and
nanofluids synthesis is
technique condenses the nanoparticles vapour directly to the lower vapour pressure base
fluid in a vacuum chamber. Argonne laboratory used this method in preparing ethylene
glycol based copper nanofluids (
capability of reducing the nanoparticle agglomeration
prevention of nanoparticles oxidation (Yu et al., 2007). However, two
preferred due to its low cost nature, therefore
2.2 summarizes synthesis method
that two-step method is widely used in nanofluid research.
Figure 2.2 Ultrasonication process of nanofluids
step method is a technique where fabrication of nanoparticles and
is done in a same single process. In this method, direct evaporation
technique condenses the nanoparticles vapour directly to the lower vapour pressure base
fluid in a vacuum chamber. Argonne laboratory used this method in preparing ethylene
glycol based copper nanofluids (Eastman et al., 2001). Advantages of this method i
capability of reducing the nanoparticle agglomeration (Murshed et al., 2008a
prevention of nanoparticles oxidation (Yu et al., 2007). However, two
preferred due to its low cost nature, therefore it is potential for bulk production. Table
2.2 summarizes synthesis methods used in nanofluid research. This can be
step method is widely used in nanofluid research.
Titanium
probe
15
of nanofluids
step method is a technique where fabrication of nanoparticles and
done in a same single process. In this method, direct evaporation
technique condenses the nanoparticles vapour directly to the lower vapour pressure base
fluid in a vacuum chamber. Argonne laboratory used this method in preparing ethylene
). Advantages of this method is the
Murshed et al., 2008a), and
prevention of nanoparticles oxidation (Yu et al., 2007). However, two-step method is
potential for bulk production. Table
. This can be concluded

16
Table 2.2 Synthesis method in nanofluids formulation
Base fluid Nanoparticles Synthesis
method
References
Water Alumina(15-50nm) Two-steps
Zhu et al., (2009)
Ethylene glycol
titanate nanotube (10nm,Length =~100nm)
Two-steps Chen et al., (2009)
Water Alumina(<30 ± 5 nm)
Two-steps Do et al., (2010)
60%Ethylene glycol,40% Water
Alumina,silicon dioxide, Copper(I)oxide
Two-steps Vajjha et al., (2010)
Ethylene glycol
Copper Two-steps Yu et al., (2010)
Ethylene glycol
Diamond Two-steps Yu et al., (2011)
De-ionized water
Alumina (10-30nm) Two-steps Lin et al., (2011)
Water Silver Single step Paul et al., (2012) De-ionized water
Alumina (43nm); copper oxide (30nm)
Two-steps Suresh et al., (2012)
De-ionized water
Alumina, titanium dioxide, zinc oxide
Two-steps Putra et al., (2012)
Ethylene glycol
Copper Single step De Roberties et al., (2012)
2.4 Thermal conductivity of nanofluids
Nanofluids’ thermal conductivity represents the ability of the heat to flow. It is
the most important characteristic used to justify the suitability of nanofluids as a heat
transfer fluid. Substantial studies have been conducted to investigate the factors
affecting the thermal conductivity of nanofluids. Summary of nanofluids thermal
conductivity related studies is depicted in Table 2.3.
17
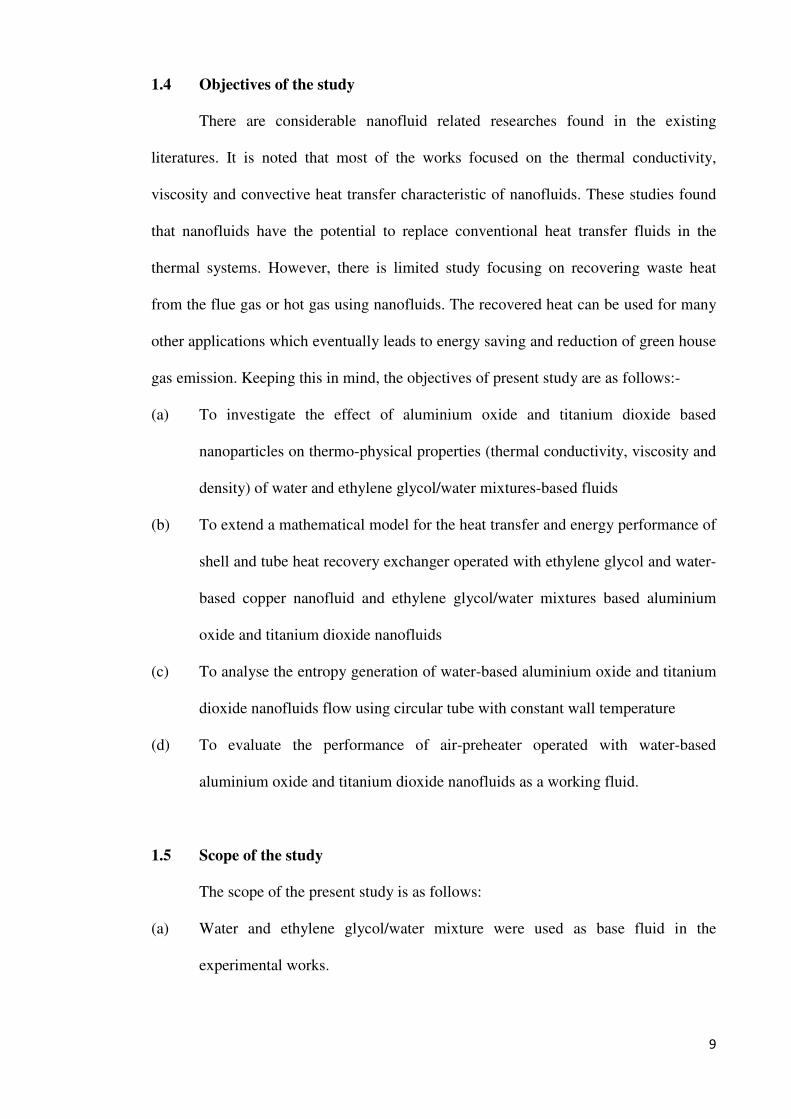
Table 2.3 Nanofluids thermal conductivity related studies
Reference Base fluid Particle Study related to
Temp Shape /
size
Vol.%
/Wt.%
Surfactant
/ pH
Particle
Eastman et al., (2011)
Ethylene glycol
Cu √ √
Murshed et al., (2005)
Deionized water
TiO2 √ √
Liu et al., (2006)
Water Cu √ √
Yoo et al., (2007)
Water, ethylene glycol
TiO2,Al2O3, Fe,WO3
√ √ √
Zhang et al., (2007)
Toluene,water Au,Al2O3, TiO2,CuO, CNT
√ √ √ √
Beck et al., (2007)
Ethylene glycol
Al2O3 √ √
Lee et al., (2008)
Deionized water
Al2O3 √
Li et al., (2008) Water Cu √ √ Duangthongsuk and Wongwises, (2009)
Water TiO2 √ √
Mintsa et al., (2009)
Distilled Water
CuO,TiO2 √ √ √ √
Zhu et al., (2009)
Water Al2O3 √ √
Yu et al., (2009) Ethylene glycol
ZnO √ √
Chandrasekar et al., (2010)
Water Al2O3 √
Yu et al., (2010) Ethylene glycol
Cu √ √ √
Teng et al., (2010)
Water Al2O3 √ √ √
Lee et al., (2011)
Deionized water
SiO √ √
Lin et al., (2011)
De-ionized water
Al2O3 √ √
2.4.1 Experimental study of nanofluids’ thermal conductivity
There are several factors that affect the thermal conductivity of nanofluids. The
factors are particle volume fraction, particle size and shape, temperature, surfactant and
pH. The following sub-sections will describe all these factors in detail.

18
2.4.1.1 Effect of particle volume fractions
The distinguished research of Eastman et al.,(2001) which draws great interest
and attention of thermal scientists and engineers reported that thermal conductivity of
ethylene glycol based copper (<10nm) nanofluids with 0.3 vol.% was enhanced up to
40% compared to that of base fluid. Study found that the metallic-based nanofluids
provide higher thermal conductivity than oxide type of nanofluids. This is attributed to
higher intrinsic thermal conductivity of Cu nanoparticle compared to that of Al2O3 and
CuO. Another reason is that the Cu particle used in this study was four times smaller
than oxide particle. Same type of nanofluids was investigated by Yu et al., (2010). In
contrast to the Eastman’s result, only 11% enhancement was obtained for the same
particle loading. This discrepancy may be due to different synthesis methods of
nanofluid preparation and type of dispersant used in both studies. In another research,
Liu et al. (2006) found that water containing only 0.1 vol % of Cu nanoparticles
exhibited 23.8% improvement in thermal conductivity. The nanofluids in their study
were produced through one step chemical reduction method.
Up to now, most of the studies implied that the thermal conductivity increases
with respect to particles volume fractions. Some researchers indicated that a linear
thermal conductivity with respect to particle’s loading relationship was discovered.
However, there are researchers that observed a non-linear thermal conductivity trend.
Chandrasekar et al., (2010) studied thermal conductivity of water based Al2O3
nanofluids and concluded linear dependency on the particle volume fractions. For the
lower range of Al2O3 volume fractions (0.01 to 0.3 vol.%), Lee et al., (2008) showed
that thermal conductivity increased linearly with particle volume fractions. However, in
another studies, non-linear relationship was observed for nanofluids thermal
conductivity with low concentration. Murshed et al., (2005) found that, thermal
conductivity of TiO2 nanofluid showed non-linear relationship for volume fractions less

19
than 2%. This could be due to the addition of cetyltrimethylammonium bromide
(CTAB) surfactant into the base fluid in their study. Non linear relationship was also
discovered for nanofluids containing up to 5 vol. % of ZnO particle (Yu et al.,2009).
The slope of the thermal conductivity enhancement with respect to particle volume
fraction was higher at lower volume fractions (about 0.2 to 0.7 vol. %) compared to the
slope at higher volume fractions (1 to 5vol.%). Authors explained that this was due to
the larger increase of nanofluids viscosity compared to thermal conductivity
enhancement.
Two types of nanofluids that are commonly used in researches are Al2O3 and
TiO2 nanofluids. Murshed et al., (2005) experimentally showed that thermal
conductivity of water based TiO2 nanofluids correlates with particle volume fractions.
With only 5 vol.%, of TiO2 nanoparticles, 29.7% and 32.8% thermal conductivity
enhancement were observed for nanofluids with TiO2 of �15nm and �10nm 3 40nm,
respectively. Comparison between water based Al2O3 and TiO2 nanofluids were carried
out by Yoo et al., (2007). Study revealed that by adding 1% nanoparticle volume
fraction, thermal conductivity enhancement of Al2O3 (4% enhancement) was lower than
TiO2 (14.4% enhancement) although it is known that Al2O3 has higher bulk thermal
conductivity than TiO2. This shows that particle’s thermal conductivity is not the major
factor to improve nanofluids thermal conductivity. The same study also found that
ceramic type nanofluids have lower thermal conductivity than metallic type nanofluids
under the same concentration. Beck et al., (2007) demonstrated the dependence of
Al2O3 nanofluids thermal conductivity on particle volume fractions. Duangthongsuk
and Wongwises (2009) performed research on TiO2/ water nanofluids with respect to
volume fraction up to 2%.
Another study done by Mintsa et al., (2009) covered a larger range of
nanoparticle volume fraction (up to 18%). Similar to the previous studies, these authors

20
experimentally pointed out that the nanofluids (Al2O3, CuO) thermal conductivity was
relatively higher than base fluid. The drawback of the addition of higher particle volume
fractions is the stability issue. Wu et al., (2009) revealed nanoparticles tend to
agglomerate at higher volume component. There are also studies focused on nanofluids
containing carbon nanotube. Hwang et al., (2006) highlighted that 11.3% enhancement
was achieved with addition of 1% of MWCNT into water. It has the highest thermal
conductivity improvement compared to that of CuO/water, SiO2/water and CuO/EG
nanofluids. Thermal conductivity of water containing 3wt.% MWCNT enhanced about
13% which is higher than predicted value from Maxwell correlation (Lee et al., 2011).
2.4.1.2 Effect of particle size and shape
Most of the researchers found that thermal conductivity of nanofluids with
smaller nanoparticle sizes tend to produce higher values compared to larger particles.
Chon and Kihm (2005) investigated the thermal conductivity of three different sizes of
Al2O3 nanofluids. Thermal conductivity of nanofluids with 11nm Al2O3 particles was
the highest compared to 47 and 150 nm alumina nanofluids. Smaller nanoparticle
increases the surface area and number of particles interactions. Sarit et al., (2008) added
that the heat transfer process happens on the surface of the particles thus higher thermal
conductivity of nanofluids is observed.
Another researcher, Yoo et al., (2007) revealed that particle size is the main
factor in affecting thermal conductivity compared to particle thermal conductivity.
Smaller particle sizes provide larger surface to volume ratios which facilitates
nanofluids heat transfer process. In their study, it was identified that nanofluids with
smaller TiO2 exhibited higher thermal conductivity than the bigger Al2O3 nanoparticles.
Vajjha and Das (2009) noted that effective thermal conductivity for ethylene
glycol/water mixture based ZnO (29nm) was 3% higher than nanofluids with ZnO

21
(77nm) for 2% volume fraction concentration. However, Mintsa et al., (2009) reported
that particle sizes of nanofluid have substantial effect on thermal conductivity only at
high operating temperatures. At ambient temperature, particle size has limited influence
on thermal conductivity. Murshed at al., (2005) found that thermal conductivity of
nanofluids with cylindrical particles is higher than spherical shape particle.
2.4.1.3 Effect of temperature
Beck et al., (2007) measured the thermal conductivity of ethylene glycol based
Al2O3 nanofluids at 298K to 411K. It was argued that, the thermal conductivity
characteristics of nanofluids at higher temperatures are almost similar to the base fluid.
This concludes that effect of Brownian motion only plays a minor role in nanofluids
thermal conductivity enhancement.
In contrast to the previous research, Murshed at al., (2008b) highlighted the
importance of Brownian motion of nanoparticles on nanofluids thermal conductivity.
Higher operating temperature will intensify the effect of Brownian motion of
nanoparticles which eventually contributes to formation of micro convection in the base
fluid. Subsequently, thermal conductivity enhancement is observed. The selected
nanofluids used in their study were Al2O3 nanoparticles with three different types of
base fluids (ethylene glycol, water and engine oil).
Duangthongsuk and Wongwises (2009) tested TiO2/ water-based nanofluids
thermal conductivity at three different temperatures, 15oC, 25oC, 35oC. It is
conclusively found that thermal conductivity is a function of temperature. Yu et al.,
(2009) reiterated that thermal conductivity of ethylene glycol based ZnO nanofluids
increases with temperature. The enhancement ratio is almost constant when the
temperature increases. Similar conclusion is deduced by Lin et al., (2011) who
investigated the water based Al2O3 nanofluids. However, Colangelo et al., (2011)

22
revealed that temperature has no effect on the diathermic oil nanofluids thermal
conductivity.
2.4.1.4 Effect of surfactant and pH
Addition of surfactant is a common method to minimize the particles
sedimentation and agglomeration. These are the two phenomena which determine the
nanofluids’ stability. The particles downward movement due to the nature of
gravitational force is defined as sedimentation while agglomeration is referred to as the
formation of cluster of particles (Bhattacharya, 2005). Surfactant is a long organic
molecule which can be classified into few types: anionic (SDBS and SDS), cationic
surfactant (CTAB) and non-ionic surfactant(PVP).According to Ghadimi et al., (2011),
surfactant is capable of modifying the particles surface from hydrophobic to hydrophilic
surface and vice versa. The surfactant molecules will attach to nanoparticle and create
repulsive force. This force prevents the nanoparticles from getting closer to each
another.
Li et al., (2008) studied the thermal conductivity of Cu/H2O nanofluids under
various loadings of SDBS surfactant. Authors reiterated that addition of surfactant
increases the nanofluids thermal conductivity. However, thermal conductivity decreased
when the loading exceeded the optimum concentration. Minzheng et al., (2012)
investigated the influence of SDBS, PVP, SDS and CTAB on thermal conductivity of
nanofluids. Similar to the previous study, it indicated that there is an optimum level of
concentration for every type of surfactant. Other researchers who used surfactant in
their experiments are Murshed et al., (2008a) (CTAB); Wang et al., (2009)
(SDBS),Hwang et al., (2006) (SDS), Chen and Xie (2010) (Gemini)
The pH value is associated with the electrostatic charge around the
nanoparticles. Zeta potential is a parameter usually used to quantify this surface charge.

23
To get a stable suspension, pH must be kept far from the iso-electric point (IEP). Iso-
electric point refers to zero zeta potential. At this stage, the repulsive force is
minimized; hence, there is a higher tendency for particles to agglomerate. If the pH
deviates from IEP, the electric double layer (EDL) is strong enough to resist the
particles from getting closer to each another (Lee et al., 2011). The authors successfully
identified pH 6 as the IEP value for SiC/water nanofluids. Li et al., (2008b) showed that
the thermal conductivity of Cu/water nanofluids is higher at pH 8.5-9.5. The authors
explained that, the surface charge around the nanoparticles is the highest at this
condition. Zhu et al., (2009) observed that Al2O3/water nanofluids have higher zeta
potential value at 8-9 pH. This contributes to uniform distribution of nanoparticles in
the suspension and leads to higher thermal conductivity.
2.4.2 Theoretical model of nanofluids’ thermal conductivity
The models used to predict the nanofluids thermal conductivity are classified
into two (2) categories. They are static and dynamic models. Typical static models are
Maxwell and Hamilton Crosser models as depicted in Equations (2.1) and (2.2),
respectively.
k���k� 5 k� 6 2k� 6 2�8k� + k�9k� 6 2k� + �8k� + k�9 (2.1- k���k� 5 k� 6 (n + 1-k� + (n + 1-� + 8k� + k�9k� 6 (n + 1-k� 6 �8k� + k�9 (2.2- where k = thermal conductivity; eff = effective, p = particle; Ø = particle volume
fraction and n = shape factor
Maxwell model is based on the concept of conduction heat transfer through a
stagnant suspension of the spherical particles (Khanafer and Vafai, 2011). Both models
are function of particle volume fractions and thermal conductivity of particle and base

24
fluid. However, Maxwell model is only valid for spherical particle. Hamilton Crosser
model is applicable for both spherical and cylindrical particles due to the introduction of
shape factor, n in this model.
Several researchers have further improved these classical models by
incorporating the effect of interfacial layer (Yu and Choi, 2003; Yu and Choi, 2004;
Leong et al., 2006). It is presumed that each particle is surrounded by an ordered layer.
Inclusion of ordered layer increases the volume fraction of nanoparticles. Yu and Choi
(2004) improved the Hamilton-Crosser model to accommodate the non-spherical
nanoparticles. In this model, the interface is described as a confocal ellipsoid with a
solid particle.
Thermal conductivity model which incorporates particles Brownian motion is
started by Jang and Choi (2004). Authors proposed that Brownian motion is an
important factor for heat transport of nanoparticles suspended in a base fluid. This
contradicts with the classical approach which assumes the discrete particles are stagnant
and motionless. The proposed model is developed based on several mechanisms such as
collision between base fluid molecules, thermal diffusion of nanoparticles, collision
between nanoparticles due to Brownian motion and thermal interaction of dynamic
nanoparticles with base fluid molecule.
Another well known model based on Brownian motion is developed by Prasher
et al., (2006). The proposed model considers the effect of interfacial thermal resistance
between the nanoparticles and liquid. Authors proposed that the thermal conductivity
enhancement of nanofluids is due to localized convection caused by nanoparticles’
Brownian motion. The proposed model is a combination of Maxwell-Garnett (MG)
conduction and convection models.
Although numerous models have been developed, at present there are no model
available to predict the nanofluids thermal conductivity accurately (Khanafer and Vafai,

25
2011). Thus, Corcione (2011) and Khanafer and Vafai (2011) developed empirical
models based on the experimental data available in the literatures. For instance, the
model constructed by Khanafer and Vafai is valid and suitable for water based Al2O3
and CuO -based nanofluids.
2.5 Viscosity of nanofluids
Viscosity of nanofluids is influenced by several factors. The main factors are
particle volume fraction and operating temperature and rheology behaviour of nanofluid
which are discussed in sub-section 2.5.1. Sub-section 2.5.2 discusses the theoretical
model of nanofluids viscosity.
2.5.1 Experimental study of nanofluids’ viscosity
Earlier works on nanofluid were mainly focused on its thermal conductivity and
convective heat transfer performance. However, nanofluids viscosity characteristics also
deserve the same attention. Addition of nanoparticles increases nanofluids viscosity.
Viscosity represents the resistance of fluid to flow and it is associated with the amount
of pressure drop. There are two important issues concerning nanofluids viscosity
characteristics. Firstly, common factors such as particle volume fractions and size,
surfactant and operating temperature affecting the nanofluids viscosity. The second
issue is whether nanofluids are classified as Newtonian or non-Newtonian fluid. The
Newtonian fluids have a constant viscosity with respect to different values of shear rate.
The shear stress of a Newtonian fluid is proportional with shear rate.
Most of the researchers found that nanofluids viscosity increases with
augmentation of nanoparticle volume fractions (Nguyen et al., 2008; Duangthongsuk
and Wongwises, 2009; Kole and Dey, 2010; Corcione, 2011; Mahbubul et al., 2012).
Addition of nanoparticles creates higher internal force in the base fluid (Kole and Dey,

26
2010). Phuoc and Massoudi (2009) proposed that nanoparticles tend to form a structure
in base fluid. The motion of the fluids were restricted which resulted in increase of
viscosity. Murshed et al., (2008b) added, the increase of nanofluids viscosity could be
attributed to nanoparticles clustering and surface adsorption. It is followed by the
increase of particles hydrodynamic diameter that leads to augmentation of viscosity.
Namburu et al., (2007) found that viscosity of water and ethylene glycol mixture based
CuO nanofluids increases along with particle loading. Lee et al., (2008) revealed that
non linear relation between Al2O3/water nanofluids viscosity increment and
nanoparticle concentration ranged from 0.01-0.3vol.% Author pointed out that the non
linear relation was resulted from longer sonication time (5 hours) which produced
uniform dispersed nanoparticles. It augmented the particle-particle interaction and
surface area of the well-dispersed nanoparticles. Consequently, hydrodynamic force
which acted on the particles in the fluid was also affected.
Nanofluids viscosity depends on the fluid operating temperature. Interparticle
forces tend to be weakened when temperature increases. The fluid can move freely
when the particles motion is not restricted. Chen et al., (2007) measured the rheological
behaviours of ethylene glycol based TiO2 nanofluids up to 8wt.% for temperature range
of 20oC to 60oC. Viscosity of low volume fraction Al2O3 (0.01 to 0.3 vol.%)/ water -
based nanofluids was studied by Lee et al., (2008). In this study, the author considered
temperature range of 21oC to 39oC. Duangthongsuk and Wongwises (2009) studied the
TiO2/water-based nanofluids at three different temperatures, 15oC, 25oC and 35oC. All
these studies concluded that nanofluids viscosity decreases with the increasing of fluid
temperature. Kulkarni et al., (2009) extended the nanofluids viscosity to very low
temperature to test the suitability of nanofluids in the cold climate countries. Varying
the temperature from -35oC to 50oC in the study showed that the viscosity of nanofluids
is higher at low temperatures.

27
There are considerable researches focused on the rheological behaviour of
nanofluids. Newtonian and non-Newtonian fluids have completely different
characteristics. Phuoc and Massoudi (2009) discovered that Fe2O3–deionized water
nanofluids rheological behaviour depends on the particle volume fraction. Addition of
0.2% (by weight) PVP surfactant, these nanofluids still exhibit shear thinning non-
Newtonian behaviour with 2% particle volume fraction. Similar trend was observed for
the same nanofluids with addition of 0.2% (by weight) PEO. Yu et al., (2009) revealed
that ZnO-ethylene glycol nanofluids demonstrate shear thinning non-Newtonian
behaviours when particle volume fraction exceeds 3%. Chen et al., (2008) found that
shear thinning behaviour is more obvious for higher weighted percentages of titanate
nanotubes/ water nanofluids. Kulkarni et al., (2009) found that water/ethylene glycol
mixture with 6.12% volume fraction of CuO shows Newtonian behaviour at -35oC.
Chen et al., (2007) found that a nanofluid with higher base fluid viscosity
(ethylene glycol) tends to have Newtonian characteristics. The authors measured the
rheological behaviours of ethylene glycol based TiO2 nanofluids up to 8% wt. for
temperature range of 20oC to 60oC. However, Kole and Dey (2010) concluded that
addition of small amount of Al2O3 nanoparticles into engine coolant base fluid
transforms its behaviour from Newtonian to non-Newtonian. In the most recent study
by Bobbo et al.,(2012) it was concluded that water based SWCNH and TiO2 nanofluids
exhibit Newtonian behaviour.
2.5.2 Theoretical model of nanofluids’ viscosity
There are a few analytical models available to estimate the viscosity behaviour
of nanofluids. It is interesting to find that most of the models are originated from
Einstein’s pioneering work. His model is based on the linearly viscous fluid containing
dilute spherical particles (�< 2%). The proposed formulation is shown in Equation (2.3)

28
µ��µ� 5 (1 6 2.5�- (2.3- The limitations of this formula are: it only considers non-interacting particle and
negligible inertia force in the fluid. Since then, many researchers have introduced new
models to overcome the mentioned limitations of Einstein’s model. An extended
Einstein's model for higher particle volume concentrations was developed by Brinkman
(1952) as shown in Equation (2.4)
µ�� 5 1(1 + �-?.@ µ� (2.4- Another researcher, Batchelor (1977) focused on the hydrodynamic and Brownian
effect of spherical particle as shown in Equation (2.5)
µ��µ� 5 (1 6 2.5� 6 6.2�?- (2.5- Lundgren (1972) developed a Taylor series formulation as shown in Equation (2.6)
µ���µ� 5 1(1 + 2.5�- 5 (1 6 2.5� 6 6.25�? 6 … . . - (2.6- Nguyen et al. (2007) presented viscosity correlation for water based copper oxide
(CuO) and alumina (Al2O3) nanofluid as shown in Equations. (2.7 – 2.9)
µ��µ� 5 (1.475 + 0.319� 6 0.051�? 6 0.009�F- for CuO (2.7- µ��µ� 5 (1 6 0.025� 6 0.015�?- for 36nm (Al?OF- (2.8- µ��µ� 5 0.904eQ.RSTF� for 47nm (Al?OF- (2.9-
2.6 Density and specific heat of nanofluids
To the best of the author’s knowledge, most researchers used single formulation
to determine the density of nanofluids. The density formulation is shown in Equation
(2.10).
ρ�� 5 (1 + �-ρ� 6 �ρ� (2.10-

29
Similar formulation has also been used by other researchers (Namburu et al., 2009 and
Kulkarni et al., 2009). From the formulation, it seems that the density of nanofluid tends
to increase with the increase of particle volume fraction.
The common formulation for specific heat used by researchers is shown in Equation
(2.11). Specific heat tends to reduce with particle volume fraction.
c�,�� 5 (1 + �-ρ�c�,� 6 �ρ�c�,�ρ�� (2.11-
2.7 Convective heat transfer coefficient of nanofluids
Zenaili et al., (2007) studied convective heat transfer performance of water
based Al2O3 nanofluid in a circular tube under constant wall temperature. Findings
implied that there is an augmentation of nanofluid convective heat transfer coefficient
with the increase of nanoparticle volume fraction. The authors concluded that heat
transfer coefficient is much higher than the predicted value from single phase heat
transfer correlation. Ding et al., (2007) observed that aqueous-based carbon nanofluid
offers the highest enhancement of convective heat transfer compared to that of aqueous-
based titanate and aqueous-based titania nanofluids. Bianco et al., (2009) employed
single and two-phase models in the analysis of nanofluids’ characteristics in a uniformly
heated circular tube. The authors found that the heat transfer performance of the base
fluid increases with the increase of particle volume fractions. However, this is
accompanied by the higher wall shear stress. The selected heat transfer fluid applied in
this study is water based Al2O3 nanofluids.
He et al., (2009) concluded that convective heat transfer coefficient has its
maximum value at the entrance region. The authors added that this property is highly
affected by nanofluid thermal conductivity. Other factors such as viscosity, Brownian,
lift and thermophoretic forces have minor effect on convective heat transfer coefficient
of nanofluids. Jung et al., (2009) studied the convective heat transfer of Al2O3 in

30
rectangular micro channels. It was observed that convective heat transfer coefficient of
1.8% Al2O3 nanofluid in laminar flow increases to about 32% compared to distilled
water. Kim et al., (2009) investigated the effect of convective heat transfer coefficients
derived from thermal conductivity. His study found that thermal conductivity
enhancement has a key role in nanofluids convection. However, an amorphous carbonic
nanofluid with similar thermal conductivity value as pure water did not show any
convection improvement at the turbulent flow. Vajjha et al., (2010) studied convective
heat transfer and pressure loss characteristics of nanofluids in turbulent flow.
Ebrahimnia-Bajestan et al., (2011) conducted the numerical investigation on the
heat transfer and pressure drop performance of several types of nanofluids flowing in a
circular tube subjected with constant heat flux. Analysis was done by using custom-
made FORTRAN language. For simplication and ease of analysis, single phase thermo-
physical properties models were used. Study revelead that, the heat transfer
performance of nanofluids are more accurately predicted by using particle dynamic
based thermal conductivity model compared to that of static based model. This shows
that particle’s Brownian motion play significant role in nanofluids’ thermal
performance.
Duangthongsuk and Wongwises (2012) used Einstein-Strokes’s model to
investigate the heat transfer coefficient of water based TiO2 nanofluids. Authors stated
that heat transfer coefficient of nanofluids increases with the increase of fluid’s
Reynolds number and particle volume fractions. In another hand, this performance
decreases when the tube length is increasing. Huminic and Huminic (2013) applied
three dimensional CFD analyses to evaluate the thermal performance of flattened tube
operated with nanofluids. Ethylene glycol based CuO nanofluids were applied in this
study. Similar with the previous studies, authors found that heat transfer performance
improved with particle volume fractions.

31
2.8 Entropy generation
Optimum design of a thermal system is achieved when the entropy generation is
minimized (Bejan, 1996; Sahin, 1998). Entropy generation and irreversibility are
reduced when there is a heat transfer improvement; however, higher pressure drop due
to fluid friction causes exergy loss in a thermal system (Moghaddami et al., 2011).
Numerous studies have been conducted to investigate the entropy generation of a
thermal system. Sahin (1998) analysed the entropy generation of several cross sectional
duct geometries under a constant wall temperature. The author found that circular duct
is favourable for high Reynolds numbers. Dagtekin et al., (2005) have applied this
concept on the circular duct with different shapes of longitudinal fins (longitudinal thin,
triangular and V-shape) using laminar flow. They revealed that the length, angle and
number of fins affect the entropy generation of a circular duct under constant wall
temperature. Ko (2006) obtained the optimal Reynolds number, using laminar flow in a
double sine duct with various wall heat fluxes using the same approach. Ko and Wu
(2009) conducted numerical study on entropy generation induced by turbulent forced
convection in a curved rectangular duct exposed to heat flux. Yilmaz (2009) found that
the temperature difference between fluid inlet and wall has an optimum value as it
minimizes entropy generation of a circular duct with constant wall temperature. Overall,
the above studies utilized conventional working fluids such as water and air.
Recently, there have been few studies which focused on the entropy generation
of nanofluids flow. Singh et al.,(2010) conducted an entropy generation investigation on
nanofluid (alumina/water) flow in circular tubes with three different diameters under
constant wall heat flux. The study indicates that nanofluids are suitable to be used in
conventional channels with laminar flow conditions, microchannels with turbulent flow
conditions and minichannels for both laminar and turbulent regimes. Moghaddami et
al., (2011) obtained optimum Reynolds number which minimized entropy generation
32
for water- alumina and ethylene glycol- alumina nanofluids using a circular tube under
constant heat flux. On the contrary to other researchers who focused on circular tube,
Bianco et al., (2011) conducted a study on entropy generation in a square tube.
Recently, Leong et al., (2012) conducted an entropy analysis on three types of heat
exchangers. They found that shell and tube with 50o helical baffles experiences the
lowest entropy generation compared to heat exchanger with segmental baffles and 25o
helical baffles. Ethylene glycol-based fluid containing up to 2% volume fraction of
copper nanoparticles were used in this study. Shalchi-Tabrizi and Seyf (2012)
investigated entropy generation of Al2O3 nanofluids in a tangential micro heat sink. It is
found that the total entropy generation decreases when the particles volume fraction or
Reynolds number increases and particle size decreases. The particle volume fractions
and sizes considered in the study were 0.01-0.04 and 29and 47nm.
2.9 Nanofluids in heat pipe and shell and tube heat exchangers
Heat pipe is regarded as one of the most efficient heat recovery exchanger. It is
capable of transmitting a large amount of heat, although it provides a smaller heat
transfer area (Liu et al., 2006). Shafahi et al. (2010) revealed that thermal resistance of a
cylindrical heat pipe decreases as the particle concentration increases or the particle size
decreases. Do et al., (2010) found that thermal resistance in the evaporator-adiabatic
section of the circular screen mesh wick heat pipes is reduced to about 40% for a heat
pipe operated with distilled water based 3.0 vol.% alumina nanofluid. The mechanism
attributed to this enhancement is due to the formation of a nanoparticles coating layer at
the evaporator section. It widens the evaporation surface; improves the surface
wettability and the capillary working performance. Mousa (2011) agreed that
nanoparticles tend to form a porous layer at the evaporation section which eventually
increases the surface wettability. Do and Jang (2010) found that the thermal

33
performance of a heat pipe operated with water based alumina (<1 vol. %) nanofluids
increased up to 100% at an optimum condition. The nanoparticle depositions on the
evaporator and condenser surface are the main reasons of thermal performance
enhancement or deterioration for oscillating heat pipe (Qu and Wu, 2011).
Shell and tube heat is another common type of heat exchanger. There is limited
study focusing on the application of nanofluids in shell and tube heat exchanger.
Farajollahi et al.,(2010) performed an investigation on water-water shell and tube heat
exchanger. Nanofluids used in their study were α-Al2O3/water and TiO2/water
nanofluids. Study found existence of optimum concentration for both types of
nanofluids. At lower concentrations, TiO2/water exhibited better heat transfer
coefficient than the α-Al2O3/water nanofluids. On the other hand, α-Al2O3/water
performed better at higher particle loading. Recently, Lotfi et al., (2012) found that
overall heat transfer coefficient of the shell and tube heat exchanger operating with
water based MWCNT nanofluids is higher than the base fluid. From here, it can be
noted that Kern and effective-NTU methods are rarely used in the nanofluids operated
shell and tube heat exchanger analysis. Most of the studies emphasize on the
experimental aspect rather than mathematical modeling.
2.10 Energy saving using nanofluids
Over the past few years, energy costs have been increased significantly. This is
getting even worse by the depletion of fossil energy resources. There are several
researches which indicate that application of nanofluids can reduce the need for energy
and pumping power. Kulkarni et al., (2009) revealed that for the same heat transfer
coefficient, there is the possibility to decrease the size of heating coil by employing
nanofluids as heat transfer fluid. Smaller heating coil requires lower coolant mass flow
rate and pump power. For instance, ethylene glycol/water mixture with 6 vol %

34
aluminium oxide nanoparticle needs only 7.1W power compared to 11.5W for heating
coil operates with base fluid. Strandberg et al., (2010) studied the performance of a
hydronic finned tube heating units operated with nanofluids. The required pumping
power for nanofluid was also reduced compared to base fluid in this application. The
authors stated this is attributed to the lower nanofluids velocity that is required for the
same heating output. Firouzfar et al., (2011) compared the application of methanol-
silver nanofluids and pure methanol in a thermosyphon heat exchanger of an air
conditioning system. For cooling of supply air stream, about 8.8 to 31.5% energy saving
was achieved for nanofluids compared to pure methanol. As for reheating the supply air
process, 18 to 100% was observed for nanofluids application.
Liu et al., (2011) experimentally investigated the performance of chillers
operated with MWCNT/water nanofluids. It was seen that, the power consumption was
slighty lower (about 0.8%) for chiller operated with nanofluids compared to water base
fluid. Recently, Zarifi et al., (2013) conducted a thermal-hydraulic modelling of
application of nanofluids in a VVER-1000 reactor core. Similar to the previous studies,
the authors suggested that the cooling process for reactor core with nanofluids requires
lower coolant flow rate.
It is obvious that there are many studies that indicated nanofluids contribute to
energy saving. But there are arguements that substitution of nanofluids as heat transfer
fluid may involves large investment. However, the recent market survey on the
nanoparticles shows that the average cost of the 100g nanoparticles is less than
RM1,000. Saidur et al., (2010) revealed the cost of nanofluids and the paybacks period
of nanofluids application are reasonable. The authors added that only small amount of
nanoparticles is needed to produce large quantities of nanofluids. Moreover the two-step
method is suitable for bulk production of nanofluids. The market price of the

35
nanoparticles is depicted in Table 2.4. It is found that oxide type nanoparticle is cheaper
than the pure metallic type.
Table 2.4 Market price of the nanoparticles (Sigma Aldrich, 2013; US Research
Nanomaterials, 2013)
2.11 Conclusion
This chapter summarizes the fundamental thermo-physical characteristics of
nanofluid coolants, their preparation, convective heat transfer and entropy generation,
application of nanofluids in heat pipe and shell and tube heat exchangers and energy
savings using nanofluids. Most of the researchers found that nanofluids exhibit
enhanced thermal conductivity and convective heat transfer coefficient compared to
base fluids. From the nanofluids’ applications point of view, it seems that favourable
results are obtained. Application of nanofluids can enhance the heat recovery
exchanger’s thermalperformance. An effective heat recovery exchanger will lead to
optimization of energy consumption in industrial sector. Optimization of energy use is
the main concern nowadays, due to the depletion of fossil fuel based energy, escalating
of fuel price and emission of green house gasses. Thus, a comprehensive study on this is
important to adderess the mentioned issues.
Num Particle Company Particle
size
(nm)
Purity
(%)
RM/gram
1 Al2O3 Sigma Aldrich 13 99.8 725.01 2 γ -Al2O3 Sigma Aldrich <50 740.02 3 TiO2 Sigma Aldrich 21 ≥99.5 650.02 4 Cu US Research
Nanomaterials, Inc
40 99.9 USD$296(RM964.96)
5 γ-Al2O3 US Research Nanomaterials, Inc
20 99+ USD$59 (RM192.34
6 TiO2 US Research Nanomaterials, Inc
20nm 99+ USD$76(RM247.76)

36
CHAPTER 3 METHODOLOGY
3.1 Introduction
This chapter describes the methodology used to conduct the study. The
methodology for thermal conductivity, viscosity and density measurements will be
described in sub-section 3.2. Sub-section 3.3 explains the mathematical modelling of
flue gas/hot gas heat recovery through shell and tube heat exchanger. In the last
subsection 3.4, the mathematical modelling of a thermosyphon air-preheater heat
exchanger is presented.
3.2 Thermal conductivity, viscosity and density measurements
This section covers the methodology used in thermo-physical properties
measurement. The type of nanoparticle and base fluids used in the experiment,
nanofluids’ preparation, and instruments used to measure thermal conductivity,
viscosity and density will be described in the subsequent sub-sections.
3.2.1 Preparation of Nanofluids
Two types of nanofluids are used in the present experimental. They are
aluminium oxide, Al2O3 and TiO2 based nanofluids. In order to investigate the particle
size effect on the base fluid thermo-physical properties, two different sizes of Al2O3 are
chosen: 13nm and particle size less than (<) 50nm. The selection of these sizes is
adequate since there is a large gap between these sizes. Bigger size is not selected
because it will limit the thermal conductivity of nanofluids. In another hand, the
selected size for TiO2 particle is 21nm. These particles are commonly used in
nanofluids researches as they are easy and inexpensive to purchase in market. In this
study, the nanoparticles were purchased from Sigma Aldrich. As for the base fluid,
author selected water and water/ethylene glycol mixture (50:50). Water/ ethylene glycol

37
mixture is selected due to the limitation of the ultrasonic equipment available in the
laboratory. High viscosity samples such as ethylene glycol is not suitable to be
sonicated by this equipment. As stated in the manual, the manufacturer recommended
that, samples with high viscosity to be diluted before the sonication process. This is to
avoid damage to titanium horn (see Figure 3.1).
Two-step method is used for nanofluids preparation. This method is inexpensive
and does not require high-end equipment as compared to single-step method. It is a
common method in nanofluid research (Lee et al., 2011; Nasiri et al., 2011 and Suresh
et al., 2012). Ultrasonic Cell Disruptor KS- 1200R with maximum power of 1200W and
20 kHz frequency as depicted in Figure 3.1 is used in the present study.
Figure 3.1 Ultrasonic cell disruptor KS-1200R
Each of the nanofluids is prepared in two different nanoparticle volume fractions
(0.1vol. % and 0.5vol. %). Higher value is not preferable in the present study as it
requires longer ultrasonication time. The preparation process of nanofluids is as
Sound control
chamber
Control panel
Titanium horn
38
follows: the mass of nanoparticles is weighed using digital weighing balance (Denver
Instrument SI-234, readability 0.0001g); the weighted nanoparticles are put into
distilled water or ethylene glycol/water mixture, then the mixture is sonicated for the
duration of 15 minutes. Ultrasonication process is able to produce stable and uniform
nanofluids suspensions compared to suspensions without ultrasonication process (Lee et
al., 2011).
3.2.2 Measurement of thermal conductivity
A hand-held thermal conductivity analyzer (KD2-Pro, Decagon) as shown in
Figure 3.2 was used to measure nanofluids thermal conductivity. It uses the concept of
transient line heat source to measure the thermal conductivity of nanofluids. There are
three (3) types of sensors available with this instrument, however a sensor (Single-
needle KS-1) with 6 cm length and 1.27 mm diameter is chosen since it is the best for
fluid’s thermal conductivity measurement. This needle has accuracy of ±5% W/mK for
thermal conductivity range from 0.2 - 2 W/mK. It is capable of measuring thermal
conductivity of fluid at -50oC to 150oC.
In order to obtain accurate results, average value from 5 measurements was
taken in this study. Several precaution procedures were strictly followed to minimize
the error during the measurement. They are:-
(a) The measurement is started only 15 minutes after the sensor is immersed in the
fluid sample. This is to ensure that the fluid and sensor reach equilibrium
temperature condition.
(b) The convection in the fluid is minimized or eliminated. This is done by
preventing bench shakes during the measurement. Any vibration of the bench
will create convection since the fluid will be moving.

39
Figure 3.2 KD2 Pro Decagon
3.2.3 Measurement of viscosity
As mentioned in sub-section 3.2.1, two types of nanofluids based coolant were
considered in this study. They are ethylene glycol/water mixtures and water-based
nanofluids. Thus, sub-sections 3.2.3.1 and 3.2.3.2 will describe the instruments used to
measure viscosity of the samples.
3.2.3.1 Ethylene glycol/water mixture-based nanofluids
The viscosity of the samples was measured using LVDV- III Ultra Brookfield
Rheometer as illustrated in Figure 3.3. The accuracy of this instrument is ±1.0% and the
revolution per minute (rpm) of the spindle, which will be immersed in the sample, can
be set to maximum 250.

40
Figure 3.3 LVDV –III Ultra Brookfield Rheometer with water bath circulator
Spindle is driven by a motor through a calibrated spring as seen in Figure 3.4.
The viscous drag of the fluid creates resistance against the spindle resulting in
deflection of the spring. It will be then converted into viscosity value based on
calibrated scale.
Figure 3.4 Viscosity measurement concept of LVDV-III Ultra Brookfield
Rheometer
LVDV-III
Ultra
Brookfield
UL-adapter
Water bath
(Temperature
controller )
Motor
Calibrated
spring
Drive shaft
Drive shaft

41
UL Adapter with spindle “00” is attached into this instrument since it is meant
for low viscosity samples down to 1mPa.s. Refrigerated water bath is used to control the
sample temperature.
3.2.3.2 Water-based nanofluids
The viscosity of water-based nanofluids was measured using Vibro viscometer
SV–10 (Figure 3.5) instead of LVDV-III Ultra Brookfield. This is because the lowest
measurement value for LVDV-III Ultra is only 1mPa.s. Water definitely has lower
viscosity value. Viscometer (SV – 10) is capable of measuring sample with viscosity
ranging 0.3 to 10,000 mPa.s. This instrument has high accuracy where it is capable of
providing 1% of repeatability reading.
Figure 3.5 SV- 10 Viscometer
Figure 3.6 shows the major parts of the instrument.

42
Figure 3.6 Major parts of SV- 10 Viscometer
There are two sensor plates (at the left and right) and a temperature sensor
(middle) in this instrument. Temperature range that can be measured by the sensor is
from 0oC to 100oC. The sensor plates that are immersed into a sample will vibrate with
uniform frequency during the measurement process. The vibration of the sensor plates
are control by the electromagnetic drive. The driving electric current to maintain the
constant amplitude will be regarded as the viscidity between the sample and sensor
plates.
3.2.4 Measurement of Density
The density of the ethylene glycol/ water mixture and water-based nanofluid is
measured using density meter DA-130N from Kyoto Electronics. This instrument is
able to measure sample density ranging from 0 to 2 g/cm3. The accuracy of this
instrument is ±0.001 g/cm3 at temperatures within 0 to 40oC. Similar to thermal
Sensor plate
Displacement
sensor Temperature
sensor
Vibrator
(Sensor
plate) Sample

43
conductivity measurements, average value from 5 readings was taken for each sample.
Figure 3.7 illustrates the density meter used in this study.
Figure 3.7 Density meter
3.3 Modelling of flue gas or hot gas waste heat recovery through shell and tube
heat exchanger
Sub-section 3.3.1 presents methodology used in modelling of thermal and
energy performance of a shell and tube heat recovery exchanger operated with
nanofluids. Sub-section 3.3.2 covers the energy saving associated with size reduction of
heat exchanger. In the sub-section 3.3.3, the entropy generation analysis of nanofluids
flows through a circular tube is included.
3.3.1 Shell and tube heat exchanger and operating condition
This type of heat exchanger is commonly used as a pre-heater in power plant,
steam generator in nuclear power plant and etc (Kakac and Liu,2002). It consists of two

44
sides namely; shell and tube sides. In the present study, necessary input data such as
shell and tube heat exchanger specifications and operating characteristics were taken
from the literatures. The composition of flue gas was obtained from Chen et al.,(2012)
as shown in Table 3.1.
Table 3.1 Composition of flue gas from biomass heating plant
Type of gases Percentage
CO2 12.1 H2O 24.4 O2 3.2 N2 60.3
The flue gas compositions are from biomass heating plant. The specifications of
heat exchanger and operating conditions are shown in Table 3.2. Shell and tube heat
exchanger is used to recover the waste heat available in the flue gas.
Table 3.2. Specifications of shell and tube heat exchanger and operating conditions
for flue gas and nanofluids
Description Type/Value
Type of heat exchanger Single tube pass, type E shell and tube heat exchanger
Tube outside diameter, do(mm) 25.4 Tube inner diameter, di(mm) 22.9 Pitch, pt/do 1.75 Total tube number, N 1024 Tube layout Rotated square Shell inner diameter, Ds(mm) 2090 Shell thickness, δs (mm) 14 Baffle type Single-segmental Baffle spacing, B(mm) 1776 Baffle cut 25% Fluid mass flow rate (kg/s) 111.6 Flue gas mass flow rate (kg/s) 26.3 Fluid inlet temperature (oC) 30 Flue gas temperature (oC) 150

45
The length of tubing is assumed to be 5 meters. Thermal conductivity of
ethylene glycol based copper and water -based nanofluid is obtained from Eastman et
al., (2001) and Jang and Choi (2006) as shown in Fig. 3.8 and 3.9, respectively.
Figure 3.8. Thermal conductivity ratio of ethylene glycol based copper nanofluids
(Eastman et al., 2001)
Figure 3.9 Thermal conductivity ratio of water based copper nanofluids (Jang and Choi,
2006)
1.00
1.02
1.04
1.06
1.08
1.10
1.12
1.14
1.16
1.18
0.10
0.15
0.20
0.25
0.30
0.35
0.40
0.45
0.50
0.55
0.60
0.65
0.70
0.75
0.80
0.85
0.90
0.95
1.00
k eff/k
base
flui
d
Copper nanoparticles volume fraction (vol. %)
1.00
1.05
1.10
1.15
1.20
1.25
1.30
1.35
1.40
1.45
0.5 1.0 1.5 2.0 2.5
Kef
f/k b
asef
luid
Copper nanoparticles volume fraction (vol.%)

46
Leong et al. (2010) used Eastman thermal conductivity data in their study on
automotive radiator. Other thermo-physical properties such as density, specific heat and
viscosity are calculated from correlations found from the literature. The obtained
thermo-physical properties and stability of nanofluids are assumed to remain constant in
the application of heat exchanger. On the other hand, the thermo-physical properties of
the ethylene glycol/water, ethylene glycol/water based Al2O3 (particle size :13nm and
<50nm) and TiO2 (particle size:21nm) nanofluids were obtained from the present
experiment as discussed in section 3.2. These properties were used in the mathematical
modelling and analysis works. Thermo-physical properties of flue gas, ethylene glycol
and water are also needed in calculation. These are depicted in Table 3.3.
Table 3.3. Thermo-physical properties of flue gas, ethylene glycol and water
Flue Gas thermo-physical properties (Increase Performance, 2011)
Specific heat (kJ/kgK) Thermal conductivity (W/mK)
Viscosity (Ns/m2)
1.148 2.9×10⁻⁵ 1.9×10⁻⁵
Thermo-physical properties ethylene glycol (Incropera et al., 2007)
Thermal conductivity
(W/mK)
Density (kg/m3) Dynamic viscosity (Ns/m2)
Specific heat (kJ/kgK)
0.2613 1071.81 0.263 2.6958
Thermo-physical properties water (Incropera et al., 2007) Thermal
conductivity (W/mK)
Density (kg/m3) Dynamic viscosity (Ns/m2)
Specific heat (kJ/kgK)
674.9×10⁻³ 968.32 318.6×10⁻⁶ 4.2048
3.3.1.1 Theoretical derivation on heat transfer and energy performance of shell
and tube heat recovery exchanger
This study intregrated Kern and effective-NTU methods to investigate the
performance of shell and tube exchanger. On the shell side modelling, Kern method was
selected due to its good estimation on the heat transfer coefficient in shell side (Sarit,

47
2009). Effective-NTU approach was applied in the tube side analysis. Combination of
these two approaches are required to evaluate the heat transfer from the flue/hot gasses
to the heat transfer fluid flows through the circular tubes. Single phase models were
used in the analysis due to its simpler implementation. There has not been any study
which uses these approaches in nanofluids operated shell and tube heat exchanger.
Mathematical modelling shown in this sub-section were taken from various
references (Incropera et al., 2007; Ramesh and Dusan, 2003; Velagapudi et al., 2008;
Kakac and Liu, 2002). The heat transfer and energy performance of shell and tube heat
exchangers were analysed. The base fluids considered are ethylene glycol, water and
ethylene glycol/water mixtures while the nanoparticles are Cu, Al2O3 and TiO2. The
mathematical modelling used in the analysis is divided into flue gas and base fluid or
nanofluids calculations.
The mathematical modelling for flue gas side started with determining cross flow
area and equivalent diameter of the shell side. These two values were needed to
calculate the flue gas Reynolds number. Eventually, the flue gas Reynolds's number was
used in the convective heat transfer coefficient formulation. The mathematical
modelling used in this study is shown below.
(a) Crossflow area, Acf can be determined by using Equation (3.1):
A�� 5 (DV + N��d�-B (3.1- where
N�� 5 DVP�
(b) Equivalent diameter, De can be determined by using Equation (3.2):
D� 5 4YP�? + πd�?4 Zπd� (3.2-
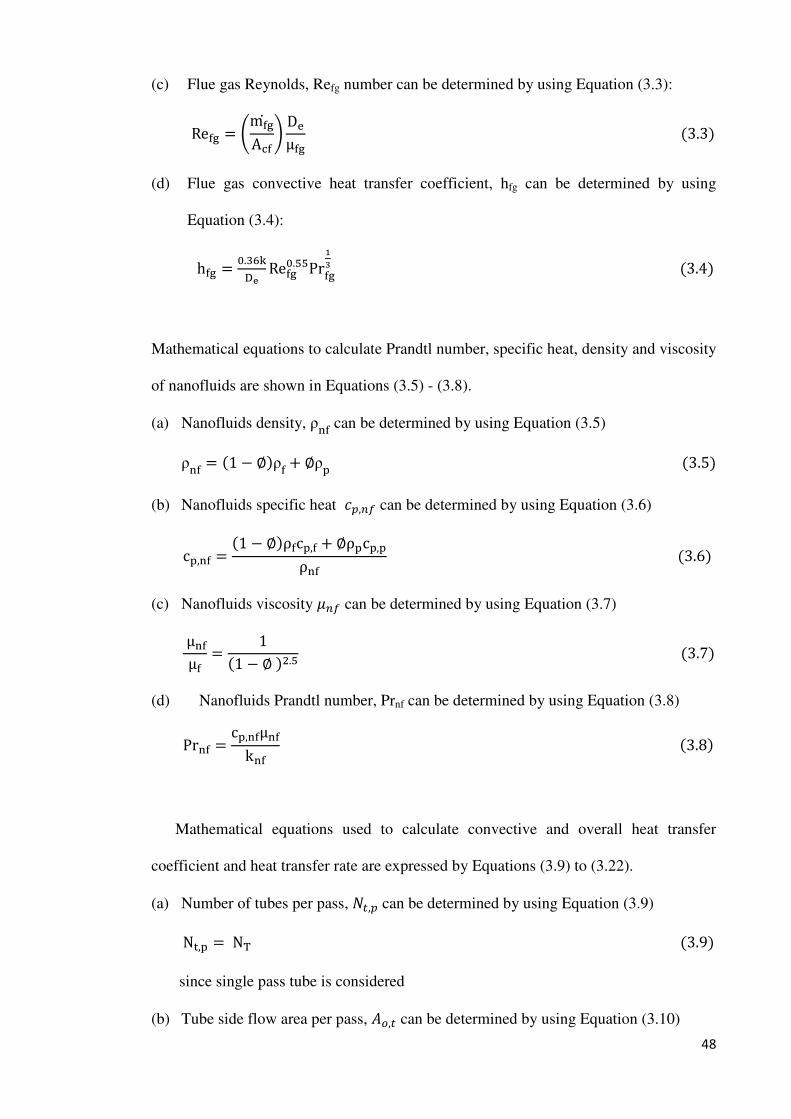
48
(c) Flue gas Reynolds, Refg number can be determined by using Equation (3.3):
Re�� 5 \m��A��] D�µ�� (3.3- (d) Flue gas convective heat transfer coefficient, hfg can be determined by using
Equation (3.4):
h�� 5 Q.F_`ab Re��Q.@@Pr��cd (3.4-
Mathematical equations to calculate Prandtl number, specific heat, density and viscosity
of nanofluids are shown in Equations (3.5) - (3.8).
(a) Nanofluids density, ρ�� can be determined by using Equation (3.5)
ρ�� 5 (1 + �-ρ� 6 �ρ� (3.5- (b) Nanofluids specific heat ef,gh can be determined by using Equation (3.6)
c�,�� 5 (1 + �-ρ�c�,� 6 �ρ�c�,�ρ�� (3.6- (c) Nanofluids viscosity igh can be determined by using Equation (3.7)
µ��µ� 5 1(1 + � -?.@ (3.7- (d) Nanofluids Prandtl number, Prnf can be determined by using Equation (3.8)
Pr�� 5 c�,��µ��k�� (3.8-
Mathematical equations used to calculate convective and overall heat transfer
coefficient and heat transfer rate are expressed by Equations (3.9) to (3.22).
(a) Number of tubes per pass, j�,f can be determined by using Equation (3.9)
N�,� 5 N� (3.9- since single pass tube is considered
(b) Tube side flow area per pass, k#,� can be determined by using Equation (3.10)

49
A�,� 5 π4 d,?N�,� . (3.10- (c) Nanofluids Reynolds number, Renf can be determined by using Equation (3.11)
Re�� 5 m�� d,A�,�µ�� (3.11- (d) Nusselt number, Nunf can be determined by using Equations. (3.12) and (3.13)
Nu�� 5 3.66 for laminar olow (3.12- Nu�� 5 0.024Re��Q.TPr��Q.S for turbulent olow (3.13- (e) Nanofluids heat transfer coefficient, hnf can be determined by using Equation (3.14)
h�� 5 Nu��k��d, (3.14- (f) Overall heat transfer coefficient, Uo can be determined by using Equation (3.15)
where fouling factors are not considered in this analysis.
1U� 5 1h�� 6d�ln Yd�d,Z2k* 6 1h�� d�d, (3.15-
where kw is thermal conductivity of copper wall.
(g) Total tube outside heat transfer area, As can be determined by using Equation
(3.16)
AV 5 πLd�N� (3.16- (h) Number of heat transfer units, NTU can be determined by using Equation (3.17)
NTU 5 U�AVCu,� (3.17- where
Cuvw 5 8m c�9�� (3.18- Cu,� 5 8m c�9�� (3.19- (i) Heat exchanger effectiveness, x can be determined by using Equation (3.20)

50
Assuming single pass, both fluids unmixed
ε 5 1 + exp zY 1C{Z (NTU-Q.??|exp&+C{(NTU-Q.}T. + 1~ � (3.20- where
C{ 5 Cu,�Cuvw (3.21- (j) Heat transfer rate, q can be determined by using Equation. (3.22)
q 5 εCu,�8T��,, + T��,,9 (3.22-
Pressure drop and pumping power can be determined by using following
formulations from Equations (3.23) - (3.27).
(a) Friction factor, F can be determined by using Equations. (3.23) and (3.24)
F 5 64Re�� for laminar (3.23- F 5 (0.790 ln Re�� + 1.64-�? for turbulent olow (3.24- (b) Mean velocity of nanofluids, um can be determined by using Equation (3.25)
uu 5 4m��ρ��πd,? (3.25- (c) Pressure drop, ∆� of nanofluids can be determined by using Equation (3.26)
∆p 5 F ρ��uu?2d, L (3.26- (d) Pump power,P can be determined by using Equation (3.27)
P 5 V�� 3 ∆p (3.27-
The mathematical flow chart is depicted in Figure 3.10

51
Shell side calculation Tube side calculation
Calculation of cross flow
area, equivalent
diameter, flue gas
Reynolds number
Thermo-physical
properties of flue gas
Convective heat transfer
coefficient
Thermo-physical properties
of heat transfer fluids
Calculation of number of
tubes per pass, tube side
flow area per pass, Reynolds
number, Nusselt number
Convective heat transfer
coefficient
Overall heat transfer
coefficient
Total tube outside
heat transfer area
Number of transfer
unit (NTU)
Heat transfer rate
End
Figure 3.10 Mathematical flow chart (Thermal and energy
performance of shell and tube heat exchanger)
Start

52
3.3.1.2 Test procedures and conditions
The analysis in this study was conducted based on flue gas composition from the
biomass heating plant, nanofluids and base fluid properties and operating conditions
discussed in Sections 3.3.1. In this study, nanoparticle volume fraction, flue gas and
nanofluids mass flow rate were varied to determine thermal and energy performance of
the heat recovery exchanger. The test procedures and conditions in this study are shown
below.
(a) Effect of nanoparticles volume fraction on thermal and energy performance of
shell and tube heat recovery exchanger
In this analysis, flue gas and nanofluids mass flow rate were kept constant at
26.3kg/s and 111.6kg/s, respectively. These values are taken from Chen et al., (2012)
which are based on actual mass flow rate values applied in the shell and tube exchanger.
Nanoparticles volume fractions were augmented from 0 to 1% for ethylene glycol based
copper nanofluids and from 0 to 2% for water based copper nanofluids. Nanofluids
Reynolds number, convective and overall heat transfer coefficient and heat transfer rate
were then determined. Other parameters such as pumping power as well as the
nanofluids pressure drop were determined. Apart from that, analysis was also done on
the overall heat transfer performance of the shell and tube heat recovery exchanger
operated with ethylene glycol/water base fluid, ethylene glycol/water mixture-based
aluminium oxide (particle size:13nm and <50nm) and titanium dioxide (particle size:
21nm). The nanoparticle volume fraction used for these nanofluids was 0.5%.
(b) Effect of flue gas mass flow rate on thermal performance of shell and tube heat
exchanger
In this analysis, the flue gas mass flow rate was varied from 26.3kg/s to 42kg/s.

53
Reynolds number for flue gas was included. Nanofluids convective and overall heat
transfer coefficient and heat transfer rate were also analyzed i. Nanofluid
subjected to this study was ethylene glycol based copper nanofluids.
(c) Effect of coolant mass flow rate on thermal performance of shell and tube heat
Exchanger
Coolant mass flow rate varied from 200 kg/s to 230 kg/s to create turbulent
flow. Nanofluids convective and overall heat transfer coefficient and heat transfer rate
were also analyzed in this section. Nanofluid subjected in this study was ethylene glycol
based copper nanofluids.
3.3.2 Energy saving associated with size reduction of shell and tube heat
exchanger
This section describes the method used to estimate the size reduction of shell
and tube heat recovery exchanger operated with nanofluids based coolants and its
associated energy saving.
3.3.2.1 Size estimation of shell and tube heat recovery exchanger
The specification of shell and tube heat exchanger (TEMA E type) is also taken
from Chen et al., (2012) as described in Table 3.2. It is used to recover heat from flue
gases emitted from biomass heating plant. From the study, it is implied that the flue gas
inlet temperature of about 150oC reduced to 35oC with 26.3kg/s mass flow rate of flue
gas. The flue gas thermo-physical properties are obtained from (Increase Performance,
2011) based on its composition given by Chen et al., (2012).
In the present study, the heat transfer fluid inlet temperature and mass flow rate
are set as 30oC and 60kg/s, respectively. However, the energy balance Equation (3.28)

54
is used to determine the heat transfer fluid outlet temperature since the specific heat
changes with addition of nanoparticles. Similar to previous section, 5m tube length is
considered in this study.
(a) Energy balance is expressed by the Equation (3.28):
m ��C�,��8T��,,� + T��,���9 5 m ��C�,��8T��,��� + T��,,�9 (3.28-
Initially the convective heat transfer coefficients for flue gas and heat transfer
fluid (coolant) are assumed in this analysis. The convective coefficient for the heat
transfer fluid (coolant) is assumed to increase with the particle volume fraction due to
substantial increase of nanofluids thermal conductivity (Wen and Ding, 2004).
Nanoparticles movement which creates the thermal boundary disturbance also enhances
convective heat transfer (Kim et al., 2009). Fouling factors are considered negligible in
this study. The mathematical modellings used in this study are taken from different
references (Incropera et al., 2007; Kakac and Liu,2002; Ramesh and Dusan, 2003;
Velagapudi et al., 2008, Taborek, 1991).
(b) The required heat transfer area to perform the selected condition is expressed by the
Equation (3.29)
A 5 QLMTD 3 U (3.29-
(c) LMTD constant is expressed by the Equation (3.30):
LMTD 5 8T��,,� + T��,���9 + 8T��,��� + T��,,�9In YT��,,� + T��,���T��,��� + T��,,�Z (3.30-

55
In this study, few similar parameters used by Chen et al. (2012) are taken into
consideration as shown in Table 3.4
Table 3.4 Specification of shell and tube heat exchanger for size reduction estimation
Description Value
Tube outside diameter (mm) 25.4
Tube inside diameter (mm) 22.9
Pitch ratio 1.75
Baffle length (mm) 1776
CTP constant was assumed to be 0.93 for one tube pass, while tube layout constant CL
for 90o is assumed to be 1 (Taborek, 1991).
(d) The overall shell diameter is expressed by the Equation (3.31):
DV 5 0.637� CLCTP �(A-(PR-?8d�,�9L �R ?� (3.31- (e) The required number of tubes is expressed by the Equation (3.32):
N� 5 0.785 YCTPCL Z (DV-?(PR-?(d��-? (3.32- Finally, the convective heat transfer of the heat exchanger with the calculated
geometric values is compared with the initial assumption of convective heat transfer
coefficient. This is to ensure that the calculated geometries value is capable to produce
the same thermal performance.
3.3.2.2 Convective heat transfer coefficient of flue gas and nanofluids
Thermal conductivity, specific heat and viscosity of heat transfer fluids are
required to calculate this convective heat transfer properties for the tube side. Two types
of nanofluids are considered in this study namely; ethylene glycol and water based
copper nanofluids. Both are taken from Eastman et al., (2001) (Figure 3.8) and Jang and
Choi (2006) (Figure 3.9) respectively. It is noted that the thermal conductivity data

56
taken from Eastman et al., (2001) is measured from samples without addition of any
surfactant. Flue gas and nanofluids convective heat transfer coefficient are calculated
based on formulations listed in Section 3.3.1.1.
3.3.2.3 Energy savings
Mathematical formulations to calculate energy savings associated with the size
reduction of heat exchanger are presented by Equations (3.33)-(3.36).
(a) Mass, m can be expressed by the Equation (3.33):
m 5 ρ 3 v (3.33- (b) Energy consumption used for material processing , E can be expressed by the
Equation (3.34):
E 5 e 3m (3.34- Energy consumption for copper material processing is 1.17517kWh/kg copper
(Yanjia and Chandler, 2010). Guo and Fu (2010) reported that energy consumption for
steel is 0.45224 kWh/kg steel. Copper and steel are assumed as the materials for tube
and shell, respectively.
(c) Mass reduction, mred can be expressed by the Equation (3.35):
m��� 5 m�� + m�� (3.35- (d) Total energy savings for material processing, et can be expressed by the
Equation (3.36)
eVv� 5 e�� + e�� (3.36-
Figure 3.11 shows the mathematical flowchart of the size reduction and energy savings
of shell and tube heat exchanger.

57
Figure 3.11 Mathematical flowchart of the size reduction and energy savings of shell
and tube heat exchanger
Start
Overall heat transfer
enhancement
Calculation of shell
diameter and number of
tube
Calculation of
convective heat transfer
coefficient
Calculation of shell and
tube heat exchanger
mass
Calculation of energy
consumption for
material processing
Calculation of mass
reduction and total
energy savings for
material processing
End

58
Constant wall temperature, Tw
3.3.3 Entropy generation of nanofluids flow through a circular tube subjected to
constant wall temperature
The efficiency of nanofluids as a heat transfer fluid depends not only on the heat
transfer enhancement but also on the pressure drop. Thus, entropy generation analysis
was conducted in the present study. Circular tube is selected because this shape of tube
is widely used in shell and tube heat exchangers. Sub-section 3.3.3.1 describes the
geometry configuration and thermo-physical properties of nanofluids while the
modelling used in the analysis is presented in the succeeding sub-section.
3.3.3.1 Geometry configuration of circular tube and thermo- physical properties of
nanofluids
The schematic diagram of a circular tube subjected to entropy analysis is shown
in Figure 3.12. In this figure, the circular tube is subjected to constant wall temperature
due to heating process from flue gas/hot gas. The fluid that flows through the tube
absorbs the heat from the circular tube’s wall. The heat transfer rate of the fluid within
the control volume can be determined using Newton’s law of cooling as follows: dQ 5 m c�dT 5 hπ(T* + T-dx (3.37-
Figure 3.12 Circular tube under constant wall temperature (Sahin, 2000)
Flow
direction Ti (x=0)
Constant wall temperature
Diameter, d T(x = L) T T + dT
dx
Constant wall temperature

59
The specifications and operating characteristics are shown in Table 3.5.
Table 3.5 Specification and operating characteristic of circular tube
Specification/ working condition Value/ Remark
1 Diameter of circular tube, d (m) 0.01-0.03 2 Length of circular tube, l (m) 2-10 3 Temperature of heat transfer fluid , Ti(K) 300 4 Base fluid Water 5 Nanoparticle volume fraction, � Al203 (0-7% volume fractions) and
TiO2(0-4% volume fractions) 6 Mass flow rate (kg/s) Laminar (0.01-0.02), turbulent (0.1-
0.2) 7 Dimensionless wall and fluid
temperature different, τ 0.01-0.02
The thermal conductivity of water based Al2O3 nanofluids is obtained from
Khanafer and Vafai (2011) as shown in Equation (3.38).
k���k� 5 1.0 6 1.0112�� 6 2.4375�� \ 47d�(nm-] + 0.0248 �� \ k�0.613] (3.38- As for water based TiO2 nanofluids, the thermal conductivity value is obtained from
Murshed et al.,(2009) as shown in Figure 3.13.
Figure 3.13 Thermal conductivity of water based TiO2 nanofluids (Murshed et al.,
2009)
1.00
1.05
1.10
1.15
1.20
1.25
1.30
1.0 2.0 3.0 4.0
Kef
f/kbf
TiO2 nanoparticle volume fraction (Vol.%)
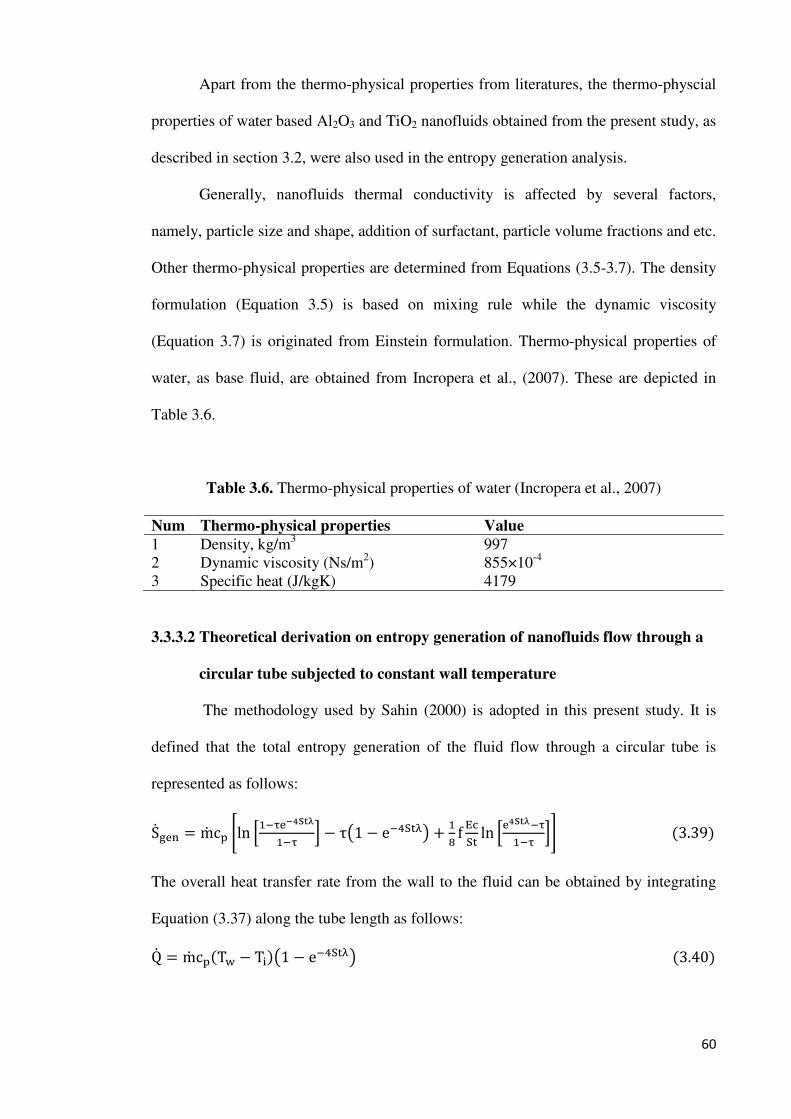
60
Apart from the thermo-physical properties from literatures, the thermo-physcial
properties of water based Al2O3 and TiO2 nanofluids obtained from the present study, as
described in section 3.2, were also used in the entropy generation analysis.
Generally, nanofluids thermal conductivity is affected by several factors,
namely, particle size and shape, addition of surfactant, particle volume fractions and etc.
Other thermo-physical properties are determined from Equations (3.5-3.7). The density
formulation (Equation 3.5) is based on mixing rule while the dynamic viscosity
(Equation 3.7) is originated from Einstein formulation. Thermo-physical properties of
water, as base fluid, are obtained from Incropera et al., (2007). These are depicted in
Table 3.6.
Table 3.6. Thermo-physical properties of water (Incropera et al., 2007)
Num Thermo-physical properties Value
1 Density, kg/m3 997 2 Dynamic viscosity (Ns/m2) 855×10-4 3 Specific heat (J/kgK) 4179
3.3.3.2 Theoretical derivation on entropy generation of nanofluids flow through a
circular tube subjected to constant wall temperature
The methodology used by Sahin (2000) is adopted in this present study. It is
defined that the total entropy generation of the fluid flow through a circular tube is
represented as follows:
S��� 5 m c� �ln �R��������R�� � + τ81 + e�S���9 6 RT f ���� ln ��������R�� �� (3.39- The overall heat transfer rate from the wall to the fluid can be obtained by integrating
Equation (3.37) along the tube length as follows:
Q 5 m c�(T* + T,-81 + e�S���9 (3.40-

61
For simplification of analysis, the entropy entropy generation can be presented in
dimensionless form as depicted indicated as follows:
ψ 5 S���Q /(T* + T,- (3.41- Substitution of Equations (3.39) and (3.40) into Equation (3.41), the total dimensionless
entropy generation can be written as follows:
Ψ =
11 + e�S��� �ln �1 + τe�S���1 + τ � + τ81 + e�SV��9 6 18 f EcSt ln �eSV�� + τ1 + τ �¡ (3.42-
where
πR 5 St λ (3.43- π? 5 f EcSt (3.44-
This formulation consists of entropy generation contributed by heat transfer and
friction loss. Optimum condition for a thermal system or flow is achieved when this
value is minimized. Equations. (3.45-3.56) are obtained from references (Sahin, 2000;
Incropera et al.,2007; Ramesh and Dusan, 2003).
The friction factor, f of the fluid flow can be determined as follows:
f 5 64Re for laminar olow (3.45- f 5 (0.79 ln Re + 1.64-�? for turbulent olow (3.46-
The pumping power plays a significant role in a thermal system. It is known
that, higher pumping power is required for fluid flow with higher pressure drop. The
fluid pressure drop can be determined as follows:
d� 5 fρ��u?2d£ dx (3.47-
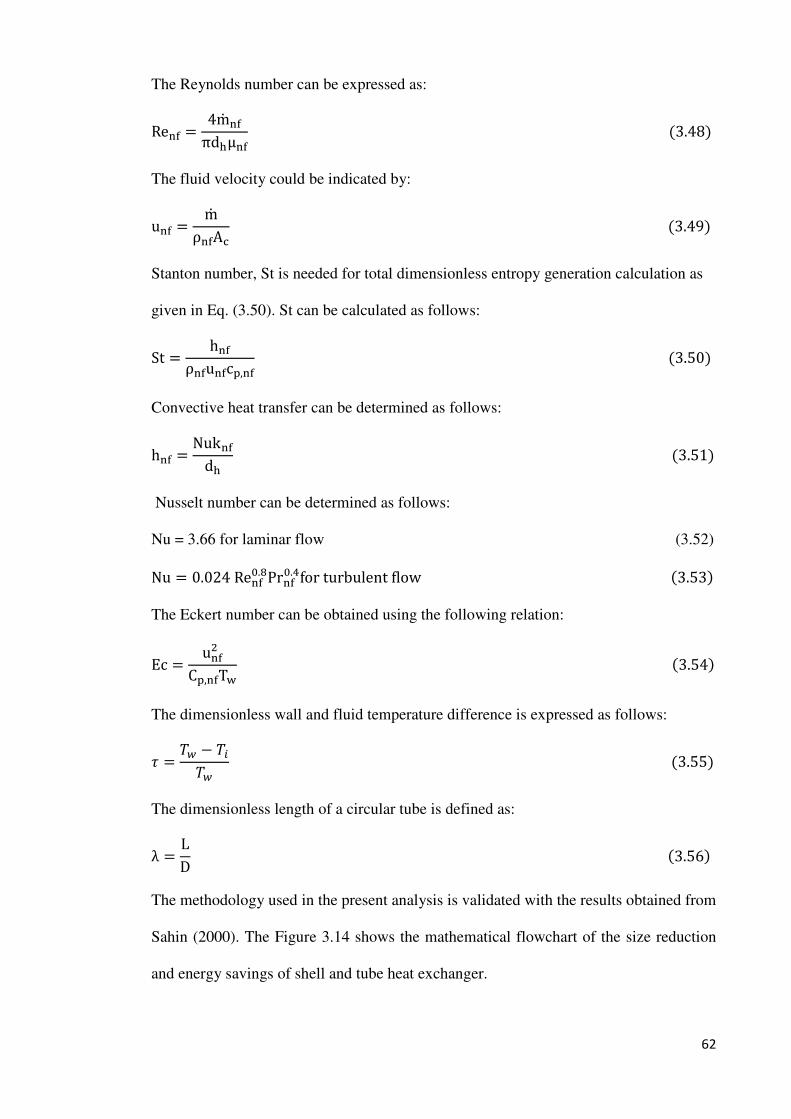
62
The Reynolds number can be expressed as:
Re�� 5 4m ��πd£µ�� (3.48- The fluid velocity could be indicated by:
u�� 5 mρ��A� (3.49- Stanton number, St is needed for total dimensionless entropy generation calculation as
given in Eq. (3.50). St can be calculated as follows:
St 5 h��ρ��u��c�,�� (3.50- Convective heat transfer can be determined as follows:
h�� 5 Nuk��d£ (3.51- Nusselt number can be determined as follows:
Nu = 3.66 for laminar flow (3.52)
Nu 5 0.024 Re��Q.TPr��Q.Sfor turbulent olow (3.53- The Eckert number can be obtained using the following relation:
Ec 5 u��?C�,��T* (3.54- The dimensionless wall and fluid temperature difference is expressed as follows:
¤ 5 ¥¦ + ¥§¥¦ (3.55- The dimensionless length of a circular tube is defined as:
λ 5 LD (3.56- The methodology used in the present analysis is validated with the results obtained from
Sahin (2000). The Figure 3.14 shows the mathematical flowchart of the size reduction
and energy savings of shell and tube heat exchanger.

63
Figure 3.14 Mathematical flowchart of the size reduction and energy savings of shell
and tube heat exchanger.
Start
Thermo-physical properties of
heat transfer fluid
Calculation of fluid mass flow
rate, Reynolds number, Nusselt
number
Calculation of convective heat
transfer coefficient
Calculation of Stanton number
Calculation of Eckert number
Calculation of dimensionless
wall and fluid temperature
difference
Calculation of dimensionless
length of a circular tube
Calculation of total
dimensionless entropy generation
Calculation friction factor
End

64
3.4 Modelling of hot gas waste heat recovery through thermosyphon air
preheater
Beside from shell and tube heat exchanger, thermosyphon heat exchanger also
can be used to recover the waste heat from the flue gass/hot gass. Therefore, this section
describes the methodology used for performance investigation of thermosyphon air
preheater. It covers the modelling characteristic, input data, mathematical modeling and
test characteristics.
3.4.1 Modelling characteristics and input data
The specification of an air to air thermosyphon heat recovery exchanger is taken
from Noie (2006). In their study, authors used water as the thermosyphon’s working
fluid. As mentioned in Chapter 2, nanofluids offer better thermal properties than water.
Thus, the present study investigated the performance of the same thermosyphon but
operated with nanofluids. The specification and schematic diagram of thermosyphon are
shown in Table 3.7 and Figure. 3.15.
Table 3.7 Specifications of an air preheater (Noie, 2006)
Description Value
Dimension of heat exchanger (m) 1.3 (H) × 0.43 (L) × 0.27 (W) Dimension of each thermosyphon (mm) do = 15, di=14, Ltubes=1300 Type and dimension of fins (mm) Aluminium plate fin, thickness =
0.4mm Number of fins per meter = 300, Spacing,�� =10mm
Thermosyphon arrangement Staggered, sl = 30mm , st=30mm Number of rows nl = 6 , nt= 15 Total number of the thermosyphons N=90 Thermosyphon materials/ working fluid Copper/ water

Figure 3.1
The operating temperature for hot air ranges
air is assumed to be 25
taken from Incropera et al., (2007). Nanofluids used in the present study are water based
Al2O3 and water based TiO
3.4.2 Theoretical derivation
thermosyphon air
The formulations used for modelling analysis in this section are divided into:
thermal resistance of air
temperatures and energy performance.
3.4.2.1 Thermal resistance of air side
Nuntaphan et al. (2002
the convective heat transfer coefficient
represented by Equation (3.57
Figure 3.15 Schematic diagram of an air preheater (Noie, 2006)
The operating temperature for hot air ranges from 100oC to 240
air is assumed to be 25oC. Thermo-physical properties of air at these temperatures are
from Incropera et al., (2007). Nanofluids used in the present study are water based
and water based TiO2. These are commonly used in nanofluid researches.
Theoretical derivation of heat transfer and energy performance in
thermosyphon air preheater
The formulations used for modelling analysis in this section are divided into:
thermal resistance of air sides, wall, working fluids, overall effectiveness, outlet
temperatures and energy performance.
Thermal resistance of air side
Nuntaphan et al. (2002) have used a formulation from Webb (1994) to calculate
the convective heat transfer coefficient of air at the evaporator side,
represented by Equation (3.57)
0.43m
Evaporator
Condenser
0.6m
0.1m
65
Schematic diagram of an air preheater (Noie, 2006)
C to 240oC while the cold
at these temperatures are
from Incropera et al., (2007). Nanofluids used in the present study are water based
ly used in nanofluid researches.
heat transfer and energy performance in
The formulations used for modelling analysis in this section are divided into:
sides, wall, working fluids, overall effectiveness, outlet
have used a formulation from Webb (1994) to calculate
air at the evaporator side, . It can be

66
hv,�,��v 5 j ρv,�uuvw¨�,v,�Prv,�? F� (3.57- where j is Colburn factor which can be represented by the following equation:
j 5 0.14Re�Q.F?T Ys�sªZ�Q.@Q? Y fVd�ZQ.QFR (3.58-
It is a formulation to cater for plain finned tubes. The tubes are arranged in the
staggered array. Incropera et al., (2007) used the following equation to determine the
maximum velocity, uuvw for the staggered configuration:
uuvw 5 S�2(S� + d�- u (3.59- Maximum Reynolds number can be represented by the following equation:
Rea,uvw 5 ρv,�uuvwd�µv,� (3.60-
Mass flow rate,m can be represented by the following equation:
m 5 ρv,�uA���� (3.61- Air side thermal resistance at the evaporator can be expressed in the following equation:
Rv,�,��v 5 1hv,�,��v η� (3.62- where «#is the total surface temperature effectiveness. It can be represented by the
following equation:
η� 5 1.0 + (1.0 + η�- 3 A�A� (3.63- where η� is the fin efficiency. It can be represented by the following equation:
η� 5 tanhmlml (3.64- where,
m 5 � 2hv,�,��vko,� f�£,�`��VV (3.65-

67
Same formulations (Equations 3.57-3.65) are used to determine thermal resistance of air
at the condenser side.
3.4.2.2 Thermal resistance of thermosyphon wall
The wall thermal resistances at both sides; evaporator and condenser are
negligible. This is because wall thickness is only 1 mm. Moreover, in the present study,
the thermosyphon heat exchanger is made of copper. Copper exhibits 401W/mK
thermal conductivity at 300K. This material is known as one of the best heat conductors
available in the market.
3.4.2.3Thermal resistance of working fluid at evaporator
Nanofluids considered in this study are similar with the previous nanofluids
used in entropy generation analysis. The heat transfer coefficient of the working fluid in
an evaporator is determined from Hewitt et al., (1993). Therefore, nanofluids heat
transfer coefficient at the evaporator side of thermosyphon (h��,��v- can be represented
by the following equation:
h��,��vk�� ¬ µ��?ρ��,ª ρ��,ª + ρ��,�® g°
R/F 5 Y43ZRF 1Re��R/F (3.66-
Reynolds number for the nanofluid is assumed to be 30 in this study since the heat
transfer fluid containing nanoparticles has higher viscosity. Thus, the fluid flow is
restricted in this condition. Hagens et al., (2007) used Reynolds number ranging from
30 to100 in their experimental and analytical study of long heat pipes. Thermal
resistance of nanofluids at an evaporator can be represented by the following equation:
R��,��v 5 1α��αv,�® h��,��v (3.67-

68
3.4.2.4 Thermal resistance of working fluid at condenser
Same formulations from Equations (3.66-3.67) were used to calculate thermal
resistance of working fluid in the condenser section. However, Equation (3.66) is
replaced with Equation (3.68) since condensation process is taking place at the
condenser section. This formulation is obtained from Hewitt et al. (1993):
h��,����k�� \ µ��?ρ��,ª8ρ��,ª + ρ��,�9g]R/F 5 43 Y 43Re��Z
RF (3.68-
3.4.2.5 Overall effectiveness of thermosyphon air preheater
The overall heat transfer coefficient is represented by the following equation:
U� 5 U��v 6 U���� (3.69- Noie (2006) used Equations (3.70-3.79) in his analysis of thermosyphon air preheater
operated with water as working fluid. The effectiveness for a single row heat pipe is
represented by the following equations:
ε��v,V,��ª� 5 1 + exp (+ NTU-��v (3.70- ε����,V,��ª� 5 1 + exp (+ NTU-���� (3.71- Number of transfer unit (NTU) for both evaporator and condenser section are shown as
follows.
NTU��v 5 (UA-��vC��v (3.72- where
C��v 5 8m v,�c�,v,�9��v (3.73- NTU���� 5 (UA-����C���� (3.74- where
C���� 5 8m v,�c�,v,�9���� (3.75-

69
The effectiveness of thermosyphon with n rows of heat pipes is represented by the
following equations:
ε��v,� 5 1 + 81 + ε��v,V,��ª�9� (3.76- ε����,� 5 1 + 81 + ε����,V,��ª�9� (3.77- Overall effectiveness of the thermosyphon , x� is represented by the following
equations:
ε� 5±²³ R´µ¶·¸,· 6
�¹º»,µ¶·¸ �¹º»,b¼¹½´b¼¹,· ¾
¿À�R
if C��v Á C���� (3.78-
ε� 5±²³ R´b¼¹,· 6
�¹º»,b¼¹ �¹º»,µ¶·¸½´µ¶·¸,· ¾
¿À�R
if C���� Á C��v (3.79)
3.4.2.6 Outlet temperature at evaporator and condenser
The outlet temperatures at condenser and evaporator sections are represented by
the following equations (Noie, 2006).
T��v,��� 5 T��v,,� + ε� 8m v,�c�,v,�9u,�8m v,�c�,v,�9��v 8T��v,,� + T����,,�9 (3.80- T����,��� 5 T����,,� 6 ε� 8u ¹º»�Â,¹º»9ú·8u ¹º»�Â,¹º»9µ¶·¸ 8T��v,,� + T����,,�9 (3.81- 3.4.2.7 Energy performance
The absorbed energy at the evaporator and condenser sections of a heat pipe
heat exchanger are represented by the following equations:

70
ÄÅÆÇ 5 ¨ÅÆÇ 3 8¥ÅÆÇ,§g + ¥ÅÆÇ,#È�9 (3.82- ÄÉ#gÊ 5 É̈#gÊ 3 8¥É#gÊ,#È� + ¥É#gÊ,§g9 (3.83- Figure 3.16 shows the mathematical flow chart of the thermpsyphon air reheater
analysis
Figure 3.16 Mathematical flowchart of the thermosyphon air-preheater analysis
Start
Thermo-physical properties of working fluid and air
Calculation of air velocity, Colburn factor and
Reynolds number (evaporator and condenser)
Calculation of convective heat transfer of air side
(evaporator and condenser)
Calculation of total surface temperature effectiveness
and fin efficiency air side thermal (evaporator and
condenser)
Calculation of air thermal resistance
(evaporator and condenser)
Calculation of convective heat transfer and thermal
resistance of working fluid (condenser and
evaporator)
Calculation of overall heat transfer coefficient
Calculation of effectiveness of thermosyphon
Calculation of outlet temperature at evaporator and
condenser
Calculation of energy performance
End

71
3.4.2.8 Test characteristics
The test characteristics considered in this study are presented in this section. It
includes the operating condition used in the comparative studies and nanofluids
analysis.
(a) Comparative studies
This sub-section describes the method used to validate the model in this study.
The influence of hot air inlet temperature on the hot air outlet temperature was analyzed
in this section. The obtained results were compared with results obtained from Noie
(2006). The hot air temperature was varied from 100oC to 240oC. However, cold air
inlet temperature was fixed at 25oC. The analysis was conducted at three difference hot
air velocities, which are 2.5, 4.0 and 4.75 m/s while, cold air velocity was kept constant
at 3 m/s. These values are similar with the experimental conditions used by Noie
(2006). Water was used as heat pipe working fluid in this study.
(b) Influence of particle volume fraction on thermal and energy performance of
thermosyphon heat exchanger
Water based Al2O3 and TiO2 nanofluids were used as the thermosyphon heat
exchanger working fluid. The parameters that were kept constant in this section are hot
air inlet temperature (100oC), cold air velocity (3 m/s) and cold air inlet temperature
(25oC). Similar to the previous section, the analysis were conducted with three different
hot air velocities. The effects of the particle volume fractions on overall heat transfer
coefficient and cold air outlet temperature were analyzed in this part. In addition, the
energy required to heat the combustion air was also estimated.

72
3.5 Conclusion
This chapter discusses the methodology used in the present study. Three types of
thermo-physical experiments were conducted namely thermal conductivity, viscosity
and density. For the thermal and energy performance of heat recovery exchanger’s
analysis, mathematical equations were presented. The relevant formulations are
obtained from literatures and text book. The methodology discussed covers shell and
tube heat exchanger and thermosyphon air preheater heat exchangers. Entropy
generation formulations are also presented in this chapter. The next chapter will discuss
the findings obtained from the present study.

73
CHAPTER 4 RESULTS AND DISCUSSION
4.1 Introduction
This chapter deals with results and discussions on thermo-physical properties of
nanofluids. The thermal and energy performance of the heat exchangers used to recover
the flue gas/ hot gas are included as well.
4.2 Thermal conductivity characteristic of nanofluid based coolants
Thermal conductivity of heat transfer fluids was measured using a KD2-Pro
thermal analyzer. The accuracy of the instrument was tested by comparing the reference
values (Incropera et al., 2007) and (ASHRAE, 2001) with the experimental values. This
is shown in Figure 4.1. The deviation between the reference and experiment values for
ethylene glycol/water mixture is 2.0% only. As for water, the recorded deviation is
6.3%. These values are acceptable and, it shows that the KD2-Pro thermal analyzer is
reliable and provides accurate results.
Figure 4.1 Validation of KD2-Pro thermal conductivity analyzer (~ 28oC)
0.00
0.10
0.20
0.30
0.40
0.50
0.60
0.70
1
The
rmal
con
duct
ivit
y (W
/mK
)
Water (Incopera et al. 2007)Water (Experiment)Ethylene glycol/water (Ashrae, 2001)Ethylene glycol/water+water (Experiment)

74
Thermal conductivity of various types of ethylene glycol/water and water-based
nanofluid is shown in Figure 4.2.
Figure 4.2. Comparison of thermal conductivity between various water and ethylene
glycol/water-based nanofluid and base fluid (~ 28oC)
The particles used in this study were TiO2 (particle size: 21nm) and Al2O3
(particle size: 13nm and <50nm). It is found that thermal conductivity of ethylene
glycol/water-based nanofluids is higher than ethylene glycol/water mixture. For
instance, 8.9% thermal conductivity augmentation is observed for ethylene glycol/water
mixture containing 0.5vol. % of Al2O3 (particle size: 13nm) compared to ethylene
0.00
0.10
0.20
0.30
0.40
0.50
0.60
0.70T
herm
al c
ondu
ctiv
ity
(W/m
K)
H2O+ Al2O3 (0.5V%)(13nm) H2O+ Al2O3(0.1V%)(<50nm)
H2O+ TiO2 (0.1V%) (21nm) H2O+ Al2O3(0.1V%)(13nm)
H2O+ TiO2(0.5V%) (21nm) H2O
H2O+ Al2O3 (0.5V%) (<50nm) EG/H2O + Al2O3(0.5V%)(13nm)
EG/H2O + TiO2(0.5V%) (21nm) EG/H2O + Al2O3(0.1V%)(13nm)
EG/H2O + Al2O3(0.1V%)(<50nm) EG/H2O + Al2O3 (0.5V%)(<50nm)
EG/H2O + TiO2(0.1V%) (21nm) EG/H2O
(0.1vol.% )(13nm)
(0.5 vol.%)(13nm)
(0.1vol%).(21 nm)
(0.5 vol.%)(21nm)
(0.5 vol.%)(<50nm)
(0.5 vol.%)(21nm)
(0.1 vol.%)(<50nm)
(0.1vol.%)(21nm)
(0.1 vol.%)(<50nm)
(0.5 vol.%)(13nm)
(0.1 vol.%)(13nm)
0.5 vol.%(<50nm)

75
glycol base fluid. This percentage of thermal conductivity enhancement is calculated
based on formula show in Appendix G. On the other hand, addition of 0.5 vol. % of
TiO2 into ethylene glycol/water would increase the thermal conductivity of ethylene
glycol/water about 5.6%. The increase of thermal conductivity could be due to
formation of nanolayer around the particle. It is believed that the base fluid molecules
tend to form an ordered layer around solid particles. This layering is much more ordered
than the bulk fluid, thus, it would have higher thermal conductivity compared to the
bulk fluid (Murshed et al., 2008b). Several other mechanisms contributing to the
thermal conductivity enhancement of nanofluids have been discussed by various
researchers (Keblinski et al., 2002; Keblinski et al., 2005; Murshed et al., 2008a; Choi,
2009). These mechanisms include Brownian motion, nature of heat transport in
nanoparticles, nanoparticles clustering and etc.
Apart from that, the thermal conductivity of ethylene glycol/water based
nanofluids increases with the increase of nanoparticle volume fraction except for
Al2O3(particle size: <50nm). Nanoparticle might agglomerate in ethylene glycol/water
containing 0.5vol. % of Al2O3 (particle size:<50nm). This hinders its thermal
conductivity enhancement compared to 0.1vol. %. Shima et al., (2010) reported that
particle agglomeration is the main reason for the thermal conductivity decrement of
nanofluids. Another researcher, Hong et al., 2006) explained that nanoparticles are
closer to each other for higher particle loadings; thus, they can agglomerate easily. They
added that the decrease of nanofluids thermal conductivity is directly linked to the
particle agglomeration.
The present experiment shows that nanofluids with smaller particle size exhibit
higher thermal conductivity. For instance, thermal conductivity of ethylene glycol/
water based Al2O3 (particle size:13nm) nanofluids is higher than Al2O3 (particle size:
<50nm) nanofluids irrespective of particle volume fraction. This is agreed by Teng et

76
al., (2010). These authors considered three types of particle size; 20, 50 and 100nm of
Al2O3 in water base fluid. They concluded that nanofluids with smaller nanoparticles
exhibit higher thermal conductivity enhancement especially at high temperatures. Chon
and Kihm (2005) also reported that smaller nanoparticles give higher surface area and
particles interaction which leads to thermal conductivity augmentation. In another
research, Mintsa et al., (2009) added nanofluids with smaller nanoparticles for the same
particle volume fraction create more contact area between the solid and fluid.
Thermal conductivity of various water -based nanofluids is also depicted in
Figure 4.2. From this figure, it is shown that most nanofluids exhibit higher thermal
conductivity compared to water base fluid. Water containing 0.5 vol.% of Al2O3
(particle size:13nm) offers 12.9% augmentation compared to water base fluid. This is
higher than augmentation offered by the ethylene glycol/ water-based nanofluids
containing the same type and particle concentration. However, nanoparticles might be
not uniformly dispersed in water base fluid compared to the ethylene glycol/ water base
fluid. This could be the reason why the thermal conductivity of water base fluid with
0.5 vol.% of TiO2 and Al2O3 (particle size:13nm) is lower than 0.1 vol.% nanofluids.
Nanoparticles agglomeration might be high in these samples. It is known that ethylene
glycol/ water has higher viscosity compared to water base fluid.
4.3 Density characteristic of nanofluid based coolants
The comparison between the reference and the measured values of density is
presented in Figure 4.3. This is done in order to validate the accuracy of the density
meter. From Figure 4.3, 0.8% deviation is observed for the ethylene glycol/water
mixtures while water only accumulates 0.04% deviation. This shows that the selected
density meter is accurate and reliable in performing measurements in this study.

77
Figure 4.3 Validation of density meter (~28oC)
Comparison of the density of ethylene glycol/ water and water based nanofluids
with base fluids is presented in Figure 4.4.
Figure 4.4 Density of ethylene glycol/water and water-based nanofluids and base fluid
(~28oC)
0.96
0.98
1.00
1.02
1.04
1.06
1.08
1
Den
sity
(g/
cm3 )
Axis Title
EG+H2O(Ashrae, 2001)
EG+H2O(Experiment)
H2O (Incropera et al., 2007)H2O(Experiment)
0.94
0.96
0.98
1.00
1.02
1.04
1.06
1.08
1.10
Den
sity
(g/
cm3 )
EG+H2O+TiO2(0.5vol.%) (21nm) EG+H2O+Al2O3(0.5vol.%)(13nm)EG+H2O+Al2O3(0.5vol.%)(<50nm) EG+H2O+TiO2(0.1vol.%) (21nm)EG+H2O+Al2O3(0.1vol.%)(13nm) EG+H2O+Al2O3(0.1vol.%)(<50nm)EG+H2O (Experiment) H2O+TiO2(0.5vol.%) (21nm)H2O+Al2O3(0.5vol.%)(13nm) H2O+Al2O3(0.5vol.%)(<50nm)H2O+Al2O3(0.1vol.%)(13nm) H2O+TiO2(0.1vol.%) (21nm)H2O+Al2O3(0.1vol.%)(<50nm) H2O(Experiment)

78
As expected, the density of ethylene glycol-based nanofluids containing TiO2
nanoparticles is higher than the Al2O3 nanofluids. This is attributed to the higher density
of TiO2 nanoparticles as compared to Al2O3. Incropera et al., (2007) stated that the
density of TiO2 and Al2O3 is 4157kg/m3 and 3970 kg/m3 respectively. Similar trend is
also observed for water based nanofluids. This study shows that the particle type, rather
than the size, plays a significant role in determining the density of nanofluids. Not much
difference in density is observed for Al2O3 nanofluids at 13nm and <50nm particle
sizes. Apart from that, density also increases with particle volume fractions.
4.4 Viscosity characteristic of nanofluid based coolants
As explained in Chapter 3, two types of instrument were used to measure
viscosity of nanofluids. LVDV-III Ultra Brookfield was used to measure the viscosity
of ethylene glycol/water-based nanofluids while a SV-10 viscometer was used for
water-based nanofluids. Thus, the results and discussions on viscosity characteristic of
nanofluids are divided into two sub-sections 4.4.1 and 4.4.2. Sub-section 4.4.1 covers
the ethylene glycol/water based nanofluids while water-based nanofluids is presented in
sub-section 4.4.2.
4.4.1 Viscosity of the ethylene glycol/ water -based nanofluids
Before adding nanoparticles into base fluid, the LVDV-III Ultra Brookfield
rheometer was validated by measuring the viscosity of ethylene glycol and ethylene
glycol/water mixture. The measured value is then compared with the values obtained
from Incropera et al., (2007) and ASHRAE (2001). This is shown in Figure 4.5.

79
Figure 4.5 Theoretical and experimental viscosity of base fluids at different
temperature
From Figure 4.5, it is deduced that there is a good agreement between the
measured and standard values from text books. On the aspect of shear rate, it is
successfully proved that the viscosity of ethylene glycol is independent of shear rate,
thus, it is a Newtonian fluid. Figure 4.6 shows the effect of shear rate to the viscosity of
ethylene glycol/water mixture at various temperatures. Ethylene glycol/water exhibits
Newtonian characteristic from 30oC to 45oC.
Figure 4.6 Dynamic viscosity of ethylene glycol/water mixture with respect to shear rate
0
2
4
6
8
10
12
14
16
25 30 35 40 45 50 55 60
Dyn
amic
vis
cosi
ty (
m P
a.s)
Temperature (oC)
EG (Experiment)EG (Incropera et al. 2007)EG+H2O (Experiment)EG+H2O (Ashrae, 2001)
1.8
2.0
2.2
2.4
2.6
2.8
3.0
3.2
3.4
3.6
40 60 80 100 120 140 160 180
Dyn
amic
vis
cosi
ty (
mP
a.s)
Shear rate (1/s)
30 degree celsius35 degree celsius40 degree celsius45 degree celsius

80
Figure 4.7 shows the viscosity of ethylene glycol/ water-based nanofluids at
various nanoparticle volume fractions as a function of temperature.
Figure 4.7. Effect of the particle volume fractions and temperature on the ethylene
glycol/ water -based nanofluids
Generally, Al2O3 (0.5vol%. and particle size:13nm) nanofluids, demonstrate
higher viscosities compared to base fluid. At 30oC, nanofluids containing 0.5vol%
Al2O3 (particle size:13nm) experienced 9.9% augmentation compared to base fluid.
This is in line with the results obtained by various researchers (Kole and Dey, 2010; Lee
et al., 2011). Their results indicated that nanofluids viscosity tends to increase with the
increase of nanoparticle volume fraction. Viscosity rises due to the mutual interference
created by the nanoparticles as well as the interaction between the nanoparticles and
base fluid. The internal shear stress also increases with nanoparticle concentration.
These are supported by Yang et al., (2012) and Kole and Dey (2010). However, there
are only slight differences observed for nanofluids at 0.1 vol.% loading. It is presumed
that this concentration is too low to impose any effect on nanofluids viscosity. Apart
from that, inclusion of TiO2 nanoparticles into base fluid seems to give minimum effect
2.0
2.2
2.4
2.6
2.8
3.0
3.2
3.4
3.6
3.8
28 30 32 34 36 38 40 42 44 46 48
Dyn
amic
Vis
cosi
ty (
mP
a.s)
Temperature (oC)
Al2O3 (13nm)- 0.1vol.%Al2O3 (13nm)- 0.5vol.%TiO2 (21nm) - 0.1vol.%TiO2 (21nm) - 0.5vol.%Al2O3 (<50nm)- 0.1vol.%Al2O3 (<50nm)- 0.5vol.%Water/EG

81
on viscosity for both 0.1% and 0.5% volume fractions. The TiO2 particle size used in
this study is 21nm. Particles in this suspension might be so well dispersed that
agglomeration effect is minimized. Higher force is needed to overcome the
nanoparticles structure due to agglomeration. Regarding the effect of temperature, it is
obvious that inter-particles forces such as Van der Waals attractive force weaken with
augmentation of temperature. Thus, the nanofluids viscosity is inversely proportional
with temperature as shown in Figure 4.7. For instance, nanofluid viscosity irrespective
of type declines approximately 30-31% when the operating temperature increases from
30 to 45oC. Aside from that, Figure 4.7 also shows that nanoparticle size have effect on
viscosity. For instance 3.3% increase is observed for nanofluid containing 0.1vol. % of
Al2O3 (particle size:13nm) compared to the Al2O3 sizes less than 50nm at 30oC. This
increasing trend is also observed in the studies done by various researchers (Corcione,
2011; Duangthongsuk and Wongwises, 2009; Lu and Fan, 2008). Timofeeva et
al.,(2010) explained that the total area of solid/liquid interface and the number of
nanoparticles increases for the same concentration with smaller particle size. Thus it
increases the electro-viscous effect due to the particle/liquid interfacial as well as the
electrostatic interaction between the particles. Particles agglomeration and the flexibility
of nanofluids motion depends on the electrostatic particles interaction. It becomes
dominant when the particles are at smaller size, therefore, higher viscosity occurres.
Lastly, Figures 4.8 and 4.9 show that all types of tested nanofluids exhibit Newtonian
behaviour since they are independent of shear rate.

82
Figure 4.8 Viscosity of the ethylene glycol/water-based nanofluids with respect to shear
rate at 30oC
Figure 4.9. Viscosity of the ethylene /water-based nanofluids with respect to shear rate At 40oC
3.0
3.1
3.2
3.3
3.4
3.5
3.6
3.7
60 80 100 120 140 160 180 200 220
Dyn
amic
vis
cosi
ty (
m P
a.s)
Shear rate (1/s)
Al2O3 (13nm) 0.1vol.% Al2O3 (13nm)0.5 vol.%
TiO2 (21nm)0.1 vol.% TiO2 (21nm)0.5 vol.%
Al2O3 (<50nm)0.1vol.% Al2O3 (<50nm)0.5vol.%
2.4
2.5
2.6
2.7
2.8
2.9
3.0
60 80 100 120 140 160 180 200 220
Dyn
amic
vis
cosi
ty (
m P
a.s)
Shear rate (1/s)
Al2O3 (13nm)- 0.1vol.% Al2O3 (13nm)- 0.5vol.%
TiO2 (21nm) - 0.1vol.% TiO2 (21nm) - 0.5vol.%
Al2O3 (<50nm)- 0.1vol.% Al2O3 (<50nm)- 0.5vol.%
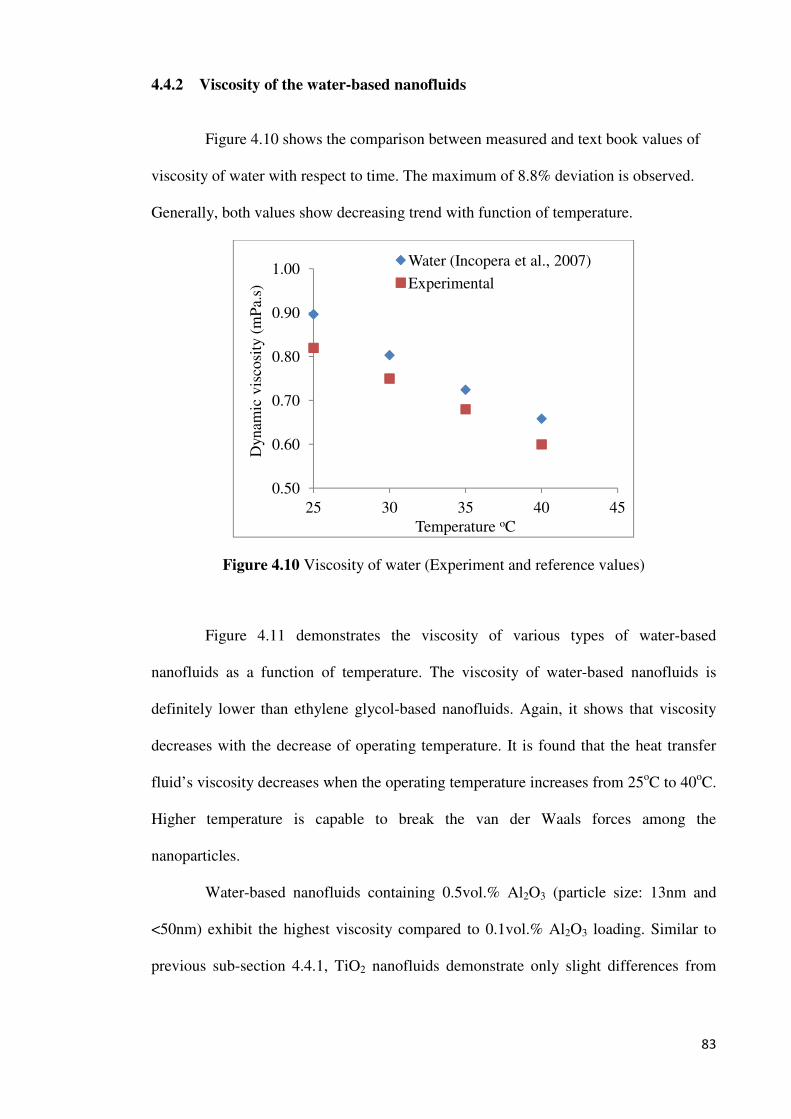
83
4.4.2 Viscosity of the water-based nanofluids
Figure 4.10 shows the comparison between measured and text book values of
viscosity of water with respect to time. The maximum of 8.8% deviation is observed.
Generally, both values show decreasing trend with function of temperature.
Figure 4.10 Viscosity of water (Experiment and reference values)
Figure 4.11 demonstrates the viscosity of various types of water-based
nanofluids as a function of temperature. The viscosity of water-based nanofluids is
definitely lower than ethylene glycol-based nanofluids. Again, it shows that viscosity
decreases with the decrease of operating temperature. It is found that the heat transfer
fluid’s viscosity decreases when the operating temperature increases from 25oC to 40oC.
Higher temperature is capable to break the van der Waals forces among the
nanoparticles.
Water-based nanofluids containing 0.5vol.% Al2O3 (particle size: 13nm and
<50nm) exhibit the highest viscosity compared to 0.1vol.% Al2O3 loading. Similar to
previous sub-section 4.4.1, TiO2 nanofluids demonstrate only slight differences from
0.50
0.60
0.70
0.80
0.90
1.00
25 30 35 40 45
Dyn
amic
vis
cosi
ty (
mP
a.s)
Temperature oC
Water (Incopera et al., 2007)
Experimental

84
the water. It can be assumed that TiO2 is well dispersed not only in the ethylene
glycol/water mixture but also in the water
Figure 4.11. Viscosity of water-based nanofluids
4.5 Discussion on flue gas waste heat recovery through shell and tube heat
exchanger
This section presents the results and discussion from modelling of shell and tube
heat recovery exchanger operated with various types of nanofluids. Application of
nanofluids in heat exchanger used to recover the waste heat from the flue gas. The
analysis was done based on modelling as explained in sub-section 3.3.1.
0.50
0.60
0.70
0.80
0.90
1.00
1.10
1.20
24 26 28 30 32 34 36 38 40 42
Vis
cosi
ty (
mP
a.s)
Temperature oC
Alumina<50nm 0.1vol.% Alumina<50nm 0.5vol.%Titanium 21nm 0.1vol.% Titanium 21nm 0.5vol.%Alumina 13nm 0.1vol% Alumina 13nm 0.5vol.%Water

85
4.5.1 Effect of nanoparticle volume fraction on thermal and energy performance
of shell and tube heat recovery exchanger
Three types of nanofluids were used in the analysis. They are ethylene glycol
based copper nanofluids, water based copper nanofluids and ethylene glycol/water
based aluminium oxide and titanium dioxide nanofluids.
(a) Ethylene glycol based copper nanofluids
The effect of copper (Cu) nanoparticle volume fraction on thermal and energy
performance of the heat recovery exchanger was carried out. In this analysis, the flue
gas and coolant flow rate were kept constant at 26.3 kg/s and 111.6 kg/s, respectively.
In this condition, the flue gas convective heat transfer coefficient was found to be
56.4W/m2K. The sample calculation for flue gas convective heat transfer coefficient is
shown in Appendix G. With the increase of the nanoparticle volume fractions, the
coolant Reynolds's number decreases as shown in Figure 4.12.
Figure 4.12 Effect of copper volume fraction to coolant Reynolds number at
constant flue gas and coolant mass flow rate
2240
2250
2260
2270
2280
2290
2300
2310
0.00
0.10
0.15
0.20
0.25
0.30
0.35
0.40
0.45
0.50
0.55
0.60
0.65
0.70
0.75
0.80
0.85
0.90
0.95
1.00
Coo
lant
Rey
nold
num
ber
Copper nanoparticle volume fraction (vol.%)

86
In this analysis, all parameters except dynamic viscosity of coolant were kept
constant. It is noted that, dynamic viscosity of coolant increases with nanoparticle
volume fraction. Addition of nanoparticles increases the fluid shear stress associated
with a higher dynamic viscosity. Substituting a higher value of this property into
Equation (3.11) definitely decreases the coolant Reynolds number as shown in Figure
4.12. It is assumed that the flow is of laminar type.
Study found that the convective heat transfer coefficient for nanofluids is
proportional with the nanoparticle volume fractions as depicted in Figure 4.13
Figure 4.13 Effect of copper volume fraction to coolant convective heat transfer
coefficient and overall heat transfer coefficient at constant flue gas and coolant mass
flow rate.
In Equation (3.14), nanofluid heat transfer coefficient increases since it exhibits higher
thermal conductivity with the increase of nanoparticle volume fraction. Figure 4.13 also
depicts a higher overall heat transfer coefficient observed with copper nanoparticle
volume fraction. About 9.5% augmentation was observed at 1vol.% copper
nanoparticles compared to the base fluid. Typical calculation of the overall heat transfer
20
21
22
23
24
25
40
42
44
46
48
50
0.000 0.002 0.004 0.006 0.008 0.010
Hea
t tra
nsfe
r co
effi
cien
t (W
/m2 K
)
Copper nanoparticle volume fraction (vol.%)
Heat transfer coefficient Overall heat transfer coefficient
Overall heat transfer coefficient (W
/m2K
)
0 0.2 0.4 0.6 0.8 1.0

87
coefficient is shown in Appendix G. Heat transfer enhancement was observed with the
particle volume fractions as shown in Figure 4.14.
Figure 4.14 Effect copper volume fraction to heat transfer rate at constant
flue gas (26.3kg/s) and coolant (111.6 kg/s) mass flow rate.
Heat transfer was calculated by using Equation (3.22). In this equation, the
effectiveness of the heat recovery exchanger was found to increase with copper
nanoparticle volume fraction. For instance, with an addition of 1vol. % copper
nanoparticles in ethylene glycol-based fluid, 7.8% heat transfer enhancement was
observed at 26.3 kg/s and 111.6 kg/s flue gas mass flow rate and coolant mass flow rate,
respectively. Higher thermal conductivity of nanofluid probably is the main reason
contributing to heat transfer enhancement. More heat can be absorbed and transferred
with the application of nanofluids. The potential mechanism of thermal conductivity
enhancement is due to the nanoparticles’ heat transfer behavior as well as the formation
of liquid-particle interface layer.
As for energy needed to pump the coolant, findings implied that the pressure
drop decreased with copper nanoparticle volume fractions as shown in Figure 4.15.
930
940
950
960
970
980
990
1000
1010
1020
0.000 0.002 0.004 0.006 0.008 0.010
Hea
t tr
ansf
er (
kW)
Copper nanoparticle volume fraction(vol.%)
0 0.2 0.4 0.6 0.8 1.0

88
Figure 4.15 Effect copper volume fraction to coolant pressure drop and pump power at
constant flue gas (26.3kg/s) and coolant (111.6 kg/s) mass flow rate.
Therefore, lower pumping power is needed when nanofluids is used in the heat recovery
exchanger. About 10.99% less power or energy was observed at 1% nanoparticle
volume fraction compared to ethylene glycol base fluid. In the present analysis, the
coolant mass flow was kept constant. As a result, the coolant velocity decreases with
particle volume fractions. Equation (3.25) shows that velocity decreases due to the
increase of nanofluids density. Definitely, nanofluids density increases due to the
higher density of nanoparticles. Nanofluids density can be determined based on rule of
mixture as shown in Equation (3.5). The lower value of velocity decreases the pressure
drop substantially.
(b) Water based copper nanofluids
Similar analysis was done on water based copper nanofluids. In this analysis, the
coolant mass flow rate is fixed at 12 kg/s. Laminar flow was observed for this mass
flow rate. Other parameters were the same as in the previous analysis. Table 4.1 depicts
193
194
195
196
197
198
199
200
201
202
203
204
18.5
19.0
19.5
20.0
20.5
21.0
21.5
0.000 0.002 0.004 0.006 0.008 0.010
Coo
lant
Pum
ping
Pow
er (
kW)
Copper nanoparticle volume fraction (vol.%)
Pump power for entire tube Pressure drop
Pressure drop (kP
a)
0 0.2 0.4 0.6 0.8 1.0

89
the summary of thermal and energy performance enhancement of heat recovery
exchanger operated with water based copper nanofluids compared to base fluid.
Table 4.1 Thermal and energy performance of water -based nanofluids containing 2%
of copper nanoparticles compared to water base fluid at 12kg/s mass flow rate
Number Description Water based copper
nanofluids
1 Coolant convective heat transfer enhancement
33.4%
2 Overall heat transfer coefficient enhancement
10.11%
3 Heat transfer enhancement 4.53% 4 Pump power (lesser) 22.5%
(c) Ethylene glycol/water based aluminium oxide and titanium dioxide nanofluids
Figure 4.16 depicts the overall heat transfer coefficient of the shell and tube heat
recovery exchanger operated with ethylene glycol/water based Al2O3 and TiO2
nanofluids. These nanofluids based coolants exhibit higher overall heat transfer
coefficient compared to water. From this figure, it is observed that ethylene
glycol/water based Al2O3 (particle size: 13nm) offers the highest overall heat transfer
coefficient attributed to its highest thermal conductivity enhancement as described in
sub-section 4.2.

90
Figure 4.16 Overall heat transfer coefficient of shell and tube heat recovery exchanger
operated with ethylene glycol/water -based nanofluids
4.5.2 Effect of flue gas mass flow rate on thermal performance of shell and tube
heat recovery exchanger
This section discusses the influence of flue gas mass flow rate to thermal
performance of heat recovery exchanger. The coolant mass flow rate was fixed at 111.6
kg/s. Flue gas Reynolds’s number was found to increase with mass flow rate as
calculated in Equation (3.3). In this equation, the cross flow area, equivalent diameter
and flue gas dynamic viscosity were kept constant. Then, the higher value of flue gas
convective heat transfer was calculated using Equation (3.4). In Equation (3.4), the
Reynolds’s number was increased with mass flow rate. Other parameters such as
equivalent diameter and flue gas Prandtl number were kept constant. Hence, convective
heat transfer coefficient of flue gas is proportional to mass flow rate as shown in Figure
4.17. It is due to the large number of random and bulk motion of flue gas molecules.
27.0
27.2
27.4
27.6
27.8
28.0
28.2
28.4
28.6
28.8
29.0
29.2
Ove
rall
hea
t tr
ansf
er c
oeff
icie
nt (
W/m
2 K)
EG/H2O+Al2O3(Ø13nm)(0.5%vol)
EG/H2O+TiO2 (Ø21nm)(0.5% vol)
EG/H2O+Al2O3(Ø<50nm)(0.5% vol)
EG/H2O
(21nm)(0.5vol.%)
(13nm)(0.5vol.%)
(<50nm)(0.5vol.%)

91
This value was substituted into Equation 3.15 to calculate the overall heat transfer
coefficient which was found to be proportional to flue gas mass flow rate as depicted in
Figure 4.18.
Figure 4.17 Effect of flue gas mass flow rate to flue gas convective heat transfer
coefficient
Figure 4.18. Effect of flue gas mass flow rate to overall heat transfer coefficient
50
55
60
65
70
75
24 26 28 30 32 34 36 38 40 42 44
Flu
e ga
s he
at t
rans
fer
coef
fici
ent
(W/m
2 K)
Flue gas mass flow rate (kg/s)
22
23
24
25
26
27
28
25 30 35 40 45
Ove
rall
hea
t tr
ansf
er c
oeff
icie
nt (
W/m
2 K)
Flue gas mass flow rate (kg/s)
Ethylene Glycol
0.002
0.004
0.006
0.008
0.01
0.2vol% Cu
0.4 vol % Cu
0.6 vol % Cu
0.8 vol % Cu
1 vol % Cu

92
As the flue gas mass flow rate increases, more energy can be transferred from the flue
gas to the coolants due to the extensive random and bulk motion of flue gas molecules.
Increase of flue gas mass flow rate will decrease the thermal resistance of flue gas. It
also shows that overall heat transfer coefficient increases with the augmentation of
particle volume fraction. Moreover, thermal conductivity of nanofluids increases with
the particle volume fraction. Higher value of thermal conductivity leads to the higher
amount of heat that can be transferred by the nanofluid. Figure 4.19 shows that the heat
transfer rate of 1vol.% copper nanofluids is higher than of base fluid.
Figure 4.19. Effect of flue gas mass flow rate to heat transfer rate
At 1% of copper nanofluids, 15.97% heat transfer enhancement is observed when flue
gas mass flow rate increased from 26.3 kg/s to 42 kg/s.
850
950
1050
1150
1250
24 29 34 39 44
Hea
t tr
ansf
er (
kW)
Flue gas mass flow rate (kg/s)
Ethylene Glycol 0.011 vol % Cu

93
4.5.3 Effect of coolant mass flow rate on thermal performance of shell and tube
heat recovery exchanger
This section presents the effect of coolant Reynolds number on the thermal
performance of heat recovery exchanger. Based on Equation 3.11, it was found that
coolant Reynolds number is proportional with mass flow rate at constant volume
fraction of copper nanoparticle. With the increase of coolant’s Reynolds number,
Nusselt number was increased as calculated using Equation 3.13. Equation 3.13 was
used since the calculated Reynolds number indicated that flow is of turbulent type.
Substituting a higher value of Nusselt and nanofluids thermal conductivity, the
convective heat transfer of coolants was higher than base fluid, which is obtained from
Equation 3.14. The same happened for overall heat transfer coefficient which is
depicted in Figure 4.20.
Figure 4.20. Effect of coolant mass flow rate to overall heat transfer coefficient
Similar to previous analysis, heat transfer rate is proportional to coolant mass flow rate
as shown in Figure 4.21.
52.2
52.3
52.4
52.5
52.6
52.7
52.8
52.9
53.0
190 200 210 220 230 240
Ove
rall
hea
t tr
ansf
er c
oeff
icie
nt (
W/m
2 K)
Coolant mass flow rate (kg/s)
Ethylene Glycol
0.002
0.004
0.006
0.008
0.011 vol % Cu
0.8 vol % Cu
0.6 vol % Cu
0.4 vol % Cu
0.2 vol % Cu

94
Figure 4.21. Effect of coolant mass flow rate to heat transfer rate
However, only 0.7% enhancement is observed when compared with 234kg/s and
200kg/s mass flow rate at 1vol.% of copper nanofluids. This indicates that the coolant
mass flow rate only plays a minor role in enhancing the heat transfer rate compared to
mass flow rate of flue gas.
4.5.4 Comparison of studies
Outcome of the previous section indicates that the overall heat transfer
coefficient increases with the usage of nanofluids. This parameter depends on the
convective heat transfer coefficient of nanofluids as shown in Equation (3.15). Overall
heat transfer coefficient increases with convective heat transfer coefficient. Equation
(3.14) also indicates that convective heat transfer coefficient is proportional to Nusselt
number. Aside from the thermal conductivity, heat transfer coefficient of nanofluids
plays a crucial role in determining the performance of a heat recovery system. To
further strengthen the validity of the results of current study, comparisons have been
1810
1812
1814
1816
1818
1820
1822
1824
1826
1828
190 200 210 220 230 240
Hea
t tr
ansf
er (
kw)
Coolant mass flow rate (kg/s)
Ethylene Glycol 0.011 vol % Cu

95
made with the study conducted by Hojjat et al. (2011). In that study, the authors
investigated the thermal performance of a uniformly heated circular tube. The present
study compares the Nusselt number of the nanofluid with deionized water in a circular
tube. The higher value of Nusselt number definitely increases the heat transfer
coefficient of the base fluid. Moreover, Ijam and Saidur (2012) revealed that convective
heat transfer increases with fluid’s thermal conductivity. The comparison result is
shown in Figure 4.22.
Figure 4.22. Comparison of studies
The Nusselt numbers for ethylene glycol based 0.5vol. % copper nanofluid and water
has been calculated in the present study. It is found that Nusselt number for nanofluid is
higher than deionized water determined by Hojjat et al., (2011). From this, it can be
proved that the application of nanofluids is capable of improving the convective heat
transfer coefficient of the base fluid. In addition, results from literatures also indicate
that application of nanofluids improve the thermal performance of the heat exchanger.
Kulkarni et al. (2008) found that superior performance of convective heat transfer
0
100
200
300
400
500
600
0 5000 10000 15000 20000 25000 30000
Nus
selt
Num
ber
Reynolds number
Nusselt number (Ethylene glycol + 0.5% copper)
Nusselt number (Water)
Experiment result from Hojjat et al. [32]Hojjat et al.(2011)
0.5 vol .% copper)
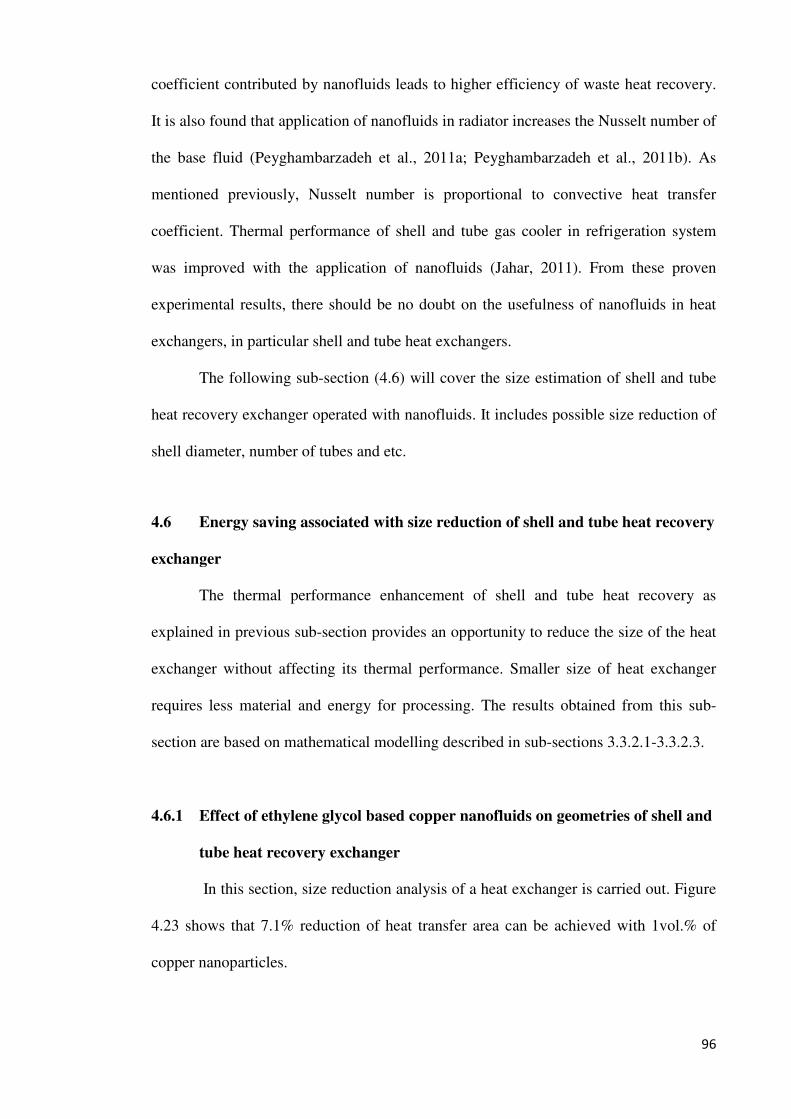
96
coefficient contributed by nanofluids leads to higher efficiency of waste heat recovery.
It is also found that application of nanofluids in radiator increases the Nusselt number of
the base fluid (Peyghambarzadeh et al., 2011a; Peyghambarzadeh et al., 2011b). As
mentioned previously, Nusselt number is proportional to convective heat transfer
coefficient. Thermal performance of shell and tube gas cooler in refrigeration system
was improved with the application of nanofluids (Jahar, 2011). From these proven
experimental results, there should be no doubt on the usefulness of nanofluids in heat
exchangers, in particular shell and tube heat exchangers.
The following sub-section (4.6) will cover the size estimation of shell and tube
heat recovery exchanger operated with nanofluids. It includes possible size reduction of
shell diameter, number of tubes and etc.
4.6 Energy saving associated with size reduction of shell and tube heat recovery
exchanger
The thermal performance enhancement of shell and tube heat recovery as
explained in previous sub-section provides an opportunity to reduce the size of the heat
exchanger without affecting its thermal performance. Smaller size of heat exchanger
requires less material and energy for processing. The results obtained from this sub-
section are based on mathematical modelling described in sub-sections 3.3.2.1-3.3.2.3.
4.6.1 Effect of ethylene glycol based copper nanofluids on geometries of shell and
tube heat recovery exchanger
In this section, size reduction analysis of a heat exchanger is carried out. Figure
4.23 shows that 7.1% reduction of heat transfer area can be achieved with 1vol.% of
copper nanoparticles.

97
Figure 4.23. Effect of copper volume fraction to heat transfer area and shell diameter of
shell and tube heat exchanger operated with ethylene glycol-based nanofluids
Inclusion of copper nanoparticles into base fluid increases the convective heat
transfer coefficient and eventually the overall heat transfer coefficient of the heat
exchanger due to enhancement of nanofluids thermal conductivity. Formation of solid
and liquid interfacial nanolayer and Brownian motion contribute to higher thermal
conductivity of nanofluids (Leong et al., 2010). Jung and Yoo (2009) suggested that,
electric double layer produces interparticle interaction which contributes most
significantly to the improvement of nanofluids thermal conductivity. Moreover,
addition of nanoparticles will delay and create a disturbance of a thermal boundary
layer which eventually improves the convective heat transfer. Substitution of higher
value of overall heat transfer coefficient will decrease the required heat transfer area as
shown in Equation (3.29). In this equation, the heat capacity, Q and log mean
temperature difference values, LMTD are kept constant. Log mean temperature
6400
6450
6500
6550
6600
6650
6700
6000
6100
6200
6300
6400
6500
6600
6700
0.000 0.002 0.004 0.006 0.008 0.010
Hea
t tr
ansf
er a
rea
(m2 )
Volume fraction of copper nanoparticles (vol.%)
Heat exchanger area (m2) Diameter of shell (mm)
Diam
eter of Shell (m
m)
0 0.2 0.4 0.6 0.8 1.0
(m2)

98
difference is determined using Equation (3.30). Reduction of overall shell diameter is
estimated using Equation (3.31) and depicted in Figure 4.23. It is found that volume
fraction of copper nanoparticles is inversely proportional to the shell diameter. About
3.6% reduction of shell diameter is achieved using 1% of copper nanoparticles. In this
equation, all the parameters were kept constant except the heat transfer area. Heat
transfer area is determined based on Equation (3.29) while other parameters are
determined based on the heat exchanger geometry as mentioned in sub-section 3.3.2.1.
Substitution of lower heat transfer area will definitely decrease the overall shell
diameter. Figure 4.24 shows that the volume fraction of nanoparticles is inversely
proportional to the number of tubes.
Figure 4.24 Effect of copper volume fraction to number of tubes in shell and
tube heat exchanger operated with ethylene glycol-based nanofluids
The number of tube is obtained based on Equation (3.32). Geometry specifications of
heat exchanger are kept constant except the diameter of the shell. Study found that
number of tubes is decreased with the increase of copper nanoparticles. Figure 4.25
depicts the calculated convective heat transfer values for tube side. The calculated
15200
15400
15600
15800
16000
16200
16400
16600
0.000 0.002 0.004 0.006 0.008 0.010
Num
ber
of t
ubes
Volume fraction of copper nanoparticles (vol.%)
0 0.2 0.4 0.6 0.8 1.0

99
convective heat transfer values are determined based on the obtained heat exchanger
geometric values. The detail calculations are shown in Appendix G.
Figure 4.25 Calculated tube side heat transfer coefficient for shell and tube heat
exchanger operated with ethylene glycol-based nanofluids
It is revealed that the convective heat transfer coefficient of tube side is
increased although smaller size of heat exchanger is used. The convective heat transfer
coefficient for tube side is calculated based on Equations (3.9)-(3.14).
4.6.2 Effect of water based copper nanofluids on the geometries of shell and heat
recovery exchanger
About 4% area reduction is observed at 2.5 vol. % of copper nanoparticles. For
the shell diameter, 2% reduction was observed. As for number of tubes, 4% reduction
was observed. These results are shown in Figures 4.26 and 4.27.
40
41
42
43
44
45
46
47
48
0.000 0.002 0.004 0.006 0.008 0.010
Con
vect
ive
heat
tra
nsfe
r co
effi
cien
t (w
/m2 K
)
Volume fraction of copper nanoparticles (vol.%)
0 0.2 0.4 0.6 0.8 1.0

100
Figure 4.26 Effect of copper volume fraction to heat transfer area and shell
diameter of shell and tube heat exchanger operated with water-based nanofluids
Figure 4.27 Effect of copper volume fraction to number of tubes in shell and tube
heat exchanger operated with water-based nanofluids
The calculated convective heat transfer for tube side of heat exchanger is shown in
Figure 4.28. Similar to the previous section, higher convective heat transfer coefficient
is observed although smaller size of heat exchanger is used.
7020
7040
7060
7080
7100
7120
7140
7160
7180
7200
7250
7300
7350
7400
7450
7500
7550
7600
7650
0 0.005 0.01 0.015 0.02 0.025 0.03
Hea
t tr
ansf
er a
rea
(m2 )
Volume fraction of copper nanoparticles (Vol.%)
Heat transfer area (m2) Diameter (mm)
0 0.5 1.0 1.5 2.0 2.5
18200
18400
18600
18800
19000
19200
0 0.005 0.01 0.015 0.02 0.025 0.03
Num
ber
of t
ube
Volume fraction of copper nanoparticles (vol%)
0 0.5 1.0 1.5 2.0 2.5 3.0
She
ll d
iam
eter
(m
m)
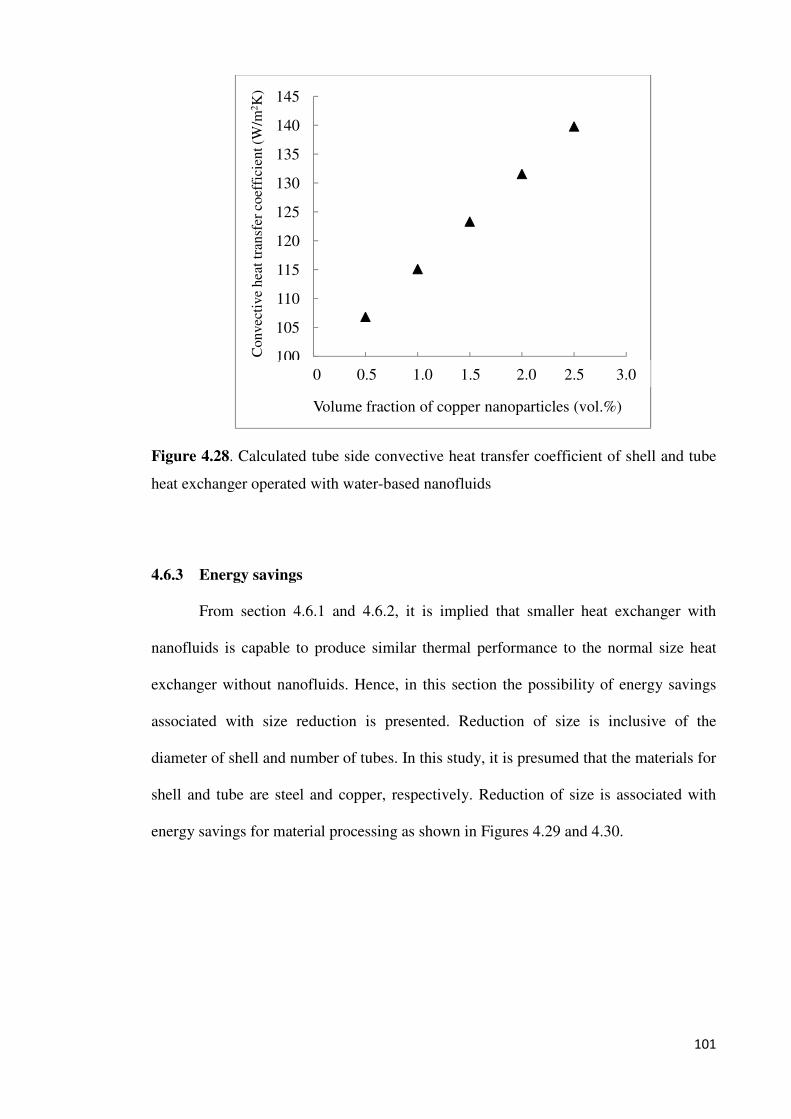
101
Figure 4.28. Calculated tube side convective heat transfer coefficient of shell and tube
heat exchanger operated with water-based nanofluids
4.6.3 Energy savings
From section 4.6.1 and 4.6.2, it is implied that smaller heat exchanger with
nanofluids is capable to produce similar thermal performance to the normal size heat
exchanger without nanofluids. Hence, in this section the possibility of energy savings
associated with size reduction is presented. Reduction of size is inclusive of the
diameter of shell and number of tubes. In this study, it is presumed that the materials for
shell and tube are steel and copper, respectively. Reduction of size is associated with
energy savings for material processing as shown in Figures 4.29 and 4.30.
100
105
110
115
120
125
130
135
140
145
0.000 0.005 0.010 0.015 0.020 0.025 0.030
Con
vect
ive
heat
tran
sfer
coe
ffic
ient
(W
/m2 K
)
Volume fraction of copper nanoparticles (vol.%)
0 0.5 1.0 1.5 2.0 2.5 3.0

102
Figure 4.29 Mass reduction of shell and tube heat recovery exchanger operated with
ethylene glycol-based copper nanofluids
Figure 4.30 Energy saving of material processing of shell and tube heat recovery
exchanger operated with ethylene glycol-based copper nanofluids
Observation of 5932.9MWh energy savings can be achieved at 1% copper volume
fraction. This analysis is done on energy savings for a total of 1,000 shell and tube heat
0
1,000,000
2,000,000
3,000,000
4,000,000
5,000,000
6,000,000
0.10
0.15
0.20
0.25
0.30
0.35
0.40
0.45
0.50
0.55
0.60
0.65
0.70
0.75
0.80
0.85
0.90
0.95
1.00
Mas
s re
duct
ion
of s
hell
and
tub
e he
at
exch
ange
r (k
g)
Volume fraction of copper nanoparticle(vol.%)
0
1000
2000
3000
4000
5000
6000
7000
0.10
0.15
0.20
0.25
0.30
0.35
0.40
0.45
0.50
0.55
0.60
0.65
0.70
0.75
0.80
0.85
0.90
0.95
1.00
Tot
al e
nerg
y sa
ving
for
mat
eria
l pr
oces
sing
(M
wh)
Volume fraction of copper nanoparticles (vol.%)

103
recovery exchangers. Smaller size of heat exchanger requires fewer materials which
will eventually decrease the energy needed for material processing. This can be
explained by using Equations (3.33) - (3.34). Smaller size of heat exchanger definitely
decreased the value of heat exchanger volume. Substitution of lower value of volume
into Equation (3.33) will lead to fewer amounts (mass) of needed material. Finally, the
energy required for material processing is determined using Equation (3.34). Equation
(3.35) - (3.36) show the formulation used to calculate the mass reduction and energy
savings of heat exchanger. Sample calculation of the energy saving is shown in
Appendix G. Figure 4.31 and 4.32 show the energy savings associated with mass
reduction of heat exchanger using water based copper nanofluids.
Figure 4.31 Mass reduction of shell and tube heat recovery exchanger operated with
water- based copper nanofluids
0
1,000,000
2,000,000
3,000,000
4,000,000
0.005 0.01 0.015 0.02 0.025
Mas
s re
duct
ion
of s
hell
and
tub
e he
at e
xcha
nger
(k
g)
Volume fraction of copper nanoparticle (vol.%)
0.5 1.0 1.5 2.0 2.5

104
Figure 4.32 Energy saving of material processing of shell and tube heat recovery
exchanger operated with water-based copper nanofluids
It is observed that 3857.9 MWh of energy can be saved at 2.5 vol. % of copper
concentration into base fluid. Energy savings increase with increase of weight
reduction. With this, it can be stated that, energy savings not only can save the cost but
also reduces the amount of pollutant gasses. In the next sub-section, the findings on the
entropy generation analysis of nanofluid flow in a circular tube subjected to constant
wall temperature are elaborated.
0
500
1000
1500
2000
2500
3000
3500
4000
4500
0.005 0.010 0.015 0.020 0.025
Tot
al e
nerg
y sa
ving
for
mat
eria
l pr
oces
sing
(M
Wh)
Volume fraction of copper nanoparticle (vol.%)
0.5 1.0 1.5 2.0 2.5

105
4.7 Entropy generation analysis of nanofluid flow in a circular tube subjected
to constant wall temperature
The comparative studies used to validate the proposed modelling will be
discussed first in sub-section 4.7.1. The total dimensionless entropy generation of
water-based nanofluids under different conditions and flows and the comparison
between Al2O3and TiO2 nanofluids will be described later in sub-sections 4.7.2 and
4.7.3.
4.7.1 Comparative studies
Figure 4.33 illustrates the total dimensionless entropy generation of water with
respect to modified Stanton number, П1.
Figure 4.33. Comparative studies
Modified Stanton number, П1 is a product of Stanton number, St and dimensionless
length, Ë. Operating conditions for this analysis are fluid velocity (0.02 m/s),
dimensionless wall and fluid temperature difference τ = 0.214, tube diameter (0.1m) and
fluid temperature (300K). There are slight differences in the results although both
0.020
0.025
0.030
0.035
0.040
0.045
0.050
0.055
0 0.1 0.2 0.3 0.4 0.5 0.6 0.7 0.8
Tot
al d
imen
sion
less
ent
ropy
gen
erat
ion
Modified Stanton number, П1
Water- this study
Water - Sahin [24]Sahin, 2000

106
studies use the same working fluid (water). One of the reasons for the discrepancies is
the different thermo-physical properties of water. The present study used thermo-
physical properties obtained from Incropera et al., (2007) which are different from those
by Sahin (2000). Other contributing factors are the fluid temperature and Nusselt
number correlation applied for turbulent flow. It is noted that, present study utilized
Dittus-Boelter correlation but Sahin et al., (2000) used Nusselt number correlation from
Gnielinski. This study also found that different properties of viscosity will result in
different values for tube length in order to produce the same value of П1. Sahin (2000)
used 9.93×10⁻⁴ Ns/m2 while the current study used 8.55×10⁻⁴ Ns/m2. The viscosity
affects the Reynolds number of the fluid as shown in Equation 3.48. It is evident that
the change in the Nusselt number (Equation (3.53)) due to Reynolds number will
eventually change the convective heat transfer coefficient (Equation (3.51)).
Substitution of different convective heat transfer coefficients into Equation (3.50) will
definitely cause adjustment to the value of Stanton number. Therefore, length of tube
needs to be changed to cater for the modification of Stanton number with production of
the same value of П1. This is based on Equation (3.43). Overall, Figure 4.33 implies that
the same trend is observed for both studies.

107
4.7.2 Water based aluminium oxide nanofluids
The following sub-section shows the entropy generation results for water based
Al2O3 nanofluids. Factors such as nanoparticle loading, dimensionless wall and fluid
temperature difference, type of flow and geometry configurations are presented as well.
4.7.2.1 Total dimensionless entropy generation using different aluminium oxide
nanoparticles loading and dimensionless wall and fluid temperature different
In this analysis, the volume fractions of nanoparticle are set as variable
parameter, ranging from 0 to 7%. Other parameters such as tube length, l (5m) and
diameter, d (0.0229m), dimensionless wall and fluid temperature difference, τ (0.01),
working fluid mass flow rate, � (0.01kg/s) and fluid temperature, T (300K) are fixed as
constants. According to Figure 4.34, it is found that the total dimensionless entropy
generation is reduced with nanoparticle volume fractions.
Figure 4.34 Contribution of heat transfer and fluid friction on the total dimensionless
entropy generation
0
2E-09
4E-09
6E-09
8E-09
1E-08
6.20E-05
6.40E-05
6.60E-05
6.80E-05
7.00E-05
7.20E-05
7.40E-05
0 0.02 0.04 0.06 0.08
Dim
ensi
onle
ss e
ntro
py g
ener
atio
n (t
otal
and
hea
t tr
ansf
er c
ontr
ibut
ion)
Volume fractions of Al2O3nanoparticle (vol.%)Dimensionless entropy generation (heat transfer contribution)
Total dimensionless Entropy generation (total)
Dimensionless entropy generation (Pressure drop contribution)
Dim
ensionless entropy generation (Friction
loss contribution)
0 2.0 4.0 6.0 8.0
6.2×10⁻⁵
6.4×10⁻⁵
6.6×10⁻⁵
6.8×10⁻⁵
7.0×10⁻⁵
7.2×10⁻⁵
7.4×10⁻⁵
2.0×10⁻⁹
4.0×10⁻⁹
6.0×10⁻⁹
8.0×10⁻⁹
1.0×10⁻⁸

108
Total dimensionless entropy generation is calculated by Equation (3.38) which is
comprised of heat transfer (first and second term in the parentheses) and fluid friction
(third term). The entropy generation through the heat transfer enhancement process will
be at reducing rate by the addition of nanoparticles. Addition of nanoparticles increases
the thermal conductivity of nanofluids as depicted in Equation (3.38). At the same time,
augmentation of convective heat transfer is observed since the thermal conductivity is
proportional to convective heat transfer coefficient as shown in Equation (3.51). Thus,
Stanton number as given in Equation (3.50) increases. Finally, the entropy generation
due to heat transfer enhancement is minimized based on Equation (3.42).
The entropy generation is also created by the fluid friction which will eventually
cause fluid pressure drop. Minimization trend can be explained by referring to pressure
drop formulation (Equation (3.47)). There are three (3) variables in this equation
namely friction factor, density and velocity of fluids. At constant mass flow rate,
friction factor and density increases with particle volume fraction but velocity shows the
other way. A close examination of this equation, it is noted that the decreasing effect of
fluid velocity is more pronounced since it is in power of two. Thus, the slight decrease
in pressure drop of the fluid is observed as given in Equation (3.47). However, this
decreasing trend is only valid for lower particle volume fractions. At higher particle
volume fractions, the pressure drop shows the opposing trend although the total
dimensionless entropy generation due to fluid friction is still on a decreasing trend. This
could be due to density effect, which is more pronounced for higher loading of
nanoparticles. Density is determined using Equation (3.5). Sample calculation of the
water based 1vol. % Al2O3 nanofluids can be obtained in Appendix G. Figure 4.35
demonstrates that total dimensionless entropy generation increases with τ.

109
Figure 4.35 Effect of dimensionless temperature different on total dimensionless
entropy generation of nanofluids flow
Total dimensionless entropy generation is defined by Equation (3.55). Similar result is
found from the study conducted by Dagtekin et al. (2005). It is found that as τ increases,
the total dimensionless entropy generation of the fluid increases (for circular duct with
thin, triangular and V-shaped fins).
4.7.2.2 Total dimensionless entropy generation using laminar and turbulent flow
Figures 4.36 and 4.37 depict the effect of fluid mass flow rate on total
dimensionless entropy generation of nanofluids for laminar and turbulent flows.
Parameters that are fixed in this section include tube diameter, d (0.0229m), tube length,
l (5m), dimensionless wall and fluid temperature different, τ (0.01). Laminar flow is
produced from mass flow rate, � ranging from 0.01kg/s to 0.02 kg/s. Figure 4.36 shows
that total dimensionless entropy generation increases with mass flow rate.
0.00E+00
5.00E-05
1.00E-04
1.50E-04
2.00E-04
2.50E-04
3.00E-04
3.50E-04
0 0.02 0.04 0.06 0.08
Dim
ensi
onle
ss E
ntro
py g
ener
atio
n
Volume fraction of Al2O3nanoparticles(vol.%)
τ = 0.01 τ = 0.015 τ = 0.02
0 2.0 4.0 6.0 8.0 0
3.5 × 10⁻⁴
3.0 × 10⁻⁴
2.5 × 10⁻⁴
2.0 × 10⁻⁴
1.5 × 10⁻⁴
1.0 × 10⁻⁴
5.0 × 10⁻⁵

110
Figure 4.36 Total dimensionless entropy generation of nanofluids using laminar flow
Both entropy generations due to heat transfer and fluid friction are maximized
when mass flow rate increases. Higher mass flow rate increases the fluid velocity as
given in Equation (3.49). Stanton number which is determined from Equation (3.50)
decreases due to the increase of fluid velocity. Inclusion of lower value of Stanton
number will increase the entropy generation due to heat transfer process. Similar trend
is observed for entropy generation contributed by fluid friction. Pressure drop tends to
increase as the fluid velocity increases as depicted in Equation (3.47). Increase of
pressure drop results in higher entropy generation. Similar trend is found for the
turbulent flow as shown in Figure 4.37.
7.20634E-05
8.3527E-05
6.0E-05
6.5E-05
7.0E-05
7.5E-05
8.0E-05
8.5E-05
0 0.02 0.04 0.06 0.08
Tot
al d
imen
sion
less
ent
ropy
gen
erat
ion
Volume fractions of Al2O3 nanoparticle (vol.%)
0.01kg/s 0.012kg/s 0.014kg/s
0.016kg/s 0.018kg/s 0.02kg/s
0 2.0 4 6.0 8.0
8.5×10⁻⁵
8.0×10⁻⁵
7.0×10⁻⁵
6.5×10⁻⁵
6.0×10⁻⁵
7.5×10⁻⁵

111
Figure 4.37 Total dimensionless entropy generation of nanofluids using turbulent flow
Mass flow rates from 0.1kg/s to 0.2kg/s are chosen to produce turbulent flow.
Although the convective heat transfer increases with mass flow rate, the effect of higher
fluid velocity is more pronounced, thus, resulting in lower Stanton number. The
convective heat transfer coefficient is calculated from Equations (3.51) and (3.53) while
Stanton number from Equation (3.50). The pressure drop of nanofluids also seems to be
increasing with mass flow rate. All these factors lead to higher total entropy generation
of nanofluids.
4.7.2.3 Total dimensionless entropy generation using different geometry
configurations
Geometry configurations considered in this study are tube length and diameter.
Figure 4.38 shows that, the total entropy generation decreases with respect to tube
length.
6.0E-05
6.2E-05
6.4E-05
6.6E-05
6.8E-05
0 0.02 0.04 0.06 0.08
Tot
al d
imen
sion
less
ent
ropy
gen
erat
ion
Volume fractions of Al2O3 nanoparticle (vol.%)
0.1kg/s 0.12kg/s 0.14kg/s
0.16kg/s 0.18kg/s 0.2kg/s
0 2.0 4.0 6.0 8.0 6.0×10⁻⁵
6.2×10⁻⁵
6.4×10⁻⁵
6.6×10⁻⁵
6.8×10⁻⁵

112
Figure 4.38 Total dimensionless entropy generation of nanofluids with respect to tube
length
Parameters used for this study are mass flow rate, � (0.01kg/s), tube diameter, d
(0.0229m), Al2O3 volume fraction (7%), dimensionless temperature difference, τ (0.01)
and 300K fluid temperature, T. The considered tube length is from two (2) to ten (10)
meters. Laminar flow is created using 0.01kg/s of mass flow rate. One of the possible
reasons contributing to this result is the increase of dimensionless length, λ. The
dimensionless length, λ is affected by the tube length as given by Equation (3.56).
Substitution of higher value of dimensionless length decreases the total dimensionless
entropy generation of nanofluids as determined by Equation (3.42). The same operating
conditions are used to test the effect of different tube diameters. The only difference is
that the tube length is fixed at 5 meter while the tube diameter ranges from 0.01 to
0.03m. The result of this analysis is shown in Figure 4.39.
4.0E-05
5.0E-05
6.0E-05
7.0E-05
8.0E-05
9.0E-05
0 2 4 6 8 10 12
Tot
al d
imen
sion
less
ent
ropy
gen
erat
ion
Tube length (m)
4.0×10⁻⁵
5.0×10⁻⁵
7.0×10⁻⁵
8.0×10⁻⁵
9.0×10⁻⁵
6.0×10⁻⁵

113
Figure 4.39 Total dimensionless entropy generation of nanofluids with respect to
tube diameter
Study implies that there is slight decrease (0.3%) in total dimensionless entropy
generation when diameter increases from 0.01 to 0.03 meter. Analysis shows that the
fluid pressure drop is inversely proportional to tube diameter. Bigger tube diameter
might increase the fluid friction, however, the fluid velocity also decreases at the same
time. Combination of lower fluid velocity and higher tube diameter will reduce the
pressure drop as given by Equation (3.47). Calculations using Equation (3.42) show that
contribution of heat transfers to the entropy generation remain unchanged even though
different tube diameters are used. This might be due to increase of Stanton number
being compensated by the decrease of dimensionless length.
6.425E-05
6.430E-05
6.435E-05
6.440E-05
6.445E-05
6.450E-05
0.01 0.015 0.02 0.025 0.03 0.035
Tot
al e
ntro
py g
ener
atio
n
Tube diameter (m)
6.425×10⁻⁵
6.430×10⁻⁵
6.435×10⁻⁵
6.440×10⁻⁵
6.445×10⁻⁵
6.450×10⁻⁵

114
4.7.2.4 Total dimensionless entropy generation of water based aluminium oxide
and titanium dioxide nanofluids
Figure 4.40 compares the total dimensionless entropy generation of Al2O3 and
TiO2 nanofluids. The thermo-physical properties of Al2O3 and TiO2 are obtained from
the literatures and mathematical correlations.
Figure 4.40 Comparison of total dimensionless entropy generation between Al2O3 and
TiO2 nanofluids
It is found that entropy generation by TiO2 nanofluids is lower than Al2O3
nanofluids. Addition of 4vol.% of Al2O3 nanoparticles reduces the total dimensionless
entropy generation by 6.4% compared to 9.7% reductions observed with the use of
TiO2. It might be due to higher thermal conductivity of TiO2 nanofluids. Thermal
conductivity of nanofluids is affected by stability of the suspension, size of the particles,
type of particle and etc. In this case, the particle size of Al2O3 is 30nm while the TiO2 is
15nm taken from Murshed et al. (2009). Smaller particle size provides higher surface
area to volume ratio which will enhance the heat transfer process.
6.2E-05
6.4E-05
6.6E-05
6.8E-05
7.0E-05
7.2E-05
7.4E-05
0 0.02 0.04 0.06 0.08
Tot
al d
imen
sion
less
ent
ropy
gen
erat
ion
Volume fractions of nanoparticle (vol.%)
Titanium dioxide Alumina
0 2.0 4.0 6.0 8.0
Al2O3TiO2
7.4×10⁻⁵
7.2×10⁻⁵
7.0×10⁻⁵
6.8×10⁻⁵
6.6×10⁻⁵
6.4×10⁻⁵
6.2×10⁻⁵

115
Figure 4.41 depicts the total entropy generations modelled from the thermo-
physical experimental data obtained in the present study. Four types of fluids were
considered; water based Al2O3 (particle size 13nm and <50nm) nanofluids, water based
TiO2 (particle size: 21nm) nanofluids and water base fluid. The selected particle volume
fraction is 0.5%. Study implied that the nanofluids (except Al2O3 with particle size:
<50nm) have lower entropy generation in comparison to that of water base fluid. In sub-
section 4.2, it is found that thermal conductivity of the Al2O3 with particle size less than
50nm has lower thermal conductivity compared to the base fluid. Thus, it contributes to
higher total dimensionless entropy generation in this analysis.
Figure 4.41 Total dimensionless entropy generation of various water-based nanofluids
6.95E-05
7.00E-05
7.05E-05
7.10E-05
7.15E-05
7.20E-05
7.25E-05
7.30E-05
7.35E-05
7.40E-05
1
Tot
al d
imen
sion
less
ent
ropy
gen
erat
ion
Axis TitleAl2O3 (Ø<50nm, 0.5V%) H2O
TiO2 (Ø21nm, 0.5V%) Al2O3 (Ø13nm, 0.5V%)
(<50nm,0.5 vol.%)
(21nm, 0.5 vol.%) (13nm, 0.5 vol.%)
6.95×10⁻⁵
7.00×10⁻⁵
7.05×10⁻⁵
7.10×10⁻⁵
7.15×10⁻⁵
7.20×10⁻⁵
7.25×10⁻⁵
7.30×10⁻⁵
7.35×10⁻⁵
7.40×10⁻⁵

116
4.8 Performance investigation of nanofluids as working fluid in a thermosyphon
air preheater
This section covers all the major findings on the performance of thermosyphon
air preheater operated with nanofluid as a working fluid. Thermosyphon air preheater
heat exchanger serves as an alternative option to recover waste heat beside shell and
tube heat exchanger.
4.8.1 Comparative studies
Figures 4.42-4.44 depict the relationship between hot air inlet and outlet
temperatures at 3 different hot air velocities. The results obtained from present study are
compared to the results from Noie (2006).
Figure 4.42. Relationship between hot air inlet and outlet temperature at 2.5 m/s hot air
velocity
40
80
120
160
200
240
280
100 120 140 160 180 200 220 240 260 280 300
Hot
air
out
let
tem
pera
ture
(o C
)
Hot air inlet temperature (oC)
Experimental [15]
Theoretical [15]
Theoretical (Thispaper)(This study)
Noie (2006)
Noie (2006)
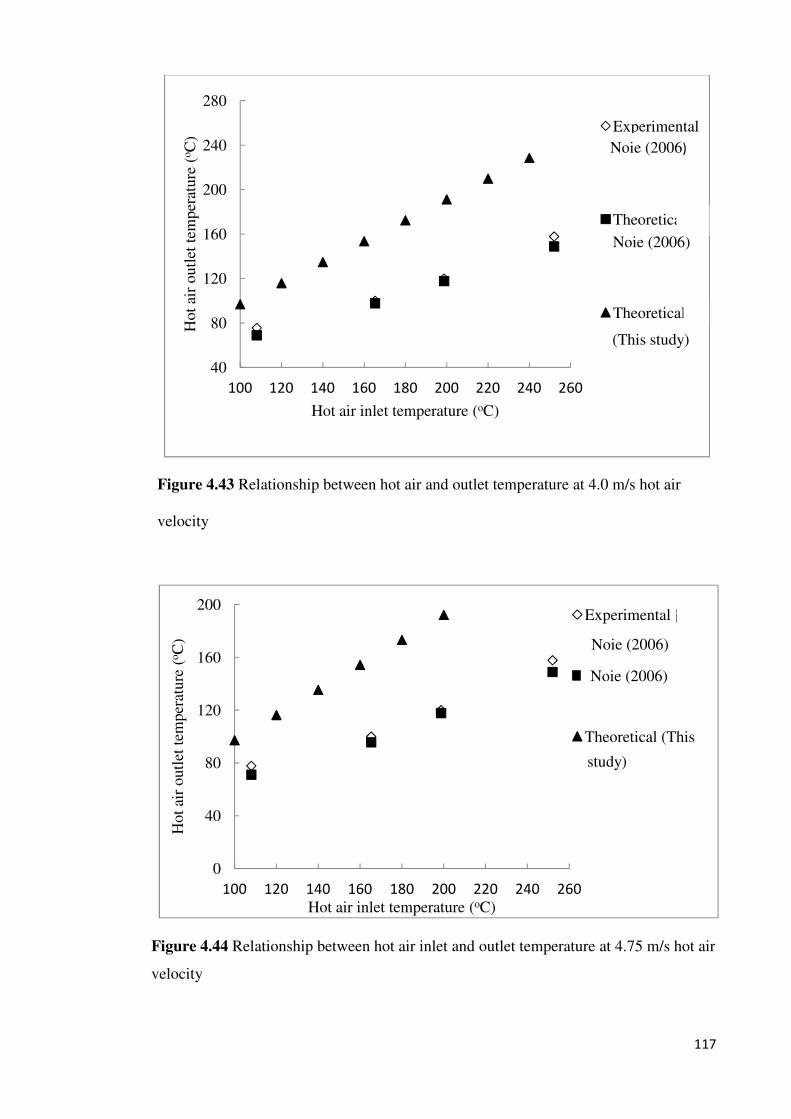
117
Figure 4.43 Relationship between hot air and outlet temperature at 4.0 m/s hot air
velocity
Figure 4.44 Relationship between hot air inlet and outlet temperature at 4.75 m/s hot air
velocity
40
80
120
160
200
240
280
100 120 140 160 180 200 220 240 260
Hot
air
out
let
tem
pera
ture
(o C
)
Hot air inlet temperature (oC)
Experimental [15]
Theoretical [15]
Theoretical (This paper) (This study)
0
40
80
120
160
200
100 120 140 160 180 200 220 240 260
Hot
air
out
let
tem
pera
ture
(o C
)
Hot air inlet temperature (oC)
Experimental [15]
Theoretical [15]
Theoretical (This paper) study)
Noie (2006)
Noie (2006)
Noie (2006)
Noie (2006)

118
It is found that the results’ accuracy is higher at lower hot air inlet temperatures.
It is noted that the hot air inlet temperature is proportional to hot air outlet temperature.
Figure 4.45 depicts the relationship between hot air inlet temperature, hot air
velocity and absorbed energy at evaporator section.
Figure 4.45 Effect of hot air inlet temperature and velocity to energy absorbed
at evaporator section
Hot inlet air temperature is proportional to absorbed energy. It is noted that the hot air
with higher temperature contains higher amount of heat, hence more heat can be
absorbed at the evaporator section. Aside from temperature, the velocity of hot air also
plays a crucial role in determining the absorbed energy. Higher augmentation of hot air
velocity increases the absorbed energy. Based on Equation (3.82), it is found that the
absorbed energy depends on capacity rate, C. Capacity rate is multiplication of hot air
mass flow rate and specific heat as shown in Equation (3.73). Increase of the hot air
0
1000
2000
3000
4000
5000
6000
0 50 100 150 200 250 300
Abs
orbe
d en
ergy
(W
att)
Hot air inlet temperature (oC)
2.5m/s
4m/s
4.75m/s
Hot air velocity

119
velocity will increase the hot air mass flow rate. Substitution of this value into Equation
(3.82) increases the absorbed energy. In addition, convective heat transfer coefficient of
the hot air increases with the increase of hot air velocity as shown in Equation (3.57).
Higher convective heat transfer decreases the thermal resistance of the air as shown in
Equation (3.62). The large amount of the collective and aggregate movement of hot air
molecules contribute to higher heat transfer rates (Incropera et al., 2007).
4.8.2. Influence of nanoparticles volume fraction and hot air velocity on thermal
and energy performance of thermosyphon heat exchanger
The following sub-sections describe the thermal and energy performance of
thermosyphon heat exchanger operated with nanofluids.
4.8.2.1 Thermal performance of thermosyphon heat exchanger
This section discusses the influence of nanoparticle volume fraction and hot air
velocity on the thermal performance of a thermosyphon heat exchanger. The thermal
performance analysis includes investigating overall heat transfer coefficient and cold air
outlet temperature. From Figure 4.46, it is found that minor differences were created in
overall heat transfer coefficient for thermosyphon operated with water and nanofluids.

120
Figure 4.46 Effect of nanoparticles’ volume fraction and hot air velocity to
overall heat transfer coefficient of heat pipe heat exchanger
Only a slight increase in overall heat transfer coefficient is observed with addition of
nanoparticles. From the literatures, the change of heat pipe surface and working fluids
thermo-physical properties (thermal conductivity, specific heat and viscosity) are the
possible mechanisms contributing to higher efficiency of heat pipe. However, it is noted
that the formulations used in the present study only covers the thermo-physical
properties of the nanofluids. External surface change is not considered in the analysis.
Do and Jang (2010) found that the change of evaporator surface causes substantial
effect compared to the change of working fluid thermo-physical properties. The authors
revealed that development of thin porous coating layer at the evaporator augments the
heat transfer rate by providing additional surface for evaporation. Qu et al. (2010)
agreed that Al2O3 nanoparticles settlement at the evaporator section of oscillating heat
pipe provides major contribution to the thermal performance enhancement of heat pipe.
40
45
50
55
60
65
70
0 0.01 0.02 0.03 0.04 0.05 0.06 0.07 0.08
Ove
rall
hea
t tr
ansf
er c
oeff
icie
nt (
W/m
2 K)
Volume fraction of nanoparticle (vol.%)
Alumina (4.75m/s)
Titanium dioxide (4.75m/s)Alumina (4.0m/s)
Titanium dioxide (4.0m/s)Alumina (2.5m/s)
Titanium dioxide (2.5m/s)
0 1 2 3 4 5 6 7 8
TiO2 (4.75 m/s)
Al2O3 (4.0 m/s)
TiO2 (4.0 m/s)
Al2O3 (2.5 m/s)
TiO2 (2.5 m/s)
Al2O3 (4.75 m/s)

121
It is found that, settlements of the nanoparticles occurred at both sides. Thus, Figure
4.46 again proves that the change of working fluid (nanofluids) only provides minor
contribution to the heat transfer enhancement of the heat pipe. The surface change in the
heat pipe or thermosyphon itself is the main factor for the thermal performance
enhancement.
It is noticed that the overall heat transfer coefficient of the thermosyphon
operated with TiO2 nanofluids is slightly higher than Al2O3 nanofluids. It is due to
higher thermal conductivity of TiO2 nanofluids compared to that of the Al2O3
nanofluids. For the effect of hot air velocity, present study implied that higher velocity
enhances the overall heat transfer coefficient. At 7% Al2O3 volume fraction, 23%
improvement of overall heat transfer coefficient is observed when hot air velocity
increases from 2.5m/s to 4.75m/s. The same amount of enhancement is observed for 4%
volume fraction of TiO2. Higher air velocity increases its convective heat transfer which
reduces the thermal resistance of air. Eventually, it increases the overall heat transfer
coefficient. Similar to section 4.8.1, higher air velocity produces large amount of
collective and aggregate movement of hot air molecules. Sample calculation of the
water based 1 vol.% Al2O3 nanofluid’s overall convective heat transfer coefficient is
shown in Appendix G. Figure 4.47 depicts the effect of nanoparticle volume fraction
and hot air velocity to the cold air outlet temperature.

122
Figure 4.47 Effect of nanoparticles’ volume fraction and hot air velocity to cold
air outlet temperature of heat pipe heat exchanger
The cold air outlet temperature is associated with the overall heat transfer coefficient.
Hence, similar trend is observed in Figure 4.47. Not much increase in the cold air outlet
temperature is observed with the augmentation of particle volume fraction. However,
both Al2O3(7vol.%) and TiO2(4vol.%) offer 2.4% cold air outlet temperature
enhancement when hot air velocity increases from 2.5m/s to 4.75m/s.
4.8.2.2 Energy performance of thermosyphon heat exchanger
This section further analyzes the cold air outlet temperature obtained from
section 4.8.2.1. Energy will be supplied to the cold air until its temperature reaches
126.85oC to facilitate fuel combustion process. This value is taken from Saidur et al.,
(2010). The authors used it in their energy and exergy analysis for industrial boilers.
Figures 4.48-4.49 shows the energy required to increase the air temperature to 126.85oC
for Al2O3and TiO2 nanofluids, respectively.
27.8
27.9
28.0
28.1
28.2
28.3
28.4
28.5
28.6
0.00 0.01 0.02 0.03 0.04 0.05 0.06 0.07 0.08
Col
d ai
r ou
tlet
tem
pera
ture
(o C
)
Volume fraction of nanoparticles (vol.%)
Alumina (4.75m/s)
Titanium dioxide (4.75m/s)Alumina (4.0m/s)
Titanium dioxide (4.0m/s)Alumina (2.5m/s)
Titanium dioxide (2.5m/s)
0 1 2 3 4 5 6 7 8
Al2O3 (4.75 m/s)
TiO2 (4.75 m/s)
Al2O3 (4.0 m/s)
TiO2 (4.0 m/s)
Al2O3 (2.5 m/s)
TiO2 (2.5 m/s)

123
Figure 4.48 Effect of Al2O3 nanoparticles’ volume fraction and hot air velocity to
energy performance of thermosyphon heat exchanger
Figure 4.49 Effect of TiO2 nanoparticles, volume fraction and hot air velocity to
energy performance of thermosyphon heat exchanger
4900
4910
4920
4930
4940
4950
4960
0 0.01 0.02 0.03 0.04 0.05 0.06 0.07
Ene
rgy
requ
ired
to
heat
com
bust
ion
air
(kW
) -
100
boil
ers
Volume fraction of Al2O3 nanoparticles (vol.%)
2.0m/s
4.0m/s
4.75m/s
Hot air
4900
4910
4920
4930
4940
4950
4960
0 0.01 0.02 0.03 0.04
Ene
rgy
requ
ired
to
heat
com
bust
ion
air
(kW
) -
100
boil
ers
Volume fraction of titanium dioxide nanoparticles
2.0m/s
4.0m/s
4.75m/s
Hot air velocity
0 1 2 3 4
0 1 2 3 4 5 6 7

124
This is the total energy required to increase the air to 126.85oC predicted for 100
boilers. It is found that, the required energy decreases with increase of hot air velocity.
Similar to section 4.8.2.1, this happened due to decrease of thermal resistance at the
evaporator side. Increase in the air velocity produces higher convective heat transfer
coefficient which eventually decreases the air thermal resistance. For instance, the
required energy reduces 0.67% when hot air velocity increases from 2.0 m/s to 4.75 m/s
for 7vol. % of Al2O3 nanofluids. Similar reduction percentage is observed for 4vol. %
titanium dioxide nanoparticles. However, not much energy difference is found with
increasing the nanoparticle volume fraction for two types of nanofluids. The next
chapter will describe the conclusions derived from the present study and suggestions for
further study.

125
CHAPTER 5 CONCLUSION AND RECOMMENDATIONS
5.1 Conclusion
All the objectives in the present study are achieved amd the conclusions that can
be drawn from this study are:
(a) Thermal conductivity of base fluids increases with addition of nanoparticles. For
instance, 8.9% augmentation of thermal conductivity of water based Al2O3
(0.5vol. %, particle size:13nm) is observed compared to water/ethylene glycol-
based fluid. About 12.9% improvement is observed for the water based Al2O3
(0.5vol.%, particle size: 13nm) nanofluid. Water and ethylene glycol/water -
based nanofluid containing smaller Al2O3 (particle size: 13nm) nanoparticles
exhibits higher thermal conductivity compared to Al2O3 with less than 50nm
particle size.
(b) Density of water or ethylene glycol/water-based nanofluids containing Al2O3 or
TiO2 nanoparticles increases with the increase of particle volume fraction. TiO2
nanofluids exhibit higher density values compared to Al2O3 nanofluids (particle
size 13 and <50nm). Type of particle has significant effect on nanofluids density
rather than particle size. Viscosity of water or water/ethylene glycol nanofluids
containing TiO2 or Al2O3 nanoparticles increases with particle loading but
decreases with the increase of operating temperature.
(c) With reference to the thermal performance of shell and tube heat exchanger,
heat transfer rate is improved with volume fractions for copper nanofluid. About
7.8% heat transfer augmentation was observed for ethylene glycol-based
nanofluids containing 1vol.% of copper nanoparticles at 26.3 kg/s and 111.6
kg/s mass flow rate for flue gas and coolant, respectively. For 2vol.% water-
based copper nanofluids, 4.53% heat transfer enhancement in laminar flow was
recorded. Nanofluid convective heat transfer coefficient and overall heat transfer

126
coefficient are higher than those of base fluid. About 9.5% and 16.9%
enhancements were recorded for ethylene glycol with 1% copper nanoparticles
compared to base fluid. Overall heat transfer coefficient of ethylene glycol/water
Al2O3 (particle size: 13 and <50nm) and TiO2 are higher than the ethylene
glycol/water base fluid. Apart from that, thermal performance of the heat
recovery exchanger is increased with flue gas mass flow rate. However, only
minor heat transfer enhancement was observed for ethylene glycol based 1
vol.% of copper nanofluids when coolant mass flow rate was increased from 200
to 230 kg/s.
(d) Study also found that application of nanofluids in shell and tube heat exchanger
provides opportunity to reduce the size of shell and tube heat exchanger without
affecting its thermal performance. Smaller heat exchangers require less materials
for fabrication and for processing energy.
(e) Based on the nanofluids flow in a circular tube subjected to a constant wall
temperature, total dimensionless entropy generation is reduced with nano
particle volume fraction. TiO2 nanofluids offer lower total dimensionless
entropy generation compared to Al2O3 nanofluids. For 4 vol. % , about 9.7% and
6.4% reduction of entropy generation are observed for TiO2 and Al2O3
nanofluids, respectively.
(f) Total dimensionless entropy generation increases with the increase of
dimensionless temperature difference, τ. Mass flow rate of working fluid
influences the total dimensionless entropy generation. 19.6% increase is
achieved when mass flow rate increases from 0.01 to 0.02 kg/s for water based
7vol.% Al2O3 nanofluids. However only 3.9% increase is found in turbulent
flow (from 0.1 to 0.2 kg/s) under the same nanoparticle loading.

127
(g) About 32.7% reduction of total dimensionless entropy generation can be
resulted when tube length is extended from 2 to 10 m for 7vol.% Al2O3
nanofluid. However, only 0.3% reduction in entropy generation was achieved
when tube diameter increased from 0.01 to 0.02 m.
(h) On the application of thermosyphon air pre-heater, the change of nanofluid
thermo-physical properties plays a minor role in improving its thermal
performance. Slight increase of overall heat transfer coefficient and cold air
outlet temperature is observed with augmentation of nanoparticle volume
fraction. TiO2 nanofluids offer slightly higher overall heat transfer coefficient
and cold air outlet temperature compared to Al2O3 nanofluids. 23% overall heat
transfer enhancement is observed for TiO2(4vol.%) and Al2O3 (7vol.%)
nanofluids when hot air velocity increases from 2.5 m/s to 4.75 m/s. 2.4%
enhancement of cold air outlet temperature is observed for TiO2 (4vol.%) and
Al2O3 (7vol.%) nanofluids when hot air velocity increases from 2.5 m/s to 4.75
m/s. 0.67% reduction is resulted in the energy required to heat the combustion
air when velocity increases from 2.5 m/s to 4.75 m/s.
This study found that nanofluid operated shell and tube heat recovery exchanger
offers better thermal performance compared to that of base fluid. Analysis was
conducted by using Kern and effective-NTU methods. This is the main contribution or
novelty of the present work in heat recovery aspect. The application of nanofluids
provides an alternative approach for better utilization of energy consumption especially
in the industry.
5.2 Recommendations
The recommendations for future or further study are as follows:

128
(a) From the literature review, it is found that thermal researchers focused only on
thermal conductivity and viscosity characteristics of nanofluids. There is lack of
research investigating the specific heat of nanofluids. Thus, more study should
be conducted in this area.
(b) Stability is an important parameter for obtaining nanofluids with optimum
thermal properties and to make nanofluid a pragmatic solution to industry
problems. Nanoparticles tend to agglomerate when higher loading is used. More
studies should focus on minimizing instability particularly by using surfactants.
However, surfactant increases the viscosity characteristic of nanofluids.
Research in analyzing the optimum loading of surfactant should be considered.
(c) More experimental studies should be done on using nanofluids in heat recovery
exchanger. From the open literatures it is apparent that most of the researchers
focused on the fundamental properties of nanofluids. Researchers should switch
their attention to the applications of nanofluids especially in heat recovery
exchanger.

129
REFERENCES
Abdelaziz, E. A., Saidur, R., & Mekhilef, S. (2011). A review on energy saving strategies in industrial sector. Renewable and Sustainable Energy Reviews, 15(1), 150-168.
ASHRAE Handbook (2001). Physical properties of secondary coolants (Brines),
American Society of Heating, Refrigerating and Air Conditioning Engineers,Inc, Atlanta. GA.
Batchelor, G. K. (1977). The effect of Brownian motion on the bulk stress in a
suspensions of spheres. J.Fluid Mech, 83(1). Beck, M. P., Sun, T.,&Teja, A. S. (2007). The thermal conductivity of alumina
nanoparticles dispersed in ethylene glycol. Fluid Phase Equilibria, 260(2), 275-278.
Beck, M. P. (2008). Thermal Conductivity of Metal Oxide Nanofluids. Unpublished
PhD’s thesis, Georgia Institute of Technology. Bejan, A. (1996). Entropy generation minimization. Boca Taron: CRC Press. Bhattacharya, P. (2005). Thermal conductivity and colloidal stability of nanofluids.
Arizona State University. Bianco, V., Chiacchio, F., Manca, O., & Nardini, S. (2009). Numerical investigation of
nanofluids forced convection in circular tubes. Applied Thermal Engineering, 29(17-18), 3632-3642.
Bianco, V., Nardini, S., & Manca, O. (2011). Enhancement of heat transfer and entropy generation analysis of nanofluids turbulent convection flow in square section tubes. Nanoscale research letters, 6(252).
Bobbo,S., Fedele, L., Benetti, A., Colla, L., Fabrizio, M., Pagura, C., et al. (2012).
Viscosity of water based SWCNH and TiO2 nanofluids. Experimental Thermal and Fluid Science, 36, 65-71.
Brinkman.H.C. (1952). The viscosity of concentrated suspensions and solution. J.Chem.
Phys, 20, 571-581. Charyulu, D. G., Singh, G., & Sharma, J. K. (1999). Performance evaluation of a
radiator in a diesel engine-a case study. Applied Thermal Engineering, 19(6), 625-639.
Chandrasekar, M., Suresh, S., & Chandra Bose, A. (2010). Experimental investigations
and theoretical determination of thermal conductivity and viscosity of Al2O3/water nanofluid. Experimental Thermal and Fluid Science, 34(2), 210-216.
Chen, H., Ding, Y., He, Y., & Tan, C. (2007). Rheological behaviour of ethylene glycol
based titania nanofluids. Chemical Physics Letters, 444(4-6), 333-337.

130
Chen, H., Yang, W., He, Y., Ding, Y., Zhang, L., Tan, C., Alexei,A.L., et al. (2008). Heat transfer and flow behaviour of aqueous suspensions of titanate nanotubes (nanofluids). Powder Technology, 183(1), 63-72.
. Chen, H., Ding, Y., & Lapkin, A. (2009). Rheological behaviour of nanofluids
containing tube / rod-like nanoparticles. Powder Technology, 194(1-2), 132-141. Chen, L., & Xie, H. (2010). Properties of carbon nanotube nanofluids stabilized by
cationic gemini surfactant. Thermochimica Acta, 506(1-2), 62-66. Chen, Q., Finney, K., Li, H., Zhang, X., Zhou, J., Sharifi, V., et al. (2012). Condensing
boiler applications in the process industry. Applied Energy, 89, 30-36. Choi, S. U. S. (2009). Nanofluids: From vision to reality through research. Journal of
Heat Transfer, 131, 033106-033109. Chon, C. H., & Kihm, K. D. (2005). Thermal conductivity enhancement of nanofluids
by Brownian motion. Journal of Heat Transfer, 127, 810. Colangelo, G., Favale, E., de Risi, A.,& Laforgia, D. (2011). Results of experimental
investigations on the heat conductivity of nanofluids based on diathermic oil for high temperature applications. Applied Energy, 97, 828-833.
Corcione, M. (2011). Empirical correlating equations for predicting the effective
thermal conductivity and dynamic viscosity of nanofluids. Energy Conversion and Management, 52(1), 789-793.
Dagtekin, I., Oztop, H. F., & Sahin, A. Z. (2005). An analysis of entropy generation
through a circular duct with different shaped longitudinal fins for laminar flow. International Journal of Heat and Mass Transfer, 48(1), 171-181.
De Robertis, E., Cosme, E. H. H., Neves, R. S., Kuznetsov, A. Y., Campos, A. P. C.,
Landi, S. M., et al. (2012) Application of the modulated temperature differential scanning calorimetry technique for the determination of the specific heat of copper nanofluids. Applied Thermal Engineering, 41,10-17.
Ding, Y., Chen, H., He, Y., Lapkin, A., Yeganeh, M., Siller, L., et al. (2007). Forced
convective heat transfer of nanofluids. Advanced Powder Technology, 18(6), 813-824.
Duan, F., Kwek, D., & Crivoi, A. (2011). Viscosity affected by nanoparticle
aggregation in Al2O3-water nanofluids. Nanoscale Research Letters, 6, 248. Duangthongsuk, W., &Wongwises, S. (2007). A critical review of convective heat
transfer of nanofluids. Renewable and Sustainable Energy Reviews, 11(5), 797-817.
Duangthongsuk, W., & Wongwises, S. (2009). Measurement of temperature-dependent
thermal conductivity and viscosity of TiO2-water nanofluids. Experimental Thermal and Fluid Science,33(4), 706-714.
Duangthongsuk, W., & Wongwises, S. (2012). A dispersion model for predicting the

131
heat transfer performance of TiO2-water nanofluids under a laminar flow regime. International Journal of Heat and Mass Transfer, 55(11-12), 3138-3146.
Do, K. H., Ha, H. J., & Jang, S. P. (2010). Thermal resistance of screen mesh wick heat
pipes using the water-based Al2O3 nanofluids. International Journal of Heat and Mass Transfer, 53(25-26), 5888-5894.
Do, K. H., & Jang, S. P. (2010) Effect of nanofluids on the thermal performance of a
flat micro heat pipe with a rectangular grooved wick. International Journal of Heat and Mass Transfer, 53(9-10), 2183-2192.
Eastman, J. A., Choi, S., S, L., Yu, W., & Thompson, L. J. (2001). Anomalously
increased effective thermal conductivities of ethylene glycol-based nanofluids containing copper nanoparticles. Applied Physics Letters, 78(6), 718-720.
Ebrahimnia-Bajestan, E., Niazmand, H., Duangthongsuk, W., & Wongwises, S. (2011).
Numerical investigation of effective parameters in convective heat transfer of nanofluids flowing under a laminar flow regime. International Journal of Heat and Mass Transfer, 54(19-20), 4376-4388.
Evans, W. J. (2008). Investigation and Identification of Physical Mechanism for
Enhanced Thermal Conductivity in Nanofluids Using Molecular Level Modeling. Unpublished PhD’s thesis, Rensselaer Polytechnic Institute, New York.
Farajollahi, B., Etemad, S. G., & Hojjat, M. (2010). Heat transfer of nanofluids in a
shell and tube heat exchanger. International Journal of Heat and Mass Transfer, 53(1-3), 12-17.
Fedele, L., Colla, L., & Bobbo, S. (2012). Viscosity and thermal conductivity
measurements of water-based nanofluids containing titanium oxide nanoparticles. International Journal of Refrigeration, 35(5), 1359-1366.
Firouzfar, E., Soltanieh, M., Noie, S.H., & Saidi, S.H. (2011). Energy saving in HVAC
systems using nanofluid. Applied Thermal Engineering, 31, 1543-1545. Ghadimi, A., Saidur, R., & Metselaar, H. S. C. (2011). A review of nanofluid stability
properties and characterization in stationary conditions. International Journal of Heat and Mass Transfer, 54(17-18), 4051-4068.
Guo, Z. C., & Fu, Z. X. (2010). Current situation of energy consumption and measures
taken for energy saving in the iron and steel industry in China. Energy, 35(11), 4356-4360.
Hagens, H., Ganzevles, F. L. A., Van der Geld, C. W. M., & Grooten, M. H. M. (2007).
Air heat exchangers with long heat pipes: Experiments and predictions. Applied Thermal Engineering, 27(14-15), 2426-2434.
Han, Z. (2008). Nanofluids with Enhanced Thermal Transport Properties. Unpublished
PhD’s thesis, University of Maryland at College Park, College Park, Maryland.

132
Hewitt, G. F., Shires, G. L., & Bott, T. R. (1993). Process heat transfer. Florida: CRC Press, Inc.
He, Y., Jin, Y., Chen, H., Ding, Y., Cang, D., & Lu, H. (2007). Heat transfer and flow
behaviour of aqueous suspensions of TiO2 nanoparticles (nanofluids) flowing upward through a vertical pipe. International Journal of Heat and Mass Transfer, 50(11-12), 2272-2281.
He, Y., Men, Y., Zhao, Y., Lu, H., & Ding, Y. (2009). Numerical investigation into the
convective heat transfer of TiO2 nanofluids flowing through a straight tube under the laminar flow conditions. Applied Thermal Engineering, 29(10), 1965-1972.
Hojjat, M., Etemad, S. G., Bagheri, R., & Thibault, J. (2011). Convective heat transfer
of non-Newtonian nanofluids through a uniformly heated circular tube. International Journal of Thermal Sciences, 50(4), 525-531
Hong, K. S., Hong, T.-K., & Yang, H.-S. (2006). Thermal conductivity of Fe nanofluids
depending on the cluster size of nanoparticles. Appl. Phys. Lett., 88, 031901 Huminic, G., & Huminic, A. (2013). Numerical analysis of laminar flow heat transfer of
nanofluids in a flattened tube. International Communications in Heat and Mass Transfer, 44, 52-57.
Hwang, Y. J., Ahn, Y. C., Shin, H. S., Lee, C. G., Kim, G. T., Park, H. S., et al. (2006).
Investigation on characteristics of thermal conductivity enhancement of nanofluids. Current Applied Physics, 6(6), 1068-1071.
Hwang, Y., Lee, J.-K., Lee, J.-K., Jeong, Y.-M., Cheong, S.-i., Ahn, Y.-C., et al. (2008).
Production and dispersion stability of nanoparticles in nanofluids. Powder Technology, 186(2), 145-153.
Ijam, A., & Saidur, R. (2012) Nanofluid as a coolant for electronic devices (cooling of
electronic devices). Applied Thermal Engineering, 32, 76-82. Increase Performance Inc. Flue gas calculator. Retrieved 26th March 2011, from
http://www.increase-performance.com/calc-flue-gas-prop.html Incropera, F. P., Dewitt, D. P., Bergman, T. L., & Lavine, A. S. (2007). Fundamentals
of heat and mass transfer (6th ed.). New York: John Wiley andSons. Jahar, S. (2011). Performance of nanofluid-cooled shell and tube gas cooler in
transcritical CO2 refrigeration systems. Applied Thermal Engineering, 31(14-15), 2541-2548.
Jang, S. P., & Choi, S. U. S. (2004). Role of Brownian motion in the enhanced thermal
conductivity of nanofluids. Applied Physics Letters, 84(21), 4316-4318. Jang, S. P., & Choi, S. U. S. (2006). Cooling performance of a microchannel heat sink
with nanofluids. Applied Thermal Engineering, 26(17-18), 2457-2463. Jayamaha, L. (2008). Energy Efficient Building Systems, Green Strategies for Operation

133
and Maintenance. Singapore: McgrawHill Education. Jung, J.-Y., Oh, H.-S., & Kwak, H.-Y. (2009). Forced convective heat transfer of
nanofluids in microchannels. International Journal of Heat and Mass Transfer, 52(1-2), 466-472.
Jung, J.-Y., & Yoo, J. Y. (2009). Thermal conductivity enhancement of nanofluids in conjunction with electrical double layer (EDL). International Journal of Heat and Mass Transfer, 52(1-2), 525-528.
Jung, S., Jo, B., Shin, D., & Banerjee, D. (2010). Experimental Validation of a Simple
Analytical Model for Specific Heat Capacity of Aqueous Nanofluids. SAE Technical Paper 2010-01-1731.
Kakac, S. & Liu, H.T. (2002). Heat exchanger selection,rating and thermal design (2nd
ed.). New York: CRC Press. Keblinski, P., Phillpot, S. R., Choi, S. U. S., & Eastman, J. A. (2002). Mechanisms of
heat flow in suspensions of nano-sized particles (nanofluids). International Journal of Heat and Mass Transfer, 45(4), 855-863.
Keblinski, P., Eastman, J. A., & Cahill, D. G. (2005). Nanofluids for thermal transport.
Materials Today, 8(6), 36-44. Keblinski, P. (2009). Thermal conductivity of nanofluids. In S. Volz (Ed.), Thermal
nanosystems and nanomaterials: Springer. Khanafer, K., & Vafai, K. A critical synthesis of thermophysical characteristics of
nanofluids. International Journal of Heat and Mass Transfer, 54(19-20), 4410-4428.
Kim, D., Kwon, Y., Cho, Y., Li, C., Cheong, S., Hwang, Y., et al. (2009). Convective
heat transfer characteristics of nanofluids under laminar and turbulent flow conditions. Current Applied Physics, 9(2, Supplement 1), 119-123.
Ko, T. H. (2006). Analysis of optimal Reynolds number for developing laminar forced
convection in double sine ducts based on entropy generation minimization principle. Energy Conversion and Management, 47(6), 655-670.
Ko, T. H., & Wu, C. P. (2009). A numerical study on entropy generation induced by
turbulent forced convection in curved rectangular ducts with various aspect ratios. International Communications in Heat and Mass Transfer, 36(1), 25-31.
Kole, M., & Dey, T. K. (2010). Viscosity of alumina nanoparticles dispersed in car
engine coolant. Experimental Thermal and Fluid Science, 34(6), 677-683. Kulkarni, D. P., Vajjha, R. S., Das, D. K., & Oliva, D. (2008). Application of aluminum
oxide nanofluids in diesel electric generator as jacket water coolant. Applied Thermal Engineering, 28(14-15), 1774-1781.
Kulkarni, D. P., Das, D. K., & Vajjha, R. S. (2009). Application of nanofluids in
heating buildings and reducing pollution. Applied Energy 86(12),2566-2573.

134
Lee, J.-H., Hwang, K. S., Jang, S. P., Lee, B. H., Kim, J. H., Choi, S. U. S., et al. (2008). Effective viscosities and thermal conductivities of aqueous nanofluids containing low volume concentrations of Al2O3 nanoparticles. International Journal of Heat and Mass Transfer, 51(11-12), 2651-2656.
Lee, S. W., Park, S. D., Kang, S., Bang, I. C., & Kim, J. H. (2011). Investigation of
viscosity and thermal conductivity of SiC nanofluids for heat transfer applications. International Journal of Heat and Mass Transfer, 54, 433-438.
Leong.K.C, Yang.C, and Murshed, S. M. S. (2006). A model for the thermal
conductivity of nanofluids-the effect of interfacial layer. J.Nanopart Res, 8, 245254.
Leong, K. Y., Saidur, R., Kazi, S. N., & Mamun, A. H. (2010). Performance
investigation of an automotive car radiator operated with nanofluid-based coolants (nanofluid as a coolant in a radiator). Applied Thermal Engineering, 30(17-18), 2685-2692.
Leong, K. Y., Saidur, R., Khairulmaini, M., Michael, Z., & Kamyar, A. (2012). Heat
transfer and entropy analysis of three different types of heat exchangers operated with nanofluids. International Communications in Heat and Mass Transfer, 39(6), 838-843.
Lin, C.-Y., Wang, J.-C., and Chen, T.-C. (2011). Analysis of suspension and heat
transfer characteristics of Al2O3 nanofluids prepared through ultrasonic vibration. Applied Energy, 88(12), 4527-4533.
Liu, D., Tang, G.-F., Zhao, F.-Y., & Wang, H.-Q. (2006). Modeling and experimental
investigation of looped separate heat pipe as waste heat recovery facility. Applied Thermal Engineering, 26(17-18), 2433-2441.
Liu, M.-S., Lin, M. C.-C., Tsai, C. Y., & Wang, C.-C. (2006). Enhancement of thermal
conductivity with Cu for nanofluids using chemical reduction method. International Journal of Heat and Mass Transfer, 49(17-18), 3028-3033.
Liu, M.S., Lin, C.C., & Wang, C.C. (2011). Enhancement of thermal conductivityies
with Cu, CuO, and carbon nanotube nanofluids and application of MWNT/water nanofluid on a water chiller system. Nanoscale Research Letters, 6(297),1-23
Li, X. F., Zhu, D. S., Wang, X. J., Wang, N., Gao, J. W., & Li, H. (2008). Thermal
conductivity enhancement dependent pH and chemical surfactant for Cu-H2O nanofluids. Thermochimica Acta, 469(1-2), 98-103.
Lotfi, R., Rashidi, A. M., & Amrollahi, A. (2012). Experimental study on the heat
transfer enhancement of MWNT-water nanofluid in a shell and tube heat exchanger. International Communications in Heat and Mass Transfer, 39(1), 108-111.
Lu, W.-Q., & Fan, Q.-M. (2008). Study for the particle's scale effect on some
thermophysical properties of nanofluids by a simplified molecular dynamics method. Engineering Analysis with Boundary Elements, 32(4), 282-289.

135
Lundgren, T. S. (1972). Slow flow through stationary random beds and suspensions of spheres. J. Fluid Mech, 51(2), 273-299.
Mahbubul, I. M., Saidur, R., & Amalina, M. A. (2012). Latest developments on the
viscosity of nanofluids. International Journal of Heat and Mass Transfer, 55(4), 874-885.
Mingzheng, Z., Guodong, X., Jian, L., Lei, C., & Lijun, Z. (2012). Analysis of factors
influencing thermal conductivity and viscosity in different kinds of surfactant solutions. Experimental Thermal and Fluid Science, 36, 22-29.
Mintsa, H. A., Roy, G., Nguyen, C. T., & Doucet, D. (2009). New temperature
dependent thermal conductivity data for water-based nanofluids. International Journal of Thermal Sciences, 48(2), 363-371.
Moghaddami, M., Mohammadzade, A., & Esfehani, S. A. V. (2011). Second law
analysis of nanofluid flow. Energy Conversion and Management, 52(2), 1397-1405.
Murshed, S. M. S., Leong, K. C., & Yang, C. (2005). Enhanced thermal conductivity of
TiO2--water based nanofluids. International Journal of Thermal Sciences, 44(4), 367-373.
Murshed, S. M. S., Leong, K. C., & Yang, C. (2008a). Thermophysical and
electrokinetic properties of nanofluids - A critical review. Applied Thermal Engineering, 28(17-18), 2109-2125.
Murshed, S. M. S., Leong, K. C., & Yang, C. (2008b). Investigations of thermal
conductivity and viscosity of nanofluids. International Journal of Thermal Sciences, 47(5), 560-568.
Murshed, S. M. S., Leong, K. C., & Yang, C. (2009). A combined model for the
effective thermal conductivity of nanofluids. Applied Thermal Engineering, 29(11-12), 2477-2483.
Mousa, M. G. (2011). Effect of nanofluid concentration on the performance of circular
heat pipe. Ain Shams Engineering Journal, 2(1), 63-69. Namburu, P. K., Kulkarni, D. P., Misra, D., & Das, D. K. (2007). Viscosity of copper
oxide nanoparticles dispersed in ethylene glycol and water mixture. Experimental Thermal and Fluid Science, 32(2), 397-402
Nasiri, A., Shariaty-Niasar, M., Rashidi, A. M., & Khodafarin, R. (2012). Effect of
CNT structures on thermal conductivity and stability of nanofluid. International Journal of Heat and Mass Transfer, 55, 1529-1535.
Nguyen, C. T., Desgranges, F., Roy, G., Galanis, N., Mare, T., Boucher, S., et al.
(2007). Temperature and particle-size dependent viscosity data for water-based nanofluids -Hysteresis phenomenon. International Journal of Heat and Fluid Flow, 28(6), 1492-1506.

136
Nguyen, C. T., Desgranges, F., Galanis, N., Roy, G., Maré, T., Boucher, S., et al. (2008). Viscosity data for Al2O3-water nanofluid--hysteresis: is heat transfer enhancement using nanofluids reliable? International Journal of Thermal Sciences, 47(2), 103-111.
Noie, S. H. (2006). Investigation of thermal performance of an air-to-air thermosyphon
heat exchanger using є-NTU method. Applied Thermal Engineering, 26(5-6), 559-567.
Noie-Baghban, S. H., & Majideian, G. R. (2000). Waste heat recovery using heat pipe
heat exchanger (HPHE) for surgery rooms in hospitals. Applied Thermal Engineering, 20(14), 1271-1282.
Nuntaphan, A., Tiansuwan, J., & Kiatsiriroat, T. (2002). Enhancement of heat transport
in thermosyphon air preheater at high temperature with binary working fluid: A case study of TEG-water. Applied Thermal Engineering, 22(3), 251-266.
Otanicar, T. P., Phelan, P. E., Prasher, R. S., Rosengarten, G., & Taylor, R. A. (2010).
Nanofluid-based direct absorption solar collector. Journal of renewable and Sustainable Energy, 2, 033102-033113.
Pandiyarajan, V., Chinna Pandian, M., Malan, E., Velraj, R., & Seeniraj, R. V. (2011).
Experimental investigation on heat recovery from diesel engine exhaust using finned shell and tube heat exchanger and thermal storage system. Applied Energy, 88(1), 77-87.
Park, K.-J., & Jung, D. (2007). Boiling heat transfer enhancement with carbon
nanotubes for refrigerants used in building air-conditioning. Energy and Buildings, 39(9), 1061-1064.
Paul, G., Sarkar, S., Pal, T., Das, P. K., & Manna, I. (2012). Concentration and size
dependence of nano-silver dispersed water based nanofluids. Journal of Colloid and Interface Science, 371(1), 20-27.
Peyghambarzadeh, S. M., Hashemabadi, S. H., Hoseini, S. M., & Seifi Jamnani, M.
(2011a). Experimental study of heat transfer enhancement using water/ethylene glycol based nanofluids as a new coolant for car radiators. International Communications in Heat and Mass Transfer, 38(9), 1283-1290.
Peyghambarzadeh, S. M., Hashemabadi, S. H., Jamnani, M. S., & Hoseini, S. M.
(2011b). Improving the cooling performance of automobile radiator with Al2O3/water nanofluid. Applied Thermal Engineering, 31(10), 1833-1838.
Phuoc, T. X., & Massoudi, M. (2009). Experimental observations of the effects of shear
rates and particle concentration on the viscosity of Fe2O3 deionized water nanofluids. International Journal of Thermal Sciences, 48(7), 1294-1301.
Prasher, R., Bhattacharya, P., & E.Phelan, P. (2006). Brownian-motion-based
convective-conductive model for the effective thermal conductivity of nanofluids. Journal of Heat Transfer, 128, 588-595.

137
Putra, N., Septiadi, W. N., Rahman, H., & Irwansyah, R. (2012). Thermal performance of screen mesh wick heat pipes with nanofluids. Experimental Thermal and Fluid Science, 40, 10-17.
Qu, J., Wu, H.-y., & Cheng, P. (2010). Thermal performance of an oscillating heat pipe
with Al2O3-water nanofluids. International Communications in Heat and Mass Transfer, 37(2), 111-115.
Qu, J., & Wu, H. (2011). Thermal performance comparison of oscillating heat pipes
with SiO2/water and Al2O3/water nanofluids. International Journal of Thermal Sciences, 50(10), 1954-1962.
Ramesh, K. S., & Dusan, P. S. (2003). Fundamentals of heat exchanger design. New
Jersey: John Wiley and Sons. Roberts, N. A., & Walker, D. G. (2010). Convective Performance of Nanofluids in
Commercial Electronics Cooling Systems. Applied Thermal Engineering, 30(16), 2499-2504.
Saidur, R., Ahamed, J. U., & Masjuki, H. H. (2010). Energy, exergy and economic
analysis of industrial boilers. Energy Policy, 38(5), 2188-2197. Sahin, A. Z. (2000). Entropy generation in turbulent liquid flow through a smooth duct
subjected to constant wall temperature. International Journal of Heat and Mass Transfer, 42(8), 1469-1478.
Sahin.A.Z. (1998). A second law comparison for optimum shape of duct subjected to
constant wall temperature and laminar flow. Heat and mass transfer, 22, 425-430.
Saneipoor, P., Naterer, G. F., & Dincer, I. (2011). Heat recovery from a cement plant
with a Marnoch Heat Engine. Applied Thermal Engineering, 31(10), 1734-1743. Sarit, K. D., Choi, S. U. S., Yu, W., & Pradeep, T. (2008). Nanofluids science and
technology. New Jersey: Wiley Interscience. Sarit, K.D. (2009). Process heat transfer. Oxford: Alpha Science. Shafahi, M., Bianco, V., Vafai, K., & Manca, O. (2010). An investigation of the thermal
performance of cylindrical heat pipes using nanofluids. International Journal of Heat and Mass Transfer, 53(1-3), 376-383.
Shalchi-Tabrizi, A., & Seyf, H. R. (2012). Analysis of entropy generation and
convective heat transfer of Al2O3 nanofluid flow in a tangential micro heat sink. International Journal of Heat and Mass Transfer, 55(15-16), 4366-4375.
Shi, X., Che, D., Agnew, B., & Gao, J. (2011). An investigation of the performance of
compact heat exchanger for latent heat recovery from exhaust flue gases. International Journal of Heat and Mass Transfer, 54(1-3), 606-615.
Shima, P. D., Philip, J., & Raj, B. (2010). Influence of aggregation on thermal
conductivity in stable and unstable nanofluids. Appl. Phys. Lett, 97, 153113.
138
Sigma Aldrich. (2013).Nanomaterials. Retrieved 4th August 2013, from
http://www.sigmaaldrich.com/malaysia.html Singh, P. K., Anoop, K. B., Sundararajan, T., & Das, S. K. (2010). Entropy generation
due to flow and heat transfer in nanofluids. International Journal of Heat and Mass Transfer, 53, 4757-4767.
Srimuang, W., & Amatachaya, P. (2012). A review of the applications of heat pipe heat
exchangers for heat recovery. Renewable and Sustainable Energy Reviews, 16(6), 4303-4315.
Strandberg, R., & Das, D. K. (2010). Influence of temperature and properties variation
on nanofluids in building heating. Energy Conversion and Management, 51(7), 1381-1390.
Stijepovic, M. Z., & Linke, P. (2011). Optimal waste heat recovery and reuse in
industrial zones. Energy, 36(7), 4019-4031. Suresh, S., Venkitaraj, K. P., Selvakumar, P., & Chandrasekar, M. (2012). A
comparison of thermal characteristics of Al2O3/water and CuO/water nanofluids in transition flow through a straight circular duct fitted with helical screw tape inserts. Experimental Thermal and Fluid Science, 39, 37-44.
Taborek, J. (1991). Industrial Heat Exchanger Design Practices. In S. Kakac (Ed.),
Boilers, evaporators condensers. New York: John Wiley and Sons.Inc. Teke, I., Agra, Ö., AtayIlmaz, S. Ö., & Demir, H. (2010). Determining the best type of
heat exchangers for heat recovery. Applied Thermal Engineering, 30(6-7), 577-583.
Teng, T.-P., Hung, Y.-H., Teng, T.-C., Mo, H.-E., & Hsu, H.-G. (2010). The effect of
alumina/water nanofluid particle size on thermal conductivity. Applied Thermal Engineering, 30(14-15), 2213-2218.
Timofeeva, E. V., Smith, D. S., Yu, W., France, D. M., Singh, D. V., & Routbort, J. L.
(2010). Particle size and interfacial effects on thermo-physical and heat transfer characteristics of water-based α-SiC nanofluids. Nanotechnology, 21(215703 (10pp)), 21.
Tsai, T.-H., & Chein, R. (2007). Performance analysis of nanofluid-cooled
microchannel heat sinks. International Journal of Heat and Fluid Flow, 28(5), 1013-1026.
United States, Energy Information Administration. (2011). Annual Energy Outlook
2011 Early Release Overview. Retrieved 26th March 2011,from http://www.eia.gov/forecasts/aeo/pdf/0383er(2011).pdf
US Research Nanomaterials, Inc. (2013). Nanopowders. Retrieved 4th August 2013,
from http://us-nano.com/nanopowders

139
Vajjha.R.S., D.K.Das, & Mahagaonkar.B.M. (2009). Density measurement of different nanofluids and their comparison with theory. Petroleum Science and Technology, 27, 612-624.
Vajjha, R. S., & Das, D. K. (2009). Experimental determination of thermal conductivity
of three nanofluids and development of new correlations. International Journal of Heat and Mass Transfer, 52(21-22), 4675-4682.
Vajjha, R. S., Das, D. K., & Kulkarni, D. P. (2010). Development of new correlations
for convective heat transfer and friction factor in turbulent regime for nanofluids. International Journal of Heat and Mass Transfer, 53(21-22), 4607-4618.
Velagapudi, V., Konijeti, K.,&Aduru, K. (2008). Empirical correlations to predict
thermophysical and heat transfer characteristics of nanofluids. Thermal Science, 12, 27-37.
Wang, X.-j., Zhu, D.-s., & Yang, S. (2009). Investigation of pH and SDBS on
enhancement of thermal conductivity in nanofluids. Chemical Physics Letters, 470(1-3), 107-111.
Wang, X.-Q., & Mujumdar, A. S. (2007). Heat transfer characteristics of nanofluids: a
review. International Journal of Thermal Sciences, 46(1), 1-19. Webb.R.L. (1994). Principles of enhanced heat transfer. New York: Wiley. Wen, D., & Ding, Y. (2004). Experimental investigation into convective heat transfer of
nanofluids at the entrance region under laminar flow conditions. International Journal of Heat and Mass Transfer, 47(24), 5181-5188.
Wu, S., Zhu, D., Li, X., Li, H., & Lei, J. (2009). Thermal energy storage behavior of
Al2O3-H2O nanofluids. Thermochimica Acta, 483(1-2), 73-77. Xu, G., Huang, S., Yang, Y., Wu, Y., Zhang, K., & Xu, C. (2013). Techno-economic
analysis and optimization of the heat recovery of utility boiler flue gas. Applied Energy (in press).
Yang, F., Yuan, X., & Lin, G. (2003). Waste heat recovery using heat pipe heat
exchanger for heating automobile using exhaust gas. Applied Thermal Engineering, 23(3), 367-372.
Yang, L., Du, K., Ding, Y. H., Cheng, B., & Li, Y. J. (2012). Viscosity-prediction
models of ammonia water nanofluids based on various dispersion types. Powder Technology, 215-216, 210-218.
Yanjia, W., & Chandler, W. (2010). The Chinese nonferrous metals industry--energy
use and CO2 emissions. Energy Policy, 38(11), 6475-6484. Yilmaz, A. (2009). Minimum entropy generation for laminar flow at constant wall
temperature in a circular duct for optmum design. Heat mass transfer, 45, 1415-1421.

140
Yoo, D.-H., Hong, K. S., & Yang, H.-S. (2007). Study of thermal conductivity of nanofluids for the application of heat transfer fluids. Thermochimica Acta, 455(1-2), 66-69.
Yousefi, T., Veisy, F., Shojaeizadeh, E., & Zinadini, S. (2012). An experimental
investigation on the effect of MWCNT-H2O nanofluid on the efficiency of flat-plate solar collectors. Experimental Thermal and Fluid Science, 39, 207-212.
Yu, W., & Choi, S. U. S. (2003). The role of interfacial layers in the enhanced thermal
conductivity of nanofluids: A renovated Maxwell model. Journal of Nanoparticle Research, 5, 167-171.
Yu, W., & Choi, S. U. S. (2004). The role of interfacial layers in the enhanced thermal
conductivity of nanofluids: A renovated Hamilton–Crosser model. Journal of Nanoparticle Research, 6, 355-361.
Yu, W., France, D. M., Choi, S. U. S., & Routbort, J. L. (2007). Review and assessment
of nanofluid technology for transportation and other applications (No. ANL/ESD/07-9). Argonne: Energy System Division,Argonne National Laboratoryo. Document Number)
Yu, W., Xie, H., Chen, L., & Li, Y. (2009). Investigation of thermal conductivity and
viscosity of ethylene glycol based ZnO nanofluid. Thermochimica Acta, 491(1-2), 92-96.
Yu, W., Xie, H., Chen, L., & Li, Y. (2010). Investigation on the thermal transport
properties of ethylene glycol-based nanofluids containing copper nanoparticles. Powder Technology, 197(3), 218-221.
Yu, W., Xie, H., Li, Y., Chen, L., & Wang, Q. (2011). Experimental investigation on
the thermal transport properties of ethylene glycol based nanofluids containing low volume concentration diamond nanoparticles. Colloids and Surfaces A: Physicochemical and Engineering Aspects, 380(1-3), 1-5.
Zeinali, H. S., Nasr, E. M., & Etemad, S. G. (2007). Experimental investigation of
convective heat transfer of Al2O3/water nanofluid in circular tube. International Journal of Heat and Fluid Flow, 28(2), 203-210.
Zarifi, E., Jahanfarnia, G., & Veysi, F. (2013). Thermal-hydraulic modelling of
nanofluids as the coolant in VVER- 1000 reactor core by the porous media approach. Annals of Nuclear Energy, 51,203-212.
Zhang, X., Gu, H., & Fujii, M. (2007). Effective thermal conductivity and thermal
diffusivity of nanofluids containing spherical and cylindrical nanoparticles. Experimental Thermal and Fluid Science, 31(6), 593-599.
Zhou, S.-Q., & Ni, R. (2008). Measurement of the specific heat capacity of water-based
Al2O3 nanofluid. Appl. Phys. Lett, 92, 093123. Zhou, L.-P., Bu-XuanWang, Peng, X.-F., Du, X.-Z., & Yang, Y.-P. (2010). Research
Article On the Specific Heat Capacity of CuO Nanofluid. Advances in Mechanical Engineering, 1-4.

141
Zhu, D., Li, X., Wang, N., Wang, X., Gao, J., & Li, H. (2009). Dispersion behavior and thermal conductivity characteristics of Al2O3-H2O nanofluids. Current Applied Physics, 9(1), 131-139.

142
APPENDIX A
CURRICULUM VITAE
Leong Kin Yuen obtained his M.Eng in mechanical engineering from University of
Malaya, Malaysia and a B.Eng in mechanical engineering from University Tun Hussein
Onn, Presently, he is a lecturer at Universiti Pertahanan Nasional Malaysia (UPNM)
teaching Heat Transfer, Air Conditioning and Refrigeration, Engineering Drawing and
Control Engineering. To date, he has published seven (7) ISI- cited papers where most
of the papers are nanofluids related papers. He is also a principle investigator for one of
the nanofluids project funded by the Ministry of Higher Education, Malaysia under the
FRGS grant to UPNM. He also reviews articles submitted to the International Journal of
Heat and Mass Transfer, Heat Transfer- Asian Research and Nano-Micro Letter.

143
APPENDIX B
LIST OF PUBLICATIONS
1) K.Y.Leong ,R. Saidur, T.M.I Mahlia,Y.H.Yau, Performance Investigation of
Nanofluids as Coolant in Thermosyphon Air Preheater,-International
Communication Heat and Mass Transfer – 39 (2012) 523–529 (ISI/SCOPUS-
Cited Publication- 1.892IF)-Q1
2) K.Y.Leong ,R. Saidur, T.M.I Mahlia,Y.H.Yau, Modeling of shell and tube heat
recovery exchanger operated with nanofluid based coolants, International Journal
of Heat and Mass Transfer, 55 (4), (2012) 808-816 (ISI/SCOPUS-Cited
Publication-2.407IF) –Q1
3) K.Y.Leong, R.Saidur, T.M.Mahlia, Y.H.Yau, Entropy generation analysis of
nanofluid flow in a circular tube subjected to constant wall temperature,
International Communication Heat and Mass Transfer, 39(8) (2012) 1169-1175
(ISI/SCOPUS- Cited Publication-1.8921IF)- Q1
4) K.Y.Leong ,R. Saidur, T.M.I. Mahlia,Y.H.Yau,Predicting size reduction of shell
and tube heat recovery exchanger operated with nanofluids based coolants and
its associated energy saving, Energy Education Science and Technology Part A,
30(1) (2012)1-14 (SCOPUS- Cited Publication)

144
APPENDIX C
INVITATION AS A REVIEWER

145

146

147

148

149
APPENDIX D
INVITATION TO THE 2ND
ANNUAL CONGRESS OF NANO S&T 2012 CHINA

150
APPENDIX E
INVITATION TO SUBMIT PAPER TO FRONTIER IN HEAT PIPE (FHP)

151
APPENDIX F
SPPEECH INVITATION FROM NANOSCIENCE AND TECHNOLOGY 2013,
CHINA

152
APPENDIX G
SAMPLE CALCULATIONS
Some of the sample calculations used in this study are as follows
1) Thermal conductivity enhancement of ethyelene/glycol based 0.5 vol%
Al2O3 (13nm) nanofluids
k(ethylene glycol/water- 6 0.5 vol.% Al2O3 + 13nm- 5 0.4116
k(ethylene g; ycol/water- 5 0.378
% enhancement 5 k�v��oª�,�V + k��£Ïª��� �ªÏ��ª/*v���k��£Ïª��� �ªÏ��ª/*v��� 3 100%5 0.4116 + 0.3780.378 3 100% 5 8.9%
2) Shell and tube heat recovery exchanger
Shell side calculation (Convective heat transfer coefficient)
Cross olow area, A�� 5 (DV + N��d�-B N�� 5 DVP� 5 2.090.044450 5 47.019123 A�� 5 82.09 + 47.019123(0.0254-91.776 5 1.590788 Equivalent diameter, D� 5 4YP�? + πd�?4 Zπd� D� 5 4Y0.044450? + π(0.0254-?4 Zπ(0.0254- 5 0.073629 m
Flue gas viscosity, � 5 0.000019 Nsm?
Flue gas Prandtl number, Pr�� 5 0.759492
Flue gas Reynolds number Re�� 5 \m��A��] D�µ�� 5 Y 26.31.590788Z Y0.0736290.000019Z
5 64067.863724 Flue gas convective heat transfer coefoicient , h�� 5 0.36kD� Re��Q.@@Pr��RF

153
h�� 5 0.36(0.000029-0.073629 64067.863724Q.@@0.759492RF 5 0.056418
5 56.418 Wm?K
Tube side calculation (Convective heat transfer coefficient)
1vol. % Cu+H2O
Thermal conductivity of nanooluids, k�� 5 0.000305 kWmK
Density of nanooluid ρ�� 5 1150.421900 kgmF
Specioic heat of nanoolui, c�.�� 5 2.516754 kJkgK
Prandtl number of, Pr�� 5 22.222115
Number of tubes per pass, Nt,p
N�,� 5 N� 5 1024 since single tube pass is considered
Tube side olow area per pass, A�,� 5 π4 d,?N�,�
A�,� 5 π4 d,?N�,� 5 π4 (0.0229-?(1024- 5 0.421810m?
Nanooluids Reynold number, Re�� 5 m�� d,A�,�µ�� Re�� 5 (111.6 3 0.0229-(0.421810 3 0.002697- 5 2246.543355 (laminar olow-
Nusselt number, Nu 5 3.66
Nanooluids convective heat transfer coefoicient, h�� 5 Nu��k��d, h�� 5 (3.66-(0.000305-0.0229 5 48.82 kWm?K Overall heat transfer coefficient
Overall heat transfer coefficient, Uo

154
1U� 5 1h�� 6d�ln Yd�d, Z2k* 6 1h�� d�d,
1U� 5 156.418 6 0.0229 ln 0.02540.0229®2(395.96- 6 148.82 0.02540.0229
U� 5 24.723411 Wm?K
3) Size reduction and energy saving of shell and tube heat exchanger
Estimation of nanooluids convective heat transfer coefoicient, h�� 5 49.5 Wm?K
Estimation of olue gas convective heat transfer coefoicient, h�� 5 30 Wm?K
Overall heat transfer coefoicient, U� 5 1149.5 6 130 5 18.67924528 Wm?K
Heat capacity, Q 5 26.3 3 1149.2766 3 (150 + 35- 5 3475987.077W
LMTD 5 8T��,,� + T��,���9 + 8T��,��� + T��,,�9In YT��,,� + T��,���T��,��� + T��,,�Z
5 (150 + 55.46453799- + (35 + 30-In 150 + 55.4645379935 + 30 ® 5 90.98318372.95473
5 30.45903442
Required heat transfer area, A 5 QLMTD 3 U
A 5 QLMTD 3 U 5 3475987.077(30.45903442-(18.67924528- 5 6109.458181
Shell diameter, DV 5 0.637� CLCTP �(A-(PR-?8d�,�9L �R ?�
DV 5 0.637� 10.93 �(6109.458181-(1.75-?(0.0254-5 �R ?� 5 6.439753015m

155
Number of tubes, N� 5 0.785 YCTPCL Z (DV-?(PR-?(d��-?
Number of tubes, N� 5 0.785 Y0.931 Z (6.439753015-?(1.75-?(0.0254-? 5 15323.13038
Number of tubes per pass,
N�,� 5 N� 5 15323.13038 since single tube pass is considered
Tube side olow area per pass, A�,� 5 π4 d,?N�,�
Tube side olow area per pass, A�,� 5 π4 0.0229?(15323.13038- 5 6.311147683
For 1 vol.% Copper +Ethylene glycol
Nanooluids Reynold number, Re�� 5 m�� d,A�,�µ�� Re�� 5 m�� d,A�,�µ�� 5 60 3 0.02296.767221121 3 0.014561307 5 14.94932983 laminar olow
Nusselt number, Nu 5 3.66
Nanooluids convective heat transfer coefoicient, h�� 5 Nu��k��d, h�� 5 3.66 3 0.0002956430.0229 5 47.23 WmK ~49.5 WmK (Prediction- Assume tube is made from copper with 8933kg/m3 (density)
Cross section area of tube 5 π4 0.0254? + π4 0.0229? 5 0.00009483682823 m?
Volume of the tube 5 0.00009483682823 3 5 5 4.7419144115 3 10�SmF
Mass of tubes (overall- 5 8933 3 4.7419144115 3 10�S 3 15323.13038
5 649915.46375 kg
Energy required for material processingfor 1000 boilers (tube side- 5 1.17517 3 649915.46375 3 1000 576286705.54 kWh
Assume tube is made from steel with 7854kg/m3 (density)

156
Cross section area of shell 5 π4 6.453753015? + π4 6.439753015?5 0.141789886 m?
Volume of shell 5 0.141789886 3 5 5 0.70894943
Mass of shell 5 0.70894943 3 7854 5 5568088.816 kg
Energy required for material processingfor 1000 boilers (shell side- 5568088.816 3 0.45224 3 1000 5 2518112.486 kWh
Total energy consumption 5 2518112.486 6 76286705.54 5 78804818.03 kWh Energy saving 5 Energy consumption�� + Energy consumption ��
5 84737707.93 + 78804818.03 5 5932.889906MWh
4) Entropy generation analysis
Thermo-physical properties of water based (1 vol.%) Al2O3 nanofluids
k���k� 5 1.0 6 1.0112�� 6 2.4375�� \ 47d�(nm-] + 0.0248 �� \ k�0.613]
k���0.613 5 1.0 6 1.0112(0.01- 6 2.4375(0.01- Y4730Z + 0.0248 (0.01- Y 360.613Z
Thermal conductivity of nanooluids, k��� 5 k�� 5 0.633679594 WmK
µ��0.000855 5 1(1 + � -?.@ 5 1(1 + 0.01-?.@
Vicosity of nanooluid, � 5 0.000876755 Nsm?
Density of nanooluid, ρ�� 5 (1 + �-ρ� 6 �ρ� 5 (1 + 0.01-997.0089731 6 (0.01- (3970- 5 1026.738883 kgmF
Specioic heat of nanooluid, c�,�� 5 (1 + �-ρ�c�,� 6 �ρ�c�,�ρ��

157
5 (1 + 0.01-(997.0089731-(4179- 6 (0.01-(3970-(765-1026.7388835 4046.993896 JkgK
Dimensionless wall temperature difference, τ 5 T* + 300T* 5 0.02
Wall temperature, T* 5 306.122449
Cross section area (circular tube- 5 π4 d? 5 π4 0.0229? 5 4.118706509 3 10�S
Velocity of nanooluids, u�� 5 mρ��A� 5 0.01(1026.738883-(4.118706509 3 10�S- 5 0.023644103 ms?
Eckert number, Ec 5 u��?C�,��T* 5 0.023644103?4046.993896 3 306.122449 5 4.51251 3 10�RQ Nanooluids Reynolds number, Re�� 5 4m ��πd£µ�� 5 (4-(0.01-π(0.0229-(0.000876755- 5 634.0743717 (laminar olow- Convective heat transfer coefoicient, h�� 5 Nuk��d£ h�� 5 (3.66-(0.633679594-0.0229 5 101.2780486 Wm?K
Stanton number, St 5 h��ρ��u����c�,�� 5 101.2780486(1026.738883-(0.023644103-(4046.993896-
5 0.001029991 Dimensionless length of a circular tube, λ 5 LD 5 50.0229 5 218.3406114
Friction factor, f 5 64Re 5 64634.0743717 5 0.100934532

158
Total dimensionless entropy generation, Ψ
Ψ 5 11 + e�S��� �ln �1 + τe�S���1 + τ � + τ81 + e�SV��9 6 18 f EcSt ln �eSV�� + τ1 + τ �¡
5 7.08586 3 10�@
5) Thermosyphon air preheater
Properties of air
ρv,� 5 0.938006 kgmF
μv,� 5 2.18274 3 10�@ Nsm?
Pr 5 0.6954
c�,v,� 5 1011.3 JkgK
Thermal resistance of air side (evaporator)
Air Reynolds number, Rea,uvw 5 ρv,�uuvwd�µv,�
Rea,uvw 5 0.9380006(1.367295402-(0.015-2.18274 3 10�@ 5 881.3678843
Colburn factor j 5 0.14Re�Q.F?T Ys�sªZ�Q.@Q? Y fVd�ZQ.QFR
5 0.14(881.3678843-�Q.F?T Y0.030.03Z�Q.@Q? Y 0.010.015ZQ.QFR5 0.014950566
Convective heat transfer coefoicient of air hv,�,��v 5 j ρv,�uuvw¨�,v,�Prv,�? F�
hv,�,��v 5 j ρv,�uuvw¨�,v,�Prv,�? F�
5 (0.014950566-(0.938006-(1.367295402-(1011.3-0.6954?F

159
5 24.70486532
Fin efoicency, η� 5 tanhmlml
m 5 � 2hv,�,��vko,� f�£,�`��VV 5 � 2(24.70486532- (239.19-(0.0004- 5 22.72504428
η� 5 tanhmlml 5 tanh(22.72504428 3 0.015-(22.72504428 3 0.015- 5 0.962987276
Total surface temperature effectiveness, η�
η� 5 1.0 + (1.0 + 0.962987276- 3 11.22168613.67169192 5 0.969620061 Air thermal resistance , Rv,�,��v 5 1(24.70486532-(0.969620061 - 5 0.041746101
Thermal resistance of air side (condenser)
Same calculation as evaporator side
Air thermal resistance , Rv,�,������V�� 5 0.034452879
Thermal resistance of working fluid at evaporator
Water based (1 vol.%) Al2O3 nanofluids
Convective heat transfer coefficient, hnf/eva
h��,��vk�� \ µ��?ρ��,ª8ρ��,ª + ρ��,�9g]R/F 5 Y43Z
RF 1Re��R/F
h��,��v0.704815957 \ 0.000287073?987.97546(987.97546 + 40.286476-9.81]R/F 5 Y43Z
RF 130��R/F
h��.��v 5 12.01471751 kWm?K
Thermal resistance of nanooluids at evaporator, R��,��v 5 1α��αv,�® h��,��v

160
R��,��v 5 1 34.0992248196.2631628®12014.71751 5 0.00047905
Thermal resistance of working fluid at condenser
Water based (1 vol.%) Al2O3 nanofluids
Convective heat transfer coefficient, hnf,cond
h��,����k�� \ µ��?ρ��,ª8ρ��,ª + ρ��,�9g]R/F 5 43 Y 43Re��Z
RF
h��,���� 5 6.775680502 kWm?K
Thermal resistance of nanooluids at condenser, R��,������V�� R��,������V�� 5 1α��αv,�® h��,���� 5 0.000849457 Overall heat transfer coefoicient at evaporator, 5 10.041746101 6 0.00047905
5 23.68256796
Overall heat transfer coefoicient at condenser 5 10.034452879 6 0.000849457
28.32673729
Total overall heat transfer coefoicient at both sides 5 52.00930525 Wm?K