Embed Size (px)
Citation preview

MULTITHERMAN:Out-of-band High-Resolution HPC Power and
Performance Monitoring Support for Big-Data Analysis
EU FP7 ERC ProjectMULTITHERMAN (g.a.291125)
EU H2020 FETHPCproject ANTAREX (g.a. 671623)
EETHPC, Frankfurt28.06.2018
Antonio LibriA. Bartolini, F. Beneventi, A. Borghesi and L. Benini

2Departement Informationstechnologie und Elektrotechnik
Outline Motivation & D.A.V.I.D.E. Overview DiG: High Res Out-of-Band Pow & Perf Mon ExaMon: Scalable Data Collection and Analytics Monitored Metrics and Data Visualization

3Departement Informationstechnologie und Elektrotechnik
Motivation – Innovative Scenarios
req
requtil
Job Scheduler
CPUNode
Coarse grain
Fine grain
CPU
ACC ACC
DIMM
System Power Capping (bound from grid): Job scheduler decides the job that enters in the
system Ensures operating power below a maximum power consumption level Reduce Power budget during new Installations and Power Shortage
Fine Grain Power and Performance Measurements: Verify and classify node performance (e.g. In
spec / out of spec behaviour, aging and wear out) Predictive maintenance Per user - Energy / Performance – accounting

D.A.V.I.D.E. SUPERCOMPUTER(Development of an
Added Value
Infrastructure Designed in
Europe)
D.A.V.I.D.E. (#18 Green500 Nov’17)
4

D.A.V.I.D.E. SUPERCOMPUTER(Development of an Added Value Infrastructure Designed in Europe)
OCP form factor compute nodebased on IBM Minsky
2xIB EDR
LIQUID COOLING
4x Tesla P100 HSMX2
ETH Zurich / University of Bologna OUT-OF-BAND
HIGH RESOLUTION POWER AND PERFORMANCE MONITORING
BusBar
2 x POWER8 with NVLink
5
DiG

6Departement Informationstechnologie und Elektrotechnik
Outline Motivation & D.A.V.I.D.E. Overview DiG: High Res Out-of-Band Pow & Perf Mon ExaMon: Scalable Data Collection and Analytics Monitored Metrics and Data Visualization

7Departement Informationstechnologie und Elektrotechnik
Out-of-band Zero overhead Collect more than 1.5 kS/s,
7/7d, 24/24h, for all users Architecture independent (i.e.
tested on Intel, ARM and IBM) Fine grain down to ms scale
(sampling @800 kS/s + avg) IoT communication technology
(MQTT) scalable Time synchronous (NTP, PTP)
Beaglebone Black
DiG: High Resolution Out-of-band Power Monitoring

8Departement Informationstechnologie und Elektrotechnik
Coarse Grain View
BB View1 Node - 15 min
15 min
45 Nodes -4s
BB @1s
BB @1ms
BB @1ms 45 Nodes -1s
DiG: Example of fine grain monitoring
How do we correlate these activities with applications phases?

9Departement Informationstechnologie und Elektrotechnik
BBB1
BBBn
Rack
node1
Cold air/water
CRAC
HPC cluster Hot air/water
C˚RPM FAN
Power
PerfcountersGPU
CPU1
CPUn
Clock
Clock
DiG: Fine grain correlation with jobs’ activities
μs resolved time stamps

10Departement Informationstechnologie und Elektrotechnik
BBB1
BBBn
SeveralMetrics
Rack
node1
Cold air/water
CRAC
HPC cluster Hot air/water
C˚RPM FAN
Power
PerfcountersGPU
P0Pn
APP MPI SynchTime
Node 1
Node n
CPU1
CPUn
ParallelApplication
Node 1
Node nTimeTemp
Power
Cache Miss
Clock
Clock
DiG: Fine grain correlation with jobs’ activities
Ok up to 1ms … but what about real-time analysis at higher frequencies for a football-
field size cluster of computing nodes?

11Departement Informationstechnologie und Elektrotechnik
11
Application 1
Application 2
Real-time Frequency analysis on power supply and more…a live oscilloscope
DiG: live FFT on the power traces
• User -> to discriminate application phases• Sys Admin -> to detect malicious users• Designers -> to debug and optimize power delivery network

12Departement Informationstechnologie und Elektrotechnik
Outline Motivation & D.A.V.I.D.E. Overview DiG: High Res Out-of-Band Pow & Perf Mon ExaMon: Scalable Data Collection and Analytics Monitored Metrics and Data Visualization

13Departement Informationstechnologie und Elektrotechnik
ExaMon: Scalable Data Collection and Analytics
Aggregates job’s power and performance in real-time and at a fine granularity for Big Data analysis
Based on open-src SW Store, Process, Visualize and Analyze Monitored Data Historical Buffer (i.e. 2 Weeks) Perpetual per Job
Web frontend
Open-src beta release:https://github.com/fbeneventi/examon
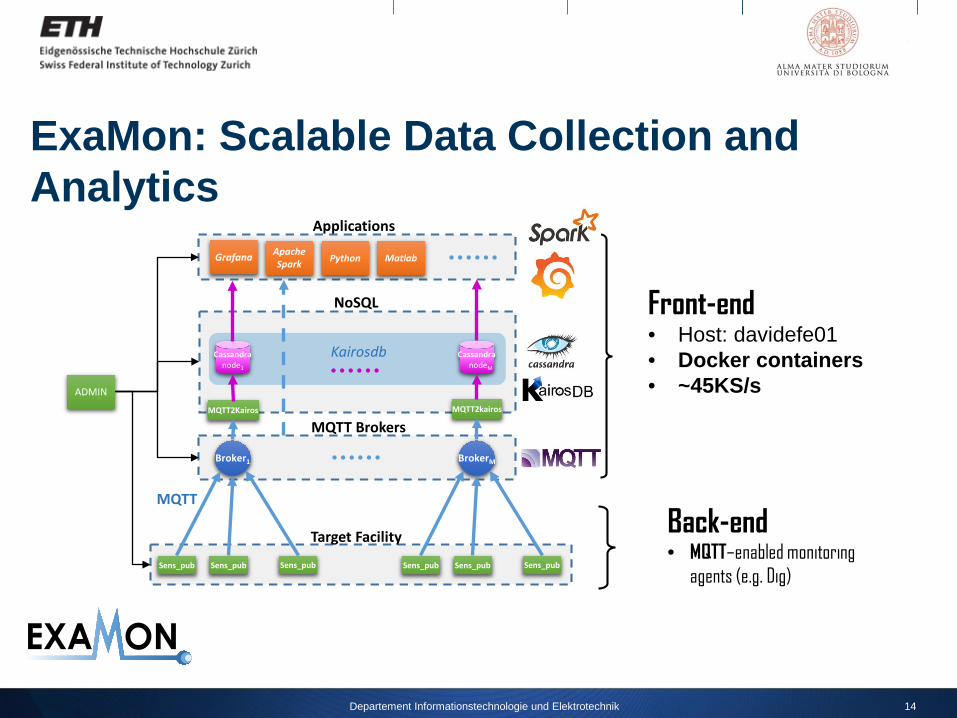
14Departement Informationstechnologie und Elektrotechnik
Back-end• MQTT–enabled monitoring
agents (e.g. Dig)
Front-end • Host: davidefe01• Docker containers• ~45KS/s
ExaMon: Scalable Data Collection and Analytics
Sens_pub
Broker1
Sens_pub Sens_pub
Cassandranode1
MQTT
Sens_pub
BrokerM
Sens_pub Sens_pub
CassandranodeM
Grafana ApacheSpark
Target Facility
MQTT Brokers
Applications
NoSQL
ADMIN
MQTT2Kairos MQTT2kairos
Kairosdb
Python Matlab

15Departement Informationstechnologie und Elektrotechnik
ExaMon: Scalable Data Collection and Analytics
Monitoring Agents:• Send Power and Performance
measurements to the FE• Key-Value pairs (TS, Data)• Topic (Metric)Sens_pub
Broker1
Sens_pub Sens_pub
Cassandranode1
MQTT
Sens_pub
BrokerM
Sens_pub Sens_pub
CassandranodeM
Grafana ApacheSpark
Target Facility
MQTT Brokers
Applications
NoSQL
ADMIN
MQTT2Kairos MQTT2kairos
Kairosdb
Python Matlab

16Departement Informationstechnologie und Elektrotechnik
Sens_pub
Broker1
Sens_pub Sens_pub
Cassandranode1
MQTT
Sens_pub
BrokerM
Sens_pub Sens_pub
CassandranodeM
Grafana ApacheSpark
Target Facility
MQTT Brokers
Applications
NoSQL
ADMIN
MQTT2Kairos MQTT2kairos
Kairosdb
Python Matlab
ExaMon: Scalable Data Collection and Analytics
Broker:• Forward data to the
listeners (e.g. kairosDB)
Mqtt2kairosdb:• Interface between MQTT
and KairosDB• KairosDB is a front-end
to handle time series in Cassandra
Cassandra:• NoSQL database• Highly scalable• Optimized to balance the
load on multiple nodes

17Departement Informationstechnologie und Elektrotechnik
Sens_pub
Broker1
Sens_pub Sens_pub
Cassandranode1
MQTT
Sens_pub
BrokerM
Sens_pub Sens_pub
CassandranodeM
Grafana ApacheSpark
Target Facility
MQTT Brokers
Applications
NoSQL
ADMIN
MQTT2Kairos MQTT2kairos
Kairosdb
Python Matlab
ExaMon: Scalable Data Collection and Analytics
Application layer:• Grafana, Apache Spark,
etc …• Aggregate metrics for
Data Visualization, ML Analysis, Post Processing, etc …
19Departement Informationstechnologie und Elektrotechnik
Outline Motivation & D.A.V.I.D.E. Overview DiG: High Res Out-of-Band Pow & Perf Mon ExaMon: Scalable Data Collection and Analytics Monitored Metrics and Data Visualization
19Departement Informationstechnologie und Elektrotechnik
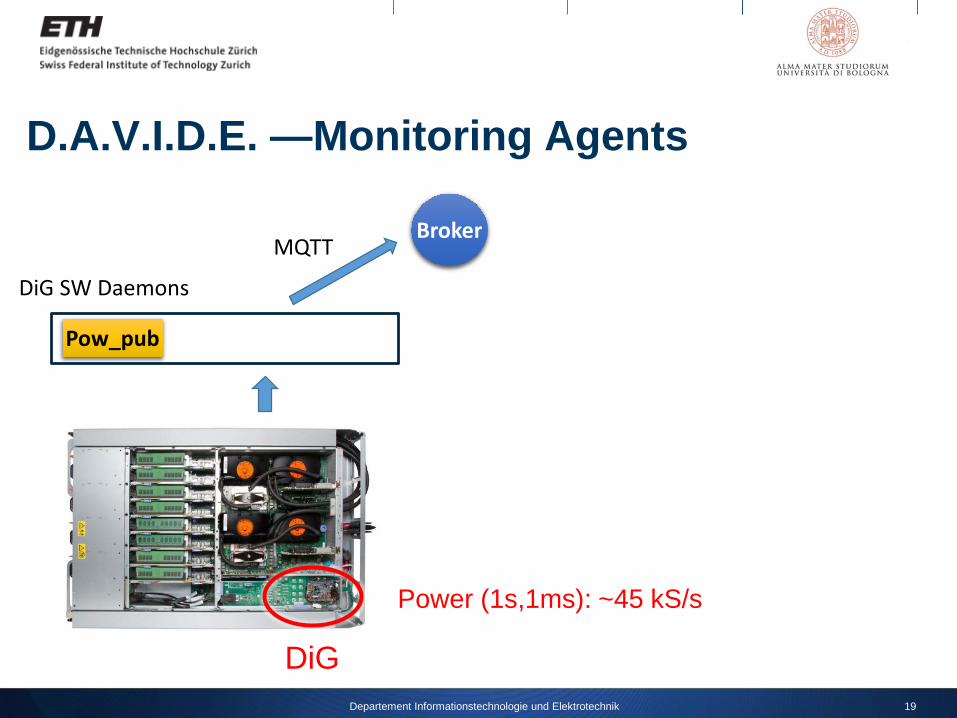
D.A.V.I.D.E. — Monitoring Agents
BrokerMQTT
DiG
Pow_pub
DiG SW Daemons
Power (1s,1ms): ~45 kS/s

20Departement Informationstechnologie und Elektrotechnik
D.A.V.I.D.E. — Monitoring Agents
BrokerMQTT
DiG
Pow_pub
DiG SW Daemons
IPMI: 89 metrics per node every 5s
IPMI_pub

21Departement Informationstechnologie und Elektrotechnik
D.A.V.I.D.E. — Monitoring Agents
BrokerMQTT
DiG
Pow_pub
DiG SW Daemons
OCC: 242 metrics per node every 10s
IPMI_pub OCC_pub

22Departement Informationstechnologie und Elektrotechnik
D.A.V.I.D.E. — Monitoring Agents
BrokerMQTT
DiG
IPMI
MQTT
Pow_pub IPMI_pub OCC_pub
DiG SW Daemons
PSU_pub
D.A.V.I.D.E. Front-End
LiteonOverall Rack info (e.g., Total Power)

23Departement Informationstechnologie und Elektrotechnik
D.A.V.I.D.E. — Monitoring Agents
BrokerMQTT
DiG
IPMI
MQTT
Pow_pub IPMI_pub OCC_pub
DiG SW Daemons
PSU_pub Cooling_pub
D.A.V.I.D.E. Front-End
Liteon
Asetek
Info Liquid Cooling

24Departement Informationstechnologie und Elektrotechnik
Real-Time Monitoring, Processing, Visualization
we provide for all the users a debug portal that can be
accessed to gather and visualize its job data
DiG

25Departement Informationstechnologie und Elektrotechnik
Real-Time Monitoring, Processing, Visualization
Users can now see power breakdown for each node, live
DiG

27Departement Informationstechnologie und Elektrotechnik
Conclusion
With D.A.V.I.D.E. and its monitoring infrastructure we provide real-time analysis on computing nodes
high resolution power and performance measurements up to ms scale
upcoming FFT live analysis Data Storage, Processing and Visualization, along
with Big Data Analysis support

Thanks for your interest.
Contact: Antonio Libri, [email protected]
This project has received funding from the European Union’s Horizon 2020 research and innovation programme under grant agreement No 671623 (ANTAREX)
Co-funded by EU FP7 ERC Project Multitherman (No 291125)
Unibo/ETH:A. Bartolini, F. Beneventi, A. Borghesi, and L. Benini

28Departement Informationstechnologie und Elektrotechnik
Backup Slides

29Departement Informationstechnologie und Elektrotechnik
A. Bartolini, and L. Benini
Topics:1. Examon: holistic and scalable real-time
monitoring for HPC centers – open source, beta release Q2/Q3 2018 (F. Beneventi, https://github.com/fbeneventi/examon)
2. Large-scale multiscale Power and Thermal modeling, and control (F. Pittino, C. Conficoni)
a. Development of power and thermal models at core level for monitoring and control of large HPC clusters in production
b. Datacentre cooling modeling and optimization
Team & Research Activity

30Departement Informationstechnologie und Elektrotechnik
3. Fine grain monitoring and management (A. Libri, D. Cesarini)
a. DiG: multi-platform and production ready solution, based on low-cost open-source HW, already integrated with E4 technology
b. Application aware power and thermal management: open source, beta release Q3 2018
4. Power and performance aware Job scheduler (A. Borghesi)
a. System level power capping and optimization
5. Datacentre automation (A. Borghesi, A. Libri)a. Big-data and deep learning based automated power
optimization
b. Big-data and deep learning based automated anomaly detection
Team & Research ActivityDiG

31Departement Informationstechnologie und Elektrotechnik
D.A.V.I.D.E. — Fine Grain Power Metric
Metric Name
Ts Description Unit
power 1s,1ms Power consumption at node power plug W
Pow_pub
Broker
MQTT
DiG
Power: ~45 kS/s

32Departement Informationstechnologie und Elektrotechnik
D.A.V.I.D.E. — IPMI Metrics
IPMI_pub
Broker
IPMI
MQTT
DiG
IPMI: 89 metrics per node every 5s

33Departement Informationstechnologie und Elektrotechnik
D.A.V.I.D.E. — OCC Metrics
OCC_pub
Broker
IPMI
MQTT
DiG
Per-componentpower
OCC: 242 metrics per node every 10s

34Departement Informationstechnologie und Elektrotechnik
D.A.V.I.D.E. — PSU Metrics
PSU_pub
Broker
IPMI
MQTT
• Running in the front-end• Full Rack info

35Departement Informationstechnologie und Elektrotechnik
D.A.V.I.D.E. — Liquid Cooling Metrics
Cooling_pub
Broker
IPMI
MQTT
• Running in the front-end• Per Rack Cooling info

36Departement Informationstechnologie und Elektrotechnik
ExaMon: Batch & Streaming
examon-client(REST)
(Batch)
Pandasdataframe
Bahir-mqtt(Spark connector)
(Streaming)
Open-src beta release:https://github.com/fbeneventi/examon