Embed Size (px)
Citation preview

NanoscaleAdvances
REVIEW
Ope
n A
cces
s A
rtic
le. P
ublis
hed
on 0
6 M
ay 2
020.
Dow
nloa
ded
on 1
2/27
/202
1 8:
02:2
1 PM
. T
his
artic
le is
lice
nsed
und
er a
Cre
ativ
e C
omm
ons
Attr
ibut
ion-
Non
Com
mer
cial
3.0
Unp
orte
d L
icen
ce.
View Article OnlineView Journal | View Issue
There's no place
TtCUwgKcrHtodd
Department of Chemistry and Nanoscience C
Copenhagen Ø, Denmark. E-mail: kirsten@c
Cite this: Nanoscale Adv., 2020, 2,2234
Received 12th February 2020Accepted 5th May 2020
DOI: 10.1039/d0na00120a
rsc.li/nanoscale-advances
2234 | Nanoscale Adv., 2020, 2, 223
like real-space: elucidating size-dependent atomic structure of nanomaterials usingpair distribution function analysis
Troels Lindahl Christiansen, † Susan R. Cooper † and Kirsten M. Ø. Jensen *
The development of new functional materials builds on an understanding of the intricate relationship
between material structure and properties, and structural characterization is a crucial part of materials
chemistry. However, elucidating the atomic structure of nanomaterials remains a challenge using
conventional diffraction techniques due to the lack of long-range atomic order. Over the past decade,
Pair Distribution Function (PDF) analysis of X-ray or neutron total scattering data has become a mature
and well-established method capable of giving insight into the atomic structure in nanomaterials. Here,
we review the use of PDF analysis and modelling in characterization of a range of different nanomaterials
that exhibit unique atomic structure compared to the corresponding bulk materials. A brief introduction
to PDF analysis and modelling is given, followed by examples of how essential structural information can
be extracted from PDFs using both model-free and advanced modelling methods. We put an emphasis
on how the intuitive nature of the PDF can be used for understanding important structural motifs, and
on the diversity of applications of PDF analysis to nanostructure problems.
Introduction
When looking back on the developments in materials chemistryover the past decades, it is clear that the discovery andadvancement of new functional materials for advanced appli-cations in e.g. energy technologies and many other elds has
roels Lindahl Christiansen ob-ained his Ph.D. degree inhemistry in 2019 from theniversity of Copenhagen,orking in the nanostructureroup under supervision ofirsten M.Ø. Jensen. He isurrently a postdoctoralesearcher in the same group.is research focuses on struc-ural characterization of metalxide materials, as well as oneveloping new methods for pairistribution function analysis.
enter, University of Copenhagen, 2100
hem.ku.dk
4–2254
paralleled the ability of scientists to characterize atomic struc-ture in materials.1,2 The very core of materials chemistry isunderstanding the relation between atomic structure andproperties, and developments in materials chemistry heavilyrelies on structural knowledge. The ability to determine theatomic structure of materials began with the work of Max Von
Susan R. Cooper received herPh.D. in Chemistry from theUniversity of Oregon in 2018(with James E. Hutchison andDarren W. Johnson). She wassupported by the NationalScience Foundation GraduateResearch Fellowship program,and her research focused on thesynthesis and structural charac-terization of iron oxide nano-crystals. She is nowa Postdoctoral Fellow at the
University of Copenhagen, funded by a Marie Sklodwska-CurieIndividual Fellowship. Her research is focused on determiningthe nanoscale structural changes of small nanocrystals using totalX-ray scattering and pair distribution function analysis.
† These authors contributed equally to this manuscript.
This journal is © The Royal Society of Chemistry 2020
Review Nanoscale Advances
Ope
n A
cces
s A
rtic
le. P
ublis
hed
on 0
6 M
ay 2
020.
Dow
nloa
ded
on 1
2/27
/202
1 8:
02:2
1 PM
. T
his
artic
le is
lice
nsed
und
er a
Cre
ativ
e C
omm
ons
Attr
ibut
ion-
Non
Com
mer
cial
3.0
Unp
orte
d L
icen
ce.
View Article Online
Laue and W. H. and W. L. Bragg in the 1910s.3–5 Epochaldevelopments such as Rietveld renement6 and the advent oflarge scale synchrotron and neutron facilities have allowedmaterials scientists to tackle structures, materials and problemsof ever increasing complexity.7,8 The result is an explosion in thediversity of the materials we use every day, which has causeda fundamental change in our society and way of life.9 Still aheadlies challenges to develop cheaper, more sustainable andgreener materials with improved properties, tailormade for newtechnologies. Nanomaterials have the potential to be part of thisdevelopment and have contributed solutions in a number ofimportant elds.10,11
The size-dependent properties observed in many nano-materials arise from effects including enhanced surface/volumeratio, and for the smallest nanoparticles, quantum connementeffects.12–14 In addition, the atomic arrangement in a materialmay also change upon nanosizing, which will dramaticallyinuence the material properties. For example, a change ofatomic structure is seen in metallic nanoparticles when goingbelow 2–3 nm, leading to completely new properties.15–18
Despite this, the atomic structure of most nanomaterials isoen assumed to be simple cut-outs of the structure of thecorresponding bulk materials. This lack of understanding of animportant nanoscale effect is most likely due to the difficulty incharacterizing atomic structure in nanoscale materials.19 Whilethe small domain size of the nanomaterials is the origin ofemerging properties,12 it also poses a problem as it challengesthe conventional crystallographic methods used for deter-mining and rening the atomic structure of materials.19,20 Intraditional powder X-ray diffraction (PXRD), the Bragg peaksthat arise from atomic periodicity in crystalline materials areanalyzed to obtain information on the atomic structure of thesample, however this is not sufficient for nanostructuredmaterials, where the crystalline domain size is small and wherethe structure is oen disordered. Consider the standard Riet-veld renement approach:6 Structural information is extractedby minimizing the difference between experimental PXRD dataand Bragg peak intensities and positions calculated from
Kirsten M. Ø. Jensen is an asso-ciate professor at Department ofChemistry at University ofCopenhagen. She received herPh.D. in Chemistry from AarhusUniversity in 2013. Followinga postdoc position at ColumbiaUniversity, she started herresearch group in Copenhagen in2015. The research in her groupconcerns nanomaterials, focusingespecially on the use of X-ray andneutron scattering to elucidate
the structure and formation mechanisms of nanoparticles. Pairdistribution function analysis is central to her research, and hergroup is active in development of new PDF modelling methods andexperiments.
This journal is © The Royal Society of Chemistry 2020
a crystal structure model. Any deviation from perfect crystal-linity is included by modelling the Bragg peak shape, which canyield microstructural information such as crystallite size andstrain.21 However, any diffuse scattering arising from disorder inthe material is normally considered background scattering andconventional Rietveld renement is oen inadequate forstructural analysis of nanomaterials whose atomic structure isfar from that of bulk, crystalline materials.22
Because of the challenges in applying traditional diffractionmethods to nanostructured materials, many other techniqueshave been applied in the quest to characterize their atomicstructure.23 For example, Extended X-ray Absorption Spectros-copy (EXAFS) can be used to characterize the local atomicstructure in any material no matter its degree of atomic order,including disordered nanostructured materials.24 However, thestructural information that can be obtained from EXAFS islimited to the rst few coordination shells around an atom,making it difficult to fully characterize material structure.19
Transmission electronmicroscopy (TEM) is another widely usedtechnique for nanomaterials, and with sufficient resolution,TEM can be applied in the characterization of the atomicstructure of nanoparticles.25–27 However, highly disorderedmaterials can be difficult to characterize from microscopymethods alone and a limited number of particles can beanalyzed at a time. Since the turn of the century, X-ray TotalScattering (TS) and Pair Distribution Function (PDF) analysishas been proven to be an extremely powerful technique for thecharacterization of material structure and has evolved froma method mainly used for characterization of liquids andamorphous matter into a powerful tool for elucidating theatomic structure of solid state materials.20,28,29 In the early daysof PDF analysis of materials, in the late 1990s and early 2000s,the method was an exotic technique applied mainly by solidstate physicists to study the local structure in bulk, crystallinematerials exhibiting e.g. superconductivity or ferroelec-tricity.30,31 PDF is still widely used for this type of materials, butsince then, the diversity of the applications of PDF has growntremendously, and PDF is now an important method forstructure characterization in chemistry,32 energy materials,33–37
geology,38–40 pharmaceuticals,41–43 and other elds.A PDF is a Fourier transform of total scattering data and, as
described further below, represents the distribution of allinteratomic distances in a material.22 When treating total scat-tering data, one does not discriminate between diffuse scat-tering and Bragg scattering, and the PDF thus includesinformation on the atomic structure of any kind of material;crystalline, nanostructured, disordered, or fully amorphous.28 Abarrier to wide adoption of the use of PDF in the past was thechallenges in measuring high quality scattering data to highmomentum transfers, Q, which is needed to obtain high reso-lution in real-space.22 Now, the increase in X-ray ux and X-rayenergy available at synchrotron sources have made the devel-opment of dedicated PDF beamlines possible.20,22 Combinedwith developments in experimental methods, such as the rapid-acquisition PDF (RA-PDF) method,44 and user-friendly so-ware,45–49 PDF has become a widely accessible technique fora large community of scientists.31
Nanoscale Adv., 2020, 2, 2234–2254 | 2235
Nanoscale Advances Review
Ope
n A
cces
s A
rtic
le. P
ublis
hed
on 0
6 M
ay 2
020.
Dow
nloa
ded
on 1
2/27
/202
1 8:
02:2
1 PM
. T
his
artic
le is
lice
nsed
und
er a
Cre
ativ
e C
omm
ons
Attr
ibut
ion-
Non
Com
mer
cial
3.0
Unp
orte
d L
icen
ce.
View Article Online
PDF analysis can now be considered a mature techniquecapable of characterizing a range of different nanostructures,and its use in several elds has been reviewed in the past.33,50–54
With this review, we focus on the application of PDF in studiesof the size-dependent atomic structure in nanomaterials andaim to give an overview of some of the different approaches thathave been applied in studies of nanosize-induced structuralchanges. We will review examples of PDF studies that usea variety of strategies for data analysis. The PDF method andPDF theory has already been thoroughly reviewed and describedin papers and textbooks,22,55,56 and we therefore only give a shortdescription of the anatomy of a PDF to aid in understandinghow structural information can be extracted from total scat-tering data and PDF analysis before reviewing examples of itsuse.
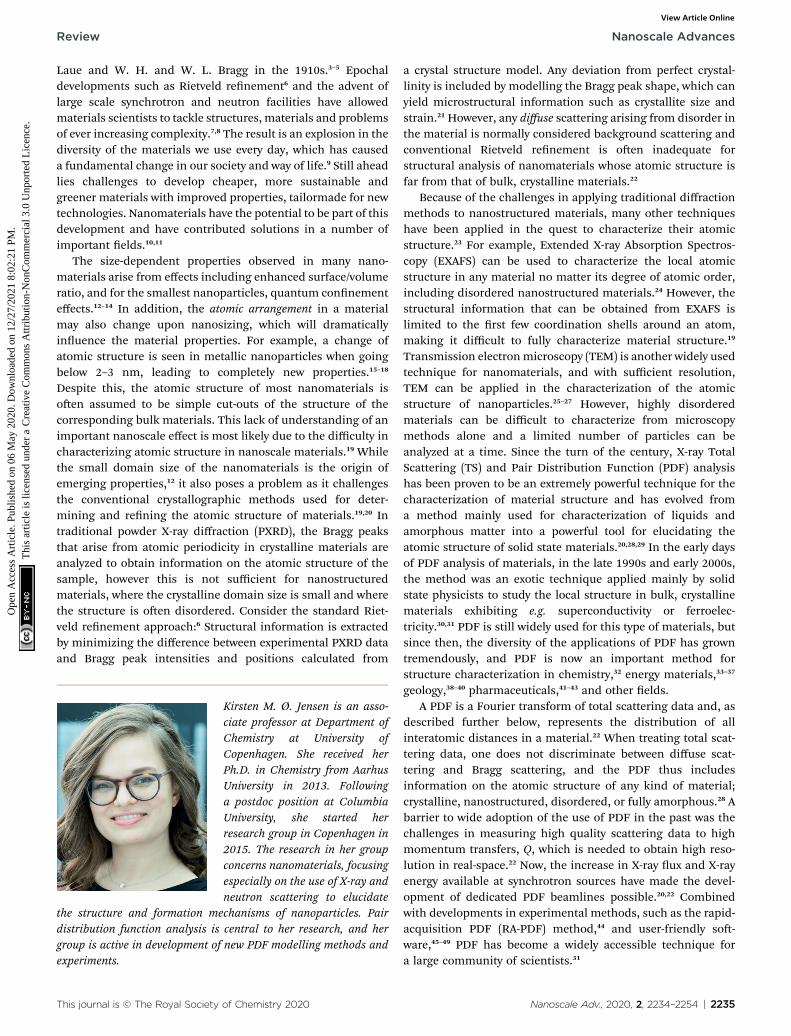
Fig. 1 G(r) functions calculated for hypothetical 1D atomic structures.A–E illustrate different aspects of the PDF and how they are inter-preted in relation to atomic structure: (A) the impact of atomic coor-dinates on peak position, (B) the impact of atomic vibration on peakbroadening, (C) the impact of crystallite size on the extent of the PDF,(D) the impact of atomic identity (as seen when replacing Au with Na,an element with lower scattering power) on the peak intensity and (E)the effects of disorder on the PDF. The blue line is the simulated PDFunder consideration, while the dotted line is the PDF simulated in A.
Obtaining and reading a PDF
A PDF is obtained by Fourier transforming total scattering data.The Fourier transform is done over the structure function S(Q),which represents the normalized, coherently scattered intensityfrom the sample, as here expressed for X-rays:22
SðQÞ ¼IcðQÞ �
Df ðQÞ2
Eþ hf ðQÞi2
hf ðQÞi2 (1)
GðrÞ ¼�2
p
�ðQmax
Qmin
QðSðQÞ � 1ÞsinðQrÞdQ (2)
here, Ic(Q) represents the coherent scattering intensity, and f(Q)the atomic form factors for the elements in the sample.Several user-friendly programs, e.g. PDFgetX3,46 PDFgetN,57
PDFgetN3,58 GSAS-II,49 GudrunX and GudrunN48 can be used toobtain S(Q) and G(r) from experimental total scattering dataobtained from X-rays, neutrons or electrons. The extent of theQ-
range�Q ¼ 4p sinðqÞ
l
�used in the Fourier transform deter-
mines the amount of information and detail that can beextracted from the PDF, and generally, a Qmax value of at least
15–20 A�1 is needed to extract atomic scale structural infor-mation, although this value is highly dependent on the purposeand aim of the study. The need for large Q-ranges means thathigh energy X-rays or neutrons with a short wavelength shouldbe applied. High ux is furthermore required, as good statisticsin the S(Q) function even at the highest Q-values are needed inorder to minimize noise in the PDF. In the case of X-rays, totalscattering studies are therefore oen done at high energysynchrotron sources with dedicated PDF beamlines.28 However,PDF analysis is also possible with laboratory instruments usinge.g. Ag or Mo X-ray tubes.59 Total scattering measurements canalso be performed using neutrons57 or electrons.60 We focushere on X-rays which is most widely used for nanostructureanalysis, but the choice of radiation depends entirely on thesample and scientic aim in question.
A PDF represents the distribution of all interatomic atomicdistances present in the structure of a sample. Due to theintuitive nature of the PDF, signicant structural insight is
2236 | Nanoscale Adv., 2020, 2, 2234–2254 This journal is © The Royal Society of Chemistry 2020
Review Nanoscale Advances
Ope
n A
cces
s A
rtic
le. P
ublis
hed
on 0
6 M
ay 2
020.
Dow
nloa
ded
on 1
2/27
/202
1 8:
02:2
1 PM
. T
his
artic
le is
lice
nsed
und
er a
Cre
ativ
e C
omm
ons
Attr
ibut
ion-
Non
Com
mer
cial
3.0
Unp
orte
d L
icen
ce.
View Article Online
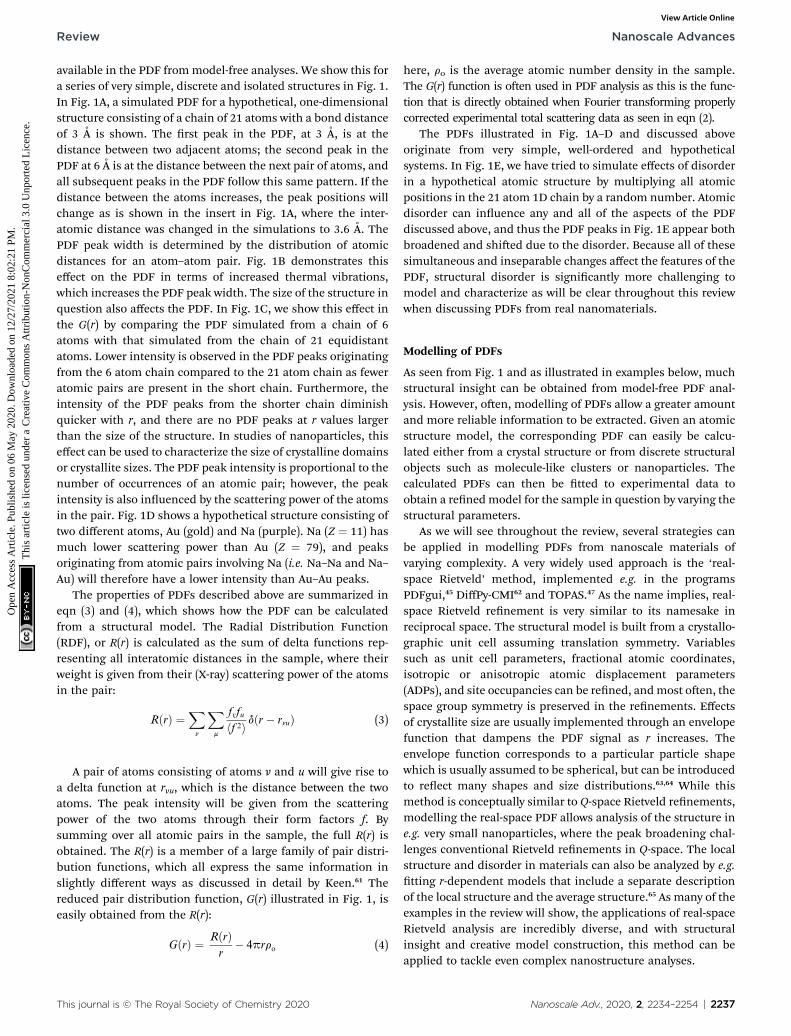
available in the PDF frommodel-free analyses. We show this fora series of very simple, discrete and isolated structures in Fig. 1.In Fig. 1A, a simulated PDF for a hypothetical, one-dimensionalstructure consisting of a chain of 21 atoms with a bond distanceof 3 A is shown. The rst peak in the PDF, at 3 A, is at thedistance between two adjacent atoms; the second peak in thePDF at 6 A is at the distance between the next pair of atoms, andall subsequent peaks in the PDF follow this same pattern. If thedistance between the atoms increases, the peak positions willchange as is shown in the insert in Fig. 1A, where the inter-atomic distance was changed in the simulations to 3.6 A. ThePDF peak width is determined by the distribution of atomicdistances for an atom–atom pair. Fig. 1B demonstrates thiseffect on the PDF in terms of increased thermal vibrations,which increases the PDF peak width. The size of the structure inquestion also affects the PDF. In Fig. 1C, we show this effect inthe G(r) by comparing the PDF simulated from a chain of 6atoms with that simulated from the chain of 21 equidistantatoms. Lower intensity is observed in the PDF peaks originatingfrom the 6 atom chain compared to the 21 atom chain as feweratomic pairs are present in the short chain. Furthermore, theintensity of the PDF peaks from the shorter chain diminishquicker with r, and there are no PDF peaks at r values largerthan the size of the structure. In studies of nanoparticles, thiseffect can be used to characterize the size of crystalline domainsor crystallite sizes. The PDF peak intensity is proportional to thenumber of occurrences of an atomic pair; however, the peakintensity is also inuenced by the scattering power of the atomsin the pair. Fig. 1D shows a hypothetical structure consisting oftwo different atoms, Au (gold) and Na (purple). Na (Z ¼ 11) hasmuch lower scattering power than Au (Z ¼ 79), and peaksoriginating from atomic pairs involving Na (i.e. Na–Na and Na–Au) will therefore have a lower intensity than Au–Au peaks.
The properties of PDFs described above are summarized ineqn (3) and (4), which shows how the PDF can be calculatedfrom a structural model. The Radial Distribution Function(RDF), or R(r) is calculated as the sum of delta functions rep-resenting all interatomic distances in the sample, where theirweight is given from their (X-ray) scattering power of the atomsin the pair:
RðrÞ ¼Xn
Xm
fvfu
hf 2i dðr� rnuÞ (3)
A pair of atoms consisting of atoms v and u will give rise toa delta function at rvu, which is the distance between the twoatoms. The peak intensity will be given from the scatteringpower of the two atoms through their form factors f. Bysumming over all atomic pairs in the sample, the full R(r) isobtained. The R(r) is a member of a large family of pair distri-bution functions, which all express the same information inslightly different ways as discussed in detail by Keen.61 Thereduced pair distribution function, G(r) illustrated in Fig. 1, iseasily obtained from the R(r):
GðrÞ ¼ RðrÞr
� 4prro (4)
This journal is © The Royal Society of Chemistry 2020
here, ro is the average atomic number density in the sample.The G(r) function is oen used in PDF analysis as this is the func-tion that is directly obtained when Fourier transforming properlycorrected experimental total scattering data as seen in eqn (2).
The PDFs illustrated in Fig. 1A–D and discussed aboveoriginate from very simple, well-ordered and hypotheticalsystems. In Fig. 1E, we have tried to simulate effects of disorderin a hypothetical atomic structure by multiplying all atomicpositions in the 21 atom 1D chain by a random number. Atomicdisorder can inuence any and all of the aspects of the PDFdiscussed above, and thus the PDF peaks in Fig. 1E appear bothbroadened and shied due to the disorder. Because all of thesesimultaneous and inseparable changes affect the features of thePDF, structural disorder is signicantly more challenging tomodel and characterize as will be clear throughout this reviewwhen discussing PDFs from real nanomaterials.
Modelling of PDFs
As seen from Fig. 1 and as illustrated in examples below, muchstructural insight can be obtained from model-free PDF anal-ysis. However, oen, modelling of PDFs allow a greater amountand more reliable information to be extracted. Given an atomicstructure model, the corresponding PDF can easily be calcu-lated either from a crystal structure or from discrete structuralobjects such as molecule-like clusters or nanoparticles. Thecalculated PDFs can then be tted to experimental data toobtain a renedmodel for the sample in question by varying thestructural parameters.
As we will see throughout the review, several strategies canbe applied in modelling PDFs from nanoscale materials ofvarying complexity. A very widely used approach is the ‘real-space Rietveld’ method, implemented e.g. in the programsPDFgui,45 DiffPy-CMI62 and TOPAS.47 As the name implies, real-space Rietveld renement is very similar to its namesake inreciprocal space. The structural model is built from a crystallo-graphic unit cell assuming translation symmetry. Variablessuch as unit cell parameters, fractional atomic coordinates,isotropic or anisotropic atomic displacement parameters(ADPs), and site occupancies can be rened, andmost oen, thespace group symmetry is preserved in the renements. Effectsof crystallite size are usually implemented through an envelopefunction that dampens the PDF signal as r increases. Theenvelope function corresponds to a particular particle shapewhich is usually assumed to be spherical, but can be introducedto reect many shapes and size distributions.63,64 While thismethod is conceptually similar to Q-space Rietveld renements,modelling the real-space PDF allows analysis of the structure ine.g. very small nanoparticles, where the peak broadening chal-lenges conventional Rietveld renements in Q-space. The localstructure and disorder in materials can also be analyzed by e.g.tting r-dependent models that include a separate descriptionof the local structure and the average structure.65 As many of theexamples in the review will show, the applications of real-spaceRietveld analysis are incredibly diverse, and with structuralinsight and creative model construction, this method can beapplied to tackle even complex nanostructure analyses.
Nanoscale Adv., 2020, 2, 2234–2254 | 2237
Nanoscale Advances Review
Ope
n A
cces
s A
rtic
le. P
ublis
hed
on 0
6 M
ay 2
020.
Dow
nloa
ded
on 1
2/27
/202
1 8:
02:2
1 PM
. T
his
artic
le is
lice
nsed
und
er a
Cre
ativ
e C
omm
ons
Attr
ibut
ion-
Non
Com
mer
cial
3.0
Unp
orte
d L
icen
ce.
View Article Online
The real-space Rietveld approach is mostly suited for mate-rials where the atomic structure shows periodicity and is relatedto the crystal structure of the corresponding bulk material orother known crystalline structures. In many materials, con-taining e.g. molecular units, large ionic clusters, or metallicnanoclusters, this approach cannot be used to describe theatomic structure. PDF modelling can then be done withoutassuming translation symmetry and periodicity, i.e. by buildingup a discrete structural object through its atomic coordinates.This method, used for small nanoparticles, clusters and mole-cules, takes advantage of the Debye equation66 for calculation ofa scattering pattern and subsequently the PDF.67 In the case ofnanoparticles, an entire structural model can be built and ttedto the data. Soware packages such as DISCUS68 and Diffpy-CMI62 facilitate modelling of PDFs of discrete structures. Anal-ysis of scattering patterns using the Debye scattering equationcan also be done directly in Q-space, i.e. without Fouriertransforming the data,69 for example using the Debussyprogram.70 Unlike in Q-space or real-space Rietveld analysis,where the space group symmetry can be applied to constrain theparameters in the renements, extra care has to be taken inlimiting the number of renable parameters when ttingdiscrete models. However, as examples below will show, thisapproach can be extremely powerful for structural analysis ofsmall nanoparticles.
PDF analysis can also be done using ‘large-box modelling’,e.g. through the use of Reverse Monte Carlo (RMC) methods,where thousands of atoms in a structure are allowed to move tobetter t experimental PDFs.71–73 While widely applied for fullyamorphous and disordered crystalline materials, this approachhas been less used for nanomaterials, although recent exampleshave shown its application to nanoparticles.74–76
Independent of the approach tomodelling, the quality of a tto a PDF is oen analyzed through the Rw-factor, which isa measure of the difference between the calculated (Gcalc) andexperimental PDF (Gobs) that is calculated as:22
Rw ¼ffiffiffiffiffiffiffiffiffiffiffiffiffiffiffiffiffiffiffiffiffiffiffiffiffiffiffiffiffiffiffiffiffiffiffiffiffiffiffiffiffiffiP
nðGobs;n � Gcalc;nÞ2PnGobs;n
2
s(5)
It is difficult to establish exactly what the Rw value fora ‘good’ t should be. PDF is oen used to characterize verydifferent materials with varying degrees of structural order, andthe Rw-value that can be expected depends greatly on thestructure type investigated as well as the data quality. Whentting high quality PDFs from highly ordered, crystallinemodels, very good agreement between data andmodel can oenbe obtained with Rw values between 1–5%. This is rarely the casefor nanostructured and disordered materials, where satisfactoryts are reported with Rw values above 15%. Oen, thecomplexity of a disordered nanomaterial is too high for a rela-tively simple model to fully describe e.g. heterogeneous size andstructure. The quest for a good t is always a compromisebetween extending the number of parameters in the model(which may result in over-tting and unphysical models) andthe development of simple models that describe important
2238 | Nanoscale Adv., 2020, 2, 2234–2254
structural features in the sample. A visual inspection of the t iskey when evaluating the t quality, as large features in thedifference curve are clear indications of an inadequate structuremodel. Due to the intuitive nature of a PDF, features in thedifference curve can oen be directly linked to a structure motif,which can aid in developing better models, as discussed furtherbelow.
Nanostructure from PDF analysis
In the following, we will review examples of the use of PDF foranalysis of atomic structure in nanomaterials. This is a largeand quickly developing eld, spanning over a range of materialtypes, applications, experimental methods and approaches tostructure analysis. We do not aim to cover the whole eld, butwe have chosen examples applying different analysis methodsto the structures that appear on the nanoscale; from model-freeanalysis, to real-space Rietveld renements, and discrete clustermodelling of varying complexity. The examples range from earlyapplications of PDF for nanoparticle studies to recent examplesof its use. As will be seen from the diverse examples, the methodto be used for a specic study is highly dependent on theproblem that is under investigation, and what information issought. This means that PDF analysis of the atomic structure innanomaterials requires a great deal of creativity, structuralunderstanding and chemical intuition. We have divided theexamples into three material classes; metal chalcogenides,metallic nanoparticles and oxides, and in this way, we try tocover a broad range of materials as well as approaches for PDFanalysis.
Size-dependent structure of metal chalcogenide nanoparticlesfrom PDF analysis
Stacking faults and size-dependent structure in metal chal-cogenide nanoparticles. Layered metal chalcogenides such asLiMoS2 (ref. 77) andWS2 (ref. 78) provided early examples of thePDF technique applied to crystallographically challenged nano-structured materials,50,55 and since then, the structure of severalchalcogenide nanomaterials have been characterized withPDF.79–82 Many metal chalcogenide nanoparticles are of partic-ular interest because of their photoabsorptive properties, andbecause of the extraordinary synthesis-control that can beachieved over both size and structure.83 The band gap of metalchalcogenides can be tuned both with nanosizing and bychanging the chemical composition of the material,84 and it istherefore crucial to elucidate the size- and composition-dependent structure of these materials. For example, ZnS (oneof the rst semiconductors ever discovered) has been reportedto have size-dependent electronic properties making it aninteresting material for structural studies. Furthermore, thesynthetic size control possible for e.g. CdSe83,85 made these typesof materials an early target for PDF studies of size-dependentnanostructures. Bulk ZnS and CdSe crystallize in either thewurtzite or zinc-blende (sphalerite) structure. The two struc-tures have identical closed packed layers, but they differ in theirstacking sequence; hexagonal wurtzite shows ABABAB stacking,
This journal is © The Royal Society of Chemistry 2020

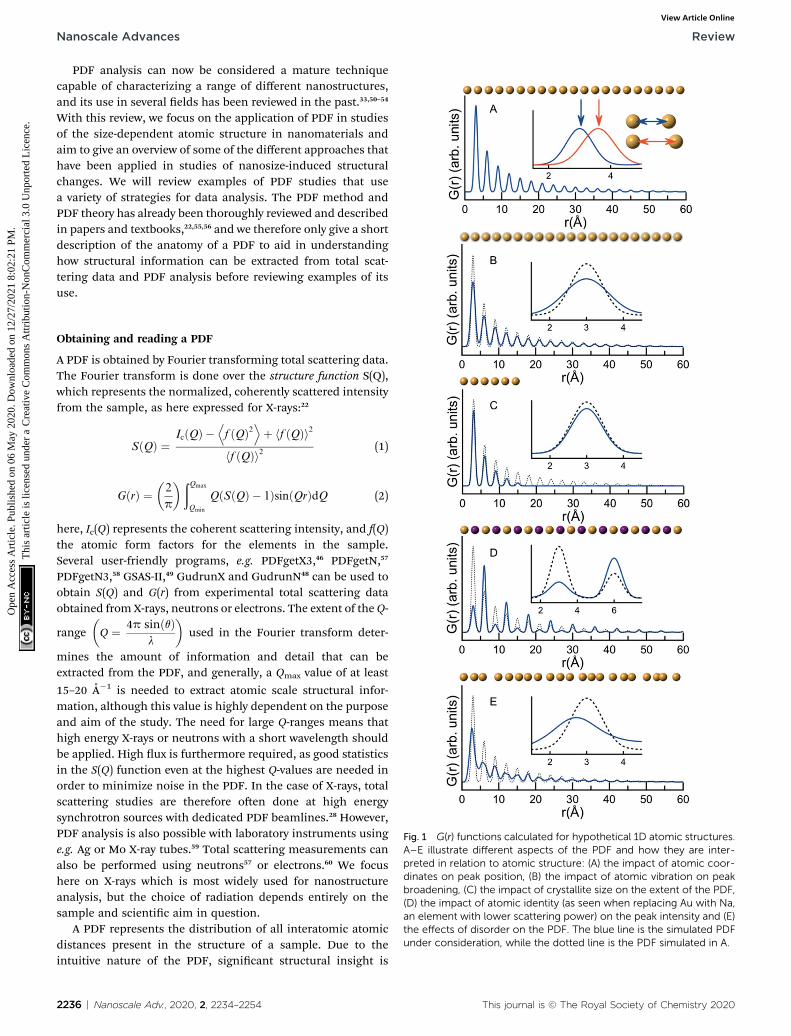
Fig. 3 Three real-space Rietveld refinements of a PDF from CdSenanoparticles (3.5 nm). The PDF is fit using a zinc-blende model (top),a wurtzite model (middle) or a two-phase model using both structures(bottom). The blue line is experimental data and the red line isa simulated PDF. Reproduced from Yang et al., Phys. Chem. Chem.Phys., 2013, 15, 8480–8486 (ref. 89) with permission from the PCCPOwner Societies.
Review Nanoscale Advances
Ope
n A
cces
s A
rtic
le. P
ublis
hed
on 0
6 M
ay 2
020.
Dow
nloa
ded
on 1
2/27
/202
1 8:
02:2
1 PM
. T
his
artic
le is
lice
nsed
und
er a
Cre
ativ
e C
omm
ons
Attr
ibut
ion-
Non
Com
mer
cial
3.0
Unp
orte
d L
icen
ce.
View Article Online
and cubic zinc-blende ABCABC stacking as shown in Fig. 2.Both structures are prone to stacking faults which affect thematerial properties, and the presence of stacking faults is highlydependent on the size of the particles.86
In small particles of CdSe it has been difficult to distinguishbetween the zinc-blende and wurtzite phases using conven-tional diffraction and microscopy techniques.87,88 Using PDF,Masadeh et al.86 tted structural models (using the real-spaceRietveld approach) of both phases to the PDF of bulk CdSeand nanoparticles with approximate sizes of 3.5 nm (III), ca.2.9 nm (II) and 2.0 nm (I). The ts revealed unphysically largeADPs that increase with decreasing particle size. In the wurtzitet, anisotropic ADPs were applied, and they showed increasedvalues along the stacking direction in the unit cell i.e. along thez-axis. The increased ADPs in the stacking direction wereinterpreted to indicate the presence of stacking faults, and theincrease in ADPs with decreasing particle size could thereforebe interpreted as an increase in stacking fault density. To testthis hypotheses, the authors built CdSe nanoparticle modelswith different stacking fault densities using the DISCUS68
program, and PDFs of the different structures were simulatedapplying xed, isotropic ADP values. The simulated PDFs weresubsequently t using a wurtzite model with anisotropic ADPs,i.e. using the same approach as for the experimental data.Again, the rened ADPs from the simulated data were unphys-ically large in the stacking direction due to the stacking faultsintroduced in the models. However, the rened ADP valuesalong the stacking direction could now be directly correlated tothe specic stacking fault density introduced in the constructedmodels. Using this information, the stacking fault density in thesamples were determined to be ca. 35% in bulk CdSe and 50%in the nanoparticles. The experimental PDFs were then t withstructural models with the appropriate stacking fault density,which yielded excellent ts with physically reasonable ADPvalues.
In a later paper, Yang et al.89 applied the real-space Rietveldapproach to extract approximate stacking densities in similarCdSe nanoparticles, using two-phase models. In Fig. 3, real-space Rietveld renements of a CdSe nanoparticle PDF areshown using a zinc-blende model (top), a wurtzite model
Fig. 2 Illustration of the stacking sequence in the wurtzite structure(A) and the zinc-blende structure (B). Cations are represented aspurple dots, and anions are represented as green dots. The tetrahe-drally coordinated Cd cations are shown to emphasize the layering ofthe structure.
This journal is © The Royal Society of Chemistry 2020
(middle) or a two-phase model using both structures (bottom).Only the two-phase model is able to correctly describe allpositions and the intensity of the PDF peaks. The authorsrecognized that the PDFs of wurtzite and zinc-blende would beidentical for the rst two stacking layers (AB) but would differ inthe third layer (A or C). They dened a stacking fault densitywith regards to wurtzite as P(C), which is the probability of a C-layer occurring in third position of the stacking sequence. Thus,for wurtzite P(C) ¼ 0 (no C in third layer), while P(C) ¼ 1 (Calways in third layer) corresponds to the zinc-blende structure.A wurtzite structure with stacking faults would have a P(C)between 0 and 1. In the study, P(C) was approximated byrening the phase fraction between wurtzite and zinc-blende ina limited r-range of the PDF that only includes the rst threelayers (1–10 A). The mixed phase models showed an excellentagreement with the data of the nanoparticles, except for the PDFfrom ultra-small CdSe particles (ca. 1.3 nm), which appear tohave a different atomic structure to the other particles that wasnot elucidated from the broad and dampened PDF peaks.Consistent with the previous study, the stacking fault density isseen to increase with decreasing particle size from ca. 8% in thebulk sample to ca. 30% in the small nanoparticles. The correctstacking sequence aer the third layer of stacking is notdescribed in a two-phase real-space Rietveld model, however,the advantage of this approach is the ease and computationalspeed by which it can be applied to extract stacking faultdensities.
Both papers on the structure of CdSe nanoparticles (Masa-deh et al.86 and Yang et al.89) also demonstrate how model-freeanalysis can allow information to be extracted from PDF. Bysimply observing the changes in the width and position of therst Cd–Se peak in the PDFs, it is possible to extract information
Nanoscale Adv., 2020, 2, 2234–2254 | 2239

Nanoscale Advances Review
Ope
n A
cces
s A
rtic
le. P
ublis
hed
on 0
6 M
ay 2
020.
Dow
nloa
ded
on 1
2/27
/202
1 8:
02:2
1 PM
. T
his
artic
le is
lice
nsed
und
er a
Cre
ativ
e C
omm
ons
Attr
ibut
ion-
Non
Com
mer
cial
3.0
Unp
orte
d L
icen
ce.
View Article Online
on the strain in the particles. Homogeneous strain will causea shi in all bond-lengths, which causes the position of the peakin the PDF to move, while inhomogeneous strain causesbroadening of the peak due to a non-uniform distribution ofbond-lengths. The width and position can be extracted by ttinge.g. a Gaussian function to the peak, as seen in Fig. 4a. Theresultant changes in position and width is shown as a functionof particle size in Fig. 4b and c, respectively. From the gures itis evident that both the homogenous (position) and inhomog-enous (width) strain increase rapidly with decreasing particlesize, consistent with the increase in structural disorder and thepresence of stacking faults evident from the modelling.
While the intuitive nature of PDF can facilitate the descrip-tion of defects and stacking faults, it should be noted thatstacking faults and other defects in metal chalcogenides arealso oen studied in Q-space analysis of total scatteringdata,90–92 or in a combination of Q- and r-space renements.93,94
For example, Mosheni et al. used the Debye equation ina complex and highly advanced analysis of small and wide angleX-ray scattering data to determine stacking faults and facetingin CdSe nanoparticles.95 Niederdraenk et al. used ensemblemodelling to determine distributions of stacking faults, sizesand morphologies of small CdSe, ZnS and ZnOnanoparticles.96,97
Other chalchogenide nanoparticles crystallize in the rocksalt structure, where PDF and other scattering methods havebeen applied to study structural distortions from the ideallattice in the bulk.98 Studies of nanoparticles using total scat-tering methods have revealed size-dependent structural distor-tions,99 and PDF and a suite of nanoscale characterizationtechniques have been applied to study nanoparticles in thePbmSb2nTem+3n system, where compositions that do not havestable bulk counterparts can be synthesized as nanomaterials.35
Fig. 4 (a) Gaussian fits to the first peak in experimental PDFs of CdSenanoparticles of various sizes. Data are represented as black dots, andthe fit as a red line. The green dotted line indicates the peak r valuefrom a bulk sample. (b) The relative percentage change in position asobtained from the Gaussian fits, plotted as function of nanoparticlesize. (c) Changes in peak width obtained from the Gaussian fits, plottedas function of nanoparticle size. The green dotted line indicates thevalue of peak width from a bulk sample. Reproduced from Yang et al.,Phys. Chem. Chem. Phys., 2013, 15, 8480–8486 (ref. 89) withpermission from the PCCP Owner Societies.
2240 | Nanoscale Adv., 2020, 2, 2234–2254
Magic-sized metal chalcogenide nanoclusters. In recentyears, synthetic control in chalcogenide chemistry has allowednot only the synthesis of highly size controlled nanoparticles,but even of atomically monodisperse ‘magic-sized’ nano-clusters.85,100 For magic-sized clusters it is oen possible tocrystallize diffraction-quality single crystals and solve thestructure using single-crystal X-ray diffraction. For example, 3different ‘magic-sized’ CdSe nanoclusters were recentlysynthesized by Beecher et al.,101 containing 35, 56 and 84 Cdatoms. Single crystal diffraction was applied to determine thepyramidal tetrahedron structure of the smallest CdSe cluster.However, two larger CdSe clusters did not form single crystals,and instead PDF was used to characterize the cluster structures.Using the Debye approach to PDF analysis, where discretestructural objects are constructed, excellent ts of the PDF wereobtained by adding additional layers to the CdSe tetrahedronsto t the larger clusters. This model supports the suggested“quantized” layer-by-layer growth. In a study by Stein et al.,102
PDF was used to investigate the structural transitions occurringin In37P20 magic sized clusters upon cation exchange with Cd.Using PDF, the existence of 3 structurally different magic sizedclusters were demonstrated, including a partially substitutedIn–Cd–P cluster that is isostructural to the CdSe pyramidaltetrahedron. The studies of magic-sized chalcogenide clustersuse discrete, non-periodic objects as models, where the Debyeequation is used to calculate the scattering intensity and PDFfrom the structure. From these studies, it is clear that a goodstarting model for structure is needed in the analysis, e.g. fromrelated single crystal experiments, theoretical predictions, orother characterization methods.103
Characterization of strain and surface effects in metalchalcogenide nanoparticles. Detailed studies on strain in chal-cogenide nanoparticles using PDF was done by Gilbert et al.,104
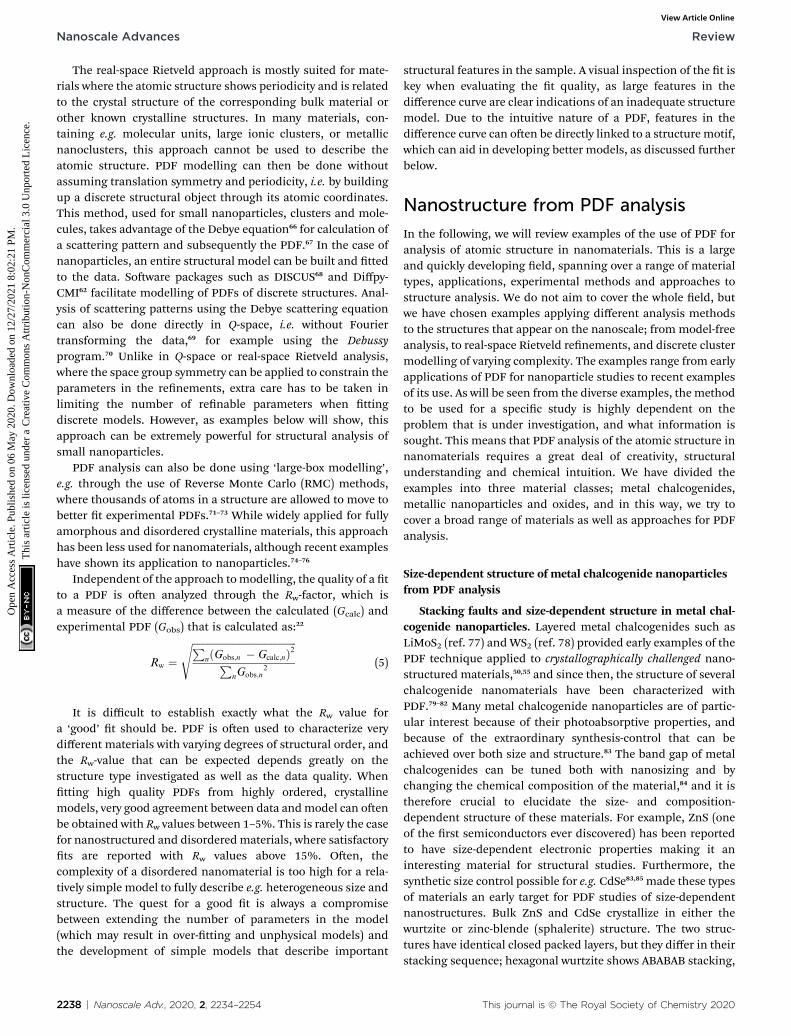
who studied the structure of ZnS nanoparticles using PDF incombination with high resolution transmission electronmicroscopy (HR-TEM), small angle X-ray scattering (SAXS) andEXAFS in order to characterize the ‘stiffness’ of the nanoparticlestructure. In Fig. 5A, the experimental PDF of 3.4 nm ZnSnanoparticles (size determined from TEM and SAXS) iscompared to a PDF calculated from a bulk zinc-blende (sphal-erite) model and a PDF calculated from a truncated 3.4 nm zinc-blende nanoparticle model. The peaks in the experimental PDFare signicantly broader and are shied in r compared to thebulk zinc-blende PDF. The experimental PDF also dampenswith r much faster than would be expected for the 3.4 nm size,as seen in Fig. 5A when comparing the data to the calculatedPDF from the nanoparticle model. The broad peaks and the fastdamping are clear indications of disorder in the atomic struc-ture of the zinc-blende nanoparticles. However, as illustrated inFig. 1B, broadening of PDF peaks is also caused by thermalatomic vibrations, and the two contributions to broadeningmust be distinguished in order to quantify disorder. To separatethe static disorder from thermal vibration, the thermalparameters were rened for a PDF from data measured fora bulk ZnS sample, and it was then assumed that the thermalcontribution in the bulk and nanostructured sample was
This journal is © The Royal Society of Chemistry 2020
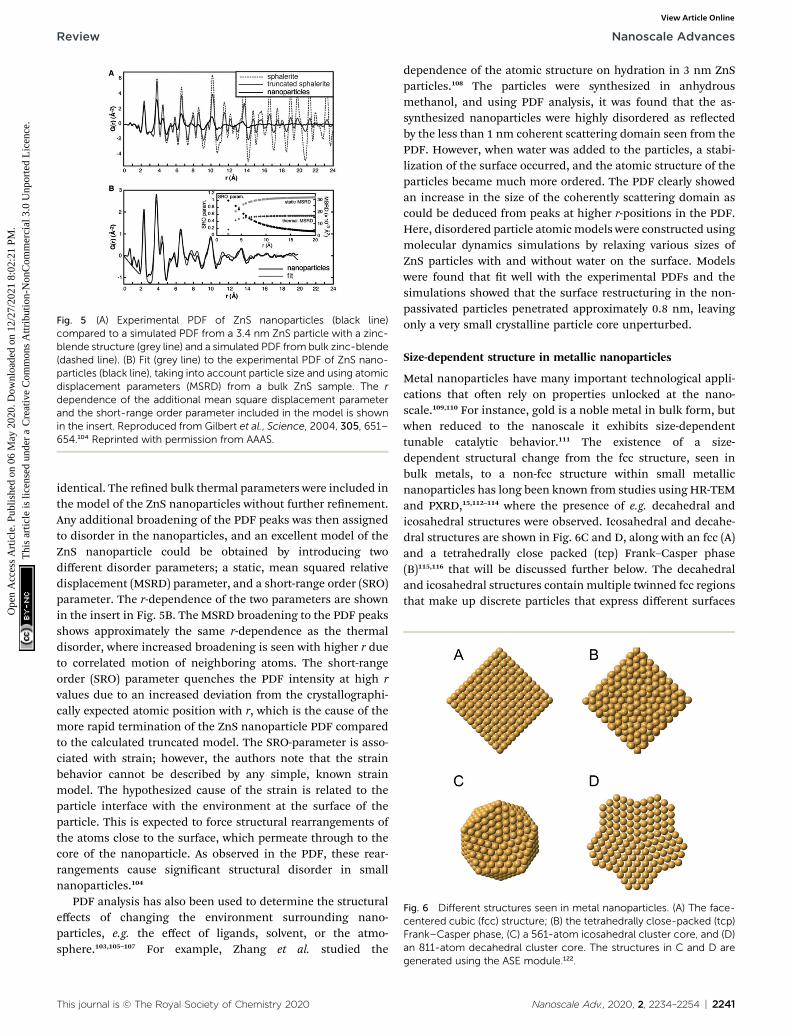
Fig. 5 (A) Experimental PDF of ZnS nanoparticles (black line)compared to a simulated PDF from a 3.4 nm ZnS particle with a zinc-blende structure (grey line) and a simulated PDF from bulk zinc-blende(dashed line). (B) Fit (grey line) to the experimental PDF of ZnS nano-particles (black line), taking into account particle size and using atomicdisplacement parameters (MSRD) from a bulk ZnS sample. The rdependence of the additional mean square displacement parameterand the short-range order parameter included in the model is shownin the insert. Reproduced from Gilbert et al., Science, 2004, 305, 651–654.104 Reprinted with permission from AAAS.
Fig. 6 Different structures seen in metal nanoparticles. (A) The face-centered cubic (fcc) structure; (B) the tetrahedrally close-packed (tcp)Frank–Casper phase, (C) a 561-atom icosahedral cluster core, and (D)an 811-atom decahedral cluster core. The structures in C and D are
Review Nanoscale Advances
Ope
n A
cces
s A
rtic
le. P
ublis
hed
on 0
6 M
ay 2
020.
Dow
nloa
ded
on 1
2/27
/202
1 8:
02:2
1 PM
. T
his
artic
le is
lice
nsed
und
er a
Cre
ativ
e C
omm
ons
Attr
ibut
ion-
Non
Com
mer
cial
3.0
Unp
orte
d L
icen
ce.
View Article Online
identical. The rened bulk thermal parameters were included inthe model of the ZnS nanoparticles without further renement.Any additional broadening of the PDF peaks was then assignedto disorder in the nanoparticles, and an excellent model of theZnS nanoparticle could be obtained by introducing twodifferent disorder parameters; a static, mean squared relativedisplacement (MSRD) parameter, and a short-range order (SRO)parameter. The r-dependence of the two parameters are shownin the insert in Fig. 5B. The MSRD broadening to the PDF peaksshows approximately the same r-dependence as the thermaldisorder, where increased broadening is seen with higher r dueto correlated motion of neighboring atoms. The short-rangeorder (SRO) parameter quenches the PDF intensity at high rvalues due to an increased deviation from the crystallographi-cally expected atomic position with r, which is the cause of themore rapid termination of the ZnS nanoparticle PDF comparedto the calculated truncated model. The SRO-parameter is asso-ciated with strain; however, the authors note that the strainbehavior cannot be described by any simple, known strainmodel. The hypothesized cause of the strain is related to theparticle interface with the environment at the surface of theparticle. This is expected to force structural rearrangements ofthe atoms close to the surface, which permeate through to thecore of the nanoparticle. As observed in the PDF, these rear-rangements cause signicant structural disorder in smallnanoparticles.104
PDF analysis has also been used to determine the structuraleffects of changing the environment surrounding nano-particles, e.g. the effect of ligands, solvent, or the atmo-sphere.103,105–107 For example, Zhang et al. studied the
This journal is © The Royal Society of Chemistry 2020
dependence of the atomic structure on hydration in 3 nm ZnSparticles.108 The particles were synthesized in anhydrousmethanol, and using PDF analysis, it was found that the as-synthesized nanoparticles were highly disordered as reectedby the less than 1 nm coherent scattering domain seen from thePDF. However, when water was added to the particles, a stabi-lization of the surface occurred, and the atomic structure of theparticles became much more ordered. The PDF clearly showedan increase in the size of the coherently scattering domain ascould be deduced from peaks at higher r-positions in the PDF.Here, disordered particle atomicmodels were constructed usingmolecular dynamics simulations by relaxing various sizes ofZnS particles with and without water on the surface. Modelswere found that t well with the experimental PDFs and thesimulations showed that the surface restructuring in the non-passivated particles penetrated approximately 0.8 nm, leavingonly a very small crystalline particle core unperturbed.
Size-dependent structure in metallic nanoparticles
Metal nanoparticles have many important technological appli-cations that oen rely on properties unlocked at the nano-scale.109,110 For instance, gold is a noble metal in bulk form, butwhen reduced to the nanoscale it exhibits size-dependenttunable catalytic behavior.111 The existence of a size-dependent structural change from the fcc structure, seen inbulk metals, to a non-fcc structure within small metallicnanoparticles has long been known from studies using HR-TEMand PXRD,15,112–114 where the presence of e.g. decahedral andicosahedral structures were observed. Icosahedral and decahe-dral structures are shown in Fig. 6C and D, along with an fcc (A)and a tetrahedrally close packed (tcp) Frank–Casper phase(B)115,116 that will be discussed further below. The decahedraland icosahedral structures containmultiple twinned fcc regionsthat make up discrete particles that express different surfaces
generated using the ASE module.122.
Nanoscale Adv., 2020, 2, 2234–2254 | 2241

Fig. 7 Fit residuals from real-space Rietveld refinements using an fccmodel to several experimental PDFs of differentmetallic nanoparticles.The difference curve has been scaled for easier visual comparison.Reprinted with permission from Banerjee et al., J. Phys. Chem. C, 2018,122, 29498–29506.126 Copyright 2018 American Chemical Society.
Nanoscale Advances Review
Ope
n A
cces
s A
rtic
le. P
ublis
hed
on 0
6 M
ay 2
020.
Dow
nloa
ded
on 1
2/27
/202
1 8:
02:2
1 PM
. T
his
artic
le is
lice
nsed
und
er a
Cre
ativ
e C
omm
ons
Attr
ibut
ion-
Non
Com
mer
cial
3.0
Unp
orte
d L
icen
ce.
View Article Online
and internal atomic structure.117–119 PDF is a useful technique tocharacterize such structures120,121 and early studies helped todemonstrate the ability of PDF analysis to elucidate nano-structure before the technique was widely used in the materialschemistry communities.
Non-fcc structures in metallic nanoparticles. An early studyof non-fcc structures in metal nanoparticles was done by Petkovet al.,121 who studied the structure of 30, 15 and 3 nm Auparticles, as well as bulk Au. The presence of signicant struc-tural disorder could be deduced from the PDF by consideringthe width of the rst Au–Au peak as well as the damping of thePDFs. The width in the PDFs of the nanoparticles reecteda much broader distribution of nearest neighbor distances thanin the bulk structure, which is interpreted as a local structuredefect. The PDFs of the nanoparticles were modelled using anfcc structure, and fairly good ts were obtained for the PDFs of30 nm and 15 nm particles, while the PDF of the 3 nm particlesshows signicant discrepancies between the data and themodel, and the structure of the 3 nm gold nanoparticles can nolonger be considered fcc. To model this nanostructure, theauthors found multiple lowest energy congurations of the3 nm nanoparticles using Monte Carlo simulations of a 2000 Auatom cluster decorated with 3000 H2O molecules as ligands,and the most probable models were determined by comparisonwith the experimental PDF. They found that the 3 nm particleswere characterized by extended structural defects and differ-ently oriented domains of fcc within the nanoparticle.
Since then, several PDF and total scattering studies havefocused on the structures of non-fcc and hcp structures inmetallic nanoparticles.117,123,124 Vargas et al. used PDF and TEMto characterize the atomic structure in long and ultrathin Aunanowires. In this study, many possible structural models in2 nm by 12 nm nanowires were generated and energeticallyoptimized using Molecular Dynamics simulations. The modelstested included structural models that are adopted by bulk gold(fcc and hcp structures), models previously observed in goldnanowires (Boerdijk–Coxeter–Bernal helix, spirals and attachedgold nanoparticles) and models from other bulk metals (a-Mn,b-Mn and b-W). For the models that most closely resembled thePDFs obtained from the synthesized nanowires, RMC rene-ments were performed. It was found that a-Mn, which closelyresembles a tcp structure, provided the best t to the data.76,125
The nanowires are formed from particle assembly in solutionand it was suggested that they adapt the tcp-like structure inorder to maintain close atomic packing while avoiding thestrain introduced by the high surface area of the nanowires.
Recently, Banerjee et al.126 did a comprehensive study ofa range of different metallic nanoparticles, including Pt, Pd, Auand alloys such as CoPd and PtRu. The study puts a largeemphasis on scrutinizing the t residual, and Fig. 7 shows thet residual obtained when tting a range of different metalnanoparticle PDFs with an fcc model using the real-spaceRietveld approach. The residual from the t of a bulk Ni stan-dard with an fcc Ni model is seen at the bottom of the gure andis essentially a at line with small uctuations mostly due tonoise in the data. In comparison, the t residuals of all inves-tigated nanoparticles show large distinct features. Features
2242 | Nanoscale Adv., 2020, 2, 2234–2254
exhibited in the t residual is an indication that the applied fccmodel is insufficiently describing the structural informationavailable in the PDF, and the authors proceed to show thata discrete decahedral nanoparticle model signicantly reducesthe t residual in comparison with the fcc model. Nanoparticlemodels with similar particle shape, but without the presence oftwin domains were compared to decahedral models, andgenerally resulted in poorer ts of the experimental PDFs. Thisshows that the PDFs reect an actual rearrangement at theatomic level that can be described by twinned domains of an fccstructure rather than an effect of the morphology of the nano-particles. The decahedrally twinned cluster cores were observedin a majority of nanoparticles used in the study, and the authorspoint out that including this nanostructure in models ofmetallic nanoparticles should take precedent over employingcomplex surface rearrangements or ligand interactions.
In an innovative approach to structural characterization ofmetallic nanoparticles, Banerjee et al. have moved on to showthat the identication of metallic cores can be done in anautomated manner.127 The congurations of the differentcluster cores such as icosahedral and decahedral structures arewell-known, and soware packages such as ASE122 can beapplied to build nanoparticles of different sizes, shapes andgeometries. The authors generated a large number of discretenanoparticles, ranging in size from tens of atoms to around1500 atoms with different geometries and subsequently t all ofthem to an experimental PDF of Pd nanoparticles. Fig. 8 illus-trates the t quality (Rw) as a function of number of atoms fora range of different structure types. The Rw value obtained ina real-space Rietveld t using an fcc structure is given as thegreen circle with the letters AC (attenuated crystal). The cluster-
This journal is © The Royal Society of Chemistry 2020

Fig. 8 Rw values obtained for a number of discrete non-twinnednanoparticle models, fitted to the experimental PDF of Pd nano-particles. The Rw values are plotted as a function of the number ofatoms in the structure. The teal circle labelled AC corresponds to theRw obtained from a real-space Rietveld refinement of the data using anfcc model. Symbols for the discrete nanoparticle models with differentgeometries can be seen in the bottom right of the figure. Figure fromBanerjee et al., Acta Crystallogr., Sect. A: Found. Adv., 2020, 76, 24–31.127
Fig. 9 Characterization of three NiPd samples using PDF and TEM. (a)Fits of PDFs using an fcc structure. The experimental PDF is shown inblue, the calculated PDF in red, and difference curve in grey. (b) TEMimages obtained for the three NiPd samples, scale bar is 20 nm.Reprinted with permission from Doan-Nguyen et al., ACS Nano, 2014,8, 6163–6170.129 Copyright 2014 American Chemical Society.
Review Nanoscale Advances
Ope
n A
cces
s A
rtic
le. P
ublis
hed
on 0
6 M
ay 2
020.
Dow
nloa
ded
on 1
2/27
/202
1 8:
02:2
1 PM
. T
his
artic
le is
lice
nsed
und
er a
Cre
ativ
e C
omm
ons
Attr
ibut
ion-
Non
Com
mer
cial
3.0
Unp
orte
d L
icen
ce.
View Article Online
screening process reveals that several of the discrete nano-particle models yield signicantly lower Rw values when t tothe experimental PDF. Initially, fcc-based structures withouttwinning were tested, and the best model found from this initialcluster-screening is a cuboctahedron with 225 atoms. However,the difference curve in the insert of Fig. 8 reveals signicantfeatures similar to those shown in Fig. 7, and therefore, thecuboctahedron model is not fully describing the Pd nano-particle structure, due to the lack of a twinned cluster core.When also considering twinned cluster cores such as icosahe-dral and decahedral models in the structure search the Rw valueare further improved, and the best model found is a 609 atomdecahedron. The decahedron is nearly twice as large as thecuboctahedron model found in the initial search. The decahe-dron nanoparticle model has a diameter of ca. 3.6 nm, which ismuch closer to the TEM estimate of 3.0 � 0.3 nm than thecuboctahedron model. The reason for this is that the sizeinitially extracted from the PDF reects the size of the coher-ently diffracting twinned fcc unit in the structure, and not thephysical size of the particles as seen in TEM. The size of the fccunit in a 3.6 nm decahedron particle is approximately 2 nm,which explains the small size obtained when applying the non-twinned fcc models. This further demonstrates the importanceof determining the correct cluster core when extracting struc-tural information from PDF. In general, large discrepanciesbetween the physical size (TEM, SAXS) and the size of the
This journal is © The Royal Society of Chemistry 2020
coherently scattering domain (PDF, PXRD) can be used as anindication of the presence of nanostructure which then must beincluded in a structural model, as is also discussed for the ZnSparticles above.
The novel method of algorithmically generating clusters andautomatically screening them for their potential to t experi-mental PDFs is promising, as it greatly increases the number ofmodels that can be assessed, as well as reducing humanselection bias in the model. If the results from the structure-screening are properly scrutinized, the method has the poten-tial to greatly aid in the characterization of nanomaterials. Forinstance, we have recently applied a similar method to disor-dered MoOx nanostructures supported on alumina and zeoliteparticles. In this study, a large number of possible models werealgorithmically generated and used to extract information onthe average structural motifs from the best modelsdiscovered.128
An even more pronounced structural rearrangement fromthe common fcc structure has been observed for NiPd alloynanoparticles in a study by Doan-Nguyen et al.129 Here, TEMwasused to demonstrate a very high uniformity of particle size inthe synthesized particles as shown in Fig. 9b. From the corre-sponding PDFs in Fig. 9a, it is readily apparent that signicantchanges in atomic structure occurs below 5 nm. The PDFs of theparticles larger than 5 nm display distinct peaks that can bemodelled reasonably well using an fcc model in the real-spaceRietveld approach. However, for the 5 nm particles, the muchbroader PDF peaks signify a large degree of structural disorder.The PDF could not be modelled using the same fcc model, andin fact the signal in the experimental PDF is out-of-phase withthe fcc model due to a very different distribution of atoms in themodel and PDF. The PDFs could be modelled using an icosa-hedral core model with very high ADPs to encompass the largestructural disorder, and the authors note that the PDF is very
Nanoscale Adv., 2020, 2, 2234–2254 | 2243

Fig. 10 Fits to experimental PDFs from Au144(SR)60 samples. (a) Fit ofan icosahedral structure model to data collected from Au144(SC)60. (b)Fit of an icosahedral structure model, (c) of an fcc/hcp model, (d) a 114atom decahedral model and (e) a decahedral model with ‘staples’ tothe PDF obtained from Au144(p-MBA)60. From Jensen et al., Nat.Commun., 2016, 7, 11859.140
Nanoscale Advances Review
Ope
n A
cces
s A
rtic
le. P
ublis
hed
on 0
6 M
ay 2
020.
Dow
nloa
ded
on 1
2/27
/202
1 8:
02:2
1 PM
. T
his
artic
le is
lice
nsed
und
er a
Cre
ativ
e C
omm
ons
Attr
ibut
ion-
Non
Com
mer
cial
3.0
Unp
orte
d L
icen
ce.
View Article Online
similar to that found from bulk-metallic glasses. The modelused to t the data for the <5 nm particle provides a reasonablet of the PDF data; however, the interpretation of the model issomewhat difficult, and the authors also show that the PDFsignal is close to a damped sinusoidal wave. This is a ubiquitouschallenge in PDF studies of highly disordered mate-rials.89,128,130,131 In the case of highly disordered materials,atomic structure cannot be determined with the same speci-city presented previously. Instead, as is discussed in the PDFliterature available on bulk metallic glasses132 or liquids,133
information about the degree of structural order/disorder andthe possible local structural motifs can be elucidated.
Magic-sized metallic clusters. Magic-sized clusters, asintroduced in the discussion of chalcogenide systems, can alsobe synthesized for a range of metallic nanoclusters.17,134,135 Someatomically precise magic number gold clusters can be crystal-lized into large crystals and thereby be characterized by singlecrystal X-ray diffraction,136 however, many other magic numberclusters have been predicted and synthesized137 that are toolarge to be crystallized. For such systems, PDF has been used ina suite of techniques to determine their structure.138,139 Forexample, magic-sized thiol stabilized Au144(SR)60 clusters werestudied using PDF, where it was demonstrated that the differentdecahedral and icosahedral core-structures characteristic ofmetallic nanoparticles can be resolved using PDF by Debyeequation based modelling of discrete structures.140 The experi-mental PDFs of the gold clusters stabilized using two differentligands (Fig. 10a and b) were signicantly different, revealingdistinct atomic structures. The PDFs were modelled fromdiscrete models using the Debye equation. The experimentalPDF from hexathiol (SC6) stabilized particles shown in Fig. 10acould be t using an icosahedral structural model previouslysuggested.141 However, this icosahedral model provided a poordescription of the peaks beyond the nearest-neighbor Au–Aupeak in the PDF obtained from clusters stabilized with para-mercaptobenzoic acid (p-MBA), as shown in Fig. 5B, andevidently the particle core atomic packing must be different. Atwo-phase model using fcc and hcp atomic gold structuresprovided an improved t as shown in Fig. 10c, which indicatedthat stacking faults or twinning exists in the particles.124 This 2-phase model mimics stacking faults in metallic systems, but itdid not give a physical description of the Au144(SR)60 clusters. Amodel containing a decahedrally twinned core decorated withS–Au–S ‘staples’ was subsequently constructed by consideringinformation from previous studies of gold cluster structuresusing techniques complimentary to PDF. The model providedan excellent description of the data, including the small Au–Speak at ca. 2.8 A as shown in Fig. 10e. Thus, both decahedraland icosahedral cores were observed for Au nanoparticles usingdifferent stabilizing ligands. Unexpectedly, with other thiolligands, the two cores were observed to coexist within thesample, which showed that the two core arrangements must bevery close in energy.
Supported metal nanoclusters for catalysis: d-PDF studies.In heterogeneous catalysis, catalytic metal nanoparticles areoen dispersed on high-surface area supports that save activematerial, prevent their agglomeration, and potentially improve
2244 | Nanoscale Adv., 2020, 2, 2234–2254
catalytic performance.142–144 Typically, the supports are loadedwith 1–15 wt% of metallic nanoparticles. When collecting totalscattering data from a supported sample, the signal is generallydominated by the support material. One way to bypass thisproblem is by calculating the so-called difference PDF (d-PDF)145,146 by measuring a PDF of the support with and withoutnanoparticles on the surface, and subtracting the rst from thelatter. In this way, a PDF containing only the signal associatedwith the supported nanoparticles is obtained. This method canthen be used to study e.g. the structure of the active catalystsand structural changes occurring under catalysis, which iscritical for optimizing catalyst performance.147–150 For example,Lei et al. studied the structural changes occurring when sup-ported platinum nanoparticles adsorbed different small mole-cules during catalytic reactions.151 The PDF measurements wereperformed in a gas ow cell, where atmosphere and tempera-ture can be controlled. The platinum nanoparticle surface wascleaned by heating in a H2/He mixture, and total scattering data
This journal is © The Royal Society of Chemistry 2020

Review Nanoscale Advances
Ope
n A
cces
s A
rtic
le. P
ublis
hed
on 0
6 M
ay 2
020.
Dow
nloa
ded
on 1
2/27
/202
1 8:
02:2
1 PM
. T
his
artic
le is
lice
nsed
und
er a
Cre
ativ
e C
omm
ons
Attr
ibut
ion-
Non
Com
mer
cial
3.0
Unp
orte
d L
icen
ce.
View Article Online
were collected as the clean particles were exposed to He, H2 andCO in sequence. PDF analysis showed a clear structuralresponse to the exposure of different gases, especially in thesmallest 1 nm nanoparticles. For example, it was found that the‘clean’ nanoparticles in He showed a Pt–Pt bond distance of2.74 A, which is a 1.4% contraction from the bulk Pt–Pt distancein 2.78 A, an effect which has been seen in several other studiesof platinum nanoparticles.152,153 However, in H2/He and CO/Heatmospheres, where either H2 or CO is adsorbed on thesurface of the nanoparticles, the Pt–Pt bond relaxed back to 2.77A and 2.78 A, respectively. The structural disorder in the particlewas estimated based on the FWHM of the rst Pt–Pt peak in thed-PDFs. The FWHM decreased with the adsorption of CO andH2 revealing that the adsorption enhances the crystallinity ofthe Pt particles. The bond contraction and poorer crystallinity inclean Pt nanoparticles were suggested to be due to the under-coordination of the Pt atoms on the surface of the particles. Theadsorbates increase the coordination of the surface Pt, therebyrelaxing the structure and increasing crystallinity.
Size-dependent structure in metal oxide nanoparticles
Metal oxides have a wide variety of applications includingenergy production and storage154,155 human health,156 andenvironmental remediation157 that rely on size-dependentproperties.158 Synthetic control of size and structure has beenharder to achieve in the synthesis of metal oxide nanoparticlescompared to metallic or metal chalcogenide nanoparticles,159
and generally, the effects of nanosizing on atomic structure areless clear compared to e.g. the simple metallic structures asdescribed above. A wealth of different metal oxide crystalstructures exists that are commonly composed of tetrahedrallyand octahedrally coordinated cations forming a range ofcanonical metal oxide structures that include e.g. the rutile,perovskite and spinel structures. The common structural units,trends in crystal chemistry and known defect motifs from bulkmaterials provide a valuable toolbox when characterizing size-dependent structures of metal oxide nanomaterials.
Defects in oxide nanoparticles. An example of a materialwhere the atomic structure changes signicantly when nano-sized is molybdenum oxide.131 MoO2 normally crystallizes ina distorted rutile structure, however, diffraction data showedindications of a signicant structural change on the nano-scale.160 To gain further insight on the nanoscale structuralchanges, crystalline nanoparticles (ca. 40 nm) and ‘nano-structured’ (ca. 4 nm nanoparticles) MoO2 were synthesized bysimply varying the solvent in a solvothermal synthesis. Thecrystalline MoO2 sample was characterized with PXRD andRietveld renement, and the data could be t reasonably wellwith the known distorted rutile structure. However, the samestructural model could not be applied to t the data from thesmaller nanostructured MoO2 particles, which indicateda fundamental change in the atomic structure. Furthermore,PDFs from the samples showed that the distorted rutile modelcould only describe the average structure of the crystallineMoO2 particles. The distorted rutile model failed to t the PDFpeak originating from nearest neighbor Mo–Mo distances in
This journal is © The Royal Society of Chemistry 2020
edge-sharing octahedra, where the t showed that edge-sharingoccurred more frequently in the crystalline sample than in therutile model. The PDF of the crystalline MoO2 (40 nm) could bemodelled by applying a two-phase approach, where the excessedge-sharing in the sample was accounted for by addinga second phase to the t, a hollandite model. Hollanditecontains more edge-sharing [MoO6] octahedra than rutile and isrelated to the defect chemistry of rutile.161 The hollandite modelwas restricted to the local region of the PDF by applyinga spherical envelope which dampened the contribution of thehollandite phase in the high-r region, where the rutile modeldescribed the data well. The t showed that the samples containuncorrelated defects, where excess Mo cations occupy emptyoctahedrally coordinated sites in the crystal structure leading tomore edge-sharing motifs. The defects do not affect the average(distorted rutile) structure in the crystalline 40 nm particles.However, this is not the case for 4 nm nanostructured particles,where the rutile model can neither describe the local nor theaverage structure. From analyzing the PDF of the 4 nm nano-structured particles, it was found that edge-sharing [MoO6]motifs were even more prominent than for the crystallinesamples. We therefore considered a Magneli-type structure,162
previously reported in rutile systems, to nd a model thatdescribed the nanostructure of MoO2. An interwoven rutilemodel was developed, where two rutile structures were super-imposed in the same closed packed oxygen lattice by addinga second Mo atom in the interstitial site of the unit cell shied(0 1
2 0) compared to the original Mo atom. This was done usingthe real-space Rietveld approach. The occupancy of the Moatoms in the interwoven lattice could be rened to determinethe defect density, and from comparison of Fig. 11A and B, itwas evident that the interwoven model greatly improved the tof the nanostructured MoO2 PDF. HR-TEM shown in Fig. 11Cprovided strong visual support for the model, where a rutilelattice was overlaid on a bright-eld HR-TEM of the nano-structured MoO2 sample. The image showed that Mo atomswere present in the interstitial sites in the rutile structure. Thisstudy showed how defect structures known from bulk materialscan completely dominate in nanostructured materials, andchange not only the local structure, but also the longer-rangeatomic order in the nanoparticles.
PDF has been used in a range of other defected oxidesystems, where the ability to characterize local structure hasallowed a description of the atomic arrangement.65,163–165 Forexample, ferrihydrite has been extensively studied with X-rayand neutron PDF over the last decade.166–168 In a 2007 paper,Michel et al. suggested a ferrihydrite structure using X-ray PDF,which resembles a Baker–Figgis d-Keggin cluster structuralmotif.166,168 Aer some controversy regarding this model, thestructure of ferrihydrite was further analyzed by Harringtonet al. using neutron total scattering with PDF analysis. Theyfound that the single phase model containing a Keggin motifbest described the data compared to other 2-phase modelsproposed in the literature.167 As an important point, the authorsemphasized that the model is merely a representation of theensemble average structure: When characterizing highlydefective nanoscale materials, any simple model will be unlikely
Nanoscale Adv., 2020, 2, 2234–2254 | 2245

Fig. 11 Fits to PDFs from nanostructured molybdenum oxide using different structural models. (A) Fit of the data with a bulk rutile structure and(B) with an ‘interwoven’ rutile model. (C) High-resolution annular dark field TEM image obtained from the sample, overlaid with the rutilestructure. The image shows intensity in the unoccupied sites in the rutile structure. Reprinted with permission from Lindahl Christiansen et al.,ACS Nano, 2019, 13, 8725–8735.131 Copyright 2019 American Chemical Society.
Nanoscale Advances Review
Ope
n A
cces
s A
rtic
le. P
ublis
hed
on 0
6 M
ay 2
020.
Dow
nloa
ded
on 1
2/27
/202
1 8:
02:2
1 PM
. T
his
artic
le is
lice
nsed
und
er a
Cre
ativ
e C
omm
ons
Attr
ibut
ion-
Non
Com
mer
cial
3.0
Unp
orte
d L
icen
ce.
View Article Online
to fully describe the structures in samples with e.g. a distribu-tion of crystallite domain sizes and structures that are difficultto parameterize. A model for such disordered systems should beseen as describing the most important structural motifs and asa starting point for further analysis. In order to better under-stand ferrihydrite, recent work was done concerning the struc-ture of an aluminum analog to ferrihydrite, akdalaite. Thestructure of akdalaite was determined by single crystal X-raydiffraction, neutron diffraction and NMR,169 and it was shownto contain a Keggin cluster motif. The calculated PDF of theakdalaite structure was then compared to the experimental PDFof 6-line ferrihydrite and it was found to describe the majorstructural features, further suggesting that the structure offerrihydrite resembles that of Keggin clusters. Very recently,Funnel et al. used a nanocomposite RMC methodology forfurther analysis of X-ray PDFs from ferrihydrite. Here, it wasshown that the single phase model from Michel et al. gave thebest t to the data without any unphysical structuralrearrangements.170
Domain structures in disordered oxide structures. PDF hasbeen used to characterize domain structures in many highlydisordered or nanostructured oxide materials, giving newinformation on e.g. the structural motifs important for catalyticactivity.171–174 Du et al. investigated the structure of a nano-structured cobalt oxide water splitting catalyst.175 Previousstructural studies of the material using X-ray absorption nestructure (XAFS) had revealed a cubane-type motif consisting ofedge-sharing CoO6 octahedra,176 and the study aimed tocomplement these results using PDF where the long rangeatomic correlations are more accessible. Various cobalt oxidemodels were built with different domain sizes, aspect ratios andlattice structures, and PDFs were calculated from the modelsusing the Debye equation and compared to the experimental
2246 | Nanoscale Adv., 2020, 2, 2234–2254
PDFs. An appropriate model with 13 Co atoms could be cutdirectly from a LiCoO2 crystal structure, and the comparison tothe experimental PDF is shown in Fig. 12A. The model givesa good description of the experimental PDF, and each peakcould be assigned to a particular atomic distance in the model.A mist is seen between model and data in peaks c and g thatoriginate from the Co–O correlations shown in the insert inFig. 12A. The mist could be remedied by a small shi in theatomic position of the terminal oxygens, which shortens someof the distances associated with peaks c and g by 0.2 A, nowlabelled cʹ and gʹ. With the small change, an excellent agree-ment between data and model is obtained with an R-value of0.19 as shown in Fig. 12B. A peak at 1.5 A was also not describedby the model, which is assigned to a P–O distance, and animproved model was made by including phosphate groups inthe structure.
Particle faceting and morphology: combination of PDF withother scattering methods. Several other oxide nanomaterialshave been studied with PDF. For example, TiO2 is among themost widely studied oxides due to its applications in e.g. pho-tocatalysis,177,178 and it has also been the subject of several PDFstudies.179–185 One study focused on a combination of scatteringtechniques for the analysis of TiO2 (B) nanocrystal morphologyand faceting.186 These particles are prone to aggregation whichmade unambiguous morphology determinations by TEM diffi-cult. Instead, the morphology was investigated using SAXS,PXRD and PDF, and the combination of all these techniqueswas demonstrated to be an excellent and necessary way toextract morphological information. Initially, the SAXS data weret using three particle shapes that were likely based on TEMresults and previous studies: spherical, prolate (one expandedaxis) and oblate (one contracted axis). All three SAXS ts were ofsimilar quality and the crystallite shape could not be
This journal is © The Royal Society of Chemistry 2020

Fig. 12 Fits to PDF from nanostructured cobalt oxide. (A) Fit of the PDFfrom model 1 (red) to the experimental PDF (black). (B) Fit of the PDFfrom model 2 (red) and model 3 (green), compared to the experi-mental PDF in black. Rw is 0.27 for structure 1 and 0.19 for structures 2and 3. Adapted with permission from Du et al., J. Am. Chem. Soc.,2012, 134, 11096–11099.175 Copyright 2012 American ChemicalSociety.
Review Nanoscale Advances
Ope
n A
cces
s A
rtic
le. P
ublis
hed
on 0
6 M
ay 2
020.
Dow
nloa
ded
on 1
2/27
/202
1 8:
02:2
1 PM
. T
his
artic
le is
lice
nsed
und
er a
Cre
ativ
e C
omm
ons
Attr
ibut
ion-
Non
Com
mer
cial
3.0
Unp
orte
d L
icen
ce.
View Article Online
distinguished from the SAXS data, however the ts yieldedapproximate particle sizes. As mentioned, a spherical envelopefunction is oen assumed for crystallite size determination inreal-space Rietveld renements. However, such ts yielded pooragreement at high r, alluding to a different shape of the parti-cles than spherical. The same conclusion was also drawn fromthe PXRD patterns. To combine the information from thevarious techniques, discrete particle models with spherical,prolate and oblate shapes were constructed using the size andaspect ratio determined from PDF and SAXS. Using the Debyeequation, these particle models could be tested against the PDFand PXRD data, and the oblate shape with a contraction alongthe crystallographic b axis was shown to best describe the data.
The combination of PDF with other scattering techniquesgives many possibilities for structural insight. Farrow et al.showed that complex modelling of combined SAXS and PDF dataallowed a more robust characterization of CdS nanoparticle
This journal is © The Royal Society of Chemistry 2020
morphology187 as can be applied in Diffpy-CMI.62 Many morestudies of this kind is likely to be seen in the literature in thefuture.
Metal sorption on oxide nanoparticle surfaces: d-PDFstudies. As described above, the use of d-PDF gives manyoptions for studying supported materials and surface interac-tions. d-PDF studies have also been widely used in studies ofoxide materials, e.g. for analysis of catalytically active sites,188
and for studies of heavy metal sorption in ferrihydrite.38,107,189,190
For example, d-PDF was used in order to characterize thebinding geometry of AsO4 on ferrihydrite.38 The d-PDFs showedclear peaks arising from As–O and As–Fe correlations, whichwere used to show that AsO4 binds bidentate to the ferrihydritestructure. In contrast to this, d-PDF showed that SbO6 binds byboth a bidentate mononuclear structure (single edge sharing)and a bidentate binuclear structure, although the bindinggeometry of SbO6 octahedra was anticipated to be the same asAsO4 tetrahedra.191 The increased sorption capacity of Sb onferrihydrite compared to As was determined to be due to thesimilarity of the SbO6 to the FeO6 octahedra in terms of size andshape, allowing SbO6 to incorporate into the structure moreeasily.
PDF analysis of disordered layered oxide materials. The highexibility and tunability in structure and chemical compositionof many layered metal oxide materials allow for extensiveintercalation of ions and molecules, opening for a wealth ofapplications in e.g. battery electrodes,192,193 catalysis,194 envi-ronmental remediation,195 and in a range of other technologiesrelying on ion exchange and storage.196 Many layered oxidesshow a high degree of inter- and intralayer disorder, and severalstructures have been extensively studied with PDF.77,197–202
The complex challenges involved in structural characteriza-tion of disordered layered oxides are addressed in an extensivestudy of the structure of d-MnO2 by Liu et al.199 Layered metaloxides are oen small nanoparticles, contain turbostaticstacking faults and exhibit in-plane cation disorder. Liu et al.address all three aspects of the structural complexity in a studyof Cu-rich d-MnO2 (ref. 199) using X-ray total scattering andPDF, supported by a range of techniques, including EXAFS andneutron PDF. The local structure in the planes of the layeredoxide was rst determined by tting the 0.7–8 A range of thePDF. Cu2+ ions were localized in the structure by comparinga model where Cu2+ was placed in the Mn4+ sites of the layer, ora model where the Cu2+ was placed between the layers of thestructure. It was found that the Cu2+ ions sit in interplanar sitesabove or below a vacant Mn4+ site. Next, the in-plane vacancyordering was determined by comparing ts of different cationvacancy ordering models applied only to the local range of thePDF, where only intraplanar distances are represented. A chal-cophanite structure model with 7.2% Mn vacancy was found tomost suitably describe the in-plane atomic arrangement, witha good agreement factor of 8.2%. The local structure descriptionis further extended by locating the interlayer H2O using neutronPDF, which is possible due to the greater sensitivity to H (or D)when using neutrons instead of X-rays in a scattering experi-ment. Finally, using the local atomic structure model alreadydeveloped, a model for the stacking disorder was built by
Nanoscale Adv., 2020, 2, 2234–2254 | 2247

Nanoscale Advances Review
Ope
n A
cces
s A
rtic
le. P
ublis
hed
on 0
6 M
ay 2
020.
Dow
nloa
ded
on 1
2/27
/202
1 8:
02:2
1 PM
. T
his
artic
le is
lice
nsed
und
er a
Cre
ativ
e C
omm
ons
Attr
ibut
ion-
Non
Com
mer
cial
3.0
Unp
orte
d L
icen
ce.
View Article Online
creating a supercell containing 7 layers with the rened locallayer structure. Each layer was assigned three vectors (ta, tb, tc),one for each crystallographic axis, that allowed the atomicstructure in the layer to remain unchanged, while the layers canmove with respect to each other. Furthermore, a numericalparticle shape correction was applied that replaced the usualspherical envelope function and improves the long-range t ofthe PDF for the non-spherical particles.63 The nal stackingfault model provided a good description of scattering data inboth Q and r for both X-rays and neutrons. The rened values ofthe in-plane layer vectors (ta and tb), appeared largely random,while the vectors in the stacking direction remainedunchanged, which was interpreted as the stacking faults beingassociated with rotational disorder. This study showcasesa highly inventive way of extending the local structural infor-mation available in the PDF to describe the full nanostructure ofa complex sample.
In situ and operando experiments: changes in nanoparticlestructure
Having established the strength of PDF analysis for nano-material characterization, we here only briey mention theimportance of in situ and operando PDF analysis in nano-materials chemistry, as these elds have been reviewed in thepast.32,33,37 In situ X-ray or neutron powder diffraction, wherediffraction patterns are continuously collected duringa chemical reaction, has a long and successful history datingback to the 1990s, and excels when investigating bulk crys-talline phase transitions and crystallite growth kinetics.203–206
In situ PDF studies, on the other hand, allow for identica-tion and characterization of disordered or amorphousintermediate structures and species in solution, which areimportant in nanomaterials. For example, in studies ofnanomaterial synthesis, in situ PDF analysis gives the possi-bility for studying the atomic structure of the species presentbefore, during and aer crystallization of nano-particles,183,207–219 which is essential for gaining a deeperunderstanding of material nucleation processes, whereatomic scale mechanistic information generally is scarce.Knowledge of the relation between chemical synthesis andthe resulting atomic structure of the material is crucial in theadvancement of nanoscience.220 In studies of battery mate-rials, operando experiments allow following the changes inelectrode structure during operation, and the use of PDF hasrevealed complex reactions, where disordered nanomaterialsplay a large role in the cycling processes.221–229
Summary and future perspectives
We have reviewed a number of studies where atomic structureon the nanoscale has been characterized using PDF. Structuralstudies of metals, chalcogenides and oxides were described,covering a range of different approaches to PDF analysis,including model-free analysis, real-space Rietveld renement,d-PDF analysis, and modelling using discrete structures withthe Debye scattering equation. The PDF technique is growing in
2248 | Nanoscale Adv., 2020, 2, 2234–2254
importance, and many other emerging nanomaterials such asperovskites,36,230–232 upconverting nanoparticles,34,233
suldes,234–236 nitrides and carbides237–242 are now being inves-tigated with PDF. The diversity of the studies demonstrates animportant point: there is no one-ts-all approach to PDFmodelling of the structure of nanoparticles, and the method tobe used is dependent on the problem that is under investiga-tion, and what information is sought. This means that con-structing a good structural model for a nanostructure from PDFanalysis requires a great deal of creativity, structural under-standing and chemical intuition, however the simplicity andintuitive nature of the PDF can be helpful in achieving a goodstarting point.
While PDF analysis can be extremely useful for analysis ofatomic structure, one always has to be aware of its limitations:the PDF will not always contain enough information to deter-mine a unique model for atomic structure. This problem is onlyamplied by the disordered and polydisperse nature of mostnanomaterials, and careful consideration should be given to theuniqueness and validity of any model constructed. It is para-mount that PDF models are supported by structural informa-tion from other techniques. One perspective on tackling thisissue is the complex modelling approach, where one structuralmodel is rened against multiple datasets from different tech-niques.62,73,243 This makes the models and rened parametersmore reliable, as they have been constrained by structuralinformation obtained from techniques with different strengthsand weaknesses, such as when combining PDF or total scat-tering with SAXS95,187,244 or EXAFS data.74,245
The interest and development of advanced computationaltechniques such as database mining and machine learning arevery likely to impact PDF analysis as well as many other data-heavy elds in the coming years.246 For example, machinelearning methods have already been applied to PDF in regardsto component analysis123,247–250 and in identifying symmetry andextracting distance lists.251,252 This development is likely to aidin maximizing the information that can be extracted from thePDF of complicated nanostructures. Automated modelling,where large numbers of structures (mined from databases oralgorithmically generated) are tted to experimental PDFs, canimprove the structural characterization workow and thediscovery of new and improved models.127,128,253 However, pres-ently, the more advanced tools for modelling and constructingnew nanostructures are somewhat un-accessible to the broadscientic community, and the development of user-friendlysoware and tools for more advanced analysis should bea high priority within the PDF community.
While these new advanced developments are hugelyimportant, we stress that signicant information can beextracted from PDF analysis using relatively simple methods,such as real-space Rietveld renement or model-free analysisof individual peaks, and PDF will prove useful in the toolboxof any scientist wishing to characterize nanostructures. Withthis review, we hope to have provided an entry into PDFanalysis, and we invite everyone to join the journey down theyellow brick road towards better understanding of structureon the nanoscale.
This journal is © The Royal Society of Chemistry 2020

Review Nanoscale Advances
Ope
n A
cces
s A
rtic
le. P
ublis
hed
on 0
6 M
ay 2
020.
Dow
nloa
ded
on 1
2/27
/202
1 8:
02:2
1 PM
. T
his
artic
le is
lice
nsed
und
er a
Cre
ativ
e C
omm
ons
Attr
ibut
ion-
Non
Com
mer
cial
3.0
Unp
orte
d L
icen
ce.
View Article Online
Conflicts of interest
There are no conicts to declare.
Acknowledgements
We are grateful to the Villum Foundation for nancial supportthrough a Villum Young Investigator grant. KMØJ acknowl-edges funding from the Danish Research Council under theSapere Aude Research Talent Program. This work is part ofa project that has received funding from the European ResearchCouncil (ERC) under the European Union's Horizon 2020research and innovation programme, (Grant agreement no.804066). This project has received funding from the EuropeanUnion's Horizon 2020 research and innovation programmeunder the Marie Sklodowska-Curie grant agreement no. 841903.
References
1 D. Schwarzenbach, Acta Crystallogr., Sect. A: Found.Crystallogr., 2012, 68, 57–67.
2 Nat. Mater., 2014, 13, 757.3 M. Eckert, Acta Crystallogr., Sect. A: Found. Crystallogr., 2012,68, 30–39.
4 W. L. Bragg, Proc. R. Soc. London, Ser. A, 1913, 89, 248–277.5 W. Friedrich, P. Knipping and M. Laue, Ann. Phys., 1913,346, 971–988.
6 H. M. Rietveld, J. Appl. Crystallogr., 1969, 2, 65–71.7 A. K. Cheetham and A. L. Goodwin, Nat. Mater., 2014, 13,760–762.
8 M. Etter and R. E. Dinnebier, Z. Anorg. Allg. Chem., 2014,640, 3015–3028.
9 J. Wood, Mater. Today, 2008, 11, 40–45.10 W. J. Stark, P. R. Stoessel, W. Wohlleben and A. Hafner,
Chem. Soc. Rev., 2015, 44, 5793–5805.11 M. V. Kovalenko, L. Manna, A. Cabot, Z. Hens,
D. V. Talapin, C. R. Kagan, V. I. Klimov, A. L. Rogach,P. Reiss, D. J. Milliron, P. Guyot-Sionnnest,G. Konstantatos, W. J. Parak, T. Hyeon, B. A. Korgel,C. B. Murray and W. Heiss, ACS Nano, 2015, 9, 1012–1057.
12 E. Roduner, Chem. Soc. Rev., 2006, 35, 583–592.13 V. H. Grassian, J. Phys. Chem. C, 2008, 112, 18303–18313.14 M. Auffan, J. Rose, J.-Y. Bottero, G. V. Lowry, J.-P. Jolivet and
M. R. Wiesner, Nat. Nanotechnol., 2009, 4, 634–641.15 C. L. Cleveland, U. Landman, T. G. Schaaff,
M. N. Shagullin, P. W. Stephens and R. L. Whetten,Phys. Rev. Lett., 1997, 79, 1873–1876.
16 N. Goswami, Q. Yao, T. Chen and J. Xie, Coord. Chem. Rev.,2016, 329, 1–15.
17 H. Qian, M. Zhu, Z. Wu and R. Jin, Acc. Chem. Res., 2012, 45,1470–1479.
18 E. C. Tyo and S. Vajda, Nat. Nanotechnol., 2015, 10, 577–588.19 S. J. L. Billinge and I. Levin, Science, 2007, 316, 561–565.20 B. Ingham, Crystallogr. Rev., 2015, 21, 229–303.21 D. Balzar, N. Audebrand, M. R. Daymond, A. Fitch,
A. Hewat, J. I. Langford, A. Le Bail, D. Louer, O. Masson,
This journal is © The Royal Society of Chemistry 2020
C. N. McCowan, N. C. Popa, P. W. Stephens andB. H. Toby, J. Appl. Crystallogr., 2004, 37, 911–924.
22 T. Egami and S. J. Billinge, Underneath the Bragg peaks:Structural analysis of complex materials, Elsevier,Amsterdam, 2nd edn, 2012.
23 E. K. Richman and J. E. Hutchison, ACS Nano, 2009, 3,2441–2446.
24 A. Kuzmin and J. Chaboy, IUCrJ, 2014, 1, 571–589.25 J. Miao, P. Ercius and S. J. L. Billinge, Science, 2016, 353,
aaf2157.26 Y. Yang, C.-C. Chen, M. C. Scott, C. Ophus, R. Xu, A. Pryor,
L. Wu, F. Sun, W. Theis, J. Zhou, M. Eisenbach,P. R. C. Kent, R. F. Sabirianov, H. Zeng, P. Ercius andJ. Miao, Nature, 2017, 542, 75–79.
27 D. A. Muller, Nat. Mater., 2009, 8, 263–270.28 S. J. L. Billinge andM. G. Kanatzidis, Chem. Commun., 2004,
7, 749–760.29 K. Page, T. Proffen and R. Neder, in Modern Diffraction
Methods, ed. E. J. Mittemeijer and U. Welzel, 2013, pp.61–86, DOI: 10.1002/9783527649884.ch3.
30 T. Egami, H. D. Rosenfeld, B. H. Toby and A. Bhalla,Ferroelectrics, 1991, 120, 11–21.
31 S. J. L. Billinge, Philos. Trans. R. Soc. London, Ser. A, 2019,377, 20180413.
32 E. D. Bøjesen and B. B. Iversen, CrystEngComm, 2016, 18,8332–8353.
33 K. W. Chapman, MRS Bull., 2016, 41, 231–240.34 S. S. Perera, D. K. Amarasinghe, K. T. Dissanayake and
F. A. Rabuffetti, Chem. Mater., 2017, 29, 6289–6297.35 R. B. Soriano, I. U. Arachchige, C. D. Malliakas, J. Wu and
M. G. Kanatzidis, J. Am. Chem. Soc., 2013, 135, 768–774.36 F. A. Rabuffetti and R. L. Brutchey, ACS Nano, 2013, 7,
11435–11444.37 K. M. Ø. Jensen, C. Tyrsted, M. Bremholm and B. B. Iversen,
ChemSusChem, 2014, 7, 1594–1611.38 R. Harrington, D. B. Hausner, N. Bhandari, D. R. Strongin,
K. W. Chapman, P. J. Chupas, D. S. Middlemiss, C. P. Greyand J. B. Parise, Inorg. Chem., 2010, 49, 325–330.
39 X. Wang, J. D. Kubicki, J.-F. Boily, G. A. Waychunas, Y. Hu,X. Feng and M. Zhu, ACS Earth Space Chem., 2018, 2, 125–134.
40 R. Harrington, R. B. Neder and J. B. Parise, Chem. Geol.,2012, 329, 3–9.
41 S. Thakral, M. W. Terban, N. K. Thakral andR. Suryanarayanan, Adv. Drug Delivery Rev., 2016, 100,183–193.
42 S. J. L. Billinge, Nanomedicine, 2015, 10, 2473–2475.43 M. W. Terban, M. Johnson, M. Di Michiel and
S. J. L. Billinge, Nanoscale, 2015, 7, 5480–5487.44 P. J. Chupas, X. Y. Qiu, J. C. Hanson, P. L. Lee, C. P. Grey and
S. J. L. Billinge, J. Appl. Crystallogr., 2003, 36, 1342–1347.45 C. L. Farrow, P. Juhas, J. W. Liu, D. Bryndin, E. S. Bozin,
J. Bloch, T. Proffen and S. J. L. Billinge, J. Phys.: Condens.Matter, 2007, 19, 335219.
46 P. Juhas, T. Davis, C. L. Farrow and S. J. L. Billinge, J. Appl.Crystallogr., 2013, 46, 560–566.
47 A. A. Coelho, P. A. Chater and A. Kern, J. Appl. Crystallogr.,2015, 48, 869–875.
Nanoscale Adv., 2020, 2, 2234–2254 | 2249

Nanoscale Advances Review
Ope
n A
cces
s A
rtic
le. P
ublis
hed
on 0
6 M
ay 2
020.
Dow
nloa
ded
on 1
2/27
/202
1 8:
02:2
1 PM
. T
his
artic
le is
lice
nsed
und
er a
Cre
ativ
e C
omm
ons
Attr
ibut
ion-
Non
Com
mer
cial
3.0
Unp
orte
d L
icen
ce.
View Article Online
48 A. K. Soper, GudrunN and GudrunX: programs for correctingraw neutron and X-ray diffraction data to differentialscattering cross section, Science & Technology FacilitiesCouncil Swindon, UK, 2011.
49 B. H. Toby and R. B. Von Dreele, J. Appl. Crystallogr., 2013,46, 544–549.
50 S. J. L. Billinge, Z. Kristallogr., 2004, 219, 117–121.51 C. A. Young and A. L. Goodwin, J. Mater. Chem., 2011, 21,
6464–6476.52 T. Proffen, K. L. Page, S. E. McLain, B. Clausen,
T. W. Darling, J. A. TenCate, S. Y. Lee and E. Ustundag, Z.Kristallogr., 2005, 220, 1002–1008.
53 A. S. Masadeh, J. Exp. Nanosci., 2016, 11, 951–974.54 P. Bordet, C. R. Phys., 2018, 19, 561–574.55 T. Proffen, S. J. L. Billinge, T. Egami and D. Louca, Z.
Kristallogr., 2003, 218, 132–143.56 S. J. L. Billinge and R. E. Dinnebier, Powder Diffraction:
Theory and Practice, RSC Publishing, Cambridge, 2008.57 P. F. Peterson, M. Gutmann, T. Proffen and S. J. L. Billinge,
J. Appl. Crystallogr., 2000, 33, 1192.58 P. Juhas, J. N. Louwen, L. van Eijck, E. T. C. Vogt and
S. J. L. Billinge, J. Appl. Crystallogr., 2018, 51, 1492–1497.59 S. L. J. Thomae, N. Prinz, T. Hartmann, M. Teck, S. Correll
and M. Zobel, Rev. Sci. Instrum., 2019, 90, 043905.60 A. M. M. Abeykoon, C. D. Malliakas, P. Juhas, E. S. Bozin,
M. G. Kanatzidis and S. J. L. Billinge, Z. Kristallogr. - Cryst.Mater., 2012, 227, 248.
61 D. Keen, J. Appl. Crystallogr., 2001, 34, 172–177.62 P. Juhas, C. L. Farrow, X. Yang, K. R. Knox and
S. J. L. Billinge, Acta Crystallogr., Sect. A: Found. Adv.,2015, 71, 562–568.
63 T.-M. Usher, D. Olds, J. Liu and K. Page, Acta Crystallogr.,Sect. A: Found. Adv., 2018, 74, 322–331.
64 L. Gamez-Mendoza, M. W. Terban, S. J. L. Billinge andM. Martinez-Inesta, J. Appl. Crystallogr., 2017, 50, 741–748.
65 G. Paglia, E. S. Bozin and S. J. L. Billinge, Chem. Mater.,2006, 18, 3242–3248.
66 P. Debye and P. Scherrer, Phys. Z., 1916, 17, 277–283.67 B. D. Hall and R. Monot, Comput. Phys., 1991, 5, 414–417.68 T. Proffen and R. B. Neder, J. Appl. Crystallogr., 1997, 30,
171–175.69 F. Bertolotti, D. Moscheni, A. Guagliardi and N. Masciocchi,
Eur. J. Inorg. Chem., 2018, 2018, 3789–3803.70 A. Cervellino, R. Frison, F. Bertolotti and A. Guagliardi, J.
Appl. Crystallogr., 2015, 48, 1600–5767.71 M. G. Tucker, D. A. Keen, M. T. Dove, A. L. Goodwin and
Q. Hui, J. Phys.: Condens. Matter, 2007, 19, 335218.72 M. T. Dove, M. G. Tucker and D. A. Keen, Eur. J. Mineral.,
2002, 14, 331–348.73 M. J. Cliffe, M. T. Dove, D. Drabold and A. L. Goodwin, Phys.
Rev. Lett., 2010, 104, 125501.74 M. Harada, R. Ikegami, L. S. R. Kumara, S. Kohara and
O. Sakata, RSC Adv., 2019, 9, 29511–29521.75 V. Petkov, C. M. Hessel, J. Ovtchinnikoff, A. Guillaussier,
B. A. Korgel, X. Liu and C. Giordano, Chem. Mater., 2013,25, 2365–2371.
2250 | Nanoscale Adv., 2020, 2, 2234–2254
76 J. A. Vargas, V. Petkov, E. S. A. Nouh, R. K. Ramamoorthy,L.-M. Lacroix, R. Poteau, G. Viau, P. Lecante andR. Arenal, ACS Nano, 2018, 12, 9521–9531.
77 V. Petkov, S. J. L. Billinge, P. Larson, S. D. Mahanti, T. Vogt,K. K. Rangan and M. G. Kanatzidis, Phys. Rev. B: Condens.Matter Mater. Phys., 2002, 65, 092105.
78 V. Petkov, S. J. L. Billinge, J. Heising andM. G. Kanatzidis, J.Am. Chem. Soc., 2000, 122, 11571–11576.
79 R. B. Neder and V. I. Korsunskiy, J. Phys.: Condens. Matter,2005, 17, S125–S134.
80 V. I. Korsounski, R. B. Neder, K. Hradil, C. Barglik-Chory,G. Muller and J. Neuefeind, J. Appl. Crystallogr., 2003, 36,1389–1396.
81 D. C. Gary, M. W. Terban, S. J. L. Billinge and B. M. Cossairt,Chem. Mater., 2015, 27, 1432–1441.
82 A. Demortiere, D. N. Leonard, V. Petkov, K. Chapman,S. Chattopadhyay, C. She, D. A. Cullen, T. Shibata,M. Pelton and E. V. Shevchenko, J. Phys. Chem. Lett., 2018,9, 1900–1906.
83 J. Owen and L. Brus, J. Am. Chem. Soc., 2017, 139, 10939–10943.84 A. Eychmuller, J. Phys. Chem. B, 2000, 104, 6514–6528.85 S. M. Harrell, J. R. McBride and S. J. Rosenthal, Chem.
Mater., 2013, 25, 1199–1210.86 A. S. Masadeh, E. S. Bozin, C. L. Farrow, G. Paglia, P. Juhas,
S. J. L. Billinge, A. Karkamkar and M. G. Kanatzidis, Phys.Rev. B, 2007, 76, 115413.
87 C. B. Murray, D. J. Norris and M. G. Bawendi, J. Am. Chem.Soc., 1993, 115, 8706–8715.
88 M. G. Bawendi, A. R. Kortan, M. L. Steigerwald andL. E. Brus, J. Chem. Phys., 1989, 91, 7282–7290.
89 X. Yang, A. S. Masadeh, J. R. McBride, E. S. Bozin,S. J. Rosenthal and S. J. L. Billinge, Phys. Chem. Chem.Phys., 2013, 15, 8480–8486.
90 W. Vogel, P. H. Borse, N. Deshmukh and S. K. Kulkarni,Langmuir, 2000, 16, 2032–2037.
91 P.-J. Wu, Y. P. Stetsko, K.-D. Tsuei, R. Dronyak andK. S. Liang, Appl. Phys. Lett., 2007, 90, 161911.
92 C. Kumpf, R. B. Neder, F. Niederdraenk, P. Luczak, A. Stahl,M. Scheuermann, S. Joshi, S. K. Kulkarni, C. Barglik-Chory,C. Heske and E. Umbach, J. Chem. Phys., 2005, 123, 224707.
93 F. Bertolotti, A. H. Proppe, D. N. Dirin, M. Liu, O. Voznyy,A. Cervellino, S. J. L. Billinge, M. V. Kovalenko,E. H. Sargent, N. Masciocchi and A. Guagliardi, Chem. Sq.,2018, 2, 1.
94 R. B. Neder, V. I. Korsunskiy, C. Chory, G. Muller,A. Hofmann, S. Dembski, C. Graf and E. Ruhl, Phys.Status Solidi C, 2007, 4, 3221–3233.
95 D. Moscheni, F. Bertolotti, L. Piveteau, L. Protesescu,D. N. Dirin, M. V. Kovalenko, A. Cervellino, J. S. Pedersen,N. Masciocchi and A. Guagliardi, ACS Nano, 2018, 12,12558–12570.
96 F. Niederdraenk, K. Seufert, A. Stahl, R. S. Bhalerao-Panajkar, S. Marathe, S. K. Kulkarni, R. B. Neder andC. Kumpf, Phys. Chem. Chem. Phys., 2011, 13, 498–505.
97 F. Niederdraenk, K. Seufert, P. Luczak, S. K. Kulkarni,C. Chory, R. B. Neder and C. Kumpf, Phys. Status Soldi C,2007, 4, 3234–3243.
This journal is © The Royal Society of Chemistry 2020

Review Nanoscale Advances
Ope
n A
cces
s A
rtic
le. P
ublis
hed
on 0
6 M
ay 2
020.
Dow
nloa
ded
on 1
2/27
/202
1 8:
02:2
1 PM
. T
his
artic
le is
lice
nsed
und
er a
Cre
ativ
e C
omm
ons
Attr
ibut
ion-
Non
Com
mer
cial
3.0
Unp
orte
d L
icen
ce.
View Article Online
98 E. S. Bozin, C. D. Malliakas, P. Souvatzis, T. Proffen,N. A. Spaldin, M. G. Kanatzidis and S. J. L. Billinge,Science, 2010, 330, 1660–1663.
99 F. Bertolotti, D. N. Dirin, M. Ibanez, F. Krumeich,A. Cervellino, R. Frison, O. Voznyy, E. H. Sargent,M. V. Kovalenko, A. Guagliardi and N. Masciocchi, Nat.Mater., 2016, 15, 987–994.
100 K. Yu, Adv. Mater., 2012, 24, 1123–1132.101 A. N. Beecher, X. Yang, J. H. Palmer, A. L. LaGrassa,
P. Juhas, S. J. L. Billinge and J. S. Owen, J. Am. Chem. Soc.,2014, 136, 10645–10653.
102 J. L. Stein, M. I. Steimle, M. W. Terban, A. Petrone,S. J. L. Billinge, X. Li and B. M. Cossairt, Chem. Mater.,2017, 29, 7984–7992.
103 L. Tan, A. J. Misquitta, A. Sapelkin, L. Fang, R. M. Wilson,D. S. Keeble, B. Zhang, T. Zhu, F. S. Riehle, S. Han, K. Yuand M. T. Dove, Nanoscale, 2019, 11, 21900–21908.
104 B. Gilbert, F. Huang, H. Zhang, G. A. Waychunas andJ. F. Baneld, Science, 2004, 305, 651–654.
105 G. R. Schleder, G. M. Azevedo, I. C. Nogueira,Q. H. F. Rebelo, J. Bettini, A. Fazzio and E. R. Leite, J.Phys. Chem. Lett., 2019, 10, 1471–1476.
106 B. M. Cossairt, P. Juhas, S. J. L. Billinge and J. S. Owen, J.Phys. Chem. Lett., 2011, 2, 3075–3080.
107 H.-W. Wang, D. J. Wesolowski, T. E. Proffen, L. Vlcek,W. Wang, L. F. Allard, A. I. Kolesnikov, M. Feygenson,L. M. Anovitz and R. L. Paul, J. Am. Chem. Soc., 2013, 135,6885–6895.
108 H. Zhang, B. Gilbert, F. Huang and J. F. Baneld, Nature,2003, 424, 1025–1029.
109 R. Sardar, A. M. Funston, P. Mulvaney and R. W. Murray,Langmuir, 2009, 25, 13840–13851.
110 C. Xie, Z. Niu, D. Kim, M. Li and P. Yang, Chem. Rev., 2020,120, 1184–1249.
111 T. Ishida, T. Murayama, A. Taketoshi and M. Haruta, Chem.Rev., 2020, 120, 464–525.
112 L. D. Marks and A. Howie, Nature, 1979, 282, 196–198.113 L. D. Marks, Rep. Prog. Phys., 1994, 57, 603–649.114 A. Mackay, Acta Crystallogr., 1962, 15, 916–918.115 S. Hajiw, B. Pansu and J.-F. Sadoc, ACS Nano, 2015, 9, 8116–
8121.116 F. C. Frank and J. S. Kasper, Acta Crystallogr., 1959, 12, 483–
499.117 H. Nakotte, C. Silkwood, K. Page, H. W. Wang, D. Olds,
B. Kiefer, S. Manna, D. Karpov, E. Fohtung andE. E. Fullerton, Phys. Scr., 2017, 92, 114002.
118 S. Ino, J. Phys. Soc. Jpn., 1969, 27, 941–953.119 L. D. Marks, J. Cryst. Growth, 1983, 61, 556–566.120 K. Page, T. Proffen, H. Terrones, M. Terrones, L. Lee,
Y. Yang, S. Stemmer, R. Seshadri and A. K. Cheetham,Chem. Phys. Lett., 2004, 393, 385–388.
121 V. Petkov, Y. Peng, G. Williams, B. Huang, D. Tomalia andY. Ren, Phys. Rev. B: Condens. Matter Mater. Phys., 2005, 72,195402.
122 A. Hjorth Larsen, J. Jørgen Mortensen, J. Blomqvist,I. E. Castelli, R. Christensen, M. Dułak, J. Friis,M. N. Groves, B. Hammer, C. Hargus, E. D. Hermes,
This journal is © The Royal Society of Chemistry 2020
P. C. Jennings, P. Bjerre Jensen, J. Kermode, J. R. Kitchin,E. Leonhard Kolsbjerg, J. Kubal, K. Kaasbjerg,S. Lysgaard, J. Bergmann Maronsson, T. Maxson,T. Olsen, L. Pastewka, A. Peterson, C. Rostgaard,J. Schiøtz, O. Schutt, M. Strange, K. S. Thygesen, T. Vegge,L. Vilhelmsen, M. Walter, Z. Zeng and K. W. Jacobsen, J.Phys.: Condens. Matter, 2017, 29, 273002.
123 W. Li, O. J. Borkiewicz, M. Saubanere, M.-L. Doublet,D. Flahaut, P. J. Chupas, K. W. Chapman andD. Dambournet, J. Phys. Chem. C, 2018, 122, 23861–23866.
124 W. A. Sławinski, E. Zacharaki, H. Fjellvag and A. O. Sjastad,Cryst. Growth Des., 2018, 18, 2316–2325.
125 J. A. Oberteuffer and J. A. Ibers, Acta Crystallogr., Sect. B:Struct. Crystallogr. Cryst. Chem., 1970, 26, 1499–1504.
126 S. Banerjee, C.-H. Liu, J. D. Lee, A. Kovyakh, V. Grasmik,O. Prymak, C. Koenigsmann, H. Liu, L. Wang,A. M. M. Abeykoon, S. S. Wong, M. Epple, C. B. Murrayand S. J. L. Billinge, J. Phys. Chem. C, 2018, 122, 29498–29506.
127 S. Banerjee, C.-H. Liu, K. M. Ø. Jensen, P. Juhas, J. D. Lee,M. Tofanelli, C. J. Ackerson, C. B. Murray andS. J. L. Billinge, Acta Crystallogr., Sect. A: Found. Adv.,2020, 76, 24–31.
128 T. Lindahl Christiansen, E. T. S. Kjær, A. Kovyakh,M. L. Roderen, M. Høj, T. Vosch and K. M. Ø. Jensen, J.Appl. Crystallogr., 2020, 53, 148–158.
129 V. V. T. Doan-Nguyen, S. A. J. Kimber, D. Pontoni,D. Reifsnyder Hickey, B. T. Diroll, X. Yang, M. Miglierini,C. B. Murray and S. J. L. Billinge, ACS Nano, 2014, 8,6163–6170.
130 L. B. Skinner, C. J. Benmore, J. K. R. Weber,M. A. Williamson, A. Tamalonis, A. Hebden, T. Wiencek,O. L. G. Alderman, M. Guthrie, L. Leibowitz andJ. B. Parise, Science, 2014, 346, 984–987.
131 T. Lindahl Christiansen, E. D. Bøjesen, M. Juelsholt,J. Etheridge and K. M. Ø. Jensen, ACS Nano, 2019, 13,8725–8735.
132 C. J. Benmore, ISRN Mater. Sci., 2012, 2012, 852905.133 H. E. Fischer, A. C. Barnes and P. S. Salmon, Rep. Prog.
Phys., 2005, 69, 233–299.134 R. Jin, C. Zeng, M. Zhou and Y. Chen, Chem. Rev., 2016, 116,
10346–10413.135 R. Jin, Nanoscale, 2015, 7, 1549–1565.136 S. Tian, Y.-Z. Li, M.-B. Li, J. Yuan, J. Yang, Z. Wu and R. Jin,
Nat. Commun., 2015, 6, 8667.137 S. F. Li, X. J. Zhao, X. S. Xu, Y. F. Gao and Z. Zhang, Phys.
Rev. Lett., 2013, 111, 115501.138 C. Kumara, X. Zuo, D. A. Cullen and A. Dass, ACS Nano,
2014, 8, 6431–6439.139 C. Kumara, X. Zuo, J. Ilavsky, K. W. Chapman, D. A. Cullen
and A. Dass, J. Am. Chem. Soc., 2014, 136, 7410–7417.140 K. M. Ø. Jensen, P. Juhas, M. A. Tofanelli, C. L. Heinecke,
G. Vaughan, C. J. Ackerson and S. J. L. Billinge, Nat.Commun., 2016, 7, 11859.
141 D. Bahena, N. Bhattarai, U. Santiago, A. Tlahuice, A. Ponce,S. B. H. Bach, B. Yoon, R. L. Whetten, U. Landman andM. Jose-Yacaman, J. Phys. Chem. Lett., 2013, 4, 975–981.
Nanoscale Adv., 2020, 2, 2234–2254 | 2251

Nanoscale Advances Review
Ope
n A
cces
s A
rtic
le. P
ublis
hed
on 0
6 M
ay 2
020.
Dow
nloa
ded
on 1
2/27
/202
1 8:
02:2
1 PM
. T
his
artic
le is
lice
nsed
und
er a
Cre
ativ
e C
omm
ons
Attr
ibut
ion-
Non
Com
mer
cial
3.0
Unp
orte
d L
icen
ce.
View Article Online
142 S. J. Tauster, S. C. Fung, R. T. K. Baker and J. A. Horsley,Science, 1981, 211, 1121.
143 R. J. White, R. Luque, V. L. Budarin, J. H. Clark andD. J. Macquarrie, Chem. Soc. Rev., 2009, 38, 481–494.
144 A. T. Bell, Science, 2003, 299, 1688–1691.145 K. W. Chapman, P. J. Chupas and C. J. Kepert, J. Am. Chem.
Soc., 2005, 127, 11232–11233.146 K. W. Chapman, P. J. Chupas, E. R. Maxey and
J. W. Richardson, Chem. Commun., 2006, 38, 4013–4015.147 P. J. Chupas, K. W. Chapman, H. Chen and C. P. Grey,
Catal. Today, 2009, 145, 213–219.148 M. A. Newton, K. W. Chapman, D. Thompsett and
P. J. Chupas, J. Am. Chem. Soc., 2012, 134, 5036–5039.149 P. J. Chupas, K. W. Chapman, G. Jennings, P. L. Lee and
C. P. Grey, J. Am. Chem. Soc., 2007, 129, 13822–13824.150 V. Petkov, Y. Maswadeh, A. Lu, S. Shan, H. Kareem, Y. Zhao,
J. Luo, C.-J. Zhong, K. Beyer and K. Chapman, ACS Appl.Mater. Interfaces, 2018, 10, 10870–10881.
151 Y. Lei, H. Zhao, R. D. Rivas, S. Lee, B. Liu, J. Lu, E. Stach,R. E. Winans, K. W. Chapman, J. P. Greeley, J. T. Miller,P. J. Chupas and J. W. Elam, J. Am. Chem. Soc., 2014, 136,9320–9326.
152 C. Y. Shi, E. L. Redmond, A. Mazaheripour, P. Juhas,T. F. Fuller and S. J. L. Billinge, J. Phys. Chem. C, 2013,117, 7226–7230.
153 J. Quinson, L. Kacenauskaite, T. Lindahl Christiansen,T. Vosch, M. Arenz and K. M. Ø. Jensen, ACS Omega,2018, 3, 10351–10356.
154 Y. Sun, N. Liu and Y. Cui, Nat. Energy, 2016, 1, 16071.155 X. Chen, C. Li, M. Gratzel, R. Kostecki and S. S. Mao, Chem.
Soc. Rev., 2012, 41, 7909–7937.156 B. R. Smith and S. S. Gambhir, Chem. Rev., 2017, 117, 901–
986.157 M. A. Shannon, P. W. Bohn, M. Elimelech, J. G. Georgiadis,
B. J. Marinas and A. M. Mayes, Nature, 2008, 452, 301–310.158 D. Koziej, A. Lauria and M. Niederberger, Adv. Mater., 2014,
26, 235–257.159 S. R. Cooper, L. K. Plummer, A. G. Cosby, P. Lenox,
A. Jander, P. Dhagat and J. E. Hutchison, Chem. Mater.,2018, 30, 6053–6062.
160 D. Koziej, M. D. Rossell, B. Ludi, A. Hintennach, P. Novak,J.-D. Grunwaldt and M. Niederberger, Small, 2011, 7, 377–387.
161 Y. Chabre and J. Pannetier, Prog. Solid State Chem., 1995,23, 1–130.
162 L. Kihlborg, in Nonstoichiometric Compounds, 1963, vol. 39,ch. 3, pp. 37–45.
163 A. L. Tiano, G. C. Papaehymiou, C. S. Lewis, J. Han,C. Zhang, Q. Li, C. Y. Shi, A. M. M. Abeykoon,S. J. L. Billinge, E. Stach, J. Thomas, K. Guerrero,P. Munayco, J. Munayco, R. B. Scorzelli, P. Burnham,A. J. Viescas and S. S. Wong, Chem. Mater., 2015, 27,3572–3592.
164 F. L. Deepak, M. Banobre-Lopez, E. Carbo-Argibay,M. F. Cerqueira, Y. Pineiro-Redondo, J. Rivas,C. M. Thompson, S. Kamali, C. Rodrıguez-Abreu,
2252 | Nanoscale Adv., 2020, 2, 2234–2254
K. Kovnir and Y. V. Kolen'ko, J. Phys. Chem. C, 2015, 119,11947–11957.
165 S. R. Cooper, R. O. Candler, A. G. Cosby, D. W. Johnson,K. M. Ø. Jensen and J. E. Hutchison, ACS Nano, 2020,DOI: 10.1021/acsnano.9b09551.
166 F. M. Michel, L. Ehm, S. M. Antao, P. L. Lee, P. J. Chupas,G. Liu, D. R. Strongin, M. A. A. Schoonen, B. L. Phillipsand J. B. Parise, Science, 2007, 316, 1726–1729.
167 R. Harrington, D. B. Hausner, W. Xu, N. Bhandari,F. M. Michel, G. E. Brown, D. R. Strongin and J. B. Parise,Environ. Sci. Technol., 2011, 45, 9883–9890.
168 F. M. Michel, V. Barron, J. Torrent, M. P. Morales,C. J. Serna, J.-F. Boily, Q. Liu, A. Ambrosini, A. C. Cismasuand G. E. Brown, Proc. Natl. Acad. Sci. U. S. A., 2010, 107,2787–2792.
169 J. B. Parise, B. Xia, J. W. Simonson, W. R. Woerner,A. M. Plonka, B. L. Phillips and L. Ehm, Crystals, 2019, 9,246.
170 N. P. Funnell, M. F. Fulford, S. Inoue, K. Kletetschka,F. M. Michel and A. L. Goodwin, Commun. Chem., 2020, 3,22.
171 A. I. Nguyen, K. M. Van Allsburg, M. W. Terban, M. Bajdich,J. Oktawiec, J. Amtawong, M. S. Ziegler, J. P. Dombrowski,K. V. Lakshmi, W. S. Drisdell, J. Yano, S. J. L. Billinge andT. D. Tilley, Proc. Natl. Acad. Sci. U. S. A., 2019, 116,11630–11639.
172 J. Huang, J. D. Blakemore, D. Fazi, O. Kokhan, N. D. Schley,R. H. Crabtree, G. W. Brudvig and D. M. Tiede, Phys. Chem.Chem. Phys., 2014, 16, 1814–1819.
173 A. S. Batchellor, G. Kwon, F. A. L. Laskowski, D. M. Tiedeand S. W. Boettcher, J. Phys. Chem. C, 2017, 121, 25421–25429.
174 M. D. Donakowski, A. N. Mansour, I. R. Pala, C. N. Chervin,P. A. DeSario, J. W. Long and D. R. Rolison, J. Phys. Chem. C,2018, 122, 28895–28900.
175 P. Du, O. Kokhan, K. W. Chapman, P. J. Chupas andD. M. Tiede, J. Am. Chem. Soc., 2012, 134, 11096–11099.
176 M. W. Kanan, J. Yano, Y. Surendranath, M. Dinca,V. K. Yachandra and D. G. Nocera, J. Am. Chem. Soc.,2010, 132, 13692–13701.
177 X. Chen and A. Selloni, Chem. Rev., 2014, 114, 9281–9282.178 X. Chen and S. S. Mao, Chem. Rev., 2007, 107, 2891–2959.179 N. Lock, E. M. L. Jensen, J. L. Mi, A. Mamakhel, K. Noren,
Q. B. Meng and B. B. Iversen, Dalton Trans., 2013, 42,9555–9564.
180 W. Li, D. Corradini, M. Body, C. Legein, M. Salanne, J. Ma,K. W. Chapman, P. J. Chupas, A.-L. Rollet, C. Julien,K. Zhagib, M. Duttine, A. Demourgues, H. Groult andD. Dambournet, Chem. Mater., 2015, 27, 5014–5019.
181 W. Li, M. Body, C. Legein, O. J. Borkiewicz andD. Dambournet, Inorg. Chem., 2016, 55, 7182–7187.
182 W. Li, M. Body, C. Legein, O. J. Borkiewicz andD. Dambournet, Eur. J. Inorg. Chem., 2017, 192–197.
183 J.-L. Mi, K. M. Ø. Jensen, C. Tyrsted, M. Bremholm andB. B. Iversen, CrystEngComm, 2015, 17, 6868–6877.
184 S. Banerjee, A. Zangiabadi, A. Mahdavi-Shakib,S. Husremovic, B. G. Frederick, K. Barmak, R. N. Austin
This journal is © The Royal Society of Chemistry 2020

Review Nanoscale Advances
Ope
n A
cces
s A
rtic
le. P
ublis
hed
on 0
6 M
ay 2
020.
Dow
nloa
ded
on 1
2/27
/202
1 8:
02:2
1 PM
. T
his
artic
le is
lice
nsed
und
er a
Cre
ativ
e C
omm
ons
Attr
ibut
ion-
Non
Com
mer
cial
3.0
Unp
orte
d L
icen
ce.
View Article Online
and S. J. L. Billinge, ACS Appl. Nano Mater., 2019, 2, 6268–6276.
185 H. Zhang and J. F. Baneld, Chem. Rev., 2014, 114, 9613–9644.
186 X. Hua, Z. Liu, P. G. Bruce and C. P. Grey, J. Am. Chem. Soc.,2015, 137, 13612–13623.
187 C. L. Farrow, C. Shi, P. Juhas, X. Peng and S. J. L. Billinge, J.Appl. Crystallogr., 2014, 47, 561–565.
188 P. J. Chupas, K. W. Chapman and G. J. Halder, J. Am. Chem.Soc., 2011, 133, 8522–8524.
189 C. M. van Genuchten and J. Pena, Environ. Sci.: ProcessesImpacts, 2016, 18, 1030–1041.
190 W. Li, R. Harrington, Y. Tang, J. D. Kubicki, M. Aryanpour,R. J. Reeder, J. B. Parise and B. L. Phillips, Environ. Sci.Technol., 2011, 45, 9687–9692.
191 C. M. van Genuchten and J. Pena, Chem. Geol., 2016, 429, 1–9.
192 M. H. Han, E. Gonzalo, G. Singh and T. Rojo, EnergyEnviron. Sci., 2015, 8, 81–102.
193 N. A. Chernova, M. Roppolo, A. C. Dillon andM. S. Whittingham, J. Mater. Chem., 2009, 19, 2526–2552.
194 M. P. Browne, Z. Sofer and M. Pumera, Energy Environ. Sci.,2019, 12, 41–58.
195 W. He, K. Ai, X. Ren, S. Wang and L. Lu, J. Mater. Chem. A,2017, 5, 19593–19606.
196 R. Uppuluri, A. Sen Gupta, A. S. Rosas and T. E. Mallouk,Chem. Soc. Rev., 2018, 47, 2401–2430.
197 D. S. Charles, M. Feygenson, K. Page, J. Neuefeind, W. Xuand X. Teng, Nat. Commun., 2017, 8, 15520.
198 B. Song, M. Tang, E. Hu, O. J. Borkiewicz, K. M. Wiaderek,Y. Zhang, N. D. Phillip, X. Liu, Z. Shadike, C. Li, L. Song,Y.-Y. Hu, M. Chi, G. M. Veith, X.-Q. Yang, J. Liu, J. Nanda,K. Page and A. Huq, Chem. Mater., 2019, 31, 3756–3765.
199 J. Liu, L. Yu, E. Hu, B. S. Guiton, X.-Q. Yang and K. Page,Inorg. Chem., 2018, 57, 6873–6882.
200 M. S. Hvid, H. S. Jeppesen, M. Miola, P. Lamagni, R. Su,K. M. Ø. Jensen and N. Lock, IUCrJ, 2019, 6, 804–814.
201 P. Gao, P. Metz, T. Hey, Y. Gong, D. Liu, D. D. Edwards,J. Y. Howe, R. Huang and S. T. Misture, Nat. Commun.,2017, 8, 14559.
202 P. C. Metz, R. Koch and S. T. Misture, J. Appl. Crystallogr.,2018, 51, 1437–1444.
203 H. L. Andersen, K. M. Ø. Jensen, C. Tyrsted, E. D. Bøjesenand M. Christensen, Cryst. Growth Des., 2014, 14, 1307–1313.
204 K. J. Gross, S. Guthrie, S. Takara and G. Thomas, J. AlloysCompd., 2000, 297, 270–281.
205 T. Ressler, R. E. Jento, J. Wienold, M. M. Gunter andO. Timpe, J. Phys. Chem. B, 2000, 104, 6360–6370.
206 P. Norby, J. Am. Chem. Soc., 1997, 119, 5215–5221.207 K. M. Ø. Jensen, M. Christensen, P. Juhas, C. Tyrsted,
E. D. Bøjesen, N. Lock, S. J. L. Billinge and B. B. Iversen,J. Am. Chem. Soc., 2012, 134, 6785–6792.
208 C. Tyrsted, K. M. Ø. Jensen, E. D. Bøjesen, N. Lock,M. Christensen, S. J. L. Billinge and B. B. Iversen, Angew.Chem., Int. Ed., 2012, 51, 9030–9033.
This journal is © The Royal Society of Chemistry 2020
209 C. Tyrsted, N. Lock, K. M. Ø. Jensen, M. Christensen,E. D. Bojesen, H. Emerich, G. Vaughan, S. J. L. Billingeand B. B. Iversen, IUCrJ, 2014, 1, 165–171.
210 K. M. Ø. Jensen, H. L. Andersen, C. Tyrsted, E. D. Bøjesen,A.-C. Dippel, N. Lock, S. J. L. Billinge, B. B. Iversen andM. Christensen, ACS Nano, 2014, 8, 10704–10714.
211 C. E. White, K. Page, N. J. Henson and J. L. Provis, Appl. ClaySci., 2013, 73, 17–25.
212 D. Saha, E. D. Bojesen, K. M. Ø. Jensen, A. C. Dippel andB. B. Iversen, J. Phys. Chem. C, 2015, 119, 13357–13362.
213 S. Birgisson, D. Saha and B. B. Iversen, Cryst. Growth Des.,2018, 18, 827–838.
214 D. Saha, K. M. Ø. Jensen, C. Tyrsted, E. D. Bojesen,A. H. Mamakhel, A. C. Dippel, M. Christensen andB. B. Iversen, Angew. Chem., Int. Ed., 2014, 53, 3667–3670.
215 S. Sommer, I. G. Nielsen and B. B. Iversen, Chem.–Eur. J.,2020, 26, 1–6.
216 M. Juelsholt, T. Lindahl Christiansen and K. M. Ø. Jensen,J. Phys. Chem. C, 2019, 123, 5110–5119.
217 H. Xu, S. Sommer, N. L. N. Broge, J. Gao and B. B. Iversen,Chem.–Eur. J., 2019, 25, 2051–2058.
218 E. D. Bøjesen, K. M. Ø. Jensen, C. Tyrsted, A. Mamakhel,H. L. Andersen, H. Reardon, J. Chevalier, A.-C. Dippel andB. B. Iversen, Chem. Sci., 2016, 7, 6394–6406.
219 N. L. N. Broge, F. Søndergaard-Pedersen, S. Sommer andB. B. Iversen, Adv. Funct. Mater., 2019, 29, 1902214.
220 L. Soderholm and J. F. Mitchell, APL Mater., 2016, 4,053212.
221 C. K. Christensen, M. A. H. Mamakhel, A. R. Balakrishna,B. B. Iversen, Y.-M. Chiang and D. B. Ravnsbæk,Nanoscale, 2019, 11, 12347–12357.
222 X. Hua, Z. Liu, M. G. Fischer, O. Borkiewicz, P. J. Chupas,K. W. Chapman, U. Steiner, P. G. Bruce and C. P. Grey, J.Am. Chem. Soc., 2017, 139, 13330–13341.
223 Y.-Y. Hu, Z. Liu, K.-W. Nam, O. J. Borkiewicz, J. Cheng,X. Hua, M. T. Dunstan, X. Yu, K. M. Wiaderek, L.-S. Du,K. W. Chapman, P. J. Chupas, X.-Q. Yang and C. P. Grey,Nat. Mater., 2013, 12, 1130–1136.
224 T. Koketsu, J. Ma, B. J. Morgan, M. Body, C. Legein,W. Dachraoui, M. Giannini, A. Demortiere, M. Salanne,F. Dardoize, H. Groult, O. J. Borkiewicz, K. W. Chapman,P. Strasser and D. Dambournet, Nat. Mater., 2017, 16,1142–1148.
225 S.-K. Jung, I. Hwang, D. Chang, K.-Y. Park, S. J. Kim,W. M. Seong, D. Eum, J. Park, B. Kim, J. Kim, J. H. Heoand K. Kang, Chem. Rev., 2019, DOI: 10.1021/acs.chemrev.9b00405.
226 B. Shyam, K. W. Chapman, M. Balasubramanian,R. J. Klingler, G. Srajer and P. J. Chupas, Angew. Chem.,Int. Ed., 2012, 51, 4852–4855.
227 K. M. Wiaderek, O. J. Borkiewicz, E. Castillo-Martınez,R. Robert, N. Pereira, G. G. Amatucci, C. P. Grey,P. J. Chupas and K. W. Chapman, J. Am. Chem. Soc., 2013,135, 4070–4078.
228 C. Henriksen, J. K. Mathiesen, Y.-M. Chiang,K. M. Ø. Jensen and D. B. Ravnsbæk, ACS Appl. EnergyMater., 2019, 2, 8060–8067.
Nanoscale Adv., 2020, 2, 2234–2254 | 2253

Nanoscale Advances Review
Ope
n A
cces
s A
rtic
le. P
ublis
hed
on 0
6 M
ay 2
020.
Dow
nloa
ded
on 1
2/27
/202
1 8:
02:2
1 PM
. T
his
artic
le is
lice
nsed
und
er a
Cre
ativ
e C
omm
ons
Attr
ibut
ion-
Non
Com
mer
cial
3.0
Unp
orte
d L
icen
ce.
View Article Online
229 C. K. Christensen, D. R. Sørensen, J. Hvam andD. B. Ravnsbæk, Chem. Mater., 2019, 31, 512–520.
230 J. J. Choi, X. H. Yang, Z. M. Norman, S. J. L. Billinge andJ. S. Owen, Nano Lett., 2014, 14, 127–133.
231 P. Cottingham and R. L. Brutchey, Chem. Mater., 2016, 28,7574–7577.
232 C. Shi, S. J. L. Billinge, E. Puma, S. H. Bang, N. J. H. Bean,J.-C. de Sugny, R. G. Gambee, R. C. Haskell, A. Hightowerand T. C. Monson, Phys. Rev. B: Condens. Matter Mater.Phys., 2018, 98, 085421.
233 K. T. Dissanayake and F. A. Rabuffetti, Chem. Mater., 2018,30, 2453–2462.
234 L. Ehm, F. M. Michel, S. M. Antao, C. D. Martin, P. L. Lee,S. D. Shastri, P. J. Chupas and J. B. Parise, J. Appl.Crystallogr., 2009, 42, 15–21.
235 F. M. Michel, S. M. Antao, P. J. Chupas, P. L. Lee, J. B. Pariseand M. A. A. Schoonen, Chem. Mater., 2005, 17, 6246–6255.
236 J. B. Parise, L. Ehm, F. M. Michel, S. Antao, P. J. Chupas,P. L. Lee, C. D. Martin and S. Shastri, AIP Conf. Proc.,2009, 1092, 41–44.
237 M. Feygenson, J. C. Neuefeind, T. A. Tyson, N. Schieber andW.-Q. Han, Inorg. Chem., 2015, 54, 11226–11235.
238 K. Page, J. Li, R. Savinelli, H. N. Szumila, J. Zhang,J. K. Stalick, T. Proffen, S. L. Scott and R. Seshadri, SolidState Sci., 2008, 10, 1499–1510.
239 C. Shi, M. Beidaghi, M. Naguib, O. Mashtalir, Y. Gogotsiand S. J. L. Billinge, Phys. Rev. Lett., 2014, 112, 125501.
240 H.-W. Wang, M. Naguib, K. Page, D. J. Wesolowski andY. Gogotsi, Chem. Mater., 2016, 28, 349–359.
2254 | Nanoscale Adv., 2020, 2, 2234–2254
241 X. Xiao, P. Urbankowski, K. Hantanasirisakul, Y. Yang,S. Sasaki, L. Yang, C. Chen, H. Wang, L. Miao,S. H. Tolbert, S. J. L. Billinge, H. D. Abruna, S. J. May andY. Gogotsi, Adv. Funct. Mater., 2019, 29, 1809001.
242 M. W. Terban, C. Shi, R. Silbernagel, A. Cleareld andS. J. L. Billinge, Inorg. Chem., 2017, 56, 8837–8846.
243 M. Eremenko, V. Krayzman, A. Gagin and I. Levin, J. Appl.Crystallogr., 2017, 50, 1561–1570.
244 A. Gagin, A. J. Allen and I. Levin, J. Appl. Crystallogr., 2014,47, 619–629.
245 V. Krayzman, I. Levin and M. G. Tucker, J. Appl. Crystallogr.,2008, 41, 705–714.
246 H. N. Bordallo, C. Lioma, J. Taylor and D. N. Argyriou,IUCrJ, 2020, 7, 1–2.
247 H. S. Geddes, H. Blade, J. F. McCabe, L. P. Hughes andA. L. Goodwin, Chem. Commun., 2019, 55, 13346–13349.
248 K. W. Chapman, S. H. Lapidus and P. J. Chupas, J. Appl.Crystallogr., 2015, 48, 1619–1626.
249 J. M. Cole, X. Cheng and M. C. Payne, Inorg. Chem., 2016,55, 10870–10880.
250 D. Olds, P. F. Peterson, M. K. Crawford, J. R. Neilson,H.-W. Wang, P. S. Whiteld and K. Page, J. Appl.Crystallogr., 2017, 50, 1744–1753.
251 C.-H. Liu, Y. Tao, D. Hsu, Q. Du and S. J. L. Billinge, ActaCrystallogr., Sect. A: Found. Adv., 2019, 75, 633–643.
252 R. Gu, S. Banerjee, Q. Du and S. J. L. Billinge, ActaCrystallogr., Sect. A: Found. Adv., 2019, 75, 658–668.
253 L. Yang, P. Juhas, M. W. Terban and S. J. L. Billinge, ActaCrystallogr., Sect. A: Found. Adv., 2020, 76, 395–409.
This journal is © The Royal Society of Chemistry 2020