Embed Size (px)
Citation preview
There goes the neighbourhood:Climate change, Australian housing and the financial sector
Discussion PaperMay 2016
ContentsExecutive Summary 1
Introduction 4
Part 1: A problem that will worsen as climate changes 9
Part 2: Stakeholders, incentives and barriers 11
Part 3: The role of insurers 15
Part 4: Reform possibilities and disruptive forces 18
Part 5: Why banks need to be part of the solution 22
Conclusions and recommendations 27
Appendices 29
Figures + TablesFigure 1: Australia’s real gross value added by industry 4
Table 1: Townsville dwellings review 5
Table 2: Barriers and perverse incentives – the property 11adaptation finance matrix.
Table 3: Example properties around Australia 21
AcknowledgementsThis Discussion Paper was written by Kate Mackenzie with input fromBrinsley Marlay, John Connor, Erwin Jackson and Luke Menzies.Thanks to the following for information, debate, and feedback:Dr Karl Mallon, Adam Davis, Dr Nick Wood, Alison Ewings, SharanjitPaddam, Prof Michael Goldstein, Drew MacRae and Graham Andersen.Thanks for very thorough feedback from peer reviewers: TayanahO’Donnell and Ian Edwards. Thanks to Adam Elliott for research andfact-checking. Special thanks to Jacquelyn Lamb for helping start thewhole project.Any views expressed and any errors are claimed by the author.
The Climate Institute is Australia’s leading climatepolicy and advocacy specialist. Backed primarilythrough philanthropic funding, the Institute has beenmarking solutions to climate change happen, throughevidence based advocacy and research, since 2007.To support us please visitwww.climateinstitute.org.au/donate
ISBN 978-1-921611-34-6

1
Executive Summary
Housing in Australia
The role of housing in Australia goes far beyondproviding shelter and security. For a majority ofpeople, a home is their biggest financial asset – orliability. Housing serves as a source of incomethrough capital growth, rental returns and taxminimisation. It is collateral for most mortgages andmany small business loans.1
The housing sector directly or indirectly drives nearlya third of the economy (see Figure 1), andmortgages account for about 60 per cent of the bigfour banks’ assets.2
Consequently, housing concerns a diverse group ofstakeholders – individuals (owners, residents andinvestors), banks, insurers, local governments, stategovernments and the federal government.
Risks to housing
Some of the homes built, bought and sold inAustralia are vulnerable to flood, cyclone andbushfire, as well as growing risks such as stormsurge, landslip and coastal erosion.
Australia is highly exposed to climate change andthis will exacerbate many of these risks. Scientistshave already identified changes in heatwavepatterns due to climate change, and are confidentthat sea level rise, movements in locations andintensity of storms and rainfall, and increasinglyintense droughts will also occur.
It is often possible to “defend” or “adapt” housing tosome of these risks. However not all are adaptable,and some only at a prohibitive expense.
Climate change exacerbates the problem
Impacts arising from climate change caused byhuman activity are often absent from long-termfinancial decisions. Even among commercialcatastrophe models, only some take account ofclimate change.3
Unsurprisingly, individual buyers and residents areoften unaware of risk levels, particularly rising levelsof risk or emerging risks.
Even when public authorities, financial institutionsand other stakeholders possess information aboutcurrent and future risk levels, they are sometimesunwilling, and sometimes unable, to share it with allaffected parties.
Thus, foreseeable risks are allowed to perpetuate,and even to grow via new housing builds. The fullscale of the risk may only be recognised eitherthrough disaster or damage, or when insurancepremiums become unaffordable. Any of theseevents can in turn affect housing values. Damaged,destroyed or devalued housing has social costs –either to individuals, or to the broader public viagovernment.
Even if these kinds of impacts affect only a tinyminority of the total housing stock, the eventualdevaluation could be financially devastating toindividuals. It could also be damaging to banks,other financial companies, and public balancesheets at all levels of government.
Exposure to a foreseeable risk is growing
Meanwhile, Australia’s housing stock is expanding,4
and with continuing gaps in policy, regulations andindustry, it is highly likely that some of this new stockis more vulnerable than buyers, residents and otherstakeholders would assume.
This means social and economic costs that couldbe managed or avoided are allowed to perpetuate.
“POPULATION TRENDS, URBANISATIONAND RESIDENTIAL SHIFTS TO HIGH RISKAREAS WILL INTERSECT WITH CLIMATECHANGE TO INCREASE AUSTRALIA’SEXPOSURE TO NATURAL HAZARDS AS AWHOLE."
National Climate Resilience and Adaptation Strategy,Department of Environment, December 2015.5

2
How big is the problem?
There have been few attempts to estimate the totalamount of Australian housing exposed to the effectsof climate change. Coastal erosion alone is estimatedto pose a threat to Australian property worth up to$63 billion (in 2008 dollars).6 This figure would be $88billion in 2015, when adjusted in line with theincrease in the national value of residential dwellingstock.7 However even that updated figure is highlylikely to be conservative, as detailed in Appendix 3.
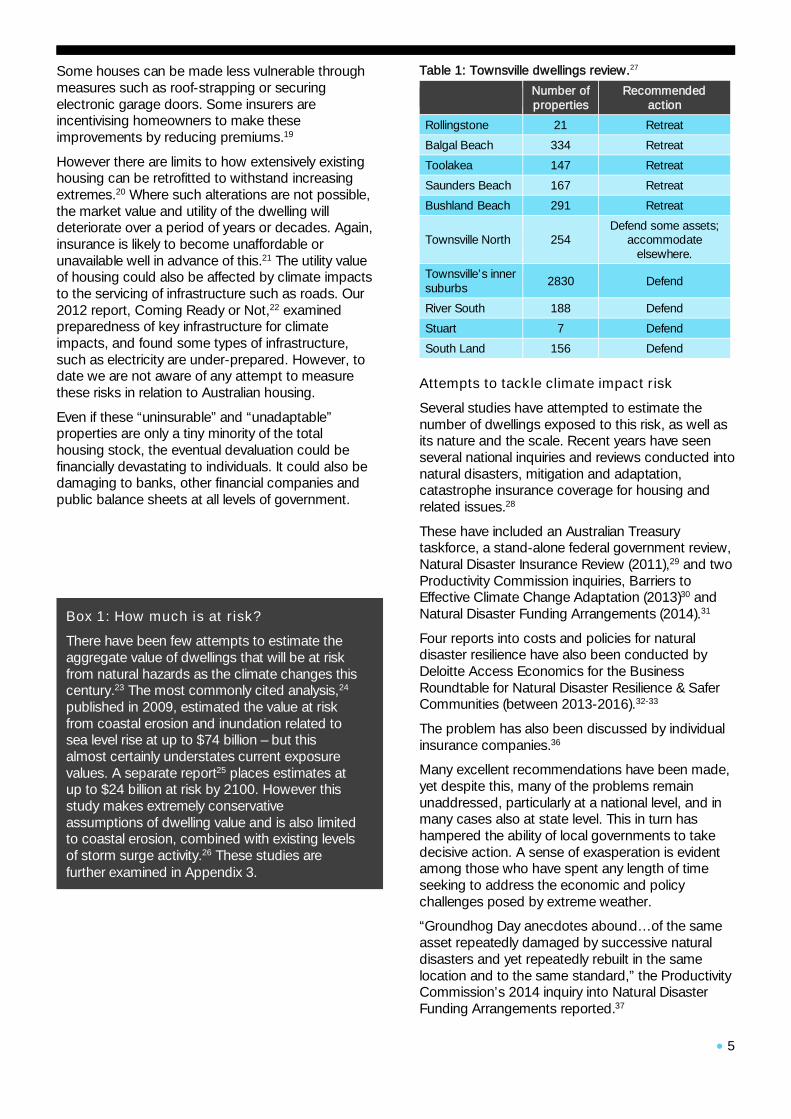
Few comprehensive studies have been conductedin specific local areas. One exception is Townsville,where a detailed study concluded that almost 4,400houses would be potentially inundated by 2100 dueto sea level rise alone – that is, excluding stormsurges, king tides, and other potentiallycompounding events. The report recommended thatsome houses would need to be effectivelyabandoned. In cases where steps could be taken tomitigate impacts to some areas, action needed tobe taken as early as 2027 (See Box 1 and Appendix3 for more detail).
Consequences vary for different stakeholders
Climate impacts to housing will affect stakeholdersin different ways. For example, escalating weatherrisk events may cause insurers to lose moneythrough making multiple localised payouts onclaims, then raise premiums or decline to insure.Unaffordable insurance can herald devaluationwhich in turn could have negative consequences forbanks and indirect mortgage investors (such assuperannuation funds). Where household orinstitutional losses result, or public investment isrequired to prevent such losses, federal or statecoffers can face unanticipated demand.
Technological changes
Recent advances in data collection, computingpower and climate modelling could mean thatclimate change becomes more clearly integratedinto public policy, private sector practices andindividual decisions. Ultimately, more accurate andlocation-specific information about climate impacts –such as detailed, address-level probabilisticforecasts – will likely improve these outcomes. But ifnot thoughtfully integrated, it could also createunnecessarily painful disruption.
This paper will:
+ examine the problem of climate impacts toAustralian residential property
+ identify why the problem remains broadlyunresolved, with a focus on the stakeholders,and the constraints and incentives under whichthey operate
+ contend that addressing this risk is importantfor the banking system, the financial systemand the Australian economy
+ explore, in particular, the role of the financialsystem and key financial institutions – insurersand banks
+ identify ways in which the financial sectorshould become a conduit for addressing theserisks.
Findings
1. All stakeholders, and the incentives andconstraints under which they operate, must beconsidered (Table 2, Part 2, p. 10 – 11).
2. Many attempts to address property risk fromextreme weather and natural disaster fail toaccount for climate change adequately, or at all(Part 1, p. 8-9 and Appendix 5).
3. The insurance sector can and should improvesome practices, however its ability to reduce orhedge against overall risk in this area issometimes overstated (Part 3).
4. Banks have been largely absent from thediscussion; as providers of housing finance theycan and should play a bigger role in developingclimate change impact policies generally (Part 5).
5. This has implications for the financial system,which have not been thoroughly explored(p.12-13).8
Recommendations
Key reforms suggested for further examinationinclude:
For insurers:
+ review assumptions about climate change, andensure they factor in the best possibleinformation to their risk and capital modelling
+ communicate to customers in a clear andconsistent way how premiums reflect risks fromnatural disaster and weather extremes bothhistorical and those that are increasing due toclimate change
+ actively support the development of an openand accessible platform for natural peril dataincluding both historical incidence andprojected or emerging risks due to climatechange
+ encourage better resilience in Australia’shousing stock.

3
For banks:
+ examine climate risk to their own mortgagebooks and ensure it is integrated into their riskassessment processes
+ use their role as the predominant providers ofproperty development finance to ensure goodpolicy and reject poor policy – both throughindividual commercial lending decisions andthrough submissions to and engagement withpolicymakers
+ work with other stakeholders in the public,private and civil society sectors to research anddevelop ways to minimise climate impact risk tohousing, and to address losses that will occurin an equitable way.
For insurers and banks:
+ integrate climate considerations as debt andequity investors in infrastructure, industry,property and other asset classes. Investment,engagement and risk management decisionsshould be aligned to minimise climate impactsand build resilience against physical, transitionaland liability risks.9
For financial authorities:
The financial sector occupies a particular placewithin public policy, in recognition of its role asfacilitator of economic movement.
Our 2015 discussion paper on Australia's FinancialSystem and Climate Risk10 recommends thatAustralian financial authorities conduct an in depthreview of these risks and factors, in order tounderstand the nature of climate risk and todetermine how to best manage it.
For public policy:
Governments at local, state and national levels alsoplay a key role. Previous publications by The ClimateInstitute have made a number of public policyrecommendations to address some of the issuesidentified in this paper:
From Coming, Ready or Not (2012)11:
+ Refresh the National Climate ChangeAdaptation Framework and work acrossfederal, state and local government jurisdictionsto develop agreed approaches includingstandards and guidelines for including climaterisk in planning, development and approvalprocesses
+ Coordinate between levels of government toimprove consistency of adaptation action byagreeing to practical requirements forinfrastructure planning and development
+ Develop sector specific guidelines for theassessment of climate risk on a consistentbasis across key regulated industry sectors.
From Buyer Beware (2014)12:
+ Mandate disclosure of all available hazardmapping including in digital formats, e.g. GlobalInformation System
+ Require that all dwellings and associatedinfrastructure be built or renovated as fit-for-purpose for the maximum projected impactsover their design life
+ Disclose extreme weather and climate changerisks associated with a property at the point ofsale
+ Disclose any settlements where climate changerisks make future habitation untenable thiscentury.
We support most recommendations for public policymade by the Productivity Commission inquiries,which are elaborated upon in the Introduction;unfortunately few of these have been adopted.
We also support recommendations for governmentto take a role in ensuring natural hazard data is ofbetter quality, more standardised, and moreaccessible, which has been supported by industrygroups including the Australian BusinessRoundtable on Natural Disaster Resilience & SaferCommunities, and the Insurance Council ofAustralia.

4
Introduction
For many Australians, a home is by far the biggestinvestment of their lifetime. Residential property isalso a large part of the Australian economy, andmakes up an unusually large proportion of ourcountry’s bank assets.13
In 2013-14, housing ownership comprised 9 percent of the national real gross value added (GVA).14
Another 20 per cent was derived from closelyrelated sectors such as finance and insurance,rental, hiring and real estate services andconstruction (see Figure 1, below).15
In taxation, “negative gearing” tax deductionsclaimed for investment property losses totalled$10 billion to $14 billion for each of the past fiveyears. In 2012-13 one in 10 tax returns byindividuals included these deductions.1617
Housing, disaster risk and its measurement
Homes are being built, bought and sold in locationswith exposure to weather and climate-related risks,particularly flood, storm surge, rising sea levels andcoastal erosion. As the climate changes due tohuman activity, these risks will be exacerbated.
The aggregate exposure of the Australian housingstock is likely to be worsening as housing continuesto be built with no requirement to consider climatechange.18
This does not mean all these houses will berendered uninhabitable. Well before becominguninhabitable – and even without suffering anydamage – some housing will become so risky as tobe “uninsurable”, with premiums reaching anextremely high level or simply not being offered atall, as insurers deem the risk is unacceptably high.Even a house that is never actually damaged can besubject to very high premiums if the risk of costlydamage is high.
Figure 1: Australia’s real gross value added by industry(Annual total ending June 2013–14, as a percentage oftotal industry). Note: Gross value added measures thecontribution to the economy of each individual producer,industry or sector.16
5
Some houses can be made less vulnerable throughmeasures such as roof-strapping or securingelectronic garage doors. Some insurers areincentivising homeowners to make theseimprovements by reducing premiums.19
However there are limits to how extensively existinghousing can be retrofitted to withstand increasingextremes.20 Where such alterations are not possible,the market value and utility of the dwelling willdeteriorate over a period of years or decades. Again,insurance is likely to become unaffordable orunavailable well in advance of this.21 The utility valueof housing could also be affected by climate impactsto the servicing of infrastructure such as roads. Our2012 report, Coming Ready or Not,22 examinedpreparedness of key infrastructure for climateimpacts, and found some types of infrastructure,such as electricity are under-prepared. However, todate we are not aware of any attempt to measurethese risks in relation to Australian housing.
Even if these “uninsurable” and “unadaptable”properties are only a tiny minority of the totalhousing stock, the eventual devaluation could befinancially devastating to individuals. It could also bedamaging to banks, other financial companies andpublic balance sheets at all levels of government.
Box 1: How much is at risk?
There have been few attempts to estimate theaggregate value of dwellings that will be at riskfrom natural hazards as the climate changes thiscentury.23 The most commonly cited analysis,24
published in 2009, estimated the value at riskfrom coastal erosion and inundation related tosea level rise at up to $74 billion – but thisalmost certainly understates current exposurevalues. A separate report25 places estimates atup to $24 billion at risk by 2100. However thisstudy makes extremely conservativeassumptions of dwelling value and is also limitedto coastal erosion, combined with existing levelsof storm surge activity.26 These studies arefurther examined in Appendix 3.
Table 1: Townsville dwellings review.27
Number ofproperties
Recommendedaction
Rollingstone 21 Retreat
Balgal Beach 334 Retreat
Toolakea 147 Retreat
Saunders Beach 167 Retreat
Bushland Beach 291 Retreat
Townsville North 254Defend some assets;
accommodateelsewhere.
Townsville’s innersuburbs 2830 Defend
River South 188 Defend
Stuart 7 Defend
South Land 156 Defend
Attempts to tackle climate impact risk
Several studies have attempted to estimate thenumber of dwellings exposed to this risk, as well asits nature and the scale. Recent years have seenseveral national inquiries and reviews conducted intonatural disasters, mitigation and adaptation,catastrophe insurance coverage for housing andrelated issues.28
These have included an Australian Treasurytaskforce, a stand-alone federal government review,Natural Disaster Insurance Review (2011),29 and twoProductivity Commission inquiries, Barriers toEffective Climate Change Adaptation (2013)30 andNatural Disaster Funding Arrangements (2014).31
Four reports into costs and policies for naturaldisaster resilience have also been conducted byDeloitte Access Economics for the BusinessRoundtable for Natural Disaster Resilience & SaferCommunities (between 2013-2016).32-33333435
The problem has also been discussed by individualinsurance companies.36
Many excellent recommendations have been made,yet despite this, many of the problems remainunaddressed, particularly at a national level, and inmany cases also at state level. This in turn hashampered the ability of local governments to takedecisive action. A sense of exasperation is evidentamong those who have spent any length of timeseeking to address the economic and policychallenges posed by extreme weather.
“Groundhog Day anecdotes abound…of the sameasset repeatedly damaged by successive naturaldisasters and yet repeatedly rebuilt in the samelocation and to the same standard,” the ProductivityCommission’s 2014 inquiry into Natural DisasterFunding Arrangements reported.37
6
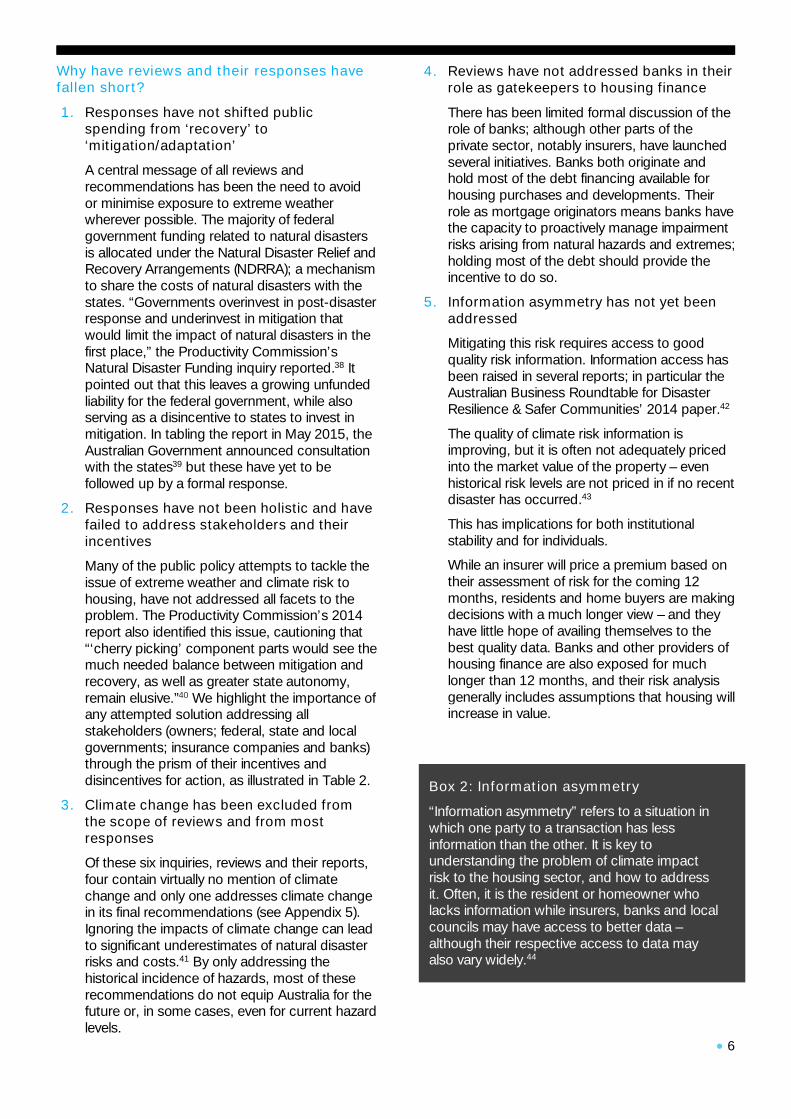
Why have reviews and their responses havefallen short?
1. Responses have not shifted publicspending from ‘recovery’ to‘mitigation/adaptation’
A central message of all reviews andrecommendations has been the need to avoidor minimise exposure to extreme weatherwherever possible. The majority of federalgovernment funding related to natural disastersis allocated under the Natural Disaster Relief andRecovery Arrangements (NDRRA); a mechanismto share the costs of natural disasters with thestates. “Governments overinvest in post-disasterresponse and underinvest in mitigation thatwould limit the impact of natural disasters in thefirst place,” the Productivity Commission’sNatural Disaster Funding inquiry reported.38 Itpointed out that this leaves a growing unfundedliability for the federal government, while alsoserving as a disincentive to states to invest inmitigation. In tabling the report in May 2015, theAustralian Government announced consultationwith the states39 but these have yet to befollowed up by a formal response.
2. Responses have not been holistic and havefailed to address stakeholders and theirincentives
Many of the public policy attempts to tackle theissue of extreme weather and climate risk tohousing, have not addressed all facets to theproblem. The Productivity Commission’s 2014report also identified this issue, cautioning that“‘cherry picking’ component parts would see themuch needed balance between mitigation andrecovery, as well as greater state autonomy,remain elusive.”40 We highlight the importance ofany attempted solution addressing allstakeholders (owners; federal, state and localgovernments; insurance companies and banks)through the prism of their incentives anddisincentives for action, as illustrated in Table 2.
3. Climate change has been excluded fromthe scope of reviews and from mostresponses
Of these six inquiries, reviews and their reports,four contain virtually no mention of climatechange and only one addresses climate changein its final recommendations (see Appendix 5).Ignoring the impacts of climate change can leadto significant underestimates of natural disasterrisks and costs.41 By only addressing thehistorical incidence of hazards, most of theserecommendations do not equip Australia for thefuture or, in some cases, even for current hazardlevels.
4. Reviews have not addressed banks in theirrole as gatekeepers to housing finance
There has been limited formal discussion of therole of banks; although other parts of theprivate sector, notably insurers, have launchedseveral initiatives. Banks both originate andhold most of the debt financing available forhousing purchases and developments. Theirrole as mortgage originators means banks havethe capacity to proactively manage impairmentrisks arising from natural hazards and extremes;holding most of the debt should provide theincentive to do so.
5. Information asymmetry has not yet beenaddressed
Mitigating this risk requires access to goodquality risk information. Information access hasbeen raised in several reports; in particular theAustralian Business Roundtable for DisasterResilience & Safer Communities’ 2014 paper.42
The quality of climate risk information isimproving, but it is often not adequately pricedinto the market value of the property – evenhistorical risk levels are not priced in if no recentdisaster has occurred.43
This has implications for both institutionalstability and for individuals.
While an insurer will price a premium based ontheir assessment of risk for the coming 12months, residents and home buyers are makingdecisions with a much longer view – and theyhave little hope of availing themselves to thebest quality data. Banks and other providers ofhousing finance are also exposed for muchlonger than 12 months, and their risk analysisgenerally includes assumptions that housing willincrease in value.
Box 2: Information asymmetry
“Information asymmetry” refers to a situation inwhich one party to a transaction has lessinformation than the other. It is key tounderstanding the problem of climate impactrisk to the housing sector, and how to addressit. Often, it is the resident or homeowner wholacks information while insurers, banks and localcouncils may have access to better data –although their respective access to data mayalso vary widely.44
7
“A LACK OF ACCESS TO FLOOD HAZARDMAPPING MAY ALSO AFFECT INSURANCEAND MORTGAGE AVAILABILITY, CREATEINCONSISTENT AND INACCURATE VIEWSOF RISK AND CAUSE UNNECESSARYDUPLICATION OF DATA CAPTURE ANDANALYSIS. SMALLER INSURERS WITHLIMITED RISK MEASUREMENTCAPABILITIES MAY CHOOSE NOT TO OFFERINSURANCE OR MORTGAGES IN AREASWHERE FLOOD MODELLING ISUNAVAILABLE. LARGER INSURERS ANDBANKS NEED TO FACTOR IN THEADDITIONAL COSTS IN FORMING A VIEW OFRISK IN ORDER TO PROVIDE THESEFINANCIAL PRODUCTS.”
Deloitte for Australian Business Roundtable on NaturalDisaster Resilience & Safer Communities
Scope and limitations
This discussion paper focuses solely on climate-related damage to housing and its implications forhousing as a financial asset class.
Social and health implications
It does not look at the social or health implications ofhousing. This would necessarily involve otherparameters and greater focus on hazards that arenot explored here. An example would be morefrequent and intense heatwaves,45 which may havelimited effects on properties and buildings butconsiderable implications for public policy throughplanning, building codes and electricity demand.
Secondary effects of climate impacts onhousing assets
There are two main ways in which the effects ofclimate change could impact housing:
+ housing which declines in value due to localeconomic effects: for example, in regions wherethe local economy is dependent on agricultureor tourism that is affected by changing climate
+ housing which declines in value and utilitybecause of It does not explore the scale andrisk of housing that is devalued because ofdamage to critical infrastructure, such asconnecting roads.
These secondary effects have been little studiedalthough they likely have significant implications forhousing both in the private sector and in publicpolicy.
Hypothetical case study of climate impactrisks
A local council is approached to approve a largeresidential housing development on greenfield land.
Planners within the council realise that this site hasactually experienced three floods in the past 20 yearsat levels which historical records suggest should onlyoccur on average of every 1-in-100 years. However,because the recent floods are seen to be at oddswith longer-term records, they’re deemed to beanomalous; the application is approved on the basisthat site complies with existing planning rules.
Some at the council believe that the proposed site isexposed to other perils, such as coastal erosion, forwhich there is little useful historical data.
Despite this, the council approves it anyway –because they fear a costly challenge or even legalaction if they reject the application.46
The apartments are built and sold, with fewresidents appreciating the extent of the flood risk.
Detailed disaster mapping information held by thelocal government is not made available, due to fearsof legal action and confusion over ‘custodianship’.47
Five years down the track, when the apartments areoccupied, a flood once again hits the area. Groundfloor flats are damaged, and worse, residentsthroughout the building suffer because the electricitytransformer is in the basement carpark.
It transpires the body corporate had voted againstflood insurance because it would have addedhundreds of dollars a year to each owner’s stratafees. Ground floor residents had no flood insuranceon their contents for similar cost reasons.
Many of the residents are distraught, angry andunsure of what recourse they have.
When the apartments are finally repaired, severalattempt to sell. A combination of market awarenessof the flood, and the fact that they are all selling atthe same time, means they would have to accept aloss on the apartments.
Some decide to stay because they cannot afford tomove into a similar home, as their mortgages arebigger than the new, discounted market price.
Those who can afford to sell up anyway, do so – tonew owners who figure they have scored a bargainbecause another flood of that scale couldn’t happenin their lifetime – that last one, after all, was a1-in-100 year event.

8
Who’s at fault?
+ The council, for not providing flood data andfor permitting a vulnerable development togo ahead?
+ The developer, for building it?
+ The home owners, for not realising the risk?
+ The building code authority?
+ The banks, for financing purchase of thedevelopment and the individual mortgages?
+ The insurers, for charging high premiums, albeitones that reflected risk levels?
The systems and the incentives
Taking an integrated view, we can see that everyindividual, company and organisation has in factacted almost exactly in line with the incentives thatexist in Australia’s complex interaction betweenresidential property as an asset class, the financialand property development sectors, and all levels ofgovernment.
+ The local council enabled the creation of morelocal jobs, more homes, and more rates – andtook the path that appeared to have least riskof incurring legal action, statutorycompensation, or political backlash.
+ The developer created construction jobs andmore homes, meeting demand for residentialproperty and made money.
+ Home owners bought properties carrying outthe usual procedures, which did not flag thescale of the risk.
+ Building codes are primarily designed to protectlives.48
+ Banks have complied with regulatoryrequirements, avoided a backlash from notlending and made money.
+ Insurers have charged premiums based on thestatistical likelihood that a flood will occur,leading to payouts.
9
Part 1: A problem that willworsen as climate changes
Prevention versus cure
The threats posed by natural disaster and climateimpacts to housing only tend to provoke a policyresponse in the following situations:
1. a natural disaster occurs, particularly oneinvolving large uninsured losses, and/or
2. insurance premiums rise rapidly or becomeunavailable in some locations.
These two situations are of course related. If risks ofdamaging extreme weather are understood to haverisen, so will premiums. Thus insurance cansometimes indicate a problem before disaster itselfstrikes. Although the usefulness of this indicator islimited by the 12-month nature of most insurancepremiums (further explored in Part 3), insurance tosome degree serves as a “signal” of higher naturaldisaster risk before the event itself.
However these signals are not always wellcommunicated or well understood. Householderssubject to extremely high insurance premiums willsometimes simply opt out of insurance altogether.49
Ironically, they are more likely to need insurance, aspremium tend to reflect the exposure and risk levels.50
This is an obvious recipe for disaster: those that arevery exposed to risks may face premiums so highthat they choose not to take out insurance at all.An unfortunate side-effect of this situation is thatinsurance is often seen as both the source of theproblem and as the path to a solution. This isexplored more in Part 3.
To date, we have seen this conundrum play out in afew specific geographical areas – notably, parts ofNorthern Australia, in which insurance premiumshave become expensive or unobtainable, mainlybecause of cyclone risk.
Extreme weather risk: Where exactly doesclimate change fit in?
Detecting the influence of climate change in individualevents is a complex science; although capabilitiesare improving (as demonstrated by the recent UK
floods)51 it remains a probabilistic assessment.However there is much research on the likelihood ofchanges in frequency, location and intensity ofextreme weather events which climate change willbring.
There are three recent examples of extreme weatherprovoking public and private sector calls for reform:
+ The Northern Australian insurance premiumproblem identified by a Treasury taskforce(2016) mostly relates to cyclone risk.
+ The Natural Disaster Insurance Review (2011),was prompted by costly flood damage thatmostly occurred in Queensland in 2010/2011.
+ The Victorian bushfires of 2009 led to severalreviews and a number of changes in mitigationand research funding, as well as changes tobuilding codes and planning rules (see Box 5).
Box 4: The Bahamas – a cautionary tale
The UK’s Prudential Regulatory Authority hashighlighted the Bahamas as a cautionary tale ifclimate risk to physical assets is not addressed.Between 1999 and 2005, the country sufferedseveral large hurricanes.
“...the scale of the losses meant that privateinsurers had to withdraw flood cover in some ofthe more impacted, low-lying regions after theyexperienced their third successive loss.(2)Consequently, without access to affordable privateinsurance, local homeowners were forced either toself-insure or to limit the increase in premium costsby excluding key items such as buildingfoundations.
The growing pressure homeowners faced due to aloss of affordable insurance cover caused many toadapt their properties to improve their climate-resilience and make them insurable again. In themost affected areas, mortgage lending started todry up due to the lack of affordable insurancecover. This caused property values to collapse,leading to many properties being abandonedaltogether. This is clearly not a scenario whichinsurers and others would advocate, given thenegative consequences for all stakeholders. Thishighlights the systemic impacts of failing tomanage societal exposure to climate risk”.
10
Box 5: Types of climate impacts
While this paper addresses most types ofclimate impacts, it is important to note largevariations in the nature of different impacts, thehistorical information available on them, and theconfidence with which they can be predicted tochange with the climate. For example, tropicalcyclones can lead to widespread damage, buthistorical data prior to 1981 is limited,52 and theirsmall-scale nature makes forecasting difficult.53
Sea-level rise, by contrast, can be predictedwith much higher confidence, as can changes intemperature averages and extremes.54
Secondly, barriers and limits to “adaptation” toclimate change impacts vary significantlybetween different types of impact.
Lastly, some climate-affected hazards havebeen the subject of more policy and industryresponses than others. For example, bushfireshave been the subject of a Council of AustralianGovernments (COAG) inquiry (2004);55 which ledto a new regime in building standards for fire-prone areas around the country. Some stateshave reformed insurance taxes,56 and mandatedpre-sales disclosure of bushfire-prone areadesignation.57 The accessibility of historicalriverine flooding data was substantially improvedin Queensland after the floods of 2011.58
However significant policy gaps remain in regardto many hazards.
Historical levels of risk versus climate-influenced risk
The influence of climate change is difficult to identifyconclusively in recent cyclone activity.59
However, the volume of rainfall from extreme rainevents has increased since the 1970s, and scientistscan say with high certainty that extreme rainfallevents in most parts of the country will become moreintense.60
Policymakers and the private sector are grapplingwith very high insurance premiums in disaster-proneareas of Northern Queensland, which was thesubject of a recent Treasury taskforce awaitingresponse from the government. That may be onethat is caused only by historical levels of risk – that is,despite apparently worsening weather patterns,climate change impacts are not a contributor in thesedecisions.
However, this very same dilemma over rising risksand higher premiums could arise in other parts of thecountry as the climate changes. For example, South-East Queensland has been identified as a hotspot forfuture climate impacts due to a combination of urbandevelopment in low-lying areas and a forecastincrease in the frequency and intensity of extremeweather events.61 Indications of an “expansion of thetropics”62 and a poleward drift of the point at whichcyclones achieve their maximum intensity63 have ledto calls for high wind speed building standards to beextended south from their current most southerlypoint, which is just north of Brisbane, to cover all ofSouth-East Queensland and parts of the northernNew South Wales coast.64
Unlike cyclones, recent worsening of heatwaves and“fire weather” have been clearly attributed to climatechange,65 as have rising sea tides and surges. Inrecent years, new houses built in bushfire-proneareas have become subject to specific AustralianStandards requirements, and some states haveapplied bushfire levies to all property owners.66
Other impacts such as coastal inundation and stormsurge – which can be worsened by sea level rise –remain unresolved, even in areas where housingstock is already being affected.67 Insurers generallydo not cover coastal inundation, storm surge, orother flooding that involves seawater.68
The challenges posed by existing levels of risk andexposure to natural disasters and extreme weatherare considerable, even when climate change isexcluded – which it often is by policymakers,authorities and industry. Avoiding all consideration ofclimate change will clearly not reduce its impact;instead it will lead to even more unnecessarily costly,painful and complex outcomes.
Recommendations
+ Public policy reviews relating to extremeweather, natural disasters and coastal hazardsshould all explicitly address climate change,using the latest science.
+ This consideration of climate change should berisk-based, in recognition of the probabilisticnature of climate forecasts and natural hazards,
+ The distribution of risks and rising uncertaintyand volatility of risks should be transparentlyconsidered, even though policy will ultimatelytend to take a position based around meanaverage forecasts.
+ High quality information on current andprojected levels of risk should be made availableon a basis that is coordinated, if not funded, bypublic authorities.

11
Part 2: Stakeholders,incentives and barriers
As discussed above, there are numerousdisincentives and barriers to taking action on climaterisk. There are also incentives to perpetuate thestatus quo. The building and extension of valuableproperties continues even though they are exposedto perils that insurers would be reluctant to cover forpremium levels that are considered “reasonable” – if
they cover them at all (coastal erosion is a primeexample: Australian home insurance generally doesnot cover actions of the sea, except for stormsurge). Moreover, the risks of such perils areexpected to increase over the course of the decade.Some, such as heatwaves and fire weather haveincreased in frequency, intensity and duration.69-70
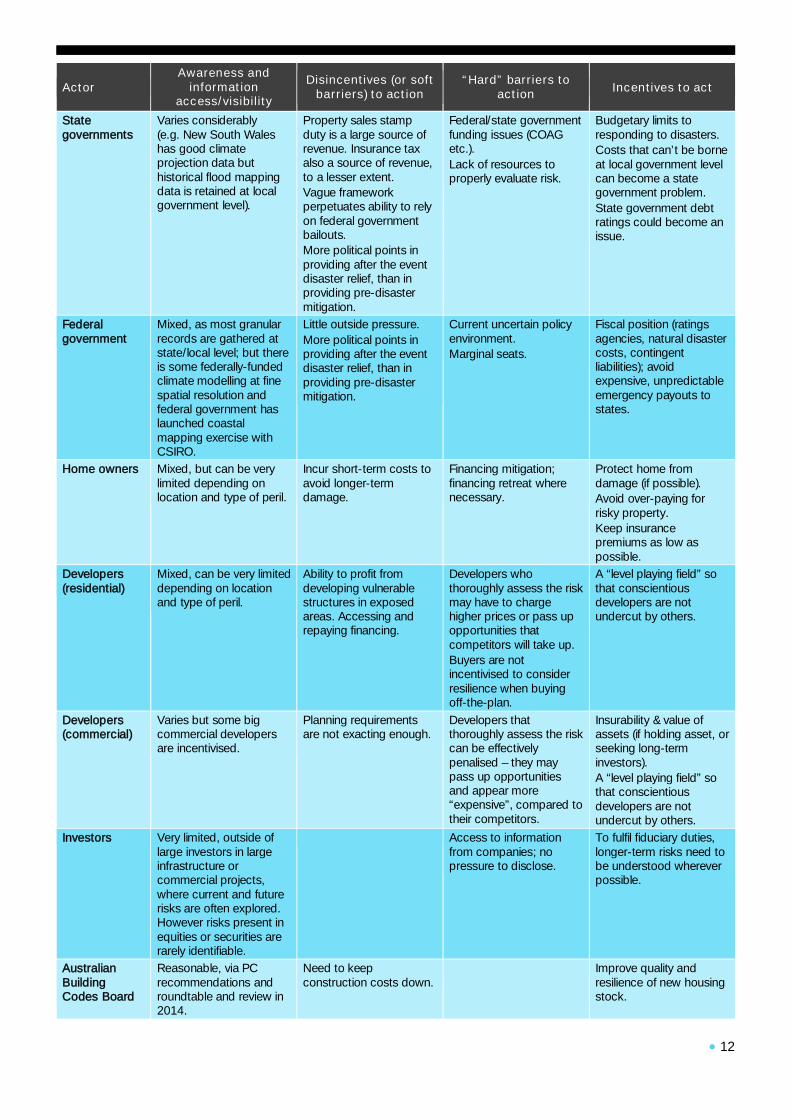
Table 2: Barriers and perverse incentives – the property adaptation finance matrix.
ActorAwareness and
informationaccess/visibility
Disincentives (or softbarriers) to action
“Hard” barriers toaction Incentives to act
Insurers Varied. Majority havemoderate to highawareness; a few smallerinsurers have very lowawareness.71
Can limit own exposureto 12 months.Protection of intellectualproperty.
Public perception(media/public cynicismabout motives, premiumhikes).Recent anxiety on climateas a political issue.
Maintain “insurableuniverse”, i.e. the marketof insurable properties.
Re-insurers Mostly high. Correctly priced riskexposed to undercuttingfrom capital markets (e.g.catastrophe bonds andother means of re-insuring without traditionalre-insurers).
National offices of globalinsurers not alwaysautonomous or equippedto engage in local climaterisk analysis.
Maintain “insurableuniverse”; avoidundercutting from capitalmarkets (catastrophebonds).
Banks Awareness of the issueappears to exist in someparts of the bankingindustry; howeverquantifying andincorporating these risksappears mixed at best.
General short-term timehorizons, even for long-term assets.Preoccupation withnearer-term risks.Fear of bad publicity fromrestricting credit.
Unclear if any exist. Avoid future losses/write-downs.Head off scrutiny frominvestors, regulators.Shape public perception,marketing.Much of sector (esp. big4) probably have similarlevels of exposure (e.g.less a competitive issue).
Localgovernments
Varies between states,but local governmentsgenerally have goodaccess to historical perildata (e.g. they are oftenthe custodians of floodrecords).Access to climate changemodelling is much morelimited however.
Property rates are a keysource of revenue;disallowing developmentsor placing requirementsseen to be onerous couldharm revenue streams.
Fear of litigation fromdevelopers in the short-term.Lack of resources toproperly evaluate risk.
Avoid litigation risks thatmay materialise soonerthan expected.Avoid unexpecteddamage and rising repaircosts.
12
ActorAwareness and
informationaccess/visibility
Disincentives (or softbarriers) to action
“Hard” barriers toaction Incentives to act
Stategovernments
Varies considerably(e.g. New South Waleshas good climateprojection data buthistorical flood mappingdata is retained at localgovernment level).
Property sales stampduty is a large source ofrevenue. Insurance taxalso a source of revenue,to a lesser extent.Vague frameworkperpetuates ability to relyon federal governmentbailouts.More political points inproviding after the eventdisaster relief, than inproviding pre-disastermitigation.
Federal/state governmentfunding issues (COAGetc.).Lack of resources toproperly evaluate risk.
Budgetary limits toresponding to disasters.Costs that can’t be borneat local government levelcan become a stategovernment problem.State government debtratings could become anissue.
Federalgovernment
Mixed, as most granularrecords are gathered atstate/local level; but thereis some federally-fundedclimate modelling at finespatial resolution andfederal government haslaunched coastalmapping exercise withCSIRO.
Little outside pressure.More political points inproviding after the eventdisaster relief, than inproviding pre-disastermitigation.
Current uncertain policyenvironment.Marginal seats.
Fiscal position (ratingsagencies, natural disastercosts, contingentliabilities); avoidexpensive, unpredictableemergency payouts tostates.
Home owners Mixed, but can be verylimited depending onlocation and type of peril.
Incur short-term costs toavoid longer-termdamage.
Financing mitigation;financing retreat wherenecessary.
Protect home fromdamage (if possible).Avoid over-paying forrisky property.Keep insurancepremiums as low aspossible.
Developers(residential)
Mixed, can be very limiteddepending on locationand type of peril.
Ability to profit fromdeveloping vulnerablestructures in exposedareas. Accessing andrepaying financing.
Developers whothoroughly assess the riskmay have to chargehigher prices or pass upopportunities thatcompetitors will take up.Buyers are notincentivised to considerresilience when buyingoff-the-plan.
A “level playing field” sothat conscientiousdevelopers are notundercut by others.
Developers(commercial)
Varies but some bigcommercial developersare incentivised.
Planning requirementsare not exacting enough.
Developers thatthoroughly assess the riskcan be effectivelypenalised – they maypass up opportunitiesand appear more“expensive”, compared totheir competitors.
Insurability & value ofassets (if holding asset, orseeking long-terminvestors).A “level playing field” sothat conscientiousdevelopers are notundercut by others.
Investors Very limited, outside oflarge investors in largeinfrastructure orcommercial projects,where current and futurerisks are often explored.However risks present inequities or securities arerarely identifiable.
Access to informationfrom companies; nopressure to disclose.
To fulfil fiduciary duties,longer-term risks need tobe understood whereverpossible.
AustralianBuildingCodes Board
Reasonable, via PCrecommendations androundtable and review in2014.
Need to keepconstruction costs down.
Improve quality andresilience of new housingstock.

13
Who’ll suffer the consequences?There are many indications that the property-climate-peril-problem may, in fact, harm differentstakeholders in different ways. And, as onestakeholder experiences harm, there are flow-oneffects to other types of stakeholders:
+ Individuals: those buying residential propertiesfor investment or dwelling. It is difficult for a buyerto assess the natural peril risk of a property –particularly those risks which may increase overtime because of climate change impacts. Fieldresearch suggests that some individuals invulnerable areas may often have very low levelsof awareness of emerging risk such as sealevel.72 Lack of awareness and information wasexplored in our 2014 report, Buyer Beware,73
which found that comparing online homeinsurance premium quotes could be an indicatorof exposure to climate risks, particularly wherepremiums are high or vary greatly – although thisis obviously a poor substitute for rigorous andcomparable data.
+ Banks: where the home becomes uninhabitable,and/or the value of the land is reducedsubstantially, individuals may default, leading tolosses for banks.
+ Investors, superannuation funds and otherinstitutions which invest in banks and inresidential mortgage debt; may suffer losses ifmortgagees default.
+ Local governments: those local governmentswith more coastal exposed properties will seesources of revenue from rates and developerfees curtailed. At the same time, they will facehigher costs as infrastructure and key servicesbecome affected by escalating perils due toclimate change.
+ State governments: federal-state funding andtaxation frameworks mean state governmentspay many of the recovery costs from naturaldisasters and perils. The Queensland floods of2011 demonstrated how these events canstretch budgets, as the damage led to adowngraded outlook from some ratingsagencies,74 despite the state drawing onemergency federal funding. While no public bodyis specifically responsible for recovering privatehousing, flow-on effects in terms of demands onsupport services and harm to the economy willoften be borne foremost by state budgets. Statesalso draw significant revenue from insurancetaxes and property stamp duties75-76 which willfall as residential development and investmentrecede because of unaffordable insurance costs.
+ Federal government: funding recovery andrepair efforts after natural disasters have been thesubject of a Productivity Commission review anda business roundtable. Budget exposure toclimate change is a risk for a country highlyexposed to all the types of climate perils. In thisregard, Australia has been described asvulnerable by Standard & Poor’s.77 Inadequatepolicy means a lack of clarity around who bearsthe burden of the risks; in such situations,governments are generally assumed to be the“insurer of last resort” and often also the “adapterof first resort”, responsible for funding anymitigation. Such assumptions naturally dampenincentives for private sector and individuals to limittheir exposure.78
Contagion: Natural perils, climate changeand the financial system
Australia’s banks are heavily concentrated inresidential property, with mortgages making upabout 60 per cent of their assets.79 The propertymarket is also embedded in Australia’s financialsystem in ways that increase its exposure to climaterisk even more directly.
In recent years, demand for residential mortgage-backed securities (RMBS) has begun to flourishagain after a hiatus due to the global financial crisis,although it remains smaller than its pre-crisis size.80
While larger banks hold mortgage debt on their ownbalance sheets, smaller banks and non-bank lenderstend to “securitise” the debt – that is, sell it to otherbuyers, often larger banks and superannuationfunds. In this way, mortgage debt forms an integralpart of the Australian financial sector. Mortgage debtalso plays an officially-designated role in Australianfinancial market operations. RMBS have been aneligible form of collateral in repurchase agreements(repos, or day-to-day money market operations) withthe Reserve Bank of Australia (RBA) since 2007.Since 2013 the Reserve Bank has been acceptingself-securitised RMBS in its liquidity and open marketoperations. This measure was introduced inresponse to a supply-demand squeeze on domesticgovernment bonds which traditionally make up thebulk of securities used for this purpose.81 By mid-2014, RMBS made up 35 per cent of Australiandollar-denominated securities held under“repurchase agreements” by the RBA; compared tojust 4 per cent a year earlier.82 Since January 1,2015, these securities have also been designated aseligible collateral for banks to meet Basel III liquidityrequirements, through a scheme known as the“Committed Liquidity Facility” (CLF). As eligiblecollateral under the CLF, they represent “asubstantial contingent exposure for the RBA and,hence, understanding RMBS is particularly important

14
Damaged caused by Cyclone Yasi in 2011 to Carmoo, Queensland.Photo: Michael Dawes Flickr (CC BY-NC 2.0)
in terms of managing the RBA’s balance sheet”,according to RBA researchers.83
The geographical data included in these “internal”securitisations submitted to the RBA is no moredetailed than postcode level.84 Location data at thisscale is inadequate for determining or predictingnatural disaster and climate peril risk, which can varyover short distances and also depends on dwellingstructure.
While information provided to the Reserve Bank islimited to postcode-level, external researchers haveeven less insight. Due to privacy concerns, geo-location data is not accessible to independentresearchers at a level more granular than by statelevel or ABS region.85-86 There have been proposalsby information service providers to make this level ofinformation available while still protecting privacy.87
While only a small proportion of Australian housingmight be ultimately at risk of falling value due toclimate change, it should be remembered that a“contagion” effect has been observed in othermarkets where sudden repricing of risk occurred,particularly where there is limited informationavailable about the extent of risk throughout themarket. Relatively low levels of outright losses onsubprime mortgages precipitated the financialcrisis.88
While there are vast differences between thatsituation and the one we are describing here, there isno doubt that housing, mortgages and our retailbanks and other mortgage lenders all play anextremely large role in Australia’s financial system.
Our July 2015 paper, Australia’s Financial Systemand Climate Change89 explores in more detail therisks of contagion and interconnectedness resultingfrom climate change affecting the financial system.
Recommendations
+ Attempts to address extreme weather andclimate impacts to housing should encompassall actors and incentives.
+ Australian financial authorities should undertakespecific analysis of climate risk in relation to thefinancial sector, including possible impacts onthe property market.

15
Part 3: The role of insurers
Heroes or villains?
The insurance sector is often seen as having aunique role in relation to climate change. Theindustry is sometimes described as perilouslyexposed to climate change impacts, and at othertimes, as being brilliantly hedged against it. Thereality is of course more complex and varies frominsurer to insurer and market to market.
Interaction between insurance and climate changehas many facets. It has become a subject ofgrowing interest among academics, regulators andpractitioners. This paper provides only a briefoverview of some aspects of this complicated topic.Our 2014 paper, Buyer Beware,90 looks at climaterisk, insurance and Australian housing in more detail.
How prepared are insurers for climatechange?
Climate change has dire implications for bothinsurers, as specialists in risk, and their customers –and by extension, for society at large. In a worstcase scenario, an insurer collapsing due tounforeseen natural disaster losses would obviouslyresult in devastating social costs, in addition to theobvious financial ones.
The likelihood of this scenario is difficult todetermine. In the UK, the Prudential RegulatoryAuthority (PRA) conducted an initial risk assessmentof climate change and the insurance sector.91 Itidentified three types of risk, of which the “clearest”was physical risk – first order risks from weather-related events, combined with secondary risks fromsupply chains or resource scarcity that might arisefrom weather events. The PRA also identified“transition risks”, relating to shifts to a lower-carboneconomy, and “liability risks” which can indirectlyresult from either of the first two risks, but manifestin professional indemnity or director and officerinsurance.92
The report pointed out that catastrophe modelling,re-insurance, new sources of capital anddiversification all suggest the industry is well-equipped to handle current levels of natural disasterrisk. It is not clear how applicable these findings areto Australia,93 as no such authoritative review hasbeen carried out.
Catastrophe risk and the price of premiums
The retail insurance business model means that thechanging levels of risk can be accounted for morefrequently when setting premiums. If a catastropheoccurs in one premium period, the risk is thereforeassessed as increased and the premium can beincreased for the next period.
Box 6: Premium variance and absentee insurers – what do insurers know?
If premiums vary widely, what does that tell us about the insurer’s resilience?
Our 2014 paper, Buyer Beware,94 demonstrated that premiums quoted by different insurance companies couldvary for the same type of coverage on the same address. While this will often merely reflect different risk appetitesor strategies, the study found that in certain areas, quotes varied by a factor of more than 200 per cent or even10,000 per cent. In certain locations, some insurers were not prepared to provide an online quote – often indicatinga reluctance to offer cover at all. Both the rate of this insurer “absenteeism”, and the degree of difference in quotedpremiums, were much more likely in areas that were known to have a high risk of weather events. Wheredifferences are great or some insurers are “absent”, it raises two troubling possibilities: that the cheaper or still-present insurers will raise premiums or join the “absentee” peers in quitting the area; or that they are under-estimating the risk, with attendant implications for resilience among individual insurers. A third possibility is that poorvisibility of future extreme weather risk is leading some insurers to over-price premiums.
16
In Australia today, most home insurance premiumsare derived from an assessment of risks to eachindividual dwelling. That is, the premium reflects (atleast partly) the insurer’s estimate of the averagecosts of meeting claims.
Premium pricing levels are a determinant of aninsurer’s profitability and are therefore a key factor inits financial resilience. For insurers in the generalinsurance (GI) market, calculating the risk of “low-probability, high impact events” is crucial for them towithstand a sudden surge in claims.
Importance of modelling catastrophe risk
Australian insurers are generally considered well-supervised, particularly since reforms were adoptedafter the collapse of HIH Insurance in 2001.95
The exact level of capital held by each insurer,however, depends to some extent on how theinsurer has modelled its risk of these rare but costlyevents. It also depends on how the insurer usesthese models to analyse its risk and its capitalrequirements.
The recent increase in insurance payouts related tonatural disasters96 is likely a combination of naturalvariability, increased exposure and climate change.The Australian Prudential Regulatory Authority(APRA) has underlined the importance for insurers tomake robust assessments of natural disaster risks.97
Catastrophe models are extensively used byinsurers covering these types of risks.98 APRA hassignalled several times to insurers that they shouldtake great care to ensure their decisions relating tocatastrophe risk are not based on accepting theresults of models without questioning theirassumptions and shortcomings. Some of thisguidance has specifically referred to the need toseek climate change expertise.99
Insurers and the role of communicating risk
Insurers sometimes point to the important rolepremiums play in “signalling” risk, providing theirprice is based on robust judgements. Risk-basedpremiums would tend to support this contention.
However the premium ‘signal’ only applies to thenext 12 months’ worth of risk. While the resident,owner or financier will be exposed for a much longerperiod, it is not an insurer’s role to warn customersof longer-term risks.
The insurance industry does however share aninterest in the longer-term resilience of the housingstock; albeit in a more subtle way. Where risksbecome too high, they become “uninsurable” – theprice of the risk makes the premium effectivelyunaffordable.
If the frequency of damaging events continues torise due to climate change, more areas will becometoo risky for insurers to cover at any price. This canlead to reputational and political risks, andultimately, a shrinking in the market for insurersthemselves.100
Consumer advocates point out that it is usuallydifficult for individuals to find out exactly why theirpremiums have risen, or to contest them.101
Additionally, finding out how they could make theirhouses less vulnerable to reduce future risks andpremiums is also not always easy for consumers.
Finally, insurance as it is traditionally conductedcannot change the underlying risk – it can only transferthe cost. As risk rises because of climate change, thatincreased cost will inevitably be transferred toindividuals. This repricing can take place rapidly, forexample when information improves.
Some insurers are attempting to address this inspecific areas – particularly Northern Queensland –via projects to reduce premiums for houses andapartment buildings that have performed works toimprove resilience to cyclones.102 These projectshave recently been extended from strata dwellingsto stand-alone housing.103 Although this is a goodexample of industry addressing a market failure, ithas limited application to some impacts related toclimate change, such as coastal inundation, whichare generally not insurable.104105
Measuring climate change impacts
Impacts of climate change on insurers
Assessing the likely impacts of climate change oninsurers is difficult. In recent years, higher levels ofnatural disaster claims have affected the profitabilityof Australian insurers. A similar trend has been seenworldwide.
Yet, it is difficult to discern precisely how much ofthis might be attributable to climate change, asopposed to falling within historically normal ranges.Though the science of attributing specific events toclimate change has improved greatly in the past fewyears, it remains mostly probabilistic.
Three recent attempts to understand and assesspossible gaps in insurance and reinsurancecalculations of climate change:
1. Modelling by Standard & Poor’s106 examinedthe potential impact of climate change in thehigher-than-normal payouts for natural disasterclaims worldwide during the past decade; theirresults indicating that reinsurers might beunderestimating their exposure to a 1-in-10year catastrophe to the extent that losses willbe an average of about 50 per cent higher thanthey currently model.

17
2. Lloyd’s of London published a report with inputfrom three vendors of catastrophe modellingsoftware used by reinsurers in 2014 andconcluded that climate change was mostly onlyincorporated via historical data and notexplicitly.107 However this has more recentlybeen disputed by some reinsurance industryfigures.108
3. A 2014 study by a group of Australian actuariesand climate scientists,109 using the portfolio of amajor Australian insurer, indicated that theimpacts of climate change would mean somehome premiums would reach 38 per cent ofaverage annual household income by 2100 –easily exceeding any definition of “affordability”.The authors note that even their findings will becertain to have underplayed the extent of theproblem, as it would exclude properties that arealready “uninsurable”, and does not explore thefull range of exposure levels in each area.
Conclusion
Climate change is a complex question for insurers –but perhaps it is more transparent than for manyother industries. Improvements can and should bemade in both the industry’s own handling of climaterisk, and its engagement in the broader policydebate.
The difficult matter of whether technical modellingand risk assumptions adequately account forclimate change is deserving of more scrutiny inAustralia. The review and further work in train by theBank of England and the Prudential RegulatoryAuthority provide a guide for the types of issues thatshould be explored.110 111112
Box 7: Blame the messenger? The Northern Australia case
The insurance sector’s climate change predicament is further complicated when it comes to their role asconsumer-facing companies in a relatively competitive and mobile market. The experience of NorthernAustralia illustrates this perfectly, over the past few years, home insurance premiums rose rapidly. Manyhomeowners found their premiums increased four- or five-fold. Some could no longer find an insurer willing togrant them coverage at all.
The Australian Government Actuary found that the prohibitive premium setting was not due to inappropriatebehaviour by insurers and that competition within the industry was unlikely to be a big factor.109 The two mainculprits were increasing payouts related to cyclone damage and the shift towards “risk-based” premiumpricing. Risk-based premiums meant that each individual address was quoted according to its own risk. So,for example, a house built prior to 1982, when cyclone proofing standards came in, would tend to have higherpremiums than a neighbouring house built more recently. The same would go for a house located in a low-lying storm surge area, compared to one in an elevated position.
The AGA concluded the premium rises simply reflected the increased “payout ratio” in the region: for every $1an insurer took in premiums between 2005-06 and 2012-13, they had paid out $1.40 in claims.110
A quick browse through the local media news coverage, however, reveals that most of this was lost on thehomeowners of Northern Australia who could no longer afford or even obtain insurance: they tended to blamethe insurers themselves.
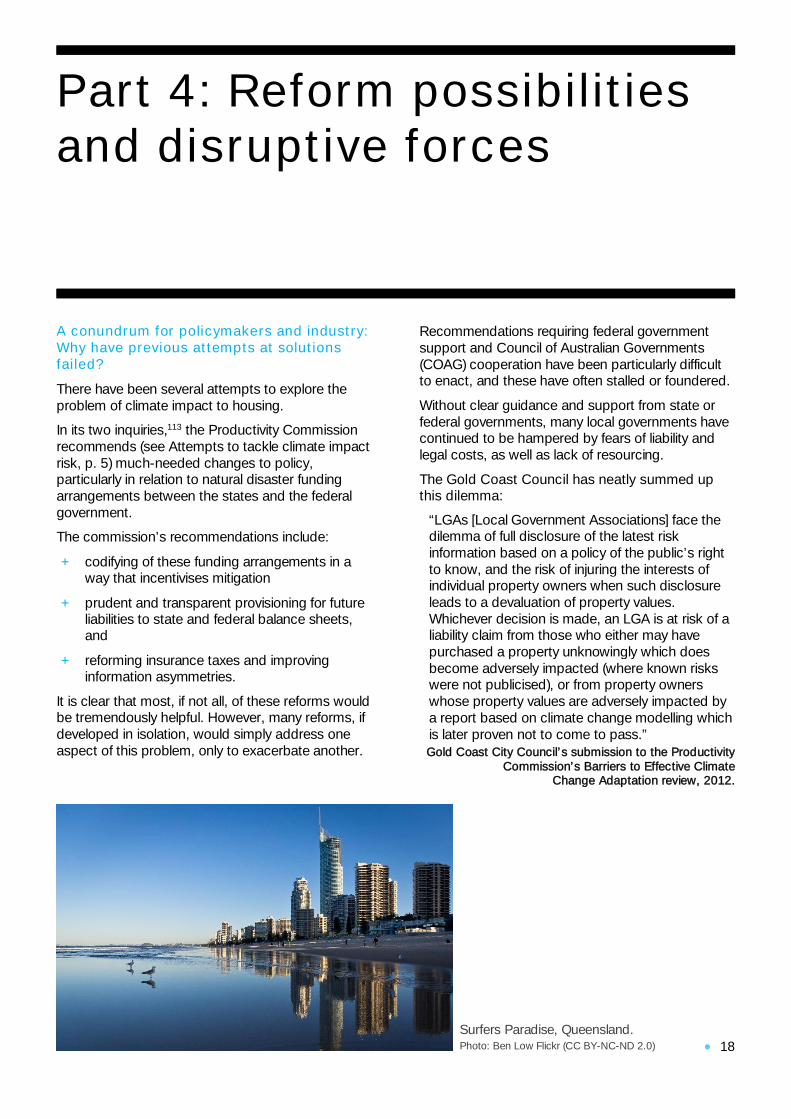
18Surfers Paradise, Queensland.Photo: Ben Low Flickr (CC BY-NC-ND 2.0)
Part 4: Reform possibilitiesand disruptive forces
A conundrum for policymakers and industry:Why have previous attempts at solutionsfailed?
There have been several attempts to explore theproblem of climate impact to housing.
In its two inquiries,113 the Productivity Commissionrecommends (see Attempts to tackle climate impactrisk, p. 5) much-needed changes to policy,particularly in relation to natural disaster fundingarrangements between the states and the federalgovernment.
The commission’s recommendations include:
+ codifying of these funding arrangements in away that incentivises mitigation
+ prudent and transparent provisioning for futureliabilities to state and federal balance sheets,and
+ reforming insurance taxes and improvinginformation asymmetries.
It is clear that most, if not all, of these reforms wouldbe tremendously helpful. However, many reforms, ifdeveloped in isolation, would simply address oneaspect of this problem, only to exacerbate another.
Recommendations requiring federal governmentsupport and Council of Australian Governments(COAG) cooperation have been particularly difficultto enact, and these have often stalled or foundered.
Without clear guidance and support from state orfederal governments, many local governments havecontinued to be hampered by fears of liability andlegal costs, as well as lack of resourcing.
The Gold Coast Council has neatly summed upthis dilemma:
“LGAs [Local Government Associations] face thedilemma of full disclosure of the latest riskinformation based on a policy of the public’s rightto know, and the risk of injuring the interests ofindividual property owners when such disclosureleads to a devaluation of property values.Whichever decision is made, an LGA is at risk of aliability claim from those who either may havepurchased a property unknowingly which doesbecome adversely impacted (where known riskswere not publicised), or from property ownerswhose property values are adversely impacted bya report based on climate change modelling whichis later proven not to come to pass.”Gold Coast City Council’s submission to the Productivity
Commission’s Barriers to Effective ClimateChange Adaptation review, 2012.
19
As public policy struggles, focus turns toinsurance
The problems of insurability and insuranceaffordability, for example, have several times beenflagged for policy reform by governments, to littleeffect.114
One policy option that is sometimes discussed isinsurance that “pools” risk – and thereby allowseveryone an equal premium, rather than a premiumbased on their actual risk. Risk is already pooled incertain cases in Australia – for example, in thegovernment-backed terrorism re-insurance pool.Health insurance is also generally pooled to somedegree.
However, for natural disaster risks where exposuresare concentrated in particular areas, and can beavoided or minimised, pooling can be problematic.The implementation of pooling can become moreakin to “cross-subsidisation”, because in contrast toterrorism insurance, it is obvious which areas willhave higher risk. While pooling can make premiumsmore affordable for individuals in those higher risklocations and dwellings, it also removes “risksignals” that risk-based premium pricing wouldconvey and thereby incentivises further riskydevelopment.
The US National Flood Insurance Program is a primeexample of this problem. Developments in flood-exposed and coastal areas have increased since itsinception, while the scheme itself is underfundedand regularly draws on government funds to financepayouts.115 Providing insurance for even highly-exposed structures and locations rewards risk-taking and fails to incentivise mitigation. That in turnsbecomes an example of “moral hazard” in whichprivate interests can profit from their risks in theknowledge that any losses will be borne by thebroader public.116
Private sector initiatives
In the absence of a comprehensive policy solutioninvolving all levels of government, some privatesector stakeholders have attempted to step into thebreach.
The Insurance Council of Australia (ICA) hasundertaken a “Property Resilience and ExposureProgram” (PREP) which seeks to share informationon resilience and housing stock between insurersand local councils.117 The goal is to help localgovernments decide whether and where to fund“mitigation infrastructure” – such as levees – that willprotect assets and bring down insurance premiumsfor their constituents.
Cross-industry groups such as the AustralianBusiness Roundtable on Natural Disaster Resilience
& Safer Communities, and Green Cross Australia’sBusiness Adaptation Network seek to expose andaddress the problem through different means. Thelatter has concentrated on multi-sector and public-private collaborations, rather than policy outcomes.The Business Roundtable, meanwhile, has soughtconsistent collation of natural peril mapping data,and a removal of barriers to accessing this data,along with incorporating resilience as a key nationalpolicy priority.118
There are also private sector initiatives such asthose proposed directly by the insurance sector.There are some notable localised examples ofcollaboration between the private sector andmultiple levels of government – such as levee-building in Roma and several other Queenslandtowns,119 or dropping premiums in exchange forhome works. However, they have not translated intomore widely-applicable changes, either at policy orindustry level.
Private sector initiatives have struggled to addressall aspects of the problem, and few have explicitlyaddressed future risk levels arising from climatechange (Appendix 5).
As noted in Part 3, while the insurance sector couldmake improvements, it is not wholly in the insurers’power to address all the causes of excessiveproperty climate risk. Furthermore, becauseinsurance providers operate in a very competitivemarket with short-term contracts and high customermobility, their incentives to do so are limited.
A lack of data, or a lack of access?
Information about extreme weather and climatechange risks to residential properties has been thesubject of intense debate. Most analyses of extremeweather and climate change impacts in Australia willmention problems with data.
However there are two distinct issues with data(whether records, modelling, or mapping):
1. adequate data doesn’t exist
2. data does exist, but is not available to eachactor – or is only available at a prohibitive cost,at poor resolution, or in a restricted data format
For example, all flood records in New South Walesare held by individual councils. None of it is centrallyhoused; although most120 is now incorporated intothe Insurance Council of Australia’s National FloodInsurance Database.121 The same type of data is notavailable in a consistent manner across the state.Some councils make the data available on request;others do not, or charge extremely high fees. Thismeans councils, and in some cases insurers, hold riskinformation that is effectively unavailable to others.

20
The ICA for its part has called for public hazard datato be freely available wherever possible. Its secondsubmission to the Productivity Commission DisasterFunding Arrangements review states:122
“Greater progress could be made if COAGresolved that all States and Territories shouldpublish relevant hazard mapping through acommunity-accessible GIS portal, perhaps linkedto each state's emergency services, naturalresources, environment or planning departments.A national portal, should each state governmentwish to deliver information through theCommonwealth, is a further refinement of theneed.
A COAG resolution should seek to:
+ Remove persistent issues regardingownership of datasets that have been createdwith public funds
+ Neutralise the legitimate liability concerns formany stakeholders
+ Ensure that any geospatial data (accountingfor national security concerns) is published inthe national interest under creative commonsstandards.
The ICA submits that cost recovery for thedevelopment of hazard data should be appliedonly to a small number of highly specialised dataresources (those with data not commonly appliedto the needs of the general community) and thatthe general presumption should be that such datashould be released under creative commons.”
Some public sector initiatives have been launched orare underway to address geographical and hazarddata access problems, such as nationalmap.gov.au,but significant gaps remain,123 even for largecommercial users.124
Despite barriers, new tools are appearing
For many years, a key barrier to good information onclimate impact risk has been the expense anddifficulty of gathering such information.
This is particularly relevant to climate changeprojections, which are rapidly evolving and oftenrequire extremely specialist knowledge andcomputing power. However, the expense ofgathering some types of geospatial data has alsobeen a barrier.
However three developments are quickly erodingthese barriers:
+ availability of more detailed geospatial mappingdata at lower cost
+ advances in climate models
+ faster computing power, cloud computing andother general technological improvements.
In combination, these developments mean thatdetailed, location-precise information on current andfuture levels of risk will become widely available forresidential properties. Commercial products andservices are likely to emerge that build onimprovements in climate modelling, better availabilityof geo-location mapping, and advances in generalcomputing power.
For example, Geoscience Australia is makingavailable, for the first time, LIDAR mapping for mostof the country.125
Some organisations - like Climate Risk, NGIS, RiskFrontiers, and the CRC for Spatial Info – aregathering and analysing information to turn it intoproducts. Some of this analysis is beyond whatmany brokers, conveyancers, banks and even someinsurers can execute.
21
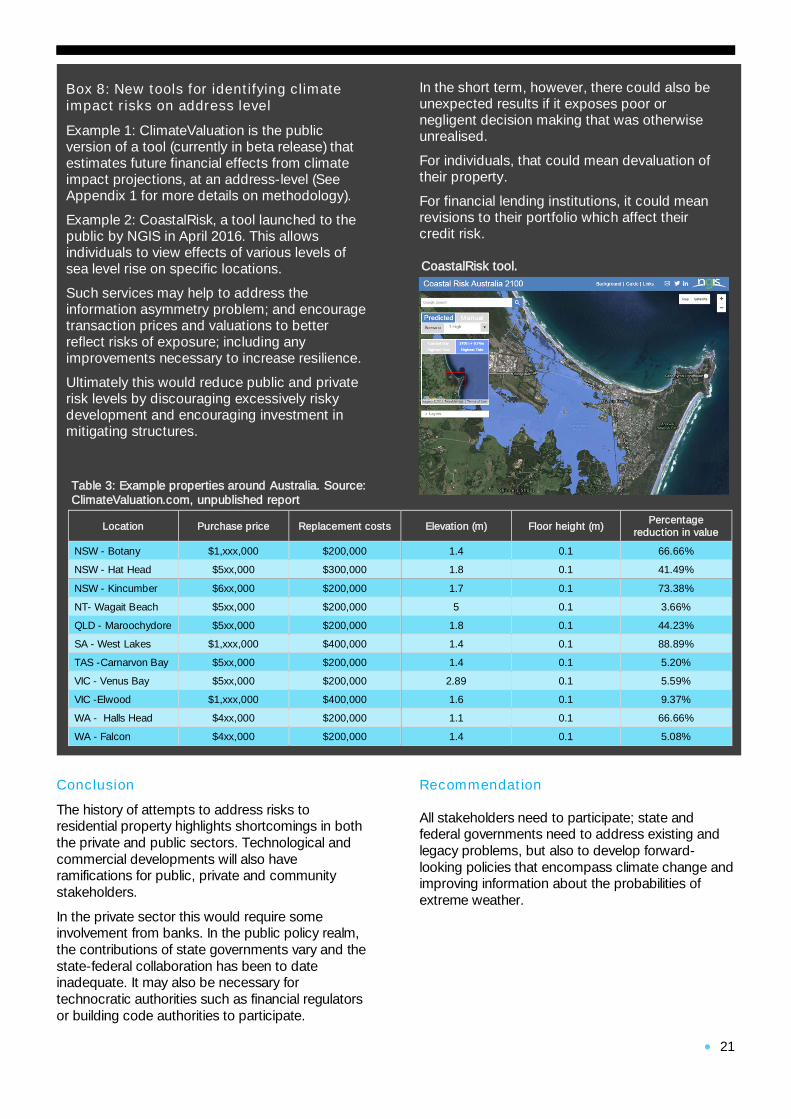
Box 8: New tools for identifying climateimpact risks on address level
Example 1: ClimateValuation is the publicversion of a tool (currently in beta release) thatestimates future financial effects from climateimpact projections, at an address-level (SeeAppendix 1 for more details on methodology).
Example 2: CoastalRisk, a tool launched to thepublic by NGIS in April 2016. This allowsindividuals to view effects of various levels ofsea level rise on specific locations.
Such services may help to address theinformation asymmetry problem; and encouragetransaction prices and valuations to betterreflect risks of exposure; including anyimprovements necessary to increase resilience.
Ultimately this would reduce public and privaterisk levels by discouraging excessively riskydevelopment and encouraging investment inmitigating structures.
In the short term, however, there could also beunexpected results if it exposes poor ornegligent decision making that was otherwiseunrealised.
For individuals, that could mean devaluation oftheir property.
For financial lending institutions, it could meanrevisions to their portfolio which affect theircredit risk.
Conclusion
The history of attempts to address risks toresidential property highlights shortcomings in boththe private and public sectors. Technological andcommercial developments will also haveramifications for public, private and communitystakeholders.
In the private sector this would require someinvolvement from banks. In the public policy realm,the contributions of state governments vary and thestate-federal collaboration has been to dateinadequate. It may also be necessary fortechnocratic authorities such as financial regulatorsor building code authorities to participate.
Recommendation
All stakeholders need to participate; state andfederal governments need to address existing andlegacy problems, but also to develop forward-looking policies that encompass climate change andimproving information about the probabilities ofextreme weather.
CoastalRisk tool.
Location Purchase price Replacement costs Elevation (m) Floor height (m)Percentage
reduction in value
NSW - Botany $1,xxx,000 $200,000 1.4 0.1 66.66%
NSW - Hat Head $5xx,000 $300,000 1.8 0.1 41.49%
NSW - Kincumber $6xx,000 $200,000 1.7 0.1 73.38%
NT- Wagait Beach $5xx,000 $200,000 5 0.1 3.66%
QLD - Maroochydore $5xx,000 $200,000 1.8 0.1 44.23%
SA - West Lakes $1,xxx,000 $400,000 1.4 0.1 88.89%
TAS -Carnarvon Bay $5xx,000 $200,000 1.4 0.1 5.20%
VIC - Venus Bay $5xx,000 $200,000 2.89 0.1 5.59%
VIC -Elwood $1,xxx,000 $400,000 1.6 0.1 9.37%
WA - Halls Head $4xx,000 $200,000 1.1 0.1 66.66%
WA - Falcon $4xx,000 $200,000 1.4 0.1 5.08%
Table 3: Example properties around Australia. Source:ClimateValuation.com, unpublished report
22
Part 5: Why banks need tobe part of the solution
Where do banks fit in?
Banks and other lending institutions have not played alarge role in the discussion to date, yet they have aunique ability – and incentive – to curb the growth ofat-risk property:
+ banks constitute the ultimate gatekeepers formost home purchases,126 thereby allowing themto constrain lending for the riskiest properties anddevelopments
+ banks have a long-term, “sticky” relationship withmortgage clients that involves regular contactthrough repayments, interest rate adjustmentsand other changes
+ banks provide the large majority of financing fornew residential development127
+ banks represent a large segment of theAustralian economy, giving them great influencein public and policy dialogues
+ banks are exposed to losses from naturaldisaster and climate impacts,128 thereforeproviding them with a financial incentive to play arole in addressing this matter
+ while proof of home insurance is required toobtain a mortgage, most lenders do not monitorin subsequent years if insurance has beenrenewed; nor do they require specific scope ofcoverage.129-130
How exposed are they?
The size of the exposure among individual lenders, orin the mortgage lending sector in aggregate, is difficultfor independent researchers to assess. Even businesslending is challenging and little studied:
“The impacts of climate change on the bankingsector have not received much attention in theinternational literature, even though the sector has acentral role to play in financing the necessaryinvestments for the transition to a low carboneconomy and the adaptation to climate change. Thebanking sector is indirectly affected by climatechange through the exposure of its borrowers to itthat generates physical and regulatory risks.However, to date, only a few banks at global leveluse quantitative indicators for the integration ofenvironmental risks into their credit riskmanagement, especially regarding climate change.”
Georgopoulou et al, 2015131
A starting point to assessing such risk to themortgage book would be data about the geographicallocation of properties which banks have loanedagainst. This data is difficult to obtain; in part due tocommercial confidentiality, but also because of limitedregulatory requirements for disclosure (this is furtherdiscussed in Part 2).
However, in private conversations, and industryforums,132 a number of arguments are commonlymade as to why Australian banks should not beinvolved in monitoring natural peril and climate risk ontheir mortgage books.
“…SOME OF THE VARIED IMPACTS OF CLIMATE CHANGE—RISING SEA LEVELS,CHANGING RAINFALL AND FLOODING PATTERNS, INCREASING TEMPERATURES—MAYNOT BE INSURABLE. AS A RESULT, SOME IMPORTANT FEATURES OF HOUSING FINANCEMAY HAVE TO CHANGE.”
Freddie Mac, 2016133

23
Banks have tended to avoid policy discussionon the issue
Although banks are key actors, most have beenrelatively silent on the matter in publiccommunications,134 particularly in comparison toinsurers.
On many occasions following natural disasters, largebanks have, via their industry association, announcedrelief measures for customers. Yet, with someexceptions, they have made little public comment onaddressing systemic problems related to disasterresilience and climate change impacts.
The question of exposure among banks, particularlythe big four banks, has been raised several timespublicly, as well as in specialist contexts, such asindustry roundtables and expert conferences.135 Thesector has, in public at least, been largely silent onthis issue with a couple of exceptions: primarilyWestpac136 and Suncorp137; and only the latter hasexplicitly mentioned climate change in policysubmissions.
One example of the banking sector articulating aposition on natural perils is the Australian Banker’sAssociation’s (ABA) submission to the NaturalDisaster Insurance Review.138 It should be pointed outthat this review considered only flood risk. It did notrefer to other natural hazards, or to climate change.
In its submission, the ABA said there is no significantrisk to its members:139
“However, while it is generally in the financialinterests of banks to have collateral protected byinsurance, banks have a number of risk mitigationtools, including:
+ Not lend: Banks can decide not to lend. Thisoption removes any risk from the loan and iscommonly used.
+ Loan to value ratio: Banks can ensure LVRsare set prudently to act as a buffer against loss.
+ Credit enhancement: Banks can imposerequirements to address risks and improve thecredit position, such as Lenders MortgageInsurers (LMIs)
+ Capital: Banks can increase the amount ofcapital held against any particular financialexposure. The riskier the exposure, the morecapital the bank must hold against the loan.
+ Risk assessment: Banks can use historicalprecedence in determining a risk mitigationstrategy.
Banks have many options to assess and managelending risks. In a competitive market-basedindustry, banks need to determine their own
strategy to manage their lending decisions andsubsequent financial exposures.
Additionally, while it may appear that some risks arelarge, in reality these risks may be inconsequentialfrom a banking loss perspective.
The ABA is advised by member banks that, despitethe widespread impact of the recent Victoria andQueensland floods, lending books have not beenadversely affected. Lending losses in relation to non-insurance or under insurance have been negligible.Notwithstanding this low actual impact on lendingbooks, we understand that some banks arecurrently reviewing their lending practices due totheir experiences with the recent natural disasters.Some banks have also reduced their maximumLVRs (loan to valuation ratios) for loans onproperties in flood risk areas.
The ABA’s arguments refer specifically to theparticular flood events covered in the NationalDisaster Insurance Review, but they do not transposeacross all natural peril risks. As with the review itself,they do not address climate change.
The submission points out that some banks have infact applied more stringent credit standards onproperties they considered to be at flood risk.However, there is also an acknowledgement thatsome banks are reviewing lending practices afternatural disasters, suggesting a post-hoc approach tomanaging these risks. With climate change expectedto increase the severity of some types of flooding, it isunclear how banks are managing the future risk levelsand increased uncertainty that may occur within amortgage term.
Other arguments against exploring bank riskfrom climate impacts to housing
In our conversations with industry participants andanalysts, several other factors have been raised aspotentially negating the risks of climate impacts tobanks’ mortgage books. They include:
+ large mortgage lenders are geographicallydispersed enough that no single disaster wouldbe material
+ full-recourse loans in Australia preventmortgagors from “walking away” from their debts
+ most of a property’s capital gains accumulatebecause of the land rather than the building:natural disasters that damage or destroydwellings are unlikely to greatly reduce value
+ although mortgages are typically issued for 25years in Australia, most are refinanced in five toseven years.

24
These factors, while individually correct, do not provethere is no risk on bank mortgage books. This islargely due to two problems:
+ data to support some of these assertions are notavailable
+ many of these assertions are less relevant whenclimate change is considered.
We will unpack each of the “mitigating factor”arguments in more detail below:
1. Property value in land: The assertion that theproperty’s value is solely in the land rather thanthe building will be irrelevant in severalscenarios, particularly when we consider climatechange. For example, there are limitations tomeasures that can mitigate the effects of coastalerosion.140 Land that is at increasingly frequentrisk of flooding may be still suitable for dwellings,but the increasing cost will reduce the value ofthe properties. This has been seen in bushfire-prone areas.141
2. Full-recourse loans protect banks:Australian mortgages are almost universallyissued on a “non-recourse” basis. This meansthat, in contrast to some US states, borrowerscannot simply “hand back the keys” to theirlender, thereby offloading their obligations. InAustralia, the risk of property devaluation remainswith the individual, while the banks are relativelyprotected from a scenario in which borrowersdefault on properties that become worth lessthan the amount of the outstanding loan.
3. Already incorporated into credit riskpractices: A review of big four banksubmissions to CDP (formerly Carbon DisclosureProject) reveals a broad range of approaches tophysical climate risk in the residential mortgageportfolio.142 While all banks discuss climateimpact resilience measures for their own propertyportfolio (bank branches etc.), and two banksmention incorporating physical climate risk intotheir commercial lending practices, there is littlemention of incorporating physical climate risk intoresidential property lending risk assessments.This is detailed in Appendix 5.
4. Size and distribution of property portfoliosmean this couldn’t be material for big banks:Several banks have already disclosed exactamounts of provisioning following naturaldisasters. In fact, at least three of the big fourbanks have individually acknowledged there issome risk. We take the following from the CDPsubmissions over the past 10 years by Westpac,National Australia Bank, ANZ Bank andCommonwealth Bank Australia (see Appendix 4for more detail):
+ Westpac has acknowledged in several CDPsubmissions that increased flood risk fromclimate change represents a risk to itsmortgage and other loan assets.
+ ANZ in 2007 said it would begin to devise amethod to analyse this risk.
+ NAB states that it is exposed to the physicaleffects of climate change to its customers,not only in residential property, but also as anagri-business lender.
It is true that all amounts of costs incurred todate are small relative to the banks’ overallbalance sheets – for example, NAB reported a$76 million provision for bad and doubtful debtsassociated with the 2011 floods in Queenslandand Victoria.143 However the nature of climatechange means these risks will increase –particularly if urban, coastal developmentcontinues to grow without adequate resiliencestandards.
5. Use of mortgage insurance removes risk tobanks: Mortgage insurance is taken out bybanks to protect against loss from mortgagedefaults, particularly where the loan-to-valuationratio is high, or when the borrower is deemedhigh risk. Lenders mortgage insurers (LMIs) arethe providers of this cover. In terms of financialrisk, LMIs will specifically not cover loss due tonatural hazards. There is also debate around therole of LMIs in Australia, in terms of their ownfinancial stability and their role in the broaderfinancial system. An RBA report in 2013 notedthat while industry practices have mitigated somerisks related to LMIs, they are highly correlated tothe broader mortgage market. Therefore in acredit market downturn, LMIs could be pro-cyclical, or at least fail to be counter-cyclical.144
Another limitation of LMIs is that they only coverabout a quarter of all mortgages. The limitationsof LMIs as a hedge against mortgage losses areillustrated by mortgage-related losses suffered byseveral banks due to natural disasters (seeAppendix 4 for more details). Finally, Australia’sprudential supervisor, APRA, has explicitly limitedthe amount of protection that banks can assignto LMI, by placing a floor of 20 per cent for “lossgiven default” on internal risk-based (IRB)models. This is the same whether or not themortgage is covered by LMI.145
6. Average mortgage duration: Averagemortgage age in Australia is thought to be around4.5 to 5 years.146 However this is an average froma market that has, in aggregate, grown every yearfor decades. Although definitive data is notcollected on non-securitised mortgage age, it islikely a proportion is due to owners “cashing out”
25
as prices rise. This is unlikely to be a mitigatingfactor for banks with up to 25-year mortgageexposures on risky properties.
Prepayment, meanwhile, would provide bothhomeowners and lenders with a “buffer” againstany type of financial shock. In 2010, prepaymentamounted to a little over 10 per cent of totalhousing debt stock.147
How could banks contribute to a solution -and why would they?
Effectively managing this risk may require banks toexplore in some detail the risk on their existing loanbooks. Such a move may reveal some exposure, butit would bring a number of benefits for the individualinstitutions and the sector:
+ Timely intervention to reduce risks of alltypes: Analysing mortgage debt at-risk for anyone individual institution is unlikely to be a simpleexercise. Deciding how to act on it will be evenmore complex – for banks themselves, theirinvestors and supervisors. A pro-active review oftheir own exposure to climate and natural perilsthrough mortgage debt would ward off questionswhich may arise over time.
+ Improve internal credit risk practices toavoid unknowingly increasing risk in themortgage book: This would encouragedevelopment of lending practices whichrecognise natural peril risk – thus providing ahard limit to a key avenue for expanding thestock and value of vulnerable residential property.
+ Curb growth in “emergency funding” banksare often required to provide after naturaldisasters. To date such spending has been smallbut as both the stock of exposed housing, andincidence of extremes increase, this may lead to amaterial increase in the costs of natural disasters.
+ Industry co-operation to avoid perverseincentives: As with insurers, if the industryapproaches this in a haphazard way, banks thatadopt more prudent lending standards and riskappetites could effectively be penalised in theshort term.
+ Avoid a chaotic, damaging devaluation:A pro-active stance would provide an opportunityto reduce the individual and social harms thatcould arise from a sudden recognition of naturalperil and climate risk.
+ Build customer loyalty and avoid potentialbacklashes: To date, insurers have often beenthe “messengers” of increased natural disasterrisk. However, when banks restrict or ceaselending in certain areas, they attract criticism fromexisting residents for affecting housing values.148
The reforms required to address the financial risks ofclimate impacts to residential property would requiresupport from multiple stakeholders. All levels ofgovernment need to play a role, particularly federaland state. The insurance and property developmentsectors are also key, as are authorities such asAustralian Building Codes Board. The importance ofthese stakeholders is detailed in reports andrecommendations from two Productivity Commissioninquiries.149
We focus on banks because their role as gatekeepersto housing finance means they could play a key role inaddressing this problem; particularly in such aconcentrated sector. Moreover, it appears that banksthemselves may be at some risk, as described above.An assessment of their own risk and a strongerengagement with the issue would serve severalpurposes.
However, banks may also face barriers toaction
The structure and nature of Australia’s bankingindustry may itself create barriers to individual banksseeking to manage their mortgage risk from climateimpacts.
For example, where a bank conducts a thoroughanalysis of its credit risk via climate impacts tohousing, a rational response might be to tightenlending requirements for more exposed locations, ormore vulnerable housing stock. However banks doalready impose geographical restraints on lending.One major bank publicly declaring it had raised LVRsin specific locations due to rising credit risks.150
In another example, a smaller bank clarified that it didnot extend mortgages to any dwellings on islands,with the exception of Tasmania.151
Some banks have indicated that privacy rules may bea barrier to getting access to information – forexample, sharing between the insurance and bankingsectors, or even between the general insurance armof a retail bank (or vice versa).
When recent privacy restrictions on securitisedmortgage data are considered, these concerns maybe well-founded. However, this also strengthens thecase for bank industry itself to advocate for goodpublic policy or financial regulatory rules that supporta sustainable outcome.

26
Aftermath of Tasmanian bushfires that ripped through communities on the Tasman Peninsula in January 2013.Photo: Michael Hall, The Climate Institute Creative Fellow 2012/14.
Recommendations
Australian banks should:
+ examine climate risk to their own mortgagebooks and ensure it is integrated into their riskassessment processes
+ use their role as the predominant providers ofproperty development finance to support goodpolicy – both through individual commerciallending decisions and through submissions toand engagement with policymakers
+ work with other stakeholders – in the public,private and civil society sectors – to researchand develop ways to minimise climate impactrisk to housing, and to address losses that willoccur in an equitable way
+ actively support the development of:
+ an open and accessible platform for naturalperil data, including both historicalincidence and projected or emerging risksdue to climate change
+ policy to achieve this outcome
+ make information publicly available so thatmarket expectations can adjust gradually,avoiding sudden, detrimental impacts.
27
Conclusions andrecommendations
Australia’s vulnerability to climate change is bothwidespread and complex. Australia is a country thatis particularly exposed to natural perils and climatechange. It is also particularly reliant on residentialproperty for wealth and growth. This suggests aconvergence that should be carefully considered inany attempt to gauge the overall risks to oureconomy in the medium to long-term.
While many thoughtful and concerted attempts havebeen made to address extreme weather and climateimpacts to residential property, they are often limitedby a lack of coordination and support from allstakeholders in both the public and private sectors.
Importantly, just as institutional financial risk isrecognised, individuals who have unknowinglybought risky dwellings should also be consideredand have recourse to a fair approach to bothmitigation and, where necessary, retreat. At thesame time, those measures must take care not toreward reckless risk-taking. In particular, they mustdiscourage the development of further risky assets.
Recommendations for policymakersMany of the recommendations by the ProductivityCommission in its 2013 and 2014 reviews152 wouldgo a considerable way towards addressing theproblems and risks described here. However,although its 2014 report, Natural Disaster Funding,made recommendations for the insurance sector, thecommission declined to identify a role for the bankingsector, or to identify a role for the state in relation toinformation provision specifically.153 Our additionalrecommendations below relate specifically to the roleof the financial sector and, in particular, banks:
+ the extent of exposure of Australia’s housingstock to climate change should becomprehensively studied
+ public policy reviews relating to extremeweather, natural disasters and coastal hazardsshould all explicitly address climate change,using the latest science
+ this consideration of climate change should berisk-based, in recognition of the probabilisticnature of climate forecasts and natural hazards
+ the distribution of risks and rising uncertaintyand volatility of risks should be transparentlyconsidered, even though policy will ultimatelytend to take a position based around meanaverage forecasts
+ high quality information on current and projectedlevels of risk should be made available on abasis that is coordinated, if not funded, bypublic authorities.
Finally, many gaps in the link between land use,building codes and resilience were identified in a papercompleted in June 2012 for the National EmergencyManagement Committee's Land Use Planning andBuilding Codes Taskforce, Enhancing DisasterResilience in the Built Environment: Roadmap.154 Thereport made numerous recommendations for all levelsof government, but there has been no co-ordinatedresponse to these, in spite of the report being cited inthe federal government’s National Climate Resilienceand Adaptation Strategy, published in late 2015.155

28
Recommendations for general insurers
The insurance sector plays a key role among financialinstitutions in addressing natural perils. The sectorhas been relatively well engaged with the topic,although it has tended to avoid discussing howclimate change exacerbates these risks. Generalinsurers should make better use of their role as risktransfer agents through:
+ reviewing assumptions about climate change,and ensuring they factor in the best possibleinformation to their risk and capital modelling
+ communicating to customers, in a clear andconsistent way, how premiums reflect risks fromnatural disaster and weather extremes –including both “historical” risks, and risks thatare increasing or emerging due to climatechange
+ actively supporting the development of an openand accessible platform for natural peril data –including both historical incidence and projectedor emerging risks due to climate change
+ encouraging better resilience in Australia’shousing stock.
These measures would not only help improve theresilience of Australian housing stock, but would alsopreserve the insurable market in the medium to longterm, and build trust among customers.
Recommendations for banks
Banks and other mortgage lenders are thegatekeepers to the majority of housing purchases,and also carry longer-term risks of residentialproperty assets. Both industry and community wouldbenefit from clear participation by the banking sectorin this arena. This could be achieved through thefollowing mechanisms:
+ examining climate risk to their own mortgagebooks and ensuring it is integrated into their riskassessment processes
+ using their role as the predominant providers ofproperty development finance to support goodpolicy – both through individual commerciallending decisions and through submissions toand engagement with policymakers
+ working with other stakeholders – in the public,private and civil society sectors – to researchand develop ways to minimise climate impactrisk to housing, and to address losses that willoccur in an equitable way
+ actively support the development of:
+ an open and accessible platform for naturalperil data, including both historicalincidence and projected or emerging risksdue to climate change, or
+ policy to achieve this outcome.
+ making information publicly available so thatmarket expectations can adjust gradually,avoiding sudden, detrimental impacts.
If initiated early and conducted thoughtfully, suchmeasures would avoid a sudden de-valuation eventand any turmoil or disorderly repricing that mayresult.
They would promote social good and provideopportunities for individual banks to attract and retaincustomers.
29
Appendices
Appendix 1
Selected reviews and recommendations relatingto climate change adaptation risk and residentialproperty
+ Coasts and Climate Change Council – advice toMinister Combet, 2009http://www.environment.gov.au/climate-change/adaptation/australias-coasts/coasts-climate-change-council-advice
+ PC review 2012 (Climate adaptation)
+ PC review 2014 (Natural disaster funding)
+ Nat Disaster Insurance Review 2012
+ Northern Australian Insurance PremiumTaskforce 2015
+ The Australian Business Roundtable on NaturalDisaster Resilience & Safer Communities -White Paper (2013), and Research Paper(2014).
Public policy statements:
+ National Strategy for Disaster Resilience.2015 Progress to date.
+ Enhancing Disaster Resilience in the BuiltEnvironment (PlanDev Business Solutions,June 2012, for the National EmergencyManagement Committee's Land UsePlanning and Building Codes Taskforce)
+ Attorney General's Department, 2015,"Critical Infrastructure Resilience StrategyPolicy Statement"
Appendix 2
This paper was informed in part by ChathamHouse discussions with industry, governmentand community stakeholders, including at thefollowing events:
+ NCCARF 2014 Conference, Panel Session 6,Business and Markets, Gold Coast, October2014 [recording]
+ Investor Group on Climate Change - adaptationworkshop, Sydney, Sep 2015
+ Climate Policy Pty Ltd, Climate risk andgovernance, introduction workshop, PwC,Sydney, Oct 2015
+ Roundtable on insurance and climate/naturaldisaster resilience with Professor HowardKunreuther, Sydney University, November 2015

30
Appendix 3
Overview of studies relevant to financial risk of residential property from climate change
Chi-Hsiang Wang, Tim Baynes, Stephen McFallan,Jim West, Yong Bing Khoo, Xiaoming Wang,George Quezada, Salim Mazouz, Alexander Herr, R.Matthew Beaty, Art Langston, Yun Li, Kwok WaiLau, Steve Hatfield-Dodds, Mark Stafford-Smith &Adrian Waring (2015): Rising tides: adaptation policyalternatives for coastal residential buildings inAustralia, Structure and Infrastructure Engineering,DOI: 10.1080/15732479.2015.1020500
This paper seeks to evaluate policy adaptationoptions for coastal residential buildings acrossAustralia. It provides a range of differentassumptions and scenarios, making it very useful forpolicymakers. Depending on climate scenarios anddiscounting rates (and to a lesser extent the patternsof future population development), the damage tocoastal property from coastal inundation isestimated at up to $24 billion in 2006 dollars andbased on 2009 property data (from NEXIS). A simpleextrapolation (inflation since 2006, plus propertyvalue increases since 2009) would take this range to($40 billion); that is before estimating the increase invulnerable housing stock since 2009, which wouldbe significantly more difficult. In addition, the point ofthe paper is not to make a granular assessment ofthe property at risk, but rather to look at the case forgovernment investment in adaptation measures. Thepaper makes very conservative assumptions on thebasis that it will allow for a “no regrets” or “lowregrets” policy options – that is, even in the leastdamaging scenario, the costs of the adaptationmeasures will prove worthwhile.
The modelling also demonstrates that it is thediscount rate, rather than adaptation scenarios orpopulation development patterns, which leads to thebiggest impact on the estimated value at risk.
Lastly, the study modelled different scenarios for sealevel rises combined with storm surge. However, theauthors note that changes to the intensity andfrequency of storm surge are not considered,although recent research suggests “severe tropicalcyclones may become more frequent”.
Department of Climate Change and EnergyEfficiency, 2009, “Climate Change Risks to CoastalBuildings and Infrastructure: A supplement to theFirst Pass Assessment”.
This paper concludes that residential property worthup to $63 billion is at risk – we believe this is likely tobe an underestimate.
We have several reasons for this assertion.
Firstly, the assessment was conducted in 2009,using 2008 stocks and replacement values. Thevolume and value of housing stock identified at riskwould have risen substantially since then. Aggregatenational residential housing stock was valued at$1.59 trillion in June 2015, compared to $1.138trillion in June 2008. This represents an increase ofjust over 40 per cent in the total value of thecountry’s housing stock. If we assume a similarincrease can be applied to the replacement value ofat-risk housing, this brings the $63 billion figure tojust over $88 billon.
Secondly, the report describes a “relatively simple‘bucket fill’ approach”. Much more advanced andgeographically granular modelling can now becarried out.
Thirdly, it does not include riverine flooding, orindeed any other natural perils such as bushfire orheatwaves which may damage homes now or in thefuture.
Fourthly, it does not include localised storm surgemodelling for some states (notably, Queensland).The report also does not incorporate seawalls andlevees, which may reduce the value at riskestimates, but is unlikely to be enough to offset theother factors listed here.
Finally, we note that the First Pass Assessmentcalculates the value at risk based on thereplacement value of the structures themselves. It isnot certain that the underlying property hosting thedwellings would retain its value if damaged by aninexorable shift such as coastal inundation. Wherethe utility of the land can be preserved, it is likely torequire that the replacement structure have differentand more expensive characteristics (for example,higher floors) than the original dwelling. Where theland itself is no longer suitable as a residentialproperty site at all, the value lost would be far higherthan the value of replacing the original building.

31
Appendix 4
Bank disclosures on materiality, visibility, and management of climate impacts to housing and consequentrisks for their mortgage books
MethodologyWe reviewed all CDP (formerly Carbon DisclosureProject) submissions from each of the big fourAustralian banks, dating from 2007 to 2015. CDPsolicits annual submissions from corporations,answering questions about their greenhouse gasemissions and other aspects of climate change.Risks and opportunities arising from the physicalimpacts of climate change have always beenincluded, although the wording and detail ofquestions has evolved over the years (as outlined atthe end of this report).
Using keyword search and checking of answers torelevant questions in the CDP survey, we compileda table of what banks have said about this risk,and when.
Virtually all banks, in every year, clearly identified risksof climate impacts to their own operations, anddescribe measures taken to ameliorate this. Mostbanks, in most years, cited indirect risk via institutionalfinancing, in particular to the agricultural sector. Insome cases, banks described developing anddeploying screening methods to ameliorate this risk.
However references to climate impacts viaresidential property were far patchier. Several banks,for example, referred to material risks via theircustomers’ ability to repay mortgages, and evenreferred to studies of the aggregate exposure ofAustralian housing to climate impacts.
Moreover, the banks’ own industry group, theAustralian Banking Association, has been relativelysilent on this matter. Our review of submissions to 6public inquiries into the financial implications ofnatural disasters and climate impacts finds that onlyone submission was made by the ABA - in responseto the interim report by the Productivity Commission(Check) into barriers to climate change adaptation.
1. Do they refer to the risk from climate changeimpacts to their residential property loanportfolio?
2. Do they refer to actual costs that have beenincurred from natural disasters via residentialproperty mortgage clients, that may be climate-linked?
3. Do they describe attempts to quantify their ownrisk?
4. Do they describe existing procedures(screening, credit risk criteria) to manage thisrisk via future lending? Or undertake to developsuch procedures in near future?
5. Do they cost these risk managementmeasures?
Text analysis method
1. Checked answers to questions relating tophysical climate impacts. These varied fromyear to year. In years 2011 - 2015 questionswere more specific. Questions changed fromyear to year, as documented at the end of thisappendix.
2. There is some inconsistency, between bothsubmitters and submissions, as to where theyaddressed the topic of climate impacts,residential housing and the mortgage book, (if itwas addressed). As a safeguard to ensure wecaptured any information relevant to this paper,we conducted a keyword search on eachsubmission of the following words: mortgage,loan book, residential property, houses,housing, flood, cyclone, erosion, bushfire,physical, climate impact, credit risk and strata.
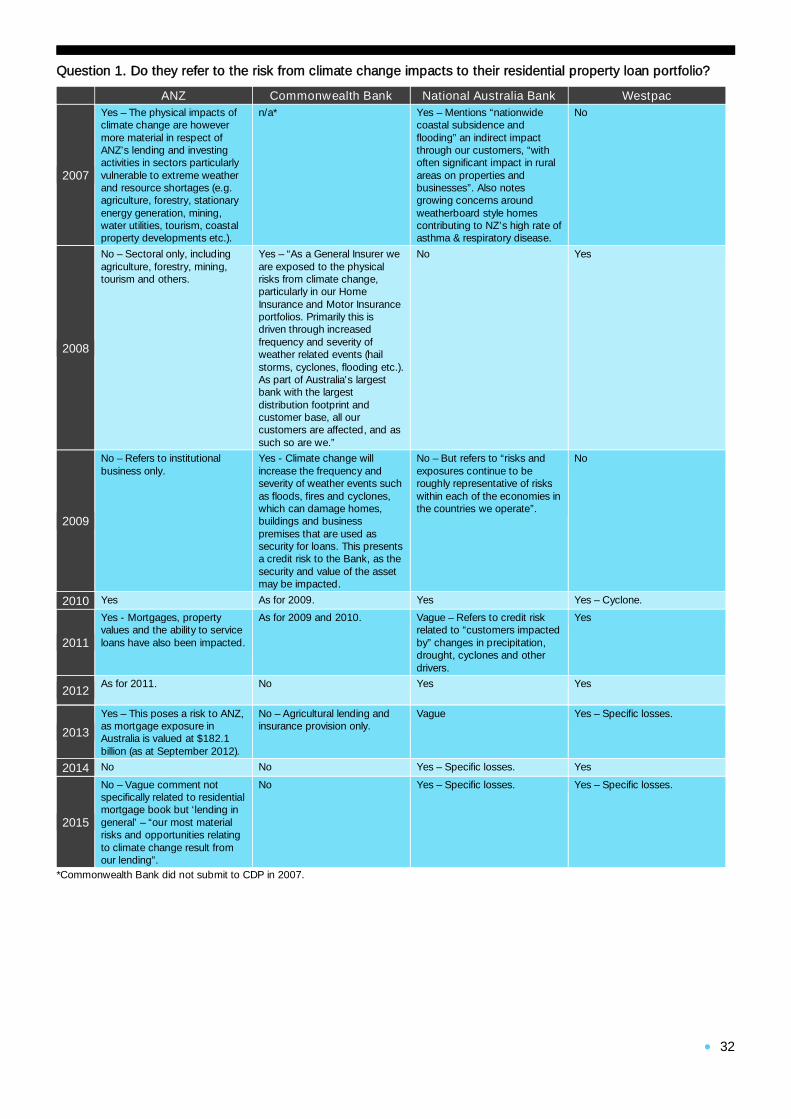
32
Question 1. Do they refer to the risk from climate change impacts to their residential property loan portfolio?
ANZ Commonwealth Bank National Australia Bank Westpac
2007
Yes – The physical impacts ofclimate change are howevermore material in respect ofANZ’s lending and investingactivities in sectors particularlyvulnerable to extreme weatherand resource shortages (e.g.agriculture, forestry, stationaryenergy generation, mining,water utilities, tourism, coastalproperty developments etc.).
n/a* Yes – Mentions “nationwidecoastal subsidence andflooding” an indirect impactthrough our customers, “withoften significant impact in ruralareas on properties andbusinesses”. Also notesgrowing concerns aroundweatherboard style homescontributing to NZ’s high rate ofasthma & respiratory disease.
No
2008
No – Sectoral only, includingagriculture, forestry, mining,tourism and others.
Yes – “As a General Insurer weare exposed to the physicalrisks from climate change,particularly in our HomeInsurance and Motor Insuranceportfolios. Primarily this isdriven through increasedfrequency and severity ofweather related events (hailstorms, cyclones, flooding etc.).As part of Australia's largestbank with the largestdistribution footprint andcustomer base, all ourcustomers are affected, and assuch so are we.”
No Yes
2009
No – Refers to institutionalbusiness only.
Yes - Climate change willincrease the frequency andseverity of weather events suchas floods, fires and cyclones,which can damage homes,buildings and businesspremises that are used assecurity for loans. This presentsa credit risk to the Bank, as thesecurity and value of the assetmay be impacted.
No – But refers to “risks andexposures continue to beroughly representative of riskswithin each of the economies inthe countries we operate”.
No
2010 Yes As for 2009. Yes Yes – Cyclone.
2011
Yes - Mortgages, propertyvalues and the ability to serviceloans have also been impacted.
As for 2009 and 2010. Vague – Refers to credit riskrelated to “customers impactedby” changes in precipitation,drought, cyclones and otherdrivers.
Yes
2012As for 2011. No Yes Yes
2013
Yes – This poses a risk to ANZ,as mortgage exposure inAustralia is valued at $182.1billion (as at September 2012).
No – Agricultural lending andinsurance provision only.
Vague Yes – Specific losses.
2014 No No Yes – Specific losses. Yes
2015
No – Vague comment notspecifically related to residentialmortgage book but ‘lending ingeneral’ – “our most materialrisks and opportunities relatingto climate change result fromour lending”.
No Yes – Specific losses. Yes – Specific losses.
*Commonwealth Bank did not submit to CDP in 2007.
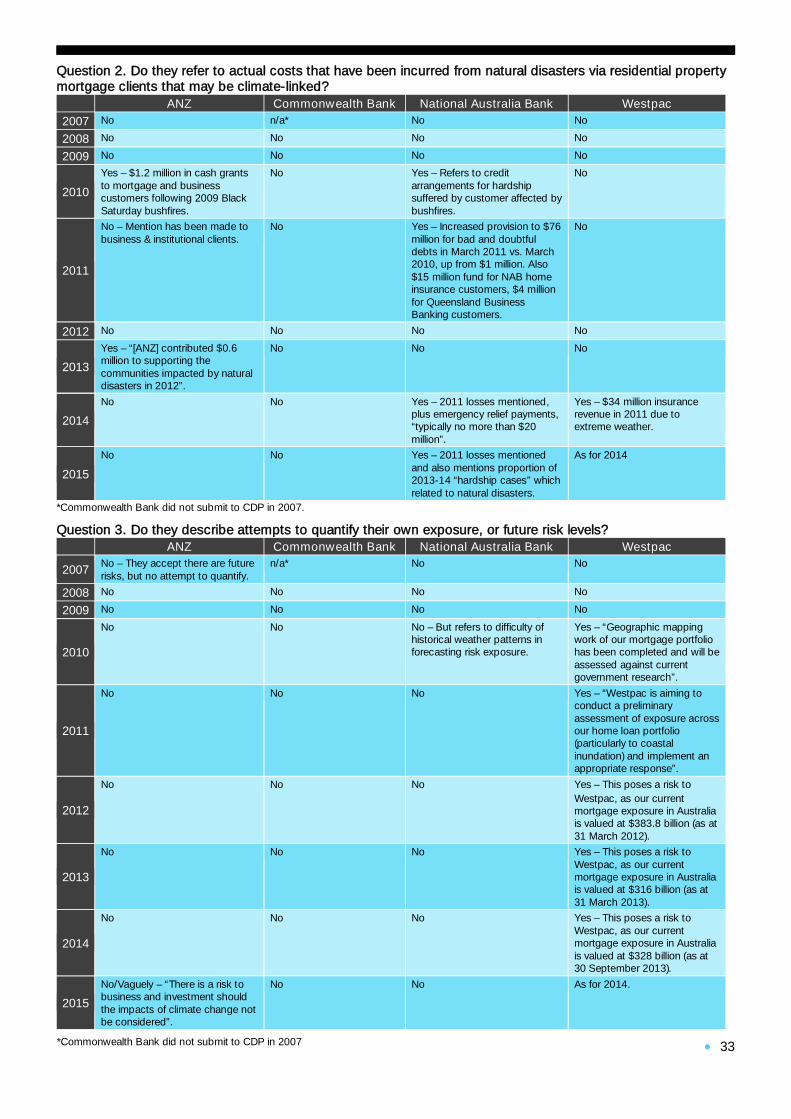
33
Question 2. Do they refer to actual costs that have been incurred from natural disasters via residential propertymortgage clients that may be climate-linked?
ANZ Commonwealth Bank National Australia Bank Westpac2007 No n/a* No No
2008 No No No No
2009 No No No No
2010
Yes – $1.2 million in cash grantsto mortgage and businesscustomers following 2009 BlackSaturday bushfires.
No Yes – Refers to creditarrangements for hardshipsuffered by customer affected bybushfires.
No
2011
No – Mention has been made tobusiness & institutional clients.
No Yes – Increased provision to $76million for bad and doubtfuldebts in March 2011 vs. March2010, up from $1 million. Also$15 million fund for NAB homeinsurance customers, $4 millionfor Queensland BusinessBanking customers.
No
2012 No No No No
2013
Yes – “[ANZ] contributed $0.6million to supporting thecommunities impacted by naturaldisasters in 2012”.
No No No
2014
No No Yes – 2011 losses mentioned,plus emergency relief payments,“typically no more than $20million”.
Yes – $34 million insurancerevenue in 2011 due toextreme weather.
2015
No No Yes – 2011 losses mentionedand also mentions proportion of2013-14 “hardship cases” whichrelated to natural disasters.
As for 2014
*Commonwealth Bank did not submit to CDP in 2007.
Question 3. Do they describe attempts to quantify their own exposure, or future risk levels?ANZ Commonwealth Bank National Australia Bank Westpac
2007 No – They accept there are futurerisks, but no attempt to quantify.
n/a* No No
2008 No No No No
2009 No No No No
2010
No No No – But refers to difficulty ofhistorical weather patterns inforecasting risk exposure.
Yes – “Geographic mappingwork of our mortgage portfoliohas been completed and will beassessed against currentgovernment research”.
2011
No No No Yes – “Westpac is aiming toconduct a preliminaryassessment of exposure acrossour home loan portfolio(particularly to coastalinundation) and implement anappropriate response”.
2012
No No No Yes – This poses a risk toWestpac, as our currentmortgage exposure in Australiais valued at $383.8 billion (as at31 March 2012).
2013
No No No Yes – This poses a risk toWestpac, as our currentmortgage exposure in Australiais valued at $316 billion (as at31 March 2013).
2014
No No No Yes – This poses a risk toWestpac, as our currentmortgage exposure in Australiais valued at $328 billion (as at30 September 2013).
2015
No/Vaguely – “There is a risk tobusiness and investment shouldthe impacts of climate change notbe considered”.
No No As for 2014.
*Commonwealth Bank did not submit to CDP in 2007

34
Question 4. Do they describe the existence of specific risk management procedures (screening, credit riskcriteria) to manage this risk via future lending? Or undertake to develop such procedures in near future?
ANZ Commonwealth Bank National Australia Bank Westpac2007 No n/a* No No
2008 No – Institutional banking andproject financing only.
No No No
2009
No – Only to their businessbook, not their residentialmortgage or consumerbusiness.
No – “The bank is currentlyamending its credit riskassessment processes toimprove its ability to understandthese risks and build them intocredit decisioning and pricingprocesses”.
No – But climate risks,including physical are“considered on a case bycase basis in key areas oflending such as ProjectFinance and Wholesale andBusiness Banking”.
Vague – Refers to researchingimpacts over next 18 months.
2010No – Only in relation to sectorallending, particularly agriculture.
No No – But mentions extensionof loan terms to existingcustomer in hardship.
Vague – Refers to briefing of 150credit and risk officers on climateimpact risks.
2011
No – Education in regards toclients and employees as to theeffect of climate change to theirbusiness and institutionalclients is expressed.
No No – Mentions institutionallending only, particularlyagriculture.
No
2012
No – Only as it relates to theircorporate and institutional bankclients.
No No –Only refers to businesslending.
No/Vague – “This Policyincorporates ESG risk into creditdecision making at the transactionand sector level”.
2013
Vaguely - ANZ’s relationshipbankers and credit officers aretrained in the risks associatedwith climate change andclimate related events.
No No Yes – Westpac has undertaken anumber of activities to helpunderstand and mitigate theserisks. This has includedstakeholder engagement withclients, scientific organisationsand environmental groups tounderstand both the issues andbest practice approaches tomanagement within our clientbase.
2014
No – Only refers to businessloans (resources sectors).
No No – Institutional andsectoral only.
Yes – Engagement andparticipation in research…Introducing storm surge pricing toreduce portfolio risk over next 1-3years… Integration of climate riskinto ESG framework for reducedcredit risk on ongoing basis.
2015No – Only refers to businessloans.
No No – Mentions institutionallending only, particularlyagriculture.
As for 2014.
*Commonwealth Bank did not submit to CDP in 2007.
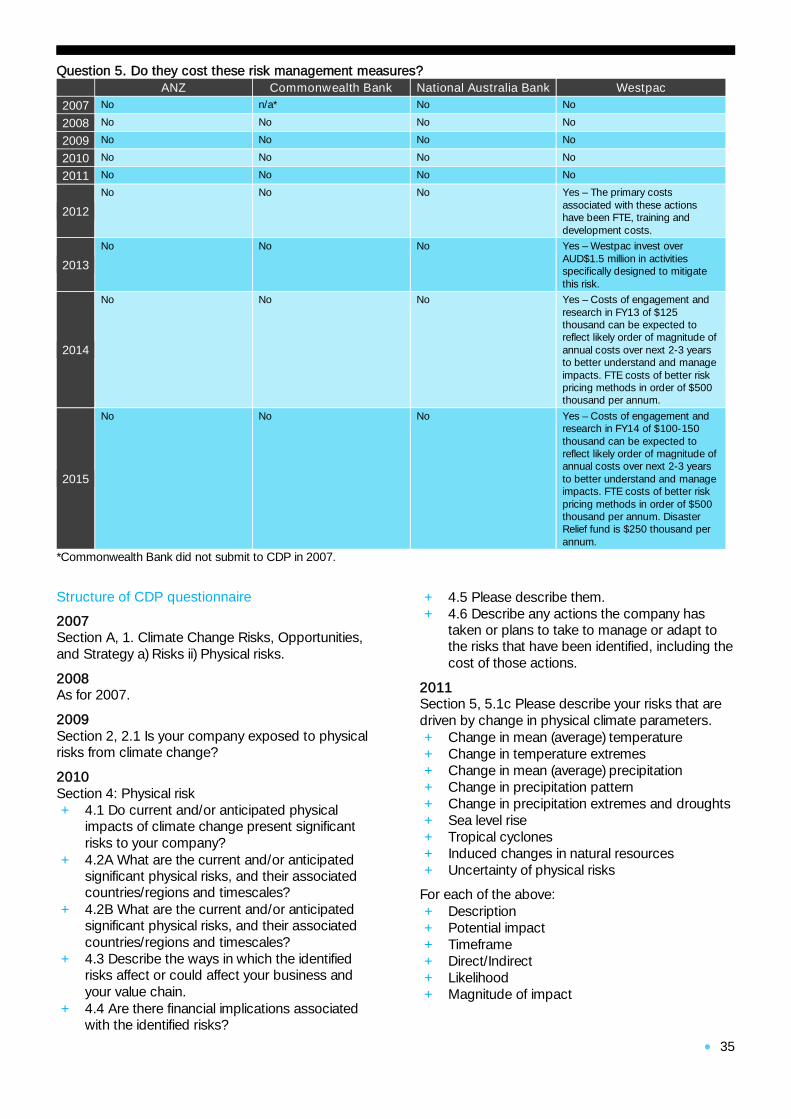
35
Question 5. Do they cost these risk management measures?ANZ Commonwealth Bank National Australia Bank Westpac
2007 No n/a* No No
2008 No No No No
2009 No No No No
2010 No No No No
2011 No No No No
2012
No No No Yes – The primary costsassociated with these actionshave been FTE, training anddevelopment costs.
2013
No No No Yes – Westpac invest overAUD$1.5 million in activitiesspecifically designed to mitigatethis risk.
2014
No No No Yes – Costs of engagement andresearch in FY13 of $125thousand can be expected toreflect likely order of magnitude ofannual costs over next 2-3 yearsto better understand and manageimpacts. FTE costs of better riskpricing methods in order of $500thousand per annum.
2015
No No No Yes – Costs of engagement andresearch in FY14 of $100-150thousand can be expected toreflect likely order of magnitude ofannual costs over next 2-3 yearsto better understand and manageimpacts. FTE costs of better riskpricing methods in order of $500thousand per annum. DisasterRelief fund is $250 thousand perannum.
*Commonwealth Bank did not submit to CDP in 2007.
Structure of CDP questionnaire
2007Section A, 1. Climate Change Risks, Opportunities,and Strategy a) Risks ii) Physical risks.
2008As for 2007.
2009Section 2, 2.1 Is your company exposed to physicalrisks from climate change?
2010Section 4: Physical risk+ 4.1 Do current and/or anticipated physical
impacts of climate change present significantrisks to your company?
+ 4.2A What are the current and/or anticipatedsignificant physical risks, and their associatedcountries/regions and timescales?
+ 4.2B What are the current and/or anticipatedsignificant physical risks, and their associatedcountries/regions and timescales?
+ 4.3 Describe the ways in which the identifiedrisks affect or could affect your business andyour value chain.
+ 4.4 Are there financial implications associatedwith the identified risks?
+ 4.5 Please describe them.+ 4.6 Describe any actions the company has
taken or plans to take to manage or adapt tothe risks that have been identified, including thecost of those actions.
2011Section 5, 5.1c Please describe your risks that aredriven by change in physical climate parameters.+ Change in mean (average) temperature+ Change in temperature extremes+ Change in mean (average) precipitation+ Change in precipitation pattern+ Change in precipitation extremes and droughts+ Sea level rise+ Tropical cyclones+ Induced changes in natural resources+ Uncertainty of physical risks
For each of the above:+ Description+ Potential impact+ Timeframe+ Direct/Indirect+ Likelihood+ Magnitude of impact
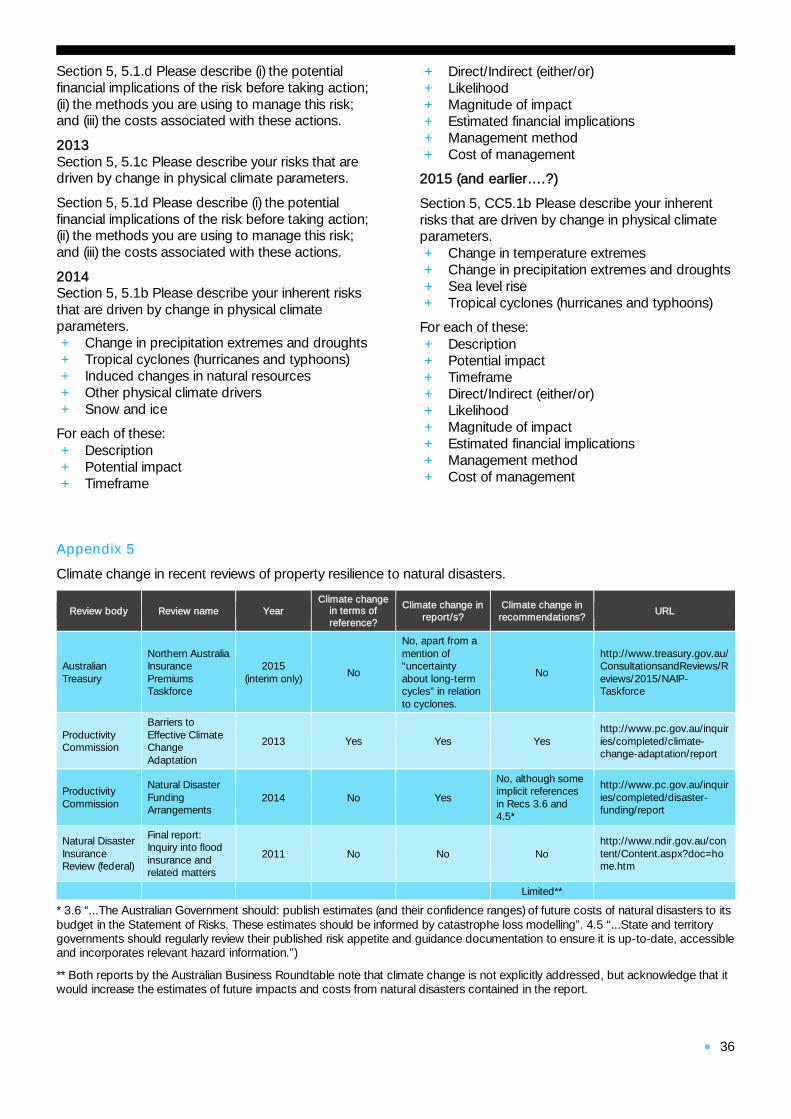
36
Section 5, 5.1.d Please describe (i) the potentialfinancial implications of the risk before taking action;(ii) the methods you are using to manage this risk;and (iii) the costs associated with these actions.
2013Section 5, 5.1c Please describe your risks that aredriven by change in physical climate parameters.
Section 5, 5.1d Please describe (i) the potentialfinancial implications of the risk before taking action;(ii) the methods you are using to manage this risk;and (iii) the costs associated with these actions.
2014Section 5, 5.1b Please describe your inherent risksthat are driven by change in physical climateparameters.+ Change in precipitation extremes and droughts+ Tropical cyclones (hurricanes and typhoons)+ Induced changes in natural resources+ Other physical climate drivers+ Snow and ice
For each of these:+ Description+ Potential impact+ Timeframe
+ Direct/Indirect (either/or)+ Likelihood+ Magnitude of impact+ Estimated financial implications+ Management method+ Cost of management
2015 (and earlier….?)
Section 5, CC5.1b Please describe your inherentrisks that are driven by change in physical climateparameters.+ Change in temperature extremes+ Change in precipitation extremes and droughts+ Sea level rise+ Tropical cyclones (hurricanes and typhoons)
For each of these:+ Description+ Potential impact+ Timeframe+ Direct/Indirect (either/or)+ Likelihood+ Magnitude of impact+ Estimated financial implications+ Management method+ Cost of management
Appendix 5
Climate change in recent reviews of property resilience to natural disasters.
Review body Review name YearClimate change
in terms ofreference?
Climate change inreport/s?
Climate change inrecommendations?
URL
AustralianTreasury
Northern AustraliaInsurancePremiumsTaskforce
2015(interim only) No
No, apart from amention of“uncertaintyabout long-termcycles” in relationto cyclones.
No
http://www.treasury.gov.au/ConsultationsandReviews/Reviews/2015/NAIP-Taskforce
ProductivityCommission
Barriers toEffective ClimateChangeAdaptation
2013 Yes Yes Yeshttp://www.pc.gov.au/inquiries/completed/climate-change-adaptation/report
ProductivityCommission
Natural DisasterFundingArrangements
2014 No Yes
No, although someimplicit referencesin Recs 3.6 and4.5*
http://www.pc.gov.au/inquiries/completed/disaster-funding/report
Natural DisasterInsuranceReview (federal)
Final report:Inquiry into floodinsurance andrelated matters
2011 No No Nohttp://www.ndir.gov.au/content/Content.aspx?doc=home.htm
Limited**
* 3.6 “...The Australian Government should: publish estimates (and their confidence ranges) of future costs of natural disasters to itsbudget in the Statement of Risks. These estimates should be informed by catastrophe loss modelling”. 4.5 “...State and territorygovernments should regularly review their published risk appetite and guidance documentation to ensure it is up-to-date, accessibleand incorporates relevant hazard information.”)
** Both reports by the Australian Business Roundtable note that climate change is not explicitly addressed, but acknowledge that itwould increase the estimates of future impacts and costs from natural disasters contained in the report.

37
Endnotes
1 M. Kohler, and M. van der Merwe, 2015, “Long-run Trends in House Price Growth”, Reserve Bank of Australia Bulletin, September,http://www.rba.gov.au/publications/bulletin/2015/sep/pdf/bu-0915-3.pdf.2 Reserve Bank of Australia, 2015, “Financial Stability Review, October 2015”, p. 34, http://www.rba.gov.au/publications/fsr/2015/oct/pdf/aus-fin-sys.pdf.3 A survey of 186 reinsurance executives and catastrophe modellers in the US in 2015 found 50 per cent of modellers and 41 per cent of executivesconsidered climate change “infrequently” or “not at all”. See, D. McCann, 2016, “Hot Topic: Climate change and insurance”, CFO, March 23,http://ww2.cfo.com/risk-management/2016/03/hot-topic-climate-change-insurance/.4 Value of housing built between January 2009 and February 2016 is $331.7bn. See, Australian Bureau of Statistics, ABS 8731, Building approvals, Australia.5 Department of Environment, 2015, “National Climate Resilience and Adaptation Strategy”,https://www.environment.gov.au/system/files/resources/3b44e21e-2a78-4809-87c7-a1386e350c29/files/national-climate-resilience-and-adaptation-strategy.pdf.6 Department of Climate Change and Energy Efficiency, 2009. “Climate Change Risks to Coastal Buildings and Infrastructure: A Supplement to the First PassNational Assessment”, Australian Government, Canberra, https://www.environment.gov.au/system/files/resources/0f56e5e6-e25e-4183-bbef-ca61e56777ef/files/risks-coastal-buildings.pdf.7 Australian Bureau of Statistics, 2015, Australian System of National Accounts (5204.0), 2013–14, Commonwealth Government,http://www.abs.gov.au/AUSSTATS/[email protected]/Lookup/5204.0Main+Features12014-15?OpenDocument. Table 10: National Balance Sheet: Volume/Real andCurrent prices as at June 30.8 The Climate Institute, 2015, “Australia’s Financial System and Climate Change”,http://www.climateinstitute.org.au/verve/_resources/FinancialSystemsRiskPolicyBrief.pdf.9 See for example the Asset Owners Disclosure Project, http://www.aodproject.net/.10 Ibid.11 The Climate Institute, 2012, “Coming, Ready or Not: Managing Climate Risks to Australia’s Infrastructure”,http://www.climateinstitute.org.au/verve/_resources/TCI_ComingReadyorNot_ClimateRiskstoInfrastructure_October2012.pdf12 Climate Risk, 2014, “Buyer Beware: Home Insurance, Extreme Weather and Climate Change”, a report for The Climate Institute in partnership with CHOICE,http://climateinstitute.org.au/verve/_resources/BuyerBeware.pdf.13 W. Byres, 2015, “Banking on Housing”, address to the Australian Economists’ Lunchtime Briefing, Sydney, August 26,http://www.apra.gov.au/Speeches/Documents/1508-ABE-Lunchtime-Briefing-Banking-on-housing-26August2015.pdf.14 Australian Bureau of Statistics, 2015, Op Cit.15 Ibid.16 Australian Taxation Office, 2015, Taxation statistics 2012–13 Individuals: Selected items, by taxable income, age, gender and taxable status, 2012–13income year, https://data.gov.au/dataset/taxation-statistics-2012-13/resource/7ca3602e-4597-4e15-a30e-35580c93292d.17 Australian Bureau of Statistics, 2015, Op Cit.18 Australian Bureau of Statistics, 2016, “ABS 3281.0 - Regional Population Growth, Australia, 2014-15”, March 3, http://www.abs.gov.au/ausstats/[email protected]/mf/3218.0. This shows population growth along coastal areas to be the fastest-growing type of region, aside from capital cities.19 Suncorp Insurance, 2016a, “Suncorp Strata Insurance Policy Factsheet”, http://www.suncorp.com.au/insurance/sites/default/files/fm/campaigns/protect-the-north/pdfs/suncorp-strata-fact-sheet.pdf.;Suncorp Insurance, 2016b, “North Queensland Hone Owners Reaping the Benefits of Cyclone Resilience”,media release, April 27, http://www.suncorpgroup.com.au/sites/default/files/pdf/news/North%20Queensland%20homeowners%20reaping%20the%20benefits%20of%20cyclone%20resilience_27April2016.pdf. Suncorp’s “Protecting the North” initiative includes premium discounts forhomeowners who attest to having resilient roofs, and incentives for strata owners to carry out improvements, see http://www.suncorp.com.au/insurance/protectingthenorth.20 G. Barnett, J. Gardner, and J. Meyers, 2015, “Adaptation: Living with a changing environment”, Climate Change Adaptation for Health and Social Services,pp. 17–36.21 J. Harwood, S. Paddam, A. Pitman, and J. Egan, 2014, “Can Actuaries Really Afford to Ignore Climate Change?”, presentation to the Actuaries InstituteGeneral Insurance Seminar, November, http://www.actuaries.asn.au/Library/Events/GIS/2014/GIS2014EganEtAlClimateChangePres.pdf.22 The Climate Institute, 2012, Op Cit.23 Existing studies are discussed in detail in Appendix 3.24 Department of Climate Change and Energy Efficiency, Op. Cit. See also Appendix 3.25 C.H. Wang, T. Baynes, S. McFallan, J. West, Y. Bing Khoo, X. Wang, G. Quezada, S. Mazouz, A. Herr, R. M. Beaty, A. Langston, Y. Li, K. Wai Lau, S.Hatfield-Dodds, M. Stafford-Smith and A. Waring, 2015, “Rising tides: adaptation policy alternatives for coastal residential buildings in Australia”, CSIRO, DOI:10.1080/15732479.2015.1020500.26 Ibid. See also Appendix 3.27 GHD, 2012, "Coastal Hazard Adaptation Strategy: Report for Townsville City Council", Brisbane.28 See Appendix 1.29 Natural Disaster Insurance Review, 2011, Final Report, http://www.ndir.gov.au/content/Content.aspx?doc=report.htm.30 Productivity Commission, 2013, “Barriers to Effective Climate Change Adaptation”, http://www.pc.gov.au/inquiries/completed/climate-change-adaptation/report.31 Productivity Commission, 2014, “Natural Disaster Funding, Final Report”, http://www.pc.gov.au/inquiries/completed/disaster-funding/report.32 Deloitte Access Economics and the Australian Business Roundtable for Disaster Resilience and Safer Communities, 2013, “White Paper”, June,http://australianbusinessroundtable.com.au/our-papers/white-paper.33 Deloitte Access Economics and the Australian Business Roundtable for Disaster Resilience and Safer Communities, 2014, “Building an open platform fornatural disaster resilience decisions”, July, http://australianbusinessroundtable.com.au/our-papers/natural-disaster-data-report.34 Deloitte Access Economics and the Australian Business Roundtable for Disaster Resilience and Safer Communities, 2016a, “Building ResilientInfrastructure”, March, http://australianbusinessroundtable.com.au/our-papers/resilient-infrastructure-report.35 Deloitte Access Economics and the Australian Business Roundtable for Disaster Resilience and Safer Communities, 2016b, “The Economic Cost of theSocial Impact of Disasters”, March, http://australianbusinessroundtable.com.au/our-papers/social-costs-report.36 For example, Suncorp commissioned research by KPMG on risk apportionment in the insurance industry, summarised in Suncorp’s General Insurancesubmission to the Financial Systems Inquiry, http://fsi.gov.au/files/2014/04/Suncorp_General_Insurance.pdf.37 Productivity Commission, 2014, Op Cit.38 Ibid.39 M. Keenan, 2015, “Australian Government to consult on changes to natural disaster funding”, media release, May 1,https://www.ministerjustice.gov.au/Mediareleases/Pages/2015/SecondQuarter/1-May-2015-Australian-Government-to-consult-on-changes-to-natural-disaster-funding.aspx.40 Productivity Commission, 2014, Op Cit.41 E. Chow and J. Egan, 2012, “Are you climate-proof?” Taylor Fry Actuaries, presentation for the Actuaries Institute 2012 General Insurance Seminar, Sydney,November 12, http://www.taylorfry.com.au/publications/papers/GIS2012_Are%20you%20climate%20proof2.pdf.42 Deloitte Access Economics and the Australian Business Roundtable for Disaster Resilience & Safer Communities, 2014, Op. Cit.43 L. Dobes, F. Jotzo, and P.Doupé, 2013, “Adaptor of last resort? An economic perspective on the Government’s role in adaptation to climate change”,
38
National Climate Change Adaptation Research Facility, Gold Coast, p. 70.44 Deloitte Access Economics and the Australian Business Roundtable for Disaster Resilience & Safer Communities, Op. Cit.45 G. Barnett, R.M. Beaty, D. Chen, S. McFallan, J. Meyers, M. Nguyen, Z. Ren, A. Spinks and X. Wang, 2013, “Pathways to climate adapted and healthy lowincome housing”, National Climate Adaptation Research Facility, Gold Coast, p. 95.46 Local government authorities have documented their fears that planning decisions will incur statutory compensation, tort liability, and/or legislative liability intheir submissions to the Productivity Commission, http://www.pc.gov.au/inquiries/completed/climate-change-adaptation/submissions/sub025.pdf. For furtherdetail see, Baker & McKenzie, 2011, “Local Council Risk of Liability in the Face ofClimate Change – Resolving Uncertainties”, a report for the Australian Local Government Association, http://alga.asn.au/site/misc/alga/downloads/environment/ALGA%20Consolidated%20Report-v7B-1392955-SYDDMS%20-%20Final.pdf.47 Deloitte Access Economics and the Australian Business Roundtable for Disaster Resilience & Safer Communities, 2014, Op. Cit. “A key barrier regarding thewillingness of local councils to share the data is the threat of legal action from citizens due to a potential fall in land and property prices.” The report furtherquotes information submitted by the Floodplain Management Association that “local politics also plays a part, with community members often raising concernsthat the publishing of flood data may affect land values and insurance premiums (even if these fears are unfounded).48 Australian Building Codes Board, 2010, “An investigation of possible building code of Australia adaptation measures for climate change”, www.acbc.gov.au,downloaded 06/01/2015.49 Northern Australia Insurance Premiums Taskforce, 2015, Final Report, November, Australian Treasury, http://www.treasury.gov.au/~/media/Treasury/Consultations%20and%20Reviews/Reviews%20and%20Inquiries/2015/NAIP%20Taskforce/Final%20Report/Downloads/PDF/NAIP_final_report.ashx.50 Climate Risk, 2014, Op Cit.51 Cookson, Clive, 2016, "Climate change strongly linked to UK floods", Financial Times, January 8, http://www.ft.com/intl/cms/s/0/831d04d4-b5ee-11e5-b147-e5e5bba42e51.html.52 K. Braganza, B. Murphy, B. Timbal, P. Hope, A. Dowdy, K. Hennessy, J. Bhend and D. Kirono, 2015, “Understanding recent Australian climate”, in ClimateChange in Australia Information for Australia’s Natural Resource Management Regions: Technical Report, CSIRO and Bureau of Meteorology.52 P. Whetton, A. Moise, D. Kirono, T. Rafter, L. Wilson, K. Hennessy, J. Bhend, P. Hope, B. Timbal, A. Dowdy, I. Watterson, M. Grose, S. Narsey, and J.Bathols, 2014, “Projections: Atmosphere and the Land”, in Climate Change in Australia Information for Australia’s Natural Resource Management Regions:Technical Report, CSIRO and Bureau of Meteorology.53 Ibid.54 Ibid.55 S. Ellis, P. Kanowski and R Whelan, 2004, “National Inquiry on Bushfire Mitigation and Management”, Council of Australian Governments, March,http://www.dfes.wa.gov.au/publications/GeneralReports/FESA_Report-NationalInquiryonBushfireMitigationandManagement.pdf.56 Emergency NSW, 2015, “NSW moves to a fairer system for funding fire and emergency services”, media release, December 10,https://www.emergency.nsw.gov.au/media-releases/2015/nsw-moves-to-a-fairer-system-for-funding-fire-and-emergency-services.html/.57 N. Mawby, 2013, “Home sales warnings for residents in Bushfire Prone Areas”, Herald-Sun, July 28, http://www.heraldsun.com.au/news/victoria/home-sale-warnings-for-residents-in-bushfire-prone-areas/story-fni0fit3-1226687171212.58 Deloitte Access Economics and the Australian Business Roundtable for Disaster Resilience & Safer Communities, 2014, Op. Cit. Box 7: “Queensland floodmapping: From poor coverage to complete coverage”.59 Braganza et al, Op Cit.60 Whetton et al, Op Cit.61 K. Hennessy, B. Fitzharris, B.C. Bates, N. Harvey, M. Howden, and L. Hughes, 2007, Australia and New Zealand, in M.L. Parry, O.F. Canziani, J.P.Palutikof, P.J. van der Linden & C.E. Hanson (Eds). 2007, Climate Change 2007: Impacts, Adaptation and Vulnerability. Contribution of Working Group II tothe Fourth Assessment Report of the Intergovernmental Panel on Climate Change, pp. 507–540, Cambridge University Press.62 J. Isaac and S. Turton, 2014, “Expansion of the Tropics: Evidence and Implications”, State of the Tropics, http://stateofthetropics.org/wp-content/uploads/Essay-5-Isaac-and-Turton.pdf.63 J.P. Kossin, K.A. Emanuel and G.A. Vecchi, 2014, “The Poleward Migration of the Location of Tropical Cyclone Maximum Intensity” Nature, 509: 349-352,DOI: 10.1038/nature13278.64 P. Hannam, 2015, “Cyclone Marcia: Climate change is expanding the tropics”, Sydney Morning Herald, February 20,http://www.smh.com.au/environment/climate-change/cyclone-marcia-climate-change-is-expanding-the-tropics-20150220-13kdfi.html.65 Braganza et al, Op Cit.66 Emergency NSW, Op. Cit.67 ABC News, 2015, “New erosion management blueprint drawn up for Old Bar”, August 14, http://www.abc.net.au/news/2015-08-14/new-erosion-management-blueprint-drawn-up-for-old-bar/6697092.68 Insurance Council of Australia, 2010, “Consumer Tips: Flood insurance in Australia”, Factsheet, May,http://www.insurancecouncil.com.au/assets/files/consumer%20tips%20flood%20insurance.pdf.69 Climate Change in Australia, “Understanding recent Australian climate” Chapter 4,http://www.climatechangeinaustralia.gov.au/media/ccia/2.1.5/cms_page_media/168/CCIA_2015_NRM_TR_Chapter%204.pdf.70 Bureau of Meteorology and CSIRO, 2014, State of the Climate 2014, http://www.bom.gov.au/state-of-the-climate/documents/state-of-the-climate-2014_low-res.pdf?ref=button.71 Chow and Egan, Op Cit.72 T. O’Donnell, 2016, “The Small Changes: Coastal Vulnerability to Sea Level Rise”, presentation at University of Sydney, March 23,http://sydney.edu.au/environment-institute/events/the-small-changes-coastal-vulnerability-to-sea-level-rise/. Presentation drew on unpublished PhD researchand also on the following paper, T. O’Donnell, 2016, “Legal Geography and Coastal Climate Change Adaptation: The Vaughan Litigation”, GeographicalResearch. DOI: 10.1111/1745-5871.12170.73 Climate Risk, 2014, Op Cit.74 G. Hutchens, 2012, “S&P warns over state debt burden”, Sydney Morning Herald, November 27, http://www.smh.com.au/business/sp-warns-states-over-debt-burden-20121126-2a3j3.html. Moody’s, rather than S&P, downgraded its Queensland credit rating outlook.75 S. Nicholls, 2015, “NSW government’s stamp duty bonanza could be the last for a while as market cools”, Sydney Morning Herald, October 20,http://www.smh.com.au/nsw/nsw-governments-stamp-duty-bonanza-could-be-the-last-for-a-while-as-market-cools-20151019-gkcllh.html.76 Edwards, J., 2015, “Stamp duty revenue drives budget surplus increase of $500m, Victorian Government says”, ABC News, March 11,http://www.abc.net.au/news/2015-11-27/victorian-land-taxes-boost-state-coffers-in-budget-update/6981454.77 F. Michaux, 2014, “Standard & Poor’s Submission to Australia’s Financial System Enquiry (Second Round Submission)”,http://fsi.gov.au/files/2014/09/Standard_Poors.pdf.78 Dobes et al, Op Cit.79 Reserve Bank of Australia, 2015, “Financial Stability Review”, October 2015, http://www.rba.gov.au/publications/fsr/2015/oct/pdf/1015.pdf.80 A. Arsov, K. Song Kim and K. Stacey, 2015 “Structural Features of Australian Residential Mortgage-backed Securities”, Bulletin, June, Reserve Bank ofAustralia.81 Reserve Bank of Australia, 2015, “CLF Operational Notes”, May 2015 http://www.rba.gov.au/mkt-operations/resources/tech-notes/clf-operational-notes.html82 Aylmer, C, 2014, “The Securitisation Market: Remarks to Australian Securitisation Conference”, Sydney, November 11, 2014.http://www.rba.gov.au/speeches/2014/sp-so-111114.html83 Arsov et al, Op. Cit.

39
84 Reserve Bank of Australia, “Data to be Reported: RMBS templates”, Securitisations Industry Forum, http://www.rba.gov.au/securitisations/data-to-be-reported/#rmbstemplates.85 Reserve Bank of Australia, “Data to be Reported”, Securitisations Industry Forum, http://www.rba.gov.au/securitisations/data-to-be-reported/.86 Reserve Bank of Australia, 2015, “Securitisation Reporting Implementation Notice - 28 October, 2015: Availability requirements for loan-level data”,http://www.rba.gov.au/securitisations/implementation-arrangements/reporting-notices/2015-10-28.html.87 Marq Services, 2012, “Marq Services Submission to Reserve Bank of Australia – New Eligibility Criteria for Residential Mortgage Backed Securities”,December 21, http://www.marqservices.com/media/rba_submission_repo_eligibility.pdf.88 R. Dodd and P. Mills, 2008, “Outbreak: US Subprime Contagion”, Finance & Development Magazine, International Monetary Fund, June,http://www.imf.org/external/pubs/ft/fandd/2008/06/dodd.htm.89 The Climate Institute, 2015, Op. Cit.90 Climate Risk et al, Op Cit.91 Prudential Regulatory Authority, 2015, “The impact of climate change on the UK insurance sector: A Climate Change Adaptation Report by the PrudentialRegulatory Authority”, September, Bank of England, http://www.bankofengland.co.uk/pra/Documents/supervision/activities/pradefra0915.pdf.92 Ibid.93 Insurance Council of Australia, 2015, “Statement on the speech by Bank of England Governor Mark Carney”, October 2,http://www.insurancecouncil.com.au/media_release/plain/328. The Insurance Council of Australia issued a statement concerning Bank of England governorMark Carney’s speech on climate risk to Lloyd’s of London, made on the same day the PRA report was released, but did not address the PRA report.94 Climate Risk et al, Op Cit.95 Australian Treasury, 2015, “Aftermath of the HIH collapse”, Australian Government, Economic Roundup Issue 1,http://www.treasury.gov.au/PublicationsAndMedia/Publications/2015/Economic-Roundup-Issue-1/HTML/article-3/3-Aftermath-of-the-HIH-collapse.96 Although climate change may have already contributed to these increasing catastrophe payouts, another factor is the increase in valuable assets that areexposed to damage.97 Australian Prudential Regulatory Authority, “Letter to industry: Catastrophe Risk Governance”, http://www.apra.gov.au/GI/PrudentialFramework/Pages/Letter-to-GIs-on-catastrophe-risk-governance.aspx.; Australian Prudential Regulatory Authority, 2013, “Insight: Issue Three, 2013: General Insurance industryoverview”, http://www.apra.gov.au/Insight/Documents/13-Insight-Issue-3.pdf.98 Ibid.99 I. Laughlin, 2013, “Challenges for Board and Management: Adequate Catastrophe Cover and Meeting Capital Requirements”, September 2013,http://www.apra.gov.au/Speeches/Documents/Ian-Laughlin-AON-Benfield-Hazards-Conference-24-September-2013-published.pdf.100 Egan et al, 2014, Op Cit.101 Financial Rights Legal Centre, 2015; Submission to the Northern Australia Insurance Premiums Task Force, September 2015.http://financialrights.org.au/wp-content/uploads/2015/09/150914_NAIPT-Interim-Report_FINAL.pdf102 For example, RACQ, 2016, “From today RACQ is providing home insurance premium discounts to North Queenslanders who have installed structureupgrades and other cyclone resilience measures to their homes”, February 15, http://www.racq.com.au/about/news-and-community/newsroom/media-releases/racq-delivers-home-insurance-discounts-to-nq ; Suncorp Insurance, “Protecting the North”,http://www.suncorp.com.au/insurance/protectingthenorth.103 Suncorp Insurance, 2016a, Op Cit.; Suncorp Insurance, 2016b, Op Cit.104 Insurance Council of Australia, 2010, Op Cit.105 Australian Government Actuary, 2014, “Report on Home and Contents Insurance Prices in North Queensland”, p. 13,http://www.aga.gov.au/publications/home_contents_nth_qld/downloads/Home-Contents-North-QLD.pdf.106 M. Petkov, 2014, “Climate Change Could Sting Reinsurers That Underestimate Its Impact”, Standard & Poor’s, September 3,https://www.globalcreditportal.com/ratingsdirect/renderArticle.do?articleId=1356905&SctArtId=260148&from=CM&nsl_code=LIME&sourceObjectId=8706036&sourceRevId=1&fee_ind=N&exp_date=20240902-15:44:53&sf4482828=1.107 T. Maynard, N. Beecroft, S. Gonzalez, and L. Restell, 2014, “Catastrophe Modelling and Climate Change”, Lloyd’s of London,https://www.lloyds.com/~/media/lloyds/reports/emerging%20risk%20reports/cc%20and%20modelling%20template%20v6.pdf.108 S. Reeves, 2016, “Climate Change and Insurers,” LinkedIn post, https://www.linkedin.com/pulse/climate-change-insurers-scott-reeves.109 Harwood et al, Op Cit.110 Prudential Regulatory Authority, Op Cit.111 Australian Government Actuary, Op Cit.112 Ibid.113 Productivity Commission, 2013, Op Cit.; Productivity Commission, 2014, Op Cit.114 Natural Disaster Insurance Review, Op Cit. The Natural Disaster Insurance Review gives a history of policymaker attempts, often subsequently abandoned.115 J. McAneney, D. McAneney, R. Musulin, G. Walker, and R. Crompton, 2016, “Government-sponsored natural disaster insurance pools: A view from down-under”, International Journal of Disaster Risk Reduction, 15: 1-9, http://dx.doi.org/10.1016/j.ijdrr.2015.11.004116 R. Cleetus, 2013, “Overwhelming Risk: Rethinking Flood Insurance in a World of Rising Seas”, August revised February 2014,http://www.ucsusa.org/sites/default/files/legacy/assets/documents/global_warming/Overwhelming-Risk-Full-Report.pdf.117 Insurance Council of Australia, “Property Resilience and Exposure Program (PREP)”, is described at http://www.insurancecouncil.com.au/affordability.118 Deloitte Access Economics and the Australian Business Roundtable for Disaster Resilience & Safer Communities, 2014, Op. Cit.119 Suncorp Insurance gives examples of reversing insurance embargoes in Roma, Queensland, seeSuncorp Group, 2014, “Suncorp cuts cost of insurance premiums as flood risk drops in regional QLD”, media release, March 12,http://www.suncorpgroup.com.au/sites/default/files/pdf/news/Media%20Release%20-%20St%20George%20levee%20opening%20v2.pdf.; Suncorp Group,2011, “The Suncorp Group Insurance Response: Barriers to Effective Climate Change Adaptation”, December,http://www.pc.gov.au/inquiries/completed/climate-change-adaptation/submissions/sub028.pdf. In both cases, local councils built levees to reduce flood risk.120 Karl Sullivan, 2016, Insurance Council of Australia, interview conducted, March 7, Sydney.121 Insurance Council of Australia, 2012, “New Flood Database Expands Insurers’ Knowledge of Risk”, media release, December 20,http://www.insurancecouncil.com.au/media_release/plain/177.122 Insurance Council of Australia, 2014, “Response to the Productivity Commission Draft Review of Natural Disaster Funding Arrangements”, October,http://www.pc.gov.au/inquiries/completed/disaster-funding/submissions/submissions-test2/submission-counter/subdr185-disaster-funding.pdf.123 Productivity Commission, 2016, “Issues Paper: Data Availability and Use”, April, http://www.pc.gov.au/inquiries/current/data-access/issues/data-access-issues.pdf.124 Barriers to access to high quality data has been repeatedly raised in various Chatham House workshops and conversations with several insurers, re-insurers, commercial property developers, and engineering firms, listed in Appendix 2.125 Geoscience Australia’s digital elevation data sources are listed at: http://www.ga.gov.au/scientific-topics/national-location-information/digital-elevation-data.126 Total value of Australian residential property is estimated at $5.9 trillion and there are 9.6 million residential properties. See Australian Bureau of Statistics,2015, “The Australian Residential Property Market”, September, http://www.abs.gov.au/ausstats/[email protected]/Lookup/6416.0Feature+Article1Sep%202015.;Total residential term loans from Australian Authorised Deposit-taking Institutions (ADIs) – $1.384 trillion at December 2015. See APRA, 2016, “QuarterlyAuthorised Deposit-taking Institution Property Exposures – December 2015”, February, http://www.apra.gov.au/adi/Publications/Documents/1602-QAPES-December-2015.pdf.; Total residential property loans outstanding: 5.49 million loans. See Australia Prudential Regulatory Authority, Op Cit.127 Banks account for about 80 per cent of residential development lending as of 2013, and held exposures of about $35bn, see S. Rowley, G. Costello, D.
40
Higgins and and P. Phibbs, 2014, “The financing of residential development in Australia", AHURI Final Report 219,Australian Housing and Urban Research Institute, Melbourne, February,http://www.ahuri.edu.au/publications/download.asp?ContentID=ahuri_81009_fr&redirect=true.[Accessed this report: 09 12 2015.128 See Appendix 4.129 Natural Disaster Insurance Review, 2011, Issues Paper. June 2011, Commonwealth of Australia,http://www.ndir.gov.au/content/issuespapers/NDIRIssuesPaper.pdf130 Australian Bankers’ Association, 2011, “Submission to the Natural Disaster Insurance Review”,http://www.ndir.gov.au/content/submissions/issues_paper_submissions/Australian_Bankers_Association_Inc.pdf.131 E. Georgopoulou, S. Mirasgedis, Y. Sarafidis, S. Hontou, N. Gakis, D. Lalas, F. Xenoyianni, N. Kakavoulis, D. Dimopoulos, and V. Zavras, 2015, “Amethodological framework and tool for assessing the climate change related risks in the banking sector”, Journal of Environmental Planning and Management,58: 874-897, DOI: 10.1080/09640568.2014.899489.132 See Appendix 2.133 Freddie Mac, 2016, Life’s a Beach. April, http://www.freddiemac.com/finance/report/20160426_lifes_a_beach.html.134 The Australian Bankers’ Association has made no submissions on climate change or natural peril risk to any reviews, with the exception of a submission tothe Natural Disasters Insurance Review (see footnote 88) in response to the review’s issues paper, which specifically examined the role and responsibility oflending institutions in relation to flood insurance.135 See Appendix 2.136 Westpac has advocated for policy solutions to climate impacts via its membership of the Australian Business Roundtable for Natural Disaster Resilienceand Safer Communities - although to date that forum has limited its scope to historical risk, rather than incorporating climate change. In the interests ofdisclosure, Westpac is a Climate Partner of The Climate Institute. Climate Partners are subject to a due diligence process and to board approval. For moreinformation, see: http://www.climateinstitute.org.au/climate-partners.html.137 Suncorp Group has regularly made submissions to reviews of natural disaster mitigation and has participated in several initiatives including one in Roma.138 Australian Bankers’ Association, Op Cit.139 Ibid.140 Wang et al, Op Cit.141 For example, R. Feneley, 2013, “A tale of two houses: lessons in how to rebuild a life from the ashes”, Sydney Morning Herald, November 10.142 See Appendix 4.143 See Appendix 4.144 Reserve Bank of Australia, 2013, “Financial Stability Review”, September.145 Australian Prudential Regulatory Authority, 2014, “Financial System Inquiry: Response to the Interim Report”, August 26, p. 15,http://fsi.gov.au/files/2014/08/APRA_2.pdf.146 M.T. Thurner and A. Dwyer, 2013, “Partial Mortgage Prepayments and Housing Credit”, RBA Bulletin, September,http://www.rba.gov.au/publications/bulletin/2013/sep/4.html#fn4.147 Reserve Bank of Australia, 2012, “Box B: Households’ Mortgage Repayment Buffers”, Financial Stability Review,http://www.rba.gov.au/publications/fsr/2012/sep/box-b.html.148 T. Raggatt, 2015, “Bank of Queensland’s risk policy rules out lending to islands”, Townsville Bulletin, November 28,http://www.townsvillebulletin.com.au/news/bank-of-queenslands-risk-policy-rules-out-lending-to-islands/news-story/5e7e7789093313c368a32fb4f394d175as at 02/02/2016.149 Productivity Commission, 2013, Op Cit.; Productivity Commission, 2014, Op Cit.150 J. Eyers, 2015, “NAB puts 40 postcodes on credit watchlist”, Sydney Morning Herald, August 18, http://www.smh.com.au/business/banking-and-finance/nab-puts-40-postcodes-on-credit-watchlist-20150817-gj12o3.html.151 T. Raggatt, 2015, “Bank of Queensland’s risk policy rules out lending to islands”, Townsville Bulletin, November 28,http://www.townsvillebulletin.com.au/news/bank-of-queenslands-risk-policy-rules-out-lending-to-islands/news-story/5e7e7789093313c368a32fb4f394d175.152 Productivity Commission, 2013, Op Cit.; Productivity Commission, 2014, Op Cit.153 Productivity Commission, 2014, Op Cit.154 PlanDev Business Solutions, 2012, "Enhancing Disaster Resilience in the Built Environment", a report for the National Emergency ManagementCommittee's Land Use Planning and Building Codes Taskforce, June.155 Department of Environment, Op Cit.