Embed Size (px)
Citation preview
Theory of Quantum Matter: from Quantum Fields
to Strings
HARVARD
Salam Distinguished LecturesThe Abdus Salam International Center for Theoretical Physics
Trieste, ItalyJanuary 27-30, 2014
Subir Sachdev
Talk online: sachdev.physics.harvard.eduThursday, January 30, 14

Map data ©2014 AutoNavi, Google 200 km
Thursday, January 30, 14

Map data ©2014 AutoNavi, Google 200 km
Prof. Abdus Salam’shometown
Thursday, January 30, 14

Map data ©2014 AutoNavi, Google 200 km
Prof. Abdus Salam’shometown
My grandparents’birthplace
Thursday, January 30, 14
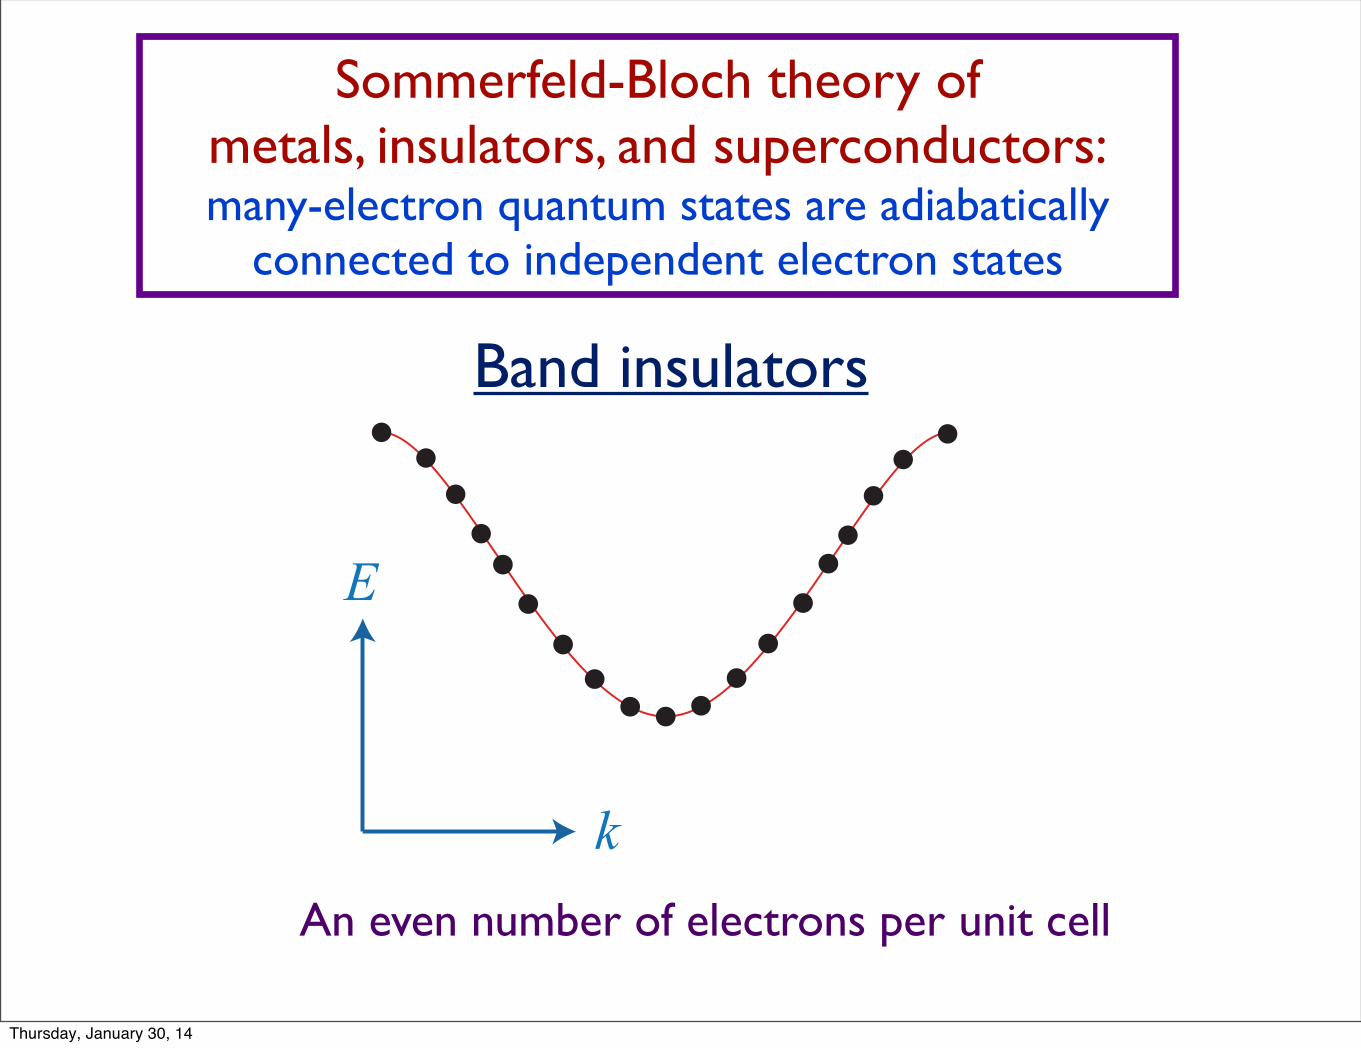
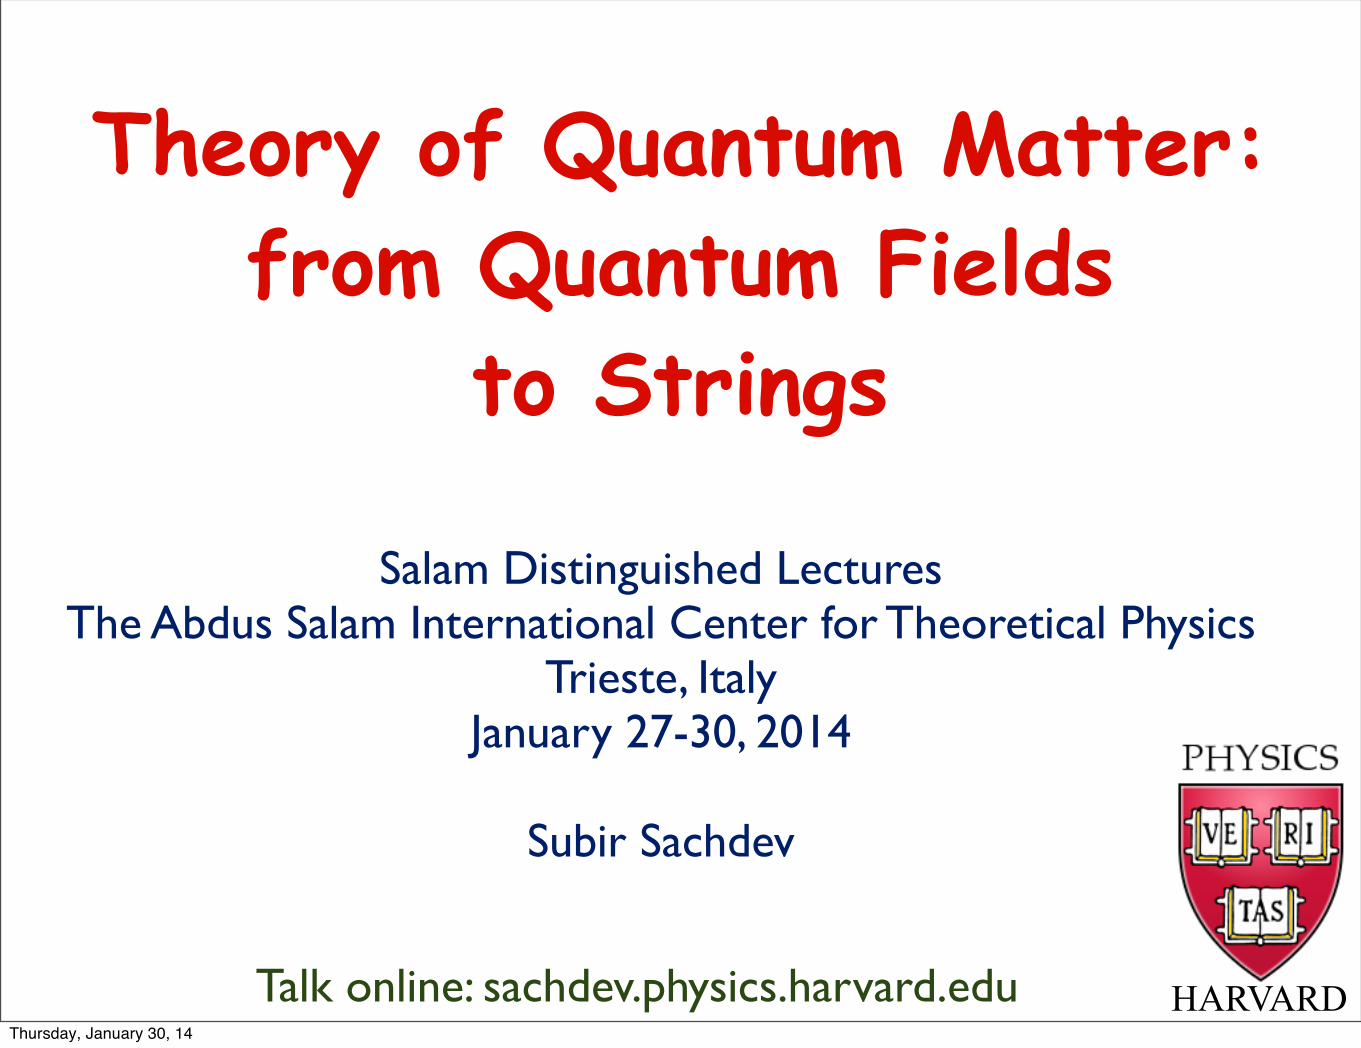
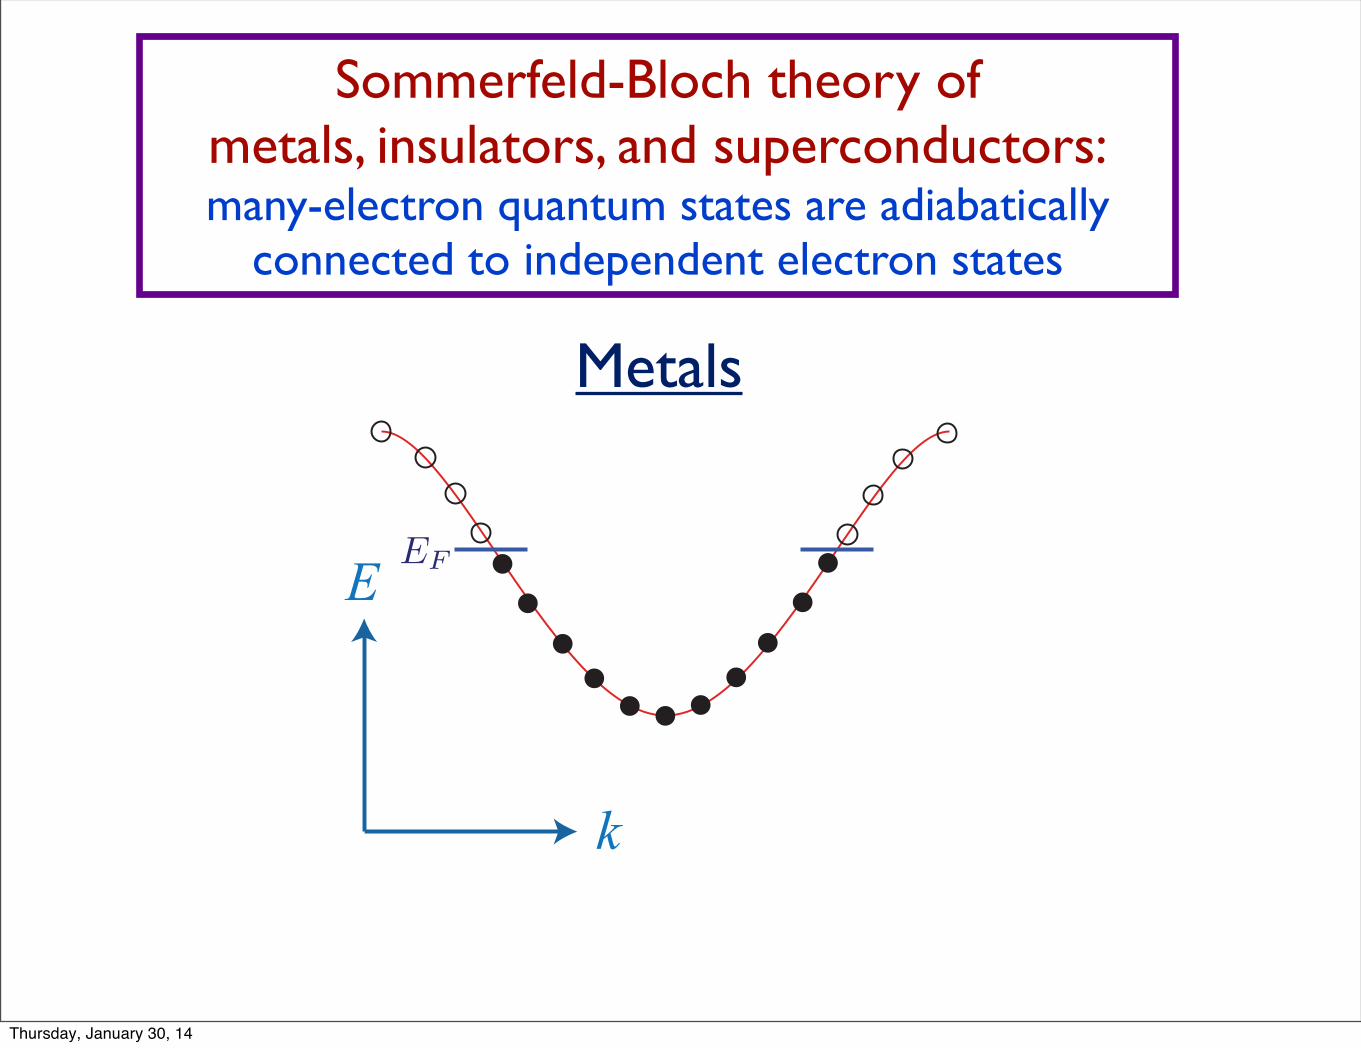
Sommerfeld-Bloch theory of metals, insulators, and superconductors:many-electron quantum states are adiabatically
connected to independent electron states
Band insulators
E
MetalMetal
carryinga current
InsulatorSuperconductor
kAn even number of electrons per unit cell
Thursday, January 30, 14

E
MetalMetal
carryinga current
InsulatorSuperconductor
k
E
MetalMetal
carryinga current
InsulatorSuperconductor
k
Sommerfeld-Bloch theory of metals, insulators, and superconductors:many-electron quantum states are adiabatically
connected to independent electron states
Metals
Thursday, January 30, 14

E
MetalMetal
carryinga current
InsulatorSuperconductor
k
Sommerfeld-Bloch theory of metals, insulators, and superconductors:many-electron quantum states are adiabatically
connected to independent electron states
Superconductors
Thursday, January 30, 14
E
MetalMetal
carryinga current
InsulatorSuperconductor
k
E
MetalMetal
carryinga current
InsulatorSuperconductor
k
Sommerfeld-Bloch theory of metals, insulators, and superconductors:many-electron quantum states are adiabatically
connected to independent electron states
Metals
Thursday, January 30, 14
E
MetalMetal
carryinga current
InsulatorSuperconductor
k
E
MetalMetal
carryinga current
InsulatorSuperconductor
k
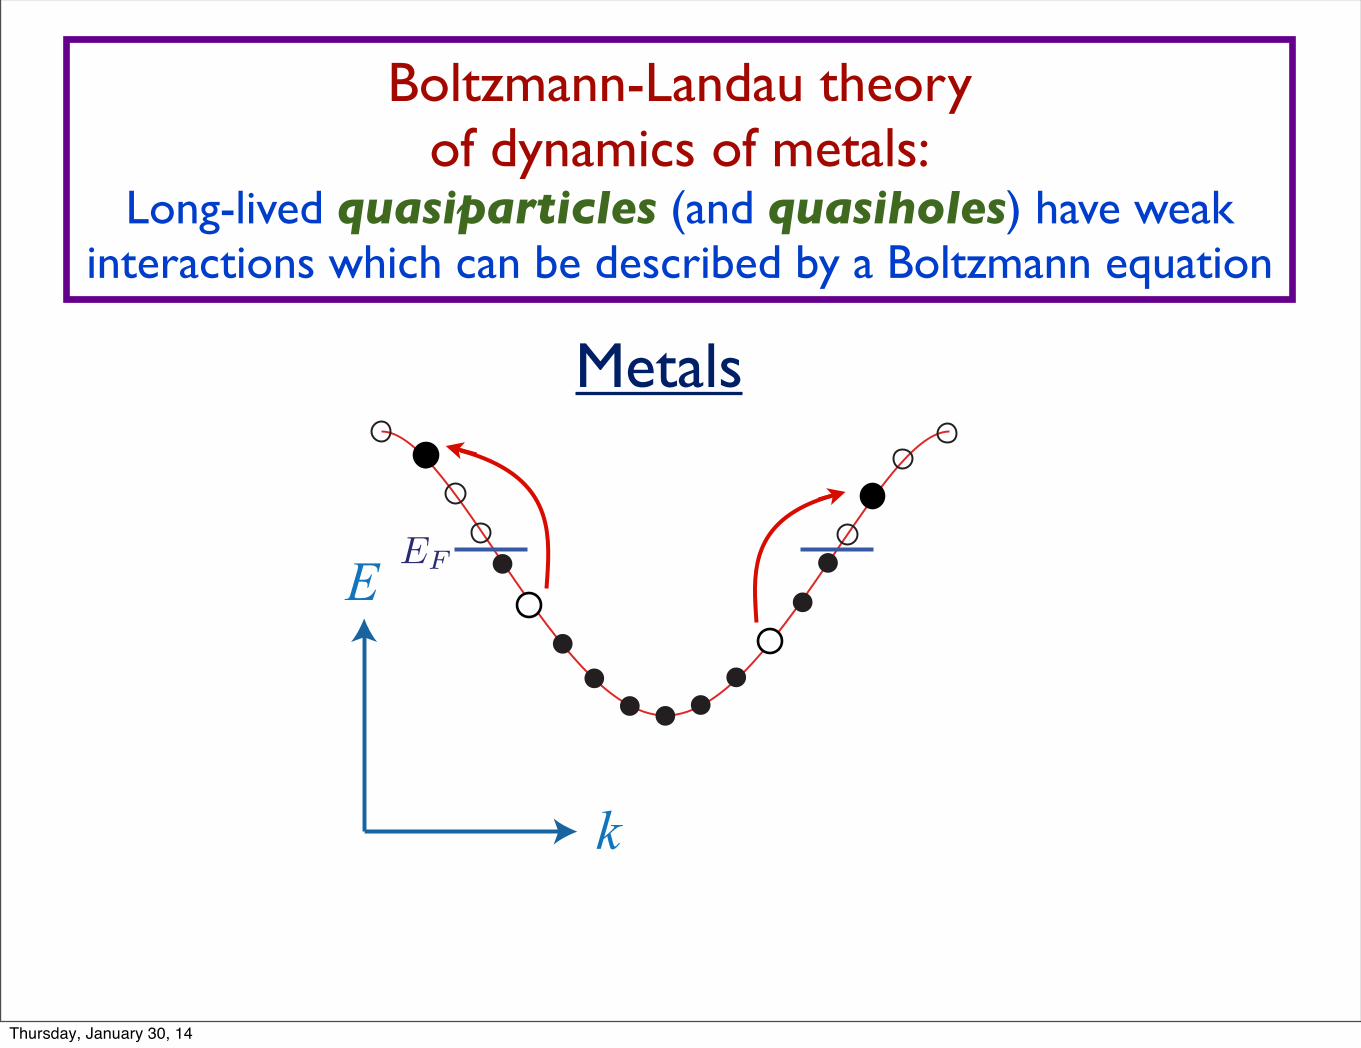
Boltzmann-Landau theory of dynamics of metals:
Long-lived quasiparticles (and quasiholes) have weak interactions which can be described by a Boltzmann equation
Metals
Thursday, January 30, 14

Modern phases of quantum matterNot adiabatically connected
to independent electron states:many-particle
quantum entanglement,
Thursday, January 30, 14

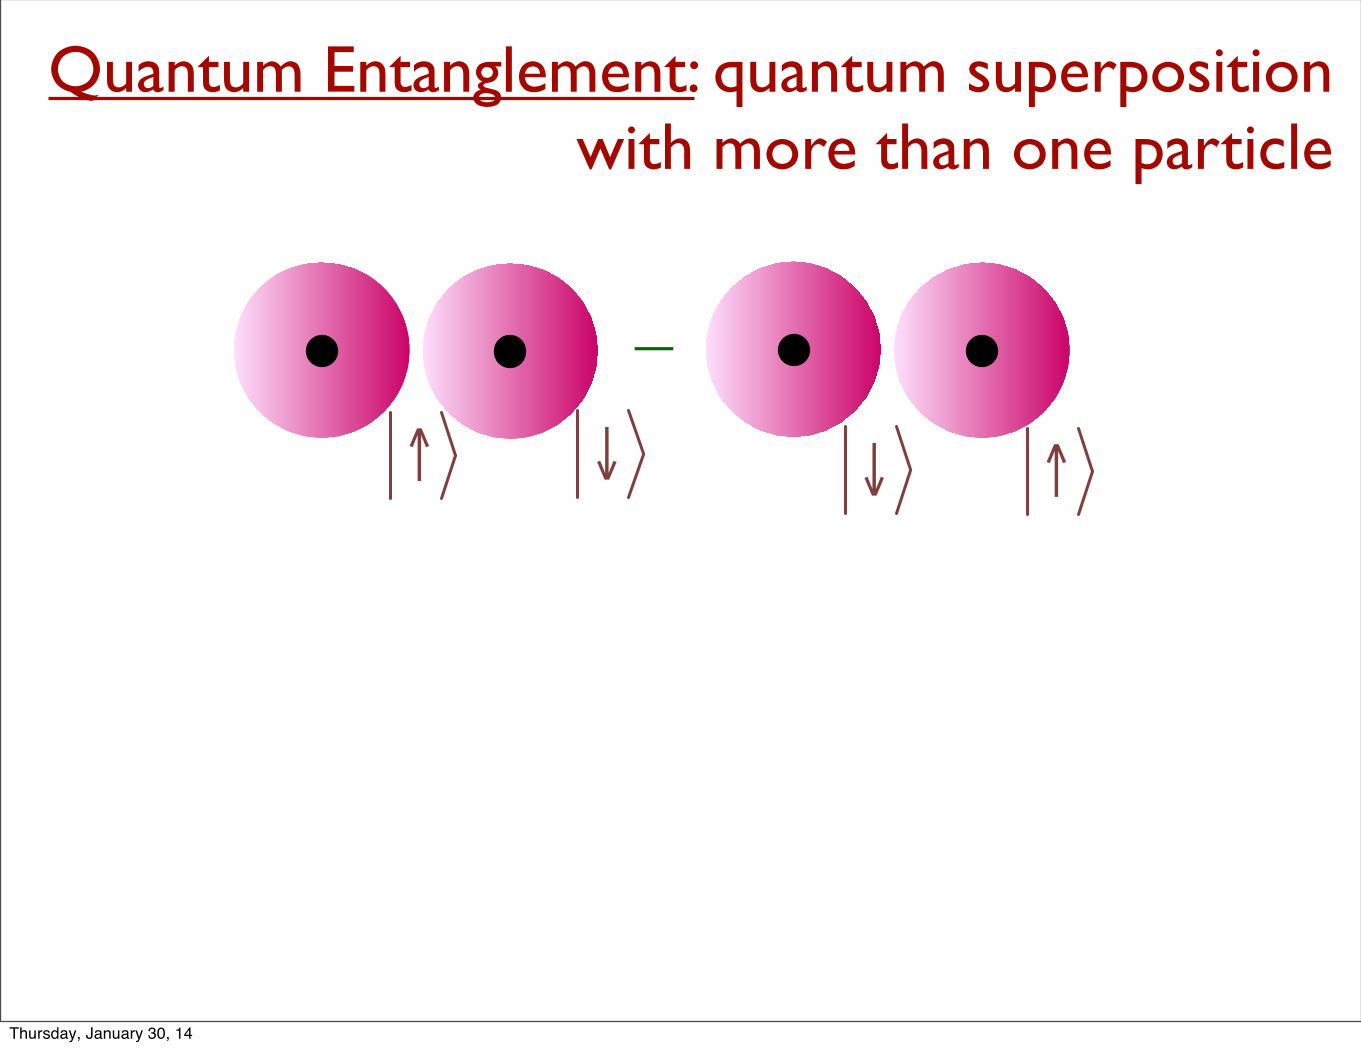
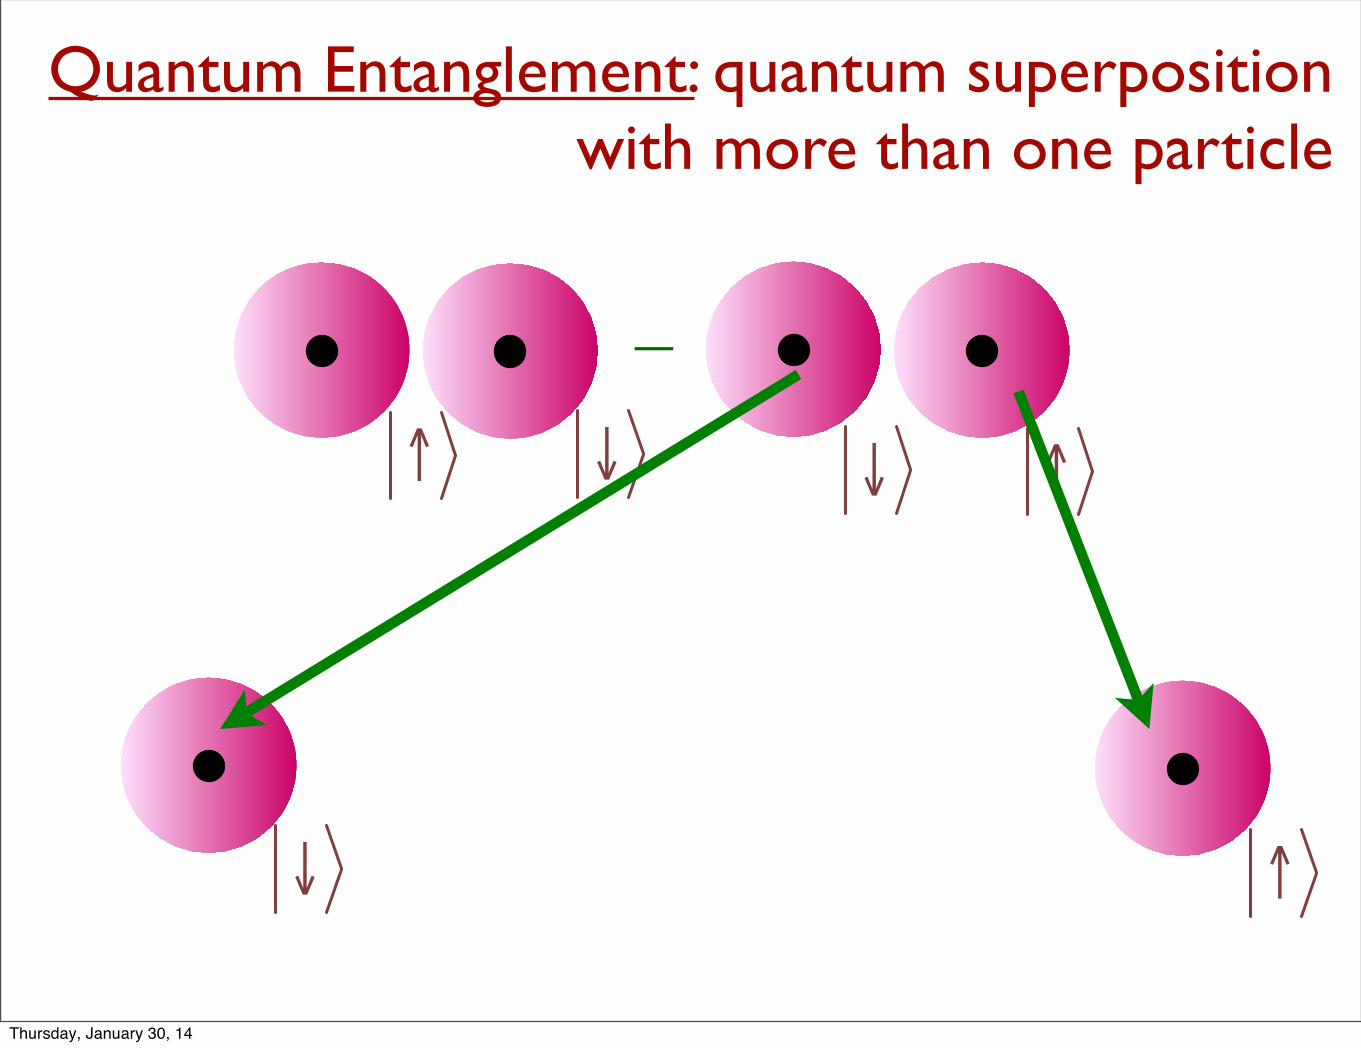
Quantum Entanglement: quantum superposition with more than one particle
Thursday, January 30, 14

Hydrogen atom:
=1⌃2
(|⇥⇤⌅ � |⇤⇥⌅)
Hydrogen molecule:
= _
Quantum Entanglement: quantum superposition with more than one particle
Thursday, January 30, 14
_
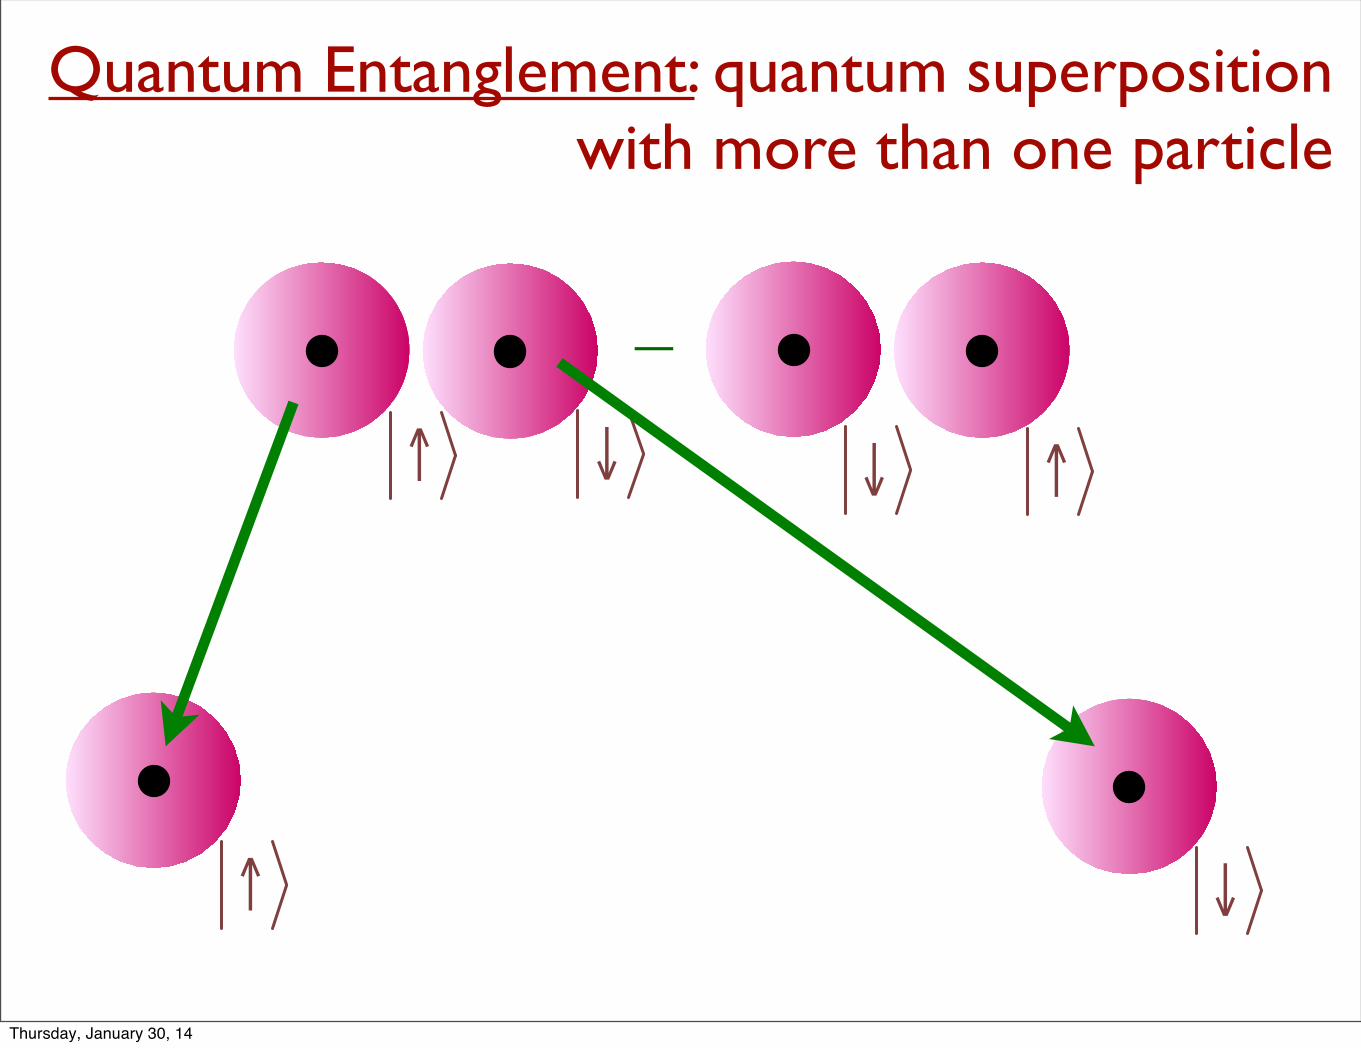
Quantum Entanglement: quantum superposition with more than one particle
Thursday, January 30, 14
_
Quantum Entanglement: quantum superposition with more than one particle
Thursday, January 30, 14
_
Quantum Entanglement: quantum superposition with more than one particle
Thursday, January 30, 14

_
Einstein-Podolsky-Rosen “paradox”: Measuring one spin instantaneously effects the state of another electron far away
Quantum Entanglement: quantum superposition with more than one particle
Thursday, January 30, 14

Modern phases of quantum matterNot adiabatically connected
to independent electron states:many-particle
quantum entanglement,
Thursday, January 30, 14

Modern phases of quantum matterNot adiabatically connected
to independent electron states:many-particle
quantum entanglement,
Famous examples:
The fractional quantum Hall effect of electrons in two dimensions (e.g. in graphene) in the presence of a
strong magnetic field. The ground state is described by Laughlin’s wavefunction, and the excitations are
quasiparticles which carry fractional charge.
Thursday, January 30, 14

Modern phases of quantum matterNot adiabatically connected
to independent electron states:many-particle
quantum entanglement,
Famous examples:
Electrons in one dimensional wires form the Luttinger liquid. The quanta of density oscillations (“phonons”) are a quasiparticle basis of the low-energy Hilbert space. Similar comments apply to
magnetic insulators in one dimension.
Thursday, January 30, 14

Modern phases of quantum matterNot adiabatically connected
to independent electron states:many-particle
quantum entanglement,
Thursday, January 30, 14
Modern phases of quantum matterNot adiabatically connected
to independent electron states:many-particle
quantum entanglement,
Thursday, January 30, 14
Modern phases of quantum matterNot adiabatically connected
to independent electron states:many-particle
quantum entanglement,and no quasiparticles
Thursday, January 30, 14

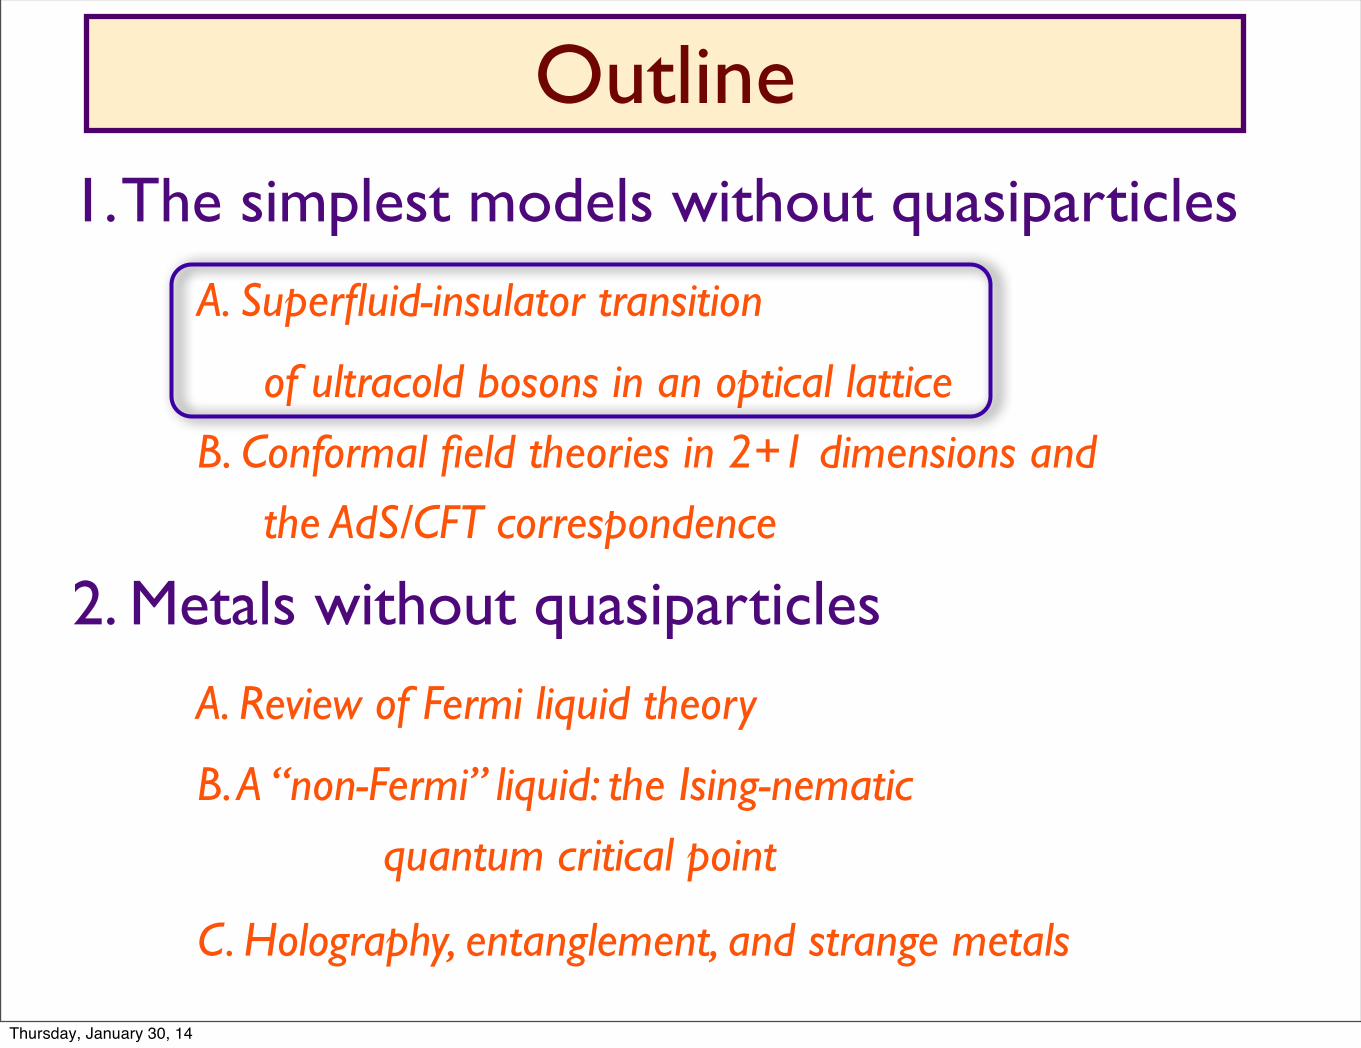
1. The simplest models without quasiparticles
A. Superfluid-insulator transition
of ultracold bosons in an optical lattice
B. Conformal field theories in 2+1 dimensions and
the AdS/CFT correspondence
2. Metals without quasiparticles
A. Review of Fermi liquid theory
B. A “non-Fermi” liquid: the Ising-nematic
quantum critical point
C. Holography, entanglement, and strange metals
Outline
Thursday, January 30, 14

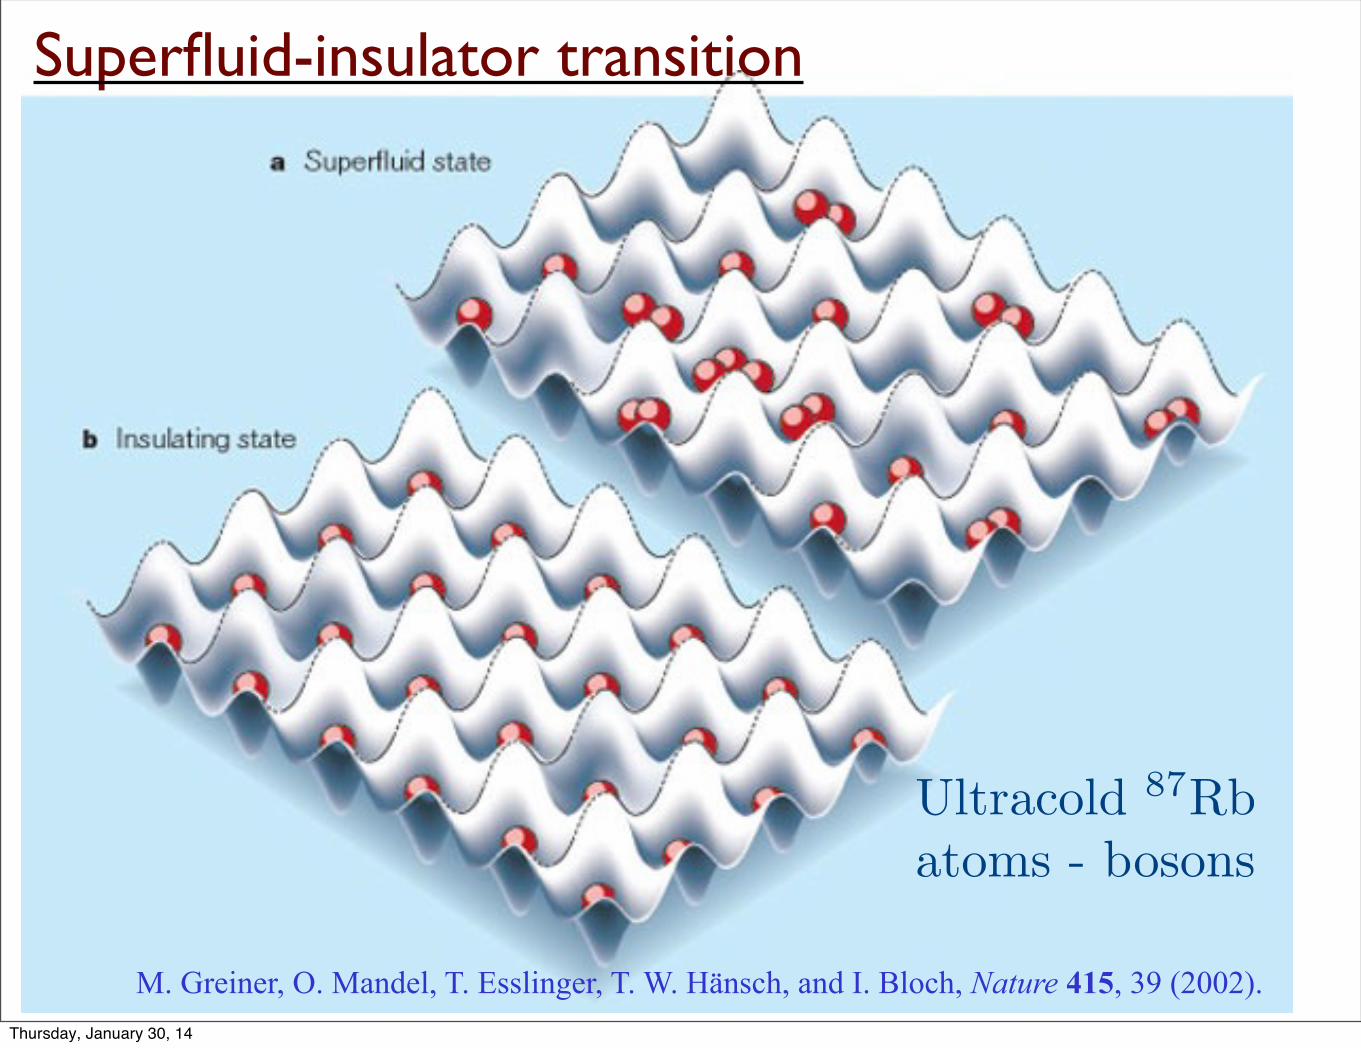
M. Greiner, O. Mandel, T. Esslinger, T. W. Hänsch, and I. Bloch, Nature 415, 39 (2002).
Ultracold 87Rbatoms - bosons
Superfluid-insulator transition
Thursday, January 30, 14
[bj , b†k] = �jk
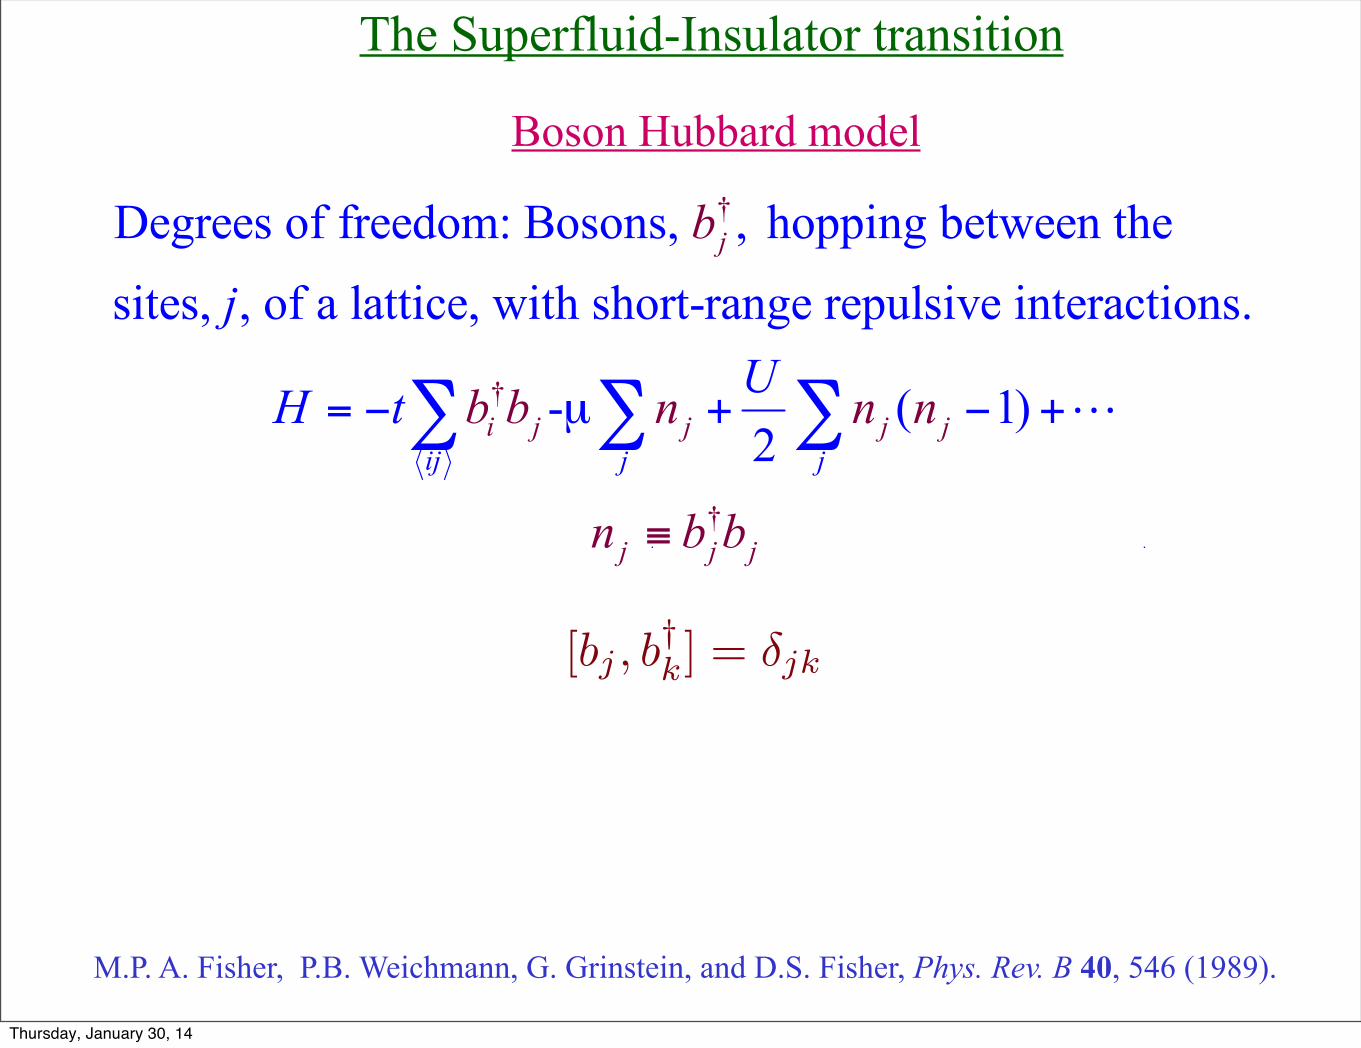
The Superfluid-Insulator transition
Boson Hubbard model
M.P. A. Fisher, P.B. Weichmann, G. Grinstein, and D.S. Fisher, Phys. Rev. B 40, 546 (1989).
Thursday, January 30, 14

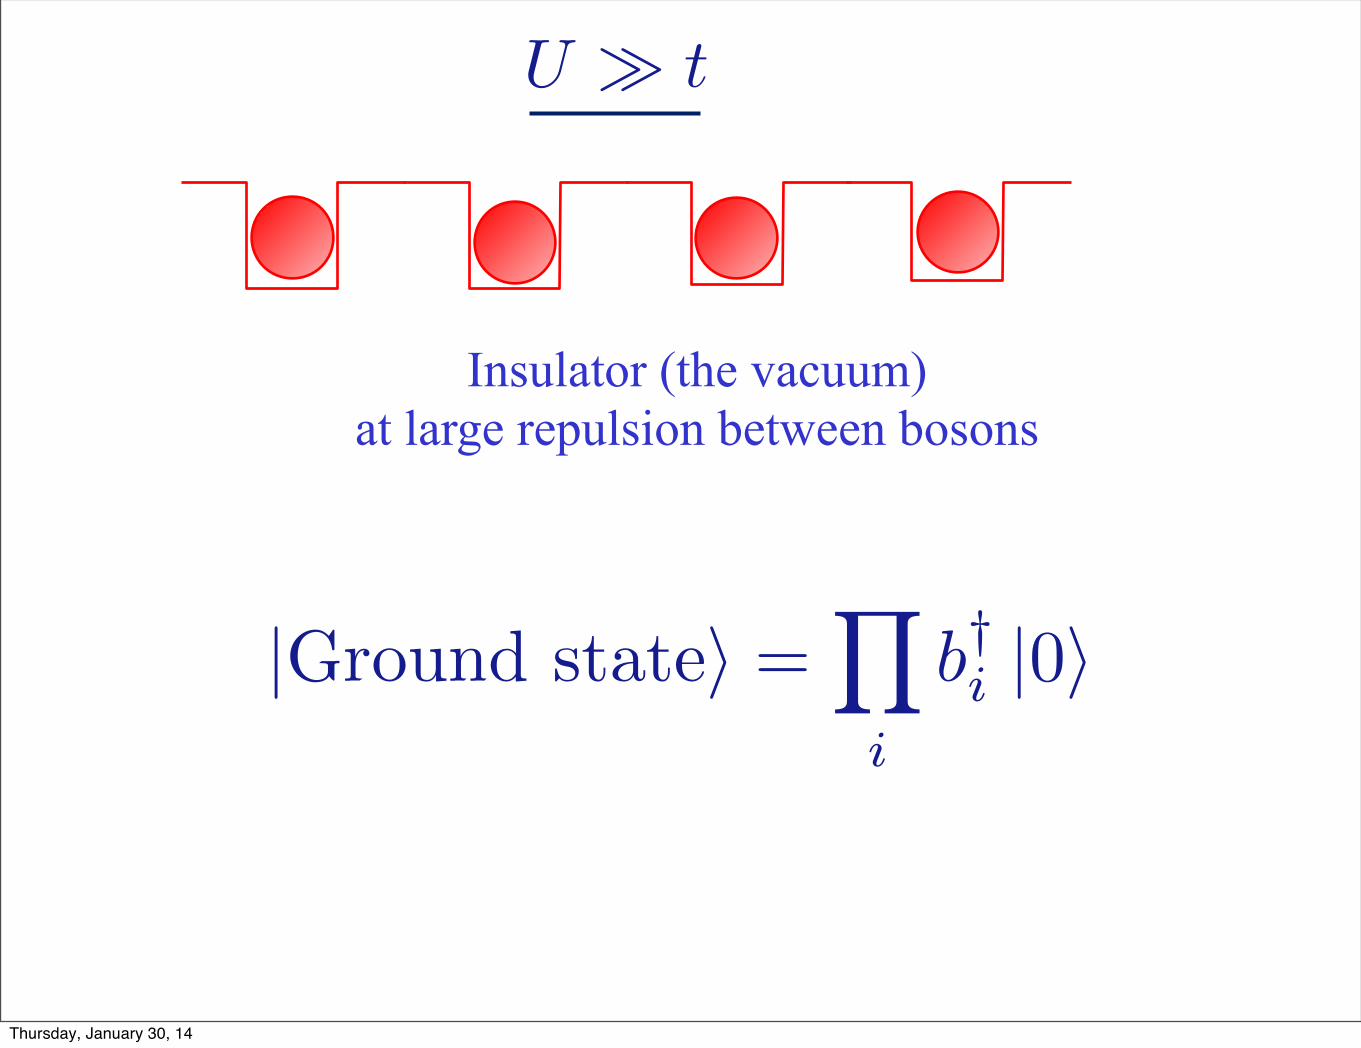
U � t
|Ground statei =Y
i
b†i |0i
Insulator (the vacuum) at large repulsion between bosons
Thursday, January 30, 14
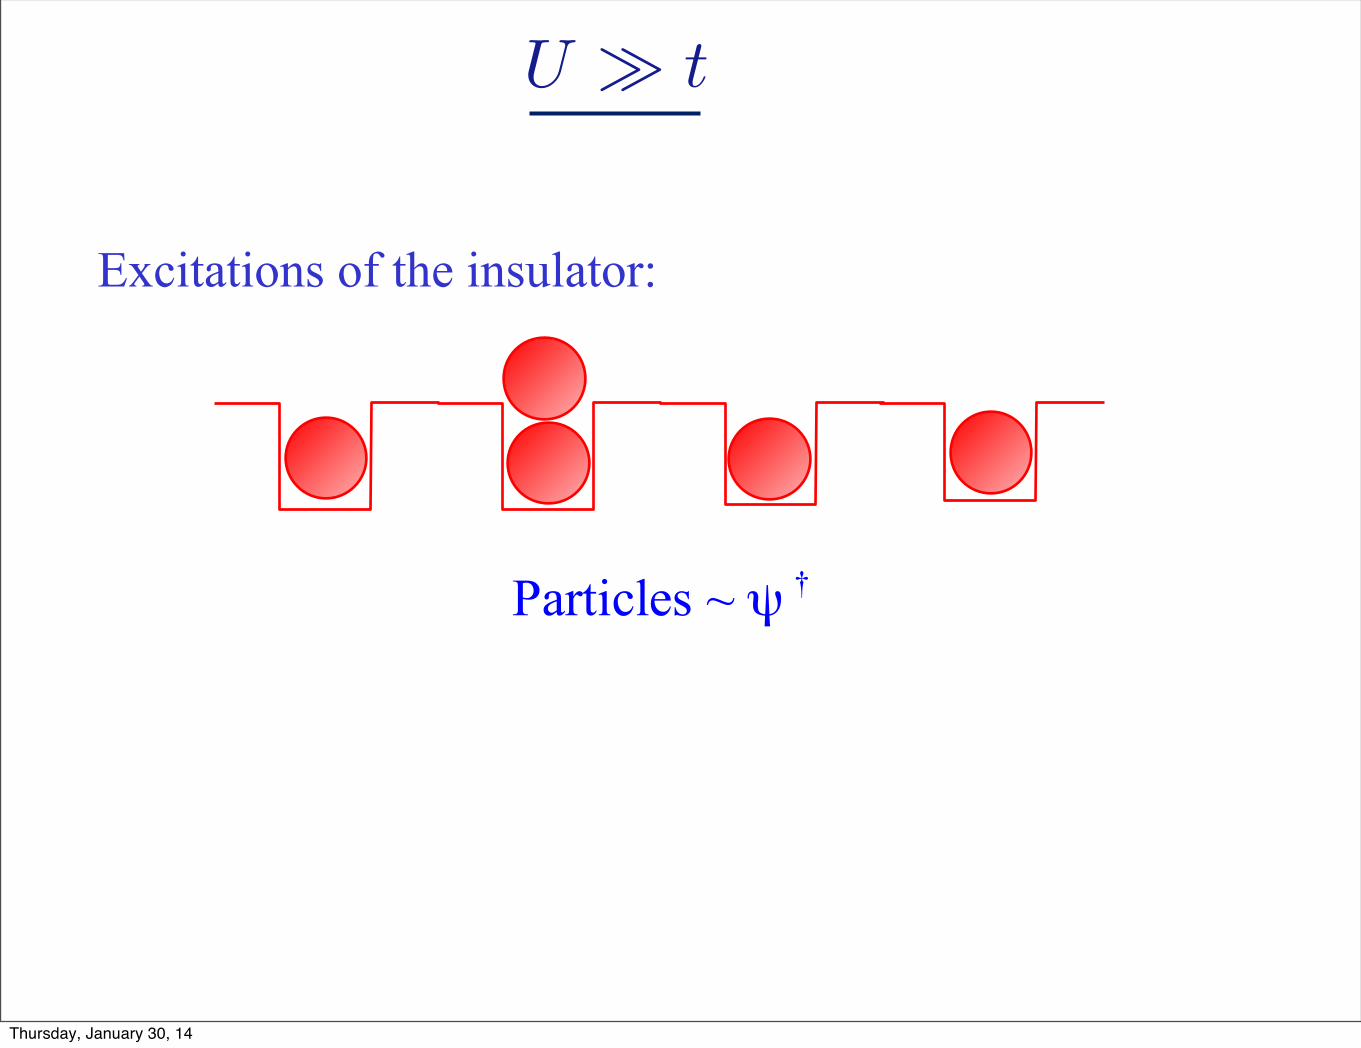
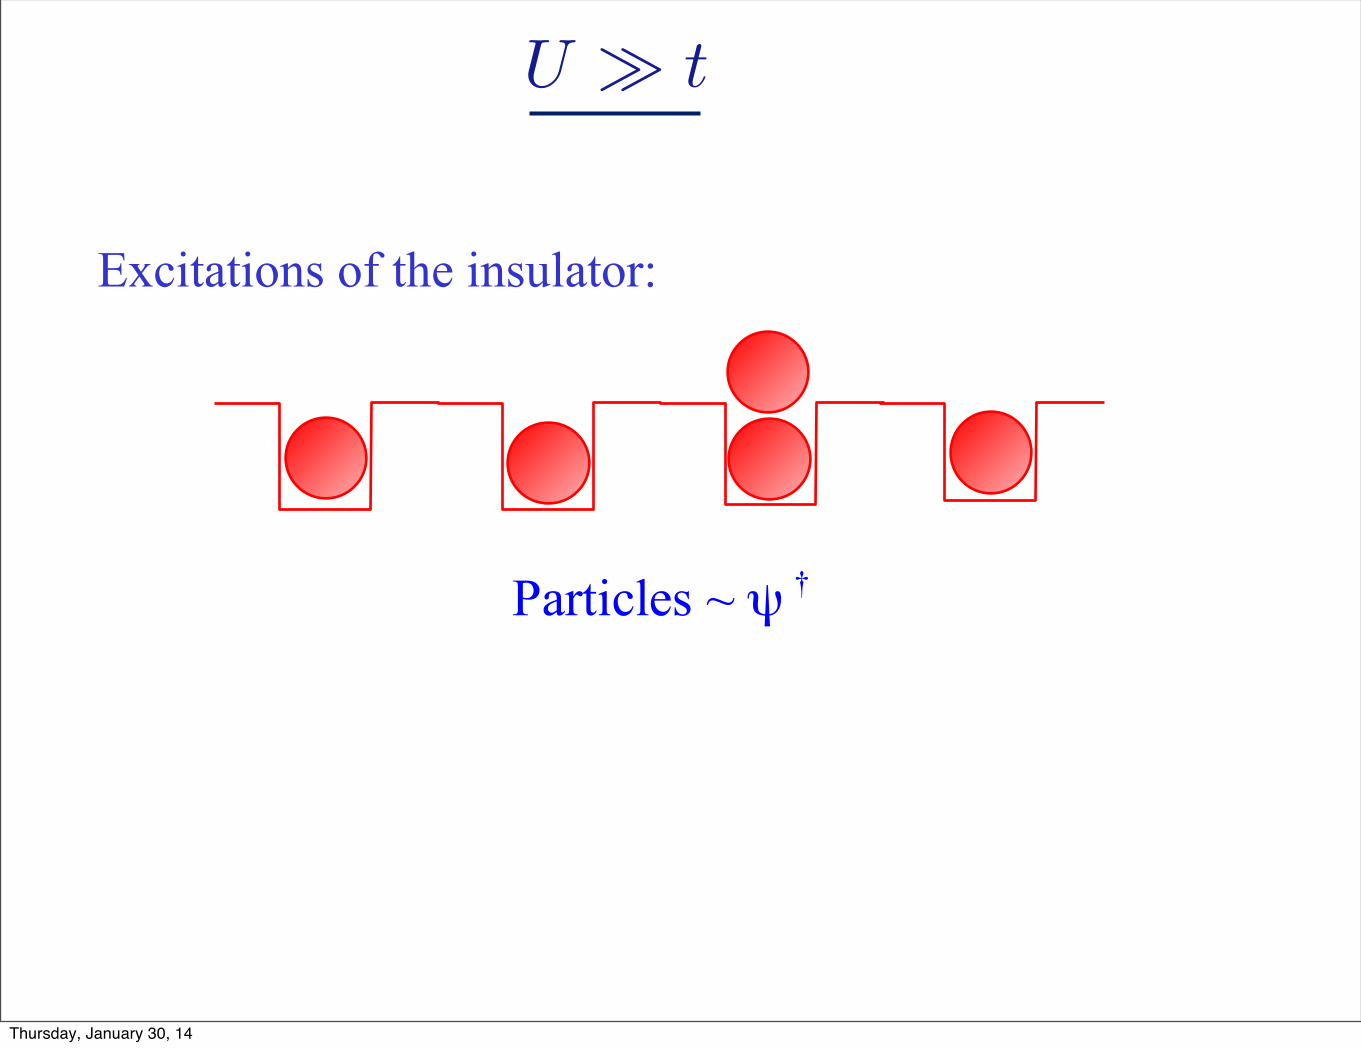
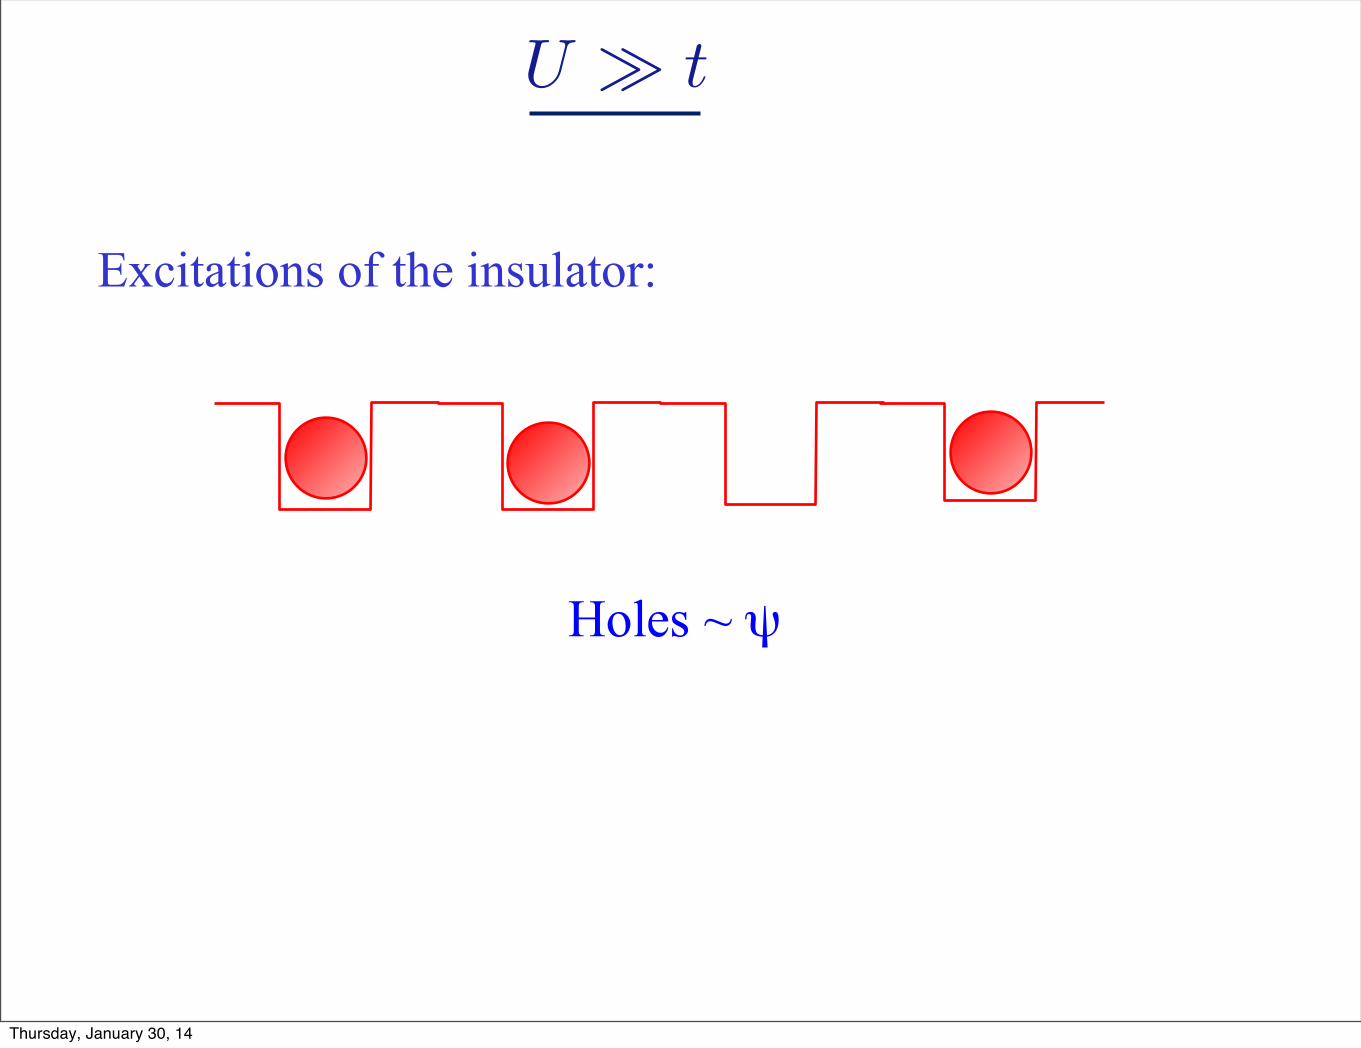
Excitations of the insulator:
U � t
Thursday, January 30, 14
Excitations of the insulator:
U � t
Thursday, January 30, 14

Excitations of the insulator:
U � t
Thursday, January 30, 14
Excitations of the insulator:
U � t
Thursday, January 30, 14

Excitations of the insulator:
U � t
Thursday, January 30, 14

Excitations of the insulator:
U � t
Thursday, January 30, 14
M. Greiner, O. Mandel, T. Esslinger, T. W. Hänsch, and I. Bloch, Nature 415, 39 (2002).
Ultracold 87Rbatoms - bosons
Superfluid-insulator transition
Thursday, January 30, 14
U � t
|Ground statei =Y
i
b†i |0i
Insulator (the vacuum) at large repulsion between bosons
Thursday, January 30, 14

|Ground statei ="X
i
b†i
#N
|0i
U ⌧ t
Superfluid at small repulsion between bosons
Thursday, January 30, 14
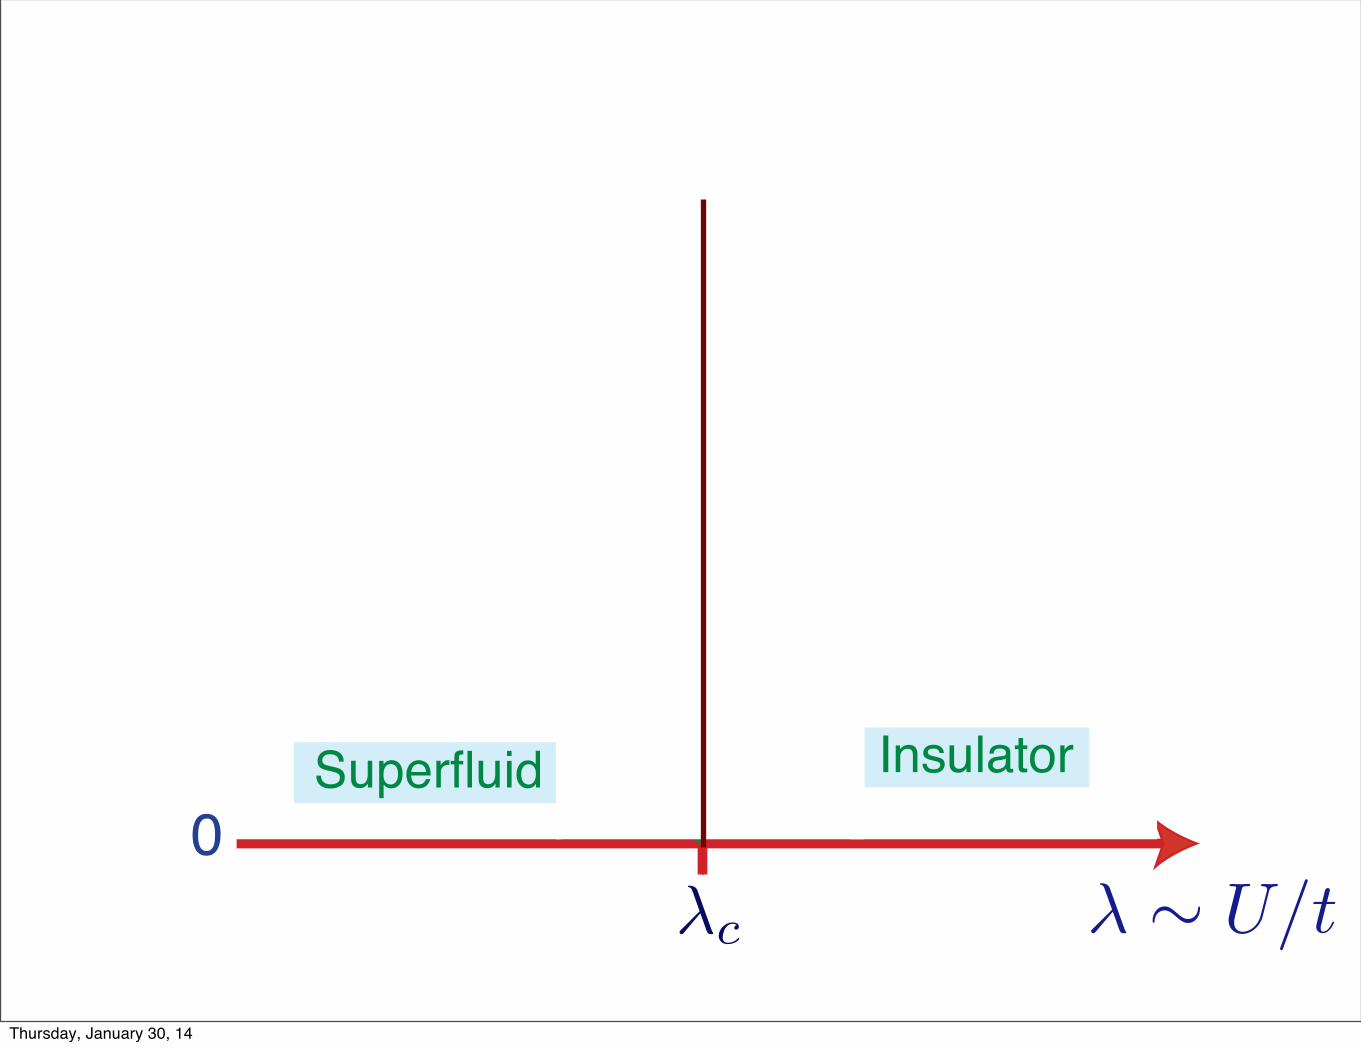
g
T
gc
0
InsulatorSuperfluid
Quantumcritical
TKT
�c
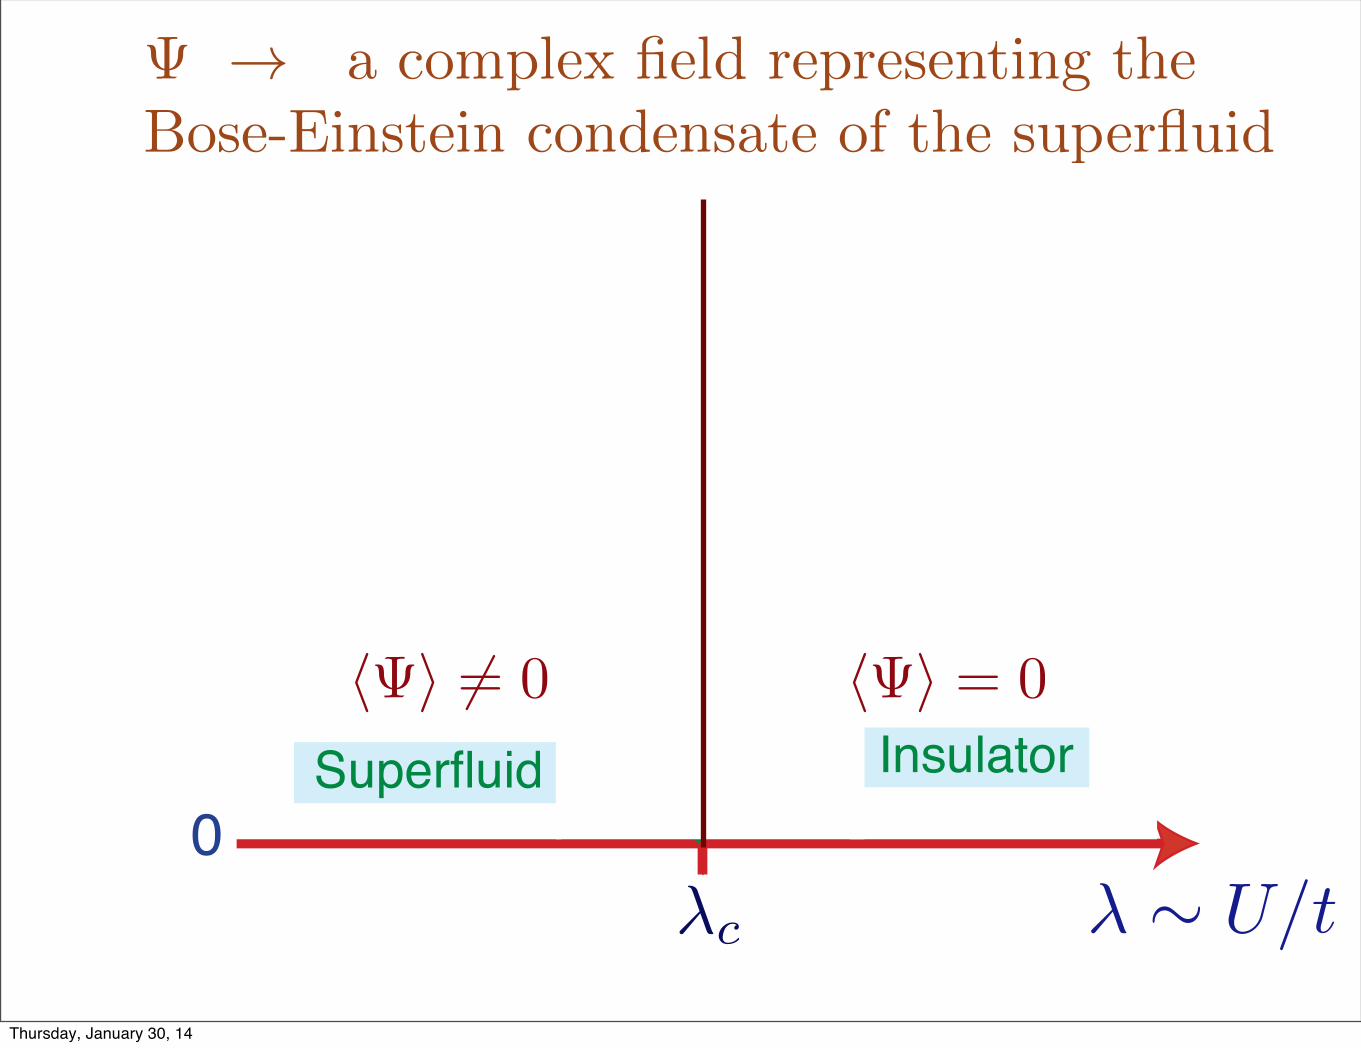
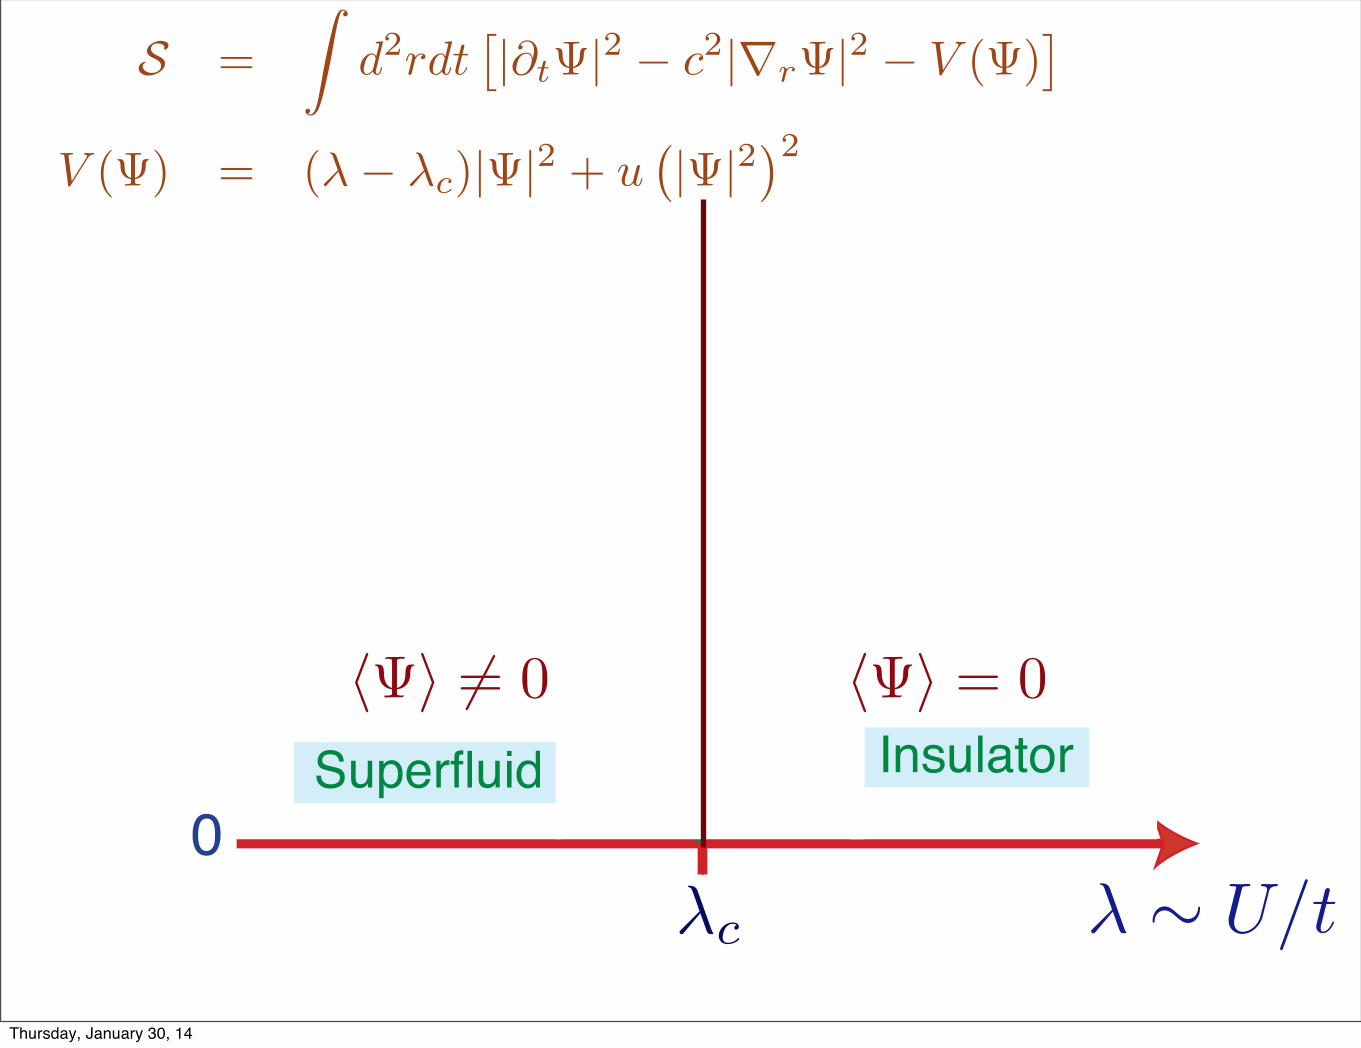
h i 6= 0 h i = 0
� ⇠ U/t
Thursday, January 30, 14
g
T
gc
0
InsulatorSuperfluid
Quantumcritical
TKT
�c
h i 6= 0 h i = 0
! a complex field representing the
Bose-Einstein condensate of the superfluid
� ⇠ U/t
Thursday, January 30, 14
g
T
gc
0
InsulatorSuperfluid
Quantumcritical
TKT
�c
h i 6= 0 h i = 0
S =
Zd2rdt
⇥|@t |2 � c2|rr |2 � V ( )
⇤
V ( ) = (�� �c)| |2 + u�| |2
�2
� ⇠ U/t
Thursday, January 30, 14

g
T
gc
0
InsulatorSuperfluid
Quantumcritical
TKT
�c
h i 6= 0 h i = 0
system with a recently developed scheme based on single-atom-resolved detection24. It is the high sensitivity of this method thatallowed us to reduce the modulation amplitude by almost an orderof magnitude compared with earlier experiments20,21 and to stay wellwithin the linear response regime (Supplementary Information).
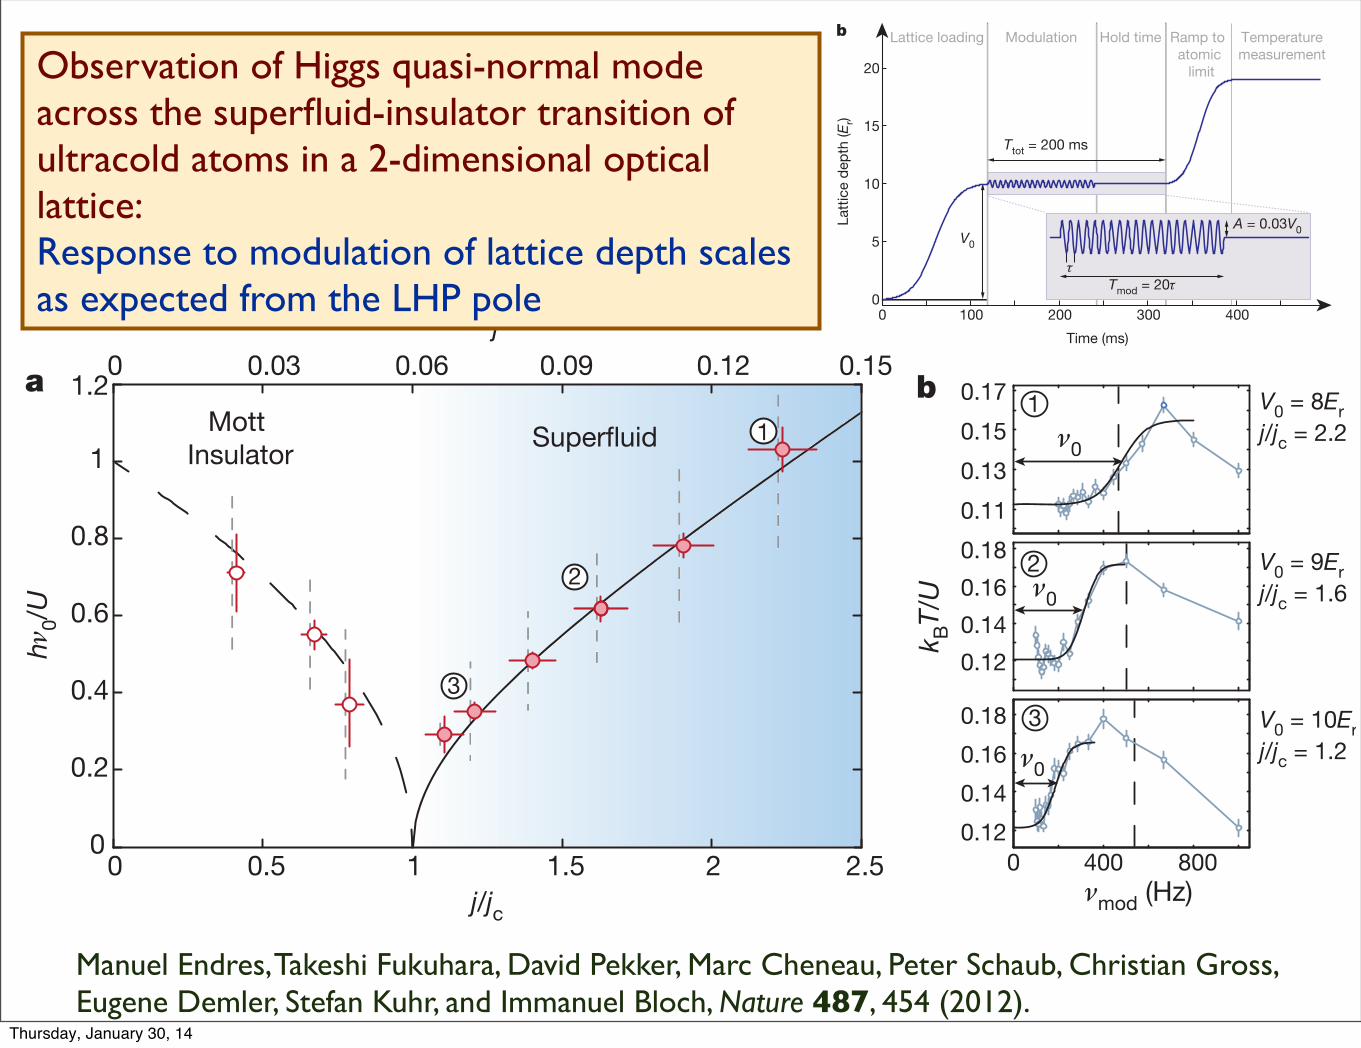
The results for selected lattice depths V0 are shown in Fig. 2b. Weobserve a gapped response with an asymmetric overall shape that willbe analysed in the following paragraphs. Notably, the maximumobserved temperature after modulation is well below the ‘melting’temperature for a Mott insulator in the atomic limit25, Tmelt < 0.2U/kB
(kB, Boltzmann’s constant), demonstrating that our experiments probethe quantum gas in the degenerate regime. To obtain numerical valuesfor the onset of spectral response, we fitted each spectrum with an errorfunction centred at a frequency n0 (Fig. 2b, black lines). With japproaching jc, the shift of the gap to lower frequencies is alreadyvisible in the raw data (Fig. 2b) and becomes even more apparent forthe fitted gap n0 as a function of j/jc (Fig. 2a, filled circles). The n0 valuesare in quantitative agreement with a prediction for the Higgs gap nSF atcommensurate filling (solid line):
hnSF=U~ 3ffiffiffi2p
{4" #
1zj=jcð Þ$ %1=2
j=jc{1ð Þ1=2
Here h denotes Planck’s constant. This value is based on an analysis ofvariations around a mean-field state7,16 (throughout the manuscript,we have rescaled jc in the theoretical calculations to match the valuejc<0:06 obtained from quantum Monte Carlo simulations26).
The sharpness of the spectral onset can be quantified by the width ofthe fitted error function, which is shown as vertical dashed lines inFig. 2a. Approaching the critical point, the spectral onset becomessharper, and the width normalized to the centre frequency n0 remainsconstant (Supplementary Fig. 3). The constancy of this ratio indicatesthat the width of the spectral onset scales with the distance to thecritical point in the same way as the gap frequency.
We observe similar gapped responses in the Mott insulating regime(Supplementary Information and Fig. 5a), with the gap closing con-tinuously when approaching the critical point (Fig. 2a, open circles).We interpret this as a result of combined particle and hole excitationswith a frequency given by the Mott excitation gap that closes at thetransition point16. The fitted gaps are consistent with the Mott gap
hnMI=U~ 1z 12ffiffiffi2p
{17" #
j=jc$ %1=2
1{j=jcð Þ1=2
where nMI is the Mott gap as predicted by mean-field theory16 (Fig. 2a,dashed line).
The observed softening of the onset of spectral response in thesuperfluid regime has led to an identification of the experimentalsignal with a response from collective excitations of Higgs type. Togain further insight into the full in-trap response, we calculated theeigenspectrum of the system in a Gutzwiller approach16,22 (Methodsand Supplementary Information). The result is a series of discreteeigenfrequencies (Fig. 3a), and the corresponding eigenmodes showin-trap superfluid density distributions, which are reminiscent of thevibrational modes of a drum (Fig. 3b). The frequency of the lowest-lying amplitude-like eigenmode n0,G closely follows the long-wave-length prediction for homogeneous commensurate filling nSF over awide range of couplings j/jc until the response rounds off in the vicinityof the critical point due to the finite size of the system (Fig. 3c). Fittingthe low-frequency edge of the experimental data can be interpreted asextracting the frequency of this mode, which explains the goodquantitative agreement with the prediction for the homogeneous com-mensurate filling in Fig. 2a. Modes at different frequencies from thelowest-lying amplitude-like mode broaden the spectrum only abovethe onset of spectral response.
An eigenmode analysis, however, does not yield any informationabout the finite spectral width of the modes, which stems from theinteraction between amplitude and phase excitations. We will considerthe question of the spectral width by analysing the low-, intermediate-and high-frequency parts of the response separately. We begin byexamining the low-frequency part of the response, which is expectedto be governed by a process coupling a virtually excited amplitudemode to a pair of phase modes with opposite momenta. As a result,the response of a strongly interacting, two-dimensional superfluid is
a1
2
V
Re( )Im( )
Higgs modeNambu–
Goldstonemode
j/jc 1
0 100 200 300 4000
5
10
15
20
Time (ms)
Lat
tice
dept
h (E
r)
Lattice loading Modulation Hold time Ramp to atomic limit
Temperaturemeasurement
V0
Ttot = 200 ms
A = 0.03V0
Tmod = 20WW
b
3
j/jc * 1
j/jc , 1
ΨΨ
Figure 1 | Illustration of the Higgs mode and experimental sequence.a, Classical energy density V as a function of the order parameter Y. Within theordered (superfluid) phase, Nambu–Goldstone and Higgs modes arise fromphase and amplitude modulations (blue and red arrows in panel 1). As thecoupling j 5 J/U (see main text) approaches the critical value jc, the energydensity transforms into a function with a minimum at Y 5 0 (panels 2 and 3).Simultaneously, the curvature in the radial direction decreases, leading to acharacteristic reduction of the excitation frequency for the Higgs mode. In thedisordered (Mott insulating) phase, two gapped modes exist, respectivelycorresponding to particle and hole excitations in our case (red and blue arrow inpanel 3). b, The Higgs mode can be excited with a periodic modulation of thecoupling j, which amounts to a ‘shaking’ of the classical energy densitypotential. In the experimental sequence, this is realized by a modulation of theoptical lattice potential (see main text for details). t 5 1/nmod; Er, lattice recoilenergy.
LETTER RESEARCH
2 6 J U L Y 2 0 1 2 | V O L 4 8 7 | N A T U R E | 4 5 5
Macmillan Publishers Limited. All rights reserved©2012
system with a recently developed scheme based on single-atom-resolved detection24. It is the high sensitivity of this method thatallowed us to reduce the modulation amplitude by almost an orderof magnitude compared with earlier experiments20,21 and to stay wellwithin the linear response regime (Supplementary Information).
The results for selected lattice depths V0 are shown in Fig. 2b. Weobserve a gapped response with an asymmetric overall shape that willbe analysed in the following paragraphs. Notably, the maximumobserved temperature after modulation is well below the ‘melting’temperature for a Mott insulator in the atomic limit25, Tmelt < 0.2U/kB
(kB, Boltzmann’s constant), demonstrating that our experiments probethe quantum gas in the degenerate regime. To obtain numerical valuesfor the onset of spectral response, we fitted each spectrum with an errorfunction centred at a frequency n0 (Fig. 2b, black lines). With japproaching jc, the shift of the gap to lower frequencies is alreadyvisible in the raw data (Fig. 2b) and becomes even more apparent forthe fitted gap n0 as a function of j/jc (Fig. 2a, filled circles). The n0 valuesare in quantitative agreement with a prediction for the Higgs gap nSF atcommensurate filling (solid line):
hnSF=U~ 3ffiffiffi2p
{4" #
1zj=jcð Þ$ %1=2
j=jc{1ð Þ1=2
Here h denotes Planck’s constant. This value is based on an analysis ofvariations around a mean-field state7,16 (throughout the manuscript,we have rescaled jc in the theoretical calculations to match the valuejc<0:06 obtained from quantum Monte Carlo simulations26).
The sharpness of the spectral onset can be quantified by the width ofthe fitted error function, which is shown as vertical dashed lines inFig. 2a. Approaching the critical point, the spectral onset becomessharper, and the width normalized to the centre frequency n0 remainsconstant (Supplementary Fig. 3). The constancy of this ratio indicatesthat the width of the spectral onset scales with the distance to thecritical point in the same way as the gap frequency.
We observe similar gapped responses in the Mott insulating regime(Supplementary Information and Fig. 5a), with the gap closing con-tinuously when approaching the critical point (Fig. 2a, open circles).We interpret this as a result of combined particle and hole excitationswith a frequency given by the Mott excitation gap that closes at thetransition point16. The fitted gaps are consistent with the Mott gap
hnMI=U~ 1z 12ffiffiffi2p
{17" #
j=jc$ %1=2
1{j=jcð Þ1=2
where nMI is the Mott gap as predicted by mean-field theory16 (Fig. 2a,dashed line).
The observed softening of the onset of spectral response in thesuperfluid regime has led to an identification of the experimentalsignal with a response from collective excitations of Higgs type. Togain further insight into the full in-trap response, we calculated theeigenspectrum of the system in a Gutzwiller approach16,22 (Methodsand Supplementary Information). The result is a series of discreteeigenfrequencies (Fig. 3a), and the corresponding eigenmodes showin-trap superfluid density distributions, which are reminiscent of thevibrational modes of a drum (Fig. 3b). The frequency of the lowest-lying amplitude-like eigenmode n0,G closely follows the long-wave-length prediction for homogeneous commensurate filling nSF over awide range of couplings j/jc until the response rounds off in the vicinityof the critical point due to the finite size of the system (Fig. 3c). Fittingthe low-frequency edge of the experimental data can be interpreted asextracting the frequency of this mode, which explains the goodquantitative agreement with the prediction for the homogeneous com-mensurate filling in Fig. 2a. Modes at different frequencies from thelowest-lying amplitude-like mode broaden the spectrum only abovethe onset of spectral response.
An eigenmode analysis, however, does not yield any informationabout the finite spectral width of the modes, which stems from theinteraction between amplitude and phase excitations. We will considerthe question of the spectral width by analysing the low-, intermediate-and high-frequency parts of the response separately. We begin byexamining the low-frequency part of the response, which is expectedto be governed by a process coupling a virtually excited amplitudemode to a pair of phase modes with opposite momenta. As a result,the response of a strongly interacting, two-dimensional superfluid is
a1
2
V
Re( )Im( )
Higgs modeNambu–
Goldstonemode
j/jc 1
0 100 200 300 4000
5
10
15
20
Time (ms)
Lat
tice
dept
h (E
r)
Lattice loading Modulation Hold time Ramp to atomic limit
Temperaturemeasurement
V0
Ttot = 200 ms
A = 0.03V0
Tmod = 20WW
b
3
j/jc * 1
j/jc , 1
ΨΨ
Figure 1 | Illustration of the Higgs mode and experimental sequence.a, Classical energy density V as a function of the order parameter Y. Within theordered (superfluid) phase, Nambu–Goldstone and Higgs modes arise fromphase and amplitude modulations (blue and red arrows in panel 1). As thecoupling j 5 J/U (see main text) approaches the critical value jc, the energydensity transforms into a function with a minimum at Y 5 0 (panels 2 and 3).Simultaneously, the curvature in the radial direction decreases, leading to acharacteristic reduction of the excitation frequency for the Higgs mode. In thedisordered (Mott insulating) phase, two gapped modes exist, respectivelycorresponding to particle and hole excitations in our case (red and blue arrow inpanel 3). b, The Higgs mode can be excited with a periodic modulation of thecoupling j, which amounts to a ‘shaking’ of the classical energy densitypotential. In the experimental sequence, this is realized by a modulation of theoptical lattice potential (see main text for details). t 5 1/nmod; Er, lattice recoilenergy.
LETTER RESEARCH
2 6 J U L Y 2 0 1 2 | V O L 4 8 7 | N A T U R E | 4 5 5
Macmillan Publishers Limited. All rights reserved©2012
Particles and holes correspond
to the 2 normal modes in the
oscillation of about = 0.
S =
Zd2rdt
⇥|@t |2 � c2|rr |2 � V ( )
⇤
V ( ) = (�� �c)| |2 + u�| |2
�2
� ⇠ U/t
Thursday, January 30, 14

g
T
gc
0
InsulatorSuperfluid
Quantumcritical
TKT
�c
h i 6= 0 h i = 0
system with a recently developed scheme based on single-atom-resolved detection24. It is the high sensitivity of this method thatallowed us to reduce the modulation amplitude by almost an orderof magnitude compared with earlier experiments20,21 and to stay wellwithin the linear response regime (Supplementary Information).
The results for selected lattice depths V0 are shown in Fig. 2b. Weobserve a gapped response with an asymmetric overall shape that willbe analysed in the following paragraphs. Notably, the maximumobserved temperature after modulation is well below the ‘melting’temperature for a Mott insulator in the atomic limit25, Tmelt < 0.2U/kB
(kB, Boltzmann’s constant), demonstrating that our experiments probethe quantum gas in the degenerate regime. To obtain numerical valuesfor the onset of spectral response, we fitted each spectrum with an errorfunction centred at a frequency n0 (Fig. 2b, black lines). With japproaching jc, the shift of the gap to lower frequencies is alreadyvisible in the raw data (Fig. 2b) and becomes even more apparent forthe fitted gap n0 as a function of j/jc (Fig. 2a, filled circles). The n0 valuesare in quantitative agreement with a prediction for the Higgs gap nSF atcommensurate filling (solid line):
hnSF=U~ 3ffiffiffi2p
{4" #
1zj=jcð Þ$ %1=2
j=jc{1ð Þ1=2
Here h denotes Planck’s constant. This value is based on an analysis ofvariations around a mean-field state7,16 (throughout the manuscript,we have rescaled jc in the theoretical calculations to match the valuejc<0:06 obtained from quantum Monte Carlo simulations26).
The sharpness of the spectral onset can be quantified by the width ofthe fitted error function, which is shown as vertical dashed lines inFig. 2a. Approaching the critical point, the spectral onset becomessharper, and the width normalized to the centre frequency n0 remainsconstant (Supplementary Fig. 3). The constancy of this ratio indicatesthat the width of the spectral onset scales with the distance to thecritical point in the same way as the gap frequency.
We observe similar gapped responses in the Mott insulating regime(Supplementary Information and Fig. 5a), with the gap closing con-tinuously when approaching the critical point (Fig. 2a, open circles).We interpret this as a result of combined particle and hole excitationswith a frequency given by the Mott excitation gap that closes at thetransition point16. The fitted gaps are consistent with the Mott gap
hnMI=U~ 1z 12ffiffiffi2p
{17" #
j=jc$ %1=2
1{j=jcð Þ1=2
where nMI is the Mott gap as predicted by mean-field theory16 (Fig. 2a,dashed line).
The observed softening of the onset of spectral response in thesuperfluid regime has led to an identification of the experimentalsignal with a response from collective excitations of Higgs type. Togain further insight into the full in-trap response, we calculated theeigenspectrum of the system in a Gutzwiller approach16,22 (Methodsand Supplementary Information). The result is a series of discreteeigenfrequencies (Fig. 3a), and the corresponding eigenmodes showin-trap superfluid density distributions, which are reminiscent of thevibrational modes of a drum (Fig. 3b). The frequency of the lowest-lying amplitude-like eigenmode n0,G closely follows the long-wave-length prediction for homogeneous commensurate filling nSF over awide range of couplings j/jc until the response rounds off in the vicinityof the critical point due to the finite size of the system (Fig. 3c). Fittingthe low-frequency edge of the experimental data can be interpreted asextracting the frequency of this mode, which explains the goodquantitative agreement with the prediction for the homogeneous com-mensurate filling in Fig. 2a. Modes at different frequencies from thelowest-lying amplitude-like mode broaden the spectrum only abovethe onset of spectral response.
An eigenmode analysis, however, does not yield any informationabout the finite spectral width of the modes, which stems from theinteraction between amplitude and phase excitations. We will considerthe question of the spectral width by analysing the low-, intermediate-and high-frequency parts of the response separately. We begin byexamining the low-frequency part of the response, which is expectedto be governed by a process coupling a virtually excited amplitudemode to a pair of phase modes with opposite momenta. As a result,the response of a strongly interacting, two-dimensional superfluid is
a1
2
V
Re( )Im( )
Higgs modeNambu–
Goldstonemode
j/jc 1
0 100 200 300 4000
5
10
15
20
Time (ms)
Lat
tice
dept
h (E
r)
Lattice loading Modulation Hold time Ramp to atomic limit
Temperaturemeasurement
V0
Ttot = 200 ms
A = 0.03V0
Tmod = 20WW
b
3
j/jc * 1
j/jc , 1
ΨΨ
Figure 1 | Illustration of the Higgs mode and experimental sequence.a, Classical energy density V as a function of the order parameter Y. Within theordered (superfluid) phase, Nambu–Goldstone and Higgs modes arise fromphase and amplitude modulations (blue and red arrows in panel 1). As thecoupling j 5 J/U (see main text) approaches the critical value jc, the energydensity transforms into a function with a minimum at Y 5 0 (panels 2 and 3).Simultaneously, the curvature in the radial direction decreases, leading to acharacteristic reduction of the excitation frequency for the Higgs mode. In thedisordered (Mott insulating) phase, two gapped modes exist, respectivelycorresponding to particle and hole excitations in our case (red and blue arrow inpanel 3). b, The Higgs mode can be excited with a periodic modulation of thecoupling j, which amounts to a ‘shaking’ of the classical energy densitypotential. In the experimental sequence, this is realized by a modulation of theoptical lattice potential (see main text for details). t 5 1/nmod; Er, lattice recoilenergy.
LETTER RESEARCH
2 6 J U L Y 2 0 1 2 | V O L 4 8 7 | N A T U R E | 4 5 5
Macmillan Publishers Limited. All rights reserved©2012
S =
Zd2rdt
⇥|@t |2 � c2|rr |2 � V ( )
⇤
V ( ) = (�� �c)| |2 + u�| |2
�2
� ⇠ U/t
Thursday, January 30, 14
expected to diverge at low frequencies, if the probe in use coupleslongitudinally to the order parameter2,4,5,9 (for example to the real partof Y, if the equilibrium value of Y was chosen along the real axis), as isthe case for neutron scattering. If, instead, the coupling is rotationallyinvariant (for example through coupling to jYj2), as expected forlattice modulation, such a divergence could be avoided and the
response is expected to scale as n3 at low frequencies3,6,9,17.Combining this result with the scaling dimensions of the responsefunction for a rotationally symmetric perturbation coupling to jYj2,we expect the low-frequency response to be proportional to(1 2 j/jc)
22n3 (ref. 9 and Methods). The experimentally observed sig-nal is consistent with this scaling at the ‘base’ of the absorption feature(Fig. 4). This indicates that the low-frequency part is dominated byonly a few in-trap eigenmodes, which approximately show the genericscaling of the homogeneous system for a response function describingcoupling to jYj2.
In the intermediate-frequency regime, it remains a challenge toconstruct a first-principles analytical treatment of the in-trap systemincluding all relevant decay and coupling processes. Lacking such atheory, we constructed a heuristic model combining the discrete spec-trum from the Gutzwiller approach (Fig. 3a) with the line shape for ahomogeneous system based on an O(N) field theory in two dimen-sions, calculated in the large-N limit3,6 (Methods). An implicit assump-tion of this approach is a continuum of phase modes, which is
Sup
erflu
id d
ensi
ty
0.1
0.3
0.5
0.7
a
b1
0 0.5 1 1.5 2
0
0.02
0.04
d
0 0.5 0.6 0.7 0.8 0.9 1 1.1
Q0,G
0
0.5
1
Line
str
engt
h (a
.u.)
hQmod/U
hQ/U
j/jc
c
1 1.5 2 2.50
0.4
0.8
1.2V0 = 9.5Erj/jc = 1.4
k BΔT
/U, Δ
E/U
Q0,G
2
2
1
3
3
4
4
hQmod/U
Figure 3 | Theory of in-trap response. a, A diagonalization of the trappedsystem in a Gutzwiller approximation shows a discrete spectrum of amplitude-like eigenmodes. Shown on the vertical axis is the strength of the response to amodulation of j. Eigenmodes of phase type are not shown (Methods) and n0,G
denotes the gap as calculated in the Gutzwiller approximation. a.u., arbitraryunits. b, In-trap superfluid density distribution for the four amplitude modeswith the lowest frequencies, as labelled in a. In contrast to the superfluiddensity, the total density of the system stays almost constant (not shown).c, Discrete amplitude mode spectrum for various couplings j/jc. Each red circlecorresponds to a single eigenmode, with the intensity of the colour beingproportional to the line strength. The gap frequency of the lowest-lying modefollows the prediction for commensurate filling (solid line; same as in Fig. 2a)until a rounding off takes place close to the critical point due to the finite size ofthe system. d, Comparison of the experimental response at V0 5 9.5Er (bluecircles and connecting blue line; error bars, s.e.m.) with a 2 3 2 cluster mean-field simulation (grey line and shaded area) and a heuristic model (dashed line;for details see text and Methods). The simulation was done for V0 5 9.5Er (greyline) and for V0 5 (1 6 0.02) 3 9.5Er (shaded grey area), to account for theexperimental uncertainty in the lattice depth, and predicts the energyabsorption per particle DE.
0 0.2 0.4 0.6 0.8 1
0
0.01
0.02
0.03
Qmod/U
(1 –
j/j c)
2 kBΔT
/U
0 0.2 0.4 0.6 0.8 1
0
0.01
0.02
0.03
Qmod/U
k BΔT
/U
Figure 4 | Scaling of the low-frequency response. The low-frequencyresponse in the superfluid regime shows a scaling compatible with theprediction (1 2 j/jc)
22n3 (Methods). Shown is the temperature responserescaled with (1 2 j/jc)
2 for V0 5 10Er (grey), 9.5Er (black), 9Er (green), 8.5Er
(blue) and 8Er (red) as a function of the modulation frequency. The black line isa fit of the form anb with a fitted exponent b 5 2.9(5). The inset shows the samedata points without rescaling, for comparison. Error bars, s.e.m.
hQ0/U
j/jc
0 0.5 1 1.5 2 2.50
0.2
0.4
0.6
0.8
1
1.20 0.03 0.06 0.09 0.12 0.15
j
SuperfluidMott Insulator
a b
3
1
2
V0 = 8Erj/jc = 2.2
k BT/U
1
2
3
V0 = 9Erj/jc = 1.6
V0 = 10Erj/jc = 1.2
Q0
0.11
0.13
0.15
0.17
0.12
0.14
0.16
0.18
0 400 8000.12
0.14
0.16
0.18
Qmod (Hz)
Q0
Q0
Figure 2 | Softening of the Higgs mode. a, The fitted gap values hn0/U(circles) show a characteristic softening close to the critical point in quantitativeagreement with analytic predictions for the Higgs and the Mott gap (solid lineand dashed line, respectively; see text). Horizontal and vertical error barsdenote the experimental uncertainty of the lattice depths and the fit error for thecentre frequency of the error function, respectively (Methods). Vertical dashedlines denote the widths of the fitted error function and characterize thesharpness of the spectral onset. The blue shading highlights the superfluid
region. b, Temperature response to lattice modulation (circles and connectingblue line) and fit with an error function (solid black line) for the three differentpoints labelled in a. As the coupling j approaches the critical value jc, the changein the gap values to lower frequencies is clearly visible (from panel 1 to panel 3).Vertical dashed lines mark the frequency U/h corresponding to the on-siteinteraction. Each data point results from an average of the temperatures over,50 experimental runs. Error bars, s.e.m.
RESEARCH LETTER
4 5 6 | N A T U R E | V O L 4 8 7 | 2 6 J U L Y 2 0 1 2
Macmillan Publishers Limited. All rights reserved©2012
system with a recently developed scheme based on single-atom-resolved detection24. It is the high sensitivity of this method thatallowed us to reduce the modulation amplitude by almost an orderof magnitude compared with earlier experiments20,21 and to stay wellwithin the linear response regime (Supplementary Information).
The results for selected lattice depths V0 are shown in Fig. 2b. Weobserve a gapped response with an asymmetric overall shape that willbe analysed in the following paragraphs. Notably, the maximumobserved temperature after modulation is well below the ‘melting’temperature for a Mott insulator in the atomic limit25, Tmelt < 0.2U/kB
(kB, Boltzmann’s constant), demonstrating that our experiments probethe quantum gas in the degenerate regime. To obtain numerical valuesfor the onset of spectral response, we fitted each spectrum with an errorfunction centred at a frequency n0 (Fig. 2b, black lines). With japproaching jc, the shift of the gap to lower frequencies is alreadyvisible in the raw data (Fig. 2b) and becomes even more apparent forthe fitted gap n0 as a function of j/jc (Fig. 2a, filled circles). The n0 valuesare in quantitative agreement with a prediction for the Higgs gap nSF atcommensurate filling (solid line):
hnSF=U~ 3ffiffiffi2p
{4" #
1zj=jcð Þ$ %1=2
j=jc{1ð Þ1=2
Here h denotes Planck’s constant. This value is based on an analysis ofvariations around a mean-field state7,16 (throughout the manuscript,we have rescaled jc in the theoretical calculations to match the valuejc<0:06 obtained from quantum Monte Carlo simulations26).
The sharpness of the spectral onset can be quantified by the width ofthe fitted error function, which is shown as vertical dashed lines inFig. 2a. Approaching the critical point, the spectral onset becomessharper, and the width normalized to the centre frequency n0 remainsconstant (Supplementary Fig. 3). The constancy of this ratio indicatesthat the width of the spectral onset scales with the distance to thecritical point in the same way as the gap frequency.
We observe similar gapped responses in the Mott insulating regime(Supplementary Information and Fig. 5a), with the gap closing con-tinuously when approaching the critical point (Fig. 2a, open circles).We interpret this as a result of combined particle and hole excitationswith a frequency given by the Mott excitation gap that closes at thetransition point16. The fitted gaps are consistent with the Mott gap
hnMI=U~ 1z 12ffiffiffi2p
{17" #
j=jc$ %1=2
1{j=jcð Þ1=2
where nMI is the Mott gap as predicted by mean-field theory16 (Fig. 2a,dashed line).
The observed softening of the onset of spectral response in thesuperfluid regime has led to an identification of the experimentalsignal with a response from collective excitations of Higgs type. Togain further insight into the full in-trap response, we calculated theeigenspectrum of the system in a Gutzwiller approach16,22 (Methodsand Supplementary Information). The result is a series of discreteeigenfrequencies (Fig. 3a), and the corresponding eigenmodes showin-trap superfluid density distributions, which are reminiscent of thevibrational modes of a drum (Fig. 3b). The frequency of the lowest-lying amplitude-like eigenmode n0,G closely follows the long-wave-length prediction for homogeneous commensurate filling nSF over awide range of couplings j/jc until the response rounds off in the vicinityof the critical point due to the finite size of the system (Fig. 3c). Fittingthe low-frequency edge of the experimental data can be interpreted asextracting the frequency of this mode, which explains the goodquantitative agreement with the prediction for the homogeneous com-mensurate filling in Fig. 2a. Modes at different frequencies from thelowest-lying amplitude-like mode broaden the spectrum only abovethe onset of spectral response.
An eigenmode analysis, however, does not yield any informationabout the finite spectral width of the modes, which stems from theinteraction between amplitude and phase excitations. We will considerthe question of the spectral width by analysing the low-, intermediate-and high-frequency parts of the response separately. We begin byexamining the low-frequency part of the response, which is expectedto be governed by a process coupling a virtually excited amplitudemode to a pair of phase modes with opposite momenta. As a result,the response of a strongly interacting, two-dimensional superfluid is
a1
2
V
Re( )Im( )
Higgs modeNambu–
Goldstonemode
j/jc 1
0 100 200 300 4000
5
10
15
20
Time (ms)
Lat
tice
dept
h (E
r)
Lattice loading Modulation Hold time Ramp to atomic limit
Temperaturemeasurement
V0
Ttot = 200 ms
A = 0.03V0
Tmod = 20WW
b
3
j/jc * 1
j/jc , 1
ΨΨ
Figure 1 | Illustration of the Higgs mode and experimental sequence.a, Classical energy density V as a function of the order parameter Y. Within theordered (superfluid) phase, Nambu–Goldstone and Higgs modes arise fromphase and amplitude modulations (blue and red arrows in panel 1). As thecoupling j 5 J/U (see main text) approaches the critical value jc, the energydensity transforms into a function with a minimum at Y 5 0 (panels 2 and 3).Simultaneously, the curvature in the radial direction decreases, leading to acharacteristic reduction of the excitation frequency for the Higgs mode. In thedisordered (Mott insulating) phase, two gapped modes exist, respectivelycorresponding to particle and hole excitations in our case (red and blue arrow inpanel 3). b, The Higgs mode can be excited with a periodic modulation of thecoupling j, which amounts to a ‘shaking’ of the classical energy densitypotential. In the experimental sequence, this is realized by a modulation of theoptical lattice potential (see main text for details). t 5 1/nmod; Er, lattice recoilenergy.
LETTER RESEARCH
2 6 J U L Y 2 0 1 2 | V O L 4 8 7 | N A T U R E | 4 5 5
Macmillan Publishers Limited. All rights reserved©2012
Observation of Higgs quasi-normal mode across the superfluid-insulator transition of ultracold atoms in a 2-dimensional optical lattice:Response to modulation of lattice depth scales as expected from the LHP pole
Manuel Endres, Takeshi Fukuhara, David Pekker, Marc Cheneau, Peter Schaub, Christian Gross, Eugene Demler, Stefan Kuhr, and Immanuel Bloch, Nature 487, 454 (2012).
Thursday, January 30, 14
g
T
gc
0
InsulatorSuperfluid
Quantumcritical
TKT
�c
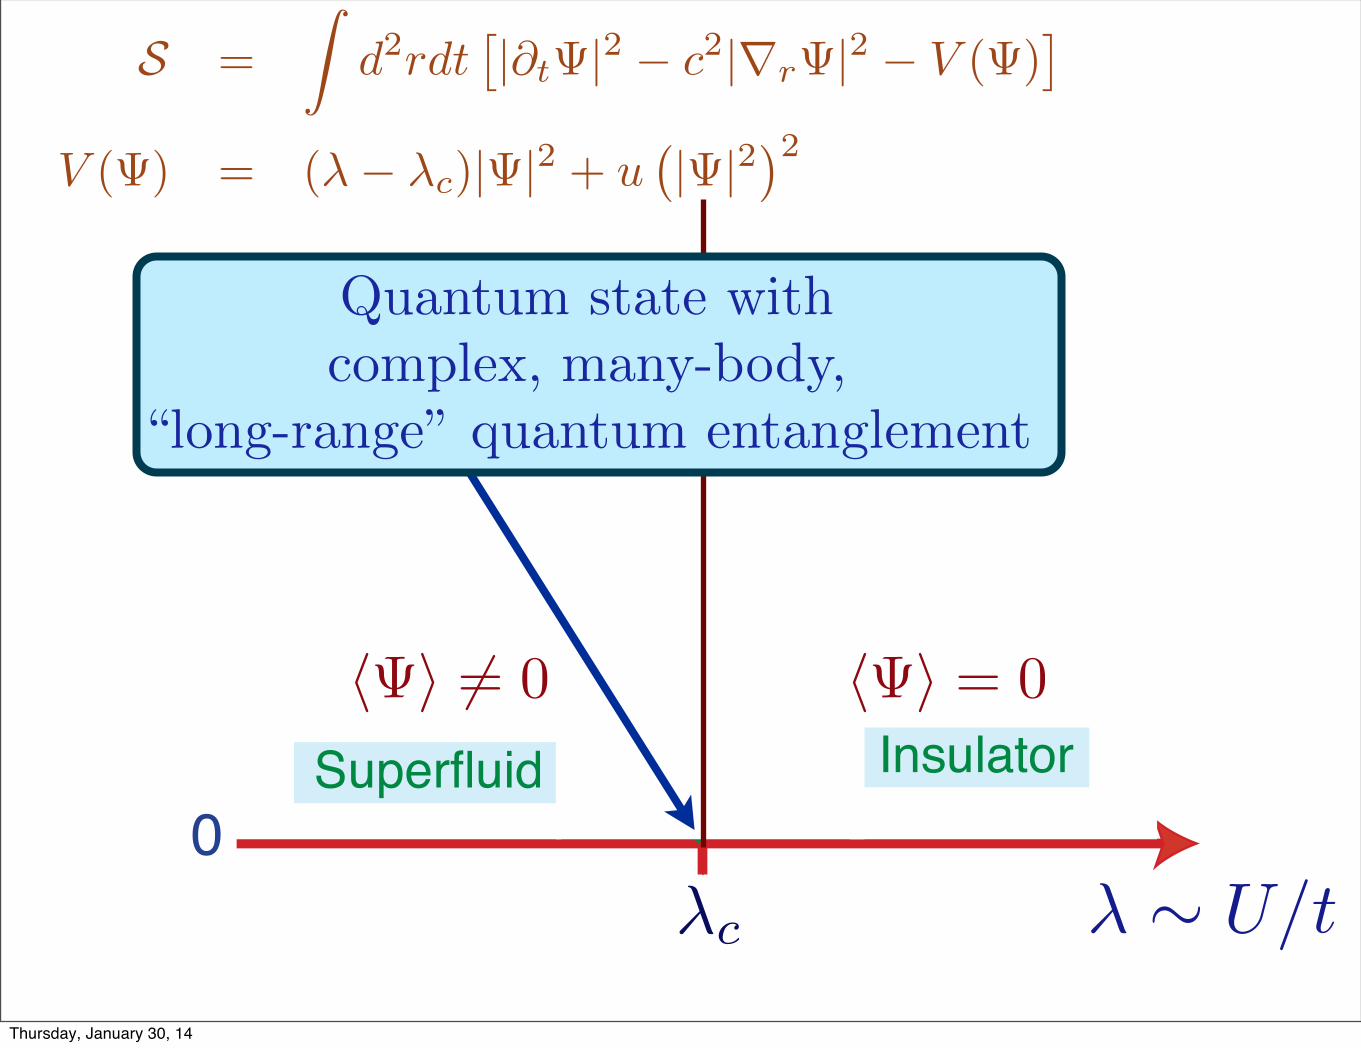
Quantum state with
complex, many-body,
“long-range” quantum entanglement
h i 6= 0 h i = 0
S =
Zd2rdt
⇥|@t |2 � c2|rr |2 � V ( )
⇤
V ( ) = (�� �c)| |2 + u�| |2
�2
� ⇠ U/t
Thursday, January 30, 14
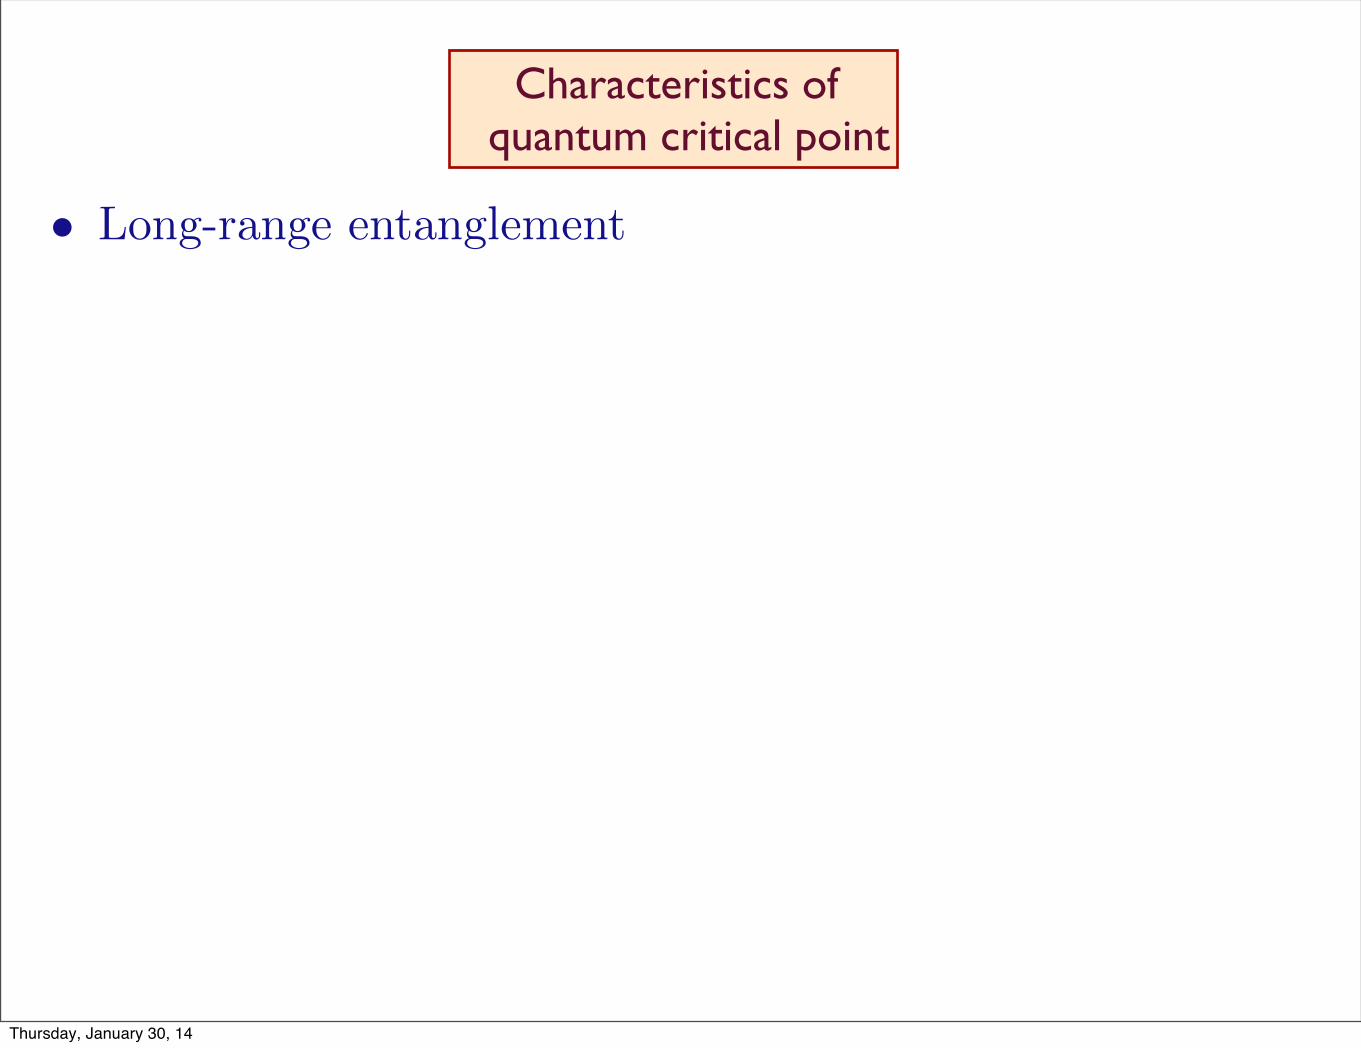
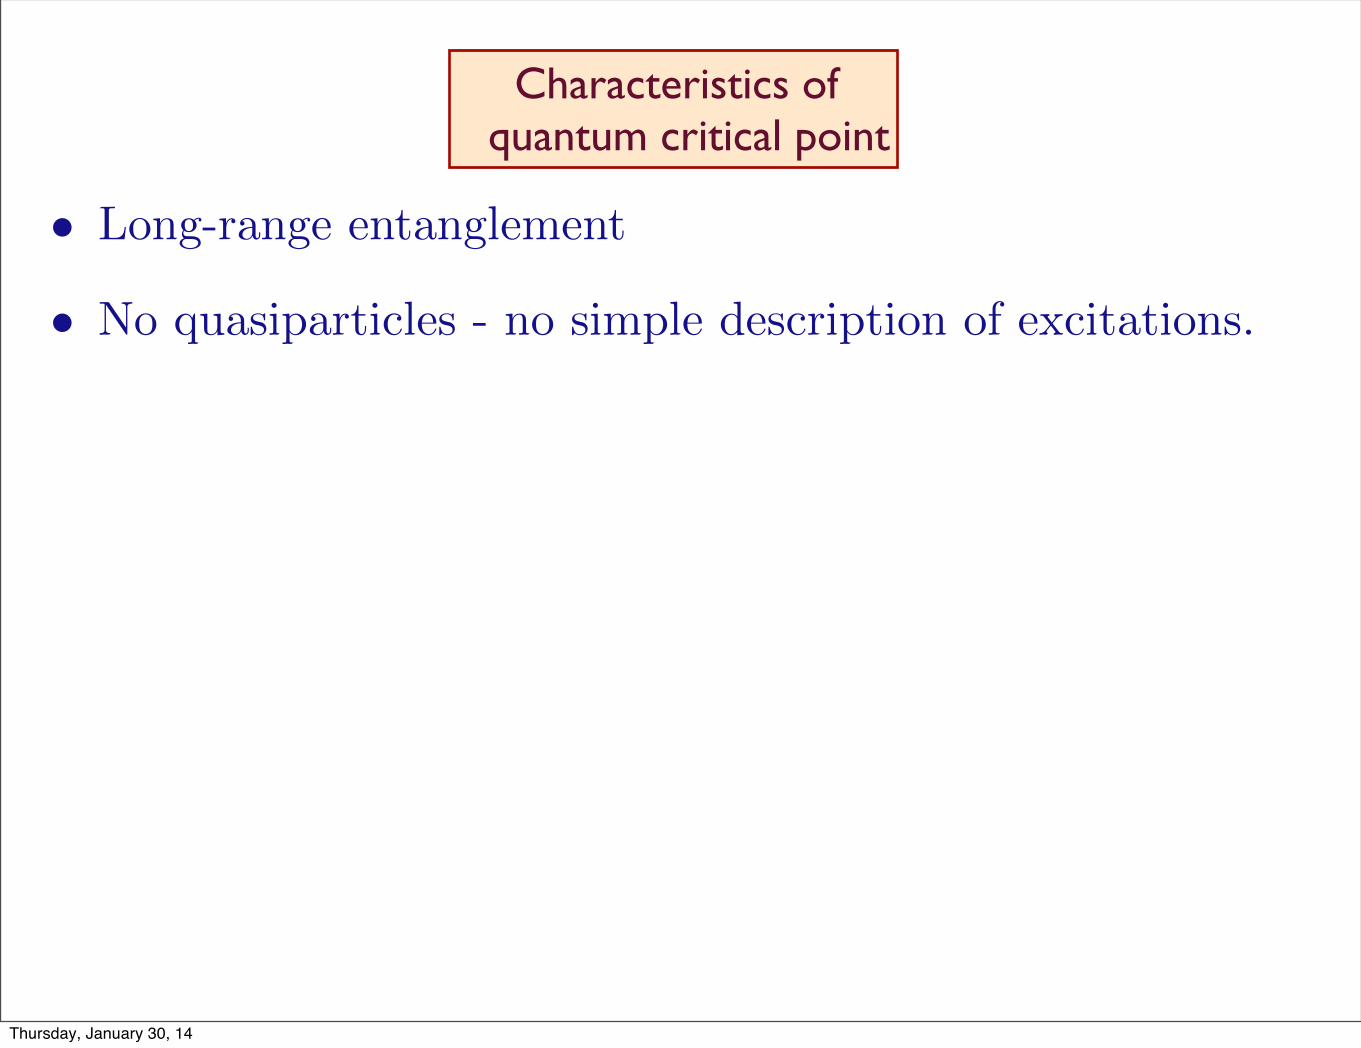
• Long-range entanglement
• No quasiparticles - no simple description of excitations.
• The low energy excitations are described by a theory
which has the same structure as Einstein’s theory of spe-
cial relativity, but with the spin-wave velocity playing the
role of the velocity of light.
• The theory of the critical point is strongly-coupled be-
cause the quartic-coupling u flows to a renormalization
group fixed point (the Wilson-Fisher fixed point). This
fixed point has an even larger symmetry corresponding
to conformal transformations of spacetime: we refer to
such a theory as a CFT3
Characteristics of quantum critical point
Thursday, January 30, 14
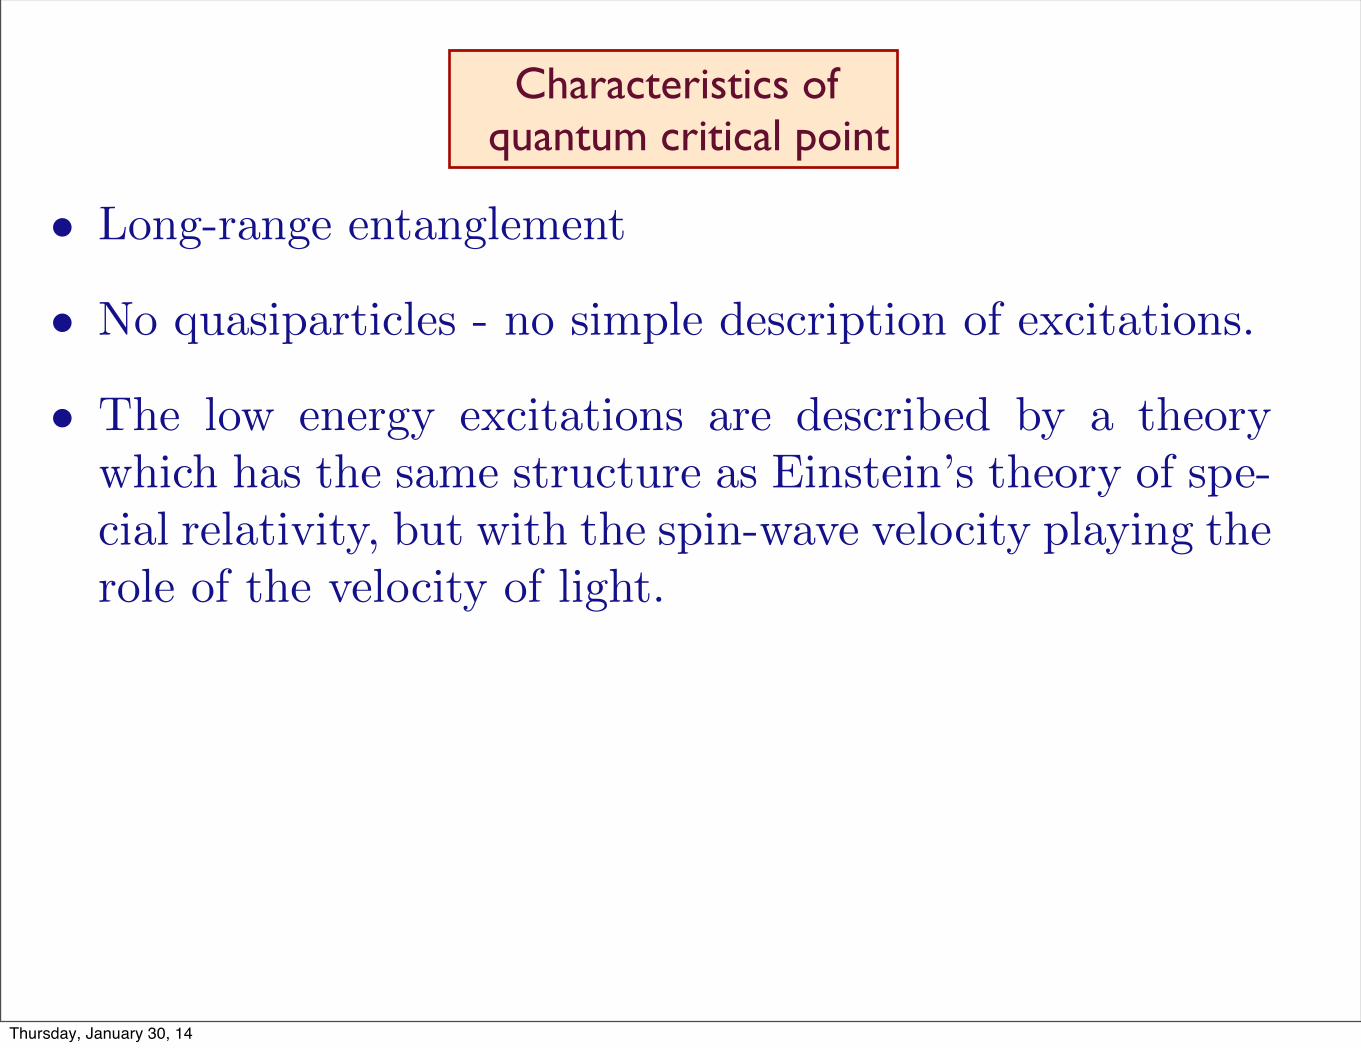

g
T
gc
0
InsulatorSuperfluid
Quantumcritical
TKT
�c
A conformal field theory
in 2+1 spacetime dimensions:
a CFT3
h i 6= 0 h i = 0
S =
Zd2rdt
⇥|@t |2 � c2|rr |2 � V ( )
⇤
V ( ) = (�� �c)| |2 + u�| |2
�2
� ⇠ U/t
Thursday, January 30, 14

g
T
gc
0
InsulatorSuperfluid
Quantumcritical
TKT
�c � ⇠ U/t
Thursday, January 30, 14
g
T
gc
0
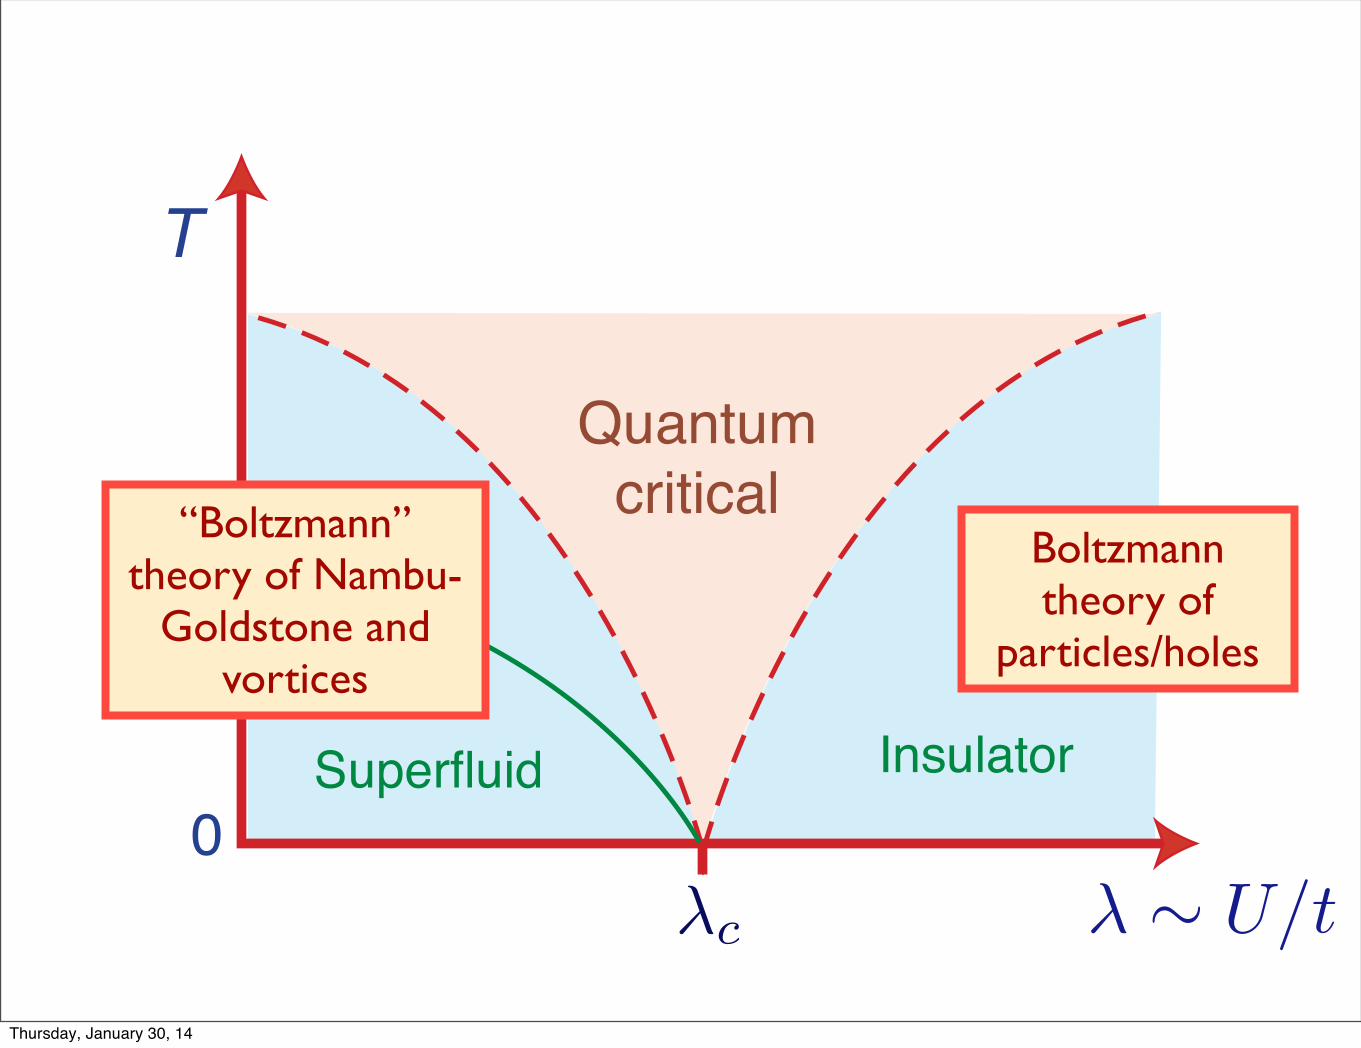
InsulatorSuperfluid
Quantumcritical
TKT
�c
“Boltzmann” theory of Nambu-
Goldstone and vortices
Boltzmann theory of
particles/holes
� ⇠ U/t
Thursday, January 30, 14

g
T
gc
0
InsulatorSuperfluid
Quantumcritical
TKT
�c
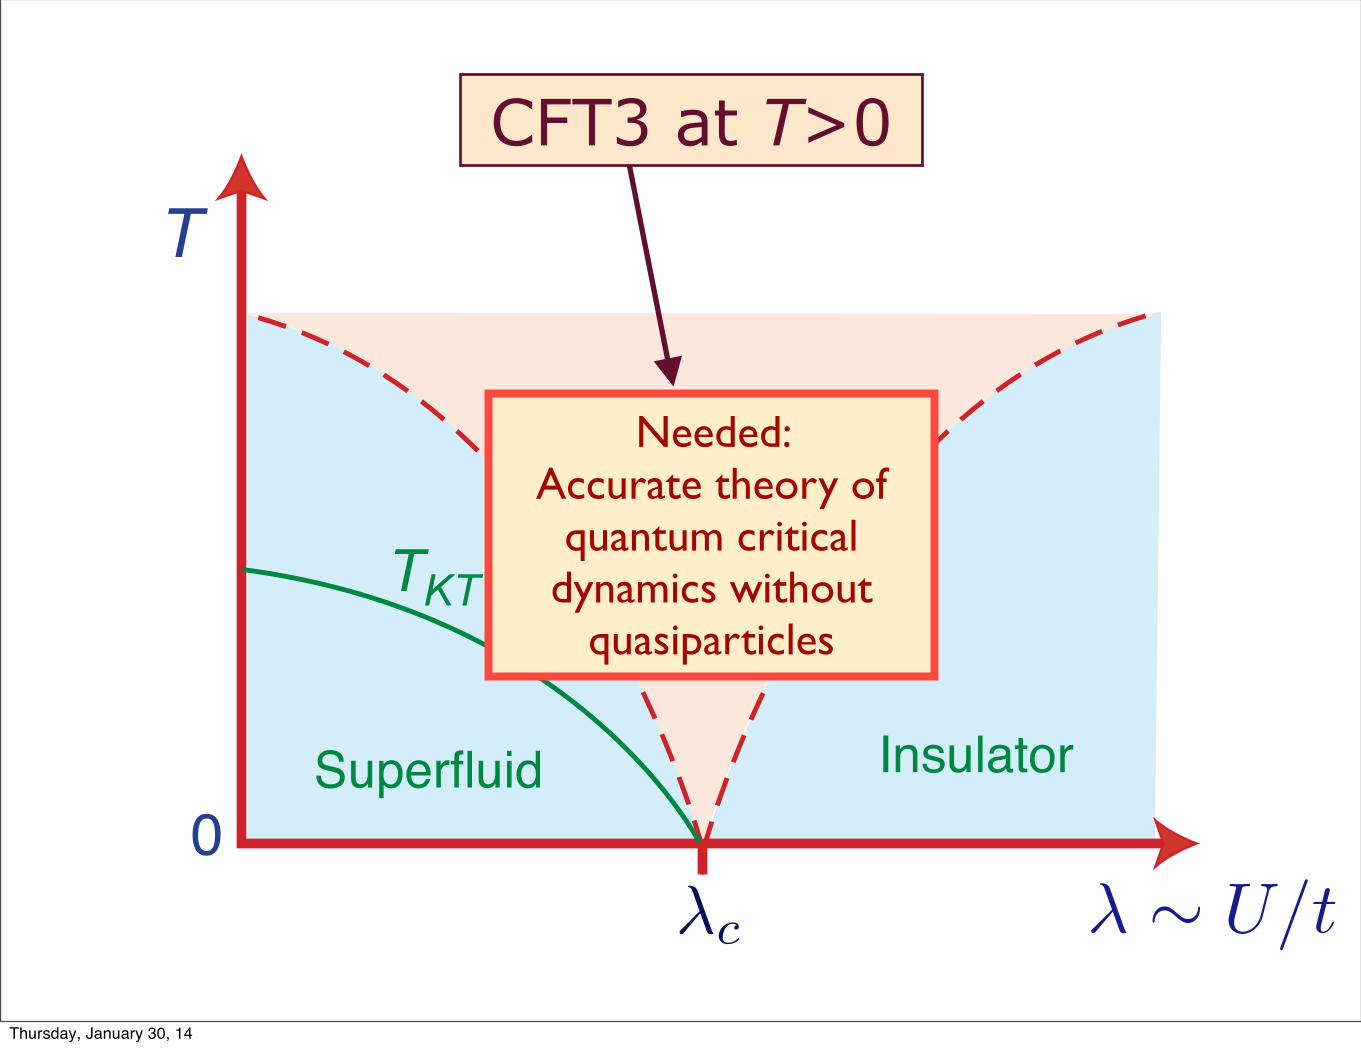
CFT3 at T>0
� ⇠ U/t
Thursday, January 30, 14
g
T
gc
0
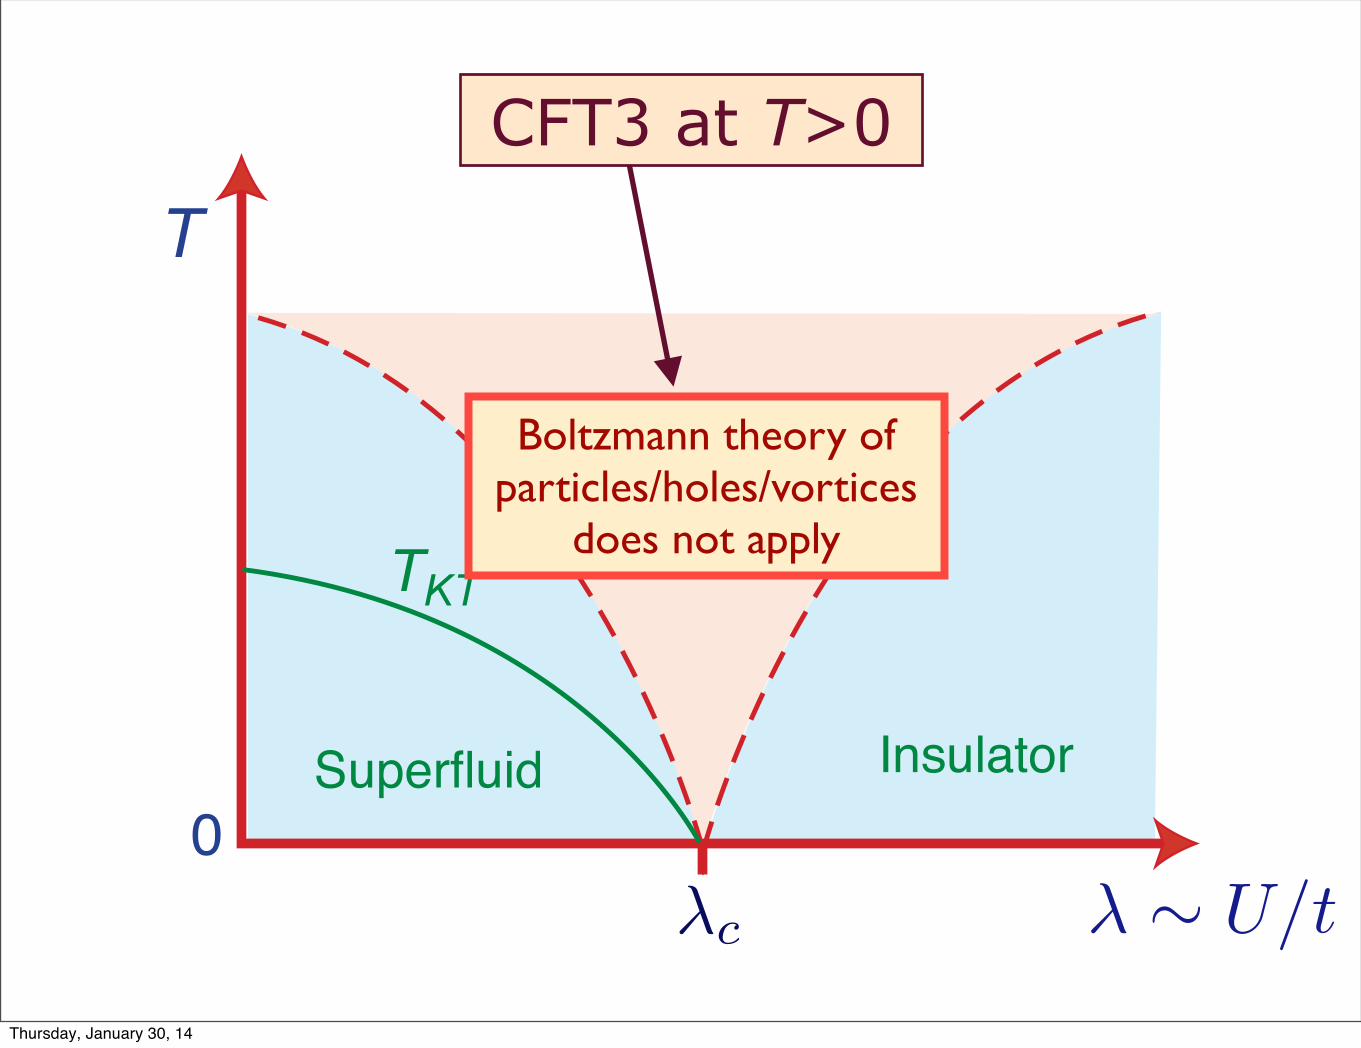
InsulatorSuperfluid
Quantumcritical
TKT
�c
CFT3 at T>0
Boltzmann theory of particles/holes/vortices
does not apply
� ⇠ U/t
Thursday, January 30, 14
g
T
gc
0
InsulatorSuperfluid
Quantumcritical
TKT
�c
CFT3 at T>0
Needed: Accurate theory of
quantum critical dynamics without
quasiparticles
� ⇠ U/t
Thursday, January 30, 14
�/T
�
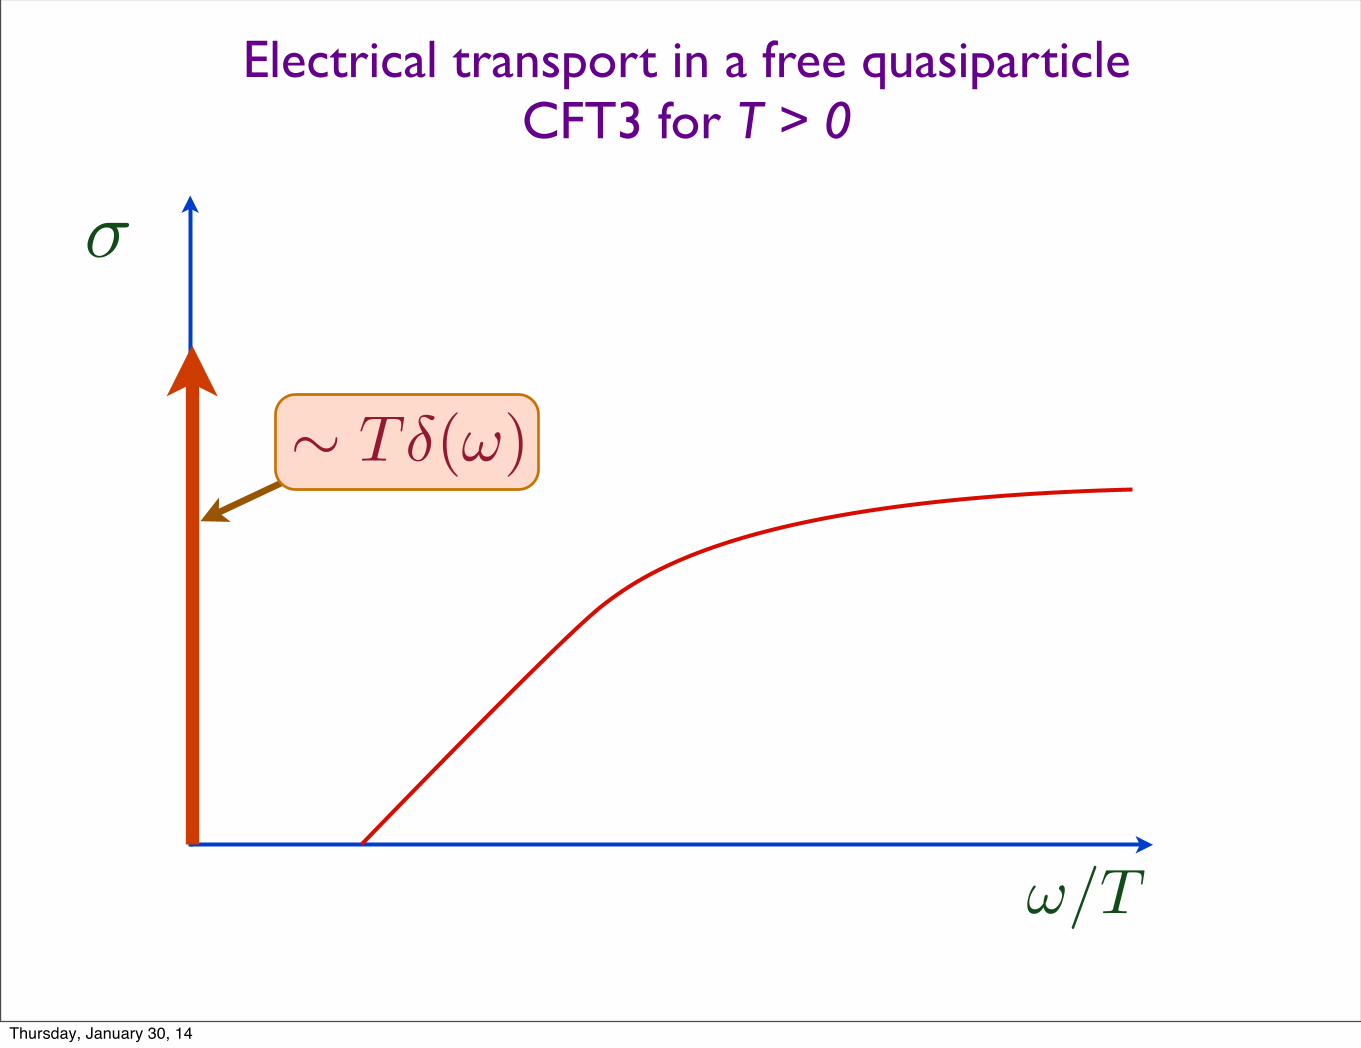
Electrical transport in a free quasiparticle CFT3 for T > 0
⇠ T �(!)
Thursday, January 30, 14
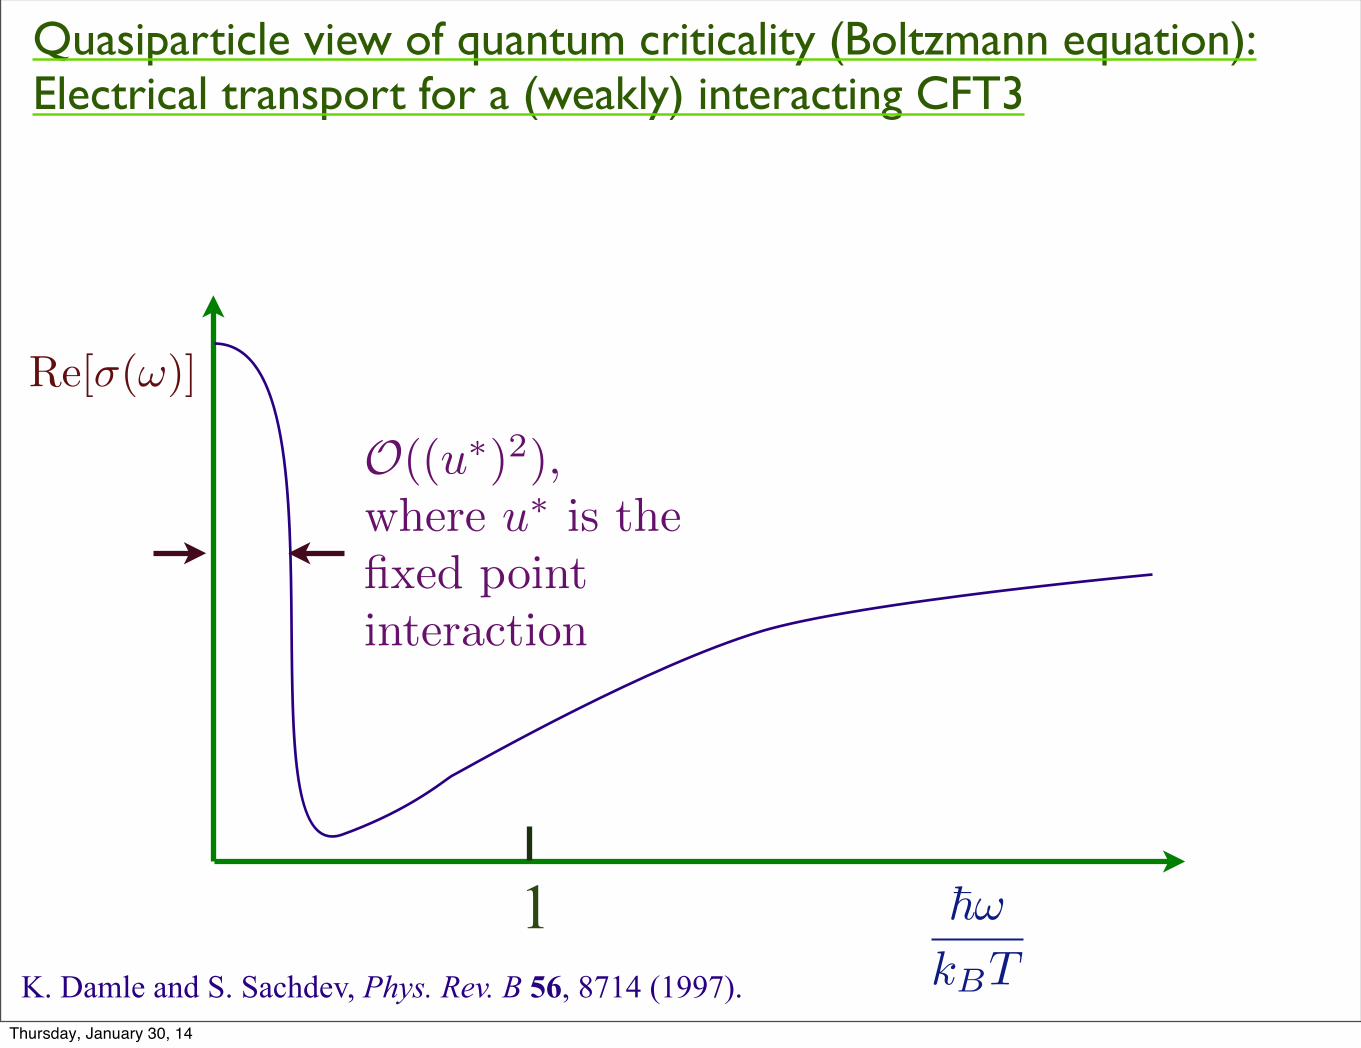
Quasiparticle view of quantum criticality (Boltzmann equation):Electrical transport for a (weakly) interacting CFT3
K. Damle and S. Sachdev, Phys. Rev. B 56, 8714 (1997).
~!kBT
1
Re[�(!)]
O((u⇤)
2),
where u⇤is the
fixed point
interaction
Thursday, January 30, 14

K. Damle and S. Sachdev, Phys. Rev. B 56, 8714 (1997).
~!kBT
1
Re[�(!)]
O((u⇤)
2),
where u⇤is the
fixed point
interaction
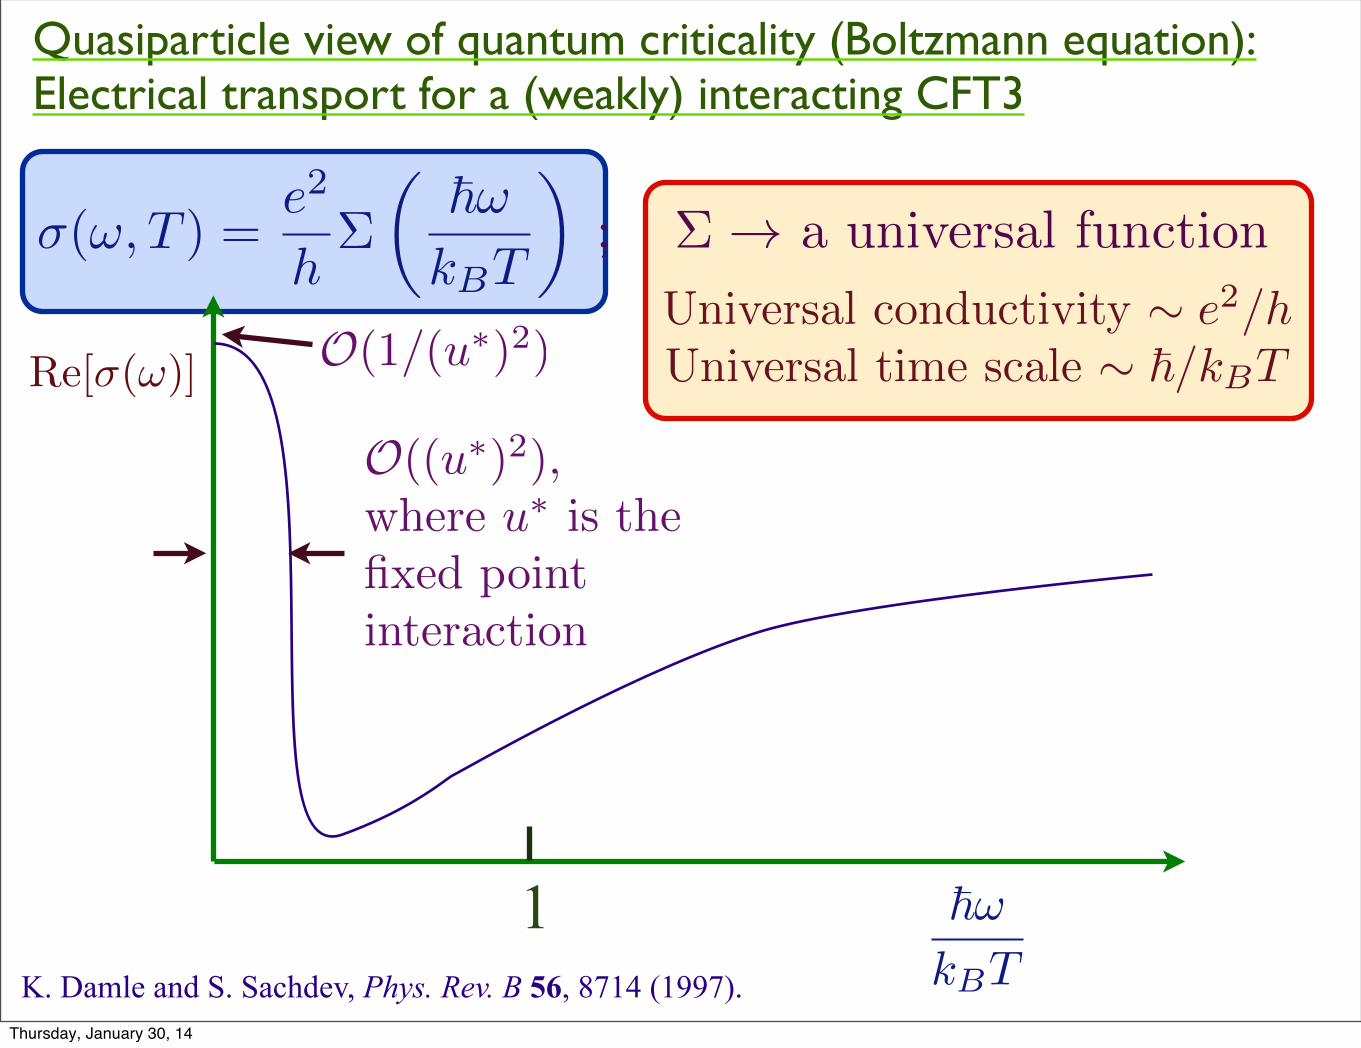
O(1/(u⇤)2)
Quasiparticle view of quantum criticality (Boltzmann equation):Electrical transport for a (weakly) interacting CFT3
Thursday, January 30, 14
K. Damle and S. Sachdev, Phys. Rev. B 56, 8714 (1997).
~!kBT
1
Re[�(!)]
�(!, T ) =e2
h⌃
✓~!kBT
◆
O((u⇤)
2),
where u⇤is the
fixed point
interaction
O(1/(u⇤)2)
; ⌃ ! a universal function
Universal conductivity ⇠ e2/hUniversal time scale ⇠ ~/kBT
Quasiparticle view of quantum criticality (Boltzmann equation):Electrical transport for a (weakly) interacting CFT3
Thursday, January 30, 14
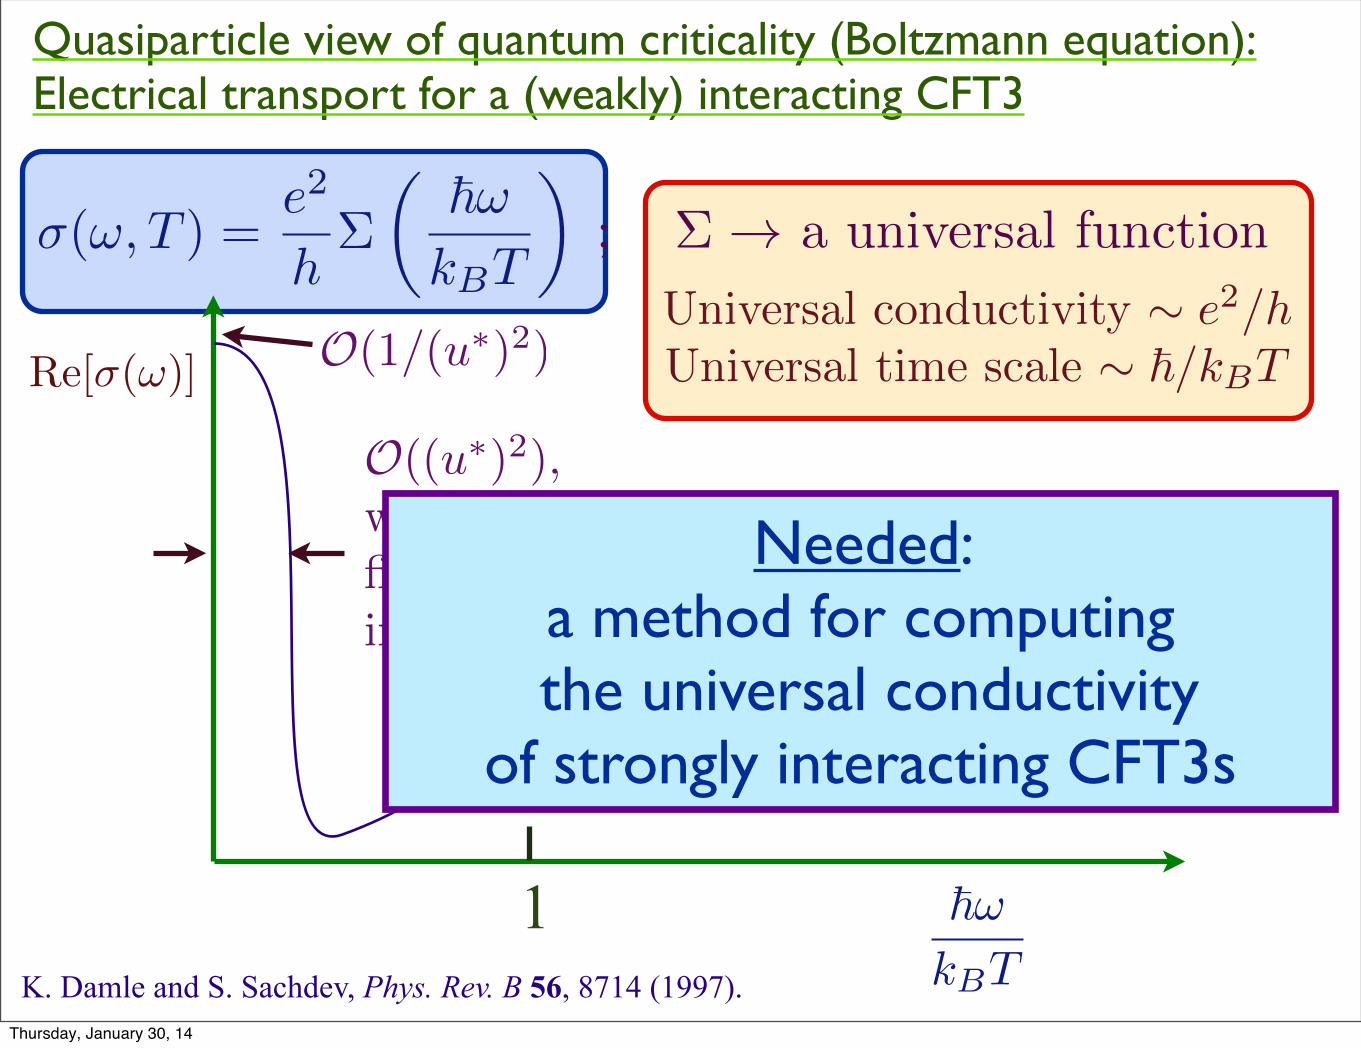
K. Damle and S. Sachdev, Phys. Rev. B 56, 8714 (1997).
~!kBT
1
Re[�(!)]
�(!, T ) =e2
h⌃
✓~!kBT
◆
O((u⇤)
2),
where u⇤is the
fixed point
interaction
O(1/(u⇤)2)
; ⌃ ! a universal function
Universal conductivity ⇠ e2/hUniversal time scale ⇠ ~/kBT
Needed: a method for computing
the universal conductivity of strongly interacting CFT3s
Quasiparticle view of quantum criticality (Boltzmann equation):Electrical transport for a (weakly) interacting CFT3
Thursday, January 30, 14