Embed Size (px)
Citation preview
RAPID COMMUNICATIONS
PHYSICAL REVIEW E 84, 020902(R) (2011)
Theory of cooperation in a micro-organismal snowdrift game
Zhenyu Wang and Nigel GoldenfeldDepartment of Physics, Center for the Physics of Living Cells and Institute for Genomic Biology, University of Illinois at Urbana-Champaign,
Loomis Laboratory of Physics, 1110 West Green Street, Urbana, Illinois 61801, USA(Received 1 November 2010; revised manuscript received 3 June 2011; published 26 August 2011)
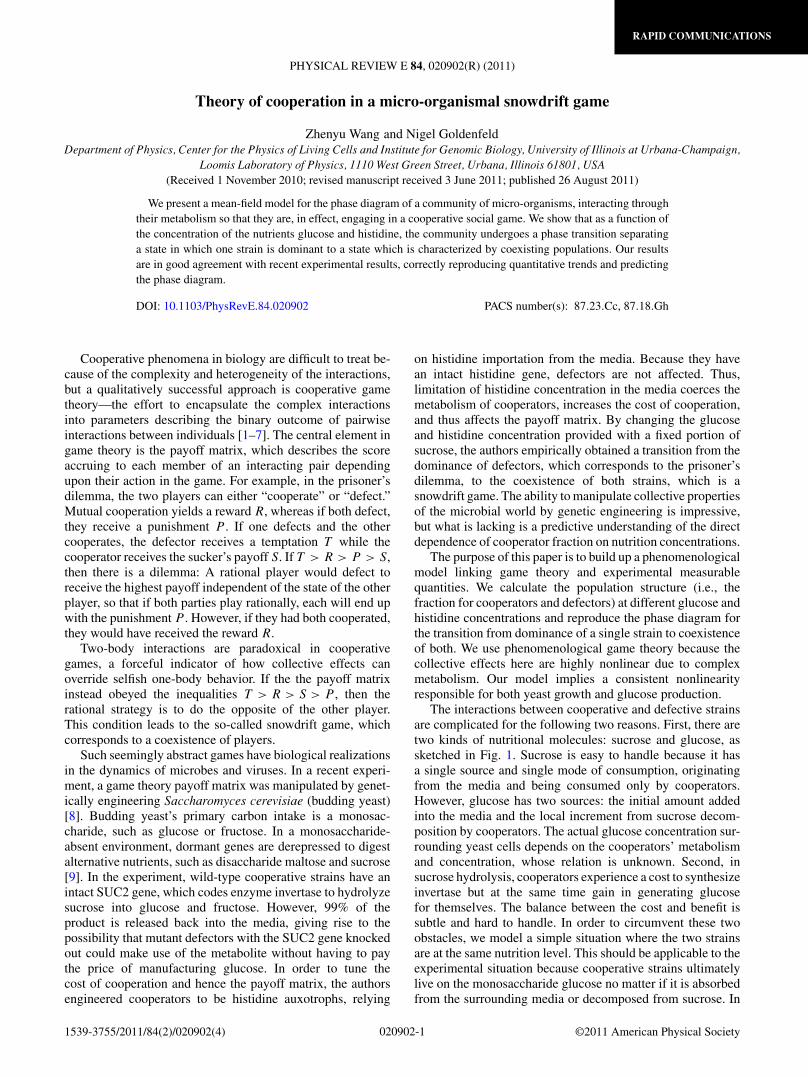
We present a mean-field model for the phase diagram of a community of micro-organisms, interacting throughtheir metabolism so that they are, in effect, engaging in a cooperative social game. We show that as a function ofthe concentration of the nutrients glucose and histidine, the community undergoes a phase transition separatinga state in which one strain is dominant to a state which is characterized by coexisting populations. Our resultsare in good agreement with recent experimental results, correctly reproducing quantitative trends and predictingthe phase diagram.
DOI: 10.1103/PhysRevE.84.020902 PACS number(s): 87.23.Cc, 87.18.Gh
Cooperative phenomena in biology are difficult to treat be-cause of the complexity and heterogeneity of the interactions,but a qualitatively successful approach is cooperative gametheory—the effort to encapsulate the complex interactionsinto parameters describing the binary outcome of pairwiseinteractions between individuals [1–7]. The central element ingame theory is the payoff matrix, which describes the scoreaccruing to each member of an interacting pair dependingupon their action in the game. For example, in the prisoner’sdilemma, the two players can either “cooperate” or “defect.”Mutual cooperation yields a reward R, whereas if both defect,they receive a punishment P . If one defects and the othercooperates, the defector receives a temptation T while thecooperator receives the sucker’s payoff S. If T > R > P > S,then there is a dilemma: A rational player would defect toreceive the highest payoff independent of the state of the otherplayer, so that if both parties play rationally, each will end upwith the punishment P . However, if they had both cooperated,they would have received the reward R.
Two-body interactions are paradoxical in cooperativegames, a forceful indicator of how collective effects canoverride selfish one-body behavior. If the the payoff matrixinstead obeyed the inequalities T > R > S > P , then therational strategy is to do the opposite of the other player.This condition leads to the so-called snowdrift game, whichcorresponds to a coexistence of players.
Such seemingly abstract games have biological realizationsin the dynamics of microbes and viruses. In a recent experi-ment, a game theory payoff matrix was manipulated by genet-ically engineering Saccharomyces cerevisiae (budding yeast)[8]. Budding yeast’s primary carbon intake is a monosac-charide, such as glucose or fructose. In a monosaccharide-absent environment, dormant genes are derepressed to digestalternative nutrients, such as disaccharide maltose and sucrose[9]. In the experiment, wild-type cooperative strains have anintact SUC2 gene, which codes enzyme invertase to hydrolyzesucrose into glucose and fructose. However, 99% of theproduct is released back into the media, giving rise to thepossibility that mutant defectors with the SUC2 gene knockedout could make use of the metabolite without having to paythe price of manufacturing glucose. In order to tune thecost of cooperation and hence the payoff matrix, the authorsengineered cooperators to be histidine auxotrophs, relying
on histidine importation from the media. Because they havean intact histidine gene, defectors are not affected. Thus,limitation of histidine concentration in the media coerces themetabolism of cooperators, increases the cost of cooperation,and thus affects the payoff matrix. By changing the glucoseand histidine concentration provided with a fixed portion ofsucrose, the authors empirically obtained a transition from thedominance of defectors, which corresponds to the prisoner’sdilemma, to the coexistence of both strains, which is asnowdrift game. The ability to manipulate collective propertiesof the microbial world by genetic engineering is impressive,but what is lacking is a predictive understanding of the directdependence of cooperator fraction on nutrition concentrations.
The purpose of this paper is to build up a phenomenologicalmodel linking game theory and experimental measurablequantities. We calculate the population structure (i.e., thefraction for cooperators and defectors) at different glucose andhistidine concentrations and reproduce the phase diagram forthe transition from dominance of a single strain to coexistenceof both. We use phenomenological game theory because thecollective effects here are highly nonlinear due to complexmetabolism. Our model implies a consistent nonlinearityresponsible for both yeast growth and glucose production.
The interactions between cooperative and defective strainsare complicated for the following two reasons. First, there aretwo kinds of nutritional molecules: sucrose and glucose, assketched in Fig. 1. Sucrose is easy to handle because it hasa single source and single mode of consumption, originatingfrom the media and being consumed only by cooperators.However, glucose has two sources: the initial amount addedinto the media and the local increment from sucrose decom-position by cooperators. The actual glucose concentration sur-rounding yeast cells depends on the cooperators’ metabolismand concentration, whose relation is unknown. Second, insucrose hydrolysis, cooperators experience a cost to synthesizeinvertase but at the same time gain in generating glucosefor themselves. The balance between the cost and benefit issubtle and hard to handle. In order to circumvent these twoobstacles, we model a simple situation where the two strainsare at the same nutrition level. This should be applicable to theexperimental situation because cooperative strains ultimatelylive on the monosaccharide glucose no matter if it is absorbedfrom the surrounding media or decomposed from sucrose. In
020902-11539-3755/2011/84(2)/020902(4) ©2011 American Physical Society

RAPID COMMUNICATIONS
ZHENYU WANG AND NIGEL GOLDENFELD PHYSICAL REVIEW E 84, 020902(R) (2011)
FIG. 1. (Color online) Schematic of nutrient flows in the exper-iment of Ref. [8]. Sucrose is hydrolyzed in the periplasmatic space(grey) of cooperators. The majority of the glucose produced diffusesback to the media, from which both strains import glucose.
this way, our system can be simplified as a coexistence problemof two strains living on the same nutrition glucose.
Next, we use game theory to identify the conditions forcoexistence. The key is to construct a payoff matrix withexperimental data. Here, the two strains are engaging ina cooperative game: If the payoff for defectors exceedsthat of cooperators, defectors will dominate; if the payofffor cooperators exceeds that of defectors, cooperators willdominate. Therefore, only when the payoffs for both parties areequal will coexistence be achieved. The payoff for players isthe mean fitness for strains, which is measured as the growthrate. Thus, our next task is to construct the dependency ofgrowth rates on experimental observable quantities. We dothis below using a mean-field theory, modeled after the way inwhich cooperative interactions leading to ferromagnetism aredescribed by an effective local field that adds to the externallyapplied magnetic field (see, e.g., Ref. [10]).
The first input is the nonlinear dependency of growth rateb (h−1) on glucose concentration g (%) according to theexperiment [8]:
b = γ1gα, (1)
where γ1 = 0.44, α = 0.15, and g is 0.001–0.03%. In Eq. (1),the growth rate b varies nonlinearly with glucose concentrationg. The nonlinear power α is unusual and reflects cellularconstraints, such as the nonlinear performance of hexosetransporters and catabolic pathway enzymes. We cannot usefirst principles system biology to justify the nonlinear α,because the basic metabolic networks etc are not well enoughunderstood. Instead, we make a very simplified assumption:We interpret the nonlinearity as primarily reflecting aspects ofthe efficiency of hexose transporters across the cell membrane.Hence, Eq. (1) implies that translocation flux rate throughthe membrane is proportional to the concentration raised to anonlinear power α. Note that in principle such translocationprocesses are influenced by the metabolism of the cells, butfor now we regard that as negligible.
Second, we include the presence of cooperators. Now, thereare two sources of glucose. Besides the initial glucose addedinto the media, cooperators also produce glucose from sucrosedecomposition. At the mean-field level, every cooperatormanufactures glucose at about the same rate. We assumethat this rate does not have a significant dependence on themetabolism of cells; because the amount of invertase in eachcell is not influenced by the metabolism, we assume that theperformance of invertase is also not significantly influencedby the metabolism. Since the sucrose concentration is keptthe same throughout the experiment, there is no need forus to explore the detailed form of such a production rate.The total glucose produced inside all the cooperator cells isthus proportional to the cooperator fraction f . Equation (1)implies that the glucose imported into the cell scales as gα
due to the cellular constraints on the molecular translocationprocess. The same translocation passage limits the glucoseoutput from cooperators, as evidenced by the report that thediffusion coefficient through the cell wall is anomalouslysmall, estimated to be 1
20 of that in water [8]. Hence, the flux ofglucose released is proportional to the glucose produced insidethe cells raised to the power α. Since the glucose manufacturedinside the cells is proportional to the cooperator fraction f ,the glucose contribution from cooperators is proportional tof α with some coefficient of proportionality. We denote thecoefficient as γ . As we note in the discussion about Eq. (1), thetranslocation process is affected by the metabolism of the cells.The coefficient γ , in this way, represents a general discountfactor due to metabolism, which is a combined effect of theartificial discount in histidine limitation and the natural cost incooperation. Hence, we obtain the growth rate for defectors
bd = γ1(g + γf α)α, (2)
where γ is a general discount factor that varies with histidineconcentration, reflecting the artificial discount in histidinelimitation and the natural cost of cooperation.
Third, we analyze the situation for cooperators. Comparedwith defectors, when they import glucose from the media, thetranslocation process is influenced by the metabolism, as welearn from Eq. (1). Such a discount, representing a combinedeffect of the artificial discount in histidine limitation and thenatural cost in cooperation, is represented by the same γ asin Eq. (2), because the same cellular processes are involved.Thus, we obtain
bc = γ γ1(g + γf α)α, (3)
where bc is the growth rate for cooperators. Last, we recallthat there is a small amount of glucose that cooperatorsreserve for themselves. This amount is determined by thesucrose concentration and the cell’s metabolism and transportprocesses, which are mediated by the histidine concentration.Since the sucrose concentration is always 5% during theexperiment, we denote the benefit for a single cooperator cellby ζ , a single-variable function of histidine concentration only.Including this benefit for cooperation, we finally obtain
bc = γ γ1(g + γf α)α + ζ. (4)
Equations (2) and (4) compose the central part of ourmodel, including the contribution of cooperators to theincrease in glucose concentration by the term γf α . This
020902-2

RAPID COMMUNICATIONS
THEORY OF COOPERATION IN A MICRO-ORGANISMAL . . . PHYSICAL REVIEW E 84, 020902(R) (2011)
TABLE I. Cost γ for cooperators at various histidineconcentrations.
his/(20 μg ml−1) γ Standard deviation σγ
1 0.19 0.020.2 0.14 0.020.05 0.061 0.0060.02 0.027 0.006
model balances the cost γ for cooperators with the benefitζ , both depending only on histidine concentrations. Notethat as the cooperator fraction f increases, more glucose istrapped in cooperators, but the amount per cooperator doesnot change. The positivity of ζ is essential for the survival ofcooperators, which makes it possible for the two engineeredstrains to engage in a snowdrift game.
In our model of cooperation, we have input three nontrivialarguments: (i) The two α’s in Eqs. (2) and (4) are the same,representing the same translocation passage limitation on theglucose flux both into and out of yeast cells. (ii) The twoγ ’s in Eq. (4) are the same, implying the same discountin yeasts’ growth and sucrose decomposition by cost ofcooperation mediated by histidine limitation. (iii) ζ is a single-variable function of histidine concentration, representing thatcooperators are compensated for production of glucose.
Our arguments above motivated points (i)–(iii) assumingthat it is primarily the phenomenology of transport of glucosethrough the cell membrane which is the growth-rate determin-ing factor. However, in principle, other metabolic effects canbe present. To test whether our assumptions are self-consistentand represent a good representation of the data, we comparethe predictions of our equations with the data.
Ideally, we would like to be able to calculate the cooperatorfraction as a function of glucose and histidine concentrations(Fig. 3(b) of Ref. [8]) from theory, but this would require adetailed description of the metabolism and growth dynamicsof the organisms to obtain the parameters. As an alternativeapproach, we input experimental data to our equations andverify the consistency of our modeling by checking thestandard deviations for different sets of data. Based onour reasoning from game theory that the growth rates forcooperators and defectors are the same at equilibrium, themeasured growth rates of cocultures as a function of glucoseand histidine concentrations (Fig. 3(c) of Ref. [8]) should bevalid for either strain. Interpreting them as the growth ratesfor defectors, we can import the data in Figs. 3(b) and 3(c)of Ref. [8] for various glucose and histidine concentrationsinto Eq. (2) and calculate the discount γ . According to our
TABLE II. Large standard deviation σγ to fit Eq. (5) in violationof assumption (i).
his/(20 μg ml−1) γ Standard deviation σγ
1 1.8 1.50.2 12 90.05 12 70.02 8 4
TABLE III. Benefit ζ for cooperators at various histidineconcentrations.
his/(20 μg ml−1) ζ Standard deviation σζ
1 0.269 0.0030.2 0.260 0.0040.05 0.241 0.0070.02 0.222 0.02
argument (i), we predict that γ should be the same at thesame histidine concentration but different glucose concentra-tions; this is supported by the standard deviations shown inTable I. We neglect the data for very small cooperator fractions,especially for the extinction of cooperators, such as those whenhistidine concentration is as low as 0.005, since they will eithergenerate large deviation with very small bias in measurementor cause the cooperation term γf α to vanish. By averagingamong different glucose concentrations, we can see that thediscount γ gets smaller when histidine is more dilute. Thefirst two σγ are calculated with six data points where glucoseconcentration (%) ranges from 0.001 to 0.03. The latter twoare smaller than the first two since fewer data are averaged. Thesmallness of the standard deviations has not been hardwiredinto our model and substantiates our assumption (i) becauseotherwise they might be orders of magnitude larger, as we
1 0.2 0.05 0.02
0.001
0.002
0.003
0.005
0.01
0.03
[his]/(20 µg ml−1)
[glu
c](%
)
log 10
(coo
pera
tor
frac
tion)
−4
−3.5
−3
−2.5
−2
−1.5
−1
−0.5
1 0.2 0.05 0.02
0.001
0.002
0.003
0.005
0.01
0.03
[his]/(20 µg ml−1)
[glu
c](%
)
lo
g 10(c
oope
rato
r fr
actio
n)
−4
−3.5
−3
−2.5
−2
−1.5
−1
−0.5
a)
b)
FIG. 2. (Color online) (a) Theoretical result for cooperator frac-tion at various glucose and histidine concentrations. (b) Correspond-ing experimental result for cooperator fraction at various glucose andhistidine concentrations.
020902-3

RAPID COMMUNICATIONS
ZHENYU WANG AND NIGEL GOLDENFELD PHYSICAL REVIEW E 84, 020902(R) (2011)
illustrate as follows. We show in Table II the average of γ
and its corresponding standard deviation σγ if the incrementof glucose concentration varied not with the same power α, aswe have assumed in our model, but linearly with cooperatorfraction, as we might have initially guessed,
bd = γ1(g + γf )α, (5)
or even quadratically
bd = γ1(g + γf 2)α. (6)
The standard deviations σγ in Table II are at least two ordersof magnitude larger than those in Table I and are even higherfor the fit to Eq. (6). The comparison among these tablesdemonstrates that the standard deviation is a good test ofour assumption and hence justifies the self-consistency of ourtheory.
Next, we interpret the data in Fig. 3(c) of Ref. [8] as growthrates for cooperators and plug in the values of γ shown inTable I into Eq. (4). Our arguments (ii) and (iii) predict that ζ
depends only on histidine concentration, which is consistentwith the standard deviation for ζ in Table III. The benefitfor cooperators diminishes with the limitation in histidine.The latter two σζ are bigger than the previous two since weextend the data for those not incorporated in the calculation ofγ in Table I. Overall, however, these consistency checks aresuccessful, a result that we emphasize is not “built in” to ourtheory.
With the cost γ and gain ζ in hand, we can now predictthe cooperator fraction at equilibrium. Setting bd = bc inEq. (2) and (4), we plot the predicted cooperator fraction
in Fig. 2(a). As a comparison, we replot the correspondingdata from experiment [8] in Fig. 2(b). The similarity betweenthe theoretical calculation and experimental measurement isstriking and supports our model.
We have proposed a phenomenological model for wild-typecooperative and mutant defective strains in a mixed mediaof glucose and sucrose. We circumvented the obstacle ofmodeling sucrose decomposition, which increases glucoseconcentration, incurs a cost as invertase syntheses for cooper-ators, and rewards them with a small fraction of the glucoseproduced, by attributing cost and benefit for cooperation togrowth rates. Then we determined the dependency of growthrates for defectors and cooperators on experimental quantitiessuch as glucose and histidine concentrations. Despite ourapproximations, such as averaging over different glucoseconcentrations, the resulting calculation of cooperator fractionat equilibrium is consistent with experimental observations. Sowhat did we actually predict? By requiring that bd = bc, wethus found, in a noncircular way, the condition for the phaseboundary separating the prisoner’s dilemma phase from thesnowdrift phase of the system. Our mean-field arguments alsopredict the trend, that is, the sign of ∂f/∂g for fixed histidineconcentration. These methods could be useful in the designof future experiments to manipulate collective properties ofmicro-organism communities.
We thank Jeff Gore for sharing his experimental data andKirill Korolev for helpful comments on the manuscript. Thiswork was partly supported by National Science FoundationGrant No. NSF-EF-0526747.
[1] J. Smith, Evolution and the Theory of Games (CambridgeUniversity Press, Cambridge, 1982).
[2] C. Hauert and G. Szabo, Am. J. Phys. 73, 405(2005).
[3] R. Axelrod, D. Axelrod, and K. Pienta, Proc. Natl. Acad. Sci.USA 103, 13474 (2006).
[4] M. Nowak, Science 314, 1560 (2006).[5] J. Prosser et al., Nature Rev. Microbiol. 5, 384 (2007).
[6] T. Antal, H. Ohtsuki, J. Wakeley, P. Taylor, and M. Nowak, Proc.Natl. Acad. Sci. USA 106, 8597 (2009).
[7] A. Traulsen et al., Proc. Natl. Acad. Sci. USA 107, 2962 (2010).[8] J. Gore, H. Youk, and A. Van Oudenaarden, Nature (London)
459, 253 (2009).[9] J. M. Gancedo, Microbiol. Mol. Biol. Rev. 62, 334 (1998).
[10] N. Goldenfeld, Lectures on Phase Transitions and the Renor-malization Group (Addison-Wesley, Reading, MA, 1992).
020902-4