Embed Size (px)
Citation preview

JOURNAL OF URBAN ECONOMICS 10, 9% 116 (1981)
Theory and Estimation in the Economics of Housing Demand’
STEPHEN K. MAYO
Ah1 Associutes Inc., Cumhridge, Massachusetts 01138
Received January 29, 1980
The main purpose of this paper is to review recent theoretical and empirical developments in the economics of housing demand. In particular we ask, What is known concerning the permanent income elasticity of housing demand vis-a-vis the current or measured income elasticity? What is known concerning price elasticities ? What is the appropriate functional form for housing demand equations? What is the role of demographic variables? What is known concerning dynamic aspects of housing demand? What appear to be the major sources of bias in existing estimates of demand equations?
The primary focus is on analyses that have been completed since the time of deleeuw’s (1971) review of cross-sectional evidence on housing demand. In that review the major purpose was to reduce the wide range of uncer- tainty concerning income elasticity estimates that previously existed. The paper appeared to accomplish its purpose- while elasticities derived in analyses being reviewed moved up and down in response to a variety of adjustments proposed by deleeuw, most movement was toward the center. Low elasticities moved up, high elasticities, down, and the result was a consensus income elasticity for renters of from 0.8 to 1.0 and for owners, “moderately higher than that of renters.”
Some disquieting questions were left in the wake of deleeuw’s review, however, especially in light of a pronounced, and unexplained, discrepancy in income elasticity estimates between the one analysis he cited that used individual (micro) data, and the several that he cited that used aggregate data. Was this a result of peculiarities of the data bases, definitions of variables, or of inherent biases in the use of micro or aggregated data?
‘This paper was originally presented at meetings of the American Economic Association, Chicago, Illinois, August 29-3 I. 1978. Support for this research was provided by the U.S. Department of Housing and Urban Development under contract H-2040R to Abt Assoicates Inc. The author gratefully acknowledges the intellectual contributions of his colleagues Joseph Friedman and Daniel Weinberg to this paper. Helpful comments were provided by Dennis Carlton. Frank deleeuw, William Grigsby. John Kain, Michael Murray, and Edgar Olsen. Neither the individuals nor the institutions cited should be held responsible for the paper’s content.
95
0094- 1190/g l/040095-22$02.00/O Copyright :Q I YX I by Academx Press. Inc.
All rights of reproduction in any form reserved.

96 STEPHEN K. MAYO
Further, why should owner and renter elasticities appear to be different? Since the time of deleeuw’s analysis there have been many analyses that have used both aggregated and micro data, some of which have specifically addressed the questions left open by deleeuw.
Those studies differ in many ways including not only their level of aggregation but also their functional form, stratification by tenure, treat- ment of income, inclusion of demographic variables, method of specifying a price term, and treatment of dynamic elements of demand. Most, however, have employed a log-linear demand equation (1nH = a + blny + clnp,, where H is housing; y, income; pH, the relative price of housing; and a, b, and c are parameters) with the maintained hypothesis that a single elasticity of demand suffices for everyone. Aside from its analytical convenience, such an assumption has, somewhat amazingly, rarely been subjected to even the most rudimentary statistical tests. Because much of the debate over housing demand focuses on “the” elasticity of demand (or that of income and price), analyses based on log-linear demand functions are in this paper evaluated first. Following that studies using alternative functional forms are reviewed and evaluated, particularly for what they suggest concerning variable price and income elasticities. Evidence on demographic variation in housing demand and on the dynamics of housing demand are reviewed in the final two sections.
Throughout the paper, concern is mainly with the demand for an aggre- gate bundle of housing services and only incidentally with the demand for housing “attributes” or “components.” Also there is no explicit concern with tenure choice. Each of these areas has been researched extensively in recent years, and a more thorough review of the state of housing demand research would certainly include them as well.
THE INCOME ELASTICITY OF DEMAND IN MODELS WITH LOG-LINEAR DEMAND EQUATIONS
One of the major continuing questions concerning housing demand is just how sensitive demand is to changes in income. A central issue concerns the degree to which estimates of elasticities are likely to be biased as a result of using current income rather than an appropriate measure of permanent, normal, or expected income. The well-known cause for concern is that current income elasticities will be biased downward in proportion to the ratio of variances of permanent income to current income. Thus if a demand equation is estimated using current income, the asymptotic expectation of the estimated income elasticity, 7jy, will be related to “true” permanent income elasticity, n,, by
asymptotic E( $,) = nlyPy, (1)
where E( ) is the expectation operator and P, is the ratio of the variance of

THEORY AND ESTIMATION IN HOUSING DEMAND 97
TABLE 1 Comparison of Price and Income Elasticities of Housing Demand for Recent Studies
A. Studies with Log-Linear Demand Functions and Individual Data
Data Latest year of data Author base’
____-
I a. Carliner* PSID b.
2. Fenton’,’ PSID 3. Friedman/
Weinberg HADE 4. Ian/
Quigley CRP 5a. Lee* SCF
b. c. d.
6a. Lee/ PSID Kong*
b. 7. Li* SE0
8. Ma&l/ FHA Bumham/ Austin*
9a. Mayo HADE b.
c. IO. Nelson C-EU I I. Polinsky/
ElWood FHA 12. Rosen’ FHA
13. Smith/ Campbell* CSL
14. Straszheim BATSC
Income of population*
Income measure3
1971 L-M
1972 L-M
4-year avg. Current 3-year avg.
1975 L-M 3-year avg.
1967 1959
1961
1971
L-M ? ? ? ?
L-M
Current 2-year i.v. Current 2-year i.v. Current
1967 L-M
L
1969 M
“Full income” 0.70 - 0.56 3-year i.v.
Current 0.35 - 0.56 Current 0.24
0.31 “Effective
income”
I976 L-M
I970 L-M-H
I969 1969
2-year avg. 0.37 - 0.17 “Permanent”
iv. 0.46 “Transitory” 0.30 - 0.17 Current 0.27 - 0.17 Current 0.28 “Effective
income” “Effective
income” plus imputed rent
1971
M M
? “Effective
Renter
Demand elasticities4
Income Price
Owner
Income Price
0.52 ms. 0.44 “.S. 0.4 I - 1.28
0.36 - 0.22
0.08 0.39 0.29 0.46 0.37
1965 L-M-H pooled Current 0.42 - 0.53 owners/renters
B. Studies with Log-Linear Demand Functions and Aggregated Data
0.63 - 0.80 0.50 n.r
0.2 I 0.70 0.34 0.7 I 0.4 I 0.87 - 0.57
0.6 I - 0.52
0.45 - 0.89
0.24
0.38 - 0.67 0.35 - 0.67
0.5 I
0.42 - 0.53
Group- Demand elasticities4 ing
Data Latest year Income of Income Renter Owner
cri- _____--..____. ___ Author base’ of data population’ measure3 telion Income Price Income Price
15. de Leeuw CH 1960 L-M-H Current SMSA 0.X1+ - 0.71+ I .34+ 16. Moth FHA I966 M “Effective SMSA 0.7 I+ ~ 0.76
income”

98 STEPHEN K. MAYO
TABLE I -Continued
Author
GWlp- Demand elasticities* ing
Data Latest year Income of Income Renter Owne cri- -~ __---~~._~~__
base’ of data population’ measure’ terion Income Price Income
17. Nelson CH 1970 L-M-H Current 18a. Nelson CH 1970 L-M-H Current
b. CH I970 M-H Current
19a b.
20.
2la.
b. 22a.
b. C.
23. Vaughn CH I970 L-M-H
Nelson C-Eu 1970 L-M-H Current C-Eu I970 L-M-H Current
Polinsky/ FHA EbWXUl
Smith/ CH
Campbell Smith/ CSL
1969
1970
1971
Campbell
M
L-M-H
1
“Effective income”
2-stage inst. var.
Current “Effective
income”
SMSA Income
class Income
class Random Census
tract SMSA
SMSA 0.65
Random income class housing value
SMSA
0.44+ - 0.68’ 1.32’ - 0.25 0.40
0.3 I 0.5 1
0.35 0.36 0.76’ 1.16+
0.52 -
1.21+ 0.59
0.68 1.12+
0.32+ - 0.48 1.88+ -
C. Studies with Linear Demand Functions and Individual Data
Demand Elastiaties4
Renter 0W”Cl
Author Data Latest Year lncomc or income ~
$5000 $10.ooo $5wa !
tme’ 0r data population’ Meawe Inc. Pr. Inc Pr Inc Pr. II
24. Barton/Olxn NYC IY6X L-M-H Current 0.23 ~ 0.56 0.39 - 066 (Stone- cieary demand function)
25. Friedman/Wemberg HADE 1977 L-M 3.year avg 0.2x PO.17 0.44 - 0.35 (Stone- Geary demand function)
26 Kain/Qusgley CRP IV67 L-M ClNrUlt 0.18 0 30 0.2x 0.
-- -~
D. Studies with Other Demand/Utility Functions and Individual Data
Renter Demand Elasticidea Data Latest year Income of Income __
Author base’ of data population* meawe InCOme Price
27. Murray HUD 196X L Current 0.42 nr
(Generalized C.E.S utility functmn)

THEORY AND ESTIMATION IN HOUSING DEMAND
permanent and current income: is2 IJY’,
p,=+ < 1,
uY UY: + UY’,
99
(2)
where, because permanent income, y,, and transitory income, y,, are pre- sumed to be uncorrelated, the variance of current income, y, is equal to the sum of the variances of permanent and transitory incomes. It is apparent that if the variance of transitory income is small relative to that of permanent income, the bias of the estimated current income elasticity will be small.
Different methods have been utilized to deal with the problem of estimat- ing the permanent income elasticity including grouping of observations (deLeeuw, Muth, Vaughn), using lagged income as an instrumental variable (Lee, Lee and Kong), use of an average of income over several years (Carliner, Fenton, Friedman and Weinberg, and Mayo), use of an instru- mental variable based on an auxiliary regression of income on its presumed determinants (Mayo, Smith and Campbell, Struyk), and use of extraneous estimates of the parameter Py to adjust estimated coefficients (Mayo).
“Grouping” has in practice meant using aggregate data in hopes of averaging out transitory income components. Use of aggregate data has been justifiably criticized, however, on the grounds that in the process of
*Estimated equation includes demographic variables. tSubject to aggregation/specification bias. ’ PSID-University of Michigan Panel Survey of Income Dynamics. HADE-Housing
Allowance Demand Experiment. CRP- St. Louis Community Renewal Program. SCF-Survey of Consumer Finances. SEO- Survey of Economic Opportunity. FHA- Federal Housing Administration Sec. 203 homebuyers. C-Eu-U.S. Bureau of the Census-special tabulations for Eugene/Springfield, Oregon. CSL-Chicago Savings and Loan and Department of Hous- ing and Urban Development. BATSC-San Francisco Bay Area Transportation Study Com- mission. CH-U.S. Census of Housing. NYC-New York City Housing and Vacancy Surveys. HUD-Department of Housing and Urban Development survey of Public Housing Appli- cants.
‘L-predominantly low income. M-predominantly middle income. H-predominantly high income.
‘Income measures are either current, average over some number of years, instrumental variables (iv.) using income lagged some number of years, “full income” which includes imputed rents for homeowners and other elements. “effective income” which is an FHA estimate of income expected to obtain over the first one-third of a mortgage period, an instrumental variable for permanent income based on an auxiliary regression of income on its presumed determinants, “transitory income” estimated as the difference between “permanent” and current income, and “effective income” to which imputed rent to owners has been included.
4n.s.-not significant. n.r.-estimated but not reported. ‘Although Fenton’s reported results are for a linear equation, he also estimates a log-linear
equation without reporting results. Results are presented here as though they were based on a log-linear demand equation because Fenton claims (1974, p. 3-25) that income elasticity results were similar for the two specifications at the mean,

100 STEPHEN K. MAYO
grouping the data, especially in the presence of specification errors in the demand equation, serious aggregation biases may result which drastically increase estimated income elasticities. Nelson, Polinsky, Polinsky and Elwood, Smith and Campbell, and Vaughn all discuss reasons for the presence of aggregation bias and the former four analyses attempt to measure its extent using alternative model specifications.
Evidence on income elasticities of demand for recent analyses using log-linear demand equations is presented in Table l.A for analyses using micro data, and Table l.B for analyses using aggregated data.* Estimates are presented whenever possible, based on a model specification that includes demographic variables. The tables also indicate the data base, the year of the data, the predominant levels of income of the sampled popula- tions, and, for analyses using aggregated data, the grouping criterion. Whenever analyses estimated both current and permanent income elasticity estimates based on different equations, those have been presented along with an indication of the income definition used in arriving at each estimate. Brief descriptions of alternative income concepts are contained in footnote 3 to Table 1.
A direct comparison of the income elasticity estimates based on micro data and aggregated data suggests that the sorts of differences cited by deLeeuw have in general continued to be found in subsequent analyses. This difference between micro and aggregated data estimates is most pronounced for homeowners- where no analysis using micro data has produced an income elasticity as high as 0.9, and where six different analyses using aggregated data have produced estimates ranging from 1.12 to 1.88. In every instance where homeowner income elasticities were in excess of 1.0 (and even for some with smaller elasticities) some form of aggregation and/or specification bias appears to have raised estimated elasticities. Nelson, for example, first estimated demand equations based on individual household observations drawn from a special census tabulation. Those results (1 .A. 10) indicate income elasticities of 0.28 and 0.24 for renters and owners, respectively. (See Table 1 for citations of references.) When the same observations were grouped by census tracts, simulating a procedure used by Reid in one of the analyses reviewed by deLeeuw (and which has been criticized by Lee and by deleeuw), income elasticity estimates rose to 0.76 and 1.16, respectively, for renters and owners (l.B.l9b), indicating a poten- tial bias of several hundred percent. Smith and Campbell simulated de- Leeuw (1 .B. 15), Nelson (1 .B. 17) and Vaughn’s (1 .B.23) grouping procedure (l.B.21b) and estimated an income elasticity of 1.21 in contrast with an estimate of 0.65 attained using the same data but relying on a two-stage procedure designed to minimize aggregation bias. When they estimated the income elasticity using micro data with another data set, they arrived at an
‘Analyses reviewed include only those that used U.S. data

THEORY AND ESTIMATION IN HOUSING DEMAND 101
income elasticity for owners of 0.5 1 (l.A. 13) but when data were de- liberately grouped inappropriately using housing value as a criterion, the elasticity estimate rose to 1.12 (l.B.22~). When Polinsky and Elwood simulated the effects of grouping in the presence of various specification biases, the procedure used by deleeuw, Nelson, and Vaughn (which relied on use of an average SMSA price index based on BLS family worker budgets) produced upward biases in the income elasticity of about 40% relative to their estimate of the “true” income elasticity.3 Polinsky and Elwood indicate that while micro estimates of the income elasticity are insensitive to many common specification errors,4 grouped estimates are extremely sensitive, and all of the specification errors they investigated biased income elasticity estimates upward.
When attempts are made to use aggregate data with grouping procedures less prone to aggregation bias (by grouping randomly or by income class (Nelson, 1 .B. 18a, b and 1 .B. 19a, and Smith and Campbell, 1 .B.22a, b)), or by defining variables in a way that avoids aggregation bias (Polinsky and Elwood, 1.B.20, and Smith and Campbell, l.B.21a), micro estimates and grouped estimates are quite close together. For example, Nelson’s estimates (l.A.10 and I.B. 19a) change from 0.28 to 0.35 for renters and from 0.24 to 0.36 for owners when estimates are for micro data and randomly grouped micro data, respectively. Polinsky and Elwood’s estimates (l.A.11 and l.B.20) of the income elasticity change from 0.38 to 0.52 when micro data are grouped. Smith and Campbell’s estimates (l.A. 13 and 1 .B.22a, b) change from 0.51 to 0.59 or 0.68 depending on the grouping technique.
It is possible to interpret these changes from micro to properly grouped data as indicative of the effect of not having used a proper permanent income measure in the micro demand equations. If one does so, the implied ratio of variances of permanent to current income from Eq. (1) PY, ranges from 0.67 to 0.86 for the analyses just compared, suggesting that estimates in the literature that rely on current income should be adjusted upward by from 16% to 50% to convert them to permanent income elasticity estimates.
This is still an uncomfortably large range, but one that is difficult to narrow. Direct attempts to estimate the parameter PY using techniques suggested by Friedman and later elaborated by Liviatan produced estimates of 0.73 and 0.52 in Pittsburgh and Phoenix, respectively, for low- to moderate-income households participating in the Housing Allowance De-
‘Polinsky and Elwood’s simulation of the estimation procedure used by Winger (in the analysis which was reviewed by deleeuw) produced an upward bias of roughly 100%. Muth’s procedure, which relies on an SMSA mean price index other than the BLS index, may be subject to the same sort of bias as is present in the deleeuw, Nelson, and Vaughn models, but because the price indexes are different, the extent of any bias in income elasticities is unclear.
4Common errors include using improper or no price data, using logarithms of means rather than of medians, and using either incorrect or no deflators.

102 STEPHEN K. MAYO
mand Experiment (Mayo, 1977, pp. 95 ff.).5 Discrepancies indicated be- tween current income elasticities and those based on using average incomes or instrumental variable techniques are in general comparable to those indicated by direct comparisons of grouped and micro estimates and those suggested by direct estimates of PY but still indicate a range of possibilities. The instrumental variable technique used by Lee and later Lee and Kong tends to produce both the highest change in elasticities from current to “permanent” income and the highest absolute value of income elasticity estimates of any of the micro estimates. This implies, of course, that the variance of transitory income is, in relation to the variance of permanent income, more important than it appears to be based on other analyses reviewed here. Lee and Kong’s technique, which relies on lagged income as an instrumental variable, will lead to upward-biased parameter estimates in the presence of response lags in adjusting housing consumption to changes in demand.‘j Because consumption does not in fact respond instantaneously to changes in demand, Lee’s and Lee and Kong’s estimated income elastici- ties based on the lagged-income instrumental variable technique must be viewed cautiously.
Nevertheless, the results that emerge from Tables l.A and l.B are clear. Every method used to account for the influence of permanent income produces the expected result-the permanent income elasticity of housing demand is above the current income elasticity.’ One may ask what magnitude of permanent income elasticity would result were one to apply an extreme correction (say 100%) to each micro estimate presented for the current income elasticity. In no case would the estimated elasticity be as high as unity for either owners or renters. 8 Further, for each of the analyses based on aggregated data and which utilizes an appropriate grouping technique or means to minimize aggregation bias, income elasticities are all below one for both owners and renters. Thus it seems relatively certain that on average, for
‘These estimates assume no correlation between adjacent year transitory incomes. Were a correlation of 0.25 to be assumed, estimated P, values would drop to 0.67 and 0.36 in the two cities. respectively (Mayo, 1977, p. 96).
‘See Mayo (1977. p. 64). for a more extensive discussion of this point. ‘It may be noted in passing that only two studies of those reviewed here have attempted to
measure housing consumption responses to transitory income. Mayo found transitory income elasticities to be roughly 65% on average of corresponding permanent income elasticities, although results are noted as potentially upward biased to a serious degree (Mayo, 1977, pp. 99 ff). Fenton estimates marginal propensities to consume from transitory income to be about 44% of marginal propensities to consume from permanent income.
‘One might expect that there would be less difference between current and permanent income elasticity estimates for owners than for renters because owners’ incomes are more stable and hence the parameter P,. larger for them. This does not appear to be the case for the analyses reviewed here. This may be a result of the truncated samples (by income) observed here: low-income owners may have no more stable incomes, for example, than low-income renters.

THEORY AND ESTIMATION IN HOUSING DEMAND 103
a large segment of the population including both renters and owners permanent income elasticities of demand are well below one. Among the analyses reviewed here that calculate permanent income elasticities, and which appear to be relatively free of major biases, the range of income elasticity estimates for renters is from 0.25 (l.B.18a) to 0.70 (l.A.6a) with most in the 0.3 to 0.5 range, and for owners from 0.36 (l.B.19a) to 0.87 (l.A.6a) with most in the 0.5 to 0.7 range.
THE PRICE ELASTICITY OF DEMAND IN MODELS WITH LOG-LINEAR DEMAND EQUATIONS
The degree of resolution provided by price elasticity estimates in the literature is less than that of income elasticity estimates. This is attributable in part to there being fewer analyses that have calculated price elasticities, and in part to the wide variety of measures of relative housing prices that have been used in different analyses. Four sorts of housing price variables have been used to obtain price elasticity estimates- those based on the BLS “family workers’ budgets” which contain relative price information (l.A.1,2,6,8, 11, 12; l.B.15,17,20,23), those based on the parameters of a housing production function which are used to transform factor price information into information on housing output prices (l.A.11, 12; 1 .B. 16,20); those based on a “hedonic index” of housing services, which is used to define the price of a standard bundle of services which may be used to establish relative prices within a city (1 .A. 14); and those based on the variable rent rebates offered under one part of the Housing Allowance Demand Experiment which simulate wide variations in the relative price of housing (l.A.3,9).
It appears that price elasticity estimates are very sensitive to both the way in which prices are defined and to model specification. A comparison of the analyses by Carliner (l.A. l), Fenton (l.A.2) and Lee and Kong (l.A.6) illustrates the problem. All three used the same basic data from the Panel Study of Income Dynamics and based price variables on BLS series. Each of the three differed however in its use of other variables (demographic characteristics and geographical descriptors). While Carliner found insignifi- cant price elasticities for renters, Fenton found an overall renter price elasticity of - 1.28, and Lee and Kong found a renter price elasticity of - 0.56.
This latter figure is more nearly representative of other estimates found in the literature, and represents an especially careful attempt to control for both interurban and intraurban price variation.’ Other analyses based on
‘This statement is based on having read an unpublished draft of the Lee and Kong paper which contains the full model specification and results on which the paper reviewed here is based. The latter unfortunately does not contain the detail of the unpublished version.

104 STEPHEN K. MAYO
BLS price data have indicated elasticities from about -0.3 (l.B.17, owners) to -0.9 (l.A.8), although , as Polinsky and Elwood indicate, the latter is subject to considerable upward bias in absolute value.”
The three analyses that have calculated price indices based on a produc- tion function of housing services produce very similar results-Muth ob- tains an estimate of -0.76; Polinsky and Elwood, -0.67 and -0.70 based on using micro and aggregated data, respectively; and Rosen, an estimate of - 0.67. Straszheim, whose price index is based on a hedonic index, esti- mates a price elasticity (for one demographic group) of -0.53. Mayo, and Friedman and Weinberg, estimate price elasticities based on experimental price variations in the Housing Allowance Demand Experiment of roughly - 0.2, although the latter two authors estimate elasticities for some demo- graphic groups of roughly -0.4. It may be the case that these latter elasticities are somewhat downward biased in absolute value by their experimental character-given that the Demand Experiment was of limited duration.”
Despite the variation in published price elasticity estimates, most indicate unequivocally that demand for housing is on average inelastic-all but one of the price elasticity estimates reviewed here are below one in absolute value.
Such average price elasticities and the average indicated by the log-linear models’ income elasticities may, however, conceal variation in responses to prices and income which is not uniform across prices, income, or demo- graphic groups. To investigate such possibilities requires considering alter- native functional forms that permit price and income elasticity estimates to vary among population subgroups.
PRICE AND INCOME ELASTICITIES IN MODELS USING OTHER THAN LOG-LINEAR DEMAND EQUATIONS
Several analyses have estimated demand equations which permit price and income elasticities to vary. Frequently this takes the form of estimating several alternative functional forms (log-linear, semi-logarithmic, linear, etc.) as a preliminary to deciding that “they all look pretty much the same so let’s pick the log-linear for convenience.” This review is not concerned with the jetsam of such expeditions, but rather with investigations that have relied on functional forms that can be related explicitly to known utility functions.
“‘The reason for this (Polinsky and Elwood, 1977, p. 15) is attributable to the absence of deflators in the demand equation.
“Households received rent rebates for three years with a guarantee of participation in an unspecified housing subsidy program at the end of that time. Direct attempts at evaluating the extent to which responses were influenced by experimental duration did not, however, reveal any major biases in housing consumption responses.

THEORY AND ESTIMATION IN HOUSING DEMAND 105
The most common of the functional forms that is derivable from an explicit utility function is the linear demand equation expressed in terms of expenditures: R = A + By + C’, where R is housing expenditures; y, income; pH, the relative price of housing; and A, B, and C parameters. Such a demand equation may be derived from the Stone-Geary or “displaced Cobb- Douglas” utility function. Starting with the utility function:
u = (H - &$( z - f&y, (3)
where H is housing; Z, other goods, and OH, d,, and /3 parameters, maximizing subject to the normal budget constraint with the price of other goods normalized to one, one arrives at a demand function for housing of the form
P H=e,, +-#-P,#,, -%)y (4)
or, in terms of expenditures
R = p,H = f&(1 - P)P, + PY - P@,. (5)
Thus, if rents (or housing expenditures) are regressed on income and the relative price of housing, all parameters of the Stone-Geary expenditure (demand) function are identified.”
Aside from the inherent desirability of having a demand function derived explicitly from a utility function,‘3 the Stone-Geary form is especially attractive in that it permits both price and income elasticities to vary with both prices and income. I4 This is easily shown by examination of the relationships for the income elasticity, vY, and the price elasticity, 9,:
PY % = P(Y - 6,) + P&(1 - P> ’
-NY - &I 9p = #fqy - e,) +p,&(l - /3) = -77Y
Y - 8, . y
“In the absence of relative price information, rents are regressed on income alone and the constant term becomes 0,,( I - /?)p,, - fiti,, which does not permit parameters other than /3 to be identified. Even then, the estimated B will be subject to specification bias-downward for intraurban data and upward for interurban data, as shown by Polinsky.
13Theoretical restrictions of “adding up,” homogeneity, and negativity of the direct substitu- tion effect are all automatically satisfied unlike the case, for example, of the log-linear model, Further, it is straightforward to calculate the correct Hicksian measure of consumer’s surplus for the Stone-Geary demand equation.
“‘This is not true in general of demand equations that are derived from utility functions. The Cobb-Douglas utility function leads. for example, to constant income and price elasticities equal to + I and - I, respectively. The constant elasticity of substitution utility function leads to variable price elasticities but a fixed income elasticity equal to + I (see Murray, 1975, p. 172).

106 STEPHEN K. MAYO
TABLE 2
Partial Derivative (sign) of Price (7,) and Income (g, ) Elasticities with Respect to Price and Income for the Stone-Geary Demand Function (Change in Absolute Value of Elasticity)
Change in
Price Income
Change in absolute 9, - + value of: 9,
- +
Under plausible assumptions, I5 the way in which price and income elastici- ties change with the relative price of housing and income is shown in Table 2.
Thus as income increases, both price and income elasticities increase (in absolute value); as relative prices increase, both price and income elasticities decrease. The major restriction of the Stone-Geary demand function is that price and income elasticities monotonically approach unity with changes in price and income.
Linear expenditure equations have been estimated in three different ways in the literature- without reference to the Stone- Geary utility function and without relative prices, using exogenous estimates of the parameter eH in order to identify the entire system without price information, and with information on individual variation in prices to identify the parameters of the system. Table l.C presents information on price and income elasticities calculated at incomes of $5000 and $10,000 per year based on recent analyses. Kain and Quigley estimate a linear demand function which indicates income elasticities ranging from 0.18 to 0.30 for renters, and from 0.28 to 0.45 for owners over the indicated range. These estimates are lower than those obtained by either Barton and Olsen or Friedman and Weinberg -possibly as a result of the downward bias brought about by omitting a term representing intraurban price variation and possibly as a result of using current rather than permanent income. Barton and Olsen obtain estimates of the entire (two-good) Stone-Geary system by virtue of having estimated the parameter 8, as a minimum observed level of housing consumption for their sample- and interpretation consistent with thinking of 8, as the “subsistence” or “minimum necessary” quantity of housing. The income elasticity estimates they obtain, 0.23 to 0.39, for the indicated range of incomes are very similar to the range of estimates for renters based on log-linear estimates presented in Table l.A. Estimated price elasticities are also within the range of estimates, indicated by the log-linear estimates
“Assume that 4, is less than one and >a is greater than the absolute value of 8,
THEORY AND ESTIMATION IN HOUSING DEMAND 107
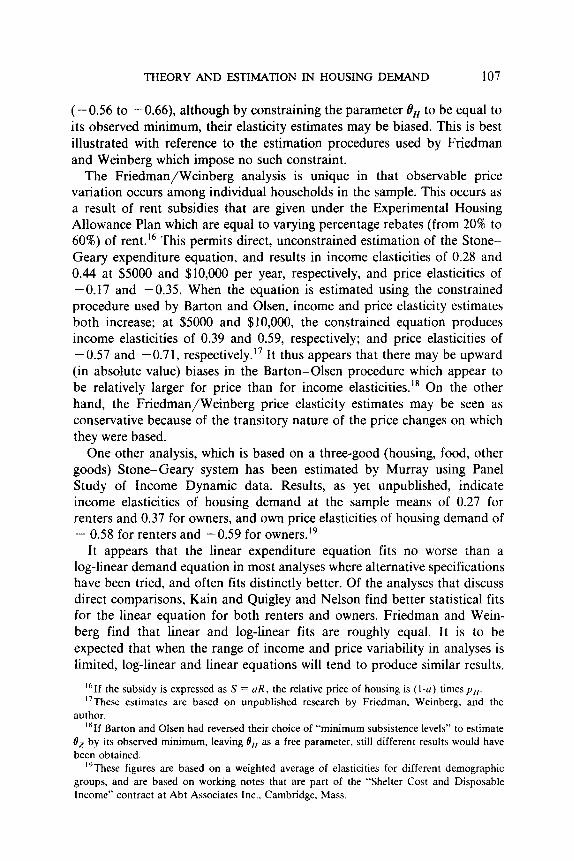
(-0.56 to -0.66) although by constraining the parameter 8, to be equal to its observed minimum, their elasticity estimates may be biased. This is best illustrated with reference to the estimation procedures used by Friedman and Weinberg which impose no such constraint.
The Friedman/Weinberg analysis is unique in that observable price variation occurs among individual households in the sample. This occurs as a result of rent subsidies that are given under the Experimental Housing Allowance Plan which are equal to varying percentage rebates (from 20% to 60%) of rent. I6 This permits direct, unconstrained estimation of the Stone- Geary expenditure equation, and results in income elasticities of 0.28 and 0.44 at $5000 and $10,000 per year, respectively, and price elasticities of -0.17 and -0.35. When the equation is estimated using the constrained procedure used by Barton and Olsen, income and price elasticity estimates both increase; at $5000 and $10,000, the constrained equation produces income elasticities of 0.39 and 0.59, respectively; and price elasticities of - 0.57 and - 0.7 1, respectively. ” It thus appears that there may be upward (in absolute value) biases in the Barton-Olsen procedure which appear to be relatively larger for price than for income elasticities.” On the other hand, the Friedman/Weinberg price elasticity estimates may be seen as conservative because of the transitory nature of the price changes on which they were based.
One other analysis, which is based on a three-good (housing, food, other goods) Stone-Geary system has been estimated by Murray using Panel Study of Income Dynamic data. Results, as yet unpublished, indicate income elasticities of housing demand at the sample means of 0.27 for renters and 0.37 for owners, and own price elasticities of housing demand of - 0.58 for renters and -0.59 for owners.”
It appears that the linear expenditure equation fits no worse than a log-linear demand equation in most analyses where alternative specifications have been tried, and often fits distinctly better. Of the analyses that discuss direct comparisons, Kain and Quigley and Nelson find better statistical fits for the linear equation for both renters and owners. Friedman and Wein- berg find that linear and log-linear fits are roughly equal. It is to be expected that when the range of income and price variability in analyses is limited, log-linear and linear equations will tend to produce similar results.
“If the subsidy is expressed as S = uR, the relative price of housing is (I-0) times p,,. “These estimates are based on unpublished research by Friedman, Weinberg, and the
author. “If Barton and Olsen had reversed their choice of “minimum subsistence levels” to estimate
8, by its observed minimum, leaving B,, as a free parameter, still different results would have been obtained.
“These figures are based on a weighted average of elasticities for different demographic groups, and are based on working notes that are part of the “Shelter Cost and Disposable Income” contract at Abt Associates Inc., Cambridge, Mass.

108 STEPHEN K. MAYO
Presuming that expenditures are in fact linear, the greater the range of income and price variability, the more the differential elasticities indicated by the linear equation would be expected to produce differences in the fit of the two forms.
Other evidence suggests that the linear equation may be more appropriate than the log-linear. Nelson, for example finds that the income elasticity of demand is negatively related to the relative price of housing in a sample of 39 SMSAs. This relationship is exactly that predicted by the Stone-Geary equation as illustrated in Table 2. Further, Nelson finds that when the lowest income group is omitted from the sample on which both renter and owner elasticities are calculated, income elasticities are larger for the higher income group than for the entire sample-again this result is consistent with the Stone-Geary formulation. Friedman and Weinberg test explicitly for differences in income elasticities for households with incomes above and below their sample means; in one site elasticities are significantly higher for above average income households, in the other site differences are insignifi- cant.
If the Stone-Geary equation is in fact more appropriate than the log-linear equation, it provides one explanation of why elasticity estimates differ between renters and owners. In the four instances in Table 1 that compare permanent income elasticity estimates for renters and owners (Carliner, Lee (2 years), and Lee and Kong, owners’ income elasticities average 40% higher than renters’ income elasticities (ny for owners = 0.73; nY for renters = 0.52). In 1975, the average income of homeowners was about 72% higher than that of renters ($13,600 versus $7900, respectively) (HUD, 1976, p. 264). Were one to extrapolate the Stone-Geary function estimated by Friedman and Weinberg to those income levels, owner income elasticities would be roughly 35% greater than those of renters-indicating that a large fraction of the observed renter-owner differences in income elasticities could be accounted for by income difference alone, assuming the Stone- Geary demand equation to be appropriate, and that the U.S. average income differences for renters and owners are representative of the dif- ferences for the samples comprising the analyses reviewed here.*’
““Other possible explanations of renter-owner differences include sources of bias in owner income elasticity elements because of improper definition of the dependent variables (e.g., failure to control for utilities, furnishings, and costs of household operations), or failure to include imputed rents in owner’s incomes. deLeeuw suggests that for these two sources of bias, the former will tend to bias owner elasticities upward and the latter (for q V’s below one) wili bias them downward, with the former likely to provide the quantitatively greater effect. It is unclear how serious either of these sources of bias is for the analyses cited (Lee and Kong in fact include imputed rents in their income measure). Another source of bias is the failure to account for the implicit price subsidy conferred on owners by the Internal Revenue Code. Rosen estimates that failure to include a “tax price” term in the owner demand equation biases the estimated income elasticity upward by 14%.

THEORY AND ESTIMATION IN HOUSING DEMAND 109
Such “evidence” is obviously far from conclusive regarding the ap- propriateness of the Stone-Geary demand function; nevertheless it is highly suggestive of the appropriateness of exploring demand and utility functions that permit price and income elasticities to vary at different levels of price and income. 2’ One such attemp t is that of Murray (1 .D.27) which relies on a Generalized Constant Elasticity of Substitution utility function which, un- fortunately, does not lead to analytically tractable demand functions. Be- cause of the problem of observing nonlinear variation in elasticities with truncated samples, the most appropriate tests of alternative functional forms will be those which are based on either data bases such as the 1972- 1973 Survey of Consumer Expenditure which cover a wide range of relative price and income or “spliced” data bases which pool samples of different price and income characteristics.
DEMOGRAPHIC EFFECTS IN HOUSING DEMAND MODELS
The effects of demographic variables are typically handled in an ad hoc way in most housing demand analyses-either added to demand equations in a linear additive way or used as stratifying variables. There is little uniformity in the demographic variables that are used in different analyses, making it difficult to compare either demand elasticities or particular demographic effects across analyses. While several analyses (Lee, Lee and Kong, Mayo) have found that the inclusion of demographic variables in demand equations has a sizable impact on estimated demand elasticities, others (Maisel, Burnham, and Austin; and Rosen) have found little impact.
While it is difficult to compare results based on stratified demand equations, several general conclusions emerge from analyses that have used additive specifications of demographic variables. Each analysis of those reviewed that has investigated the impact of race on housing demand has found that blacks (or nonwhites) spend less at comparable levels of relative price and income than do whites (Carliner, Fenton, Kain and Quigley, Li, and Smith and Campbell). Various explanations may be advanced for this: different tastes, price discrimination coupled with a price elasticity of demand that is greater in absolute value than one, differences in permanent income, or failure to control for other relevant variables. There has been little systematic testing of the relative contributions of these alternative explanations.
The only other demographic effect that appears pervasive among the analyses reviewed here is that of the sex of the household head. Female
*‘Demand functions based on the translog utility function or the quadratic expenditive system (Pollak and Wales) which are less restrictive on price and income elasticities than the Stone-Geary would seem to be especially appropriate.

110 STEPHEN K. MAYO
heads of household, other things being equal, spend more than do male heads of household (Carliner, Fenton, Kain and Quigley, Li).
In the analyses reviewed here, the effects of age and household size were ambiguous. Only one analysis found a monotonic (positive) relationship between housing demand and age (Carliner) while three (Fenton, Kain and Quigley, and R osen) found nonlinear but inconsistent relationships. While three of the four analyses of those reviewed here found positive relation- ships between household size and consumption (Fenton, Kain and Quigley, and Maisel, Burnham, and Austin), one (Li) found a negative relationship. Other analyses not reviewed here (Maisel and Winnick; Lowry, DeSalvo, and Woodfill; and David) have found that housing expenditures first increase with household size and then decrease.
The diverse nature of findings regarding demographic variables is not surprising, given the ad hoc way in which their effects have been accounted for in the literature. A more productive line of investigation than that suggested by the empiricism of the literature may be found in attempting to parameterize plausible utility functions using demographic variables to “translate” parameters (Pollak and Wales) and thus allow their effects to be accounted for in a more theoretically well-founded way. For example, in the Stone-Geary function the parameters that are often interpreted as “mini- mum subsistence levels” (the 8 parameters) could be made continuous functions of household size. This would lead to demand functions that accounted directly for the possibility of varying price and income responses not only with levels of price and income but with household size as well.
One additional theoretical extension that may be helpful in understanding the role of the demographic variables is to incorporate explicitly informa- tion on the hedonic price structure of housing into the budget constraint when maximizing the utility function. Such a procedure can easily generate the sort of nonlinear relationship between a continuous measure of house- hold preferences (say household size) and expenditures on housing as a direct result of the nonlinearity of the hedonic price structure. For example, several hedonic price investigations have found that a relationship of the form
R = QSy; OCyCl
(where R is rent or housing value, Q is a measure of housing quality attributes, and S is a measure of space), fits the data better than do alternative forms (Merrill). Suppose that one maximized a Stone-Gear-y utility function with three goods-quality of housing, quantity (space) of housing, and other goods, subject to a budget constraint that incorporates this nonlinear price restriction. Such a procedure does not lead to tractable demand functions, but does lead to a system of equations characterizing the

THEORY AND ESTIMATION IN HOUSING DEMAND 111
expansion paths of the three goods which can be directly estimated to yield all of the parameters of the three-good Stone-Geary system.22 Experiments by the author which parameterize such a three-good system using a continu- ous index presumed to represent household size have produced the nonlin- ear relationship between household size and demand that is often illustrated in the literature. As household size increases housing quality decreases monotonically, housing quantity increases monotonically, and expenditures first rise then fall.
A proper accounting for demographic effects is important both for understanding behavior and for making policy that is sensitive to the possibility of differential responses by different demographic groups. The literature has as yet produced far from a proper accounting of demographic effects-from either a theoretical or an empirical perspective, and a good deal more work is needed.
DYNAMIC ASPECTS OF HOUSING DEMAND
All of the analyses reviewed above have been based on static cross- sectional models of housing demand. By assumption they reveal long-run parameters of housing demand; in fact, they reveal little of short-run housing demand behavior.
Dynamic models of housing demand are few in number and relatively primitive. Aside from a careful theoretical investigation of one dynamic model by Muth (1974) and empirical analyses by deLeeuw and Ekanem and Roistacher, there have been few published analyses of the dynamics of housing demand. Muth, in his analysis emphasizes that transactions (mov- ing) costs may be relatively more substantial for housing than for other goods, leading to response lags in adjusting consumption to changes in desired demand. In a model that expresses changes in demand as a function of changes in income and other variables, Roistacher finds short-run income elasticities as low as 0.04-well below the range suggested by the static long-run estimates reviewed above and strongly suggesting major response lags. Similarly, deLeeuw and Ekanem estimate sizable response lags in adjusting consumption to exogenous changes, also suggesting that short-run and long-run parameters of housing demand are significantly different.
Mayo employs a “partial adjustment” model to estimate short and long run demand parameters for households participating in the Housing Al- lowance Demand Experiment and finds evidence of temporal adjustments to changes in demand that are roughly comparable to those estimated by deLeeuw and Ekanem- adjustment of actual consumption toward “desired
“‘See the Appendix for a derivation of this result.

112 STEPHEN K. MAYO
demand” occurs at a rate of from 20% to 25% per year.23 As a result it is estimated that changes in consumption are 90% “complete” only after from 8 to 10 years. Friedman and Weinberg test a number of alternative dynamic models of demand invoiving “partial adjustment”, “adaptive expectations,” and serial correlation of housing consumption for households that recently moved, and find that the data cannot distinguish among alternative dy- namic models for movers, although it is clear that moving itself is subject to considerable lags.
The work by Mayo and by Friedman and Weinberg suggest that under- standing residential mobility and the way that it is influenced by both changes in demand and transactions costs is perhaps the most important aspect of understanding the dynamic behavior of housing demand. In another analysis (Weinberg, Friedman, and Mayo) they estimate empirically a model that relates the probability of moving to the “income equivalent” of the net change in utility that would be occasioned by moving, and to a number of explicit transactions costs that vary among individuals- expected search costs, expected out of pocket moving costs, and the cost associated with surrendering any “good deal” that may exist as a result of market imperfections or tenant-landlord relations. In that analysis, one implication of the relatively low observed price and income elasticities of demand is that utility surfaces are rather “flat” with respect to changes in income and price, with the result that income equivalents of net changes in utility are small. That is, if disequilibrium arises in desired housing consumption, households are almost as well off remaining in disequilibrium as they would be by moving into equilibrium, despite what appear to be large changes in desired demand. In the face of even modest transactions costs, many moves are, as a result, deterred. It thus appears that for much of the population, disequi- librium in housing consumption must be substantial before moves are undertaken. As a result, long-run demand parameters may appear to be only tenuously related to short-run changes in housing demand and residen- tial mobility.
CONCLUSIONS
This review has indicated that for a wide range of analyses employing different data bases and methodologies, the permanent income elasticity of demand for housing is estimated to be well below one on average. Studies that have used data based on individual observations universally produce estimates below unity for both renters and owners. Studies that have used aggregated data fall into two groups- those whose estimates have been shown to be subject to aggregation and specification biases, which generally
23Mayo’s model is interpreted as a “mixed” dynamic model which allows both a Markov model of moving behavior and less than complete adjustment to equilibrium given that households move.

THEORY AND ESTIMATION IN HOUSING DEMAND 113
produce above unitary elasticities, and those that largely avoid such biases, which always produce income elasticity estimates below one. It has been shown in the literature that not only are aggregation biases serious in affecting demand elasticity estimates, but, fortunately, they are largely avoidable if proper precautions are taken. Price elasticity estimates, while subject to greater uncertainty than income elasticity estimates, appear to be less than one in absolute value.
Despite what appears to be an emerging consensus concerning the aver- age value of demand elasticities, as revealed by studies using log-linear demand equations, it has been implied that the field has been overly preoccupied with estimating “the” elasticity of demand. As suggested above, demand elasticities may vary with the level of both relative prices and income, with demographic variables, and depending on the time period over which demand functions are estimated. Analyses that have employed linear expenditure functions, which may be explicitly related to the Stone-Geary utility function, are theoretically better founded than the more ad hoc log-linear demand equations, often fit the data as well or better than other functional forms, and permit price and income elasticities to vary over a considerable range among the population. Not only does the Stone-Geary deserve more attention, but demand equations explicitly based on other utility functions deserve attention as well. Demographic variables, which have so far been only poorly integrated into theories of housing demand appear to have significant impacts on demand. It has been suggested that more fruitful understanding of the role of demographic variables can come from considering their roles in models of demand that are rooted in models of utility maximization rather than through ad hoc empiricism. Finally it has been suggested, on the basis of both limited theory and limited data, that response lags in housing demand are significant, are strongly connected residential mobility decisions, and cause short- and long-run parameters of housing demand to differ greatly. The dynamics of demand also deserve more attention than they have to date been afforded.
APPENDIX
Consider the Stone-Geary utility function with three goods-housing quality, Q; housing quantity (space), S; and other goods, Z:
u = (Q - 6,)~“( s - QB”( z - f&p
where& + & + & = 1. Maximize (A.l) with respect to the budget constraint
Y =p,Z+R, 64.2)

114 STEPHEN K. MAYO
where pz is the price of other goods (which may be normalized to one) and R is housing expenditures. Further let R be determined by a hedonic price equation which expresses housing expenditures as
R = QSy, O<y<l, (A.31
which indicates that expenditures change in proportion to housing quality, but that they change less than proportionately with housing quantity (e.g., the incremental “price” per unit of space declines as the amount of space increases). Substituting (A.3) into (A.2). the first-order conditions of the system are
upQ - -hSy -- Q-0, ’
UP, - -- S - es
-AyQSy-‘,
r.lpz - = -xp,, z - 8,
(A-4)
which, when combined, define the expansion paths of each good in terms of the others. In particular, two equations describe the expansion path of Z:
pz - PZ z=jgpy -eQB,sy +e,,
PZ Z = sQs7 - es+Qsy-l + ez. s s
Substituting (A.3), however, leads to
z=ZR-e &R+e PQ ‘PQ Q "
(A.61
(A.7)
64.8)
These two equations may be estimated efficiently by the “stacked regres- sion”:
Z = a,D,R + a,D,R + a,D,R/Q -I- a,D,R/S + T, (~4.9)
whichD, is a dummy variable which is equal to one if an observation pertains to Eq. (A.7) and zero if it pertains to Eq. (A.8), D2 is a dummy

THEORY AND ESTIMATION IN HOUSING DEMAND 115
variable which is equal to one if an observation pertains to Eq. (A.8) and zero if it pertains to Eq. (A.7); T is a constant. The parameters estimated by Eq. (A.9) fully identify the parameters Be, f$, e,, &, &, and & in the Stone-Geary equation.
REFERENCES Barton, D. M. and Olsen, E. O., “The Benefits and Costs of Public Housing in New York
City,” Institute for Research on Poverty, Madison, Wisconsin (October 1976). Carliner, G., Income elasticity of housing demand, Rev. Econ. Srutist., 55, No. 4 (November
1973). David, M. H., “Family Composition and Consumption,” North-Holland, Amsterdam (1962). deleeuw, F., The demand for housing-A review of the cross-section evidence, Rev. Econ.
Wrist., 53, No. 1, I- IO (February 1971). deleeuw, F. and Ekanem, N. F. Time lags in the rental housing market, Urbun Studies, 10,63,
67-68 (1973). Fenton, C., “The Permanent Income Hypothesis, Source of Income, and the Demand for
Rental Housing,” Analysis of Selected Census and Welfare Program Data to De- termine Relations of Household Characteristics, and Administrative Welfare Policies to a Direct Housing Assistance Program, pp. 3-l-3-52, Joint Center for Urban Studies, Cambridge, Mass. (July 1974).
Friedman, J., Mayo, S. K., and Weinberg, D. H., “A disequilibrium model of intraurban residential mobility,” mimeo, Abt Associates Inc., Cambridge, Mass. (May 1978).
Friedman, J. and Weinberg, D. H., “The Demand for Rental Housing: Evidence from the Housing Allowance Demand Experiment,” Abt Associates Inc., Cambridge, Mass. (July 1978).
Friedman, M. “A Theory of the Consumption Function,” Chap. 7, Princeton Univ. Press, Princeton, N.J. (1957).
Kain, J. F. and Quigley, J. M., “Housing Markets and Racial Discrimination: A Microeco- nomic Analysis,” Nat. Bur. Econ. Res., New York (I 976).
Lee, T. H., Housing and permanent income: Tests based on a three-year reinterview survey, Rev. Econ. Srurisr., 50, 487 ff. (November 1968).
Lee, T. H. and Kong, C. M., Elasticities of housing demand, Sourhern Econ. J., 43, 298-305 (October 1977).
Li, M. M., “An Analysis of Housing Consumption with Implications for the Design of a Housing Allowance Program,” Analysis of Selected Census and Welfare Program Data to Determine Relations of Household Characteristics, and Administrative Welfare Policies to a Direct Housing Assistance Program, pp. 5-222-5-284, Joint Center for Urban Studies, Cambridge, Mass. (September 1973).
Liviatan, N., Tests of the permanent income hypothesis based on a reinterview savings survey, in “Measurements and Economics: Studies in Mathematical Economics and Economet- rics” (C. F. Christ et al., Eds.), Stanford Univ. Press, Palo Alto (1963).
Lowry, I. S., DeSalvo, J. S., and Woodfill B. M., “Rental Housing in New York City, Volume II: The Demand for Shelter,” The New York City Rand Institute, New York (June 1971).
Maisel, J., Bumham, J. B., and Austin, J. S., The demand for housing: A comment, Rev. Econ. Srarisr., 53, No. 4., 410-413). (November 1971).
Maisel S. and Winnick, L., Family housing expenditures: Elusive laws and instrusive variances, in “Study of Consumer Expenditures, Incomes, and Savings, Proceedings of the Conference on Consumption and Savings, Volume I “(Irwin Friend and R. Jones, Eds.), pp. 359-435, Univ. of Pennsylvania Press, Philadelphia (1960).

116 STEPHEN K. MAYO
Mayo S. K., “Housing Expenditures and Quality, Part I: Housing Expenditures Under a Percent of Rent Housing Allowance,” Abt Associates Inc., Cambridge, Mass. (1977).
Merrill, S. R.,“ Draft Report on Hedonic Indices as a Measure of Housing Quality,” Abt Associates Inc., Cambridge, Mass. (1977).
Murray, M. P., “The distribution of tenant benefits in public housing,” Economet&u, 43, 771-788 (July 1975).
Murray, M. P., Shelter cost and disposable income. unpublished memo, Abt Associates Inc. (1978).
Muth, R. F., Moving costs and housing expenditures, J. Urban Econ.. 1, 108-125 (January 1974).
Muth, R. F., The derived demand for urban residential land, Urbun Studies, 8, No. 3, 243-254 (October 1971).
Nelson, D., “Income Elasticity of Housing Demand,” unpublished Ph.D. dissertation, Depart- ment of Economics, University of Oregon (1975).
Polinsky, A. M., The demand for housing: A study in specification and grouping, Econometrica, 45, 447-461 (March 1977).
Polinsky, A. M. and Elwood, D. M. “An Empirical Reconciliation of Micro and Grouped Estimates of the Demand for Housing,” Discussion Paper No. 567, Cambridge, Massachusetts, Harvard Institute of Economic Research (August 1977).
Pollak, R. A. and Wales, T. J., Estimation of complete demand systems from household budget data: The linear and quadratic expenditure systems, Amer. Econ. Rev., 68, 348-359 (June 1978).
Roistacher, E. A., Short-run housing responses to changes in income, Amer. Econ. Rw., 67, 381-386 (February 1977).
Rosen, H. Owner-occupied housing and the federal income tax: Estimates and simulations, mimeo, Princeton University (February 1977).
Smith, B. and Campbell, J. M., Jr., Aggregation bias and the demand for housing, mimeo, University of Houston/University of Chicago (1976).
Straszheim, M. R., Estimation of the demand for urban housing services from household interview data, Rev. Econ. Statist., 55, l-8 (February 1973).
Struyk. R. J., “Urban Homeowner&p,” Lexington Books, Lexington, Mass. (1976). U.S. Department of Housing and Development, “1976 Statistical Yearbook, US. Government
Printing Office, Washington, D.C. (1976). Vaughn, G. A., Sources of downward bias in estimating the demand income elasticity for urban
housing, J. Urban Econ., 3, 45-56 (January 1976). Weinberg, D. H.. Friedman, J., and Mayo, S. K. Intraurban residential mobility: The role of
transactions costs, market imperfections, and household disequilibrium, unpublished paper, Abt Associates Inc. (1979).