Embed Size (px)
Citation preview

International Journal of Science and Engineering Applications
Volume 5 Issue 7, 2016, ISSN-2319-7560 (Online)
www.ijsea.com 355
Theoretical Study on Mechanism for the Reaction of 2-
propargyl radical (C3H3) with ammonia (NH3)
Tien V. Pham
School of Chemical Engineering
Hanoi University of Science and Technology
Hanoi City, Vietnam
Hue M. T. Nguyen
Faculty of Chemistry
Hanoi National University of Education
Hanoi City, Vietnam
Abstract: A theoretical study of the mechanism and kinetics of the reaction of 2-propargyl radical, H2CCCH, with ammonia, NH3, has
been carried out by ab initio molecular orbital theory based on CCSD(T)/6-311++G(3df,2p)//B3LYP/6-311++(3df,2p) method. The
potential energy surface (PES) for the C3H3 + NH3 reaction was established, showing that the reaction has four principal entrance
channels. Two H-abstraction reactions from NH3, leading to propyne or allene + NH2. The addition reactions start by formation of two
intermediates H2CCCHNH3 and H2CC(NH3)CH. From these two intermediate states, many other transition states and intermediate
states can be accessed, leading to 21 possible products. The reaction has sizable entrance energy barriers, though the H-abstraction
entrance channels might contribute significantly at high temperatures, where formation of HCCCH3 + NH2 is more energetically
favorable.
Keywords: Reaction mechanism, propargyl radical, ammonia, DFT, PES.
1. INTRODUCTION Free radicals exhibit high chemical reactivity and
diversities. They can react with atoms, molecules or other
radicals. Propargyl (C3H3) is a free radical reserved much
concern over the last two decades. It is known to play an
important role in chemistry due to the following reasons: i) it
is the first chemical species containing three carbon atoms
found in interstellar medium. ii) It is an important
intermediate in combustion processes. For example, it occurs
with relatively significant concentration in the flames of
acetylene, butadiene and benzene as well as in the
decompositions of hydrocarbons in mass spectrometry.[1-3]
iii) It is also the most important precursor in the formation of
single and polycyclic aromatic hydrocarbons (PAHs) as well
as of soot particles. For example, the recombination reaction
of two propargyl radicals to yield benzene or phenyl radical
(C6H5) which are viewed as fundamental molecules to form
PAHs and soot. As small aromatic radicals such as phenyl,
phenylvinyl (C6H5C2H2), naphthyl (C10H7), and their
derivatives are believed to play a pivotal role in the formation
of naphthalene (C10H8) by HACA (H-abstraction, C2H2-
addition) reactions and cyclization reactions. The repetition of
such a successive abstraction/addition/ cyclization process
involving increasingly larger aromatic radicals has been
proposed as a possible route to the formation of PAHs which
give rise to soot.2,3 iv) It also takes part in the chemical
changing process of oxides of nitrogen (NOx) and carbon
(COx) quickly and effectively.3 The high reactivity of C3H3
allows it to react with species which have sustainable closed
shell such as H2O, CO, CO2, NH3, and so on.[4,5]
The formation of C3H3 has been clarified by many
previous theoretical and experimental works.2-7 There
havebeen investigations, both theoretically and
experimentally, about the reaction of propargyl radical with
other species in the interstellar medium and in combustion
systems, including the self-reaction with another propargyl
radical, with elements such as H, O(3P), C(3P), or with other
hydrocarbon radicals such as CH3.8-13 The mechanisms of
reactions between propargyl radical with O2, H2O, NO, CO,
HCNO, OH, H, CH3, and C3H3 were investigated by our
group using density functional theory.5 Reactions of propargyl
radical with atoms or with other free radicals usually occur
rapidly without energy barriers.2-4 In contrast, reactions of
propargyl with neutral molecules usually have energy
barriers.10,11,19
There are two reasons why we choose the propargyl
radical to study. Firstly, the reactions of propargyl with the
oxides of nitrogen NOx, which are important in processes such
as thermal DeNOx (Process for reducing NOx emission), NOx-
OUT (Process for reducing NO from fossil-fueled and waste-
fueled stationary combustion sources), RAPRENOx (Rapid
reduction of nitrogen oxides) and NO-reburning, are
foreshadowed to be barrier-free leading to primary nitroso and
nitro derivatives that further undergo a variety of
transformations.8-12 Secondly, the main reaction pathways of
propargyl radical with either the hydrogen compounds or the
hydrocarbons involves a hydrogen abstraction yielding C3H4
whose energy barrier is consistently low.13-14,19-25 As far as we
are aware, little is actually known about the reactions of C3H3
with other simple molecules such as ammonia and hydrogen
halides. In view of such scarcity of quantitative information,
and in relation to our continuing study on the chemistry of
propargyl radical, we set out to investigate the reaction of
C3H3 with ammonia (NH3). Because we know that
gasification of solid fuels such as coal, biomass and peat
results in a fuel gas containing high concentrations of NH3.
This ammonia may give rise to high NOx emissions when the
fuel gas is burned. In addition, ammonia is also known to be
released from the processes using urea in agriculture. More
recently, various workers have measured the ammonia lost
from urea applied to the surface of soils. Ernst and Massey
(1960) shown that initial soil moisture increased process of
losing NH3 from surfaced-applied urea. The ammonia will
likely escape to the atmosphere according to the following
reaction:
(NH2)2CO + H2O + urease → NH3 + H2NCOOH →
2NH3(gas) + CO2(gas)

International Journal of Science and Engineering Applications
Volume 5 Issue 7, 2016, ISSN-2319-7560 (Online)
www.ijsea.com 356
where, Urease is a naturally occurring enzyme that
catalyzes the hydrolysis of urea to unstable carbamic acid.
Rapid decomposition of carbamic acid occurs without enzyme
catalysis to form ammonia and carbon dioxide.26,27 Moreover,
the environment with pH around 9.0 may cause soils around
the applied urea particle to increase ammonia volatilization.
The amount of ammonia volatilization depends on several
environmental factors, including temperature, pH, and the soil
water content. 28-31
In this study, we have theoretically mapped out the
potential energy surface (PES) describing the C3H3 + NH3
reacting system, in order to obtain essential information on the
reaction rates and products distribution.
2. COMPUTATIONAL METHODS We have characterized the mechanism of the reaction
between C3H3 and NH3 by quantum-chemical calculations
based on the density functional theory (DFT) with the popular
hybrid B3LYP functionals in conjunction with the dp-
polarized plus diffuse functions 6-311++G(3df,2p) basis set.15-
18 Vibrational frequencies and zero-point vibrational energies
(ZPVE) corrections are obtained at the same level of theory.
The stationary points were identified for local minima or
transition states according to their vibrational analysis in
which the reactants, intermediates, and products possessed all
real frequencies, whereas a transition state and only one
imaginary frequency. Transition states were then verified by
IRC for the connectivity of the reactants and products.
In order to further improve the relative energies for all the
species, single-point energy calculations were then computed
using the coupled-cluster level of molecular orbital theory,
incorporating all the single and double excitations plus
perturbative corrections for the triple excitations, CCSD(T)/6-
311++G(3df,2p), corrected for ZPE. Geometries of all species
in this system have been optimized by means of the Gaussian
09 software package.19 The predicted full PES of the C3H3 +
NH3 system is presented in figure 1S of the Supporting
Information (SI)32 and the energetically low-lying reaction
paths are shown in figure 4.
3. RESULTS AND DISCUSSION
3.1 Reactivity prediction In order to determine the dominant channels in the reaction
system of C3H3 with NH3, we calculated and analyzed the
energies of critical molecular orbitals (MO) which are shown
in table 1.
Table 1. Energy values of HOMO and LUMO at the
CCSD(T)/6-311++G(3df,2p) level
E
(HOMO)
(eV)
E
(LUMO)
(eV)
E(LUMO-HOMO)
(eV)
C3H3
-0.35631
(HOMO)
0.03930
(LUMO)
C3H3() –
NH3() 0.46734
-0.39201
(HOMO)
0.04206
(LUMO)
C3H3() –
NH3() 0.47010
NH3
-0.42804
(HOMO)
0.04349
(LUMO)
NH3()–
C3H3() 0.39980
NH3() –
C3H3() 0.43550
Application of the frontier molecular orbital (FMO) theory to
compute the energy values between the HOMO and LUMO
(E). The results in table 1 point out that the minimum energy
value (E) corresponds with the LUMO-α energy level of
NH3 and the HOMO- energy level of C3H3. Therefore, when
the reaction takes place, electron density will move from C3H3
radical to NH3 molecule to saturate valence state. These
results are appropriate to form the sigma bonds in yielding the
intermediates such as IS1 and IS5. The images of frontier
orbitals are displayed in figure 1.
C3H3 NH3
HOMO LUMO
HOMO LUMO
Figure 1. Images of HOMO and LUMO of C3H3 and NH3
3.2 Potential energy surface and reaction
mechanism The optimized geometries of the intermediates, transition
states and products at the B3LYP/6-311++G(3df,2p) level are
shown in figure 2a and figure 2b. The detailed potential
energy surface obtained at the UCCSD(T)/6-
311++G(3df,2p)//B3LYP/6-311++G(3df,2p) level is
presented in figure 1S (see the Supporting Information), and
the important reaction channels of the potential energy surface
are simplified and shown in figure 3.
The scheme of the C3H3 + NH3 reaction is presented in
figure 2S of the SI. Theoretical prediction of relative energies
E (kcal/mol) for reactants, intermediates, transition states,
and products of the reaction in different levels of theory are
listed in table 2. Table 3 shows a comparison of calculated
heats of reaction for the C3H3 + NH3 system with available
experimental data. In the SI, table 1S shows Gibbs free
energies (G) and entropies (S) for different conditions,
table 2S lists harmonic vibrational frequencies of the species
considered, table 3S contains their cartesian coordinates and
table 4S mentions theoretical predication of single point
energy and ZPVE for reactants, intermediates, transition
states, and products of the C3H3 + NH3 reaction in two
different levels. To help us understand the low-energy
reaction pathways for the C3H3 + NH3 system, we only
concentrate on analyzing the main reaction channels
illustrated in figure 3.

International Journal of Science and Engineering Applications
Volume 5 Issue 7, 2016, ISSN-2319-7560 (Online)
www.ijsea.com 357
Table 2. Relative energies (kcal/mol) of all the stationary points considered.
Structures
B3LYP/
6-311++G(3df,2p)
CCSD(T)/
6-311++G(3df,2p) Structures B3LYP/
6-311++G(3df,2p)
CCSD(T)/
6-311++G(3df,2p)
C3H3 + NH3 (1) 0.0 0.0 T8/P3 22.15 21.84
H2CCCHNH2 + H (P1) 32.51 27.31 T8/12 23.65 20.93
HCCCH3 + NH2 (P2) 17.09 14.21 T4/3 34.58 34.34
H2CCCH2 + NH2 (P3) 15.67 15.05 T0/P3 21.96 26.14
H2CCCHNH + H2 (P4) 12.03 12.75 T6/7 90.00 85.57
H2CCHCNH2+H (P5) 49.80 42.62 T9/P6 22.84 18.71
H2CCHCHNH + H (P6) 18.11 9.75 T1/4 42.51 41.99
H3CCCNH2+H (P7) 33.63 26.87 T1/3 39.09 37.08
CH3NH2+C2H (P8) 62.97 56.13 T4/P6 18.39 12.98
H2CCCH3+NH (P9) 122.43 113.07 T3/P1 33.34 31.40
H2CNH2 + C2H2 (P10) 18.94 16.72 T17/P15 11.99 11.5
H2CCNH + CH3 (P11) 4.25 4.83 T3/P4 54.94 56.91
HCCNH + CH4 (P12) 0.08 2.18 T3/P7 34.96 32.00
H3CCN + CH3 (P13) -17.8 -22.97 T1/6 94.11 93.35
C2H4 + CNH2 (P14) 27.22 25.34 T7/P5 59.25 59.16
C2H4 + HCNH (P15) 4.98 3.38 T5/8 42.73 40.06
C2H5 + HCN (P16) -9.8 -15.35 T4/9 21.59 19.54
C2H5 + CNH (P17) 3.08 -1.67 T3/P2 23.36 21.63
C2H2+HCNH3 (P18) 86.21 82.24 T12/P12 87.57 87.64
H3CCH2CN + H (P19) -0.13 -11.81 T4/10 34.05 34.51
cyc-HCCHNHCH2+H (P20) 42.14 31.19 T10/11 49.79 45.94
HCCCH2NH2+H (P21) 40.12 30.27 T11/20 54.02 51.56
I1 34.69 35.51 T11/P10 28.97 28.09
I3 -3.5 -6.46 T10/P3 21.31 22.31
I4 -30.72 -31.66 T12/13 13.05 8.52
I5 40.33 37.36 T13/P13 -5.3 -10.22
I6 54.4 51.87 T4/14 36.55 35.14
I7 34.18 30.64 T16/17 14.43 12.41
I8 -27.51 -30.46 T14/P5 55.41 52.37
I9 -6.28 -11.33 T14/P14 35.49 33.53
I10 2.6 -1.73 T3/15 38.65 37.38
I11 5.39 -0.16 T3/16 31.72 30.62
I12 -27.42 -31.70 T6/P18 89.38 86.3
I13 -30.16 -35.95 T15/18 48.48 45.85
I14 20.06 15.30 T1/20 103.18 98.28
I15 -7.76 -10.89 T16/18 24 23.05
I16 -28.73 -31.45 T11/21 45.31 41.11
I17 -12.99 -18.74 T20/P21 45.43 42.25
I18 -15.36 -19.57 T18/P19 4.64 -0.70
I19 -24.88 -30.72 T17/18 24.3 21.42
I20 41.77 38.19 T21/P20 46.59 42.04
I21 43.03 37.72 T15/16 33.6 31.31
T0/5 40.29 39.62 T16/19 18.93 14.17
T0/P2 23.29 23.94 T16/18 22.09 21.15
T0/1 34.15 36.62 T19/P19 4.7 -2.24
T1/P1 39.39 41.29 T19/P16 -1.76 -6.64
(a) The addition pathways. It can be seen from figure 3,
there are two addition entrance channels of the reactants.
Addition of NH3 onto C3H3 is possible at two carbon atoms.
The attack at the central carbon, giving rise to an intermediate
I5(H2C=C(NH3)-CH) through TS1, occurs without a pre-
association complex and with a high energy barrier of 39.6
kcal/mol. This process is predicted to be endothermic by
37.36 kcal/mol with a tight transition state. The C-N distance
in TS1 (see in figure 2b) is quite long (1.8 Ǻ), which is
suitable with structure of a transition state. From the
intermediate I5, an isomeric intermediate I8 (H2C=C(NH2)-
CH2) was formed via a H-migration transition state TS21 with
the energy barrier of 2.7 kcal/mol. Conformer I8 lies below the
reactants by 30.46 kcal/mol. Once I8 is formed, it can be
converted in two ways, namely (i) a NH2-loss giving allene
(H2C=C=CH2) P3 by crossing through the transition state TS5
(shown in figure 2b) with an 21.84 kcal/mol barrier above the
reactants, and (ii) a 1,7-H-shift yielding I12 (H3C-C(NH)=CH2,
-31.7 kcal/mol) via TS6 overcoming an energy barrier of
51.39 kcal/mol. The lower TS of the two, TS6, still lies 20.93
kcal/mol above the energy of the free reactants. The formation
of the product P3 (H2C=C=CH2 + NH2) from the channel

International Journal of Science and Engineering Applications
Volume 5 Issue 7, 2016, ISSN-2319-7560 (Online)
www.ijsea.com 358
passing through three transition states (TS1, TS21, TS5) and
two intermediate states (I5, I8) is endothermic by 15.05
kcal/mol. Following the formation of I12, there are two
reaction channels, of which one goes directly to products P11
(H2CCNH + CH3) without an exit energy barrier, while the
other takes place via transition state TS31 at 8.52 kcal/mol
above the reactants, forming intermediate I13 (H3C-C(N)-
CH3, which is by far the lowest-energy isomer of the PES at -
35.95 kcal/mol. I13, however, is relatively unstable with
respect to a C-C bond cleavage via TS32 (-10.22 kcal/mol)
producing P13 (H3CCN + CH3, -22.97 kcal/mol), the lowest-
lying fragment products.
The data in figure 3 shows that the energy of product P13
(-22,97 kcal/mol) is lower than that of the product P11 (4.83
kcal/mol) by 27.8 kcal/mol, but the pathway producing P13
has to pass through many high energy barriers. Thus, the
product P11 is more easily formed while P13 is the most stable
one compared to all others of the PES.
Table 3. Comparison of Calculated Heats of Reaction for C3H3 + NH3 with Experimental Data.
Species
B3LYP/6-
311++G(3df,2p) (kcal/mol)a
CCSD(T)/6-
311++G(3df,2p)
(kcal/mol)a
Experiment (*)
(kcal/mol)
H2CCCHNH2+H (P1) 32.15 26.95 ---
HCCCH3+NH2 (P2) 17.82 14.12 14.01±1
H2CCCH2+NH2(P3) 15.49 14.87 15.74±1
H2CCCHNH+H2(P4) 12.36 12.81 ---
H2CCHCNH2+H (P5) 49.30 42.12 ---
H2CCHCHNH+H (P6) 17.48 9.12 ---
H3CCCNH2+H (P7) 33.24 26.48 ---
H2CNH2+C2H2(P10) 18.56 16.34 16.93±0.2
H2CCNH + CH3(P11) 4.09 4.67 ---
HCCNH + CH4(P12) 0.04 2.14 ---
H3CCN + CH3(P13) -17.96 -23.13 -21.49±2
C2H4 + CNH2(P14) 26.67 24.79 ---
C2H4 + HCNH (P15) 4.42 2.82 ---
C2H5 + HCN (P16) -10.04 -15.59 -14.91±0.7
C2H5+CNH (P17) 3.16 -1.59 -0.06±1.5
H3CCH2CN + H (P19) -0.63 -12.30 -9.48±2
cyclo-HCCHNHCH2+H (P20) 41.04 30.09 ---
HCCCH2NH2 + H (P21) 39.76 29.92 --- a The exothermicity for the formation of C3H3 + NH3 was calculated on the basic of the experimental heats of formation at 0 K,
(*) from reference.19
Attackon the terminal carbon of C3H3, is initiated by
formation of a pre-reactive complex, followed by a high
energy barrier TS3 of 36.62 kcal/mol, yielding I1
(H2C=C=CH-NH3, 35.51 kcal/mol). The distance of 1.63 Ǻ
for the C-N bonding TS3 (see in Fig. 2b) is now much shorter
than that in TS1 above. In both cases of the initial addition
reaction paths, the attack angle is around 105-118o and the
ammonia moiety apparently exhibits a similar configuration.
As shown in figure 3, the I1 intermediate can first isomerize to
I3 (H3C-C=CH-NH2, - 6.46 kcal/mol) via TS13 with a small
1.57 kcal/mol barrier; followed either by isomerization to the
open-chain I16 (H3C-CH=CH-NH, - 31.45 kcal/mol) via the
1,4-H-shift TS38 with a rather high 37.08 kcal/mol barrier, or
by fragmention to product P2 (HCCCH3 + NH2) by breaking
the C-N bond via TS23 with a barrier of 28.09 kcal/mol. The
overall exothermicity of the process leading to the product P2
is -14.21 kcal/mol. From intermediate I16, there are three other
isomerization channels, leading to intermediates I17 (H2C-
CH2-CH=NH), I18 (H3C-CH2-C=NH), and I19 (H3C-CH2-
CH=N) with isomerization barriers of 43.86, 52.6, and
45.62kcal/mol, respectively. A 1,4-H shift connects I17 and I18
with the energy barrier via TS47 of 40.16 kcal/mol, where the
angle N-C-C changes slightly from 123° in I17 to 137° in I18.
I17 fragmentation over the 30.24 kcal/mol barrier height of
TS16 produces product P15 (C2H4 + HCNH) with 3.38 kcal/mol
of endothermicity. In figure 3, one sees that product P19 (H3C-
CH2-CN + H) can be formed in two ways; one taking place
via the intermediate I18, while the other via the intermediate
I19. The energy of the transition state TS54 in the first path is
lower than that of TS46 in the latter by only 1.54 kcal/mol.
Furthermore, two products, namely P16 (C2H5 + HCN) and P17
(C2H5 + CNH), can also form from I19 and I18, respectively.
P17 was produced directly from I18 without any exit energy
barrier, whereas the product P16 was produced by the C-C
bond-breaking process with anenergy barrier of 6.46
kcal/molbelow the entrance point. It is clear that product P16 is
more stable than product P17. Formation of both of these is
exothermic with relative energies of -15.35 kcal/mol and -1.67
kcal/mol, respectively. The I1 intermediate formed in the
current addition reaction can also undergo isomerization to
another isomer I4 (H2C=CH-CH-NH2, -31.66 kcal/mol,) via
TS12 with a 6.48 kcal/mol barrier. This barrier is higher than
that of the earlier process forming the isomer I3 with only 1.57
kcal/mol barrier height. This thelatter path is therefore
expected to contribute less significantly. The I4 intermediate
further dissociates to product P6 (H2CCHCHNH + H) via TS14
with a 12.98 kcal/mol barrier above the reactants. I4 can also
isomerizes to I9 (H2C=CH-CH2-NH, -11.33 kcal/mol) by a
1,7-H shift via TS22 with 19.54 kcal/mol above the entry
point, and then breaking the C-H bond in I9 forming the same
product P6 via TS11 costing 30.04kcal/mol energy. The
isomerization transition state (TS7) between I4 and I3 is also

International Journal of Science and Engineering Applications
Volume 5 Issue 7, 2016, ISSN-2319-7560 (Online)
www.ijsea.com 359
located; its energy is 34.34 kcal/mol higher than that of the
reactants.
We can see that both of the addition pathways illustrated
in figure 3 can produce many different products. The entrance
transition structure, TS1 (39.62 kcal/mol), is found to be
higher in energy than TS3 (36.62 kcal/mol); accordingly, it is
concluded that the latter pathway takes place relatively faster
than the former. As both these transition states are high in
energy, all products formation through these two channels is
controlled mainly by TS1 and TS3, and is expected to be
kinetically unfavorable.
I1
I3
I4
I5
I6
I7
I8
I9
I10
I11
I12
I13

International Journal of Science and Engineering Applications
Volume 5 Issue 7, 2016, ISSN-2319-7560 (Online)
www.ijsea.com 360
I14
I15
I16
I17
I18
I19
I20
I21
P1
P2
P3
P4
P5 P6 P7
International Journal of Science and Engineering Applications
Volume 5 Issue 7, 2016, ISSN-2319-7560 (Online)
www.ijsea.com 361
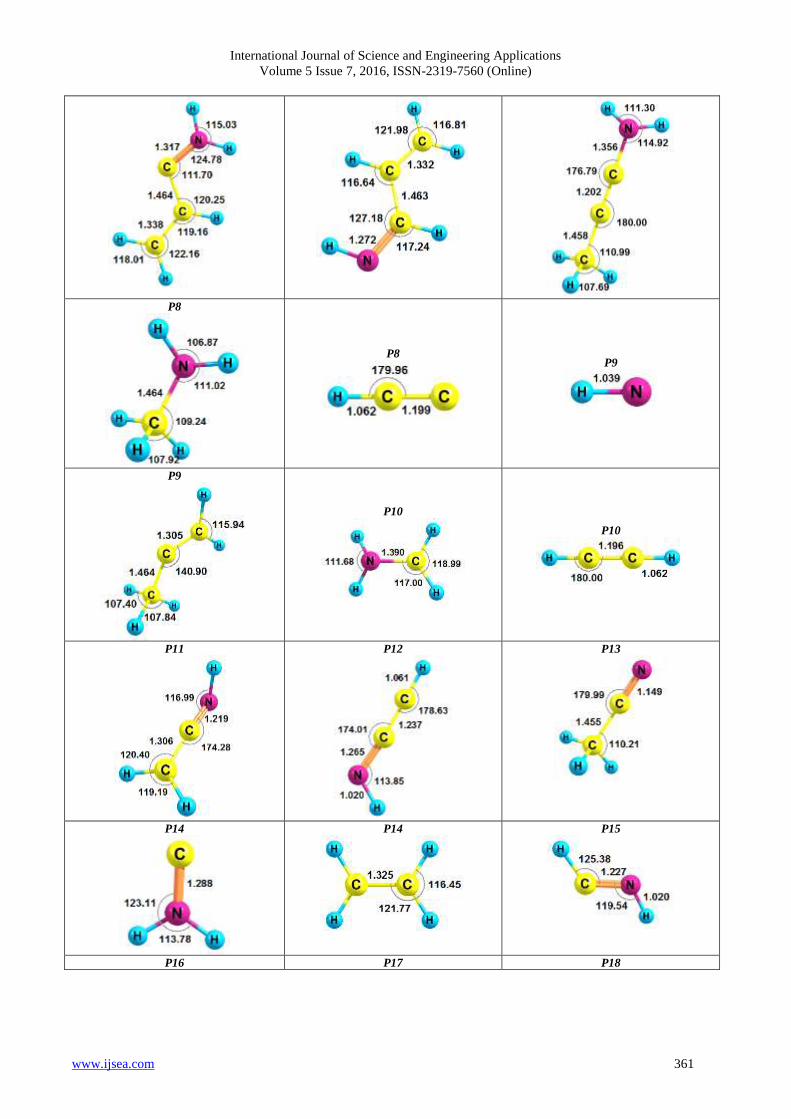
P8
P8
P9
P9
P10
P10
P11
P12
P13
P14
P14
P15
P16 P17 P18

International Journal of Science and Engineering Applications
Volume 5 Issue 7, 2016, ISSN-2319-7560 (Online)
www.ijsea.com 362
P19
P20
P21
Figure 2a. Optimized geometries of the intermediate states and products involved in the reaction of C3H3 + NH3 at the B3LYP/6-
311++G(3df,2p) level. (The bond lengths are given in angstroms and angles in degrees).
T0/5
T0/P2
T0/1
T1/P1
T8/P3
T8/12
T4/3
T0/P3
T6/7
International Journal of Science and Engineering Applications
Volume 5 Issue 7, 2016, ISSN-2319-7560 (Online)
www.ijsea.com 363
T9/P6
T14
T1/3
T4/P6
T3/P1
T17/P15
T3/P4
T3/P7
T1/6
T7/P5
T5/8
T4/9
T3/P2
T12/P12
T4/10
International Journal of Science and Engineering Applications
Volume 5 Issue 7, 2016, ISSN-2319-7560 (Online)
www.ijsea.com 364
T10/11
T11/20
T11/P10
T10/P3
T12/13
T13/P13
T4/14
T16/17
T14/P5
T14/P14
T3/15
T3/16
T6/P18
T15/18
T1/20
International Journal of Science and Engineering Applications
Volume 5 Issue 7, 2016, ISSN-2319-7560 (Online)
www.ijsea.com 365
T16/18
T11/21
T20/P21
T18/P19
T17/18
T21/P20
T15/16
T16/19
T16/18
T19/P19
T19/P16
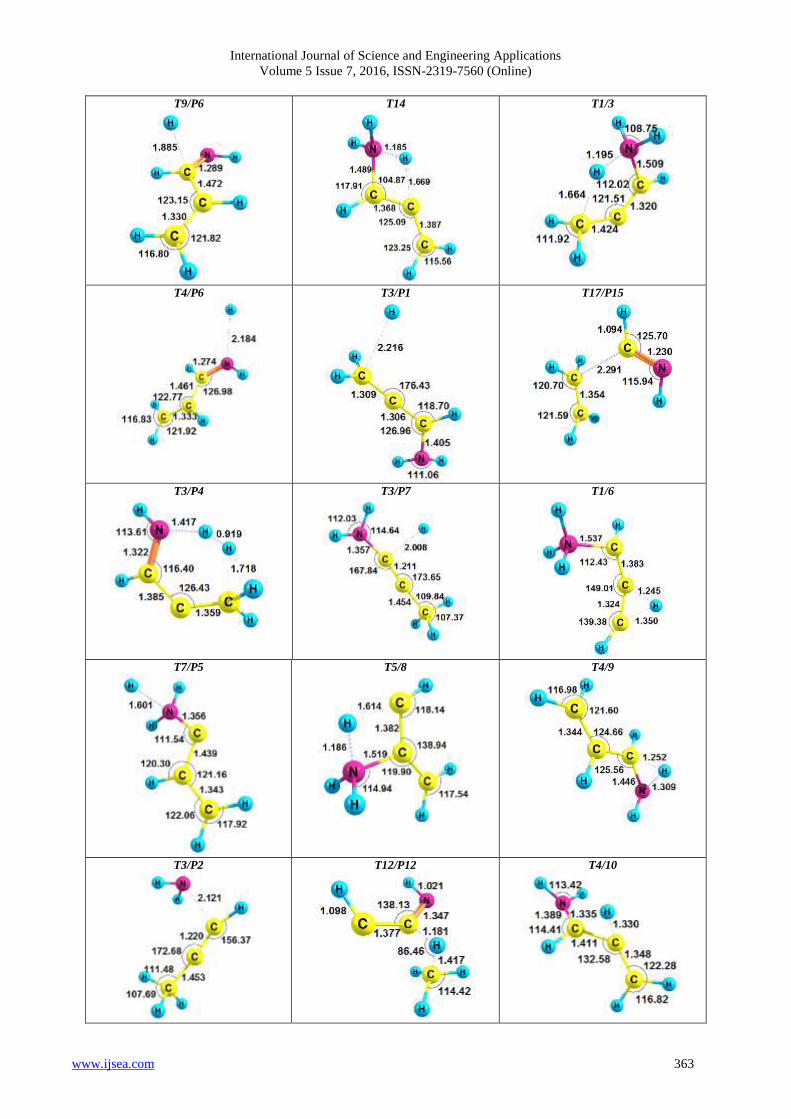
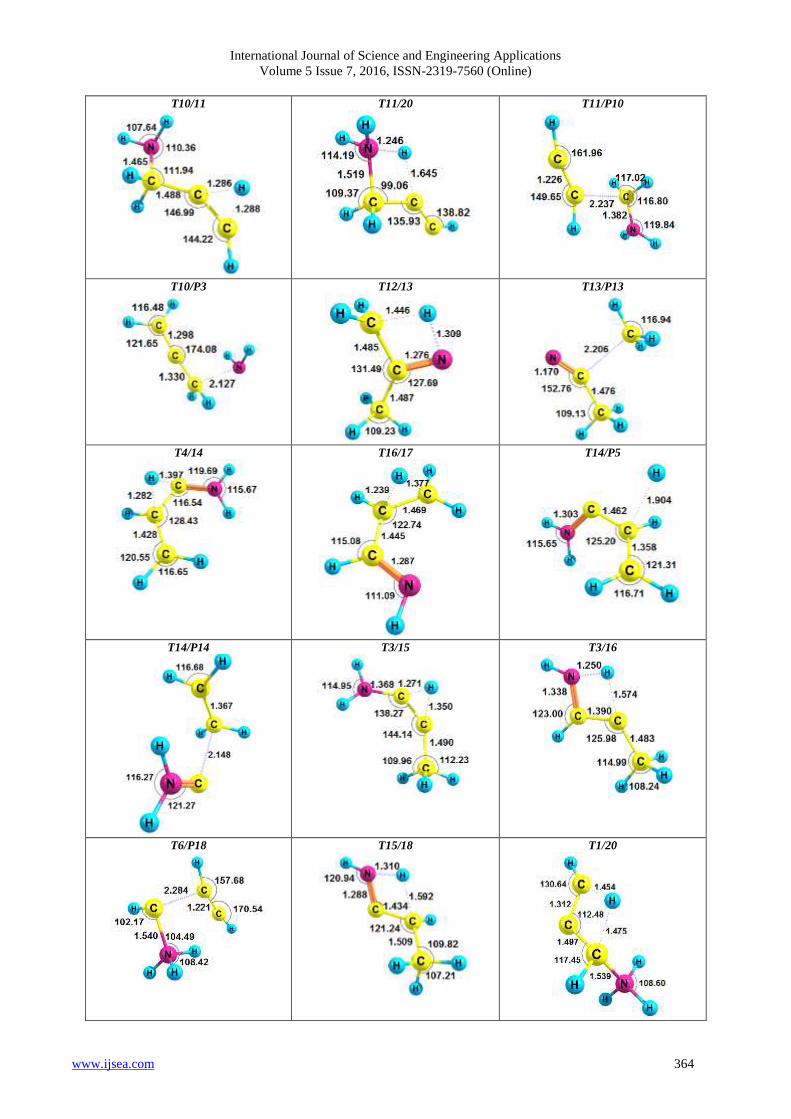
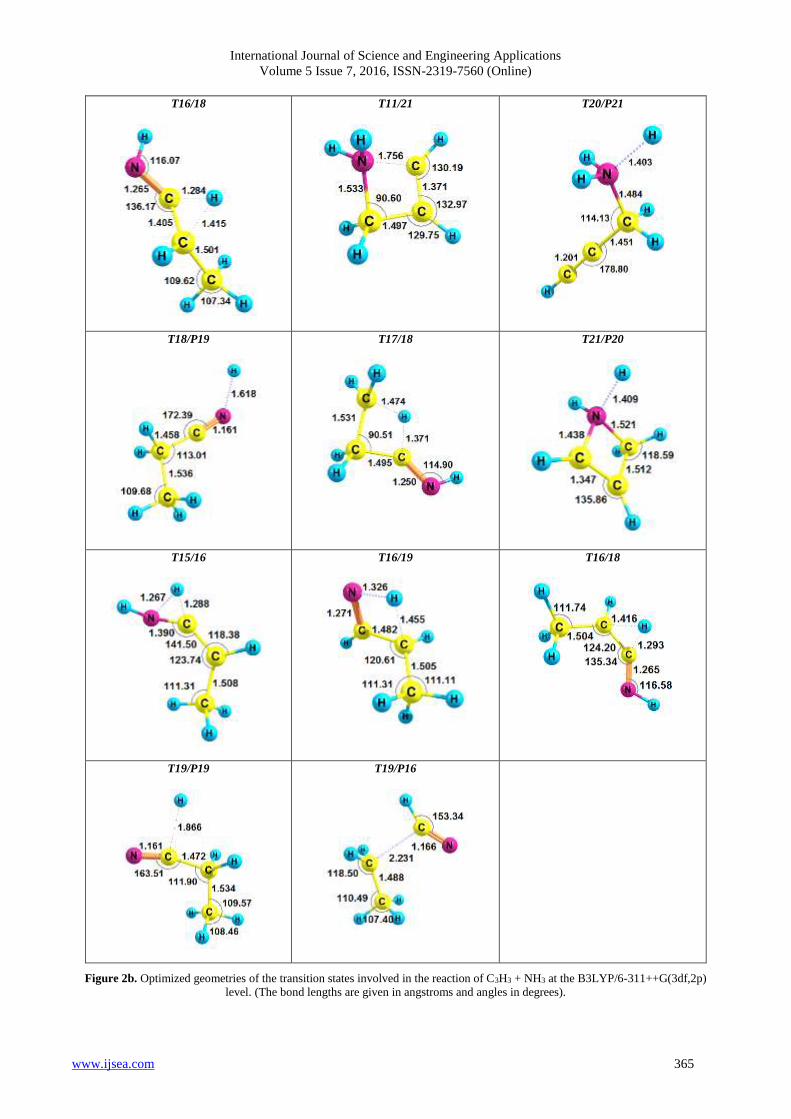
Figure 2b. Optimized geometries of the transition states involved in the reaction of C3H3 + NH3 at the B3LYP/6-311++G(3df,2p)
level. (The bond lengths are given in angstroms and angles in degrees).

International Journal of Science and Engineering Applications
Volume 5 Issue 7, 2016, ISSN-2319-7560 (Online)
www.ijsea.com 366
(b) The hydrogen abstraction pathway. The figure 4 shows
that H-abstraction takes place in two channels. The first
abstraction channel creates P2 via only one transition state TS2
with an energy barrier of 23.94 kcal/mol. Although not
having a pre-reactive complex at the beginning of this
pathway, the products are formed in a complex with a relative
energy value of 12.39 kcal/mol above the energy of the free
reactants, before separating without an exit barrier. In the
structure of TS2 (see in figure 2b), when the molecular
ammonia approaches the propargyl radical, one of three
hydrogen atoms abstracts from ammonia at the distance of
1.374 Å to bond with the carbon atomat the distance of 1.256
Ǻ. In this case, the bond lengths of N…H and C…H are
longer than the experimental bond lengths of them33 about
0.355 and 0.166 Ǻ, respectively. The latter is slightly stable
with respect to the separated fragments P2 (HCCCH3 + NH2,
14.21 kcal/mol). The distance between H and N in the Com1
is elongated by 1.459Å when going from the TS2 to Com1.
The complex further dissociates to P2 without transition state.
Moreover, it is easy to realize that, the product P2 is also
produced by the additional reaction mechanism as discussed
above. Comparing these two mechanisms, one finds that,
relatively, the latter mechanism takes place more readily than
the former mechanism.
Product P3 is formed by the second abstraction channel
through transition structure TS8 (shown in Figure 2b) with an
energy barrier of 26.14 kcal/mol. In the geometry of TS8, the
distances of N…H and C…H are calculated to be about 1.347
and 1.259Å, respectively; the angle C-C-H changes by more
than 61º from 180º in C3H3 to 128.42º in TS8, which suggests
that this transtion is a critical motion in this transition state,
and relates to the re-hybridisation of the carbon atom from sp
to sp2. Dissociation to the separated products H2CCCH2 +
NH2 (P3) occurs by anextremely small dissociation energy of
0.7kcal/mol compared to the complex (H2C=C=CH2…NH2,
14.35 kcal/mol). In this process there is no exit barrier for the
loose bond cleavage. In the final product, the newly formed C-
H bond length is shortened to 1.08 Å in H2CCCH2. Formation
of product, H2CCCH2 + NH2, is found to be endothermic by
15.05 kcal/mol at the CCSD(T)/6-311++G(3df,2p)//B3LYP/6-
311++G(3df,2p) level.
It is obvious that formation of product P2 via TS2 is more
favorable than product P3 formed through TS8.
The results given above clearly demonstrate that the
hydrogen abstraction is preferred over the additional reaction.
Figure 3. The simplified potential energy surface of the C3H3 + NH3 reaction. Energies are in units of kcal/mol calculated at the
CCSD(T)/6-311++G(3df,2p)//B3LYP/6-311++G(3df,2p) + ZPVE level.
4. CONCLUSION
By application of the density functional theory, we have
optimized geometric structures of reactants, intermediate
substances, transition states, and products of the C3H3 + NH3
reaction system, based on the CCSD(T)/6-
311++G(3df,2p)//B3LYP/6-311++G(3df,2p) methods.
In the present theoretical study, we have mapped in detail
the [C3H6N] potential energy surface, with emphasis on the
sections guiding the four main reaction routes for the C3H3 +
NH3 reaction, namely the hydrogen abstractions and addition
reactions. Calculated results indicate that products of this
reaction can be P1 to P21 as shown in the full PES. The
formation of P2 (HCCCH3 + NH2) is the most energetically
favorable. However, the product H3CCN + CH3 (P13) is the
most stable product in energy. Calculated enthalpies of

International Journal of Science and Engineering Applications
Volume 5 Issue 7, 2016, ISSN-2319-7560 (Online)
www.ijsea.com 367
formation for five reaction pathways P2, P3, P10, P13, P16, P17,
and P19 are in good agreement with experimental data, which
suggests that the theoretical methodology is reliable.
We find that the hydrogen abstraction is expected to
dominate at all temperatures. However, due to its rather
lower-lying energies of products, the addition emerges as a
novel channel that could contribute significantly at higher
temperatures.
In terms of thermodynamics, all products of this reaction
are possible to present at the investigated condition. This
study is a contribution to the understanding of the reaction
mechanisms of the propargyl radical with many small radicals
and molecules in the atmosphere and combustion chemistry.
5. ACKNOWLEDGMENTS We thank the National Foundation for Science and
Technology Development (Nafosted), Vietnam, which has
sponsored this work.
6. REFERENCES
[1] J. A. Miller, M. J. Pilling, and J. Troe, Proc. Combust.
Inst. 2005, 30, 43-88.
[2] Wei QuanTian, Yan Alexander Wang;J. Org. Chem.
2004, Vol.69 (13), 4299-4308.
[3] Ikchoon Lee, Chan Kyung Kim, Bon-Su Leea,Tae-Kyu
Ha; J. Mol. Struct. (Theochem).1993, 279, 191-205.
[4] S. R. Schofield,N. J. Curson, M. Y. Simmons, O.
Warschkow, N. A. Marks, H. F. Wilson, D. R.
McKenzie, P. V. Smith, M. W. Radny; e-J. Surf.Sci.
Nanotech.2006, Vol. 4, 609-613.
[5] HemaMunjal, K L Baluja; J. Phys. B: At.Mol. Opt.
Phys.2007, 40, 1713.
[6] Michael D. Hoops and Bruce S. Ault; The Journal of
Physical Chemistry A. 2008, 112 (24), 5368-5377.
[7] S. J. Klippenstein, J. A. Miller, and A. W. Jasper, J.
Phys. Chem.A, 2015, 119 (28), 7780.
[8] Ya A Dorfman, I M Yukht, L V Levina, G S
Polimbetova, T V Petrova, V S Emelyanova; Russ.
Chem. Rev.1991, 60, 605.
[9] Peter A. Hamilton and Timothy P. Murrells; J. Chem.
Soc., Faraday Trans. 1985, 2, 81, 1531-1541.
[10] Adam J. Delson, Bruce S. Ault; The Journal of Physical
Chemistry A. 2006, 110 (51), 13786-13791.
[11] SlawomirBerski, ZdzisławLatajka; Chemical Physics
Letters.2006, 426, 273–279.
[12] Hue Minh Thi Nguyen, Shaun Avondale Carl,
JozefPeeters, Minh Tho Nguyen; Phys . Chem. Chem.
Phys. 2004, 6, 4111-4117.
[13] Shaun A. Carl, Hue Minh Thi Nguyen, Rehab Ibrahim
M. Elsamra, Minh Tho Nguyen, and JozefPeeters;
Journal of Chemical Physics. 2005, 122, 114307.
[14] Frank Jensen; Introduction to Computational Chemistry;
Second edition; John Wiley & Sons, Ltd. 2007.
[15] A. D. Becke, Density-functional thermochemistry.III.
The role of exact exchange, J. Chem. Phys. 98 (1993),
5648.
[16] A. D. Becke, Density-functional thermochemistry.I. The
effect of the exchange-only gradient correction, J. Chem.
Phys. 96 (1992), 2155.
[17] A. D. Becke, Density-functional thermochemistry.II. The
effect of the Perdew–Wang generalized-gradient
correlation correction, J. Chem. Phys. 97 (1992), 9173.
[18] C. Lee, W. Yang, R. G. Parr, Development of the Colic-
Salvetti correlation-energy formula into a functional of
the electron density, Phys. Rev. B 37 (1988), 785-789.
[19] M. J. Frisch, G. W. Trucks, H. B. Schlegel,.., J. A. Pople;
Gaussian, Inc.,Pittsburgh PA. 2003.
[20] Matsugi, A.; Suma, K.; Miyoshi, A. Kinetics and
Mechanisms of some radicals plus Propargyl
Recombination Reactions. J. Phys. Chem. A. 2012, 117,
7321–7334.
[21] Stephen J. Klippenstein†, James A. Miller*†, and Ahren
W. Jasper‡. Kinetics of Propargyl Radical Dissociation.J.
Phys. Chem. A. 2015, 119(28), 7780-7791.
[22] Ruscic, B.; Boggs, J. E.; Burcat, A.; Csaszar, A. G.;
Demaison, J.; Janoschek, R.; Martin, J. M. L.; Morton,
M. L.; Rossi, M. J.; Stanton, J. F.; Szalay, P. G.;
Westmoreland, P. R.; Zabel, F.; Berces, T. J. Phys.
Chem. Ref. Data 2005, 34, 573.
[23] Chase, M. W., Jr. NIST-JANAF Thermochemical Tables,
4th ed.; American Chemical Society: Washington, D.C.;
American Institute of Physics for the National Institute of
Standards and Technology: Woodbury: New York, 1998.
[24] Hansel, A.; Scheiring, Ch.; Glantschnig, M.; Lindinger,
W.; Ferguson, E. E. J. Chem. Phys. 1998, 109, 1748.
[25] Maricq, M. M.; Smith, M. A.; Simpson, C. J. S. M.;
Ellison, B.B. J. Chem. Phys.1981, 74, 6154.
[26] Tisdale, Samuel L.; Nelson, Werner L.; Beaton, James D.
(1985), Soil fertility and fertilizers, New York:
Macmillan, 1985, 161–168
[27] Jump up^ Benini, Stefano, Wojciech R. Rypniewski,
Keith S. Wilson, Silvia Miletti, Stefano Ciurli, and
Stefano Mangani. A new proposal for urease mechanism
based on the crystal structures of the native and inhibited
enzyme from Bacilus pasteurii: why urea hydrolysis
costs two nickels. Structure 7, 1999, 205-216.
[28] Schwab, G.J. and L.W. Murdock. Nitrogen
Transformation Inhibitors and Controlled Release Urea.
Extension Report. Lexington, KY: University of
Kentucky College of Agriculture, 2005.
[29] Watson, C.J., et al. "Rate and mode of application of the
urease inhibitor N-(n-butyl) thiophosphoric triamide on
ammonia volatilization from surface-applied urea." Soil
Use and Management, British Society of Soil Science
(2008): 1-7.
[30] Wells, K.L., L.W. Murdock and H.F. Miller. Urea as a
Source of Fertilizer Nitrogen for Crops in Kentucky.
Extension Report. Lexington, KY: University of
Kentucky College of Agriculture, 1978.
[31] Jump up^ McInnes, K.J., et al. "Field measurements of
Ammonia Loss from Surface Applications of Urea
Solution to Bare Soil." Agonomy Journal (1986): 192-
196.
[32] See supplementary material at http://pubs.acs.org for full
PES of C3H3 + NH3, optimized geometries of reactants,
intermediates and transition states, vibrational
frequencies, and predicted rate coefficients.
[33] O. Bastiansen and B. Beagley, Acta. Chem. Scand. 18,
(1964), 2077.

International Journal of Science and Engineering Applications
Volume 5 Issue 7, 2016, ISSN-2319-7560 (Online)
www.ijsea.com 368
Design of Solar Panel for 1.5 Hp Nano Coated Motor
Used in Ball Mills for Producing Nano Powders in Pyro
Industries in Sivakasi
D. Edison Selvaraj,
A. Venkatesan,
A. Sivakumar,
Assistant Professor / EEE Panimalar Engineering College Chennai, India.
T. Blessline Ponmani,
G. Sivakumar,
Assistant Professor / Chemistry
Panimalar Engineering
College, Chennai, India.
D. Benson Celix,
B.E – II Year / EEE,
Panimalar Engineering
College, Chennai, India.
J.Ganesan
Assistant Professor / EEE
Sree Sowdambika College of
Engineering
Aruppukottai, India.
K. Joiada Sheloni Rachee,
BE – IV Year/EEE,
Panimalar Institute of
Technology
Chennai, India.
S. Suthir,
Research Scholar,
Manonmaniam Sundaranar
University and
Assistant Professor,
Panimalar Engg. College,
Chennai, India.
S. Dwarakesh,
B.E – II Year / Mech,
Panimalar Engineering
College, Chennai, India.
Abstract: This paper deals with the design of nano coated motor used in ball mills used for producing nano powders in pyro industries
in Sivakasi. This paper also briefs about the profile of industries and administration of Virudhunagar district. A brief history of
Virudhunagar district was also discussed. This paper deals with the industrial application of nano coated motor used in the preparation
of nano powders used in pyro industries located in Sivakasi. Design of solar panel for 1.5 Hp nano coated motor was given in nice
manner for the understanding of young researchers to design the solar cells for the nano coated motor. These nano coated motors were
used in pyro industries for producing nano powders in ball mills in Sivakasi.
Keywords: Solar panel, nano coated motor, pyro industries, ball mills, Sivakasi, Virudhunagar district.Enamel,
1. INTRODUCTION This paper deals with the industrial application of nano coated
motor used in the preparation of nano powders used in pyro
industries located in Sivakasi. Particle sizes of powders used
in pyro industries were in nano size. So, pyro industries were
called as Nano pyro industries. Balls mills were used to
produce Nano pyro powders. Induction motors were used in
Ball mills. Nano coated windings were used in Induction
motor and hence, these motors were called as nano coated
induction motors. These nano coated induction motors were
operated by solar power. Hence, these kinds of motors were
called as solar power operated Nano coated induction motor.
These motors can be used in ball mills to produce nano pyro
powders in pyro industries in Sivakasi. Hence the article was
named as “Solar power operated Nano coated Induction motor
used in Ball mills in Nano pyro industries in Sivakasi”.
Sivakasi was a mega industrial hub in Virudhunagar district.
Virudhunagar district was carved on 15th March 1985 by
trifurcation of the composite Ramanathapuram district with
head quarters at Virudhunagar. The district lies between 55.00
Degree and 77.00 Degree of the eastern longitude and
between 9.00 Degree and55.00 Degree of the northern
latitude. It has an area of 4243 Sq Km and is bounded on the
west by Kerala State, on the north by Madurai and Sivaganga
district, on the east by New Ramanathapuram district and on
the south by Tirunelveli and Tuticorin districts.
Virudunagar is a small town located at a distance of 45 Kms
South-West of Madurai. This place was once referred to as

International Journal of Science and Engineering Applications
Volume 5 Issue 7, 2016, ISSN-2319-7560 (Online)
www.ijsea.com 369
'Virudupatti'. In the beginning of 20th century A.D.,
Virudupatti was one among the six important places of
Ramanathapuram District. Due to the rapid growth in the field
of Trade and Education, it was renamed as 'Virudunagar' on
29th October 1923. The term 'virudu' means 'Award' in Tamil.
The people of this community migrated to improve their
business status and settled in Virudunagar during 19th century
A.D. Virudhunagar exports all kinds of oil to Dubai and
Srilanka and also exports Cotton, chilli, spices, cardamom to
USA and Singapore. Virudhunagar is a famous business
centre without markets. The Business people of Virudhunagar
play an important role in price fixation of consumer products.
Hence there is a popular saying, "virudunagar produces
nothing but controls everything".
In 1985, the erstwhile Ramanathapuram District was
trifurcated to create the districts of Ramanathapuram,
Pasumpon Muthuramalinga Thevar Tirumagan (later renamed
Sivaganga) and Kamarajar District (later renamed
Virudhunagar District).
The District headquarters is Virudhunagar town. It covers an
area of 4232 sq. km and is divided into 8 taluks, namely
Aruppukkottai, Kariapatti, Rajapalayam, Sattur, Sivakasi,
Srivilliputur, Tiruchuli and Virudhunagar. On 3rd March
1996, Sivakasi taluk was created separating the firkas of
Sivakasi, Edirkottai and Salwarpatti from Sattur taluk and
Mangalam firka from Virudhunagar taluk. In 31st August
1998, Kariapatti taluk was formed by separating Kariapatti,
Mudukkankulam and Kalkurichi firkas from Aruppukattai
taluk. Mallanginar firka, the 4th firka of the taluk was carved
out of Kalkurichi firka. TheDistrict is divided into two
Revenue Divisions comprising four taluks each. The
Aruppukkottai Revenue Division comprises Kariapatti,
Tiruchuli, Aruppukkottai and Virudhunagar taluks, and
Sivakasi Revenue Division of Sattur, Sivakasi, Srivilliputur
and Rajapalayam taluks.
According to the 2011 census Virudhunagar district has a
population of 1,943,309, roughly equal to the nation of
Lesotho or the US state of West
Virginia. This gives it a ranking of 242nd in India (out of a
total of 640).The district has a population density of 454
inhabitants per square kilometre (1,180 /sq mi). Its population
growth rate over the decade 2001 - 2011 was 10.96 %.
Virudhunagar has a sex ratio of 1009 females for every 1000
males and a literacy rate of 80.75 % [2]. It is 44.39 %
urbanized. Majority of the population are involved in
Industries and agriculture. The total area of Virudhunagar
District is 3445.73 km.
The climate is generally hot and dry with a low degree of
humidity. The District receives scantly rainfall. The average
annual rainfall is only 987.7 mm. The frequent drought caused
by the failure of the monsoon adversely affects the dry crops
depending upon rain fed tanks for irrigation. Soil is
predominately black soil.
Virudhunagar has rich mineral deposits of lime kankar and
granite also. The lime and limestone deposits are concentrated
in Pandalkudi, Chettipatti and Velayudhapuram villages of
Arupukottai taluk and Cholapuram and Perumalpatti of
Rajapalayam taluk and Gopalapuram, Kangaseval and
Vertrilaiyurani of Sattur taluk. Likewise, kankar deposits are
found abundant in Kilavaraneri and P. Pudupatti in Kariapatti
blocks of Arupukottai taluk. Granite deposits are also found in
Thiruthangal in Sattur taluk and Pillaiyarkulam in
Srivilliputhur taluk.
The forests are found on the eastern slopes of the Western
Ghats. Only 6.3% of the total geographical area of the district
is under forests. Many rare and endemic varieties of flora and
fauna are found along the mountain slopes. A wildlife
sanctuary, spread over 480 sq. kms was established in 1989 at
Shenbagathopu in Srivilliputtur taluk. The forests of
Alagarkoil valley in Srivilliputur taluk and Saduragiri are
known for rare medicinal plants. The medicinal value of 275
plants has been recorded and reported. The forests host a rich
variety of orchids and ferns.
The district has got 3 revenue divisions, 7 municipalities, 11
blocks and 9 taluks respectively. The district is endowed with
a semi arid tropical climate with an average rainfall of 985.7
mm. The predominant soil type is black loomy. This type of
soil is found common in Sattur, Srivilliputtur, and
Aruppukottai blocks.
Existence of Industrial estate attracts investment
opportunities. The Tamil Nadu Small Industries Development
Corporation (SIDCO) is the agency for establishing and
maintaining industrial estates for tiny and small-scale
industries in this district/state. Two Industrial Estates are
functioning at Virudhunagar and Rajapalayam. A Cooperative
Industrial Estate is also functioning at Sivakasi. SIDCO has
also constructed Tiny Industrial Sheds at Watrap, Kariapatti
and Thiruchuli.
Virudhungar district is known for concentration of multiple
enterprises in different part of the district. Each block is
unique in nature. Concentration industries like Match,
Fireworks, Printing, Oil Extraction, readymade garments,
Brick Making, Surgical cotton, textile products, cement, lime
based products, rice mill, paper products, food industries, tin
containers, gold jewellary making in different parts of the
district the district offer multiple intervention for further
development. It attacks the attention of the policy makers and
reaches to anchor the industrial development in a balanced
matter across the district. Cotton is a major commercial crop
of the District and the cotton industry therefore occupies an
important place in the economy. Rajapalayam is the chief
centre for spinning mills and ginning factories. Surgical
cotton and bandage cloth are manufactured here. Textile mills
in the produce a variety of cotton yarn and valued added
textile products. The District has huge deposits of limestone
and gypsum. It paves the way to establish lime based and
cement industry Tamil Nadu Cements – a Public Sector
undertaking at Alangulam and Madras Cements – a Private
Sector undertaking at Thulukkapatti are two large cement
producing units situated in this district.
Sivakasi and Sattur are known for the match industry. There
are over 4500 match unit concentrated in this district giving
employment to more than lakh plus people. There are nearly
450 fireworks factories giving direct employment, to about
40,000 workers and about 1 lakhs indirect such as paper tube
making, Wire cutting, Box making sale distribution in the
country side. The market for fire works is likely to grow at the
rate of 10% per annum. The annual output is over 50,000
tones, and turn over (at factory cost) around Rs. 350 crores
according to industrial sources.
Explosives for blasting are also manufactured here. Over 70%
of the total production of matches and fireworks in India is

International Journal of Science and Engineering Applications
Volume 5 Issue 7, 2016, ISSN-2319-7560 (Online)
www.ijsea.com 370
manufacture in Virudhunagar District. A large percentage of
crackers are exported. Sivakasi, renowned the world over for
its printing, Litho Presses, offset printing machines of which
is the second largest number in the world, next to Guthenburg,
a city in Germany. Around 450 printing presses including
offset & flexo types are located in and around Sivakasi.
The printing industry was originally established to supply
labels for the match and firework industries. Soon the industry
developed and diversified into other areas of printing like
books, posters, greeting cards and diaries. Sivakasi now offers
state of the art, world class printing facilities. Sattur town was
once very famous for fountain pen Nib manufacturing
industries. More than 2000 families were involved in this
industry. But during the recent times, usage of fountain pen
has come down to larger extent and hence the industry is in
declining trend. This industry, which was once the bread
winning industry of the town has almost, vanished now.
Sundaram Fasteners and Brakes India Ltd, private sector
enterprises of the
TVS group are located at Aviyur and Kanjanaiyakampatti in
Kariapatti taluk. The former manufactures high density bolts
and nuts while the latter manufactures automobile brakes.
There are 19335 registered small scale industrial units as on
31 December 1999 engaged in the manufacture of a very wide
range of products. Cottage and village industries are dispersed
throughout the rural areas. Some common cottage industries
are: making of boxes and other articles from Palmyra leaves,
metal artifacts fashioned from copper and brass, and
aluminium vessel manufacture for domestic use. Gold jewelly
making enteprieses are concentrated in Virudhungar,
Rajapalayam, Srivilliputtur and Aruppukottai. The Traditional
lock making enterprises are situated in Rajapalayam town.
Virudhunagar, Rajapalayam, Sattur, Watrap, Aruppukkottai
and Kamudi are important centres for wholesale and retail
trade. Cotton, groundnut, chillies and spices are the main
agricultural goods of trade. Matches, crackers, cement and
textiles are marketed both within and outside the State. Two
warehouses at Virudhunagar and Rajapalayam offer facilities
for storage of food grains, spices, pulses, chillies, jaggery and
cotton.
An analysis of the growth of small scale sector reveals that the
significant change in structure and pattern of the industrial
development have taken place within the small scale sector in
the district. Promising changes in structure and pattern of
industries have made a noticeable impact on the production
front.
1.1Strength
a) Widened highway from Chennai to Kaniyakumari.
b) Widened road from Madurai to Tuticorin
c) Completion of Sethu Project.
d) Extended Port in Tuticorin
e) Nearest Airport at Madurai – 45 Km.
f) Availability of skilled labours.
g) Formation of SIPCOT & SEZ
h) Dispersal of different types of Micro, small and medium
clusters in different location of the district
i) 5 TNEB substations are yet to commence
1) Pulvaikarai
2) Sulakkarai
3) Nenmeni
4) Sukaravarpatti
5) Nallamanaickenpatti.
j) SH 42 were converted into NH. 2000 Crores were
sanctioned for the extension of two way road into four ways.
1.2Weakness
a) Non – availability of Technical person
b) Lack in Technical adoption
c) Competition from abroad like china etc.
d) Low infrastructure
e) Low rail connectivity between different states of India
1.3 Opportunity
a) Availability of natural resources
b) Diverged business operation
c) Availability of Manpower
d) Developed IT field
e) Better export chance
f) Availability of waste land
g) Near to Tuticorin Port
h) Strong Presence of Enterprising People
i) Extension of Srivilliputhur to Parthibanoor road as four
ways
1.4 Threat
a) Tough competition
b) Non – availability of credit
c) Non presence of big industrial estate
The district is not witnessing the strong presence of Medium
scale enterprises. There are 9 large scale enterprises in this
district. They are mostly engaged in manufacturing Auto
component, cotton and textile products, cement, and surgical
cotton.

International Journal of Science and Engineering Applications
Volume 5 Issue 7, 2016, ISSN-2319-7560 (Online)
www.ijsea.com 371
1.5 Major Industrial Groups in
Virudhunagar District
1. TVS Groups
2. RAMCO Groups
3. Jeyavilas Groups
4. Naatchiyar Groups
5. Arumuga Group of Industries
6. Subburaj Cotton Mills Group
7. Standard Group of Industries
8. Arasan Group of Industries
9. Cement factory
1.6 Service Enterprises
Virudhunagar district is witnessing a strong presence of
service enterprises and foot loose industries. Major
contribution has emerged from service enterprises. The
following service enterprises are having visible presence in
Virudhunagar regions: Hotel, Hospitality enterprises,
Hospital, restaurant, Industrial consultancy,
educational instructions ,web site developing, two - 4
wheelers servicing and repairing, tutorial, BPO, private
telephone, Marriage Bureaus, electric and electronic goods
servicing and repairing, Travel Agency, Gas Agency,
Construction consultancy, Marriage items hiring, industrial
Testing Labs, Advertising Agencies, Marketing Consultancy,
Typing Centers. Desk Top Publishing, internet
Browsing/Setting up of Cyber Café Auto Repairs, Services,
Garages, Laundry & Dry, X-Ray clinic, Cleaning, Animal
dispensary, Weigh Bridge, Blue Printing and enlargement of
drawing/designs facilities, Operation of Cable TV Network,
Beauty Parlours and Crèches.
1.7 Potential areas for service industry
BOP, Hotel, Hospitality enterprises, Hospital, IT enabled,
Documentary Films on themes like Family Planning, Social
Forestry, Energy Conservation, and Commercial Advertising,
industrial Laundry , Tailoring., Pathological lab, integrated
diagnostic centre, Sub-contracting Exchanges (SCXs)
established by Industry Associations, Beauty Parlors and
Crèches, fitness centre for men and women, Glass engraving,
Ladies and gents Hostel , House Keeping and Office and
equipment maintenance , Interior decoration, Industrial design
and layout making. Logistic centre, Material Handling, Metal
coating, Office Automation, Parcel servicing and private
carrier, upholstery , Power System maintenance, Manpower
agency, Weighing bridge repairing and maintenance, digital
printing, Embroidering and chamki work , repacking of
agriculture produce, Glass engraving, multipurpose diagnostic
centre.
1.8 Suggestion for Industrial associations
from MSME
1. Creation of Common display centre within SIDCO
industrial Estate, Industrial Association and DIC.
2. Fund support for undertaking adhoc studies.
3. Skill up gradation – participatory model Industry-
Institution – MSME –DI - E & T programs may be allowed to
conduct by Industrial association and MSE by themselves.
4. Project specific allocation for introducing hybrid business
development for Tribal, Rural and artisan clusters.
5. Scheme for community enterprises in respect of privileged
groups and Tribal community.
6. Fund support for establishing Community enterprises at
Tribal regions.
7. More support from NSIC, Re introduction of hire /
purchasing scheme.
8. PMEGP scheme may be revised and KVIC may be allowed
to fund only rural enterprises and State May be permitted to
implement the scheme for promoting more MSEs at regional
Level.
9. Creating common software for tracing the industrial
sickness.
10. Conducting Integrated modular rural development
programs.
11. Establishing Business Incubation within the premises of
Industrial Estates.
12. Preparation of need based project proposals for
establishing Medium scale enterprises.
13. Creation of multiple linkages with educational institutions,
R &D centers.
14. Developing forward linkages with user groups.
2. SPECIFICATIONS OF THE MOTOR
The particle size Current – 4.2 A
Voltage – 230 V
Capacity - 1.5 Hp
Speed – 1500 rpm
3. DESIGN OF PV PANEL The design of solar panel involves the following steps:
1. Load calculation
2. Inverter design
3. Calculation of battery ratings
4. Charge controller efficiency
5. Design of PV panels

International Journal of Science and Engineering Applications
Volume 5 Issue 7, 2016, ISSN-2319-7560 (Online)
www.ijsea.com 372
Figure 1 Design of solar panel
Consider the motor load having 1.5 Hp.
1 Hp = 746 Watts.
1.5 Hp = 1.5 x 746 Watts = 1119 Watts.
Total Watts of the motor = 1119 Watts.
Total Watts hour of the motor load = 8952 Wh
Consider the motor operates for 8 hours
Inverter rating =1119/0.8=1397.78 VA
Power factor = 0.8
Consider inverter efficiency of 93 %
Output of the battery =8952/0.93=9625.81Wh
Consider a battery rating of 12 V, 100Ah
System voltage = 24V
20 Batteries are connected in series to obtain 230V
Depth of discharge of battery = 75 %
Rated Ampere hour of battery considering Depth of discharge
= 0.75 x 100 = 75Ah
Actual Ampere hour of the battery =9625.81/230=41.85Ah
Number of battery =41.85/75=0.6 (approx-1 battery)
Considering, the autonomy of 5 days for this case. Hence, the
number of strings would be 5 + 1 = 6. Number of strings = 6
Number of PV panel
Controller efficiency = 0.97
Input to the battery =9625.81/0.8x0.97=12404.39Wh
Battery efficiency = 80%
Number of sun shine hours = 5
System voltage = 230 V
Ampere hour of the panel =12404.39/230=53.93Ah
Ampere rating of PV panel =53.93/5=10.79A
Consider a PV panel of voltage 15V, 5A, 75w
Number of panels in parallel =10.79/5=2.16 (approx-3)
Number of panels in series =230/15=15.33=16
4. CONCLUSION This paper dealt with the use of nano coated motor in the
pyro industries and design of Solar panel for that nano
coated motor which were used in the pyro industries located
in Sivakasi. South Tamil Nadu was becoming an important
solar hub in the world. Solar power generation units were
constructed in South TN for continuous and uninterrupted
power supply to the country. Recently, some HVDC cable
transmission of power project from Sri Lanka to Madurai
grid were under in initial state to get power from Sri Lanka
to India in future. Set up of nano Lab is rare, new and
uncommon. It is also an emerging technology. Fabrication of
powder needs extra machines which are not popular among
common people. It will become popular in the coming
future. Nano coated motors can bring the following changes
in the conventional machine tools:
1. Accuracy and quality of output can be improved
2. Improves the life time of the plant
3. Reduces the maintenance cost
The proposed work can be extended in future as follows:
1. Coating of stator winding of induction motor with
enamel filled with various nano fillers such as ZrO2, ZnO,
Al2O3, SiO2, SiC and so on.
2. Testing of nano coated motors – load test, blocked
rotor test, no load test, temperature withstanding test
3. Measurement of stator resistance
4. Equivalent circuit parameters
5. Speed control of nano coated motor
6. Comparison of both nano coated motor and normal
induction motor
7. Harmonic reduction by using nano fillers
8. Measurement of EMI and EMC
9. Estimation of losses in both motors and its
comparison
10. Implementation of solar panel for the nano coated
motor.
5. ACKNOWLEDGEMENT We express our sincere thanks to the God, the Almighty, and
Lord Jesus Christ. This paper is dedicated to the hard working
people of Virudhunagar district. We express our gratitude

International Journal of Science and Engineering Applications
Volume 5 Issue 7, 2016, ISSN-2319-7560 (Online)
www.ijsea.com 373
towards our Tamil Scientist Dr. A.P.J. Abdul Kalam. We
express our deep heart feelings towards His death and the
people who have lost their lives in Tamil Nadu floods, 2015.
6. REFERENCES [1] Selvaraj, D. Edison, et al. "Analysis of Efficiency,
Thermal Withstanding Capacity and Electromagnetic
Interference of Three Phase Squirrel Cage Induction
Motor Coated with SiO2 & TiO2 nano composite Filled
Enamel." International Journal of Science and
Engineering Applications 1.1 (2012): 17- 21.
[2] Edison Selvaraj, D., C. Pugazhendhi Sugumaran, and A.
Sivaprakash."Characterization of Electrical and Thermal
Properties of Enamel Filled with Carbon Nanotubes."
Proceedings of the Third International Conference
on Trends in Information, Telecommunication and
Computing. Springer New York, 2013.
[3] Selvaraj, D. Edison. "Partial discharge characteristics of
enamel filled with micro and nano composite of siO2 and
TiO2." International Journal of Science and Engineering
Applications 1.2 (2012): 95-101.
[4] Selvaraj, D. Edison. "Characterization of dielectric
properties of the enamel filled with carbon nano tubes for
the frequency range of 50 Hz-5 MHz" International
Journal of Science and Engineering Applications 1.2
(2012): 102-106.
[5] Selvaraj, D. Edison, and C. Pugazhendhi Sugumaran.
"Comparative Analysis of Dielectric Properties of Enamel
Filled with Various Nanofillers such as ZrO2, Al2O3,
CNT and ZnO." International Journal of Science and
Engineering Applications 1.1 (2012): 51-55.
[6] Babu, B. Gurukarthik, D. Edison Selvaraj, R. Srinivas, B.
Guru Prakash, and R. Vishnu. "Analysis of Relative
Permittivity and Tan Delta Characteristics of
Silicone Rubber Based Nano-composites." International
Journal of Scientific Engineering and Technology ,
pp.2201-206, 2012.
[7] D. Edison Selvaraj, J. Ganesan. "Experimental Analysis of
Efficiency and Thermal Withstanding Capacity of
Three Phase Squirrel Cage Induction Motor Coated with
SiO2 & TiO2 Nano Composite Filled Enamel",
International Journal of Engineering Sciences, Vol (2), No
(4), 2013. pp. 115-118.
[8] Lieutenant Ganesan. J, Jeyadevi.S.Dr, and Edison
Selvaraj. D, “Performance Analysis of Single Phase
Induction Motor Coated with Al2O3 Nano Filler Mixed
Enamel” ACEEE International Journal on Recent Trends
in Engineering & Technology Vol. 10, No. 1, Jan 2014.
[9] Edison Selvaraj. D, Pugazhendhi Sugumaran. C,
Lieutenant Ganesan. J, Ramathilagam. J, “Analysis of
Dielectric and Thermal Properties of Polyamide Enamel
Filled with Carbon Nano tubes” International Journal of
Nano science, Vol.12, Issue 3, June 2013.
[10] Lieutenant Ganesan. J, Edison Selvaraj. D, and
Ramathilagam. J,“Experimental analysis of Thermal
conductivity of enamel filled with micro and nano
composite of SiO2 and TiO2” International journal of
Advanced Research in Electrical, Electronics and
Instrumentation Engineering, Vol.2, Issue 7,pp.
2907-2912 , 2013.
[11] Lieutenant Ganesan. J, Jeyadevi. S. Dr, and Edison
Selvaraj. D, “Reduction of Electromagnetic
Interference in Single Phase Induction Motor by
coating the winding with Al2O3 nano filler mixed
Enamel” International journal of Advanced Research in
Electrical, Electronics and Instrumentation Engineering,
Vol.2, Issue7,pp. 2913-2916 , 2013.
[12] Lieutenant Ganesan. J, Edison Selvaraj. D, and Selva
Kumar. B, “High Efficiency Induction Motor”,
International journal of Advanced Research in Electrical,
Electronics and Instrumentation Engineering, Vol.2, Issue
2, pp. 750-754, 2013.
[13] Lieutenant Ganesan. J, Edison Selvaraj. D, GuruPrakash.
B, Vishnu Prakash. R, Muthupandi. E, and BalaKumar. R,
“Analysis of Efficiency and Thermal Withstanding
Capacity of Single Phase Induction Motor Coated with
Al2O3 Nano Filler Mixed Enamel”, International
journal of Advanced Research in Electrical, Electronics
and Instrumentation Engineering, Vol.2,Issue
3,pp. 960-963, 2013.
[14] Edison selvaraj. D, et.al Applications of Nano Technology
in Pyro Industries located in Sivakasi, International
Journal of Science and Engineering Applications Volume
4 Issue 4, 2015.
[15] Ben nett T and Zilo uchain A (2012), “Photovoltaic model
and converter topology considerations for MPPT
purposes” , Solar Energy 86(7), pg 2029-2040.
International Journal of Science and Engineering Applications
Volume 5 Issue 7, 2016, ISSN-2319-7560 (Online)
www.ijsea.com 374
Effects of ultrafine limestone powder on some
properties of Portland cement
Dung Ta Ngoc
Hanoi University of Science
and Technology
No. 1, Dai Co Viet, Hai Ba
Trung, Hanoi, Vietnam
Mai Pham Thanh
Hanoi Architectural University
Km 10, Nguyen Trai, Thanh
Xuan, Hanoi, Vietnam
Duong Tran Hong
Hanoi University of Science
and Technology
No. 1, Dai Co Viet, Hai Ba
Trung, Hanoi, Vietnam
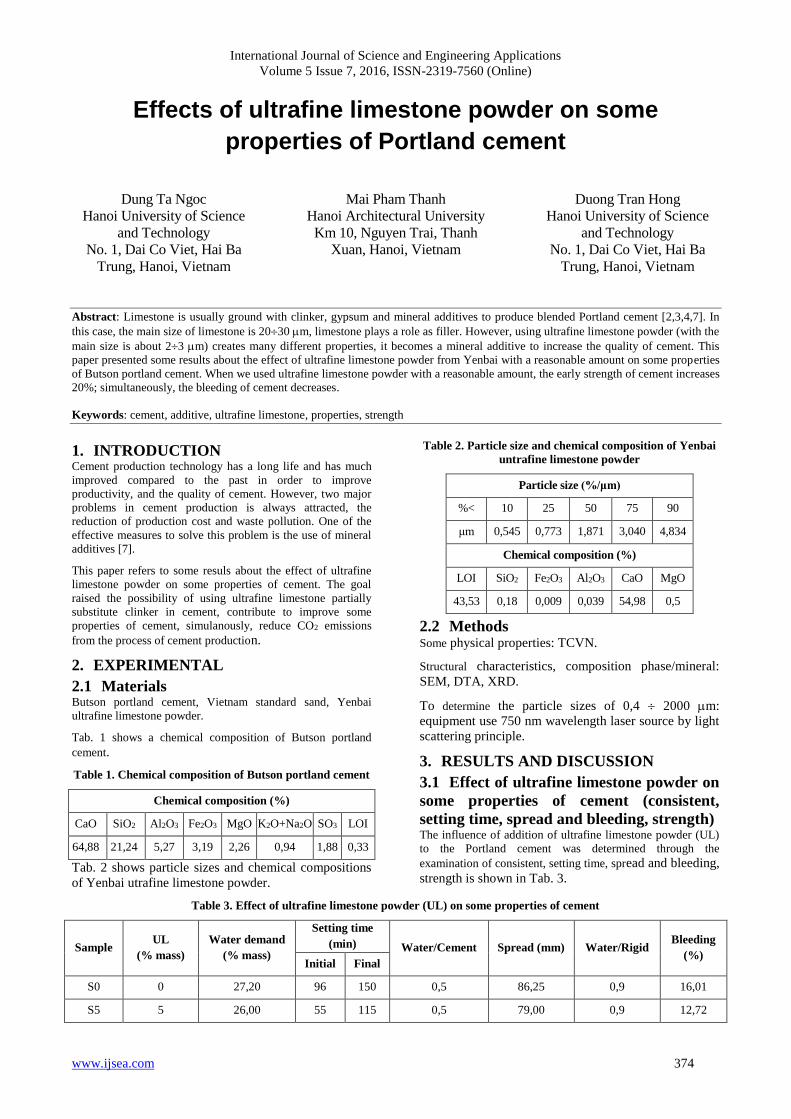
Abstract: Limestone is usually ground with clinker, gypsum and mineral additives to produce blended Portland cement [2,3,4,7]. In
this case, the main size of limestone is 2030 m, limestone plays a role as filler. However, using ultrafine limestone powder (with the
main size is about 23 m) creates many different properties, it becomes a mineral additive to increase the quality of cement. This
paper presented some results about the effect of ultrafine limestone powder from Yenbai with a reasonable amount on some properties
of Butson portland cement. When we used ultrafine limestone powder with a reasonable amount, the early strength of cement increases
20%; simultaneously, the bleeding of cement decreases.
Keywords: cement, additive, ultrafine limestone, properties, strength
1. INTRODUCTION Cement production technology has a long life and has much
improved compared to the past in order to improve
productivity, and the quality of cement. However, two major
problems in cement production is always attracted, the
reduction of production cost and waste pollution. One of the
effective measures to solve this problem is the use of mineral
additives [7].
This paper refers to some resuls about the effect of ultrafine
limestone powder on some properties of cement. The goal
raised the possibility of using ultrafine limestone partially
substitute clinker in cement, contribute to improve some
properties of cement, simulanously, reduce CO2 emissions
from the process of cement production.
2. EXPERIMENTAL
2.1 Materials Butson portland cement, Vietnam standard sand, Yenbai
ultrafine limestone powder.
Tab. 1 shows a chemical composition of Butson portland
cement.
Table 1. Chemical composition of Butson portland cement
Chemical composition (%)
CaO SiO2 Al2O3 Fe2O3 MgO K2O+Na2O SO3 LOI
64,88 21,24 5,27 3,19 2,26 0,94 1,88 0,33
Tab. 2 shows particle sizes and chemical compositions
of Yenbai utrafine limestone powder.
Table 2. Particle size and chemical composition of Yenbai
untrafine limestone powder
Particle size (%/μm)
%< 10 25 50 75 90
μm 0,545 0,773 1,871 3,040 4,834
Chemical composition (%)
LOI SiO2 Fe2O3 Al2O3 CaO MgO
43,53 0,18 0,009 0,039 54,98 0,5
2.2 Methods Some physical properties: TCVN.
Structural characteristics, composition phase/mineral:
SEM, DTA, XRD.
To determine the particle sizes of 0,4 2000 m:
equipment use 750 nm wavelength laser source by light
scattering principle.
3. RESULTS AND DISCUSSION
3.1 Effect of ultrafine limestone powder on
some properties of cement (consistent,
setting time, spread and bleeding, strength) The influence of addition of ultrafine limestone powder (UL)
to the Portland cement was determined through the
examination of consistent, setting time, spread and bleeding,
strength is shown in Tab. 3.
Table 3. Effect of ultrafine limestone powder (UL) on some properties of cement
Sample UL
(% mass)
Water demand
(% mass)
Setting time
(min) Water/Cement Spread (mm) Water/Rigid Bleeding
(%) Initial Final
S0 0 27,20 96 150 0,5 86,25 0,9 16,01
S5 5 26,00 55 115 0,5 79,00 0,9 12,72

International Journal of Science and Engineering Applications
Volume 5 Issue 7, 2016, ISSN-2319-7560 (Online)
www.ijsea.com 375
S10 10 26,40 52 110 0,5 63,75 0,9 5,68
S15 15 26,80 45 94 0,5 53,50 0,9 3,22
S20 20 26,80 40 104 0,5 59,38 0,9 2,03
S25 25 28,00 35 98 0,5 58,13 0,9 1,16
S30 30 29,20 44 90 0,5 46,63 0,9 1,17
S35 35 29,60 37 93 0,5 51,38 0,9 0,56
3.1.1 Normal consistency
The water requirement, determined on the fresh paste, is
reported in Tab. 3. It seems that utrafine limestone
powder reduces water requirement compared to
Portland cement. Moreover, increasing the amount of
limestone requires much water.
3.1.2 Setting time
From Tab. 3, it indicates the initial and final setting time
of cement pastes at different amount of limestone. The
obtained values show that both initial and final setting
times were decreased with an increase in the amount of
limestone. It can be concluded that limestone fills the
pores between cement particles due to formation of
carboaluminates, which may accelerate the setting of
cement pastes.
3.1.3 Spread of cement paste
The results from Tab. 3 show that the spread of cement
pastes was decreased. Because of using ultrafine
limestone powder, with w/c = constant, caused higher
specific surface area, thus the thickness of the water
layer on cement particle surface decreases, which
increases the internal friction, leading to reduce spread
of cement paste.
3.1.4 Bleeding
When we using ultrafine limestone powder, the
bleeding of cement pastes decreases. The more amount
of additive, the more reduction of separated water. The
amount of separated water greatly reduced in samples
of 5; 10; 15% cement replacement additive (the
bleeding decreased from 16% to 3,2%); then, it slowly
reduced in the other ratios.
This result is caused of the ultrafine limestone particles
increases the surface area, the amount of adsorbed
water around the surface of the particles also increases.
In contract, the formation of monocarboaluminate
(C3A.CaCO3.11H2O), hemicarboaluminate
(C3A.0,5CaCO3.0,5Ca(OH)2.11,5H2O), which increases
the water holding capacity of cement paste, so the
amound of separated water decreases.
3.1.5 Strength
The influence of the ultrafine limestone powder
addition on the compressive strength of cement is
shown in Tab. 4 and Fig. 1.
Table 4. Effect of ultrafine limestone powder (UL) on compressive strength of cement
Sample
UL,
%
mass
Compressive strength, MPa ∆ (declination compare with S0), %
1
day
3
days
7
days
14
days
28
days
60
days
1
day
3
days
7
days
14
days
28
days
60
days
S0 0 14,4 28,4 36,7 40,5 43,5 50,0 100 100 100 100 100 100
S5 5 17,0 33,2 39,0 40,4 45,1 46,9 118 117 106 100 104 94
S10 10 17,4 32,4 40,9 44,9 45,6 47,1 121 114 111 111 105 94
S15 15 17,5 32,1 41,8 42,6 47,8 45,5 122 113 114 105 110 91
S20 20 17,4 32,6 38,2 37,8 45,3 43,8 121 115 104 93 104 88
S25 25 17,2 31,6 35,7 33,8 40,8 39,0 119 111 97 83 94 78
S30 30 15,8 25,7 31,4 34,9 38,2 34,5 110 90 86 86 88 69
S35 35 14,9 25,6 26,8 29,6 31,8 31,5 103 90 73 73 73 63

International Journal of Science and Engineering Applications
Volume 5 Issue 7, 2016, ISSN-2319-7560 (Online)
www.ijsea.com 376
(a) Compressive strength (b) Declination
Figure 1. Effect of UL on compressive strength of cement
Tab. 4 and Fig. 1 show that:
Ultrafine limestone powder increases compressive
strength at early ages (1; 3 days). Lower declination are
obtained with higher addition levels.
Ultrafine limestone decreases compressive strength of
cement at the later age (60 days). Higher amount of
addition, lower declination.
When we use addion with amount lower 15%, the
compressive strength of cement increases at early ages,
decreases at later age.
This result is caused of some reasons:
Limestone improves the hydration rate of minerals C3S,
C3A, C4AF [7].
The presence of ultrafine limestone was slowed down
the formation of C3AH6; simultaneously, the formation
of monocarboaluminate (C3A.CaCO3.11H2O),
hemicarboaluminate
(C3A.0,5CaCO3.0,5Ca(OH)2.11,5H2O) [1,3,4,6].
The effect of aggregate and crystalline nuclei of
limestone powder is a favorable condition for the
formation and development of crytalline hydrate. It
gradually fills the pores between particles of cement,
creates the dense structure. Moreover, with the ultrafine
size, this band of limestone might contribute to improve
the grain composition, arrange tightly structure and
reduce the size of the pores in cement hydrated.
Increasing levels of additives cause the dilution of
minerals, which reduces the intensity of cement
hydrated when excessive levels of additives.
The decline in the intensity at the age of 60 days likely
due to the conversion of the mineral form of ettringit to
calcium monosulfoaluminate, calcium
monocarboaluminate accompanying volume change
(dett = 1,77 g/cm3 < dmono = 2,17 g/cm3), also due to
slowing C3AH6 formation, or the transformation of
calcium monocarboaluminate from thin sheets to form
shape metal rod will cause residual stress [6]. These
changes cause the volume reduction and create pores in
cement hydrated. Since then, the strength of cement
hydrated tend to decrease when combined with
limestone. This is usually seen in the report on the
recent studies.
3.2 The effect of ultrafine limestone on the
process of the hydration and the formation
of crystals
3.2.1 Differential thermal analysis (DTA)
At a temperature of less than 250oC, the amount of loss
H2O is free water, bound water of calcium silicate
hydrate CSH (B), calcium aluminate hydrate (ferrite)
[5].
From 250oC to 500oC, the amount of water loss is
mainly caused by the decomposition of Ca(OH)2, and a
part of the remaining calcium silicate hydrate minerals
[5].
From 500oC to 1000oC, the amount of LOI is caused by
the hydration of the remaining compounds and CO2.
CO2 is considered to be the result of the decomposition
of CaCO3 in the cement hydrated; created by the
reaction between Ca(OH)2 and CO2 in air and CaCO3 in
additives [5].
International Journal of Science and Engineering Applications
Volume 5 Issue 7, 2016, ISSN-2319-7560 (Online)
www.ijsea.com 377
Furnace temperature /°C0 100 200 300 400 500 600 700 800 900
TG/%
-14
-7
0
7
14
HeatFlow/µV
-50
-40
-30
-20
-10
0
Mass variation: -11.98 %
Mass variation: -3.97 %
Mass variation: -1.37 %
Peak :138.82 °CPeak :518.94 °C
Peak :772.48 °C
Figure:
29/05/2009 Mass (mg): 64.82
Crucible:PT 100 µl Atmosphere:AirExperiment:Mau S0
Procedure: RT ----> 1000C (10C.min-1) (Zone 2)Labsys TG
Exo
Furnace temperature /°C0 100 200 300 400 500 600 700 800 900
TG/%
-20
-10
0
10
20
HeatFlow/µV
-50
-40
-30
-20
-10
0
Mass variation: -15.33 %
Mass variation: -4.10 %
Mass variation: -5.65 %
Peak :135.41 °C
Peak :520.69 °C
Peak :837.40 °C
Figure:
29/05/2009 Mass (mg): 63.38
Crucible:PT 100 µl Atmosphere:AirExperiment:Mau S15
Procedure: RT ----> 1000C (10C.min-1) (Zone 2)Labsys TG
Exo
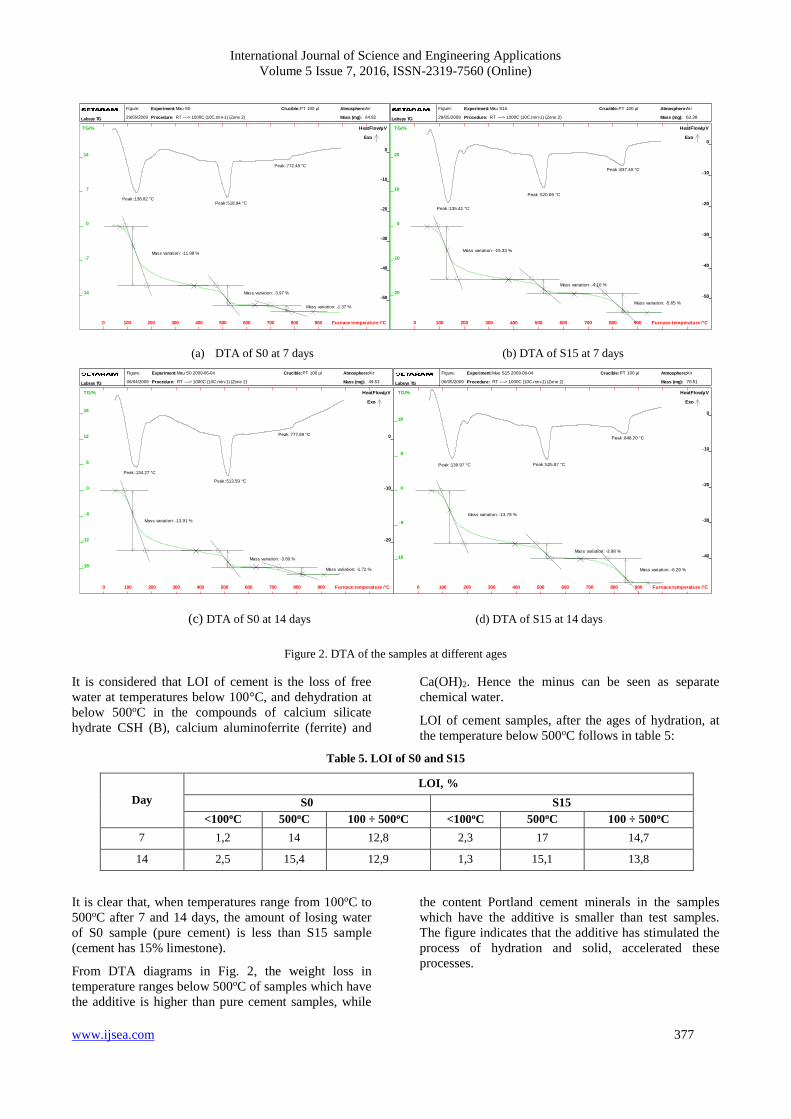
(a) DTA of S0 at 7 days (b) DTA of S15 at 7 days
Furnace temperature /°C0 100 200 300 400 500 600 700 800 900
TG/%
-18
-12
-6
0
6
12
18
HeatFlow/µV
-20
-10
0
Mass variation: -13.91 %
Mass variation: -3.80 %
Mass variation: -1.72 %
Peak :134.27 °C
Peak :513.59 °C
Peak :777.89 °C
Figure:
06/04/2009 Mass (mg): 49.53
Crucible:PT 100 µl Atmosphere:AirExperiment:Mau S0 2009-06-04
Procedure: RT ----> 1000C (10C.min-1) (Zone 2)Labsys TG
Exo
Furnace temperature /°C0 100 200 300 400 500 600 700 800 900
TG/%
-18
-9
0
9
18
HeatFlow/µV
-40
-30
-20
-10
0
Mass variation: -13.79 %
Mass variation: -3.98 %
Mass variation: -6.29 %
Peak :139.97 °C Peak :525.87 °C
Peak :848.20 °C
Figure:
06/05/2009 Mass (mg): 70.51
Crucible:PT 100 µl Atmosphere:AirExperiment:Mau S15 2009-06-04
Procedure: RT ----> 1000C (10C.min-1) (Zone 2)Labsys TG
Exo
(c) DTA of S0 at 14 days (d) DTA of S15 at 14 days
Figure 2. DTA of the samples at different ages
It is considered that LOI of cement is the loss of free
water at temperatures below 100°C, and dehydration at
below 500oC in the compounds of calcium silicate
hydrate CSH (B), calcium aluminoferrite (ferrite) and
Ca(OH)2. Hence the minus can be seen as separate
chemical water.
LOI of cement samples, after the ages of hydration, at
the temperature below 500oC follows in table 5:
Table 5. LOI of S0 and S15
Day
LOI, %
S0 S15
<100oC 500oC 100 ÷ 500oC <100oC 500oC 100 ÷ 500oC
7 1,2 14 12,8 2,3 17 14,7
14 2,5 15,4 12,9 1,3 15,1 13,8
It is clear that, when temperatures range from 100oC to
500oC after 7 and 14 days, the amount of losing water
of S0 sample (pure cement) is less than S15 sample
(cement has 15% limestone).
From DTA diagrams in Fig. 2, the weight loss in
temperature ranges below 500oC of samples which have
the additive is higher than pure cement samples, while
the content Portland cement minerals in the samples
which have the additive is smaller than test samples.
The figure indicates that the additive has stimulated the
process of hydration and solid, accelerated these
processes.

International Journal of Science and Engineering Applications
Volume 5 Issue 7, 2016, ISSN-2319-7560 (Online)
www.ijsea.com 378
3.2.2 XRD analysis The results of XRD analysis are shown in Fig. 3 and
Fig. 4 below:
Faculty of Chemistry, VNU, D8 ADVANCE-Bruker - Q0
01-073-0599 (C) - Calcium Silicate Oxide - Ca3(SiO4)O - Y: 17.38 % - d x by: 1. - WL: 1.5406 - Rhombo.H.axes - a 7.05670 - b 7.05670 - c 24.97400 - alpha 90.000 - beta 90.000 - gamma 120.000 - Primitiv
00-009-0414 (D) - Ettringite, syn - Ca6Al2(SO4)3(OH)12·25H2O - Y: 13.67 % - d x by: 1. - WL: 1.5406 - Hexagonal - a 11.23000 - b 11.23000 - c 21.44000 - alpha 90.000 - beta 90.000 - gamma 120.000 - Pri
01-087-0673 (A) - Portlandite, syn - Ca(OH)2 - Y: 53.09 % - d x by: 1. - WL: 1.5406 - Hexagonal - a 3.58900 - b 3.58900 - c 4.91100 - alpha 90.000 - beta 90.000 - gamma 120.000 - Primitive - P-3m1 (164) -
File: SonBK Q0.raw - Type: Locked Coupled - Start: 5.000 ° - End: 65.000 ° - Step: 0.030 ° - Step time: 0.3 s - Temp.: 25 °C (Room) - Time Started: 13 s - 2-Theta: 5.000 ° - Theta: 2.500 ° - Chi: 0.00 ° - Phi:
Lin
(Cps
)
0
100
200
300
400
2-Theta - Scale
5 10 20 30 40 50 60
d=16
.174
d=12
.834
d=9.
786
d=8.
684
d=4.
916
d=3.
880
d=3.
033
d=2.
881
d=2.
753
d=2.
626
d=1.
925
d=1.
795
d=1.
763
d=1.
687
d=1.
486
Figure 3. XRD of S0 at the age of 7 days
Faculty of Chemistry, VNU, D8 ADVANCE-Bruker - Mau S15
01-073-0599 (C) - Calcium Silicate Oxide - Ca3(SiO4)O - Y: 23.67 % - d x by: 1. - WL: 1.5406 - Rhombo.H.axes - a 7.05670 - b 7.05670 - c 24.97400 - alpha 90.000 - beta 90.000 - gamma 120.000 - Primitiv
01-086-2334 (A) - Calcite - Ca(CO3) - Y: 91.78 % - d x by: 1. - WL: 1.5406 - Rhombo.H.axes - a 4.98800 - b 4.98800 - c 17.06099 - alpha 90.000 - beta 90.000 - gamma 120.000 - Primitive - R-3c (167) - 6 -
00-009-0414 (D) - Ettringite, syn - Ca6Al2(SO4)3(OH)12·25H2O - Y: 27.94 % - d x by: 1. - WL: 1.5406 - Hexagonal - a 11.23000 - b 11.23000 - c 21.44000 - alpha 90.000 - beta 90.000 - gamma 120.000 - Pri
01-087-0673 (A) - Portlandite, syn - Ca(OH)2 - Y: 66.27 % - d x by: 1. - WL: 1.5406 - Hexagonal - a 3.58900 - b 3.58900 - c 4.91100 - alpha 90.000 - beta 90.000 - gamma 120.000 - Primitive - P-3m1 (164) -
File: SonBK MauS15.raw - Type: Locked Coupled - Start: 5.000 ° - End: 65.000 ° - Step: 0.030 ° - Step time: 0.3 s - Temp.: 25 °C (Room) - Time Started: 12 s - 2-Theta: 5.000 ° - Theta: 2.500 ° - Chi: 0.00 ° -
Lin
(Cps
)
0
10
20
30
40
50
60
70
80
90
100
110
120
130
140
150
160
170
180
190
200
210
220
230
240
250
260
270
280
290
300
310
320
330
340
350
2-Theta - Scale
5 10 20 30 40 50 60
d=4.
909
d=3.
030
d=2.
779
d=2.
624
d=2.
284
d=2.
097
d=1.
925
d=1.
794
d=1.
685 d=
1.48
3
d=5.
586
d=9.
666
d=3.
114
Figure 4. XRD of S15 at the age of 7 days
The content of Portlandite crystals Ca(OH)2 are found
in the pure cement sample is higher than S15 sample, it
is a possibility that a part Ca(OH)2 combined with
CaCO3 form hemicarboaluminate
(C3A.0,5CaCO3.0,5Ca(OH)2.11,5H2O) [4,5,6]. It is
consistent with previous studies and test results about
strength.
3.2.3 SEM results
The results of SEM are shown in Fig. 5.

International Journal of Science and Engineering Applications
Volume 5 Issue 7, 2016, ISSN-2319-7560 (Online)
www.ijsea.com 379
(a) S0 (b) S15
Figure 5. SEM pictures of the 7-age samples
After 7 days in hydration, the structure of S15 cement
sample is closer and pore density is less than the
structure of S0 cement sample. It would appear that
limestone plays a role in initial nucleus actively and
more evenly; moreover, it contributes to fill the pores.
4. CONCLUSION Used up to 15% additives still maintains the basic
properties of cement followed by Vietnamese
standards.
Improved approximately 1020% strength at the early
ages when we used to 15% additives.
The dehydration reduced. Specially, the bleeding rate
reduced significantly from 16% in the pure cement
sample to just under 3% when we used to 15%
additives.
5. REFERENCES [1] E. Sakai, H. Imoto and M. Daimon (2003), Hydration of
Limestone Portland Cement, Proceeding Internation
Scientific Workshop Cement and Concrete Technology,
pp 8 – 13 , Hanoi.
[2] E. Sakai and M. Daimon (1998), Limestone powder
application, Workshop on Cement and Concrete
Technology, pp 1 – 13, Hanoi.
[3] Monica Lundgren (2004), Limestone Filler as Addition
in Cement Mortar: Influence on the Early-Age Strength
Development at Low Temperature, SP Swedish National
Testing and Research Institute.
[4] Ward R.Malisch (1998), Limestone additions to Portland
Cement pro and cons.
[5] S.Tsivilis, G.Kakali, E.Chaniotakis and A.Souvaridou
(1998), A Study on the hydration of portland limestone
cement by means of TG, Journal of Thermal Analysis
and Calorimetry 04-1998, Volume 52, Issue 3, pp 863-
870.
[6] XIAO Jia, GOU Cheng-fu, JIN Yong-gang, WANG
Yong-he (2010), Effect of CaCO3 on hydration
characteristics of C3A, J. Cent. South Univ. Technol.
(2010) 17: 918−923.
[7] Peter Hawkins, Paul Tennis, and Rachel Detwiler (2003),
The Use of Limestone in Portland Cement: A State-of-
the-Art Review, ENGINEERING BULLETIN 227.

International Journal of Science and Engineering Applications
Volume 5 Issue 7, 2016, ISSN-2319-7560 (Online)
www.ijsea.com 380
Critiquing Recalling as Mechanism in Answering
Questions during Evaluation
Kenneth Bright Boateng
Department of Fashion
Design
Takoradi Polytechnic
Takoradi, Ghana
John Frank Eshun
Department of Interior
Design and Technology
Takoradi Polytechnic
Takoradi, Ghana
Frederick Boakye Yiadom
Department of Sculpture
Takoradi Polytechnic
Takoradi, Ghana
Abstract: Evaluation has been the key measuring instrument employed to determine knowledge, skill, and competence levels in
Ghanaian schools. By design, conventional assessment has been structured for students to recall studied materials and re-produce
it through oral presentation, inscription, and/or demonstration. This is also the orthodox order by which appraisal has been
undertaken to declare pass and qualification. The mechanism by which performance, knowledge, skill, and competence are
determined based on volume of information to recall appears to be a limiting factor in measuring knowledge, skill, and competence
especially in Technical and Vocational Education Training (TVET). Relatively, it is a common feature in world of work where
labour has the leverage to refer from documented materials and other authorities and experts to deliver as expected. The study thus,
is an inquiry attempting to look into the means of measuring performance, knowledge, skill, competence, and standards without
depending much on absolute recall. It is a direct attempt to reduce rote learning drastically and prepare students for life other than
examination. Being literally qualitative and quasi-experimental research, the inquest will adopt observation, descriptive,
interpretative, and partial experimental research.
Keywords: Evaluation, Student, Teacher, Recall, and Learning.
1. INTRODUCTION
Many an authority of education will describe education as a
means by which people who enroll (students) into school
could be trained and guided to acquire knowledge, skill, and
competence (Smith, 2015, Roni, 2011, & Tesha, 2016). By
design, education also imbibes and sharpens the capacity
into being adaptive and poised physically, mentally,
emotionally, fit, and responsible (Smith, 2015, Roni, 2011,
& Tesha, 2016). To declare the student who must have gone
through the system passed well enough to exit the confines
of the school, the former ought to have proved that all
learning outcomes espoused must have been acquired
reasonably and evaluation is the key yardstick for
undertaking search measurement. Since the inception of
formal education, summative assessment has been the key
tool by which performance and capacity is determined.
Recently, a mix of formative and summative assessments in
the ratio 4:6 have been instituted in many institutions in
Ghana and that is what Takoradi Polytechnic also adopts.
The structure by which these assessments are executed for
appraisal have many questions among them is the challenge
of volume of information that can be memorized and its
relationship with pass, adaptation, and performance which
have been encapsulated by Novak, (2011) p. 1., as think,
feel, and act. At present, dominance of the concept of
thinking (recall) and act (delivery) with limited reference to
feel (how or methodology) form the fundamental challenge
of illiterate graduate and the reason why employers look for
five (5) to ten (10) year working experience.
By and large, qualification has been linked directly to the
ability of the student to recall as much as possible and
present as directed by the marking scheme in making
required grade for transition to the next level. Instinctively,
this has introduced varying dynamics into schooling and
evaluation and subsequently knowledge, skill, and
competence. Passing adequately has been the goal and thus,
the conventional practice is to grasp as much as possible,
recall, and deliver orally and/or inscriptively. Often, students
eagerly ask for notes or pamphlets, study the contents, and
deliver on demand. Summarily rote learning has become so
entrenched and prevalent defeating grossly the key aims and
objectives of education. According to (Mayer, 2002),
retention focuses on the past and transfer focuses on the
future. Within the context, retention looks at memorizing
and transfer requires memorization to deliver in
performance. Now, the end is prioritized over the means and
as such, many students have been drawn into the penchant
of cheating: influencing facilitators and examination
International Journal of Science and Engineering Applications
Volume 5 Issue 7, 2016, ISSN-2319-7560 (Online)
www.ijsea.com 381
officials to buy questions and marking schemes, manipulate
results, and refer to foreign materials and discussions whiles
examination is in session. Ultimately, ill-equipped graduates
and professionals get churned out; hence, the emerging
phenomenon where industry requires five (5) to ten (10) year
working experience before hiring. Industrial players for
some time have bemoaned passionately that graduates do not
measure up to standards required for the world of work.
Correlating with the context is the opine caveat by Novak
(2011) p.1., that expresses learners, teachers, subject matter
selected, social milieu, and evaluation to be benchmarks of
education theory. Indeed, every graduate should have
certificate serving as evidence in support of satisfying the
benchmarks Novak has advocated. However, direct
relationship between evidential certificate and evidential
result from productivity is core of the controversy. The
sensitive and unfortunate situation is particularly dire in
TVET education like the polytechnic where knowledge,
skill, and competence are the targets.
Increasing dangers from over-emphasizing skill and
competence performance appears to have its associated
limitations likewise. To illustrate its effect, Battino, (1992)
p. 1., argues that understanding and recalling elements of the
periodic table in chemistry is very essential in appreciating
technical and technological processes and theories of
chemistry. Factually, practical undertakings may be helpful
but to assimilate and memorize cannot be ostensibly missing
in this endeavour. That is why the contention of meaningful
learning by Mayor, (2002) p.1., where convergence is made
between the Taxonomy of retention and transfer appears to
be on spot. If meaningful is relegated to the background, then
brace yourself for any of the three possibilities: no learning,
rote learning, and meaningful learning (Mayor, 2002, pp. 1-
2).
The struggle in Ghana points to the trajectory where the
focus is on pass to make it to the next level (academic
progression and/or world of work). Under the regime of
president John Agyekum Kufour, it was believed that
making high school duration seven (7) years that is from age
12 to 19 should equip students comprehensively for
progression into tertiary notably university. As at now, the
then government, Ministry of Education, and Ghana
Education Service are yet to produce any scientific evidence
to support the claim that increment in volumes that passed
West Africa Senior Secondary Certificate Examination
(WASSCE) as a result of four (4) year senior high school
education had meaningful learning. The damage is revealed
in placing emphasis on rote learning to the detriment of
meaningful (smart) learning ultimately leading to no
learning. A reflection seen when industry provide feedback
on performance on students on industrial attachment and
internship. We are often told by industry how frequently
students from the regular universities use grammar to
express and explain issues but struggle to deliver on the job
whereas the HND students deliver on the job and also
struggle to express themselves freely.
2. RESEARCH DESIGN
As a typical applied research, the broadly qualitative study
has somewhat worked along quasi-quantitative approach
utilizing experimental, observation, descriptive, and
interpretative design and method. It has elicited factors that
fan recall and rote learning leading to the chaos being
experienced and suggest remedies. It is hoped the outcomes
will give stronger basis and support for CBT and formative
assessment as the paradigm in TVET especially at the
Polytechnic.
Employment of qualitative and quasi quantitative
approaches are revealed in sessions as facilitators (teachers)
and learners get interacted. During sessions, a common
experience is to get students ask lecturer to convert the
materials into notes even though full references have been
provided in support of study material. Students will be
sincere to confess regardless of provided references; we did
not really consult the reference for information and
knowledge expansion. On the contrary, they prefer to get
busy during revision and examination period to recall as
much as possible. Approach to evaluation particularly:
quizzes and examinations has been much disturbing as
though the world of the student must have ended. People
strive to burn the mid-night oil, try to cheat, and worst of all,
unable to apply whatever material they must treated
creditably during the quiz or examination in future even with
reference materials in support. Most of all, many lecturers
do not see the need to limit the application of summative
assessment to the advantage of formative assessment: a
pattern that became obvious during curricular review in
transition from polytechnic to technical university in 2016.
And the relevance is seen because many of the lecturers have
the same background as the students and would wish to work
with convenience. During the end of year examinations
which ended in June, 2016, out of eight papers (8) a lecturer
invigilated, it was one that seems to have professionally well
composed question for the examination. A related very
disturbing phenomenon is examination result manipulation
by lecturers and in some instances, examination officers.
Generally depending on summative assessment puts lecturer
in charge and gets students forced to explore but without
evidence to support legitimacy of the so called acquired
knowledge.
3. RESULTS AND DISCUSSION
As part of the inquest for this paper, a quiz was conducted
for mid-semester examination and presented for your
perusal.
TAKORADI POLYTECHNIC
MID-SEMESTER EXAMINATION QUESTION
SCHOOL: Applied Arts YEAR: HND 1
DEPARTMENT: Fashion Design and Textile Studies
Semester: Two (2)

International Journal of Science and Engineering Applications
Volume 5 Issue 7, 2016, ISSN-2319-7560 (Online)
www.ijsea.com 382
PROGRAM: Fashion Design and Textile Studies
Section: 2015/16
COURSE: Drawing and
Illustration
Course Code: FDT 106
Duration: 1½ Hours Credit Hours: 3
NAME OF LECTURERS: Kenneth Bright Boateng
and Ahmed Jibril
INSTRUCTIONS
You are permitted to come in with all your reference
materials with the exception of computers and smart phones.
Also come along with relevant drawing and painting
materials and instruments. Answer all questions
1. State and explain the main relevance why in
illustrations, the legs are portrayed to look taller
than the torso/trunk in fashion.
5 Marks
2. List five (5) elements of design and show how to
demonstrate each visibly in garments and
accessories with two (2) points each.
10 Marks
3. Identify with two (2) points each how colour
illusion can be used for the following:
a) Increase girth of an extreme slim silhouette
b) Reduce height of a very tall person
10 Marks
4. State two (2) ways by which you can adopt balance to
reduce a protruding waist of a lady conveniently.
5 Marks
5. State and explain with two (2) points on how to apply
occasion and function in bridal apparel. Support your
answer with credible examples.
10 Marks
The findings from the examination have been treated as
follows:
Pedagogy and andagogy are key training doctrines which aid
directing learning form known to the unknown; simple to
complex; concrete to abstract. Virtual skill required to
express little or much vividly for the understanding of
students is a teaching artistry that requires observation,
experience, and versatility. Knowledge and use of these
principles does depend on age but capacity of the learner and
hence, the difficulty in its application during training of
disengaged students as pertain in the polytechnic. Looking
at average age students in the polytechnic makes it easier to
conclude that they are matured which is highly subjective.
Understandably, dependent on formative assessment brings
knowledge, skill, competence, and adaptive cleverness
(versatility) but the former is inadequate that is why the
significance of summative assessment cannot be over-
emphasized. Granting documented materials to facilitate
revision and personal studies are not evil but needs to be
highly skewed to reflect capacity and strength of student to
stimulate personal drive for quality knowledge, skill, and
competence. Of the nine (9) students whose project report
were vetted in 2015/2016 academic year, only one had good
command over oral and written English. Seven (7) were not
impressive but two (2) could not write a complete sentence
with grammatical flaws even though they have adequately
delivered the final collection (end of programme project
work).
Absenteeism and truancy is a regular feature in training
institutions across education with teachers and educational
authorities employing varying tools for its control. To root
out this debilitating quagmire, trainers and institutions may
want to consider alternative motivation where no
documented material in the form of notes, pamphlets,
leaflets, and handouts are issued to students but the latter is
required to deliver answers to smart quiz within 30min at the
beginning of first session of every month. From observation,
many smart students of very large class size stay out of
attention and sneak in and out of class at will but make the
required grades all the time. Varying the rules of engagement
to demand performance through direct contact as seen in
formative assessment should literally reduce this menace of
education.
In the past, a regular practice in evaluation is to offer mark
up for brilliant performance but it was discovered that this
simply became another avenue for teachers to hand over
marks freely to their favorites spanning from the well-
dressed, athletes, disciplined, child with special needs,
errand runners, and even concubines. A more scaring
phenomenon is where teachers load questions requiring
voluminous written statements that the former would not
have the time to mark and award appropriate marks. In short,
the teacher just awards marks based on familiarity and
fraternity other than performance. The compelling evidence
is so staggering knowing that some failures and excellence
do not necessarily merit the award with its subsequent tag.
Note taking, pamphlets, leaflets, and handouts have
additionally problems creating tremendous challenges to
education authorities and the more allowed to thrive, the
worse. The problems become apparent just at the beginning
of the semester where it takes three (3) weeks or more for
average regular student to report fully for lectures even
though only the first week is required for registration. They
walk casually into class late and then sit oblivious of their
environment chatting, fondling their smart phones, and/or
absent minded. 'Anyway, I will get the notes from a friend
to prepare for the examinations' – that is feedback when
questioned. Albeit offensive, reading into it should reveal a
structural problem arising from teachers and institutional
authorities. If it is permissible for students to be compelled
to buy handouts, leaflets, and pamphlets with some attaching
award of points and marks to it, you could not be asking for
a lesser trouble. This practice reduces discipline and makes
International Journal of Science and Engineering Applications
Volume 5 Issue 7, 2016, ISSN-2319-7560 (Online)
www.ijsea.com 383
the vulnerable susceptible to abuse by fellow students and in
some cases, teachers and education authorities.
The importance of rote learning is being stretched beyond
reason and many a teacher has not seen it to be a time bomb.
As illustrated by local parlance in Ghana: 'chew, pass, and
forget'; many a student goes through great length to grasp
and assimilate as much as possible. Trying to capture and
memorize contents is not adequate to guarantee productivity
is a challenge because that has been their experience from
the basic levels. At the polytechnic where beyond
completion of programme is on the job performance requires
additional skill and competence that can and must convert
raw or semi-finish to finish. Well, some teachers contend
that well designed questions from open ended to close ended
within the context of knowledge, skill, and competence
demonstrated by the learning outcome should draw
appropriate responses from the answers students provide.
But, a counter contention is the student has recalled and
provided the answers as being demanded but cannot perform
the task in the world of work.
Since 1993 when I began practicing professional teaching
from basic through secondary to tertiary, am yet to
experience examination (spanning from invigilation to
awards) where cheating (copying from neighbours and
friends; foreign materials; discussion; spying; omission
and/or manipulation of results, by students and/or personnel)
never occurred. Spying appears to be the commonest where
students attempt to steal glances at the work of neighbours.
No mean lesser, another regular occurrence is the penchant
to talk and talking whiles examination is in session. Albeit it
seldom happens, some students have the boldness to grab
others works (exchange) and copy oblivious of the presence
of invigilator. But the worst and bizarre are smuggling of
foreign materials into the examination and then
manipulation of and/or by personnel and results. Even at the
highest (tertiary) level, I have seen students copy on all sort
of materials from papers, underwear, skin to sanitary towels
and more all in attempt to recall as much as possible without
working for it. Some leave the material in quite close
proximity to the examination centre (e.g. toilet) and briefly
visit to spy. The most disturbing ones are trading of
questions, marking schemes, and results by teachers and/or
students alike with sex, money, and opportunities not to talk
about lazy teachers who manufacture marks and distribute
by acquaintance without necessarily reading scripts. The
bottom line is the immaculate drive to manipulate the system
to secure advantage without working for it. Sanctions for
found cases can be very severe ranging from failure of the
paper through rustication to outright dismissal but the
prognosis appear frankly bleak: the phenomenon does not
appear to be halting as in every examination I helped to
conduct during my tenures as examination coordinator and
chief invigilator, these infractions occurred across all
programmes run by the polytechnic.
Anxiety and violence have also crept into the stream of
examination. Visibly stressed students who appear broadly
worried and exhausted begin to pester teachers and
examiners. "What are the questions about? Any possible
areas to emphasize in our learning"? In the extreme students
get to the wit end and act carelessly. Some try to trade
anything for questions, marking schemes, and better results.
Others get abused by teachers, examination staff, and fellow
students and in the process, people get breakdown. In
University of Education in Ghana where mostly advanced
age learners enroll most of whom are teachers, students get
rushed to hospital during revision and examination period
often on worsening heart conditions. In the polytechnic
where youthfulness is prevalent, depression is very common.
Also common is violence where students attempt to attack
fellow students who do not compromise examination sanity.
Vigilant and strict invigilators are seen mean and are
sometimes attacked verbally. In an incident I witness, a
semester six (6) student caught copying from foreign
material in his last paper for the examinations which also to
complete his HND education decided to wrestle the foreign
materials from the two invigilators who accosted him and the
seen was very pitiful.
4. CONCLUSION
i. Adaptive cleverness by which circumstances
could contextualized for sustained optimal
performance is extremely essential.
ii. Relevance of knowledge retention from training is
revealed in transfer: application of knowledge in
adaptation to evolving trends.
iii. Session plan, facilitation, and assessment may
require review for adaptation to the trends of the
times.
iv. Practical oriented questions with the right for
reference from study materials during examination
may be helpful after all. In surgical cases, surgeons
do not absolutely rely on recall to conduct
operations. They sometimes refer to notes and
discuss for alternative opinions and/or affirmation.
v. Timely feedback associated with appropriate
counseling to those perceived to have challenges
during sessions and assessment as the semester
wears on could engender better preparation and
confidence during examination.
5. REFERENCES
[1] Battino, R., (1992). On the importance of learning, p.
1., Provocative opinion.
www.pubs.acs.org/doi/pdf/10.1021/ed069p135 –
Retrieved: May 30, 2016, 02:47hrs.gmt.
[2] Novak, J. D. (2011). A theory of education: meaningful
learning underlies the constructive integration of
thinking, feeling, and acting leading to empowerment
for commitment and responsibility, p. 1., Florida
institute for human and machine cognition.

International Journal of Science and Engineering Applications
Volume 5 Issue 7, 2016, ISSN-2319-7560 (Online)
www.ijsea.com 384
www.ihmc.us/groups/jnovak/ – Retrieved: May 30,
2016, 02:47hrs.gmt.
[3] Mayer, R. E. (2002).
[4] Mayer, R. E. (2002). Rote versus meaningful learning,
pp. 1-2.,
mit.edu/jrankin/www/teach_transfer/rote_v_meaning.
pdf – Retrieved: May 29, 2016, 19:40hrs.gmt.]
[5] Roni, S. H. (2011). Definition of education by the
expert (2).
http://lapazinaction.blogspot.com/2011/12/definition-
of-education-by-expert-2.html – Retrieved: May 29,
2016, 17:40hrs.gmt.]
[6] Smith, M. K. (2015). What is education? A definition
and discussion. The encyclopaedia of informal
education. http://infed.org/mobi/what-is-education-a-
definition-and-discussion/. – Retrieved: May 29, 2016,
11:49hrs.gmt.
[7] Tesha, J. (2016). Plato’s concept of education,
Introduction.
http://www.sdsmorogoro.com/common/my%20pages/
research%20papers/plato's%20concept%20of%20educ
ation.html – Retrieved: May 29, 2016, 17:49hrs.gmt.

International Journal of Science and Engineering Applications
Volume 5 Issue 7, 2016, ISSN-2319-7560 (Online)
www.ijsea.com 385
Relationship between Information System Components, Trust, and User Satisfaction in terms
of Using Green Processes and Technology
Mahmood Zohoori
Master Of Environmental Management
UPM
Birjand, Iran
Samaneh Falaki
Master of Environmental Assessment and Land
Use Planning
University of Birjand
Birjand, Iran
Abstract: Nowadays there are great concerns about environmental pollution which bring attentions on the use of green products and
processes. Many researches have been conducted and are being conducted in various industries with different scopes in this term.
However, the crucial point is whether green technology and processes are able to adapt in various industries. This research with using
quantitative approach attempts to highlights effective variables on trust in green technology and processes, and also impact of trust on
user satisfaction at one of the Malaysian university. Thus, considering to Information system success model (IS success model) and
previous researches that have been conducted by scholars, this research have chosen Green information quality and Green system
quality which are able to influence trust. According to the results obtained from collecting of 150 data from university staff including
academic and official staff via distribution of questionnaire, showed that Green system quality, and Green information quality have
significant and positive relation on trust. In addition, the impact of Green system quality and Green information quality on trust is
significant and positive. On the other hand, the relationship between Trust and User satisfaction is positive and significant;
furthermore, trust has a significant and positive impact on user satisfaction.
Keywords: Green environment, System quality, Information quality, Trust, User satisfaction.
1. INTRODUCTION Nowadays industries consume more energy than necessary,
and it causes more pollution. That is why it is important to
establish a management system based on green processes and
products to reduce the pollutions. Furthermore, the
opportunities are provided in green technology. All
governments and companies look for ways to reduce waste,
because earth’s environment today is not in a good state in the
term of pollution such as: forest disappearing, water
contamination, global warming, and etc that are the major
problems for environment. On the other hand, in roofed
environment like offices with mechanical ventilation, but
without recirculation, devices like computers can cause
sensory pollution loads (Al-Ali et al., 2010). In fact, the
personal computers (PCs) are found as a strong indoor
pollution sources. Besides sensory pollution load of each
single PC is 3.4 Olfactus (olf) even when they are serviced for
every three months (Bakó‐Biró et al., 2004).
Chemical analysis detects there is pollutants emitted by PCs.
The most significant chemicals include phenol, toluene, 2-
ethylhexanol, formaldehyde, and styrene (Al-Ali et al., 2010).
So these types of pollutions have an important negative
impact on the air quality, not only in offices but also in many
spaces including homes. Furthermore, (National Public Radio)
NPR reports by Chris Arnold in 2004 from Environmental
Protection Agency officials say: Computers and computer
monitors in the United States are responsible for the
unnecessary production of millions of tons of greenhouse
gases every year (Ravali et al., 2011).
With the entire world talking about going green, everyone can
chip-in his/her bit for the environment and save money and
energy. Generally, PCs and other IT equipment consume a lot
of electricity and have high carbon emission levels.
Accordingly, if there is a potential to enhance the quality of
systems used in various industries, there will be a possibility
to cut down the emissions. For instance use of Green PCs that
are especially designed to minimize power consumption.
Moreover, Green PCs draw less power than normal PCs and
support sleep modes. A Green PC is a computer that has low
power consumption and is environment friendly. It supports
sleep modes in which the computer cuts down the power of
unnecessary components when it is inactive. Configuring and
assembling a Green PC is an easy task.

International Journal of Science and Engineering Applications
Volume 5 Issue 7, 2016, ISSN-2319-7560 (Online)
www.ijsea.com 386
Many computer components are easy on the environment,
save energy and thus, help cut costs. Saving the environment
and cutting down on energy consumption has become the
need of the hour. With the help of Green PCs, it has now
become easier to be environmentally aware without
compromising on technological advancements. A Green PC is
assembled with environment friendly components. It comes
with a number of options such as the option to dim the
monitor when it hasn’t been in use for some time, the
components like CPU, monitor, etc. don’t give off high degree
of radiation, the components are recyclable, etc. Furthermore,
other components like Processors, Motherboards, Monitors,
and Hard Drives have come out with new products that
consume less power than the earlier manufactured processors
and are better or equal in performance.
Besides, if quality of information rises alongside of quality of
system, it will be easier to use the systems like PCs. Because
in fact information quality is the desirable characteristics of
the system outputs. For example: relevance, understandability,
accuracy, conciseness, completeness, understandability,
currency, timeliness, and usability are all characteristics of a
system with high degree of information. On the other hand,
capabilities of an information system lead to increase in
system usage (Pitt et al., 1995), (Petter, S et al., 2008).
According to the results obtained from past researches by
different experts it can be said that user satisfaction can be
influenced by some main elements and as a result the
performance of individuals remains as a gap related to green
behavior. A new framework was developed in this study that
conncets information quality and the system quality to Trust
and also user satisfaction. Another gap refers to consider
green product and porcess for each variable.
2. Literature review
2.1 Information System Success Model The term IS or information system success is a popular term
to measure the information system (Lin et al., 2006). A large
number of studies in MIS or management of information
system scholarship have developed IS model of success
(Delone et al., 2003; Seddon et al, 1997; Pitt et al. 1995).
Approximately 180 papers about evaluation of IT investment
elements have been reviewd that they were published during
the 70s and 80s. consistent with the statements of (DeLone et
al., 1992) an IS is model have been presented with six
variables about IS success including information quality,
system quality, system usage, user satisfaction, organizational
impact and individual impact.
This model joins the comprehensive dependent factors applied
by IS experts but on the other hand it also obtained some
criticism. First of all, the usage of IS in the model that has
been presented by Mclean and Delone has a lot of
interpretations that needs to be examined. It is also mentioned
that the IS usage plays a role which is controversial and
problematic in the success of modeling system.
In second place, due to the fact that satisfaction of users
demonstrates the individual influence of IS in a firm context,
therefore it is not essential to investigate on a cause direction
from satisfaction of users to individual influence. Finally, the
last point that is very necessary is that this model does not
describe the relation of individual influence and user
satisfaction in a transparent way (Edward et al., 2005). The
developed definitions for each of these factors are as follow:
1. System quality: measures of the information
processing systemitself
2. Information quality: measures of information
system output
3. (Information) use: recipient consumption of the
output of an information system
4. User satisfaction: recipient response to the use of
the output of aninformation system
5. Individual impact: the effect of information on the
behavior of the recipient
6. Organizational impact: the effect of information on
organizational Performance (Fig. 2.2).
In 1994 Kiew and Seddon tested a modified version of the
model which was made by Mclean and DeLone in 1992 that
had the three significant differences as follows:
S-K. Lee, J-H, Yu / Automation in construction 25
(2012) 82-93
Figure 1: Delon and Mclean IS success model (1992)

International Journal of Science and Engineering Applications
Volume 5 Issue 7, 2016, ISSN-2319-7560 (Online)
www.ijsea.com 387
(a) the usage was replaced by usefullness, (b) a factor
crucial for the system was added in order to assist
defining the differences in the perception of users
related to user satisfaction and usefulness. (c) the
casuality that exist among users and user
satisfaction was changed by a casuality which was
one way. The outcomes that were empirical
developed some support for according to model of
Mclean and DeLone in 1992. In 1997 Seddon stated
a model of IS success in which the influence of
society was added as a value of net of the IS (Figure
2.3).
According to the success model of IS by Pitt in 1995 a service
quality was addedd as an element of quality for the model of
McLean and DeLone in 1992. For evaluation of service
quality the measure tools are shaped from the modified
SERVQUAL that were presented by Parasuraman in 1998 and
after that the validity was tested (Figure 2.4).
A success model was matured by Myers in 1997 and it was an
extension of the McLean and Delone model in 1992 as well as
Pitt’s model back in 1995. This new model is not similar to
the past models. The difference exists as follow: (a) the
service quality was added, (b) a workgroup was added to
assume the external and organizational context related to the
approach of contingency (Figure 2.5).
After over a decade past, McLean and Delone provided a
model in 2003 that was updated and it disclosed the other
researcher’s critisim as well as the situation of that time.
When the concept of service was added to information
technology, the number of IS success elements were increased
by means of using internet as well; moreover, it accelarated to
seven and contained quality of service alongside with the
interrelation and the correlation of them that were analyzed
(Figure 2.6).
Figure 3: Pitt, Watson, And Kawan success model
(1995)
Figure 4: Myers, Kuppleman, and Prybuton (1997)
System
Quality
Information
Use
Net
Benefit
Figure 5: Delone and Mclean IS success model (2003)
International Journal of Science and Engineering Applications
Volume 5 Issue 7, 2016, ISSN-2319-7560 (Online)
www.ijsea.com 388
According to the results from previous researches many
empirical studies support the left side of the model by
McLean and DeLone which states that information quality,
system quality and as well as service quality lead to user
satisfaction and system usage. It was clarified that the manner
and attitude can be influenced by quality in the context of IS.
But there still exist some arguments about information system
success construct.
This construct is different in accordance with the domain. The
success model of IS in a lot of various industries have been
used such as construction, and the experts that tried to set up
and apply a success model of IS that started to appear and
some of them have been conducted. The studies related to this
topic of construction contain the fillowing aspects. (a) based
on the model presented by McLean and DeLone they
attempted to determine the factors of the success or the fault
of the ERP system introduction that are utilized significantly
in enterprise construction with the aim of evaluation, plan and
project conduction for setting up and introducing the
Enterprise Resource Planning (ERP) in the enterprise.
In this study the elements of success for the ERP system are
classified in two separated groups. The first one is variables
that are related to users like job relevance, output, result,
image, system reliability and compatibility. The second group
is variables that are related to the project which contain
function, internal support and the support of consultant.
It can be concluded that the degree of completion for this
research is high; furthermore, it offers a model of success to
build the ERP system by a huge collection of data process as
well as the data analysis. On the other hand, it should be
mentioned that the recommended model has some restrictions
for application for other types of IS due to the fact that it was
described by concentration on ERP systems.
(b) The elements related to attitude and behavior of end users
were analyzed by EDM which is the management and
engineering system which is for projects that have a large
scale construction (Hjelt et al., 2007). The study provided a
survey in which the elements that affect the Electronic
Document Management (EDM) system acceptance will be
drawn for a project that is constructive.
Based on these elements, the IS success model that was
improved by McLean and DeLone mentioned that the
function where an end user agrees with an EDM system in a
project that is constructive. (c) Related to the above researches
(Raymond et al., 2008) offered a model of success for project
management information system or PMIS in accordance with
the IS model of success and the rest of the theories. Based on
this study the important elements that influence the success of
PMIS are the information quality of PMIS and quality of
PMIS.
To assess the quality of PMIS, it was decided to use eight
items which are response time, accessibility, ease of use,
flexibility, learning ease, querying ease, multi project
capability and system integrartion. there are six factors for
estimation of information quality of PMIS which are
relevance, availibility, precision, reliability, security and
comprehensiveness. However, as the authors declared the
biggest flaw in this research is the fact that the model was
measured by a small sample size which has been about 39
inividuals. The most related investigations provided a success
model of IS based on the model of McLean and DeLone.
The goal of this research is recommending a model of IS
success that is developed according to the two available
models. Therefore, the recommended IS model of this study
will depend to green products and services usage in industry
of education.
2.4 Green Environment in Malaysia
The application of green products is same to green purchase
and the reason is because the goal for both of them is the
similar as the other one. Green purchasing can be expected as
a crucial tool for replacement of environment; in adittion, the
friendly usage as well as behavior of the production and
consumption that provides a frequent green, and has many
issues dependent to the environment like CO2 emission
reduction.
The sectors all around the world including private, public or
social were asked to purchase green to have a stable future
(IGPN, 2009). Malaysia in terms of quality of marines and
rivers have a normal level and range. From 146 rivers, 7 of
them have been monitored, it means that around 4.8% of these
rivers have been catagorized as polluted. This number of
polluted rivers is more related to the amount of unhealthy
rivers back in 2005 that was 10.3% or 15 rivers, but due to the
fact that there was mist from July to October in 2006. While
comparing with the past year the air had a fall down related to
quality (Department of Environment, 2006).
International Journal of Science and Engineering Applications
Volume 5 Issue 7, 2016, ISSN-2319-7560 (Online)
www.ijsea.com 389
The amount of waste had an increase from 548,916,11 metric
tons back in 2005 up to 1,103,457,06 metric tons in the next
year. From the different sources that bring a polluted air, three
sources are from the vehichles, some of the industries like
powerstations as well as operations which were negligent
regarding an open burning in the country (Department of
environment, 2006).
The main categories of waste produced in Malaysia which are
hydrocarbon and oil, mineral sludge, dross, heavy metal
sludge, gypsum and finally e-waste. Quantity of scheduled
wastes generated by industry ranked from chemicals (42.7%),
electronic (21.6%), automotive/workshop (17.2%), metal
(7.1%), pharmaceutical (2.9%) and other industries
(Department of environment, 2006). It is anticipated if this
trend of iresponsible behavior and consumption pattens
continue, the environmental degradation would be aggravated.
Therefore is shift towards green products and processes is
required.
If the process of increase in economy and as well as using the
patterns in a negligent way remains, there will be a vast
damage on environment and ecosystem in Malaysia. The
concept of green purchasing is new in Malaysia (MGPN,
2003). Until now, there have been little inquiry on doing the
green purchasing for individuals in Malaysia. However, it can
be mentioned that big organizations that are located in United
States (US) or United Kingdom (UK) and other countries in
Europe are developing some go green campaigns for
advancing this concept.
On the other hand, the local industries do not care to this
aspect; furthermore, they always wait to see what will happen
(MGPN, 2003). The Green Purchasing Network Malaysia
(MGPN) president during his speech in the first International
Conference related to the green purchasing expressed that it is
better that the government establish a condition to motivate
firms to be the initiative and first leader for green buying
performance.
2.2 System Quality
Generally, the quality of system compared to quality of
information achieved a lower level of attention in the
literature of IS. Additionally, the system quality factors are
usually related to aspects related to ease of use and quality of
service. For example (Bailey et al., 1983) contained several
various system concepts related to services of IS in their
investigations of satisfaction. (Raiet, 2002) expressed that
system quality can be evaluated by operation of ease of use.
These aspects are entirely related to each other but they are
not similar.
An easy to use system can be also high quality so the easy
usage of a system can be the result of quality of system.
Furthermore, systems bundled with a high level of IT service
may be considered to be of higher quality, making service
quality a covariate to the quality of the system.
The above relations are the results of models of system
success (Seddon et al, 1997). It brings a situation which
expressed it is essential to make sure about the conceptual
clarification for the distinction and specification of the
aspects. In this case our offer is that there exist some
dimensions which are unique that are the important parts of
the system quality and they act separately from service
elements or ease of use.
The degree in which quality of information has a relationship
with output of the information system and the quality of
system shows the needed system of information process for
making the output. So the system quality dimensions
demonstrate perception of users for interacting with the
system during the time. In this case systems with more quality
can be assumed as more easy to use and also have more
usefulness in usage (Davis, 1989).
The interaction of system in an organizational environment
happens with the aim of doing a defined task most of the time.
Hence it will be better to assume the aspects of system quality
by means of spectrum which has a ranking from system to
task. Dimensions of a system can be described as the
characteristics if a system which is essentially differs in
various uses and can be measured independently from the
task, application or the environment. The dimensions of a
task can be defined as the elements of evaluation which are
related to setting and task.
Our understanding of past studies demonstrates that there
exist five necessary dimensions for the quality of system
which are reliability, accessibility, response time, flexibility
and finally integration by conducting more than 20
investigations for recognizing the system quality aspects.
2.3 Information Quality
The goal of developing information systems is bringing
valuable information for decision making for the groups and
individuals by management of sources, processing, storage
and keeping. Their real value and benefits will be known
while the provided information will be used in operations.
(Swanson, 1974) expressed that quality of information that
shows the degree of information system success is an
important factor.
The concept of information quality demonstrates the output
quality which is produced by information system (DeLone et
al., 1992). This can be a report or an online screen. In 1987,
Pazer and Ballou presented four dimensions for the quality of
information including completeness, accuracy, timelines and
consistency. There are also some aspects for data quality.
(Nelson et al., 2005) decided to apply the accuracy, construct,
currency, and completeness and information quality format.
Based on these researchers format, an extra construct have
been used in relation with layout presentation for the output of
the information.
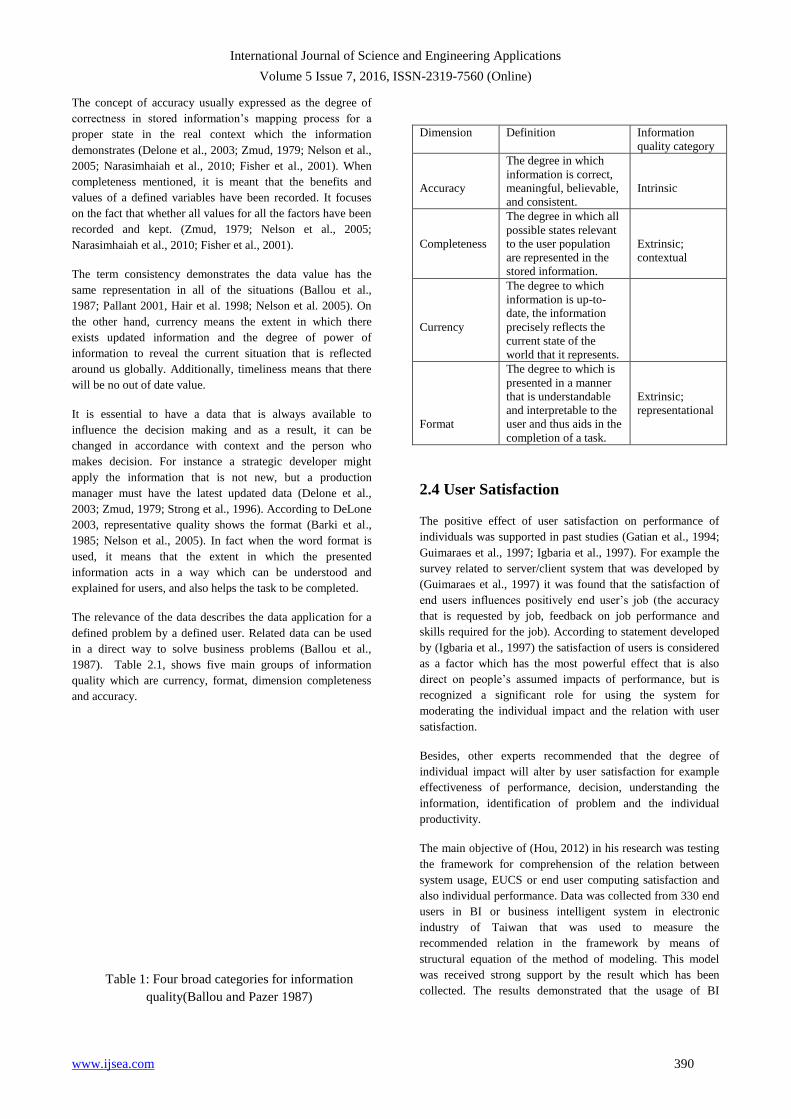
International Journal of Science and Engineering Applications
Volume 5 Issue 7, 2016, ISSN-2319-7560 (Online)
www.ijsea.com 390
The concept of accuracy usually expressed as the degree of
correctness in stored information’s mapping process for a
proper state in the real context which the information
demonstrates (Delone et al., 2003; Zmud, 1979; Nelson et al.,
2005; Narasimhaiah et al., 2010; Fisher et al., 2001). When
completeness mentioned, it is meant that the benefits and
values of a defined variables have been recorded. It focuses
on the fact that whether all values for all the factors have been
recorded and kept. (Zmud, 1979; Nelson et al., 2005;
Narasimhaiah et al., 2010; Fisher et al., 2001).
The term consistency demonstrates the data value has the
same representation in all of the situations (Ballou et al.,
1987; Pallant 2001, Hair et al. 1998; Nelson et al. 2005). On
the other hand, currency means the extent in which there
exists updated information and the degree of power of
information to reveal the current situation that is reflected
around us globally. Additionally, timeliness means that there
will be no out of date value.
It is essential to have a data that is always available to
influence the decision making and as a result, it can be
changed in accordance with context and the person who
makes decision. For instance a strategic developer might
apply the information that is not new, but a production
manager must have the latest updated data (Delone et al.,
2003; Zmud, 1979; Strong et al., 1996). According to DeLone
2003, representative quality shows the format (Barki et al.,
1985; Nelson et al., 2005). In fact when the word format is
used, it means that the extent in which the presented
information acts in a way which can be understood and
explained for users, and also helps the task to be completed.
The relevance of the data describes the data application for a
defined problem by a defined user. Related data can be used
in a direct way to solve business problems (Ballou et al.,
1987). Table 2.1, shows five main groups of information
quality which are currency, format, dimension completeness
and accuracy.
Dimension Definition Information
quality category
Accuracy
The degree in which
information is correct,
meaningful, believable,
and consistent.
Intrinsic
Completeness
The degree in which all
possible states relevant
to the user population
are represented in the
stored information.
Extrinsic;
contextual
Currency
The degree to which
information is up-to-
date, the information
precisely reflects the
current state of the
world that it represents.
Format
The degree to which is
presented in a manner
that is understandable
and interpretable to the
user and thus aids in the
completion of a task.
Extrinsic;
representational
2.4 User Satisfaction
The positive effect of user satisfaction on performance of
individuals was supported in past studies (Gatian et al., 1994;
Guimaraes et al., 1997; Igbaria et al., 1997). For example the
survey related to server/client system that was developed by
(Guimaraes et al., 1997) it was found that the satisfaction of
end users influences positively end user’s job (the accuracy
that is requested by job, feedback on job performance and
skills required for the job). According to statement developed
by (Igbaria et al., 1997) the satisfaction of users is considered
as a factor which has the most powerful effect that is also
direct on people’s assumed impacts of performance, but is
recognized a significant role for using the system for
moderating the individual impact and the relation with user
satisfaction.
Besides, other experts recommended that the degree of
individual impact will alter by user satisfaction for example
effectiveness of performance, decision, understanding the
information, identification of problem and the individual
productivity.
The main objective of (Hou, 2012) in his research was testing
the framework for comprehension of the relation between
system usage, EUCS or end user computing satisfaction and
also individual performance. Data was collected from 330 end
users in BI or business intelligent system in electronic
industry of Taiwan that was used to measure the
recommended relation in the framework by means of
structural equation of the method of modeling. This model
was received strong support by the result which has been
collected. The results demonstrated that the usage of BI Table 1: Four broad categories for information
quality(Ballou and Pazer 1987)

International Journal of Science and Engineering Applications
Volume 5 Issue 7, 2016, ISSN-2319-7560 (Online)
www.ijsea.com 391
H2
system as well as performance of individual can be enhanced
by having more EUCS. (Figure 2.7).
2.5 Trust
As Manafi et al. (2011) cited, Lee and Fung (1999) and
Fukuyama (1995) trust is defined as the willingness and
thoughts about relying on someone’s goodness, strength and
fairness. Of the internet in this regard could be a good
example. Sloman & Grandison conducted other research in
2000, and described trust as the idea of one firm to do
individually and dependently with a specific meaning. They
defined trust based on behavioral and security issues, while
popularity and reliability of trust suggested by Fukuyama.
2.6 Trust and User Satisfaction
User satisfaction is a popular measure of IS success, in which
many standardized instruments have been improved and
tested (Zviran et al., 2003; Doll et al., 2004). User satisfaction
is an essential construct because it’s related to other important
variables, including systems analysis and design. Satisfaction
has been used to evaluate IS success and effectiveness, the
success in decision supports systems, office automation
success and the utility of IS in decision making (Zviran et al.,
2006). In web-based systems, specially, satisfaction can
depend on multiple factors, such as content, navigation,
information structure, user interface and web design.
Satisfaction greatly depends on performance from marketing
perspective; however, product experience does not define
overall satisfaction lonely (Anderson et al., 1993). Research
has described that the expected performance level and
knowledge achieved by outcomes that were not experienced
are also important. In other words, when individuals measure
outcomes, in fact they compare their experienced results with
the results that might have occurred and chosen differently
(Kahneman et al., 1986).
In a similar manner, development of trust has been described
as the process setting expectations of another’s behavior and
then measuring whether those expectations have been
confirmed (Garbarino et al., 1999).
Expectations can act as cognitive filtering devices by
predisposing one individual to interpret another’s behavior as
consistent with original expectations. For instance, Holmes
(1991) understood that trusting marriage partners block out or
reinterpreted actions by their spouse positively that didn’t
match their trusting expectations. In this regard, when a
consumer trusts an institution, it means there are expectations
for satisfaction according to the institution’s website that are
likely to be confirmed. Beside as shown in Figure 2.8, user
satisfaction extended to customer satisfaction and tested
following framework in mobile banking industry (Lee and
Chung, 2009).
2.7 Hypotheses development
By reviewing and getting knowledge from previous studies
and investigations, this current study recommends a
framework. With no doubt all of the links in this framework
are supported by the past studies (Figure 2.9).
It is crucial to evaluate the impact of independent factors on
dependent factors. It can be done after defining the theoretical
model as well as independent factors. So there are five
formulated hypotheses as the following statements:
H1: Trust is affected by system quality positively and
significantly.
Figure 5: Impact of user satisfaction on individual performance
Figure 6: Lee and Chung 2009
Figure 7: Proposed Framework
H1 H3

International Journal of Science and Engineering Applications
Volume 5 Issue 7, 2016, ISSN-2319-7560 (Online)
www.ijsea.com 392
H2: Trust is affected by information quality positively and
significantly.
H3: user satisfaction is affected by trust positively and
significantly.
3. Method and results To test mentioned hypotheses, this research applied
quantitative approach. In this regard, the questionnaire was
adapted from prior research developed by Delone and Mclean
(2003) and Lee and Chung (2009). It should be mentioned
that all items of questionnaire were based 5-point Likert scale.
The staffs who are working at University Putra Malaysia
(UPM) are considered as the population of this study. They
will be selected between the official members because they
are more participating in internal process that is non paperless
or paperless. Besides, the sample size was 150. Table 2 shows
the frequencies of demographic questions.
Frequency Percent Valid Percent Cumulative
Percent
Age
Valid
less than 20 30 20.0 20.0 20.0
21-40 54 36.0 36.0 56.0
41-50 42 28.0 28.0 84.0
more than 51 24 16.0 16.0 100.0
Total 150 100.0 100.0
Gender
Valid
Male 84 56.0 56.0 56.0
Female 66 44.0 44.0 100.0
Total 150 100.0 100.0
Educational level
Valid
high school and
Diploma
45 30.0 30.0 30.0
Bachelor 81 54.0 54.0 84.0
master or higher 24 16.0 16.0 100.0
Total 150 100.0 100.0
Table 2: Frequency of demographic questions
Besides, Table 2 represents central indicators of each item of questionnaire.

International Journal of Science and Engineering Applications
Volume 5 Issue 7, 2016, ISSN-2319-7560 (Online)
www.ijsea.com 393
Constructs Mean Standard
Deviation
Kurtosis Skewness
Green System Quality
The green technologies (e.g. paperless process, faster PCs, latest
version of windows, disposable glass, etc.) can be applied in my
job.
3.5533 1.27725 -.698 -.505
The green technologies/products can be considered as reliable in
my job.
3.6867 1.05000 -.188 -1.172
I have access to green products/processes any time I need. 3.4067 1.14749 -.497 -.458
The green products and processes are usable in my job.
3.6867 1.05000 -.188 -1.172
Green technology facilitates my job as well as other technologies
are being used.
3.5200 1.40813 -.633 -.882
Green Information Quality
By using the green proceeding (online banking, e-filing of taxes,
etc.) can support all means of information and services.
3.3200 1.15462 -.546 -.857
In green process, everything is more understandable.
3.4067 1.14749 -.497 -.458
The green services can connect internal and external
Networks
3.0467 1.29706 -.387 -1.089
I think the green services makes a company´s activities as secure
as well as other working processes like bookkeeping, sales
tracking, etc.
3.0733 1.25370 -.161 -1.192
Trust
I really think by using green products at the university affects
positively the environment.
3.4000 1.56728 -.369 -1.384
I really think by using green processes at the university affects
positively the environment
3.3000 1.00835 -.036 -1.247
Using the green technology enhances my effectiveness in my job. 3.1000 1.30436 -.463 -1.033
Using green technology (product and process) facilitates the
internal process towards a green environment.
3.1000 1.22474 -.193 -1.222
User Satisfaction
The green technology provides the precise information I need. 3.3800 1.51356 -.373 -1.265
The information content provided by the green technology meets
my need.
3.4133 1.02444 -.104 -1.180
The green technology provides reports that seem to be just about
exactly what I need.
3.1000 1.30436 -.463 -1.033
The green technology provides sufficient information.
3.2533 1.14802 -.430 -.943
Using green process/technology is pleasant for me. 3.2800 1.26978 -.243 -.825
Table 3: Measure of the Construct and descriptive
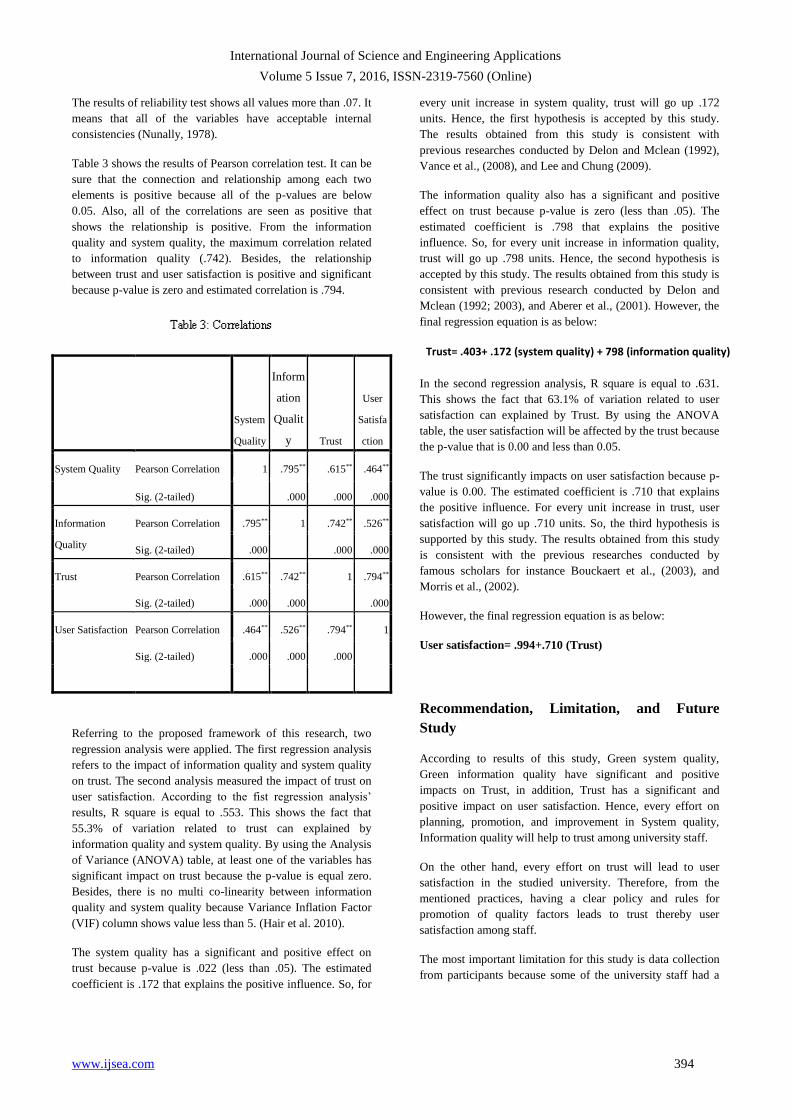
International Journal of Science and Engineering Applications
Volume 5 Issue 7, 2016, ISSN-2319-7560 (Online)
www.ijsea.com 394
The results of reliability test shows all values more than .07. It
means that all of the variables have acceptable internal
consistencies (Nunally, 1978).
Table 3 shows the results of Pearson correlation test. It can be
sure that the connection and relationship among each two
elements is positive because all of the p-values are below
0.05. Also, all of the correlations are seen as positive that
shows the relationship is positive. From the information
quality and system quality, the maximum correlation related
to information quality (.742). Besides, the relationship
between trust and user satisfaction is positive and significant
because p-value is zero and estimated correlation is .794.
System
Quality
Inform
ation
Qualit
y Trust
User
Satisfa
ction
System Quality Pearson Correlation 1 .795** .615** .464**
Sig. (2-tailed)
.000 .000 .000
Information
Quality
Pearson Correlation .795** 1 .742** .526**
Sig. (2-tailed) .000
.000 .000
Trust Pearson Correlation .615** .742** 1 .794**
Sig. (2-tailed) .000 .000
.000
User Satisfaction Pearson Correlation .464** .526** .794** 1
Sig. (2-tailed) .000 .000 .000
Referring to the proposed framework of this research, two
regression analysis were applied. The first regression analysis
refers to the impact of information quality and system quality
on trust. The second analysis measured the impact of trust on
user satisfaction. According to the fist regression analysis’
results, R square is equal to .553. This shows the fact that
55.3% of variation related to trust can explained by
information quality and system quality. By using the Analysis
of Variance (ANOVA) table, at least one of the variables has
significant impact on trust because the p-value is equal zero.
Besides, there is no multi co-linearity between information
quality and system quality because Variance Inflation Factor
(VIF) column shows value less than 5. (Hair et al. 2010).
The system quality has a significant and positive effect on
trust because p-value is .022 (less than .05). The estimated
coefficient is .172 that explains the positive influence. So, for
every unit increase in system quality, trust will go up .172
units. Hence, the first hypothesis is accepted by this study.
The results obtained from this study is consistent with
previous researches conducted by Delon and Mclean (1992),
Vance et al., (2008), and Lee and Chung (2009).
The information quality also has a significant and positive
effect on trust because p-value is zero (less than .05). The
estimated coefficient is .798 that explains the positive
influence. So, for every unit increase in information quality,
trust will go up .798 units. Hence, the second hypothesis is
accepted by this study. The results obtained from this study is
consistent with previous research conducted by Delon and
Mclean (1992; 2003), and Aberer et al., (2001). However, the
final regression equation is as below:
In the second regression analysis, R square is equal to .631.
This shows the fact that 63.1% of variation related to user
satisfaction can explained by Trust. By using the ANOVA
table, the user satisfaction will be affected by the trust because
the p-value that is 0.00 and less than 0.05.
The trust significantly impacts on user satisfaction because p-
value is 0.00. The estimated coefficient is .710 that explains
the positive influence. For every unit increase in trust, user
satisfaction will go up .710 units. So, the third hypothesis is
supported by this study. The results obtained from this study
is consistent with the previous researches conducted by
famous scholars for instance Bouckaert et al., (2003), and
Morris et al., (2002).
However, the final regression equation is as below:
User satisfaction= .994+.710 (Trust)
Recommendation, Limitation, and Future
Study
According to results of this study, Green system quality,
Green information quality have significant and positive
impacts on Trust, in addition, Trust has a significant and
positive impact on user satisfaction. Hence, every effort on
planning, promotion, and improvement in System quality,
Information quality will help to trust among university staff.
On the other hand, every effort on trust will lead to user
satisfaction in the studied university. Therefore, from the
mentioned practices, having a clear policy and rules for
promotion of quality factors leads to trust thereby user
satisfaction among staff.
The most important limitation for this study is data collection
from participants because some of the university staff had a
Trust= .403+ .172 (system quality) + 798 (information quality)

International Journal of Science and Engineering Applications
Volume 5 Issue 7, 2016, ISSN-2319-7560 (Online)
www.ijsea.com 395
little familiarity with green technology and processes, for
example, what kind of tasks can help to green environment at
the university. On the other hand, tendency of some staff
showed little willingness to participate, and also some of them
thought that participation in this research may be
contradictory with the policy of the university.
As suggestions for future researches, this study recommends
that proposed framework used in this study is examined at
other universities. Besides, researches similar to this study can
be conducted in industries such as manufacturing or banking.
Furthermore, R-square in the first Multiple Regression
analysis is .553 although this value is not very low, but it
motivates that in future researches a new variable is identified
according to literature review to help improve the framework
used in this study.
Figure 8: Proposed Framework for futurestudy
References
[1] Al-Ali, A. R., Imran Zualkernan, and Fadi Aloul. "A
mobile GPRS-sensors array for air pollution
monitoring." Sensors Journal, IEEE 10.10 (2010):
1666-1671.
[2] Anderson, Eugene W., and Mary W. Sullivan. "The
antecedents and consequences of customer
satisfaction for firms." Marketing science 12.2
(1993): 125-143.
[3] Aberer, K., & Despotovic, Z. (2001, October).
Managing trust in a peer-2-peer information system.
In Proceedings of the tenth international conference
on Information and knowledge management (pp.
310-317). ACM.
[4] Bako-Biro, Zsolt. Human perception, SBS symptoms
and performance of office work during exposure to
air polluted by building materials and personal
computers. Diss. Department for Mechanical
Engineering, Technical University of Denmark,
2004.
[5] Ballou, Donald P., and Harold L. Pazer.
"Cost/quality tradeoffs for control procedures in
information systems." Omega 15.6 (1987): 509-521.
[6] Bailey, James E., and Sammy W. Pearson.
"Development of a tool for measuring and analyzing
computer user satisfaction." Management science
29.5 (1983): 530-545.
[7] Ballou, Donald P., and Harold L. Pazer.
"Cost/quality tradeoffs for control procedures in
information systems." Omega 15.6 (1987): 509-521.
[8] Barki, Henri, and Sid L. Huff. "Change, attitude to
change, and decision support system
success." Information & Management 9.5 (1985):
261-268.
[9] Bouckaert, G., & Van de Walle, S. (2003).
Comparing measures of citizen trust and user
satisfaction as indicators of ‘good governance’:
difficulties in linking trust and satisfaction
indicators. International Review of Administrative
Sciences, 69(3), 329-343.
[10] Davis, Fred D. "Perceived usefulness, perceived
ease of use, and user acceptance of information
technology." MIS quarterly (1989): 319-340.
[11] Delone, William H. "The DeLone and McLean
model of information systems success: a ten-year

International Journal of Science and Engineering Applications
Volume 5 Issue 7, 2016, ISSN-2319-7560 (Online)
www.ijsea.com 396
update." Journal of management information
systems 19.4 (2003): 9-30.
[12] DeLone, William H., and Ephraim R. McLean.
"Information systems success: the quest for the
dependent variable." Information systems research
3.1 (1992): 60-95.
[13] Department of Environment (2006).Malaysia
Environmental Quality Report 2006.Ministry of
Natural Resources and Environment Malaysia.
[14] Gagné, Marylène, and Edward L. Deci.
"Self‐determination theory and work
motivation." Journal of Organizational
behavior 26.4 (2005): 331-362.
[15] Fisher, Craig W., and Bruce R. Kingma. "Criticality
of data quality as exemplified in two disasters."
Information & Management 39.2 (2001): 109-116.
[16] Fukuyama, Francis. Trust: The social virtues and
the creation of prosperity. New York: Free Press,
1995.
[17] Fung, Raymond, and Matthew Lee. "EC-trust (trust
in electronic commerce): exploring the antecedent
factors." AMCIS 1999 Proceedings (1999): 179.
[18] Grandison, Tyrone, and Morris Sloman. "A survey
of trust in internet applications." Communications
Surveys & Tutorials, IEEE 3.4 (2000): 2-16.
[19] Gatian, Amy W. "Is user satisfaction a valid
measure of system effectiveness?" Information &
Management 26.3 (1994): 119-131.
[20] Guimaraes, Tor, and Magid Igbaria. "Client/server
system success: exploring the human
side." Decision Sciences 28.4 (1997): 851-876.
[21] Garbarino, Ellen, and Mark S. Johnson. "The
different roles of satisfaction, trust, and commitment
in customer relationships." The Journal of
Marketing (1999): 70-87.
[22] Holmes, John G. "Trust and the appraisal process in
close relationships." (1991).
[23] Hair, Joseph F., et al. "Black (1998), Multivariate
data analysis." (1998): 577-664.
[24] Hou, Chung-Kuang. "Examining the effect of user
satisfaction on system usage and individual
performance with business intelligence systems: An
empirical study of Taiwan's electronics
industry." International Journal of Information
Management 32.6 (2012): 560-573.
[25] Hjelt, Mathias, and Bo-Christer Björk. "End-user
attitudes toward EDM use in construction project
work: case study." Journal of computing in civil
engineering 21.4 (2007): 289-300.
[26] Igbaria, Magid, and Margaret Tan. "The
consequences of information technology acceptance
on subsequent individual performance." Information
& Management32.3 (1997): 113-121.
[27] IGPN. (2009). Green Purchasing. Retrieved on
October 9, 2009, from
http://www.igpn.org/focus_on/igp_conf_2009/index
.html
[28] Kahneman, Daniel, and Dale T. Miller. "Norm
theory: Comparing reality to its
alternatives." Psychological review 93.2 (1986):
136-153.
[29] Lee, Kun Chang, and Namho Chung.
"Understanding factors affecting trust in and
satisfaction with mobile banking in Korea: a
modified DeLone and McLean’s model
perspective." Interacting with computers 21.5
(2009): 385-392.

International Journal of Science and Engineering Applications
Volume 5 Issue 7, 2016, ISSN-2319-7560 (Online)
www.ijsea.com 397
[30] Lin, Hsin-Hui, and Yi-Shun Wang. "An
examination of the determinants of customer loyalty
in mobile commerce contexts." Information &
management 43.3 (2006): 271-282.
[31] Lee, Seul-Ki, and Jung-Ho Yu. "Success model of
project management information system in
construction." Automation in construction 25
(2012): 82-93.
[32] Mahmoud Manafi, Roozbeh Hojabri, Ali Haj
Aghapour, Mehrdad Salehi, Mohammad Reza
Aghaei, Reza Ghesmi (2011), Trust in E-commerce,
IJCRB, Vol.3, Issue 6, Pages 774-788
[33] Morris, S. A., Marshall, T. E., & Rainer Jr, R. K.
(2002). Impact of user satisfaction and trust on
virtual team members. Information Resources
Management Journal (IRMJ), 15(2), 22-30.
[34] MGPN. (2003, March). An Introductory Study on
Green Purchasing Activities in Malaysia. Green
Purchasing Network Malaysia: Kuala Lumpur.
[35] Narasimhaiah G., Toni, M.S.,Wong B.,
Organizational impact of system quality,
information quality and service quality, The Journal
of Strategic Information Systems 19 (3) (2010)
207–228.
[36] Nunnally, J. C. (1978). Psychometric theory (2nd
ed.). New York: McGraw-Hill.
[37] Nelson, R. Ryan, Peter A. Todd, and Barbara H.
Wixom. "Antecedents of information and system
quality: an empirical examination within the context
of data warehousing." Journal of Management
Information Systems 21.4 (2005): 199-235.
[38] Pallant, J. "SPSS Survival Guide: A step by step
guide to data analysis using SPSS." Open University
Press: McGraw-Hill Education. Retrieved January
1 (2001): 2006.
[39] Petter, S., DeLone, W., & McLean, E. (2008).
Measuring information systems success: models,
dimensions, measures, and interrelationships.
European Journal of Information Systems, 17(3),
236-263.
[40] Pitt, Leyland F., Richard T. Watson, and C. Bruce
Kavan. "Service quality: a measure of information
systems effectiveness." MIS quarterly (1995): 173-
187
[41] Ravali, K., and P. Ashok Kumar. "Techno-
Pollution." Computer 1.4 (2011): 1416-1420.
[42] Raymond, Louis, and François Bergeron. "Project
management information systems: An empirical
study of their impact on project managers and
project success." International Journal of Project
Management 26.2 (2008): 213-220.
[43] Rai, A., Lang, S.S., Welker, R.B., 2002. Assessing
the validity of is success models: an empirical test
and theoretical analysis. Information System
Research 13,50–69.
[44] Seddon, Peter B. "A respecification and extension
of the DeLone and McLean model of IS
success." Information systems research 8.3 (1997):
240-253.
[45] Swanson, E. Burton. "Management information
systems: appreciation and involvement."
Management Science 21.2 (1974): 178-188.
[46] Vance, A., Elie-Dit-Cosaque, C., & Straub, D. W.
(2008). Examining trust in information technology
artifacts: the effects of system quality and culture.
Journal of Management Information Systems, 24(4),
73-100.
[47] Zmud, Robert W. "Individual differences and MIS
success: A review of the empirical literature."
Management Science 25.10 (1979): 966-979.

International Journal of Science and Engineering Applications
Volume 5 Issue 7, 2016, ISSN-2319-7560 (Online)
www.ijsea.com 398
[48] Zviran, Moshe, and Zippy Erlich. "Measuring IS
user satisfaction: review and
implications." Communications of the Association
for Information Systems 12.1 (2003): 5.
[49] Zviran, Moshe, Chanan Glezer, and Itay Avni.
"User satisfaction from commercial web sites: the
effect of design and use." Information &
Management 43.2 (2006): 157-178.
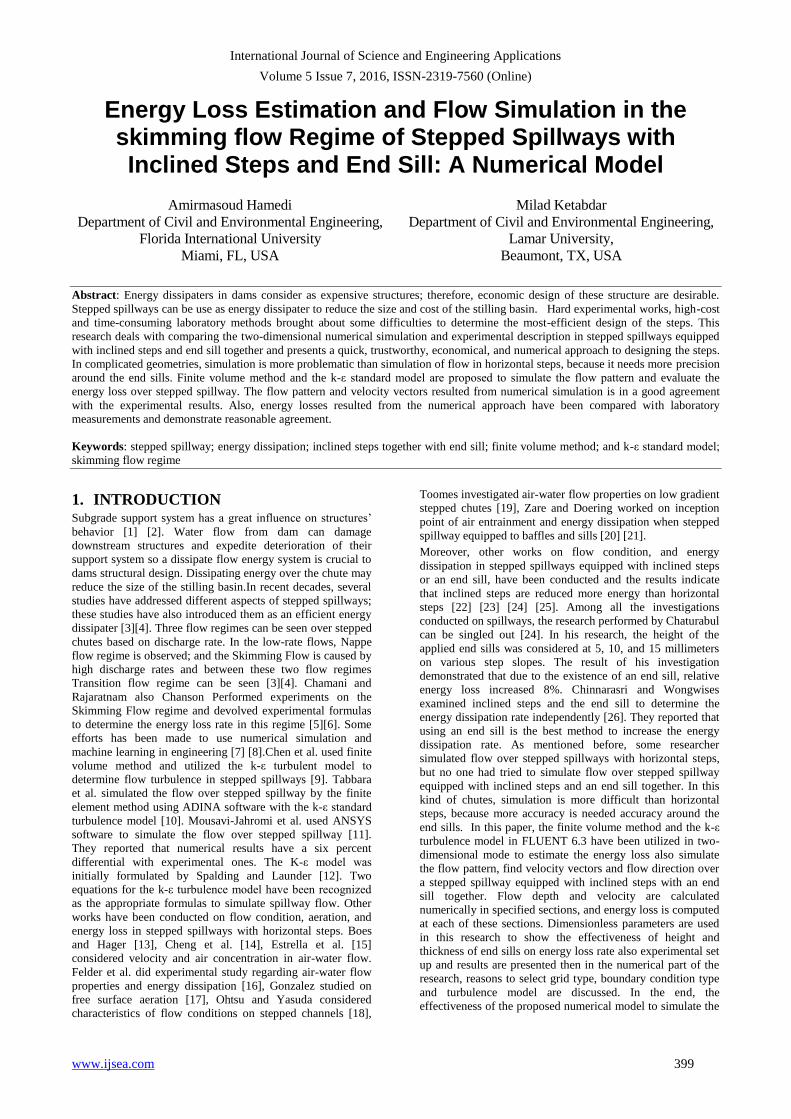
International Journal of Science and Engineering Applications
Volume 5 Issue 7, 2016, ISSN-2319-7560 (Online)
www.ijsea.com 399
Energy Loss Estimation and Flow Simulation in the skimming flow Regime of Stepped Spillways with Inclined Steps and End Sill: A Numerical Model
Amirmasoud Hamedi
Department of Civil and Environmental Engineering,
Florida International University
Miami, FL, USA
Milad Ketabdar
Department of Civil and Environmental Engineering,
Lamar University,
Beaumont, TX, USA
Abstract: Energy dissipaters in dams consider as expensive structures; therefore, economic design of these structure are desirable.
Stepped spillways can be use as energy dissipater to reduce the size and cost of the stilling basin. Hard experimental works, high-cost
and time-consuming laboratory methods brought about some difficulties to determine the most-efficient design of the steps. This
research deals with comparing the two-dimensional numerical simulation and experimental description in stepped spillways equipped
with inclined steps and end sill together and presents a quick, trustworthy, economical, and numerical approach to designing the steps.
In complicated geometries, simulation is more problematic than simulation of flow in horizontal steps, because it needs more precision
around the end sills. Finite volume method and the k-ε standard model are proposed to simulate the flow pattern and evaluate the
energy loss over stepped spillway. The flow pattern and velocity vectors resulted from numerical simulation is in a good agreement
with the experimental results. Also, energy losses resulted from the numerical approach have been compared with laboratory
measurements and demonstrate reasonable agreement.
Keywords: stepped spillway; energy dissipation; inclined steps together with end sill; finite volume method; and k-ε standard model;
skimming flow regime
1. INTRODUCTION Subgrade support system has a great influence on structures’
behavior [1] [2]. Water flow from dam can damage
downstream structures and expedite deterioration of their
support system so a dissipate flow energy system is crucial to
dams structural design. Dissipating energy over the chute may
reduce the size of the stilling basin.In recent decades, several
studies have addressed different aspects of stepped spillways;
these studies have also introduced them as an efficient energy
dissipater [3][4]. Three flow regimes can be seen over stepped
chutes based on discharge rate. In the low-rate flows, Nappe
flow regime is observed; and the Skimming Flow is caused by
high discharge rates and between these two flow regimes
Transition flow regime can be seen [3][4]. Chamani and
Rajaratnam also Chanson Performed experiments on the
Skimming Flow regime and devolved experimental formulas
to determine the energy loss rate in this regime [5][6]. Some
efforts has been made to use numerical simulation and
machine learning in engineering [7] [8].Chen et al. used finite
volume method and utilized the k-ε turbulent model to
determine flow turbulence in stepped spillways [9]. Tabbara
et al. simulated the flow over stepped spillway by the finite
element method using ADINA software with the k-ε standard
turbulence model [10]. Mousavi-Jahromi et al. used ANSYS
software to simulate the flow over stepped spillway [11].
They reported that numerical results have a six percent
differential with experimental ones. The K-ε model was
initially formulated by Spalding and Launder [12]. Two
equations for the k-ε turbulence model have been recognized
as the appropriate formulas to simulate spillway flow. Other
works have been conducted on flow condition, aeration, and
energy loss in stepped spillways with horizontal steps. Boes
and Hager [13], Cheng et al. [14], Estrella et al. [15]
considered velocity and air concentration in air-water flow.
Felder et al. did experimental study regarding air-water flow
properties and energy dissipation [16], Gonzalez studied on
free surface aeration [17], Ohtsu and Yasuda considered
characteristics of flow conditions on stepped channels [18],
Toomes investigated air-water flow properties on low gradient
stepped chutes [19], Zare and Doering worked on inception
point of air entrainment and energy dissipation when stepped
spillway equipped to baffles and sills [20] [21].
Moreover, other works on flow condition, and energy
dissipation in stepped spillways equipped with inclined steps
or an end sill, have been conducted and the results indicate
that inclined steps are reduced more energy than horizontal
steps [22] [23] [24] [25]. Among all the investigations
conducted on spillways, the research performed by Chaturabul
can be singled out [24]. In his research, the height of the
applied end sills was considered at 5, 10, and 15 millimeters
on various step slopes. The result of his investigation
demonstrated that due to the existence of an end sill, relative
energy loss increased 8%. Chinnarasri and Wongwises
examined inclined steps and the end sill to determine the
energy dissipation rate independently [26]. They reported that
using an end sill is the best method to increase the energy
dissipation rate. As mentioned before, some researcher
simulated flow over stepped spillways with horizontal steps,
but no one had tried to simulate flow over stepped spillway
equipped with inclined steps and an end sill together. In this
kind of chutes, simulation is more difficult than horizontal
steps, because more accuracy is needed accuracy around the
end sills. In this paper, the finite volume method and the k-ε
turbulence model in FLUENT 6.3 have been utilized in two-
dimensional mode to estimate the energy loss also simulate
the flow pattern, find velocity vectors and flow direction over
a stepped spillway equipped with inclined steps with an end
sill together. Flow depth and velocity are calculated
numerically in specified sections, and energy loss is computed
at each of these sections. Dimensionless parameters are used
in this research to show the effectiveness of height and
thickness of end sills on energy loss rate also experimental set
up and results are presented then in the numerical part of the
research, reasons to select grid type, boundary condition type
and turbulence model are discussed. In the end, the
effectiveness of the proposed numerical model to simulate the

International Journal of Science and Engineering Applications
Volume 5 Issue 7, 2016, ISSN-2319-7560 (Online)
www.ijsea.com 400
flow pattern, velocity vectors, flow direction and evaluate
energy loss rate in a stepped spillway equipped with inclined
steps with an end sill are discussed.
1.1 Energy Loss Equations Chanson presented an equation in order to estimate
dissipation energy rate in Skimming flow in stepped spillways
[6]:
(1)
Where f can be obtained as follows:
(2)
Where DH is hydraulic depth of flow. Foregoing equation
is applicable for mild slope chutes ( .Another
equation, which can be used for determining the dissipation
energy rate in the Skimming flow regime, is the utilization of
Chanson’s equation to calculate the remaining energy at the
end of the chute. [6]
(3)
Where y is depth of fresh water and Hres is remaining
energy at the end of the chute. The following equation is to
calculate y:
(4)
f is calculated from (2). The following equation has been
also offered by Chamani and Rajaratnam in order to estimate
the remaining energy at the end of the chute. [5]
(5)
Where ym is mixed depth (air and water); um is mixed
flow velocity and z is height from baseline.
2. DIMENSIONAL ANALYSIS Buckingham's Pi Method, as one of the most appropriate
methods in dimensional analysis, has been used in this study.
Effective parameters for energy dissipation in sloped stepped
spillways, include: discharge per unit width, flow head, step
length, step height, slope height, and gravity acceleration [27].
In this research, other factors such as spillway slope, water
density and number of steps are considered as follows.
Effective factors for energy dissipation in a stepped spillway
equipped with inclined steps and the end sill together include:
q: Discharge in the unit width of the spillway
s: The spillway slope
EL: Energy loss
E0: Flow head
h: Step height
ρw: Water density
l: Step length
N: Number of steps
m: Height of (slope + end sill)
t: Thickness of the end sill
g: Gravity acceleration
(6)
Dimensionless parameters resulted from Buckingham's Pi
theories:
(7)
The number of variables is n=11.
Basic dimensions
π=n-m=11-3=8
(8)
(9)
The performed dimensional analysis is for a stepped spillway
equipped with inclined steps and the end sill together. In this
research, only the “m/h” dimensionless parameter is used.
3. EXPERIMENTAL SETUP This research has been conducted at the Water Research
Institute in Iran. Side walls and steps were made of Plexiglas.
The broad-crested weir has been used as the spillway in the
chute and the number of steps is 60. In the present
investigation, only four steps are inclined and equipped with
the sill; all are placed after the middle of the chute (steps 39-
42). The horizontal length of the steps is 14 centimeters; the
step height is 4.66 centimeters and the chute width is 1.33
meters. Flow depth and velocity have been measured during
each test using a liminimeter (with a precision of 1 millimeter)
and a pitot-tube, respectively. The experiments have been
conducted for one discharge in the Skimming Flow regime
(90 liters per second, q=0.0677 m2/s). Flow discharge has
been measured by the sharp crested weir at the end of the
downstream chute. Characteristics of the used end sills are
presented in Figure 1 and Table 1. Three different slopes of
7°, 10°, and 12°, respectively, about the horizon were used.

International Journal of Science and Engineering Applications
Volume 5 Issue 7, 2016, ISSN-2319-7560 (Online)
www.ijsea.com 401
Table 1. End sill specifications
The depth along the spillway width was measured by a
liminimeter across each line of the piezometers. Three depth
measurement were recorded in each section because of
insufficient liminimeter accuracy and the possibility of an
outlook error. Finally, an average of these three depths across
each line of the piezometer was used as the step depth. The
pitot-tube was used to measure the velocity. This
measurement was laborious, since the flow was a two-phase
flow and bleeding had to be performed regularly. The velocity
was measured on both sides and in the middle at 0.6 meters of
depth. Finally, averages of these all three sections were
averaged and set as the average velocity of that step. The
piezometer was used to statically measure pressure
fluctuation. These data points were used to enter pressures as
initial values in a numerical simulation. In this chute, only
four steps (39-42) were inclined and had sill. Depth and
velocity values were measured on these steps, as well as on
the 38th step.
The entrance flow from the reservoir into the chute flows
through the transferring pipes from the pumps and falls into
the reservoir. When the reservoir completely fills, the vent
opens and flow falls into the chute. The utilized pump has a
capacity of 220 liters per second. The following equations
were used to determine upstream and downstream energy for
the modified steps:
(10)
(11)
Where H is flow energy, y is flow depth, V is flow velocity in
the proper sections, g is gravity acceleration and Z is the
height above the baseline (The bottom of the last modified
step has been assumed to be the baseline, and Z=0).
4. A NUMERICAL APPROACH The numerical approach (Fluent 6.3) has been applied to
simulate flow and estimate energy loss over stepped spillway
equipped with an inclined step and an end sill, together. In
this section, grid characteristics, the grid adaption method,
boundary conditions, the turbulent model and the solver
method details are discussed.
4.1 Geometry and Meshing In the Finite Volume Method initial differential equations
should be integrated into a physical space, and then should be
solved using numerical methods. For that reason, point’s grid
should be developed directly in a physical space. Due to this,
there is a non-zero probability that points in the grid don’t
relate to lines in the grid. These kind of grids are known as
unstructured grids. A structured grid is easy to develop in
simple geometry [28]. It needs less memory and time to
resolve. However, in complex geometry, like the situation in
this study, it is recommended to use unstructured grids with
triangular elements. The required time to develop an
unstructured grid in this study (complex geometry) is less than
the required time to develop a structured grid. Although an
unstructured grid needs more time and memory to solve the
problem, it is still worth it to use in the study. The
unstructured grid for this research was developed in Gambit
software by triangular elements [29][30][31].
The Region Adaption Technique has been applied in this
study. This technique makes triangular elements smaller
around end sills, to achieve high accuracy. The grid has been
divided into small triangles, depending on the required
precision, (Figure 2) and considered 0.001 up to 0.01 meters,
Also, to increase grid quality, smoothing and swapping have
been applied. Smoothing rearranges cells to improve grid
quality. It is recommended to use smoothing based on
skewness when triangular elements have been used (Fluent
6.3 user’s guide). For that reason, smoothing based on
skewness has been applied to decrease the grid’s maximum
skewness. This method tries to decrease the skewness in cells
with the skewness higher than the maximum limit, which is
0.4 in this study, by rearranging the cells. Furthermore, face
swapping has been used to the grid to increase quality. In
triangle cells, the Delaunay Method has been applied to
improve grid quality.
(p-t) mm
6-5 6-10
8-5 8-10
10-5 10-10
15-5 15-10
Figure 1. Schematic of the end sill
1
Figure 2. Applied unstructured grid

International Journal of Science and Engineering Applications
Volume 5 Issue 7, 2016, ISSN-2319-7560 (Online)
www.ijsea.com 402
4.2 Initial and Boundary Condition There are two sections in the inlet (Figure 3), which are
separated by the flow surface. In the lower section, the
boundary type has been selected as velocity inlet, because this
part is full of water with a certain velocity. The flow depth in
each test is selected as height of this section. Also, the
velocity in each test is entered into the software by magnitude
and direction. The x-direction is selected as a velocity
direction. The second section is above flow, with the pressure
equal to atmospheric pressure. For that reason, the pressure
inlet boundary type is selected for this section. The area above
the steps has a similar situation to the second section.
Therefore, the pressure inlet boundary condition is selected
for this area. In the outlet, there are two sections. The first
section includes flow and the second one includes air.
Because pressure inlet is selected in the inlet, the outflow
boundary condition cannot be used in this section and the
pressure outlet boundary condition should be used as
boundary condition. In the end, the wall boundary condition
has been applied to the steps.
4.3 Turbulence Modeling Both the water and air phases should be defined in the
software to simulate he flow over the chute. The volume
fraction is defined as “0” when the cell volume is out of
water. The volume fraction is defined as “1” when the cell
volume is full of water. The software will calculate the
volume fraction of each cell based on the water and air
percentage in that particular cell.
When the Reynolds number is large, or the geometry is
complicated, it is impossible to solve time-dependent Navier-
Stokes Equations completely. The Reynolds Average Navier-
Stokes Equations (RANS) can solve the Navier – Stokes
Equations in the way that turbulent flow fluctuations don’t
directly enter into the equations. In this method, new variables
and extra quantities are introduced in governing equations.
These new variables and quantities should be calculated by
the turbulent models [30]. RANS Method has been applied in
this research, because it can solve flows with a strong vortex
and naturally unsteady flows with moderate cost. Among
turbulent models, the Spalart- Allmaras, k- , k- , and
Reynolds Stress Model (RSM) use the RANS Method and all
of them are available in Fluent 6.3. In the RANS Method,
continuity and momentum equations are as follows [33]:
(12)
(13)
Where is density, is molecular viscosity, is time, is
the coordinate component, is the velocity component, and
is pressure. Reynolds stresses should be calculated to solve
the problem with the RANS Method. One of the methods that
can be used to calculate Reynolds stresses is the Boussinesq
Hypothesis (equation 14), which has a reasonable calculation
cost.
(14)
Where is the turbulence viscosity. when i=j
and when i j. Some turbulent models like Spalart-
Allmaras, k- , and k- use the Boussinesq Hypothesis. The
k- style models (standard, RNG, and Realizable) and the k-
turbulent models solve two equations to calculate turbulent
viscosity. The number of equations denotes the number of
additional Partial Differential Equations (PDEs) that should
be solved.
Among the k- style models (standard, RNG, and Realizable)
and the k- turbulent models, the k- standard is selected to
be considered in this study as the first turbulent model
attempt, due to its simplicity and reasonable cost.
Furthermore, it has been previously used to successfully
simulate flow over stepped spillways [9]. This turbulent
model solves “k” and “ “equations as additional PDEs to
find turbulent viscosity. “k(t)” is an instantaneous kinetic
energy and is the sum the mean kinetic energy (K) and the
turbulent kinetic energy (k). and (simplified) are as
follows:
(15)
(16)
Figure 3. Boundary conditions

International Journal of Science and Engineering Applications
Volume 5 Issue 7, 2016, ISSN-2319-7560 (Online)
www.ijsea.com 403
There are five terms in both equations. From left to right, the
terms are the rate of increase, convective transport, diffusive
transport, the rate of production, and the rate of destruction,
respectively. Where is calculated by the following
equation using and (turbulence energy dissipation rate):
(17)
Where ρ is the fluid density, is the experimental
constant and equals to 0.09. Prandtl’s turbulence numbers for
and consist of =1.0, =1.3,
and which are the constants of the relation [34].
The Second Order Implicit pressure based solver has been
applied in this research. Moreover, the segregated algorithm
has been used, because it needs less memory than the coupled
algorithm. Furthermore, the First Order Upwind Method has
been applied in turbulent kinetic energy and turbulent
dissipation rate equations. The PISO method has been applied
as a pressure velocity coupling method.
5. RESULTS AND DISCUSSION The energy loss outcomes from the horizontal steps was
0.3514 and 0.3508, respectively, derived from the Chanson
equations (Equations 2 to 5) and from the test (Equations 10
and 11), which shows acceptable agreement. The changes
were then applied to the steps, and the energy loss was
measured for various slopes and end sills. In this section, the
parameter m= (p+w) is used, where p is the height of the end
sill, and w is the height of the step inclination (Figure 4).
In Figure 5, it is obvious that if the “m/h” ratio increases, up
to 0.7, the energy loss rate increases. After that, it decreases.
This graph indicates that the best ratio for “m/h” is about 0.7,
and an excessive increase negatively affects the energy loss
rate. When the “m/h” ratio goes past 0.7, the flow jumps from
one or more steps and the energy loss rate decrease (Figures
6a and 6b). This step plays practically no role in energy
dissipation. As a consequence, the energy loss rate decreases.
Figure 5. Energy dissipation loss per “m” for all examined
slopes
.
Figure 4. Schematic of the step
All
Slopes
10mm
5mm
m/h
Figure 6a. Slope 7°, height of end sill=6mm
and thickness=5mm
Figure 6b. Slope=12°, height of end
sill=15mm and thickness=5mm
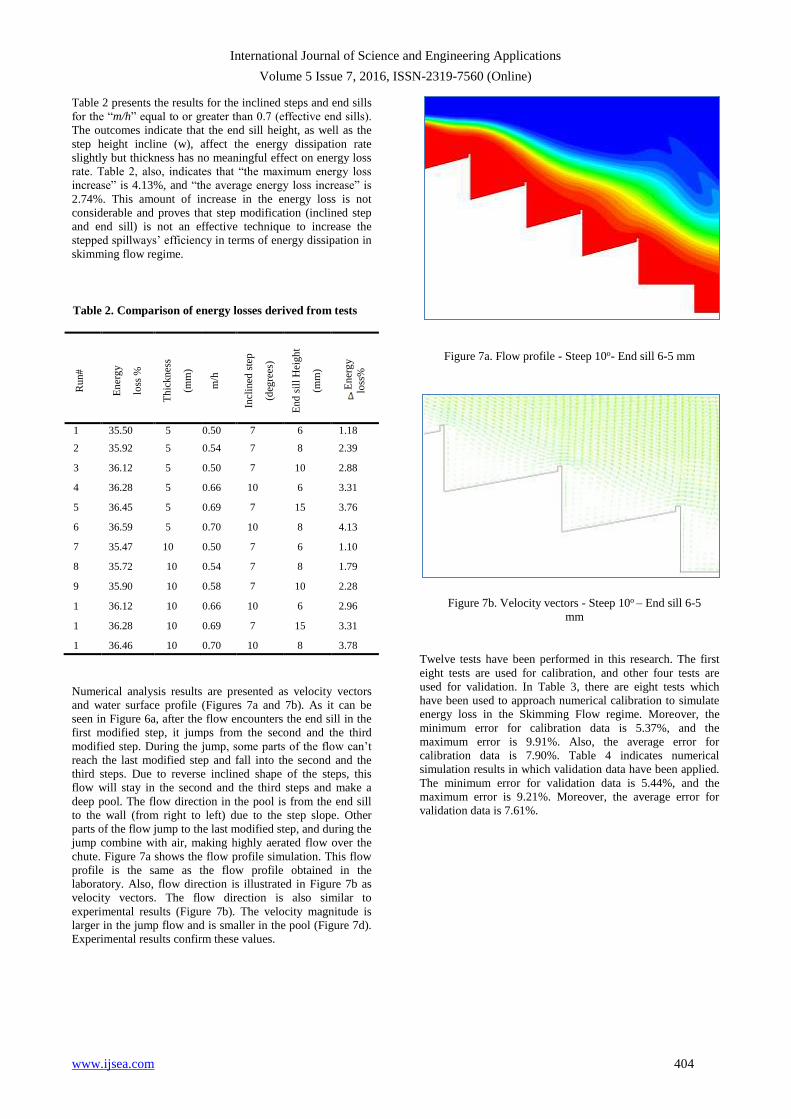
International Journal of Science and Engineering Applications
Volume 5 Issue 7, 2016, ISSN-2319-7560 (Online)
www.ijsea.com 404
Table 2 presents the results for the inclined steps and end sills
for the “m/h” equal to or greater than 0.7 (effective end sills).
The outcomes indicate that the end sill height, as well as the
step height incline (w), affect the energy dissipation rate
slightly but thickness has no meaningful effect on energy loss
rate. Table 2, also, indicates that “the maximum energy loss
increase” is 4.13%, and “the average energy loss increase” is
2.74%. This amount of increase in the energy loss is not
considerable and proves that step modification (inclined step
and end sill) is not an effective technique to increase the
stepped spillways’ efficiency in terms of energy dissipation in
skimming flow regime.
Table 2. Comparison of energy losses derived from tests
Run#
En
erg
y
loss
%
Th
icknes
s
(mm
)
m/h
Incl
ined
ste
p
(deg
rees
)
End
sil
l H
eigh
t
(mm
)
En
erg
y
loss
%
1 35.50
00
5 0.50
00
7 6 1.18
2 35.92
2
5 0.54 7 8 2.39
3 36.12 5 0.50
8
7 10 2.88
4 36.28 5 0.66 10 6 3.31
5 36.45 5 0.69 7 15 3.76
6 36.59 5 0.70 10 8 4.13
7 35.47 10 0.50 7 6 1.10
8 35.72 10 0.54 7 8 1.79
9 35.90 10 0.58 7 10 2.28
1
0
36.12 10 0.66 10 6 2.96
1
1
36.28 10 0.69 7 15 3.31
1
2
36.46 10 0.70 10 8 3.78
88
Numerical analysis results are presented as velocity vectors
and water surface profile (Figures 7a and 7b). As it can be
seen in Figure 6a, after the flow encounters the end sill in the
first modified step, it jumps from the second and the third
modified step. During the jump, some parts of the flow can’t
reach the last modified step and fall into the second and the
third steps. Due to reverse inclined shape of the steps, this
flow will stay in the second and the third steps and make a
deep pool. The flow direction in the pool is from the end sill
to the wall (from right to left) due to the step slope. Other
parts of the flow jump to the last modified step, and during the
jump combine with air, making highly aerated flow over the
chute. Figure 7a shows the flow profile simulation. This flow
profile is the same as the flow profile obtained in the
laboratory. Also, flow direction is illustrated in Figure 7b as
velocity vectors. The flow direction is also similar to
experimental results (Figure 7b). The velocity magnitude is
larger in the jump flow and is smaller in the pool (Figure 7d).
Experimental results confirm these values.
Figure 7a. Flow profile - Steep 10o- End sill 6-5 mm
Twelve tests have been performed in this research. The first
eight tests are used for calibration, and other four tests are
used for validation. In Table 3, there are eight tests which
have been used to approach numerical calibration to simulate
energy loss in the Skimming Flow regime. Moreover, the
minimum error for calibration data is 5.37%, and the
maximum error is 9.91%. Also, the average error for
calibration data is 7.90%. Table 4 indicates numerical
simulation results in which validation data have been applied.
The minimum error for validation data is 5.44%, and the
maximum error is 9.21%. Moreover, the average error for
validation data is 7.61%.
Figure 7b. Velocity vectors - Steep 10o – End sill 6-5
mm

International Journal of Science and Engineering Applications
Volume 5 Issue 7, 2016, ISSN-2319-7560 (Online)
www.ijsea.com 405
Table 3. Energy loss -Various end sills –Calibration
Energy loss %
Run#
Exp
erim
enta
l
Nu
mer
ical
Err
or%
1 35.50 37.78 6.03
2 35.92 37.96 5.37
4 36.28 38.99 6.95
5 36.45 39.18 6.97
7 35.47 39.37 9.91
8 35.72 39.58 9.75
10 36.12 39.79 9.22
12 36.46 40.06 8.99
Table 4. Energy loss – Varoious end sill - Validation
Energy loss%
Run
#
Exp
erim
enta
l
Nu
mer
ical
E
rro
r%
3 36.12 38.20 5.44
6 36.59 39.26 6.80
9 35.90 39.45 9.00
11 36.28 39.96 9.21
6. CONCLUSION In this study, four steps (39 to 42) have been modified and
equipped with inclined steps and an end sill, together. End
sills with several heights and thickness have been tested in
three reverse stepped slopes (7, 10 and 12 degrees,
respectively). The “m/h,” has been used as a dimensionless
parameter to determine the energy loss rate. Results denote
that in the discharge 90 L/s (q=0.0667 m2/s), which represents
the Skimming Flow regime, inclined steps and an end sill
slightly increases the energy loss rate. The average of this
increment is about 2.74% in effective end sills. Moreover,
FLUENT 6.3 software was used in this research to simulate
the flow over a stepped spillway. A numerical approach using
the finite volume method, triangular elements, an unstructured
grid and the k- standard turbulent model has been
successfully applied to simulate flow pattern, velocity vectors
in the complicated geometry of stepped spillways equipped
with inclined steps and end sill together. Furthermore, the
energy loss has been estimated using the numerical model. In
the first step, eight tests (out of twelve) were selected for
calibration; afterwards, four other tests were operated for
validation. Numerical results for depth and velocity were used
to calculate energy loss. The results illustrate some
differences between the numerical and experimental
outcomes. Average errors, generated by comparing the energy
loss results between the experimental and numerical methods,
were 7.90% and 7.61% for the calibration and validation data,
respectively. The amount of these errors denotes that
numerical models can be used as a low-priced and prompt
method to estimate the energy dissipation rate in a stepped
spillway equipped with inclined steps and end sills together.
Acknowledgment The authors wish to acknowledge the support received in
the form of a graduate assistantship from the Civil and
Environmental Engineering Department, Florida International
University. Also, the authors wish to acknowledge the Water
Research Institute, Iran for providing the model and
instruments to conduct experiments in the hydraulic
laboratory.
Notation
The following symbols are used in this paper:
Constant in the k- turbulent model
Constant in the k- turbulent model
Constant in the k- turbulent model
Critical depth (m)
Flow head (m)
Energy loss
Total head in section 1 (m)
Total head in section 2 (m)
Critical depth (m)
Dam height (m)
Total energy (Hdam+3/2hc) (m)
Residual height (m) (Fratino and Piccini)
= Step height (cm)
= Horizontal step length (cm, m)
Velocity component in the x-direction (m/s)
Velocity component in the y-direction (m/s)
Velocity component in the z-direction (m/s)
Velocity component in the i- or j-direction
(turbulent) (m/s)
Velocity in section 1 (m/s)
Velocity in section 2 (m/s)
Depth in section 2 (cm)
= Water Density (kg/m3
Constant in the k- turbulent model
Constant in the k- turbulent model
= 1) Flow depth on step (cm)
2) Depth in section 1 (cm)
Turbulent viscosity
Dissipated energy in the length of the chute
a = Variable in the Chamani and Rajaratnam Equation
b = Variable in the Chamani and Rajaratnam Equation
g = Gravitational acceleration (m/s2
h = Step height (cm)
k = Turbulence kinetic energy
= Step length (cm, m)
L = Length in dimension analysis (m)
M = Mass in dimension analysis (kg)
1) Height of slope + end sill (mm)
2) Basic variables (Pi Buckingham Theorem)
n = Number of variables in the Pi Buckingham Theorem
International Journal of Science and Engineering Applications
Volume 5 Issue 7, 2016, ISSN-2319-7560 (Online)
www.ijsea.com 406
Number of steps
End sill height (mm)
Unit discharge (m3/m. s)
r = Basic (main) parameters in dimension analysis
Chute slope
T = Time in dimension analysis (second)
1) End sill thickness (mm)
2) time (s)
Height caused by the slope in inclined step (mm)
Direction
Distance to the baseline (m)
= All parameters in dimension analysis
Energy loss coefficient
Turbulence energy dissipation rate
Dynamic viscosity (kg.m/s)
= In Buckingham Method
References
[1] Sadeghi, J., & Fesharaki, M. 2013. Importance of
nonlinearity of track support system in modeling of
railway track dynamics. International Journal of
Structural Stability and Dynamics, 13(01), 1350008.
[2] Esmaeili, M., Sadeghi, J., & Fesharaki, M. 2014,
February. Vehicle dynamic interaction with railway track
embankment. In Proceedings of the Institution of Civil
Engineers-Transport (Vol. 167, No. 1, pp. 15-26).
Thomas Telford Ltd.
[3] Chamani, M., & Rajaratnam,. 1994. Jet flow on
stepped spillways. Journal of Hydraulic Engineering 120
(1994): 254–259.
[4] Chanson, H. 1994. Comparison of energy dissipation
between nappe and skimming flow regimes on stepped
chutes. Journal of Hydraulic Research, 32: 213–218.
[5] Chamani, M. R., & Rajaratnam, N. 1999.
Characteristics of skimming flow over stepped
spillways. Journal of Hydraulic Engineering, 125(4),
361-368.
[6] Chanson, H., Yasuda, Y., & Ohtsu, I. 2002. Flow
resistance in skimming flows in stepped spillways and its
modelling. Canadian Journal of Civil Engineering, 29(6),
809-819.
[7] Bardestani, S., Givehchi, M., Younesi, E., Sajjadi, S.,
Shamshirband, S., & Petkovic, D. 2016. “Predicting
turbulent flow friction coefficient using ANFIS
technique.” Signal, Image and Video Processing, 1-7.
[8] Sajjadi, S., Shamshirband, S., Alizamir, M., Yee, L.,
Mansor, Z., Manaf, A. A., ... & Mostafaeipour, A. 2016.
“Extreme learning machine for prediction of heat load in
district heating systems.” Energy and Buildings, 122,
222-227.
[9] Chen, Q., Dai, G., & Liu, H. 2002. Volume of Fluid
Model for Turbulence Numerical Simulation of Stepped
Spillway Overflow. Journal of Hydraulic Engineering,
128 : 683–688.
[10] Tabbara, M., Chatila, J., & Awwad, R. 2005.
Computational simulation of flow over stepped
spillways. Computers and Structures, 83: 2215–2224.
[11] Musavi-Jahromi, H., Bina, M., & Salmasi, F. 2008.
Physical and numerical modeling of the nappe flow in
the stepped spillways. Journal of Applied Sciences, 8:
1720–1725.
[12] Launder, Edward, B., & Spalding, Dudley Brian.
1972 Lectures in mathematical models of turbulence.
[13] Boes R. M.Hager W.H. 2003. Hydraulic Design of
Stepped Spillways. Journal of Hydraulic Engineering
vol.129,No 9.,sep,page:671-679.
[14] Cheng, X., and Xuewei Chen. 2013. Numerical
Simulation of Dissolved Oxygen Concentration in Water
Flow over Stepped Spillways. Water Environment
Research 85.5: 434-446.
[15] Estrella T., Soledad, et al. 2013. Velocity and air
concentration in air-water flow: application on a stepped
spillway without sidewalls.
[16] Felder, S., Guenther, P., & Chanson, H. 2012. Air-
water flow properties and energy dissipation on stepped
spillways: a physical study of several pooled stepped
configurations. School of Civil Engineering, The
University of Queensland.
[17] Gonzalez C.A. 2005. An Experimental study of
Free-surface Aeration on Embankment Stepped Chutes.
Ph.D Thesis.University of Queensland.Department of
Civil Engineering.
[18] Ohtsu, I. , and Yasuda, r. 1997. Characteristics of
flow conditions on stepped channels. Proc., 27th
IAHR.Biennal congree, Sanfrancisco, 583-588.
[19] Toomes L. 2002. Experimental study of Air-Water
Flow properties on Low gradient stepped Cascades. Ph.D
Thesis. U niversity of Queensland, Brisbane,Austraklia.
[20] Zare, H. K., & Doering, J. C. 2012. Energy
dissipation and flow characteristics of baffles and sills on
stepped spillways. Journal of Hydraulic Research, 50
:192–199.
[21] Zare, H. K., & Doering, J. C.2012. Inception Point
of Air Entrainment and Training Wall Characteristics of
Baffles and Sills on Stepped Spillways. Journal of
Hydraulic Engineering, 138: 1119–1124.
[22] Hamedi, A., Mansoori, A., Malekmohamadi, I., &
Roshanaei, H. 2011. Estimating Energy Dissipation in
Stepped Spillways with Reverse Inclined Steps and End
Sill. In World Environmental and Water Resources
Congress Reston, VA: American Society of Civil
Engineers, Conference Proceeding :2528–2537.
[23] Hamedi, A., Malekmohammadi, I., Mansoori, A., &
Roshanaei, H. 2012. Energy Dissipation in Stepped
Spillway Equipped with Inclined Steps Together with
End Sill. In 2012 Fourth International Conference on
Computational Intelligence and Communication
Networks . IEEE.
[24] Hamedi, A., Mansoori, A., Shamsai, A., &
Amirahmadian, S. 2014. The Effect of End Sill and
Stepped Slope on Stepped Spillway Energy Dissipation.
Journal of Water Sciences Research, 6 :1-15.

International Journal of Science and Engineering Applications
Volume 5 Issue 7, 2016, ISSN-2319-7560 (Online)
www.ijsea.com 407
[25] Hamedi, A., Ketabdar, M., Fesharaki, M., &
Mansoori, A. 2016. Nappe Flow Regime Energy Loss in
Stepped Chutes Equipped with Reverse Inclined Steps:
Experimental Development. Florida Civil Engineering
Journal, 2:28-37.
[26] Chaturabul, T. 2002. Experimental study of flow
behavior through stepped channels with end sills. MS
Thesis, King Mongkut’s University of Technology,
Thailand.
[27] Chinnarasri, C., & Wongwises, S. 2006. Flow Patterns
and Energy Dissipation over Various Stepped Chutes.
Journal of Irrigation and Drainage Engineering, 132: 70–
76.
[28] Baqersad, M., Eslami, A., Haghighat, Rowshanzamir,
M., Mortazavi Bak, H., 2016. Comparison of Coupled
and Uncoupled Consolidation Equations Using Finite
Element Method in Plane-Strain Condition. Civil
Engineering Journal, 2: 375-388.
[29] Munta, S., Otun, J., 2014. Study of the Inception
Length of Flow over Stepped Spillway Models. Nigerian
Journal of Technology, 33: 176-183.
[30] Naderi Rad, I., 2016. Application of Numerical
Methods in Design of Hydraulic Structures.
Communications on Advanced Computational Science
with Applications, 1:1-15.
[31] Shahheydari, H., Jafari, E., Barati, R., Azhdary, M.,
2015. Discharge coefficient and energy dissipation over
stepped spillway under skimming flow regime. KSCE
Journal of Civil Engineering, 19:1174–1182.
[32] Wilcox, D. C. 1998. Turbulence modeling for CFD
DCW industries La Canada, CA, 2: 103-217.
[33] Rodi, W., 1993. Turbulence models and their
application in hydraulics. CRC Press.
[34] Torrano, I., Tutar, M., Martinez-Agirre, M., Rouquier,
A., Mordant, N., Bourgoin, M., 2015. Comparison of
Experimental and RANS-Based Numerical Studies of the
Decay of Grid-Generated Turbulence. Journal of Fluids
Engineering, 137(6): 061203.

International Journal of Science and Engineering Applications
Volume 5 Issue 7, 2016, ISSN-2319-7560 (Online)
www.ijsea.com 408
An Investigation on the Effect of Rail Corrugation on
Track Response
Mohammad Fesharaki
Department of Civil and Environmental Engineering
Florida International University
10555 West Flagler Street, Miami, USA
Abstract: Rail corrugation increases life cycle cost of both track and vehicle and is one of the main reasons of track and vehicle
defects. To address this problem, this paper explores the effect of rail corrugation on track response. A Finite Element model
developed to consider vehicle and track characteristics. Vehicle is a 10 degree of freedom mass-spring-dashpot model which can
simulate vertical displacements and rotations. Rail is modeled as an Euler-Bernoulli beam with two degrees of freedom at each node
which lies on discrete support to simulate sleeper and fastening system support. The total train-track matrices of mass, damping and
stiffness have been formed. Solving the differential equations of motion in time domain for each time step results the response of track
to train dynamic forces. A sensitivity analysis has been performed to explore the effect of different train and track parameters on rail
displacement. The results of analyses show the effect of corrugation depth and wavelength as well as train speed and axle load on rail
deflections and demonstrate the importance of each parameter in the studied range.
Keywords: Vehicle, track, corrugation, rail displacement, train speed
1. INTRODUCTION Corrugation is major source of dynamic forces applied from
vehicles. Based on AREMA (American Railway Engineering
Maintenance of way Association), Corrugation initiates from
rail head de-carbonization and irregularities such as; rail
manufacture pitting, contact fatigue defects, rail welds, rail
joints, etc. [1] Train axle load and speed are also important
factors creating corrugation with specific wavelengths.
Corrugation can be characterized by its depth and wavelength.
Different depth and frequency can be detected in the field.
UIC (International Union of Railways) divided corrugation
into two categories: short-pitch corrugation with wavelength
between 3 to 8 cm and long-pitch corrugation with wave
length between 8 to 30 cm [2].
The importance of corrugation made many researchers to
study this phenomenon to investigate causes, characteristics
and treatment of corrugation. These studies, delved into
different aspects of rail corrugation both theoretically and
experimentally to consider the effect of different track types,
vehicle condition, curvature and wheel-rail interaction [3].
Grassie reviewed different type of corrugation and proposed
treatments. The effect of vehicle, rail type and traffic were
also investigated[4].
Hempelmann and Knothe using an advanced linear model and
based on assuming a feedback between structural dynamics
and wear explained the formation of short pitch corrugation
[5].
Egana et al conducted a research to study the influence of rail
pad stiffness on rail corrugation. They concluded that soft rail
pads can decrease the growth of corrugation and also
eliminate one of the wavelengths [6].
Correa et al taking into account the dynamics of the track, the
wheelset and the wear mechanism, developed a numerical
method and investigated the effect of track radius on
corrugation for four types of ballasted and ballastless high
speed tracks [7].
Although the above mentioned papers and some other
researches successfully addressed some important aspects of
rail corrugation, the great influence of this rail flaw on
deteriorating track and damaging wheels makes more research
necessary. The aim of this paper is to investigate the effect of
different parameters of corrugation and train on rail
displacement using a numerical solution. The numerical
method includes modeling of vehicle and track in time
domain. The investigated parameters are, corrugation depth
and wavelength, train speed and axle load. The purpose is to
find the maximum response of track to each parameters in
order to control the effective factors on corrugation and
prioritize the maintenance activities. The results of the study
can be used from freight to high-speed trains.
2. MODELING PROCEDURE Although it is shown that the combination of physical and
numerical modeling provide better results compared to
numerical analysis in engineering application, [8], [9], [10]
however numerical modeling considering realistic values may
lead to good results. This is especially valid for a complicated
problem of rail dynamic analysis. In this research a finite
element model has been developed to consider the effect of
rail corrugation on track response. The model consists of
vehicle, track and their interactions. As 0 shows, the vehicle is
a ten degree of freedom (DOF) mass spring damper model
including a car body, two bogie frames and four wheel-sets.
The car body has a mass of cM and a rotational moment
of cj about the transverse horizontal axis. Bogies have mass
of tm and rotational moment of tj . Wheels are characterized
by a mass of wm and have one DOF. It is assumed that the
mass of each part is concentrated in the centroid of the tack
components. the mass, stiffness and damping matrices of train
can be expressed as follows: [11], [12]

International Journal of Science and Engineering Applications
Volume 5 Issue 7, 2016, ISSN-2319-7560 (Online)
www.ijsea.com 409
Figure.1 Vehicle and track model
w4w3w2w1ttttcc mmmmjmjmjmdiagvM
(1)
wtww
wtww
wtww
wtww
twtw2tw
wwwtctt
twtw2tw
wwwtctt
ctct2
ct
ttt
k000Lkk0000
0k00Lkk0000
00k000Lkk00
000k00Lkk00
LkLk00L2k00000
kk0002kk00Lkk
00LkLk00L2k000
00kk0002kkLkk
00000Lk0LkL2k0
00000k0k02k
vK
(2)
wtww
wtww
wtww
wtww
twtw2tw
wwwtctt
twtw2tw
wwwtctt
ctct2
ct
ttt
c000Lcc0000
0c00Lcc0000
00c000Lcc00
000c00Lcc00
LcLc00L2c00000
cc0002cc00Lcc
00LcLc00L2c000
00cc0002kcLcc
00000Lc0LcL2c0
00000c0c02c
vC
(3)
In equations (1) to (3), cL is half of the distance between two
bogies and tL is the half of the distance between two wheels
of the same bogie. tK , twK , tC and twC denote stiffness and
damping of the secondary and primary suspension system of
the vehicle respectively. wK and wC are the spring and
damping constants between the rail and vehicle. 0 show the
parameters and the assigned values in numerical analysis.
Table 1. Rail vehicle properties
Parameter Value
Mass of car body (kg) 49500
Car body inertia moment(kg.m2) 2.15×10⁶
Mass of bogie (kg) 3200
bogie inertia moment(kg.m2) 4000
Distance between bogie centers (m) 12.5
Mass of wheel axle (kg) 900
Secondary suspension stiffness (N/m) 1.74×10⁵
Secondary suspension damping (N.s/m) 4.50×10⁴
Primary suspension stiffness (N/m) 6.33×10⁵
Primary suspension damping (N.s/m) 4.08×10⁴
The track and its supporting layer were modeled as beam and
discrete mass-less springs and viscous dampers. The springs
represent the track sub-layers, connecting the beam to the
subgrade. Neglecting axial deformations, each beam element
has four DOF which can described by Cubic Hermitian shape
functions. Therefore, displacements of the beam elements’
nodes can be calculated by the following expression. [12],
[13]
tqeNtey i, (4)
Where y(e, t) is the vertical displacement of the rail element.
tqi is the nodal displacement vector of rail and N(e) is the
matrix of the beam shape functions as follows:
eNeNeNeNeN 43211 )( (5)
Where
32
1 21)(
l
e
l
eeN
2
2 221)(l
e
l
eeeN
32
3 23)(
l
e
l
eeN
l
e
l
eeeN
2
4 )(
In which “l” and “e” respectively demonstrate the length and
local coordinate of the elements measured from the left node
of elements. The mass and stiffness matrices of beam
elements ( rM and rK ) can be written in the following form:
22
22
422313
221561354
313422
135422156
420
llll
ll
llll
ll
lmM r (6)
22
22
3
4626
612612
2646
612612
llll
ll
llll
ll
l
IEK rr
r (7)
Where m , rE and rI stand for the mass per unit length, the
modulus of elasticity and the moment of inertia of beam
elements, respectively.
Considering the mass, stiffness and damping matrices of the
vehicle and track elements, the dynamic equation of the whole
system can be presented in the following format.
tPyKyCyM (8)

International Journal of Science and Engineering Applications
Volume 5 Issue 7, 2016, ISSN-2319-7560 (Online)
www.ijsea.com 410
Where, [M], [C], and [K] are the matrices representing mass,
damping and the stiffness of train-track coupling system,
respectively. y , y and y are displacement, velocity and
acceleration of train-track elements, respectively. P(t)
indicates the vector of load induced by the passage of the
train. Table. 2 shows track parameters used in numerical
analysis. Note that the length of beam elements is assumed to
be 0.6 m which is the typical distance between cross ties. So
the model has 80 elements and 81 nodes and consequently,
the total number of DOFs for rail is 162.
Table 2. Rail track properties
Parameter Value
Track length (m) 48
Rail modulus of elasticity (N/m2) 2×10¹¹
Rail moment of inertia (m4) 2.34×10⁻⁵
Mass per unit length of rail (Kg/m) 55
Distance between sleepers (m) 0.6
0 0.5 1 1.5 2-0.5
0
0.5
1
1.5
2
2.5
3
3.5
4x 10
-3
Time(seconds)
dis
pla
ce
me
nt(
m)
0 0.5 1 1.5 2-1
0
1
2
3
4
5x 10
-3
Time(seconds)
dis
pla
ce
me
nt(
m)
Smooth Rail
1 mm corrugation depth
Smooth Rail
0.5 mm corrugation depth
Figure. 2 Rail displacement for different rail corrugation depth (left) 0.5 mm (right) 1 mm
3. VEHICLE-TRACK SYSTEM Hertz contact theory is used to model the interaction between
vehicle and track structure. Neglecting rail irregularities, the
contact force between wheel and rail may be determined using
Hertz theory through the following formula:[14]
raillwheel yy HKP (9)
Where HK is linearized Hertzian spring constant which is a
function of wheel and rail profile radius and their material
properties.
To solve the dynamic equations of motion, Newmark
integration method is used. This method developed by
Newmark (1959) is based on the assumption that the
acceleration varies linearly between two instants of time. The
following formula can be applied
11 1 iiii ututuu (10)
122
1 5.0 iiiii ututtuuu (11)
Where t is time step, and show the variation of
acceleration during one time step. In the numerical solution,
the values of and are 0.5 and 0.25, as a result, the
solution will be unconditionally stable. Time step, t is
chosen 0.005 seconds. Applying equations 11 and 12, the
track response at time “t+dt” can be determined if response is
known at time “t”. [13]
4. RESULTS Error! Reference source not found. compares the result of
analyses for a smooth track and corrugated track with
different depth. The figure shows the rail displacement for 0.5
mm and 1 mm corrugation depth. The maximum displacement
in perfect condition is 2 mm. 0.5 mm deep corrugation
increases the rail deflection to 3 mm. 0 alsoError! Reference
source not found. depicts the same results for 1mm
corrugation. As expected, rail displacement increases with
increasing the depth of corrugation and the maximum
difference between ideal and defected track displacement is
about 100%.
0 0.2 0.4 0.6 0.8 1 1.2 1.4 1.6 1.8-0.5
0
0.5
1
1.5
2
2.5
3x 10
-3
Time(seconds)
dis
pla
ce
me
nt(
m)
0.2 m corrugation wavelength
1 m corrugation wavelength
Figure. 3 The effect of corrugation wavelength on rail
displacements
To investigate the impact of wavelength on rail response, the
analyses are performed for wavelength of 0.2 m and 1 m. 0
demonstrates the effect of corrugation wavelength on rail
deflection. Increasing corrugation wavelength causes a
reduction in rail displacement. As the figure shows about 40%
drop in rail displacement can be seen by increasing the
wavelength.
Train axle load is an important parameter to raise rail
displacement. This can be seen in 0 which shows the
influence of train axle load on rail displacements. It should be
noted that to obtain this graph, it is assumed that vehicle speed
is 100 km/hr. and wavelength and depth of corrugation are 0.2
m and 0.5 mm. The minimum displacement from the cases

International Journal of Science and Engineering Applications
Volume 5 Issue 7, 2016, ISSN-2319-7560 (Online)
www.ijsea.com 411
shown in 0 is 2.4 mm corresponding to 10 ton axle load. By
increasing the train load, rail displacement increases and for
22 ton axle load reaches to 3.97 mm.
0 0.5 1 1.5 2-0.5
0
0.5
1
1.5
2
2.5x 10
-3
Time(seconds)
dis
pla
ce
me
nt(
m)
(a) 10 ton
0 0.5 1 1.5 2-1
0
1
2
3x 10
-3
Time(seconds)
dis
pla
ce
me
nt(
m)
(b) 14 ton
0 0.5 1 1.5 2-1
0
1
2
3
4x 10
-3
Time(seconds)
dis
pla
ce
me
nt(
m)
(c) 18 ton
0 0.5 1 1.5 2-1
0
1
2
3
4x 10
-3
Time(seconds)
dis
pla
ce
me
nt(
m)
(d) 22 ton
Figure. 4 The effect of axle load on rail displacement
0 0.5 1 1.5 2 2.5 3 3.5-1
0
1
2
3
4x 10
-3
Time(seconds)
dis
pla
ce
me
nt(
m)
(a) V=50 km/hr
0 0.5 1 1.5 2 2.5 3 3.5-1
0
1
2
3
4x 10
-3 (b) V=100 km/hr
Time(seconds)
dis
pla
ce
me
nt(
m)
0 0.5 1 1.5-1
0
1
2
3
4
5x 10
-3 (c) V=150 km/hr
Time(seconds)
dis
pla
ce
me
nt(
m)
0 0.2 0.4 0.6 0.8 1-2
0
2
4
6x 10
-3
Time(seconds)
dis
pla
ce
me
nt(
m)
(d) V=200 km/hr
Figure. 5 The effect of train speed on rail displacements
In intercity lines, vehicles with different speeds may travel
and the passage of trains with different speeds can create
corrugation with varying depth and wavelength. As a result,
train speed is one of the most influential parameters on rail
response. In this part, it is assumed that axle load is 14 ton and
corrugation parameters i.e. wavelength and depth are 0.2 m
and 0.5 mm and constants. The results presented for speeds
50, 100, 150 and 200 km/hr.
As 0 shows, the maximum rail displacement under loads
moving at the speed of 50 km/hr is 3.1 mm. With increasing
vehicle speed, rail displacement also increases and for speed
100 km/hr reaches 3.8 mm. This trend is valid for 150 km/hr.
train speed and the maximum deflection raises to 4.7 and.
Increasing the speed of vehicle more than this point results in
a decrease in rail displacement. The maximum displacement
for 200 km/hr train speed is 4.6. As a result, 150 km/hr is the
critical speed for this case. 0 illustrates the difference in
critical speed with varying corrugation wavelength. An
increase in corrugation wavelength results in increasing
critical speed. So in case of high-speed train, long wavelength
corrugation should be avoided.
Figure. 6 The effect of corrugation wavelength on train
critical speed
5. CONCLUSIONS This paper explored the influence of corrugation on track
displacement by using a finite element model of track and
International Journal of Science and Engineering Applications
Volume 5 Issue 7, 2016, ISSN-2319-7560 (Online)
www.ijsea.com 412
vehicle. Vehicle is simulated by mass-spring-damper model
and rail is considered as Euler-Bernoulli beam and the whole
system has been solved in time-domain by Newmark
integration method. The results of the study show rail
displacement under different conditions and determine the
effect of train and track parameters on rail response. The
results of the study can be summarized as follows
- Increasing corrugation depth results in about 40%
increase in rail displacement. Wavelength have
almost the same effect and changing wavelength
causes 50% alternation in rail displacement
- The maximum effects of axle load and train speed
in the considered range are 58% and 62%
respectively.
- Corrugation is a very important factor in increasing
dynamic effect of rail vehicles. This is very crucial
in case of low wavelength and deep corrugation.
Controlling of corrugation depth and wavelength is
very important in case of freight and high-speed
trains.
- Increasing train speed does not necessarily increases
rail deflection. For each case of corrugation
wavelength and depth, vehicle critical speed should
be determined and considered for design purposes.
6. REFERENCES [1] American Railway Engineering and Maintenance-of-
Way Association, Manual for Railway Engineering,
Vol.1, Track. 2010.
[2] International Union of Railways, “Rail defects, UIC
code 712R,” 2002.
[3] K. H. Oostermeijer, “Review on short pitch rail
corrugation studies,” Wear, vol. 265, no. 9–10, pp.
1231–1237, 2008.
[4] S. L. Grassie, “Rail corrugation: Characteristics,
causes, and treatments,” Proc. Inst. Mech. Eng. Part
F J. Rail Rapid Transit, vol. 223, no. 6, pp. 581–596,
2009.
[5] K. Hempelmann and K. Knothe, “An extended linear
model for the prediction of short pitch corrugation,”
Wear, vol. 191, no. 1–2, pp. 161–169, 1996.
[6] J. I. Egana, J. Vinolas, and M. Seco, “Investigation of
the influence of rail pad stiffness on rail corrugation
on a transit system,” Wear, vol. 261, no. 2, pp. 216–
224, 2006.
[7] N. Correa, O. Oyarzabal, E. G. Vadillo, J.
Santamaria, and J. Gomez, “Rail corrugation
development in high speed lines,” Wear, vol. 271,
no. 9–10, pp. 2438–2447, 2011.
[8] A. Hamedi and H. R. Fuentes, “Comparative
Effectiveness and Reliability of NEXRAD Data to
Predict Outlet Hydrographs Using the GSSHA and
HEC-HMS Hydrologic Models,” in World
Environmental and Water Resources Congress,
2015, no. September 2005, pp. 1444–1453.
[9] A. Hamedi and H. R. Fuentes, “New Relationship
between a Vertical Gate Opening and Downstream
Flow Stability: Experimental Development,” World
Environ. Water Resour. Congr. 2016, pp. 47–57,
2016.
[10] M. Baqersad, A. E. Haghighat, M. Rowshanzamir,
and H. M. Bak, “Comparison of Coupled and
Uncoupled Consolidation Equations Using Finite
Element Method in Plane-Strain Condition,” Civ.
Eng. J., vol. 2, no. 8, pp. 375–388, 2016.
[11] X. Lei and N. A. Noda, “Analyses of Dynamic
Response of Vehicle and Track Coupling System
With Random Irregularity of Track Vertical Profile,”
vol. 258, no. May, pp. 147–165, 2002.
[12] P. Lou and Q. Zeng, “Formulation of equations of
motion of finite element form for vehicle–track–
bridge interaction system with two types of vehicle
model,” Int. J. Numer. Methods Eng., vol. 62, no. 3,
pp. 435–474, 2005.
[13] A. K. Chopra, Dynamics of Structures, 4th ed.
Prentice-Hall, 2011.
[14] C. Esveld, Modern Railway Track, 2nd ed. MRT
Publications, 2001.