Embed Size (px)
Citation preview

Calhoun: The NPS Institutional Archive
Theses and Dissertations Thesis Collection
1967-12
Theoretical and empirical analyses of thick skinned
swept wing panels
Parcells, Paul Whitney
Monterey, California. U.S. Naval Postgraduate School
http://hdl.handle.net/10945/13261

NPS ARCHIVE1967PARCELLS, P.
TICAL AND EMPIRICAL ANALYSES OfTHICK SKINNED SWEPT WINS PANELS
PAUL WHITNEY PARCGUJ


THEORETICAL AND EMPIRICAL ANALYSES
OF
THICK SKINNED SWEPT WING PANELS
by
Paul Whitney ParcellsLieutenant, United States Navy
B.S., United States Naval Academy, 1960
Submitted in partial fulfillment of therequirements for the degree of
MASTER OF SCIENCE IN AERONAUTICAL ENGINEERING
from the
NAVAL POSTGRADUATE SCHOOLDecember 1967
ABSTRACT
The validity of conventional skin and stringer type
analyses is verified experimentally for a thick milled skin
aircraft structure. The accuracy of solution is evaluated
by comparing the strain energies in a mathematical model to
that obtained experimentally from a wing panel of a high
performance aircraft.
Results indicate that th| conventional methods of a
skin-stringer/matrix force approach are valid for a thick
milled skin aircraft structure of this type provided the
panel loading is neither severe nor concentrated. Addi-
tionally the grid elements chosen must be small enough to
preclude any gross averaging errors.
/
DUDLEY KNOX LIBRARY
NAVAL POSTGRADUATE SCHOOL
MONTEREY CA 93943-5101
TABLE OF CONTENTS
CHAPTER PAGE
I. INTRODUCTION 13
II. THEORETICAL ANALYSIS 16
III. DISCUSSION OF THEORETICAL ANALYSIS 28
IV. EXPERIMENTAL ANALYSIS 30
V. DISCUSSION OF EXPERIMENTAL ANALYSIS 46
VI. COMPARISON OF RESULTS 48
VII. CONCLUSIONS AND RECOMMENDATIONS 52
REFERENCES 54
APPENDIX A THEORETICAL DETERMINATION OF SHEAR FLOWS 56
APPENDIX B EQUIPMENT CALIBRATION CURVES 61
APPENDIX C STRAIN GAGE LOCATIONS 62
APPENDIX D STRAIN GAGE INSTRUMENTATION 64
APPENDIX E PRINCIPAL STRESSES AND ORIENTATIONS 66

/

LIST OF TABLES
TABLE PAGE
I. Theoretical Panel Parameters 22
II. Theoretical Strain Energy Distribution 27
III. Average Sub-Panel Experimental Stresses 42

LIST OF FIGURES
FIGURE . PAGE
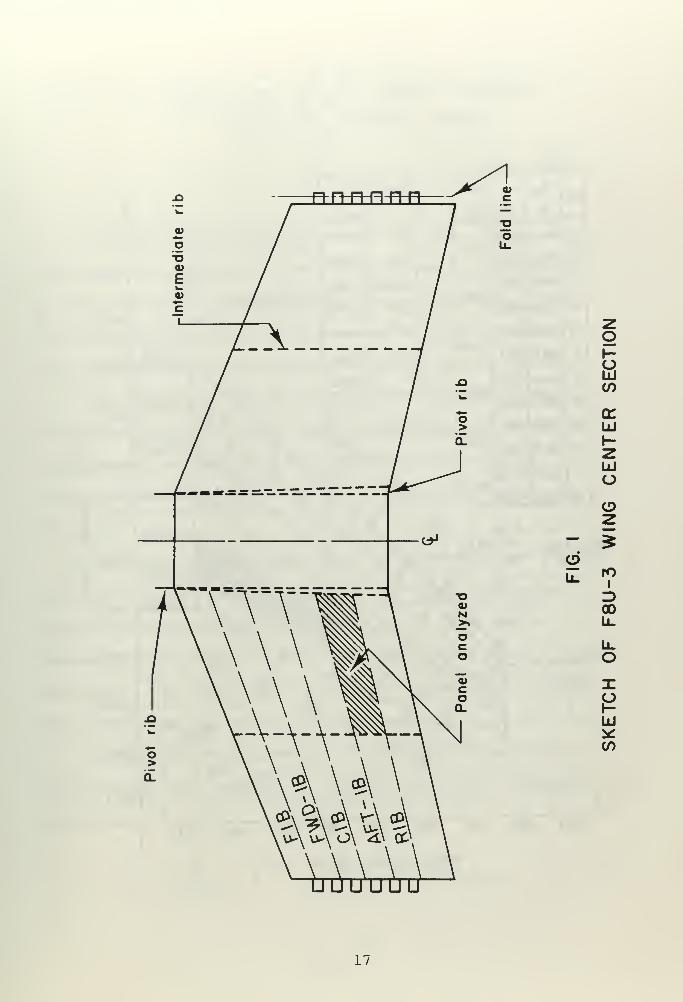
1. Sketch of F8U-3 Wing Center Section 17
2. Center Section of F8U-3 Port Wing 18
3. Idealized Panel on F8U-3 Port Wing 20
4. Panel Showing Dimensions for Edge Loading Ratios 23
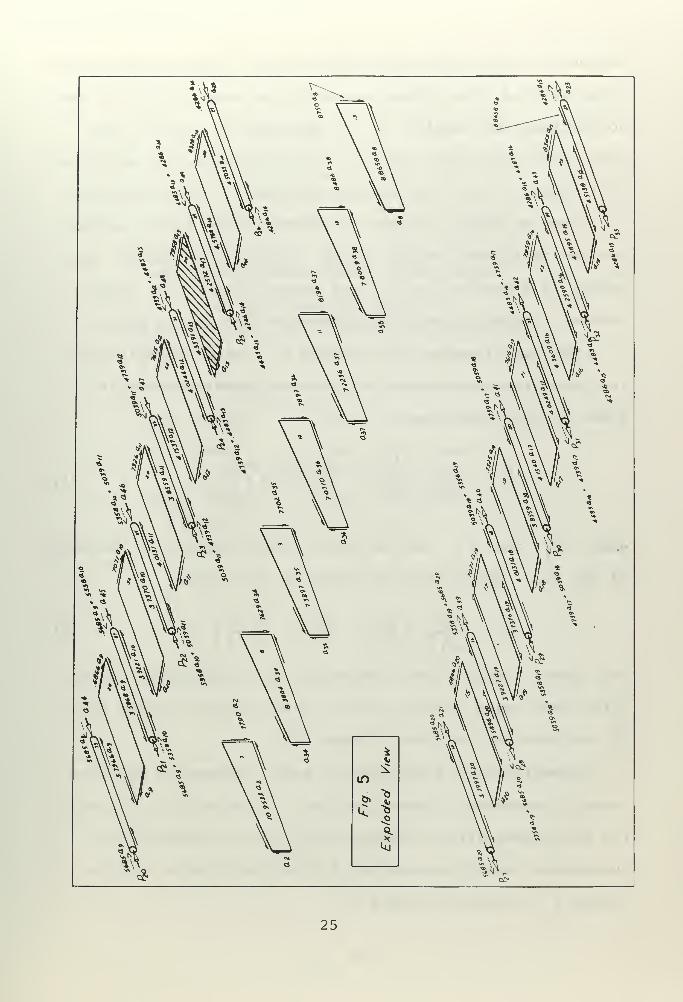
5. Exploded View of Idealized Wing 25
6. Sketch of Strain Gage Locations (Outer Skin) 34
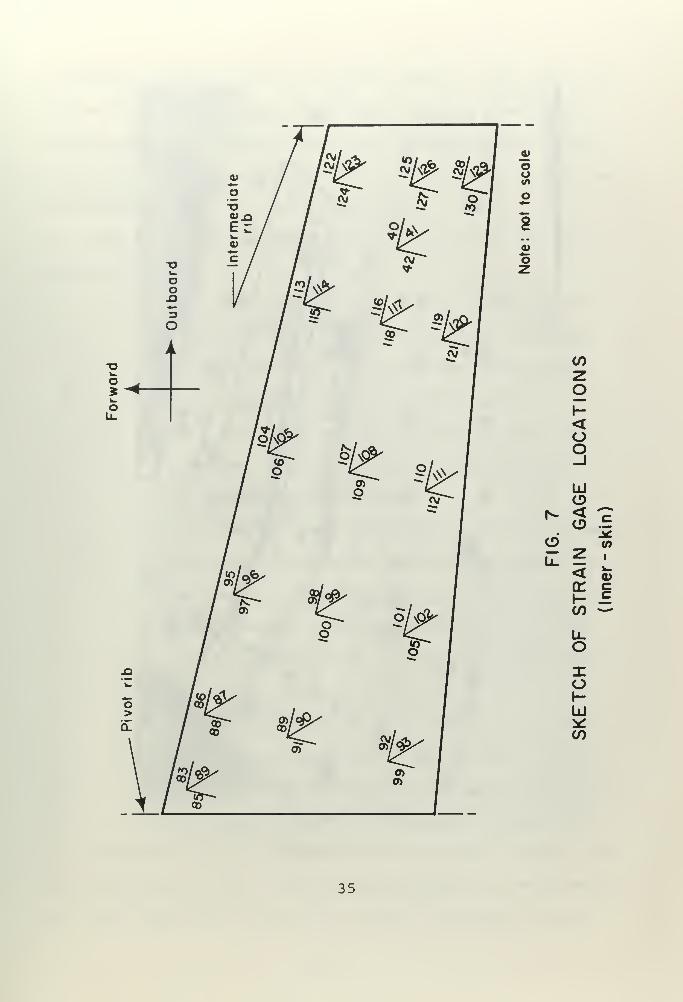
7. Sketch of Strain Gage Locations (Inner Skin) 35
8. Sketch of Planform of Partitioned Panel 41
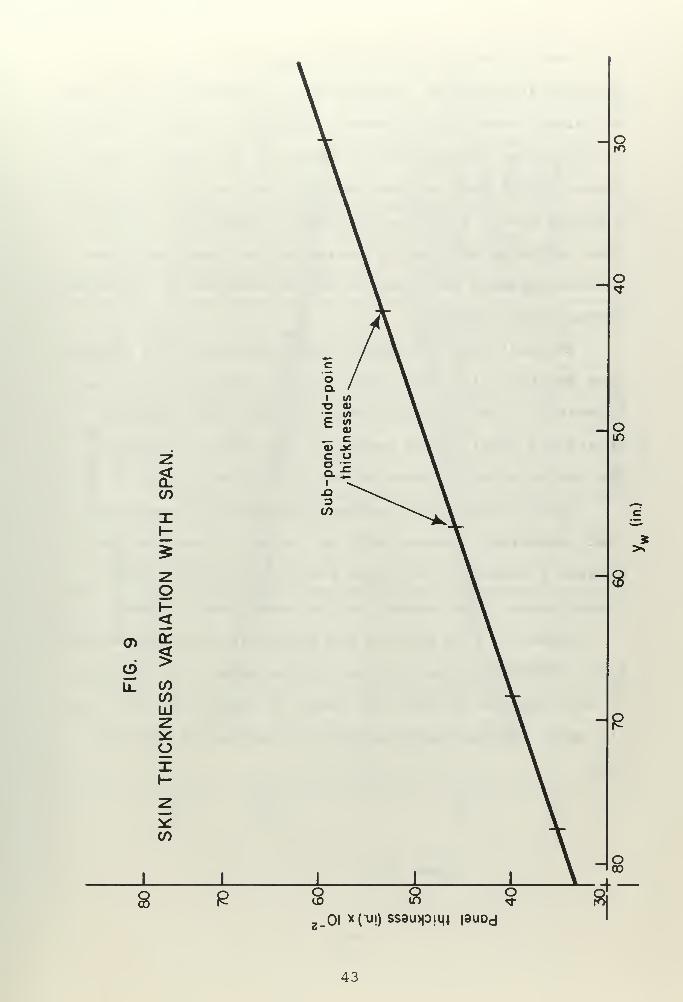
9. Skin Thickness Variation with Span 43
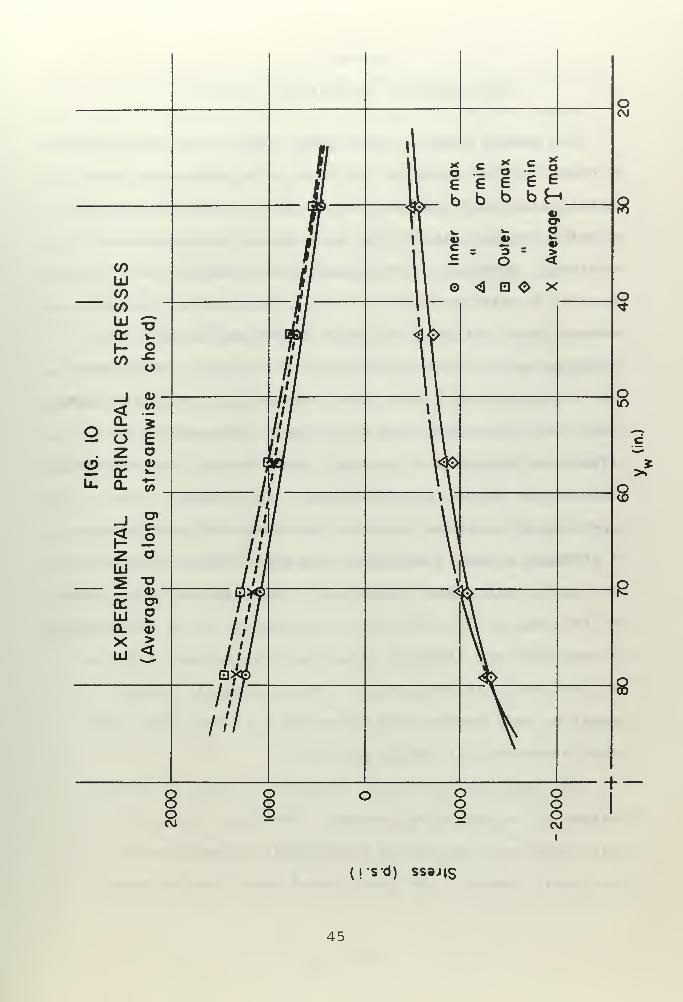
10. Experimental Principal Stresses 45


LIST OF PLATES
PLATE PAGE
1. F8U-3 Wing Test Installation 31
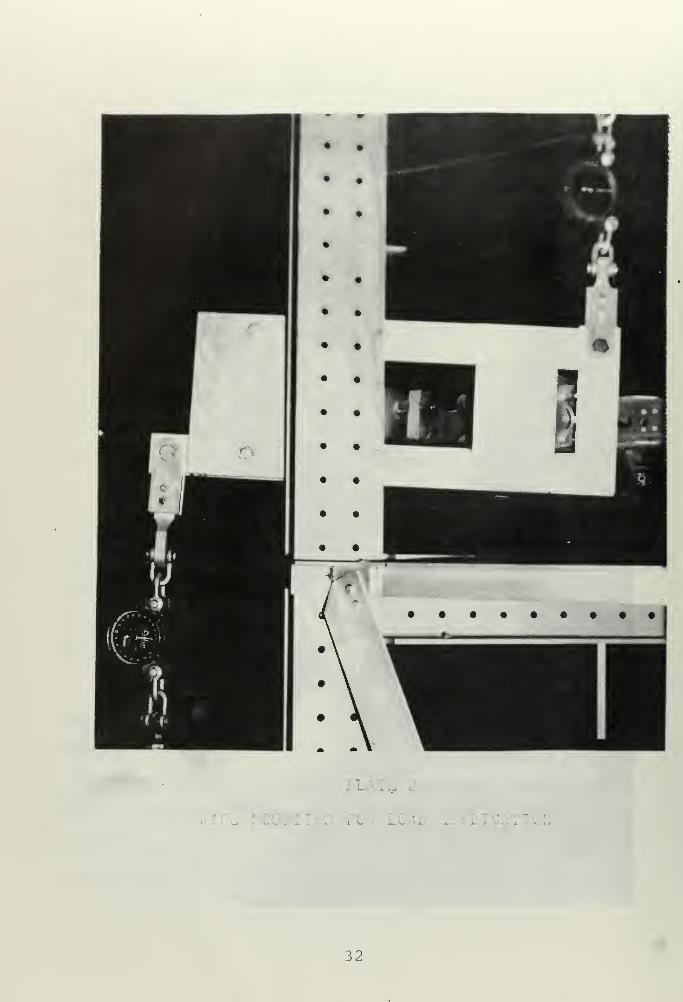
2. Wing Mounting for Load Application 32
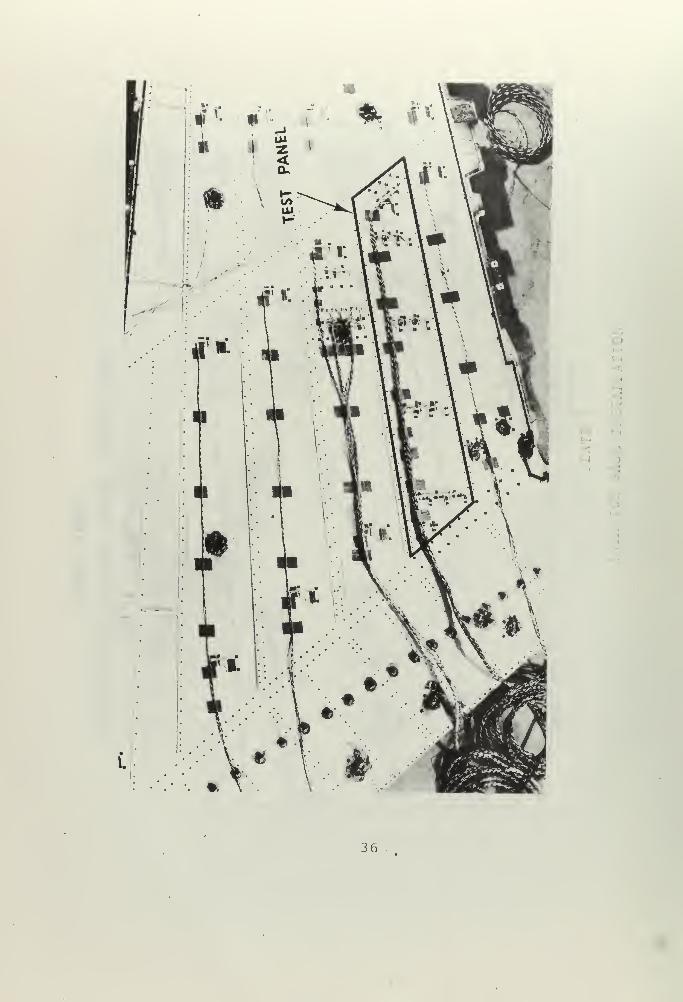
3. Interior Strain Gage Installation 36
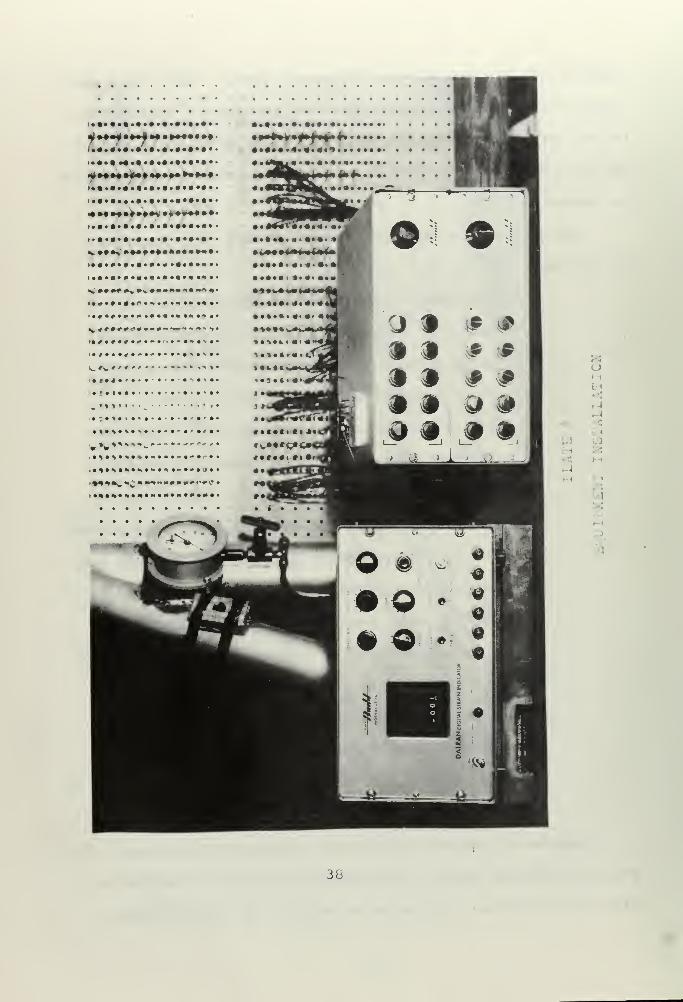
4. Equipment Installation 38


TABLE OF SYMBOLS
A Inclosed wing cell area, square inches
a. Panel width (tip) , inches
a2 Panel width (root) , inches
a. Panel end loading (tip), pounds
ac Panel end loading (root) , pounds
AFT-IB Aft intermediate beam
b Panel length, inches
CIB Center intermediate beam
E Modulus of Elasticity, pounds per square inch
FB Front beam
FIB Front intermediate beam
FWD-IB Forward intermediate beam
G Shear modulus, pounds per square inch
Ik Panel span (forward) , inches
1^ Panel span (aft) , inches
q Shear flow, pounds per inch
RB Rear beam
RIB Rear intermediate beam
T Torque, inch pounds
tt Panel thickness (tip) , inches
tr Panel thickness (root) , inches
U Internal strain energy, inch pounds
V Constant voltage source, volts
VQ Wheats tone Bridge output voltage, volts
11

w^ Panel edge length, inches
w Panel edge length, inches
xw x-axis co-ordinate of wing, inches
y y-axis co-ordinate of wing, inchesVv
S Panel angle (AFT-IB to pivot rib) , degrees
O Panel angle (RIB to intermediate rib) , degrees
AA Poisson's ratio
£ Strain, micro-inches per inch
0- Normal stresses, pounds per square inch
/T Shear stresses, pounds per square inch
Q> Angle of twist per unit length, radians per inch
(~h Angle of principal axis measured from the first
gage of the rosette, degrees
12

CHAPTER I
INTRODUCTION
Aircraft structures in general, and wings in parti-
cular, have been constructed using the conventional stringer
and sheet methods. This form of construction, by nature not
a simple structure, introduced the problem of how to accu-
rately predict the load distribution and especially the
stress concentrations that could be developed. The oldest
representation scheme for the discrete element analysis of
the problem evolved as the axial force member-shear panel
idealization that is described in Reference 1. This method
is particularly acceptable to the aircraft industry, as it
readily lends itself to various matrix techniques that are
easily adaptable to a digital computer for solution. Gen-
erally speaking, this method of solution makes no provision
for accounting for Poiseon's ratio and sweep effects.
With the advent of the very heavy milled skins of
modern high performance aircraft, one immediately questions
the validity of the conventional form of solution. In order
to properly account for bending-torsion interaction, chord-
wise curvatures, sweep coupling, shear deflections, and the
increasing use of large cutouts, several alternative methods
of analysis have been developed.
The most widely used solution technique is outlined by
J. H. Argyris and S. Kelsey in Reference 2. The aircraft
structure is molded into a large assemblage of elastic ele-
ments, which permits matrix formulation of the solution in
13

terras of the different energy theorems. The fundamental
principles originated by Maxwell and Mohr of virtual forces
and virtual displacements are used in the energy method of
solution. A practical application of this technique is
included in References 3 and 4.
The objective of this study is to determine the valid-
ity of this lumped parameter form of a theoretical analysis
for thick skinned structures. Because of the general energy
approach to the solution, the method chosen to determine the
accuracy of the results was to compare the total internal
strain energy of an idealized panel with that of an actual
thick milled skin aircraft structure of the same dimensions
.
The structure would have to be thick enough to be able to
support any bending-torsion interaction that may exist in
addition to the inplane loadings.
The objective of this report was to be achieved by
comparing the theoretical strain energy of a structure with
that determined empirically from strain gage readings. The
structural specimen to be analyzed was a single wing panel
taken from the port wing upper skin of a Mach 2.5 all-
weather fighter project which was canceled by the U. S.
Navy before the structural test program was completed.
The necessary strain gage rosettes and accompanying
instrumentation were installed, and a comparison of the
theoretical and empirical analyses was made.
A literature search did not reveal any reference that
made a comparison of the energy level in an idealized
14

structure to that of an actual wing panel element. The
importance of a comparison of this type is apparent when one
realizes that the integrated behavior of a structure is
dependent upon the energy accounting in the system.
This study was completed during the 1967-1968 academic
year at the Naval Postgraduate School, Monterey, California.
Acknowledgement is gratefully made to Professor C. H. Kahr
of the Aeronautics Department for his guidance and consulta-
tion as thesis advisor; R. A. Besel and T. B. Dunton,
laboratory technicians; and CAPT D. B. Messerschmidt, USMC
who, while working on a similar thesis project, aided in
this study.
15

CHAPTER II
THEORETICAL ANALYSIS
The structure chosen for study was the wing center
section of an F8U-3 type aircraft. The particular panel
analyzed was the port section bounded longitudinally by the
pivot and intermediate ribs and laterally by the aft-
intermediate and rear-intermediate beams. The wing center
section and specific panel are graphically depicted in
Figure 1.
The typical industrial approach to analyzing a struc-
ture of this nature would be to determine what valid siup- .:.
plifying assumptions could be made in order to create a
mathematically simple idealized structure. The resulting
model would consist of axial load carrying bars and plane
shear carrying constant thickness panels. The idealized
model was developed and is thoroughly discussed in
References 3 and 4.
The load application was accomplished by applying a
torsional moment at the wing fold rib, about the load
reference axis (CIB) . Considering the port wing inboard of
the intermediate rib, this couple must be distributed,
using elementary torque theory, to the equivalent loads on
a streamwise cross-section (intermediate rib) at station
y = 81.98 (Figure 2). The loading was then divided among
the six cells of the wing. The shear flow for each cell
was determined in accordance with Reference 1 by equating
16
go
crLU
LUOO
- i
c »300u_
u_o
UJ
CO
UUUUUU
17
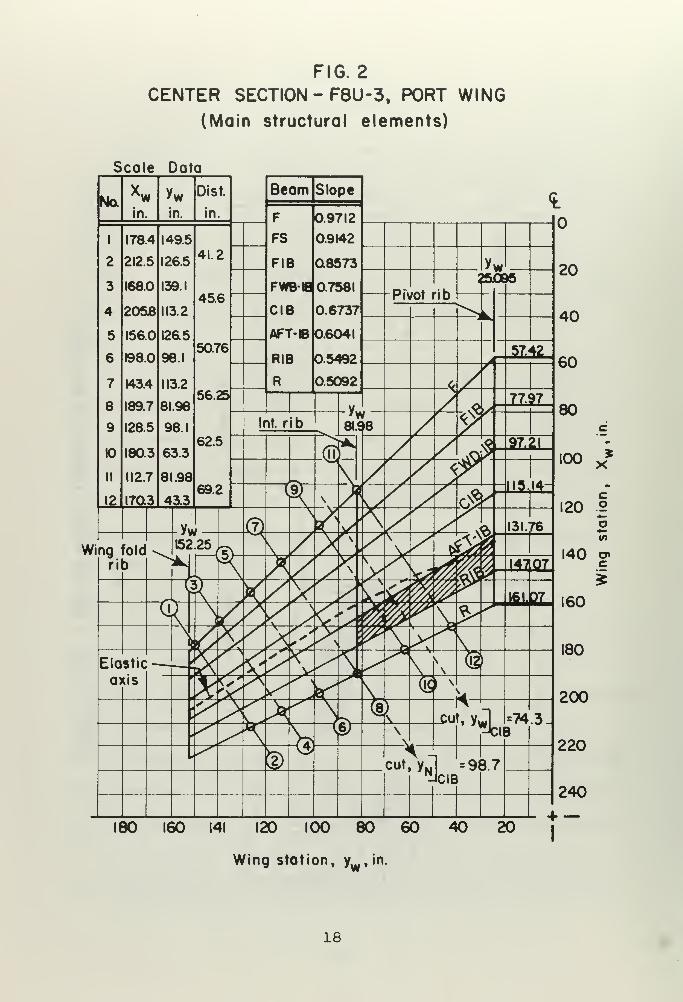
FIG. 2
CENTER SECTION - F8U-3, PORT WING
(Main structural elements)
Scale Data
Wing
X
co
pl/>
o»c
180 160 141 120 100 80 60 40 20
Wing station, yw ,in.
18
the angle of twist of one cell with the remaining five and
equating torsional moments as follows:
T =i2Aq (1)f*%The results and calculations of the shear flows were
calculated in Reference 3 and are included in this report
as Appendix A with inappropriate sections deleted. Using
the planform dimensions of Figure 2, the shear flow for each
cell was determined as oriented perpendicular to the CIB.
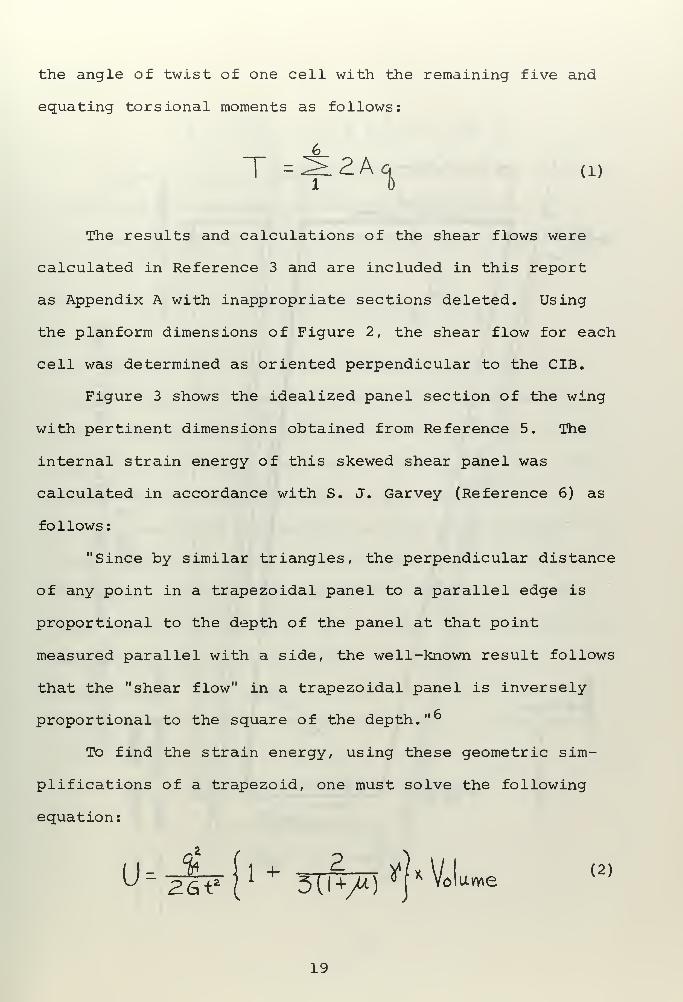
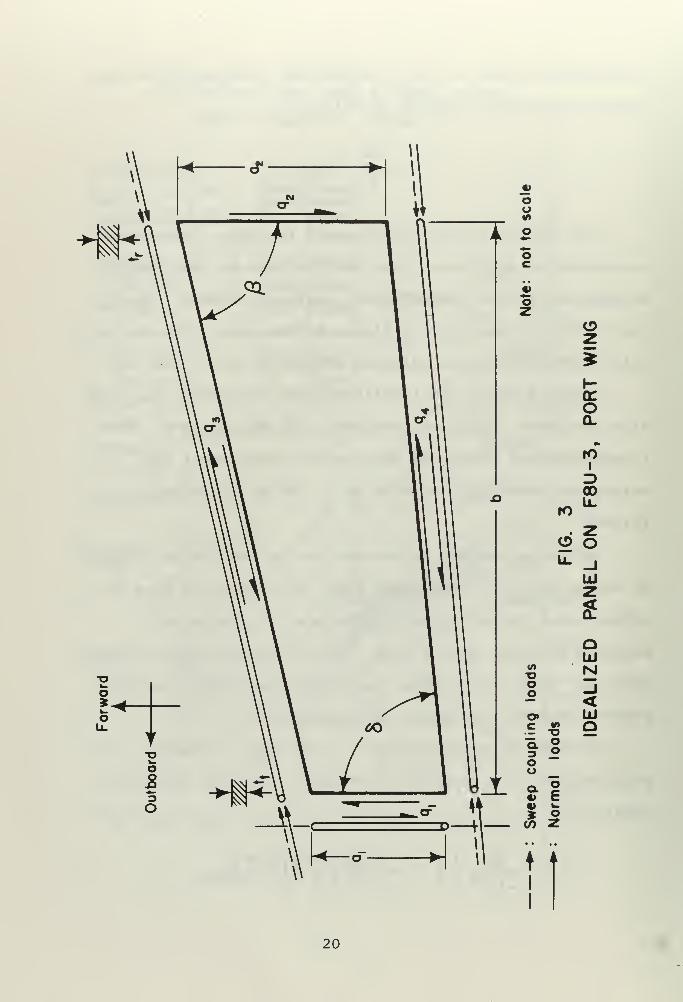
Figure 3 shows the idealized panel section of the wing
with pertinent dimensions obtained from Reference 5. The
internal strain energy of this skewed shear panel was
calculated in accordance with S. J. Garvey (Reference 6) as
follows:
"Since by similar triangles, the perpendicular distance
of any point in a trapezoidal panel to a parallel edge is
proportional to the depth of the panel at that point
measured parallel with a side, the well-known result follows
that the "shear flow" in a trapezoidal panel is inversely
proportional to the square of the depth." 6
To find the strain energy, using these geometric sim-
plifications of a trapezoid, one must solve the following
equation:
i> sIf {'
+ W> 'H(2)
oiuwe
19
CD
i
o
roi
3CD
IO
(D O
Ld
fc .<Tf ri
o —F-
<Q.
QLU
o Noo -1
<o» UJc QQ.3
oo
ouo.4>
oE
*> w* o</) z
t
20

where:
J(*= coVg + cot^ cot & -h cct fi (3)
Table I lists the appropriate dimensions and constants
needed for the theoretical analysis. The volume of the
plate was determined for the idealized panel from:
V = {**$&) b(tf +,**) (4)
This approach of utilizing the average thickness will ob-
viously limit the accuracy of the resulting theoretical
strain energy; however, the objective of this part of the
analysis is to obtain the strain energy by the same conven-
tional methods currently being used by industry.
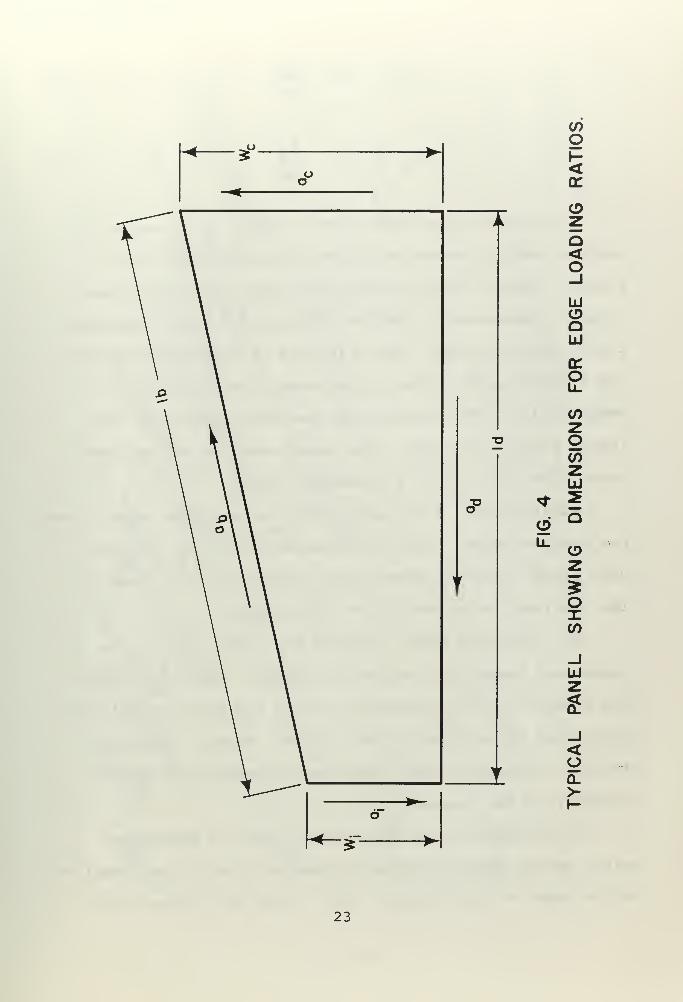
As previously discussed, the plate edge loadings were
determined from a linear interpolation using the planform
dimensions. These shear panel edge loadings were distri-
buted around the perimeter of the panel, in accordance with
Reference 4, by first assigning a unit shear force to the
outer edge of each panel. Considering a typical panel as
shown in Figure 4 and taking moments about appropriate
points to ensure the maintenance of equilibrium, the follow-
ing ratios of edge forces were derived:
a. = a ;it- (5)
21

TABLE I
PANEL PARAMETERS
Parameter Value Units Reference
h 0.32 7079-T6 Al
G 3.9 x 10 6 psi. 7079-T6 Al
E 10.3 x 10 6 psi. 7079-T6 Al
ai
12.132 in. Ref. 5
a2 15.247 in. Ref. 5
b 56.885 in. Ref. 5
fcr 0.62 in. Ref. 5
fct 0.33 in. Ref. 5
tave 0.477 in. - - -
6 61° 13' deg. Ref. 5
/* 58° 52' deg. Ref. 5
22
COo<cr
e>zo<o
LUe>oUJ
cco
CO
oCOzUJ
^ oz
oXCO
UJz2
<o>
23

The Matrix Force Method is described in Reference 11
and was used to determine the end edge loadings on the
panels. These loads were obtained from previous calcula-
tions in Reference 3. The end edge load for the particular
panel studied in this report (Figure 5) was then scaled to
the edge utilized in the strain energy calculation of
Equation (2) . This scaled load was then divided by the
length of the same edge. The result was the desired edge
shear flow (q4= 325.976 pounds per inch).
Substitution of the appropriate values from Table I and
the computed shear flow into Equations (2) , (3) , and (4)
will yield the total shear panel internal strain energy.
The resulting value was 33.280 inch pounds.
The idealized model, being a pure shear panel, was in-
capable of supporting any axial loadings. For this reason
the effective cross sectional area of the plate was divided
evenly and distributed to the adjacent flanges (Figures 3
and 5) . The axial loads were then assumed to be applied
directly to the flanges.
In accordance with Reference 9, sets of additional
axial forces (dashed forces in Figures 3 and 5) were applied
to the ends of the flanges. The forces are necessary to
24
25

account for the additional strain energy stored by the axial
components of shear flows caused by the sweep effect of the
non-rectangular panels. It is important to realize that
these sweep coupling loads are internal forces and would not
be included in the equilibrium equations of the structure.
From an energy standpoint, these dashed forces account
for the additional strain energy stored in the panel. The
energy is accounted for in this manner because the longi-
tudinal flanges contain the effective area of the panel.
The contribution of a uniform bar under linearly vary-
ing axial forces to the total internal strain energy is
given in Reference 9 as,
where P^ and P; are the axial forces applied to the ends
of the bar. Integration of Equation (8) yields:
The flange loadings were determined as a percentage of the
total load based on the ratio of the effective flange area
of the panel to the total flange area.
Substitution of appropriate panel parameters and pre-
viously determined flange loadings into Equation (9) yields
the additional strain energies required to complete the
3theoretical energy accounting. The distribution of the
energies is listed in Table II.
26

TABLE II
THEORETICAL STRAIN ENERGY DISTRIBUTION
OF THE IDEALIZED MODEL
Shear Panel 33.280 inch pounds
Forward Flange 0.313 inch pounds
Rear Flange 1.067 inch pounds
Rib Flange
TOTAL ENERGY
0.046 inch pounds
34.706 inch pounds
27

CHAPTER III
DISCUSSION 0F THEORETICAL RESULTS
The concept of the idealization, as discussed in
Reference 11, is simply to assign all the direct stress
carrying capacity of the structural material to the axial
force members and the shear carrying capacity to the
shear panel.
The idealization yields a theoretical solution to the
problem that utilizes several different averaging processes;
however, the objective of this report is to analyze the
accepted conventional methods currently in use in the
aircraft industry.
The distribution of the panel area to the adjacent
flanges is complicated by the apparent double use of the
area near the tip of the panel. Several wing analyses have
described alternative methods of including the rib flange in
12the idealized structure. It is of interest to note that
the theoretical result of the strain energy determined for
the rib flange is insignificant when compared to the other
components of the strain energy in the structure. Because
of the small energy of the rib flange portion of the plate
contribution, one could conclude that this flange and simi-
lar pieces do not contribute significantly to the over-all
wing behavior. Therefore, as discussed in Reference 12,
analyses of wings with applied normal loadings could be
simplified considerably by assuming zero flexibility for
this flange. It should be noted that the application of
28

chordwise loads would require that these elements be in-
cluded. This approach would appreciably decrease the number
of redundants in a wing analysis.
An appropriate study might be the determination of the
contribution of these rib flanges to the integrated analysis
of the wing.
29

CHAPTER IV
EXPERIMENTAL ANALYSIS
In order to determine the actual strain energy and
compare it with the value predicted from theory, an experi-
mental investigation was completed on a panel of an F8U-3
wing acquired from the Ling-Temco-Vought Corporation. The
panel section was a typical thick milled skin portion of
the wing and was tapered along the span as well as in the
chordwise direction.
The detailed explanation of the wing installation and
loading is included in Reference 3; therefore, only the
highlights of installation and any modifications incorpora-
ted by the author will be included in this report.
The wing was mounted inverted on a rigid support jig.
It was fastened to the jig at the two fuselage pivot lugs
and the two points on the main box front beam directly
opposite the bumper points (Plate 1) . Aluminum pads were
installed under the jig to distribute the loading to the
laboratory floor.
The entire wing was subjected to two pure torque loads
applied at each wing fold rib about the CIB (Piste 2) . The
position of the elastic axis was obtained from manufac-
turer's data and is shown in Figure 2. The CIB is approxi-
mately parallel to the elastic axis in the outboard section
of the wing. It reflects the characteristic breakdown in
the concept of a load axis toward the root of a swept wing.
30

31
32

The predetermined loading (8,000 pounds or 336,000 inch
pounds of torque) was measured with 10,000 pound dynamo-
meters connected in series with each hydraulic loading
cylinder. They were graduated in 100 pound increments but
could be read accurately to ten pounds. The final load
magnitudes were determined with hydraulic manifold pressure
readings related to pressure-load calibration curves for
the cylinders found in Appendix B. The load was well
within the elastic limit of the wing structure but still
of sufficient magnitude to yield adequate strain levels
throughout the structure.
All outer surface strain gage installations on the test
panel were installed by the author. The internal gages
were installed by laboratory technicians. All strains were
measured with SR-4 strain gage rosettes of the type AR-7-2
manufactured by the Baldwin-Lima-Hamilton Corporation.
Appendix C is a list of all 102 gages, their gage factors,
resistances and co-ordinate locations on the panel. The
rosettes on the outer surface were installed back to back
with the inner gages in order to give an indication of any
differential bending effects through the thickness of the
panel that may have existed. Figures 6 and 7 graphically
depict the strain gage locations on the panel, and Plate 3
shows the interior gage installation. A twenty channel
Budd Company switching and balancing unit was connected to
an externally powered Wheatstone bridge circuit. The bridge
and all associated circuitry were an integral part of a
33

COzoI-<oo
CD o>
CO
oX'oHUJ
CO
34
0)
o/ /$N&'
/ 1 p*/ 1 £f
0)
oSi
o
tt> r>
• w iw /Q) /
e /
8
0>
T> - /»- /
•V 1
V- 1
o2o /o /-° /
o1
k .
& 1 ##h^* 1 CO
z5 ^o
**do
<oo_l
LUCD
IN < ^
1 ^^/ *
#-£
C9 </>
C =< a>
PICO —LlO
° / X"v. / o1 *&'
\,
Si "Itl
LU
CO
\ Mt 0> I
t / 03
35
1
J
36

Budd/Datran Digital Strain Indicator (Model TC22) that read
out strain directly in micro-inches per inch. Calibration
of all equipment preceded each run. The electronic set-up
is described in Reference 3 and is reproduced in this report
as Appendix D.
The procedures used in conducting all test runs were
as follows:
1. The digital indicator was calibrated before
each run ensuring that sufficient time was
taken between runs to preclude any errors
being induced from hysteresis effects.
2. The switching and balancing unit leads were
plugged into twenty gage terminals at the
junction panel (Plate 4).
3. All strain gages and dynamometers were zeroed.
4. The hydraulic torque loading was applied and
adjusted to agree with all previous runs.
5. Equal couple loadings applied to each wing
tip were ensured by comparing the dynamometer
readings
.
6. The strain readings were taken and recorded.
7. The loads were removed. Hysteresis effects
were removed by allowing sufficient time (8 to
10 minutes) before commencing the next run.
Because of ambient laboratory temperature changes, the
sun striking the wing, and outside electrical interference,
all test runs were conducted at night. To ensure steady
37
3
oHiEH<
t
t
38
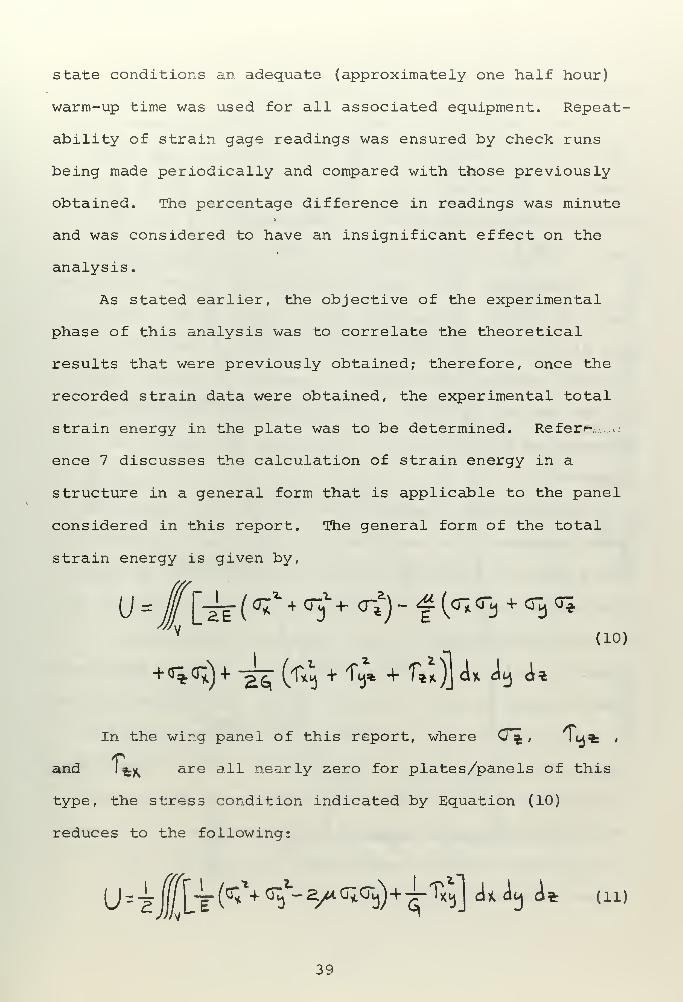
state conditions an adequate (approximately one half hour)
warm-up time was used for all associated equipment. Repeat-
ability of strain gage readings was ensured by check runs
being made periodically and compared with those previously
obtained. The percentage difference in readings was minute
and was considered to have an insignificant effect on the
analysis.
As stated earlier, the objective of the experimental
phase of this analysis was to correlate the theoretical
results that were previously obtained; therefore, once the
recorded strain data were obtained, the experimental total
strain energy in the plate was to be determined. Refer*- :o
ence 7 discusses the calculation of strain energy in a
structure in a general form that is applicable to the panel
considered in this report. The general form of the total
strain energy is given by,
)+ e^ O&a + Ty* + fw)] <U H <U
(10)
+<r^<r;H
In the wing panel of this report, where 0"%, ^M* >
and Jfc^ are all nearly zero for plates/panels of this
type, the stress condition indicated by Equation (10)
reduces to the following:
39
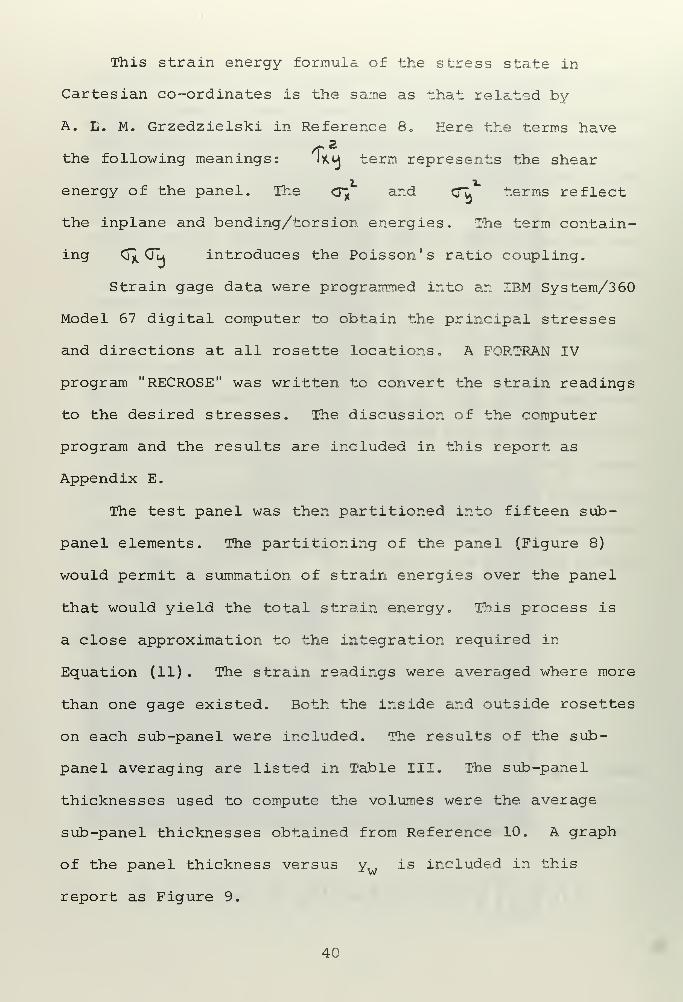
This strain energy formula of the stress state in
Cartesian co-ordinates is the same as that related by
A. L. M. Grzedzielski in Reference 8. Here the terms have
the following meanings: Iku term represents the shear
energy of the panel. The GHJ and CTu terms reflect
the inplane and bending/torsion energies. The term contain-
ing <T^(Tu introduces the Poisson's ratio coupling.
Strain gage data were programmed into an IBM System/360
Model 67 digital computer to obtain the principal stresses
and directions at all rosette locations. A FORTRAN IV
program "RECROSE" was written to convert the strain readings
to the desired stresses. The discussion of the computer
program and the results are included in this report as
Appendix E.
The test panel was then partitioned into fifteen sub-
panel elements. The partitioning of the panel (Figure 8)
would permit a summation of strain energies over the panel
that would yield the total strain energy. This process is
a close approximation to the integration required in
Equation (11) . The strain readings were averaged where more
than one gage existed. Both the inside and outside rosettes
on each sub-panel were included. The results of the sub-
panel averaging are listed in Table III. The sub-panel
thicknesses used to compute the volumes were the average
sub-panel thicknesses obtained from Reference 10. A graph
of the panel thickness versus yw is included in this
report as Figure 9.
40

u!0S2"lt>l
U!£80'Z£I= *
UJ
IQUJzo
cc
Li-
CO O
Ocrou_z<
oXo\-LU
41
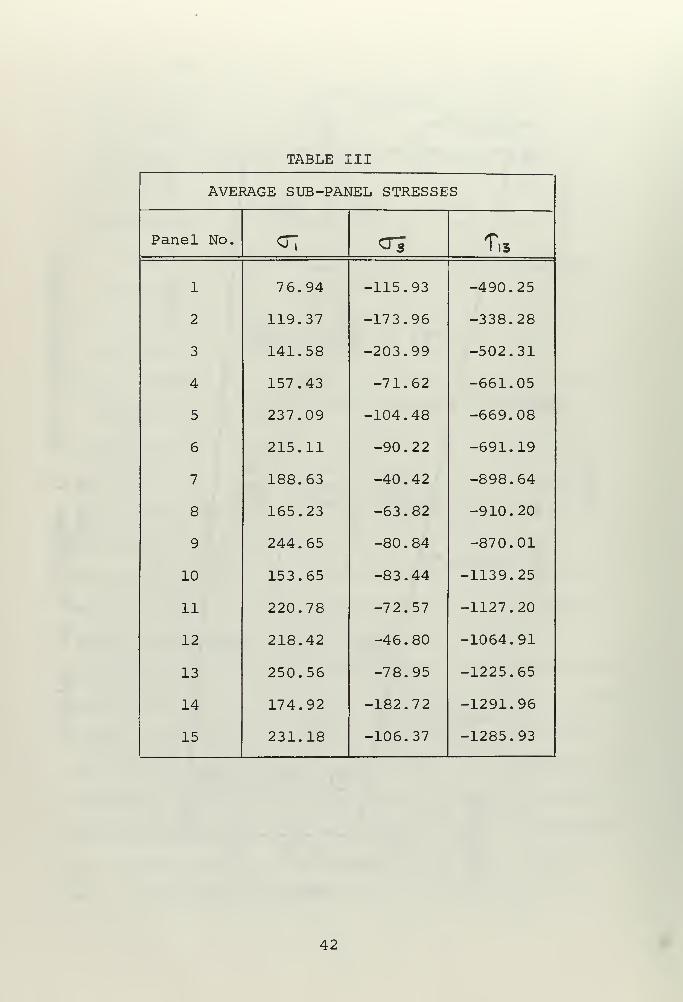
TABLE III
AVERAGE SUB-PANEL STRESSES
Panel No. <r; <Js T.i
1 7 6.94 -115.93 -490.25
2 119.37 -173.96 -338.28
3 141.58 -203.99 -502.31
4 157.43 -71.62 -661.05
5 237.09 -104.48 -669.08
6 215.11 -90.22 -691.19
7 188.63 -40.42 -898.64
8 165.23 -63.82 -910.20
9 244.65 -80.84 -870.01
10 153.65 -83.44 -1139.25
11 220.78 -7 2.57 -1127.20
12 218.42 -46.80 -1064.91
13 250.56 -78.95 -1225.65
14 174.92 -182.72 -1291.96
15 231.18 -106.37 -1285.93
42
43

The differences between the inner and outer surface
stresses (Appendix E) indicate that a bending/torsion effect
definitely does exist; however, assuming a linear variation
of the stress through the thickness of the plate produces a
strain energy that is less than one per cent different from
a direct stress averaging technique. Therefore, the mid-
plane stresses obtained by averaging the inner and outer
surface stresses were used in the calculation of the experi-
mental strain energies.
The individual sub-panel strain energies were computed
from Equation (11) using the required stresses listed in
Appendix E. The sub-panel energies were then summed to
obtain the total strain energy of the entire wing panel.
The result of this summation was 33.714 inch pounds.
The internal strain energy thus obtained was nearly
that determined theoretically in Chapter II and was con-
sidered a reasonably accurate evaluation of the actual
strain energy that existed in the swept panel element.
Figure 10 is a plot of the principal stresses obtained
from "RECROSE" versus location on the panel. The purpose
of this graph is to give the reader a feeling for the over-
all panel loading under the applied loading of the whole
wing.
44
(rs'd) SS9J4S
45

CHAPTER V
DISCUSSION OF EXPERIMENTAL RESULTS
The strain gages on the outer surface were mounted back
to back with the interior rosettes „ The purpose of this
installation was to detect any bending present that would
be reflected in a difference in inner and outer strain
readings. Examination of Figure 10 and Table E4 in
Appendix E indicates that bending definitely does exist.
However, when a linear variation of stress through the
thickness of the plate is assumed, the strain energy does
not vary appreciably from that computed by direct averaging;
therefore, even though the wing panel does exhibit the
effects of bending and twisting, the internal strain energy
computations do not seem to reflect this effect. The
experimental analysis averages the inner and outer values
of stresses before determining the panel strain energy;
therefore, this method utilizes the midplane stresses that
are the mean of the two surface stresses. It is significant
to note that the stresses along the rosette legs must be
utilized for this computation. The principal stresses
cannot be used because the orientation of the inner and.
outer stresses will not be parallel.
The experimental result obtained utilizes different
degrees of an averaging process. Obviously, this will not
yield precisely the strain energy that actually exists in
the panel; however, the partitioned panel strain energy
46

that was computed by summing the sub-panel energies must be
as close as possible to the actual internal strain energy
that exists. The further partitioning of the panel into
smaller elements would require the installation of more
strain gage rosettes. This would possibly further improve
upon the accuracy of the experimental strain energy results;
however, this approach was precluded by both time and
monetary considerations.
The optimum installation of the strain gage rosettes
would have been to place them in the center of each of the
fifteen sub-panel elements; however, the internal gages
having been previously mounted and the desirability of
mounting the inner and outer gages back to back precluded
the optimum installation. Additionally, because of the
lack of any stress concentrations, the stresses did not
vary radically over the panel. For these reasons the
rosette installations were considered adequate for this
analysis.
47

CHAPTER VI
COMPARISON OF RESULTS
The comparison of the theoretical and experimental
results, obviously, in the final analysis depends on how
well the energy of the mathematical model approximates the
true energy of the system. As stated in Reference 8, one
should not expect a correct result from either a mathema-
tical model or a lumped averaging process similar to the
empirical approach taken in this report unless the load
distribution is uniform over the panel. The strain energy
error becomes smaller if a more finely partitioned grid is
used. Thus, when the panel is subdivided into smaller
elements, the lumped integral form of computing strain
energy will increase in accuracy.
The error occurring in the determination of the
theoretical strain energy is obtained from the following:
ue " ut—— = percentage error (12)ue
Utilizing the results obtained in these analyses, the
percentage error in the theoretical strain energy computa-
tion was found to be 2.94 per cent.
It appears that there have been no gross errors made
in the energy accounting procedures. The comparison made
indicates a remarkably close agreement between experimental
and theoretical results.
48

Superficially, one might expect the experimental strain
energy to be greater than that computed from the idealized
model. This would seem reasonable when one considers that
the theoretical solution for a shear panel cannot possibly
include the strain energies induced from bending, torsion,
and any cross coupling effects that may exist in the actual
thick milled skin panel; however, careful scrutiny of the
idealized model reveals that the Poisson's effect is not
included; and therefore, there is no mechanism to include
the chordwise stresses. In fact, they are neglected. On
the other hand, in the empirical analysis it is shown that
appreciable chordwise stresses do exist. This is a contra-
diction to the close agreement (2.94 per cent) in the
comparison of the strain energies.
From this discussion one must conclude that the
stresses determined theoretically in Reference 3 must have
been in excess of their true values. This excess of span-
wise and shear stresses would compensate for the lack of
chordwise stresses. This is the only logical explanation
for the close comparison of the two analyses.
In order to determine the validity of this reasoning,
the principal stresses at station yw = 34.50 inches were
compared. The stresses in the model were: CP =714 psi• max
and *Y = 596 psi. Similarly, the experimental stresses' max r * i r
obtained from Figure 10 were: (T™ = 525 psi and^ max r
T max " 517 Psi «
49

As was predicted, the idealized normal stresses were
considerably higher (26.30 per cent) than those obtained
empirically. Similarly, the theoretical shear stresses were
higher (13.25 per cent). In general, these overestimates of
stress values compensated for the lack of chordwise stresses
when the theoretical strain energy was computed.
The location of the test panel on the wing did not lend
itself to the direct application of severe bending and/or
torsional loads. One can conclude, therefore, from the
results of this report that when even thick skinned aircraft
structures are analyzed using the conventional lumped
stringer and shear panel method, the analysis will be valid
provided there are no severe bending or torsion loads
applied directly to the panel. In general, the conventional
method is valid, provided that the structure is sufficiently
partitioned into a fine enough grid structure and the load
distribution is not too irregular.
In conclusion, one should not expect from an analysis
based on the lumped stringer and shear panel concept a
satisfactory agreement with experiment for isolated load-
ings, particularly when they are represented as point forces
in a theoretical analysis. In the panel studied and in
other similar cases there will always be ample structural
material to further partition the model. This partitioning
of a structure permits the desirable attenuation of the
effect of load concentrations. These load concentrations
can create discrepancies between computational and experi-
mental results.
50

In an associated study, the wing center section is
being included in the over-all wing analysis. The inclu-
sion of the energy contribution from the center section
would not be expected to change the theoretical analysis in
the vicinity of the particular panel considered in this
report. This is because of the massive construction of the
wing in this specific area. Even though the pivot rib is
not infinitely rigid in the chordwise direction, it is
nearly so and may be assumed to have zero flexibility.
Reference 3 verifies this assumption by the close agreement
between the theoretical and experimental results in the
vicinity of the particular panel considered.
51

CHAPTER VII
CONCLUSIONS AND RECOMMENDATIONS
Conclusions
It can therefore be concluded that a valid comparison
was achieved between theoretical and experimental strain
energies of a thick milled skin aircraft structure. The
accuracy of the analytical method is subject to the absence
of concentrated loadings. Additionally, for a theoretical
structure, a fine element partitioning procedure is
required.
The analytical method provided remarkably accurate
results (2.94 per cent error) and is a valid approach to
aircraft structures of this specific type.
Recommendations
It is recommended that even though the results of this
study are favorable, another analysis should be made on a
panel that is subjected to more severe non-planar loadings.
Possibly a panel outboard of the intermediate rib could be
used on the same wing. The load would then be applied to a
thinner section of the wing where there is less torsional
rigidity, and the point of load application would be closer
to the panel to be studied. Another possibility would be
to obtain some means of applying single point loads to the
same panel at the intersection of the intermediate rib and
the spanwise beams. Still another method would be to apply
52

the same torque used in this analysis at the intermediate
rib.
An additional recommendation, that was previously dis-
cussed in Chapter III, is that a study be conducted to
determine the validity of a wing analysis that neglects the
presence of any rib flanges.
53

REFERENCES
1. Peery, David J., Aircraft Structures, McGraw-Hill
Book Company, New York, 1950.
2. Argyris, J. H. and Kelsey, S. , Energy Theorems and
Structural Analysis , Butterworths , London, 1960.
3. Holgren, Marvin A. and Comfort, Clayton L. , Comparison
of Experimental Stresses and Deflections with Those
Predicted by a Strain Energy Method for an F8U-3
Wing Loaded in Torsion, MS Thesis, Naval Postgraduate
School, 1963.
4. Smith, F. C. , Stress and Deflection Analysis of
Aircraft Structures Using Strain Energy Theory in
Conjunction with Electronic Digital Computers ,
Chance Vought Aircraft Incorporated, Dallas, Texas,
1957.
5. Bilodeau, J. W. , F8U-3 Structural Description Report,
Chance Vought Aircraft Incorporated, Dallas, Texas,
1957.
6. Garvey, S. J., "The Quadrilateral Shear Panel,"
Aircraft Engineering, May, 1951.
7. Wang, Chi-Teh, Applied Elasticity , McGraw-Hill Book
Company, New York, 1953.
8. Grzedzielski, A. L. M. , Theory of Multi-Spar and
Multi-Rib Wing Structures , National Aeronautical
Establishment, Ottawa, Canada, 1961.
54

9. Bruhn, E F. , Analysis and Design of Flight Vehicles
Structures , Tri-State Offset Company, Cincinnati,
Ohio, 1965.
10. Kane, D. A., Wing Stress Analysis , Chance Vought
Aircraft Incorporated, Dallas, Texas, 1958.
11. Gallagher, Richard H. , A Correlation Study of Methods
of Matrix Structural Analysis , The MacMillan Company,
New York, 1964.
12. Eggwertz, Sigge, Calculation of Stresses in a Swept
Multicell Cantilever Box Beam with Ribs Perpendicular
to the Spars and Comparison with Test Results, The
Aeronautical Research Institute of Sweden, Stockholm,
1954.
55

APPENDIX A
THEORETICAL DETERMINATION OF SHEAR FLOWS
AT SECTIONS PERPENDICULAR TO CIB AT
y =98.7 and yw = 74.3 (Reference 3)
The theoretical, shear flows at sections perpendicular
to the CIB at yw = 98.70 and yw = 74.30 were calculated in
order to determine the shear flows at both sections which
would be used to produce the equivalent applied forces at
the streamwise intermediate rib, y = 81.98. The cross-w
sections are shown schematically in Figure Al. The thick-
nesses were averaged mid-panel values, and the web heights
were taken as the mid-panel height between the upper and
lower skins.
A box structure with several cells will have one less
redundant than the number of cells. In this case, there are
five redundant webs. It is desired to write six equations
in six unknown shear flows. This was done by equating the
angle of twist of one cell with the remaining five, which
gives five equations, and then writing an equilibrium of
torsional moments equation.
The first five equations were obtained by equating the
angle of twist per unit length, Q , of one cell with the
other five using the well-known expression for a box beam,
w ~^ 2A*G
56

FIG. Al
SCHEMATIC DIAGRAM OF SECTIONS
PERPENDICULAR TO THE C.I.B.
AT yw = 98.7 AND 74.3
T5.97
i
Vw=98.7
©If.
?
—
6.62
©)qet
10.4
V16.87
®
ZUpper surface
6.68
©qct
10. 9.9 9.5
6.21
i q bt
8.7
T5.70
®
8.0
"T4.6
J.
R.B. C.I.B. F.B.
Upper surface
T6.33
I
©Of.
T"7.07
®7.57
* qdt
756
®qV ^Ct
T7.13
q bt
11.3 1.4
R.B.
11.2
C. .B.
Vw=74.3
11.2 10.4
6.42
Yjll
~f5.14
A10.
1
F.B.
Note: dimensions in
inches
(ref. 10)
57

The equilibrium of torsional moments may be written as
T = Z2AnQn (A2)%'
In using Equation A2 the summation is carried out
around the entire perimeter of each cell. The unit length,
L, and the constant factor 2G drop out, leaving for cells a
and b,
4^1=^; 44s«• Aa.t b Abt <A3 >
The value of q for any exterior web of cell a is qat
and for the interior web is (q - qu.4-) • Using the
following abbreviations,
<~w - £— t<x
Equation A3 is rewritten,
A.^ A*. °*y Ab °bb A b°**>
(A4)
The terms OACl and £>&> represent summations around the
entire perimeter of their respective cells and 0«Ja the
value for the interior web. The enclosed areas were taken
as the average web height times the distance between webs.
58

Equating the angle of twist per unit length of cell a
to the remaining cells yields the following equations:
'-
T&'fc &Al -?et &cd - %<* 6de)
=H Ok* 6«c - ^t 6de - J4t feef)
Making appropriate substitutions, performing the indicated
algebraic operations and rearranging, one obtains five
equations in terms of the six shear flows with constant
coefficients. The required sixth equation was derived as
previously described.
The solution to these six simultaneous equations was
obtained from a digital computer using a FORTRAN program
which is included in Reference 3. It utilizes Gauss's
method of elimination with row pivoting and back substitu-
tion and is designed to yield solutions for one or more
column vectors forming the right hand side of the set of
equations. This means that it would produce solutions for
one or more values of applied torque. The check values of
q were hand calculated using an iterative procedure
59

suggested by Bruhn in Reference 9 and within slide rule
accuracy agree well with the computer solutions.
60

APPENDIX B
CALIBRATION CURVES FOR DILLON DYNAMOMETERSAND HYDRAULIC PRESSURE S>STEM
o 4a•2 2
-2
p _,
UJ -6
130,0001b. Riehle Tensile Test Machine
2000 4000 6000Recorded load - lbs.
8000 10,000
IOX
£}
o»cooa>k_
a>
a>
EoEoc>%Q
Riehle reading lb. x 10
61
APPENDIX C
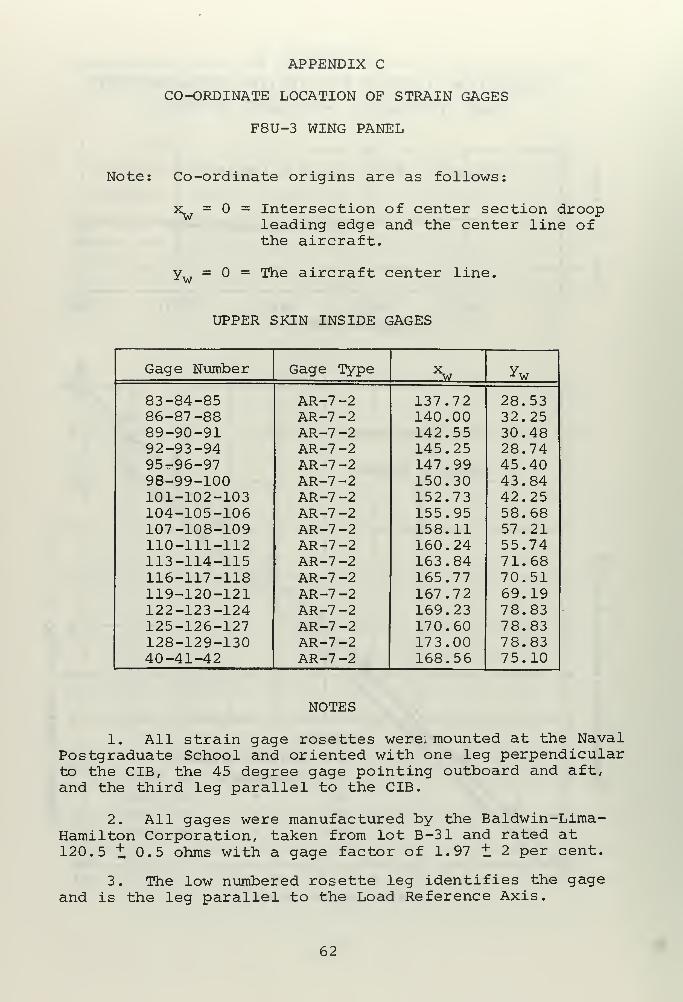
CO-ORDINATE LOCATION OF STRAIN GAGES
F8U-3 WING PANEL
Note: Co-ordinate origins are as follows:
x = = Intersection of center section droopleading edge and the center line ofthe aircraft.
ytT = = The aircraft center line.
UPPER SKIN INSIDE GAGES
Gage Number Gage Type xw ^w
83-84-85 AR-7 -2 137.72 28.5386-87-88 AR-7 -2 140.00 32.2589-90-91 AR-7 -2 142.55 30.4892-93-94 AR-7 -2 145.25 28.7495^-96-97 AR-7 -2 147.99 45.4098-99-100 AR-7 -2 150.30 43.84101-102-103 AR-7 -2 152.73 42.25104-105-106 AR-7 -2 155.95 58.68107-108-109 AR-7 -2 158.11 57.21110-111-112 AR-7 -2 160.24 55.74113-114-115 AR-7 -2 163.84 71.68116-117-118 AR-7 -2 165.77 70.51119-120-121 AR-7 -2 167.72 69.19122-123-124 AR-7 -2 169.23 78.83125-126-127 AR-7 -2 170.60 78.83128-129-130 AR-7 -2 17 3.00 78.8340-41-42 AR-7 -2 168.56 7 5.10
NOTES
1. All strain gage rosettes were: mounted at the NavalPostgraduate School and oriented with one leg perpendicularto the CIB, the 45 degree gage pointing outboard and aft,and the third leg parallel to the CIB.
2. All gages were manufactured by the Baldwin-Lima-Hamilton Corporation, taken from lot B-31 and rated at120.5 t 0.5 ohms with a gage factor of 1.97 ± 2 per cent.
3. The low numbered rosette leg identifies the gageand is the leg parallel to the Load Reference Axis.
62

4. Gage No. 98 yields questionable results.
UPPER SKIN OUTSIDE GAGES
Gage Number Gage Type v ^w
580-581-582 AR-7 -2 137.72 28.53583-584-585 AR-7-2 140.00 32.25475-476-477 AR-7 -2 142.55 30.48586-587-588 AR-7 -2 145.25 28.74589-590-591 AR-7 -2 147.99 45.40592-593-594 AR-7-2 150.30 43.84595-596-597 AR-7 -2 152.73 42.25598-599-600 AR-7 -2 155-95 58.68601-602-603 AR-7 -2 158.11 57.21604-605-606 AR-7-2 160.24 55.74607-608-609 AR-7-2 163.84 71.68610-611-612 AR-7 -2 165.77 70.51613-614-615 AR-7 -2 167.7 2 69.19616-617-618 AR-7 -2 169.23 78.83619-620-621 AR-7 -2 17 0.60 78.83622-623-624 AR-7 -2 173.00 78-83625-626-627 AR-7 -2 168.56 75.10
NOTES
1. All strain gage rosettes were mounted at the NavalPostgraduate School and oriented with one leg perpendicularto the CIB, the 45 degree gage pointing outboard and aft,and the third leg parallel to the CIB.
2. All gages were manufactured by the Baldwin-Lima-Hamilton Corporation, taken from lot B-31 and rated at120.5 + 0.5 ohms with a gage factor of 1.97 t. 2 per cent.
3. The high numbered rosette leg identifies the gageand is the leg parallel to the Load Reference Axis.
63

APPENDIX D
STRAIN GAGE INSTRUMENTATION
The method of taking strain readings employed common
Wheatstone Bridge circuitry as is shown in Figure Dl. The
experimental test setup used the Budd/Datran Digital Strain
Indicator (Model TC22) . The Wheatstone Bridge and all
associated circuits were incorporated within the indicator.
The indicator interpreted the bridge unbalance and gave a
visual display of the strain directly in units of micro-
inches per inch.
When the test runs were made, each of the twenty gages
connected through the switching and balancing unit was
zeroed on the digital strain indicator in the conventional
manner prior to load application. At any time during the
test run the calibration could be checked by merely pushing
a button on the counter. This gave a continual check and
ensured the calibration of the counter at all times during
the running of the test.
64
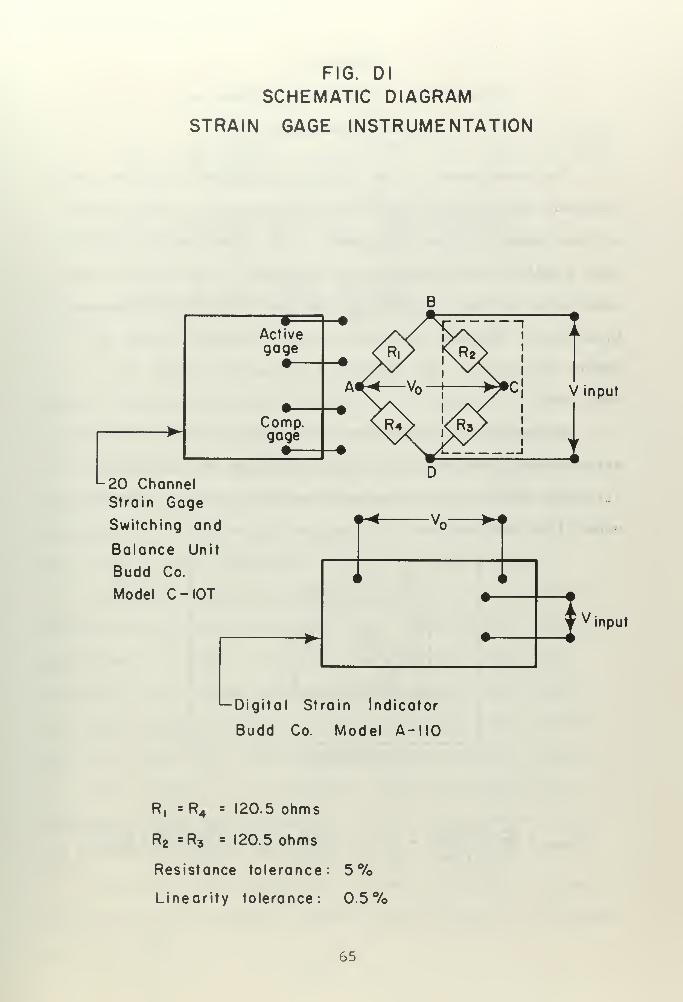
FIG. Dl
SCHEMATIC DIAGRAM
STRAIN GAGE INSTRUMENTATION
w
•Activegage
—
•
a.
A
Comp.gagem , ...
•
-?o Thnnn
A
al
Strain Gage
Switching and
Balance Unit
Budd Co.
Model C-IOT
input
•—Digital Strain Indicator
Budd Co. Model A-IIO
R, = R4 = 120.5 ohms
R2 =R3 = 120.5 ohms
Resistance tolerance: 5%Linearity tolerance: 0.5%
65
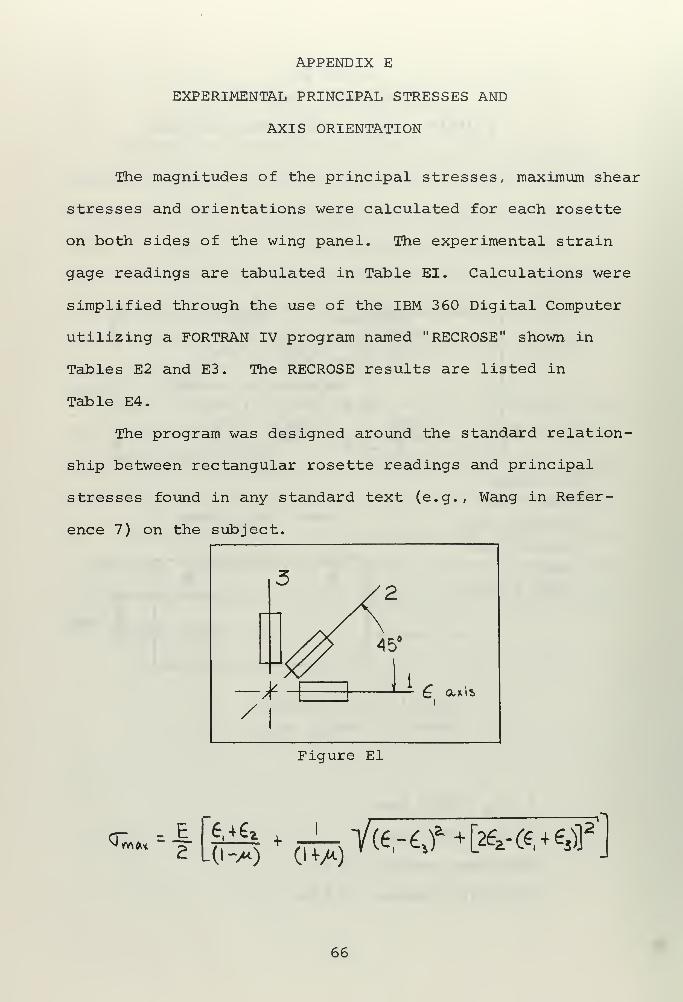
APPENDIX E
EXPERIMENTAL PRINCIPAL STRESSES AND
AXIS ORIENTATION
The magnitudes of the principal stresses, maximum shear
stresses and orientations were calculated for each rosette
on both sides of the wing panel. The experimental strain
gage readings are tabulated in Table EI. Calculations were
simplified through the use of the IBM 360 Digital Computer
utilizing a FORTRAN IV program named "RECROSE" shown in
Tables E2 and E3. The RECROSE results are listed in
Table E4.
The program was designed around the standard relation-
ship between rectangular rosette readings and principal
stresses found in any standard text (e.g., Wang in Refer-
ence 7) on the subject.
Figure El
- E.
2 L(i -A) (I +A)Yce-^f +[*a-fc+es)l
:
66

rp 2 L €,*£» J
(D p is the angle between leg number one and the maximum
normal stress axis. A positive value indicates an angle in
the direction of C ?. C,# £~ and £_ are the strain^12 -3
gage readings on their respective legs shown in Figure El.
The number of the rosette leg parallel to the Load Reference
Axis (CIB) is the identifying number for the rosette.
The input to program RECROSE (Table El) was designed to
accommodate the above notation. Only the rosette identify-
ing number is listed. This is also the gage number for
which the first column of strains is listed. The second
and third columns are then the values of the strain on the
next two consecutive numbered gages comprising the rosette.
This program was designed for 707 9-T6 Aluminum with a
Modulus of Elasticity of 10.3 x 10^ pounds per square inch
and a Poisson's ratio of 0.32.
The results of RECROSE are listed in Table E4 and are
identified by the rosette numbers which orient the reference
axis for (Pp .
67

TABLE EI
EXPERIMENTAL STRAIN READINGS
(Input to RECROSE Program)
336,000 in. lb. load
INSIDE SKIN
Rosette aa. in,/ M in./
Number
83 9 51 -1286 12 59 -1089 15 55 -2092 13 52 -2195 12 83 -3
98 19 83 -8101 20 91 -4
104 18 109 -7
107 10 110 -6
110 21 107 -12113 14 136 -2
116 17 136 -13119 22 130 -16122 20 147 -11125 12 152 -15128 17 151 -2140 26 149 -19
OUTSIDE SKIN
582 10 59 -18585 12 70 -1347 7 18 65 -20588 26 69 -26591 22 87 -20594 32 92 -26597 26 89 -26600 20 124 -12603 25 123 -16606 30 120 -18609 20 152 -23612 29 154 -14615 22 146 -6
618 32 169 -19621 32 169 -30624 33 17 7 -13627 33 167 -23
_ _
68

TABLE E2
LIST OF SYMBOLS USED IN
PROGRAM RECROSE
ComputerCoded Name
El
E2
E3
SIGMAX
SIGMIN
SIGMA 1
SIGMA 3
TAUMAX
PHIPRR
N
E
U
Definition
£ , , strain in identifying leg of rosette.
& 2' strain in diagonal leg of rosette.
€. ->, strain in perpendicular leg of rosette.
(J~ , maximum principal stress,max
Cm i n # minimum principal stress.
g-\ , stress in identifying leg of rosette.
0"~3/ stress in perpendicular leg of rosette,
'max' maxiinuIT1 shearing stress.
(7L , angle from £ , to <j~ axis.Vp r 1 M max
The number of input rosettes.
Modulus of Elasticity.
J/. , Poisson's ratio.
69
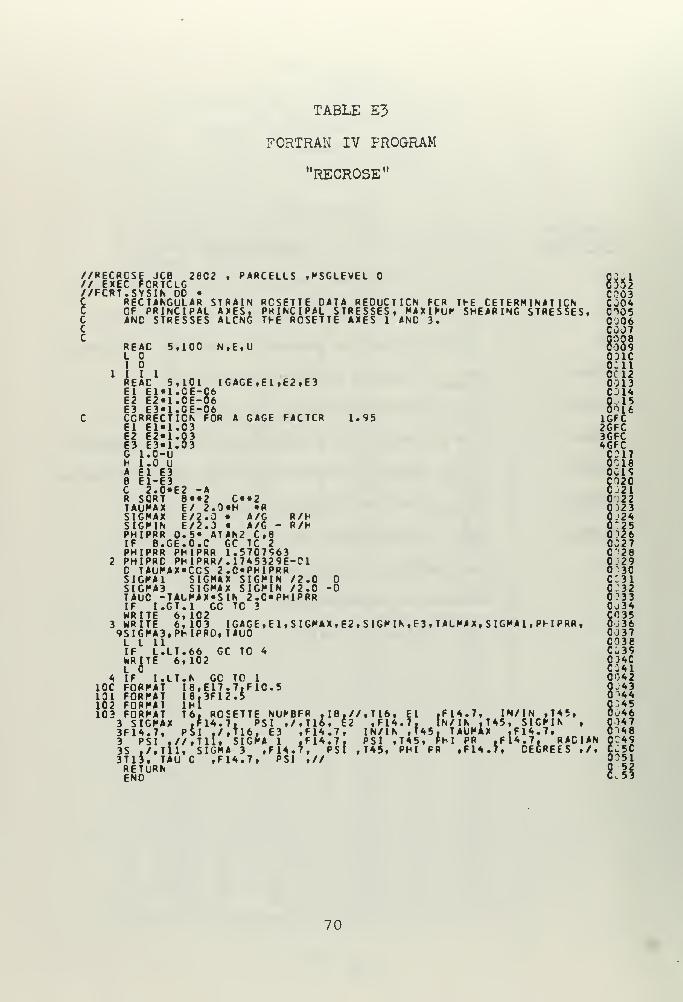
TABLE E3
FORTRAN IV FROGRAM
"RECROSE"
//RECROSE JCB 2802 , PARCELLS .HSGLEVEL QOjl// EXEC FCRTCLG 0302//FCRT.SYSIN DO • C"<03C RECTANGULAR STRAIN RCSETTE OATA REDUCTION FCR THE CETERM INAT ICN CJOAC OF PRINCIPAL AXES, PRINCIPAL STRESSES, MAXIPUP SHEARING STRESSES, 0">05C AND STRESSES ALCNG THE RCSETTE AXES 1 AND 3. 0JO6C C0J7C 0008
REAC 5,100 N,E,U 0009L C31Ci o 0:11
1 I I 1 0C12REAC 5,101 IGAGE,E1,E2,E3 0013El E1«1.0E-C6 C01A
"1-06 OILE3 E3M.OE-06 0^16CORRECTION FOR A GAGE FACTCR 1.95 IGFCEl El«1.03 2GFCE2 E2«1.03 3GFCE3 E3«1.03 AGFCG 1.0-U c:i7H 1.0 U 0~18A El E3 GC19B E1-E3 C02CC 2.0«E2 -A CJ21R SORT B»«2 C»«2 0,22TAUMX E/ 2.0«H «R 0J23SIGMAX E/2.0 • A/G R/H 0.'2«SIGHIN E/2.J • A/G - R/H 0*25PHIPRR 0.5« ATAN2 C,B 0^26IF B.GE.O.C GC TC 2 0027PHIPRR PHIPRR 1.5707S63 C'28
2 PHIPRC PHIPRR/. 17A5329E-01 0.29C TAUHAX«COS 2.0'PHIPRR 030SIGfAl SIGMAX SIGHIN /2.0 C'31SIGHA3 SIGHAX SIGHIN /2.0 -0 C-32TAUO -TAUMAX»SIN 2.C«PHIPRR 0?33IF I.GT.l GO TO 3 0j3AWRITE 6,102 £035
3 WRITE 6,103 IGAGE,EI,SIGPAX,E2,SIGPIN,E3,TAIPAX,SIG»A1,PFIPRR, 0-369SIGHA3.PHIPRD, TAUO 0037L L 11 C03eIF L.LT.66 GC TO A CJ39URITE 6,102 C3ACL CjAI
A IF I.LT.N GC TO 1 C0A2IOC FORMAT 18.E17.7.F1C.5 §vA3101 FORMAT I8.3F12.5 OHJ102 FORMAT lHl C-A5103 FORMAT T6. ROSETTE NUPBFR .I8.//.T16, El .F14.7, IN/IN ,TA5, 0JA6
3 SIGHAX .F1A.7, PSI ,/,T16, E2 ,F1A.7. IN/IN ,TA5, SIGHN , 00473F1A.7, PSI f
/,tl6, E3 .F1A.7, IN/IN ,tA5. TAUHAX .F1A.7, 0jA83 PSI ,//,Tll, SIGKA 1 .FIA.7, PSI ,TA5, PHI PR t FlA.7. RACIAN QCA93S ./fTlli SIGHA 3 ,F1A.7, PSI , TA5, PHI PR ,F1A.J, CEGREES ,/, C\5C3Tl5, TAU ,F1A.7, PSI ,// 0051RETURN Q 52END C.53
70

TABLE E4
EXPERIMENTAL RESULTS
(Output of Program RECROSE)
Ros-ette SIGMA 1 SIGMA 3 SIGMAX SIGMIN TAUMAX PHIPRR
83 60.987 -107.792 406.902 -453.706 430.304 39.34586 104.009 -7 2.807 490.063 -458.860 474.462 39.63089 101.646 -179.653 444.059 -522.066 483.063 36.53692 74.225 -199.037 407.954 -532.765 470.359 36.55695 130.485 9.928 703.993 -563.579 633.786 42.27198 194.309 -22.693 718.064 -546.448 632.256 40.059
101 221.257 28.366 798.828 -549.205 674.016 40.886104 186.273 -14.657 923.694 -752.078 837.886 41.556107 95.500 -33.094 901.589 -839.184 870.386 42.881110 202.819 -62.407 904.616 -7 64.203 834.409 40.427113 157.906 29.310 1140.408 -953.191 1046.799 43.239116 151.760 -89.355 1114.900 -1052.495 1083.697 41.806119 199.510 -105.901 1078.876 -985.268 1032.072 40.745122 194.782 -54.369 1222.249 -1081.836 1152.042 41.896125 85.100 -131.904 1215.054 -1261.858 1238.457 42.487128 121.503 -183.908 1207.919 -1270.324 1239.123 41.46140 235.441 -126.231 1237.903 -1128.693 1183.298 40.605
582 50.114 -174.925 456.284 -581.095 518.689 38.736585 92.664 -108.265 567.653 -583.255 575.454 39.973477 137.104 -168.307 536.391 -567.594 551.992 36.970588 208.965 -208.965 592.624 -592.624 592.624 34.646591 184.381 -153.178 727.102 -695.899 711.500 38.139594 279.881 -186.272 799.123 -705.514 752.318 35.976597 208.965 -208.965 745.201 -745.201 745.202 36.857600 191.000 -66.189 1035.393 -910.581 972.987 41.203603 234.968 -94.555 1036.749 -896.336 966.543 40.093606 286.500 -99.282 1029.923 -842.706 936.314 39.056609 149.397 -196.200 1222.335 -1269.139 1245.737 41.013612 289.809 -55.787 1307.058 -1073.037 1190.048 40.825615 237.332 12.291 1239.625 -990.002 1114.814 42.104618 306.356 -103.538 1423.420 -1220.602 1322.012 40.541621 264.754 -233.550 1388.629 -1357.425 1373.029 39.772624 340.868 -28.840 1510.879 -1198.849 1354.865 41.079627 303.047 -147.033 1399.322 -1243.308 1321.316 40.097
71

INITIAL DISTRIBUTION LIST
No. Copies
1. Defense Documentation Center 20Cameron StationAlexandria, Virginia 22314
2. Library 2Naval Postgraduate SchoolMonterey, California 93940
3. Professor Charles H. Kahr 2
Department of AeronauticsNaval Postgraduate SchoolMonterey, California 93940
4. Lieutenant Paul W. Parcells 1
1221 Spruance RoadMonterey, California 93940
5. Commander, Naval Air. Systems Command 1
Department of the NavyWashington, D. C. 20360
6. Chairman, Department of Aeronautics 1
Naval Postgraduate SchoolMonterey, California 93940
7. Professor Allen E. Fuhs 1
Department of AeronauticsNaval Postgraduate SchoolMonterey, California 93940
8. Professor Ulrich Haupt 1
Department of AeronauticsNaval Postgraduate SchoolMonterey, California 93940
9. Professor Robert E. Ball 1
Department of AeronauticsNaval Postgraduate SchoolMonterey, California 93940
10. Dr. E. S. Lamar 1
Chief ScientistNaval Air Systems CommandDepartment of NavyWashington, D. C. 20360
72

11. Mr. G. L. DesmondAerodynamics and Structures
Technology AdministratorNaval Air Systems CommandDepartment of NavyWashington, D. C. 20360
73

UNCLASSIFIED
Security Classification
DOCUMENT CONTROL DATA - R&D(Security classification of title, body of abstract and Indexing annotation muet be entered when (he overall report ie ctaaaitied)
1. ORIGINATING ACTIVITY (Corporate author)
Naval Postgraduate SchoolMonterey, California
2a. REPORT SECURITY CLASSIFICATION
Unclassified2b CROUP
3. REPORT TITLE
Theoretical and Empirical Analyses of Thick SkinnedSwept Wing Panels
4. DESCRIPTIVE NOTES (Type ot report and inclusive datea)
Masters Thesis 1967-19685. AUTHORfSj (Laat name, tint name, initial)
PARCELLS, Paul W. , LT, USN
6- REPORT DATEDecember 1967
7a- TOTAL NO. OF PASES71
7b. NO. OF REFS12
S« CONTRACT OR ORANT NO.
b. PROJECT NO.
9a. ORIGINATOR'S REPORT NUMBER(S)
9b. OTHER REPORT NO(S) (Any other numbers that may be assignedthis report)
10. AVAILABILITY/LIMITATION NOTICES
11- SUPPLEMENTARY NOTES 12. SPONSORING MILITARY ACTIVITY
Commander, Naval Air Systems CommandDepartment of the NavyWashington, D. C. 20360
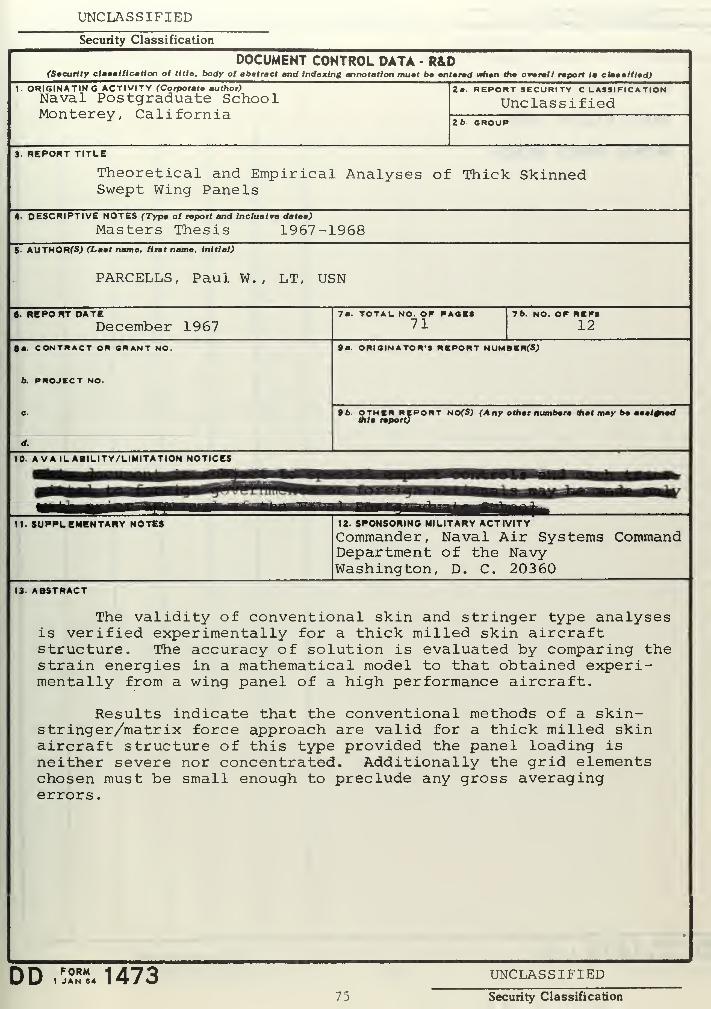
13. ABSTRACT
The validity of conventional skin and stringer type analysesis verified experimentally for a thick milled skin aircraftstructure. The accuracy of solution is evaluated by comparing thestrain energies in a mathematical model to that obtained experi-mentally from a wing panel of a high performance aircraft.
Results indicate that the conventional methods of a skin-stringer/matrix force approach are valid for a thick milled skinaircraft structure of this type provided the panel loading isneither severe nor concentrated. Additionally the grid elementschosen must be small enough to preclude any gross averagingerrors.
DD FORM1 JAN 64 1473 UNCLASSIFIED
75 Security Classification
UNCLASSIFIEDSecurity Classification
KEY WO R DS
SWEPT WING
THICK MILLED SKIN
MATRIX FORCE METHOD
4
ROLE WT ROLE WT
DD ,
F°1\.1473 back
S/N 0101 -807-682) 76
UNCLASSIFIEDSecurity Classification A- 3 1 409


thesP149
3 2768 00416403 8DUDLEY KNOX LIBRARY
BHffl
8MBinmm
HLf
mm
HH'v.- W
lliiBwtwR
ffififflSW
:R$«*3
!H NSHGSn
«yv»
(ftfflffiifjngl
^'l!«hW«4;iuiMtaBlri'o.R
H8K»B»S93
m«»imBNCaaWftflQMBUt