Embed Size (px)
Citation preview

Figure 1. Blacksburg/Christiansburg/Radford MSA, Median Household Income (2013)

Figure 2. Blacksburg/Christiansburg/Radford MSA, Median Household Income with Census Tracts (2013)
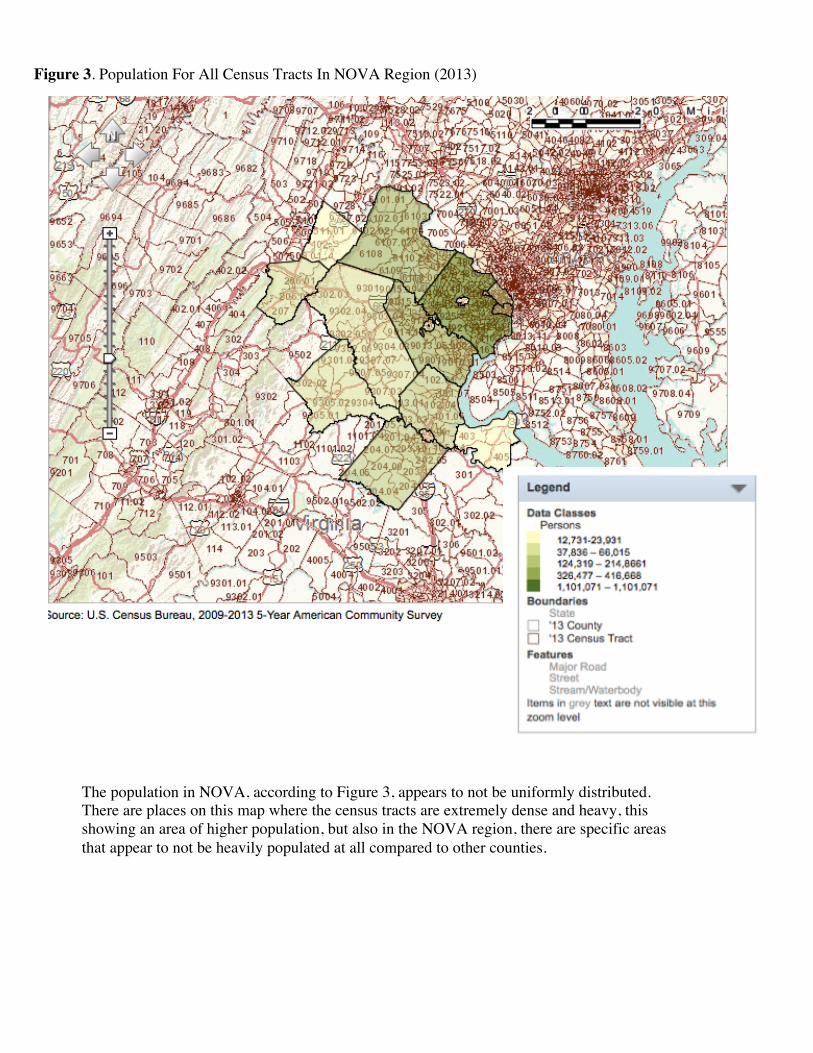
Figure 3. Population For All Census Tracts In NOVA Region (2013)
The population in NOVA, according to Figure 3, appears to not be uniformly distributed. There are places on this map where the census tracts are extremely dense and heavy, this showing an area of higher population, but also in the NOVA region, there are specific areas that appear to not be heavily populated at all compared to other counties.

Figure 4. Population of Each County In NOVA Region (2013)

Figure 5. Average Age of Each County In NOVA Region, In Years (2013)
After looking at both Figure 4, and Figure 5, the theory that young people moving to the area drive NOVA population growth is supported. Especially in Figure 5, the viewer can see that most places in NOVA have an average age of 28.8 – 32.4 or 33.5 – 34.9. This is a relatively young average age for a region, proving that NOVA indeed is a place where young people flock to.


