Embed Size (px)
Citation preview

_________________________________________________________________________________________________
16 Palm Ct · Menlo Park, CA 94025 | 650.308.9046 | www.clean-coalition.org
1
The Hunters Point Community Microgrid Project: A Model for Clean Local Energy An Energy, Economic, and Environmental Benefits Analysis for High Penetrations of Renewable Energy in San Francisco’s Bayview-‐Hunters Point Area
Copyright © 2013 Clean Coalition
2
Executive Summary
The Clean Coalition is a nonprofit organization whose mission is to accelerate the transition to local energy systems through innovative policies and programs that deliver cost-‐effective renewable energy, strengthen local economies, foster environmental sustainability, and provide energy resilience.
In collaboration with Pacific Gas & Electric and in support of the city of San Francisco’s goal to achieve a 100% renewable electricity supply, the Clean Coalition is spearheading a groundbreaking project to bring clean local energy online in San Francisco. The Hunters Point Community Microgrid Project, named after the substation that serves both the Bayview and Hunters Point areas, will prove that clean local energy can fulfill at least 25% of total electric energy consumption in the area. At the same time, the Hunters Point Community Microgrid Project advances the distribution power grid to dynamically support large amounts of clean local energy while maintaining or improving power quality, security, and reliability. The Hunters Point Community Microgrid Project provides a world class, scalable, and replicable model for how San Francisco and communities around the globe can reap the substantial economic, energy, and environmental benefits from high penetrations of clean local energy.
The Hunters Point Community Microgrid Project will result in a smarter, cleaner, and more resilient power system that boosts the local economy by attracting private investment, creating jobs, stabilizing energy prices, and shifting the energy spend closer to home. It will demonstrate how communities nationwide can leverage local renewables for cleaner, more affordable, and more reliable power while also reaping substantial economic and environments benefits.
Benefits of Clean Local Energy in Bayview-‐Hunters Point
This document summarizes the substantial economic, energy, and environmental benefits of deploying high penetrations of renewable energy in Bayview-Hunters Point. Specifically, the data below details the benefits of deploying 50 megawatts (MW) of new solar photovoltaic (PV) in the area, which would meet at least 25% of the local electric energy consumption. Given the strong solar PV potential in the Bayview-‐Hunters Point area, 50 MW is a conservative estimate, which only accounts for top-‐tier PV locations on existing commercial and residential rooftops, parking lots, and planned rooftops in the redevelopment zone.
Over a 20-‐year timespan, 50 MW of new solar PV in Bayview-‐Hunters Point will deliver the following benefits:

3
Economic Benefits1 • $200 million in total added regional economic output• $70 million in local wages from construction and installation, representing
1,270 near-‐term construction job-‐years• $29.7 million in local wages from operations and maintenance, representing
an additional 520 job-‐years (26 full-‐time equivalent or FTE jobs, $1,485,000in annual wages)
• $5.8 million in construction-‐related state sales tax revenue• $10 million in site leasing income to property owners in Bayview-‐Hunters
Point (an amount equal to $500,000 annually)
Energy Benefits • A wholesale cost for distributed solar PV equal to or less than conventional
natural gas generation (using a 20 year levelized cost of energy or LCOE)2 • $260 million spent on local energy resources versus sending those dollars
out of the community • $38 million in avoided transmission access charges3• $30 million in avoided costs from new transmission capacity3• $30 million in avoided costs by reducing power interruptions in the
community3• $12 million in avoided costs from transmission line losses3
Environmental Benefits • Reduce annual greenhouse gas (GHG) emissions by 78 million pounds4, the
equivalent of removing 6,660 cars from the road • Save 15,000,000 gallons of water annually5• Preserve 375 acres land through secondary use of roof and parking lot areas6
1 NREL JEDI model results from $2.75/W(dc) 2015 estimated gross weighted average cost. Higher or lower costs by installation type or year installed will proportionately influence results. 2 CEC 2013 Cost of Generation Calculator. NOTE: This analysis uses the most recent CEC COG model available, COG_Model_Version_3_revision_91e. As of the release date of this report, this version was officially still under development; however, no significant changes other than cosmetic were anticipated. The prior version of the CEC COG can be found at http://www.energy.ca.gov/2010publications/CEC-‐200-‐2010-‐002/ 3 CAISO 2013 TAC schedule and infrastructure projections 4 NREL Emissions Health Calculator, PG&E service territory 5 DOE 2009 6 Civil Society Institute – “Hidden Costs of Electricity” (Sep 2012)
4
Background
As part of the Hunters Point Community Microgrid Project, the Clean Coalition studied how to cost-effectively integrate high penetrations of clean local energy into the local distribution grid. The study’s geographic boundary, defined by the electrical service territory associated with the Hunters Point substation (as shown below), represents a current annual load of 236,520 megawatt hours (MWh) of conventional electricity generation from 18,000 residences and 2,000 commercial customers. The area currently supports 13,338 MWh of existing solar photovoltaic and biopower. The city’s redevelopment plans for the area will add 78,359 MWh of load, reaching a projected total annual load for the substation of over 328,000 MWh.
In the first phase, the Clean Coalition evaluated both existing and planned structures within the substation area to determine top-tier, viable locations for installing distributed solar PV. The study identified significant potential for new PV capacity across commercial rooftops, residential rooftops, and parking lots. This conservative approach found more than 50 MW of new PV – equivalent to over 81,000 MWh in annual generation – which is enough to meet 25% of the total annual electric energy needs in the area after redevelopment. This phase also included an impact analysis showing how 50 MW of new PV in the region results in significant economic, energy and environmental benefits for San Francisco.
This project is being completed with the assistance and support of Pacific Gas & Electric Corporation and the City of San Francisco’s Office of Community Investment and Infrastructure, Planning Department, and Department of Environment.
In the next phase of the study, not included in this report, the Clean Coalition is developing a power flow model of the entire substation area, which will benefit over 35,000 people. The models developed by the Clean Coalition are not simply proof-of-concepts or pilots; they deliver replicable and scalable solutions. Using sophisticated software tools and techniques, the organization first models the baseline power flow, adds the desired 50 MW of local solar capacity, then optimizes the system with dynamic grid solutions – including advanced inverters, energy storage, and demand response. The end result is a cleaner, more reliable, and more resilient power system that locally balances power, voltage, and frequency. This sophisticated modeling process provides a replicable roadmap for other communities and utilities to meet at least 25% of total electricity energy needs from local renewables.

5
Detailed Analysis
Deploying 50 MW of local solar PV in the Bayview-‐Hunters Point area will bring significant benefits to the local economy, to the regional power grid, and to the environment. The economic benefits – including greater employment and revenue – result from local PV projects and an increase in private investment to the area. The energy and environmental benefits represent avoided costs relative to the displaced use of combined cycle natural gas (CCNG) generation facilities that would otherwise provide electricity to the area and also account for the greater system efficiency distributed generation offers by generating energy close to where it is consumed. Energy benefits include reduced wholesale energy prices, avoided transmission-related costs. Environmental benefits include a reduction in greenhouse gas emissions, resource conservation, and positive health impacts from cleaner air and water.

6
As a first step towards developing the final impact analysis of 50 MW of local solar in Bayview-Hunters Point, the Clean Coalition began by modeling for 10 MW of solar PV. This initial model provides a 10 MW baseline for any Bay Area community wanting to deploy more clean local energy. Note that the calculations for other areas of the state or country will be slightly different based on localized energy costs and economic data such as solar employment wages.
The benefits, shown below, scale linearly because results are determined by the total capacity of local renewables deployed. As more local solar comes online, economic benefits will grow from the greater need for installation, construction, operations and maintenance. Energy benefits will similarly accrue, as the area will reduce reliance on centralized, conventional generation to meet its electric energy needs. Given that conservative estimates have shown the Bayview-Hunters Point area capable of accommodating 50 MW of new PV, the area could easily realize five times the benefits listed below.
Benefits, Solar PV, 10 MW over 20 Years
Each 10 MW of PV deployed in the San Francisco area (PG&E region) realizes the following benefits:
Economic Benefits 7 • $40 million in total added regional economic output• $14 million in local wages from construction and installation representing
254 near-‐term construction job years (FTE)• $6 million in local wages from operations and maintenance representing an
additional 104 job years (5.2 permanent FTE local jobs, $297,000 in annualsalaries)
• $1.16 million in construction related state sales tax revenues• $2 million in site leasing income to property owners in Bayview-‐Hunters
Point over 20 years ($100,000 annually)
Energy Benefits • A wholesale cost for distributed solar PV equal to or less than conventional
natural gas generation (using a 20 year levelized cost of energy, or LCOE)8 • $52 million spent on local energy resources versus sending those dollars out
of the community • $7.6 million in avoided transmission access charges9• $6 million in avoided costs from new transmission capacity3
7 NREL JEDI model results from $2.75/W(dc) 2015 estimated gross weighted average cost. Higher or lower costs by installation type or year installed will proportionately influence results. 8 CEC 2013 Cost of Generation Calculator 9 CAISO 2013 TAC schedule and infrastructure projections

7
• $6 million in avoided costs by reducing power interruptions in thecommunity3
• $2.4M in avoided costs from transmission line losses3
Environmental Benefits • Reduce annual GHG emissions by 15.6 million pounds,10 equivalent to
removing 1,332 cars from the road or the energy emissions from 1,744 homes
• Save 3,000,000 gallons of water annually11• Preserve 75 acres land through secondary use of roof and parking lot areas12
More detail is provided in the following sections.
Economic Benefits
The deployment of clean local energy will attract private investment to the community, and companies will hire personnel to design, build, and maintain solar facilities. Greater reliance on local energy generation will keep energy spend local – directing ratepayer dollars back into the communities where the electricity is produced.
As part of a community-wide program, solar PV can be quickly permitted and deployed – enabling rapid job creation. Employment opportunities will continue to grow as additional installations are added to meet the local solar potential and overall planning goal. As listed above, every 10 MW installed will result in:
• 254 job-‐years of regional local employment from construction andinstallation
• 104 additional job-‐years from operations and maintenance activity, from 5.2annual FTE jobs in operation and maintenance
Job creation data accounts for direct employment as well as indirect employment resulting from growth of local supply chains and induced employment related to income resulting from project development and operations. Note that no employment benefits are attributed to the manufacturing of PV modules or inverters.
For each 10 MW of solar capacity deployed, the community will reap the following additional benefits over 20 years:
10 NREL Emissions Health Calculator, PG&E service territory 11 DOE 2009 12 Civil Society Institute – “Hidden Costs of Electricity” (Sep 2012)

8
• Attract $27.5 million in private investment• Redirect $52.4 million of local energy expenses back into the community• Generate more than $14 million in wages from construction and installation,
with a total local economic output of $38 million• Generate $297,000 in local wages and $769,000 in total economic output
annually from operations• Generate additional revenue in the form of leasing parking lot and rooftop
space for PV at a rate of $10,000 per MW per year, adding $100,000 annualincome value to properties located in the Bayview-‐Hunters Point service areafor $150,000 in local benefits, totaling $4.5 million over a 30 year operationallife (note that local site owners opting to invest in PV themselves will alsocapture this value in higher relative returns, and higher lease rates arecommonly sought)
• Generate a total of $1.16 million in state and local sales tax revenue fromequipment and material sales, of which $164,000 would be directed to the SFgeneral fund if purchased in San Francisco or if San Francisco basedsuppliers are assumed to proportionately share in regional sales for similarPV project development
• Generate additional public revenues from wages due to income taxes, salestaxes related to induced household spending, and reduced public benefitscosts not included in this analysis
Based on an energy price of 17.65¢/kwh, local energy sales from 10 MW of PV will amount to $2.8 million in the first year, declining slightly in succeeding years as systems age, for an average output of 1,484kWh/W over 20 years.
Local economic output is calculated as the value of expenditures on goods and services resulting from the project and captured within the study area, and excludes expenditures outside the region, such as to module manufacturers. During operating years, local economic output is comprised of payments made by project owners, including the portion of project debt payments made to lenders located within the local analysis area. Payments including incentives, refunds, or revenues to project owners from the sale of energy produced by installed facilities are not included.
A prior economic impact analysis for Hunters Point redevelopment adopted an assumption of a 50% capture rate for resident employment and sales within the city boundaries of San Francisco, with the remainder distributed among surrounding communities. Likewise, similar project developments outside of San Francisco but within the local metropolitan region will include proportional capture of benefits by San Francisco. Program design may include local job training, hiring incentives, or specific participation requirements intended to target employment toward local disadvantaged sectors that have not yet been adopted or included in this analysis.

9
Energy Benefits
Production Each 10 MW of distributed solar PV generation installed in the Bayview-‐Hunters Point service area will produce $52.4 million in local fixed rate energy sales over 20 years, delivering positive value for ratepayers and the local community.
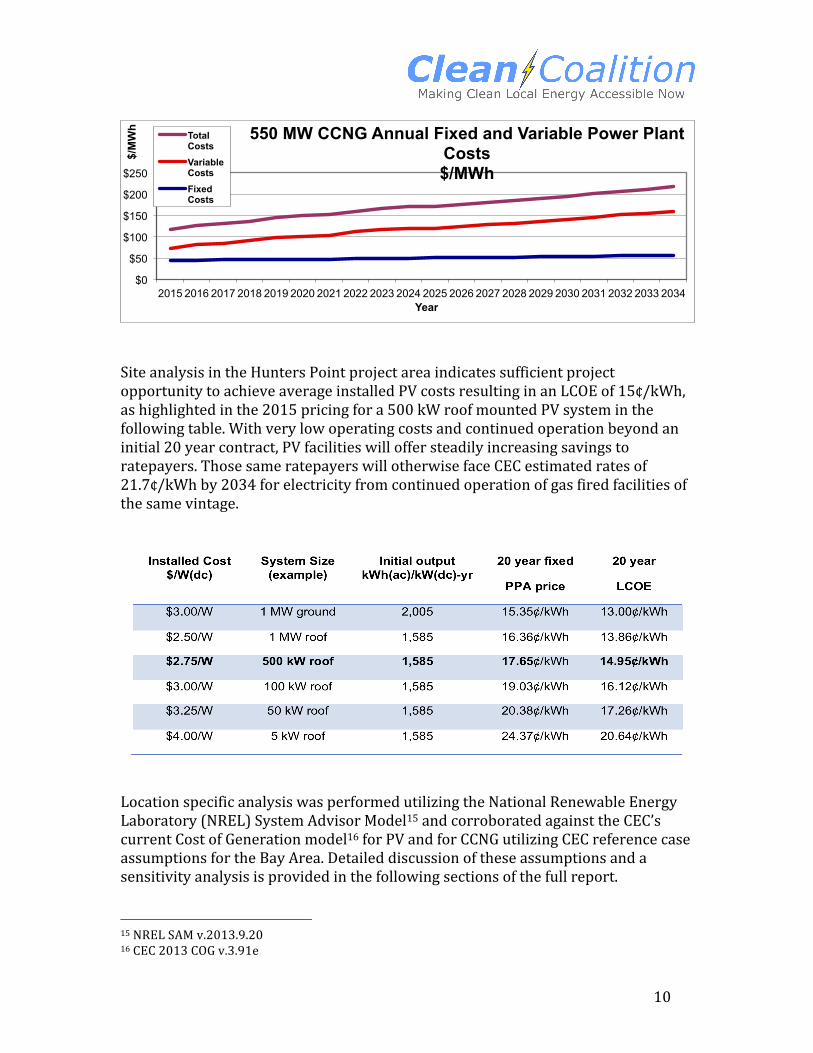
Cost of Energy As noted by the California Energy Commission (CEC) in successive Integrated Energy Policy Reports, one of the most significant cost trends is the steady movement of renewable technologies toward being cost-competitive with traditional fossil resources. After years of promise and steady cost improvement, the wholesale contract cost of electricity from local PV (the total price paid by the utility) is now at parity with new conventional generation commencing delivery to the area in 2015:13
• DG PV: 15.0¢/kWh LCOE• CCNG: 15.4¢/kWh LCOE
Each new energy source will displace the need for new generation from an alternate source. While PV reduces the need for very costly energy from “peaker” facilities, the vast majority of energy produced will replace the need for additional conventional Combined Cycle Natural Gas (CCNG) facilities.14 The levelized cost of energy (LCOE) is the price expressed in current dollars that must be paid for electricity supplied from a facility for it to break even over its contracted lifetime, including the initial investment, cost of capital, cost of fuel, operations and maintenance. Because future costs are discounted, the levelized cost is lower than the simple average price over the period studied. PV is procured at a fixed long-term price while CCNG costs will escalate over time reflecting fuel prices, O&M and delivery requirements. Expressed in current (real) dollars the 20-year CCNG wholesale cost of energy at the substation for new facilities is:
• 2015: 11.7¢/kWh• 2024: 17.1¢/kWh• 2034: 21.7¢/kWh
This results in a LCOE for combined cycle natural gas over 20 years of 15.4¢/kWh, illustrated in the graph below.
13 California Energy Commission 2013 Cost of Generation 14 ibid.
10
Site analysis in the Hunters Point project area indicates sufficient project opportunity to achieve average installed PV costs resulting in an LCOE of 15¢/kWh, as highlighted in the 2015 pricing for a 500 kW roof mounted PV system in the following table. With very low operating costs and continued operation beyond an initial 20 year contract, PV facilities will offer steadily increasing savings to ratepayers. Those same ratepayers will otherwise face CEC estimated rates of 21.7¢/kWh by 2034 for electricity from continued operation of gas fired facilities of the same vintage.
Location specific analysis was performed utilizing the National Renewable Energy Laboratory (NREL) System Advisor Model15 and corroborated against the CEC’s current Cost of Generation model16 for PV and for CCNG utilizing CEC reference case assumptions for the Bay Area. Detailed discussion of these assumptions and a sensitivity analysis is provided in the following sections of the full report.
15 NREL SAM v.2013.9.20 16 CEC 2013 COG v.3.91e
$0
$50
$100
$150
$200
$250
2015 2016 2017 2018 2019 2020 2021 2022 2023 2024 2025 2026 2027 2028 2029 2030 2031 2032 2033 2034
$/M
Wh
Year
550 MW CCNG Annual Fixed and Variable Power Plant Costs $/MWh
Total Costs Variable Costs Fixed Costs
11
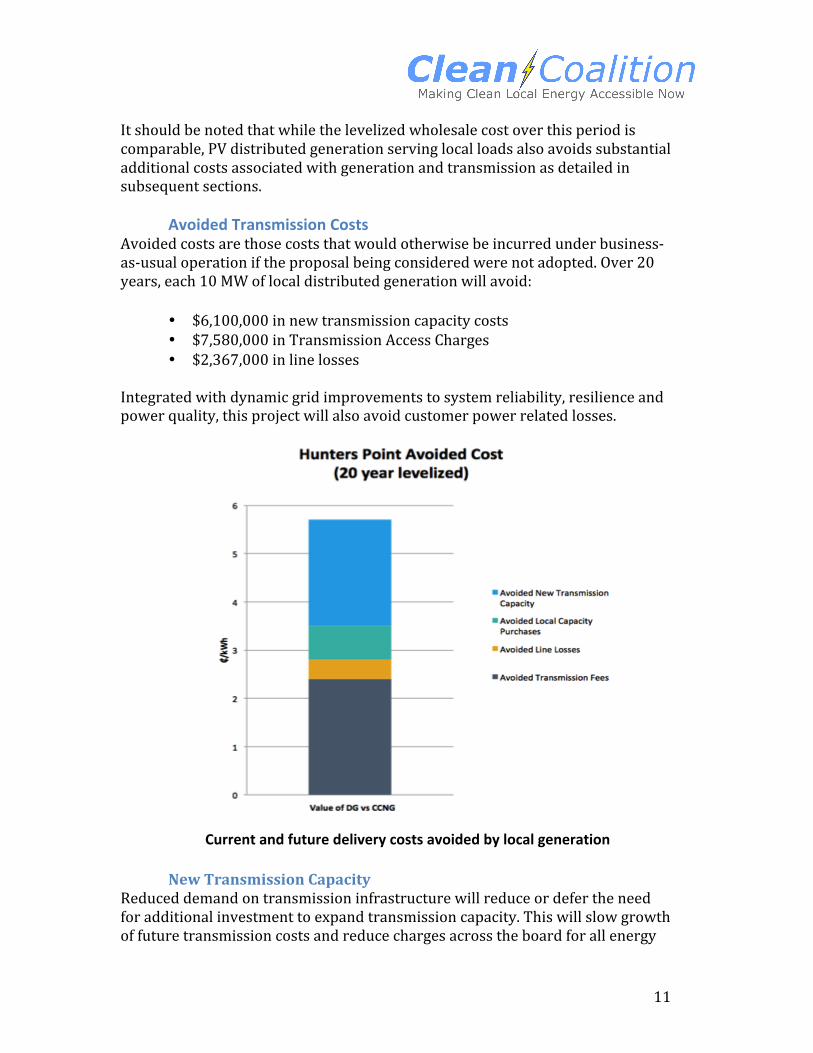
It should be noted that while the levelized wholesale cost over this period is comparable, PV distributed generation serving local loads also avoids substantial additional costs associated with generation and transmission as detailed in subsequent sections.
Avoided Transmission Costs Avoided costs are those costs that would otherwise be incurred under business-as-usual operation if the proposal being considered were not adopted. Over 20 years, each 10 MW of local distributed generation will avoid:
• $6,100,000 in new transmission capacity costs• $7,580,000 in Transmission Access Charges• $2,367,000 in line losses
Integrated with dynamic grid improvements to system reliability, resilience and power quality, this project will also avoid customer power related losses.
Current and future delivery costs avoided by local generation
New Transmission Capacity Reduced demand on transmission infrastructure will reduce or defer the need for additional investment to expand transmission capacity. This will slow growth of future transmission costs and reduce charges across the board for all energy

12
consumers utilizing the system. Based on the average costs of new capacity investments and repayment, each 10 MW of added PV DG capacity will reduce the need for added transmission capacity investment by 0.05% relative to CAISO BAU projections and the related growth in transmission charges. The avoided New Capacity Value is $6,100,000 over 20 years. This will be realized as $305,400 in annual system wide savings from a 0.0012¢/kWh reduction in transmission charges applied to virtually all of the 254,000 GWh17 consumed within CAISO transmission system electricity by 2020.
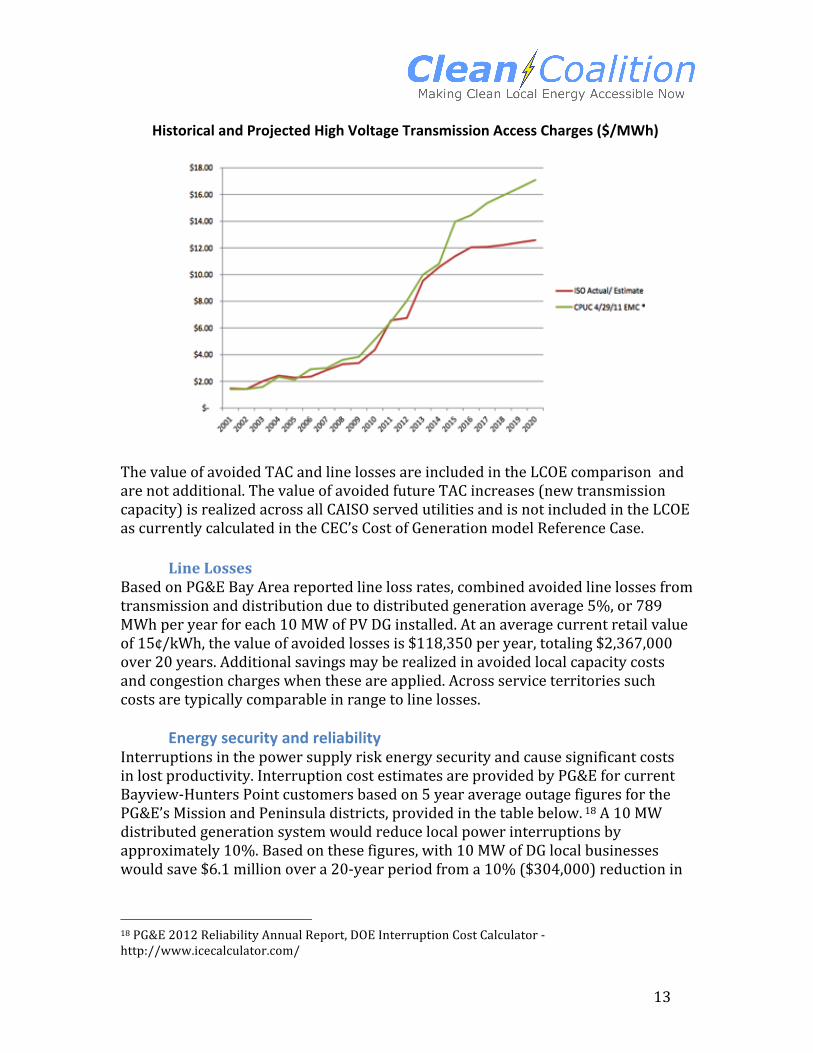
Transmission Access Charges Each kWh of energy utilizing the transmission system is subject to flat rate fees for transmission use. Transmission Access Charges (TAC) are applied to each unit of energy to recoup prior costs incurred to build capacity to deliver transmission dependent energy for non-‐local consumption.
10 MW(dc) of local DG PV will avoid $7,580,000 in TAC charges over 20 years (2013 dollars), including:
• $235,440 first year TAC savings based on 2013 combined HV and LV TACrates of 1.492¢/kWh in PG&E service territory for existing capacity, and
• $379,000 estimated levelized annual TAC charges avoided based on CAISO’sestimate Mid Value 7% TAC escalation resulting in a levelized value of2.4¢/kWh over the next 20 years.
PG&E will avoid incurring these charges due to their customers using local energy. Prior investments are paid off over time, lowering the level of future charges for PG&E customers.
17 California Energy Demand 2012-2022 Final Forecast Volume 1: Statewide Electricity Demand and Methods, Mid Energy Demand
13
Historical and Projected High Voltage Transmission Access Charges ($/MWh)
The value of avoided TAC and line losses are included in the LCOE comparison and are not additional. The value of avoided future TAC increases (new transmission capacity) is realized across all CAISO served utilities and is not included in the LCOE as currently calculated in the CEC’s Cost of Generation model Reference Case.
Line Losses Based on PG&E Bay Area reported line loss rates, combined avoided line losses from transmission and distribution due to distributed generation average 5%, or 789 MWh per year for each 10 MW of PV DG installed. At an average current retail value of 15¢/kWh, the value of avoided losses is $118,350 per year, totaling $2,367,000 over 20 years. Additional savings may be realized in avoided local capacity costs and congestion charges when these are applied. Across service territories such costs are typically comparable in range to line losses.
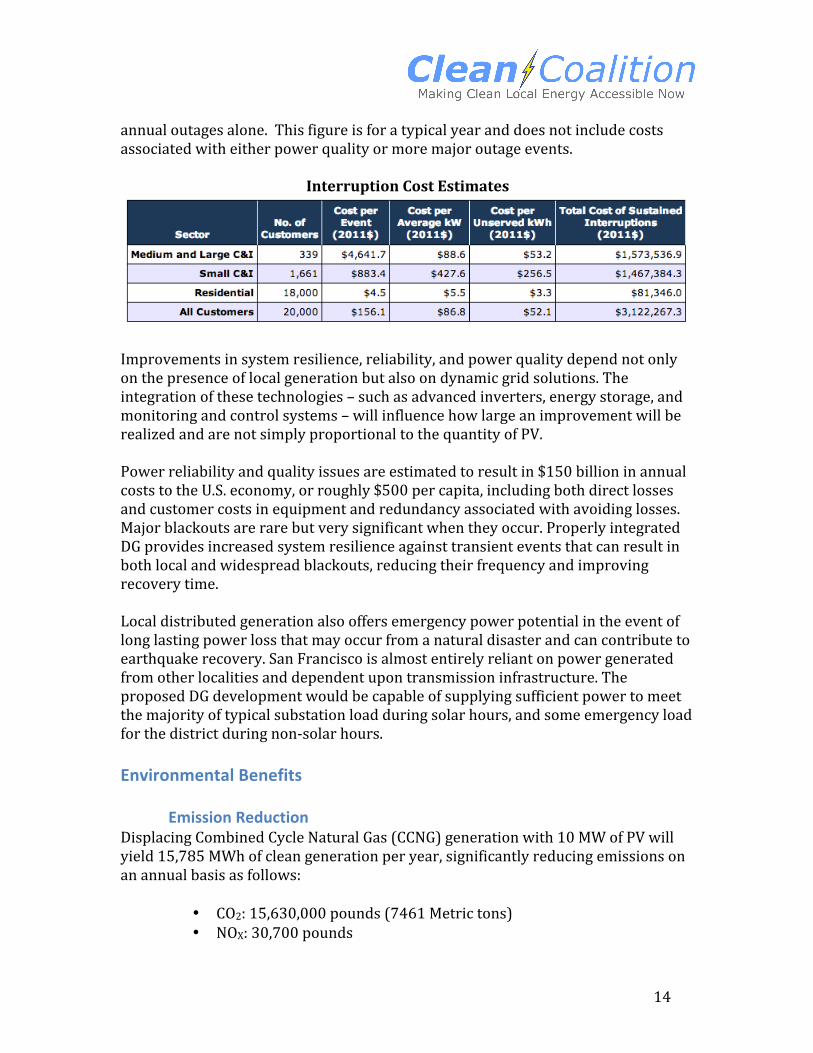
Energy security and reliability Interruptions in the power supply risk energy security and cause significant costs in lost productivity. Interruption cost estimates are provided by PG&E for current Bayview-Hunters Point customers based on 5 year average outage figures for the PG&E’s Mission and Peninsula districts, provided in the table below. 18 A 10 MW distributed generation system would reduce local power interruptions by approximately 10%. Based on these figures, with 10 MW of DG local businesses would save $6.1 million over a 20-‐year period from a 10% ($304,000) reduction in
18 PG&E 2012 Reliability Annual Report, DOE Interruption Cost Calculator -‐ http://www.icecalculator.com/
14
annual outages alone. This figure is for a typical year and does not include costs associated with either power quality or more major outage events.
Interruption Cost Estimates
Improvements in system resilience, reliability, and power quality depend not only on the presence of local generation but also on dynamic grid solutions. The integration of these technologies – such as advanced inverters, energy storage, and monitoring and control systems – will influence how large an improvement will be realized and are not simply proportional to the quantity of PV.
Power reliability and quality issues are estimated to result in $150 billion in annual costs to the U.S. economy, or roughly $500 per capita, including both direct losses and customer costs in equipment and redundancy associated with avoiding losses. Major blackouts are rare but very significant when they occur. Properly integrated DG provides increased system resilience against transient events that can result in both local and widespread blackouts, reducing their frequency and improving recovery time.
Local distributed generation also offers emergency power potential in the event of long lasting power loss that may occur from a natural disaster and can contribute to earthquake recovery. San Francisco is almost entirely reliant on power generated from other localities and dependent upon transmission infrastructure. The proposed DG development would be capable of supplying sufficient power to meet the majority of typical substation load during solar hours, and some emergency load for the district during non-‐solar hours.
Environmental Benefits
Emission Reduction Displacing Combined Cycle Natural Gas (CCNG) generation with 10 MW of PV will yield 15,785 MWh of clean generation per year, significantly reducing emissions on an annual basis as follows:
• CO2: 15,630,000 pounds (7461 Metric tons)• NOX: 30,700 pounds

15
• Mercury (Hg): 0.016 pounds
The above is the equivalent of removing 1,332 cars from the road, or offsetting the emissions of 1,744 average homes in PG&E territory. As Qualifying Facilities contributing to California’s Renewable Portfolio Standard (RPS), at a base price of $10/Mt for avoided CO2 the annual market value of emission reduction is $74,610, however the market rate is liable to substantially exceed $10/Mt in future years.
Land 10 MW of local PV will avoid impacting 75 acres of land in contrast to conventional generation or large-scale, remote renewables on pristine or arable lands. DG avoids impact because it is typically deployed as a secondary use on existing structures, parking lots, or otherwise already disturbed land. DG also provides added value to such spaces through beneficial shading. This avoided land impact reflects a land use rate of 30 m2/kW of ground mounted PV.19 While conventional CCNG facilities require relatively little land for the generating facility itself, the land impacts resulting from the extraction and delivery of fuel to these facilities is comparable.20 The figure of 75 acres does not include the additional land impacts necessary for transmission lines, which, over long distances, will impact wild lands, farms, parks, view sheds and residential zones.
Water Each 10 MW of PV would save nearly 3 million gallons of water use per year. This is equivalent to the average total annual water use of 75 San Francisco residents. Thermal generation, including both fossil and nuclear facilities requires significant water use for cooling. CCNG facilities with cooling towers consume 0.7 cubic meters of water per MWh through evaporation, and other conventional and nuclear facilities require up to three times this quantity.
Health Significant health impacts are avoided by shifting electric generation to PV, including 35 person days of restricted activity each year. When the cumulative value of operation of each 10 MW PV is considered over 20 years the impact is even more noteworthy, including over 700 person days of restricted activity, over 100 days of lost work, and one mortality. Health impacts are based on total avoided emissions of NOX from CCNG facilities that will react with other chemicals to form fine particulate matter (PM2.5). Lost and restricted workdays are not included in the economic benefits discussed in the previous section and therefore reflect an additional economic benefit resulting from this project scenario.
19 Civil Society Institute – “Hidden Costs of Electricity” (Sep 2012) 20 Fthenakis, V., Kim, H.C., Land use and electricity generation: A life-‐cycle analysis. Renew Sustain Energy Rev (2008)

16
Cases Reduced per Year per 10 MW PV displacing CCNG generation Annual
Over 20 years
Minor Restricted Activity Days 35.6593 733.19 Work Loss Days 5.1897 103.79 Lower Respiratory Symptoms 0.8118 16.23 Upper Respiratory Symptoms 0.6523 13.05 Heart Attacks 0.0736 1.47 Acute Bronchitis 0.0716 1.43 Emergency room visits, Asthma 0.0491 1.00 Mortality 0.0450 0.90 Chronic Bronchitis 0.0307 0.61 Hospital Admissions -‐ Respiratory 0.0225 0.45 Hospital Admissions -‐ Cardiovascular 0.0184 0.37