Embed Size (px)
Citation preview
Technical and Background Paper
No. 29
Theft and vandalism at residential building sites in Australia
Yuka Sakurai
Pat Mayhew
Mark White

Yuka SakuraiPat MayhewMark White
Technical and Background Paper
No. 29
Theft and vandalism at residential building
sites in Australia
© Australian Institute of Criminology 2008
ISSN 1445-7261 ISBN 0 642 53883 2
Apart from any fair dealing for the purpose of private study, research, criticism or review, as permitted under the Copyright Act 1968 (Cth), no part of this publication may in any form or by any means (electronic, mechanical, microcopying, photocopying, recording or otherwise) be reproduced, stored in a retrieval system or transmitted without prior written permission. Inquiries should be addressed to the publisher.
Project no. 0020 Ethics approval no. PO45 Dataset no. 0016
Published by the Australian Institute of Criminology GPO Box 2944 Canberra ACT 2601 Tel: (02) 6260 9272 Fax: (02) 6260 9299 Email: [email protected] Website: http://www.aic.gov.au
Please note: minor revisions are occasionally made to publications after release. The online versions available on the AIC website will always include any revisions.
Edited and typeset by the Australian Institute of Criminology

v
Contents
Acknowledgments viii
Executive summary ix
Introduction 1
Background of the study 2
Prior research on building site crime 3
Research objectives 5
Methodology 7
Sampling procedure 8
Questionnaire design 8
Pilot testing 8
Introductory mailout 9
Interview procedures 9
Weighting 9
Reporting findings 10
Ethical considerations 10
Findings 11
Characteristics of residential builders in Australia 12
Number of employees 12
Annual business turnover 12
The extent of business activities 13
The incidence of theft and vandalism 14
Perceptions of seriousness of theft and vandalism 16
Business size and risk 18
Location of work and risk 19
The impact and cost of building site theft and vandalism 20
The impact of theft and vandalism 20
The total value of losses 22
Net losses 22
Indirect losses 22
vi
Insurance 23
Reporting crime to the police 24
Nature of theft and vandalism 25
Types of work engaged in when victimised 25
When theft or vandalism took place 26
A snapshot of patterns of theft 29
Items generally stolen 30
Victims’ views about perpetrators of the crime 31
Use of crime prevention measures 33
Regular use of security hardware and crime prevention measures 33
A snapshot of crime prevention measures employed by theft victims 35
Predictors of victimisation 36
Discussion and conclusion 39
Target removal 42
Identifying property 42
Surveillance devices 42
Natural surveillance 42
Cooperation between government, community and industry 43
References 44
Figures
Figure 1: Number of employees 12
Figure 2: Annual business turnover 13
Figure 3: Theft and vandalism repeat victimisation 16
Figure 4: Perceptions of seriousness of theft 17
Figure 5: Perceptions of seriousness of vandalism 17
Figure 6: Perceived impact of theft and vandalism 21
Figure 7: Total value of loss suffered by theft and vandalism victims 21
Figure 8: Levels of satisfaction with police action 25
Figure 9: Incidence of theft and vandalism by type of building work 26
Figure 10: Theft and vandalism by month 27
vii
Figure 11: Theft and vandalism by day of the week 28
Figure 12: Types of items stolen 29
Figure 13: Total items stolen in 2002 30
Figure 14: Victims’ knowledge of who the perpetrator was 32
Figure 15: Types of perpetrator identified by theft victims 32
Figure 16: Types of crime prevention measures employed by residential builders 34
Figure 17: Types of crime prevention measures in place during most recent incident
of theft 36
Tables
Table 1: State distribution of residential builders in Australia and in the
interviewed sample 10
Table 2: Number of houses and apartments built or modified by residential
builders 14
Table 3: Theft and vandalism victimisation 15
Table 4: Theft and vandalism victimisation by number of employees 18
Table 5: Theft and vandalism victimisation by business turnover 18
Table 6: Theft and vandalism victimisation by location 19
Table 7: Insurance coverage 23
Table 8: Value of losses when claims were made versus not made 23
Table 9: Reporting crime to the police 24
Table 10: Value of losses reported and unreported 25
Table 11: Average amounts of money spent on crime prevention measures by location 34
Table 12: Logistic regression analysis predicting theft victimisation 37
Table 13: Logistic regression analysis predicting vandalism victimisation 37

viii
Acknowledgments
The Australian Institute of Criminology (AIC) gratefully acknowledges the cooperation and
continuing support provided by the Master Builders Association of Australia and the Housing
Industry Association. Roy Morgan Research conducted the telephone survey and undertook
coding of the data. The questionnaire was designed by Pat Mayhew and Mark White at the
AIC. Russell G Smith, Natalie Taylor, Tony Krone and Rob McCusker at the AIC provided
helpful comments on earlier drafts.
ix
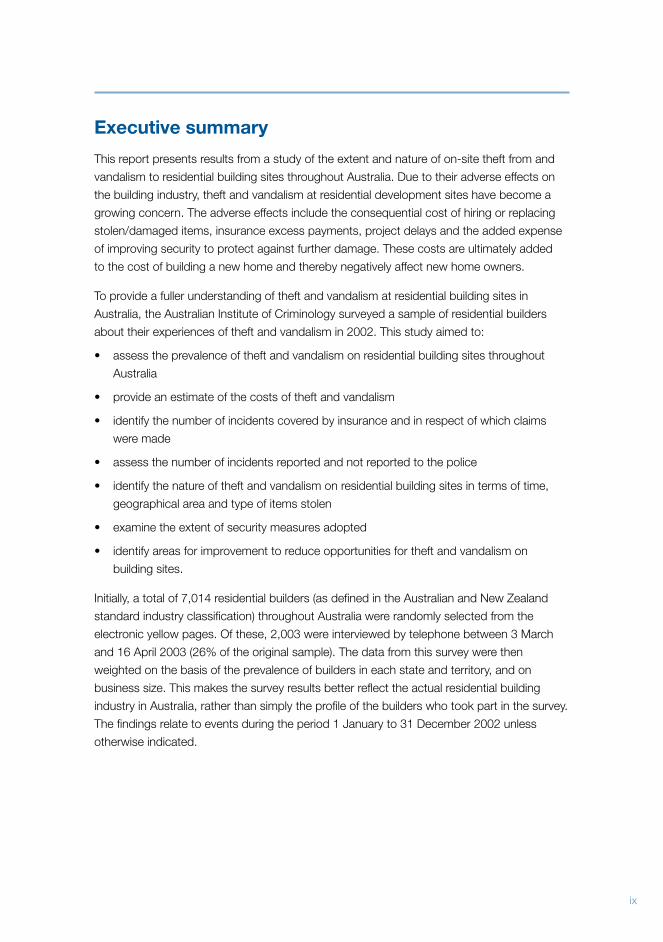
Executive summary
This report presents results from a study of the extent and nature of on-site theft from and
vandalism to residential building sites throughout Australia. Due to their adverse effects on
the building industry, theft and vandalism at residential development sites have become a
growing concern. The adverse effects include the consequential cost of hiring or replacing
stolen/damaged items, insurance excess payments, project delays and the added expense
of improving security to protect against further damage. These costs are ultimately added
to the cost of building a new home and thereby negatively affect new home owners.
To provide a fuller understanding of theft and vandalism at residential building sites in
Australia, the Australian Institute of Criminology surveyed a sample of residential builders
about their experiences of theft and vandalism in 2002. This study aimed to:
assess the prevalence of theft and vandalism on residential building sites throughout •
Australia
provide an estimate of the costs of theft and vandalism•
identify the number of incidents covered by insurance and in respect of which claims •
were made
assess the number of incidents reported and not reported to the police•
identify the nature of theft and vandalism on residential building sites in terms of time, •
geographical area and type of items stolen
examine the extent of security measures adopted•
identify areas for improvement to reduce opportunities for theft and vandalism on •
building sites.
Initially, a total of 7,014 residential builders (as defined in the Australian and New Zealand
standard industry classification) throughout Australia were randomly selected from the
electronic yellow pages. Of these, 2,003 were interviewed by telephone between 3 March
and 16 April 2003 (26% of the original sample). The data from this survey were then
weighted on the basis of the prevalence of builders in each state and territory, and on
business size. This makes the survey results better reflect the actual residential building
industry in Australia, rather than simply the profile of the builders who took part in the survey.
The findings relate to events during the period 1 January to 31 December 2002 unless
otherwise indicated.
x
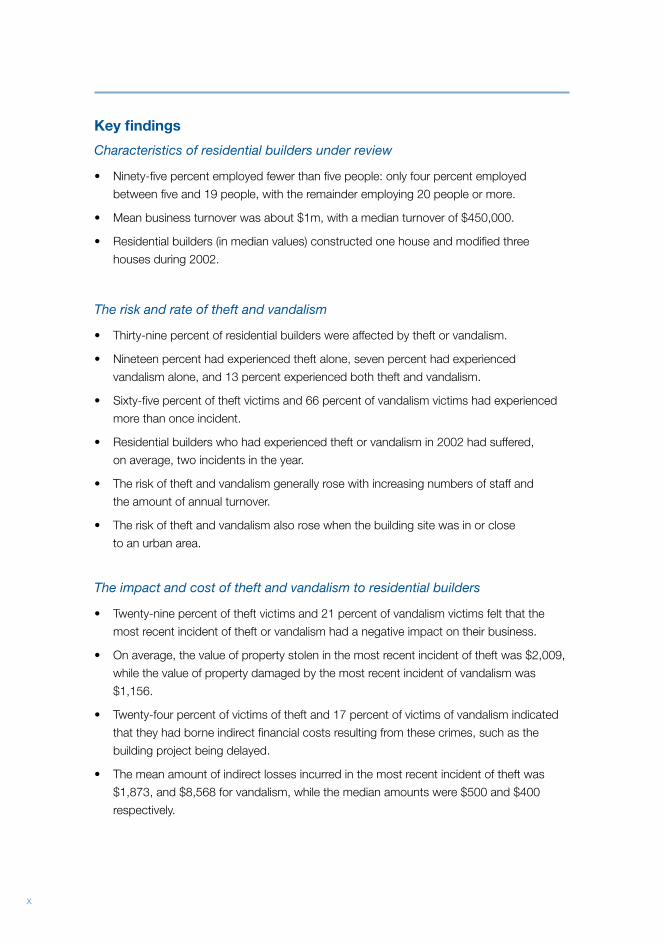
Key findings
Characteristics of residential builders under review
Ninety-five percent employed fewer than five people: only four percent employed •
between five and 19 people, with the remainder employing 20 people or more.
Mean business turnover was about $1m, with a median turnover of $450,000.•
Residential builders (in median values) constructed one house and modified three •
houses during 2002.
The risk and rate of theft and vandalism
Thirty-nine percent of residential builders were affected by theft or vandalism.•
Nineteen percent had experienced theft alone, seven percent had experienced •
vandalism alone, and 13 percent experienced both theft and vandalism.
Sixty-five percent of theft victims and 66 percent of vandalism victims had experienced •
more than once incident.
Residential builders who had experienced theft or vandalism in 2002 had suffered, •
on average, two incidents in the year.
The risk of theft and vandalism generally rose with increasing numbers of staff and •
the amount of annual turnover.
The risk of theft and vandalism also rose when the building site was in or close •
to an urban area.
The impact and cost of theft and vandalism to residential builders
Twenty-nine percent of theft victims and 21 percent of vandalism victims felt that the •
most recent incident of theft or vandalism had a negative impact on their business.
On average, the value of property stolen in the most recent incident of theft was $2,009, •
while the value of property damaged by the most recent incident of vandalism was
$1,156.
Twenty-four percent of victims of theft and 17 percent of victims of vandalism indicated •
that they had borne indirect financial costs resulting from these crimes, such as the
building project being delayed.
The mean amount of indirect losses incurred in the most recent incident of theft was •
$1,873, and $8,568 for vandalism, while the median amounts were $500 and $400
respectively.
xi
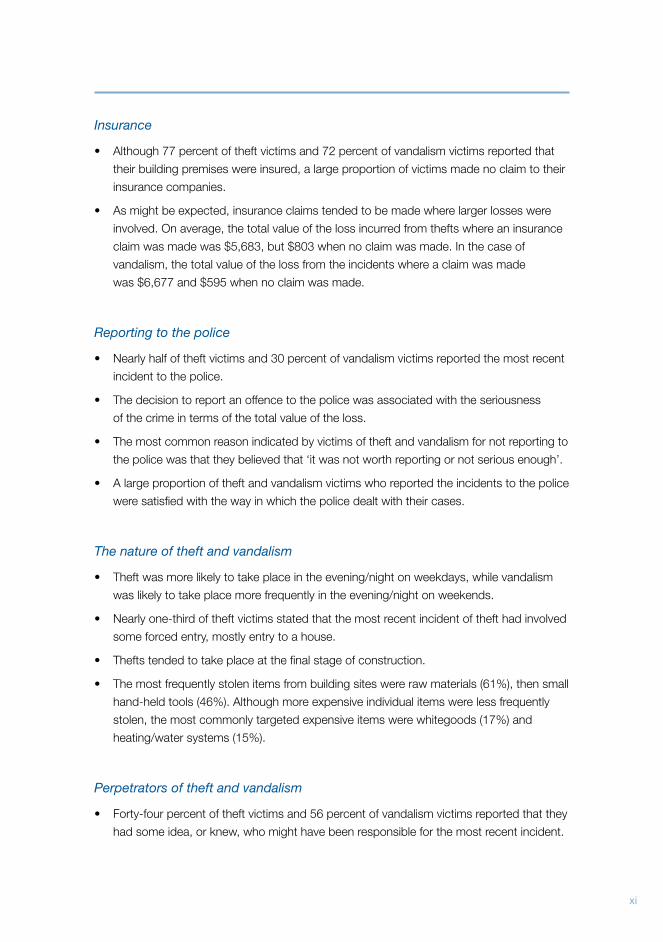
Insurance
Although 77 percent of theft victims and 72 percent of vandalism victims reported that •
their building premises were insured, a large proportion of victims made no claim to their
insurance companies.
As might be expected, insurance claims tended to be made where larger losses were •
involved. On average, the total value of the loss incurred from thefts where an insurance
claim was made was $5,683, but $803 when no claim was made. In the case of
vandalism, the total value of the loss from the incidents where a claim was made
was $6,677 and $595 when no claim was made.
Reporting to the police
Nearly half of theft victims and 30 percent of vandalism victims reported the most recent •
incident to the police.
The decision to report an offence to the police was associated with the seriousness •
of the crime in terms of the total value of the loss.
The most common reason indicated by victims of theft and vandalism for not reporting to •
the police was that they believed that ‘it was not worth reporting or not serious enough’.
A large proportion of theft and vandalism victims who reported the incidents to the police •
were satisfied with the way in which the police dealt with their cases.
The nature of theft and vandalism
Theft was more likely to take place in the evening/night on weekdays, while vandalism •
was likely to take place more frequently in the evening/night on weekends.
Nearly one-third of theft victims stated that the most recent incident of theft had involved •
some forced entry, mostly entry to a house.
Thefts tended to take place at the final stage of construction.•
The most frequently stolen items from building sites were raw materials (61%), then small •
hand-held tools (46%). Although more expensive individual items were less frequently
stolen, the most commonly targeted expensive items were whitegoods (17%) and
heating/water systems (15%).
Perpetrators of theft and vandalism
Forty-four percent of theft victims and 56 percent of vandalism victims reported that they •
had some idea, or knew, who might have been responsible for the most recent incident.
xii
Of those who had experienced theft in 2002, and who knew or had some idea about •
likely perpetrators of the most recent incident of theft, few blamed organised criminals
or ordinary criminals. Instead, employees of other firms were most frequently thought
to be the offenders (22%).
The vast majority of victims of vandalism who knew or had some idea about likely •
perpetrators blamed local youth.
The use of crime prevention measures
The majority of residential builders used some security measures at the beginning of •
2002, but more than half (56%) had not spent any money on crime prevention in 2002.
Residential builders who fell victim to theft or vandalism in 2002 invested, on average, •
$2,240 in crime prevention measures, while non-victims invested only $480 reflecting
the fact that victims reacted after being victimised.
Builders in urban areas spent more on crime prevention measures than those in •
non-urban areas, reflecting their greater exposure to risk.
The most commonly employed security measures at the beginning of 2002 were to •
protect whitegoods, by only taking delivery of whitegoods immediately before installation
(69%) and delaying the installation of whitegoods until immediately before occupancy
(64%). Various forms of access control and target-hardening were also employed.
Of residential builders who had experienced theft, 47 percent reported not having •
had any security measures in place at the time of the incident.
Predictors of victimisation
Residential builders with an annual turnover of $1m or greater were more than three •
times more likely to experience theft or vandalism.
Residential builders who worked in urban areas were at significantly greater risk of •
experiencing theft or vandalism.
Residential builders who were victims of theft or vandalism were likely to employ more •
security measures and to spend some money on crime prevention measures, reflecting
the fact that they were probably more aware of the risk faced.

Introduction
2
Theft and vandalism at residential building sites in Australia
Background of the study
Construction is an integral part of the Australian economy. The housing industry contributes
substantially to gross domestic product (GDP) and generates considerable employment
opportunities. According to the Housing Industry Association (HIA) the industry contributed
3.78 percent to economic growth in the 12 months to March 2003 (HIA 2003a). The vast
majority of businesses in the housing industry employ fewer than 20 full-time personnel.
They provide jobs for almost 370,000 people (HIA 2003b). Activity in the housing industry
mirrors the distribution of the population. Strong population growth, with a boost in the
number of overseas migrants, has increased housing demand across Australia (HIA 2003c).
In 2001–02, Australians spent $35b on building new homes and renovating existing homes
– equivalent to 3.5 percent of GDP (HIA 2003b).
As the amount of money invested in housing projects has increased, there has been
growing concern about crime at residential developments, particularly theft and vandalism.
In 1992, widespread evidence of theft of building materials and equipment within the
construction industry was cited in a report by the Royal Commission on the building industry
in New South Wales (Gyles 1992). More recently, SA police reported that theft and property
damage from building sites averaged about $4,000 per new house in South Australia (South
Australia Police 2002).
Theft and vandalism on building sites have a number of adverse financial effects on
businesses and home buyers. These include the cost of hiring or replacing stolen items,
insurance excesses, increasing insurance premiums and costs of improving security
measures (Lee 2002; Smith & Walmsley 1999). Non-financial costs are also incurred.
For example, waiting for stolen items to be replaced may delay the building process, and
hence builders’ productivity. This may affect the reputation of businesses. The costs arising
from theft and damage at building sites will ultimately be added to the cost of building
new homes.
The present study looks at theft and vandalism on residential building sites, to inform
appropriate crime prevention measures. Residential builders are defined as businesses
or individual contractors principally engaged in the following activities:
construction of new houses (excluding semi-detached houses)•
alterations or additions to existing houses•
renovation or general repairs to existing houses•
organising and managing these activities as the prime contractor.•
Residential builders are classified as house construction industry code 4111 in the Australian
and New Zealand standard industry classification (ABS 1993). Theft in this study is defined
as theft from residential building sites or company vehicles parked on-site where residential
3
Introduction
builders have been working. It does not include theft from other locations such as builders’
own premises, or from their company vehicles while they were not parked on-site.
Vandalism refers to malicious damage caused to residential building sites, such as graffiti,
broken windows or damage to equipment.
The current study is informed by the notion of situational crime prevention. This refers
to a preventive approach that relies on reducing opportunities for specific forms of crime
(Clarke 1992). Situational crime prevention is comprised of five stages:
collection of data about the nature and dimensions of the specific crime problem•
analysis of the situational conditions that permit or facilitate the commission of the •
crimes in question
systematic study of possible means of blocking opportunities for these particular crimes•
implementation of the most promising, feasible and economic measures•
monitoring results and dissemination of experiences (Clarke 1992: 5).•
This study covers the first three stages of situational crime prevention through a survey into
the nature and extent of theft and vandalism on building sites. Clarke identified 12 types
of situational prevention measures to reduce opportunities for crime to occur. Examples of
situational prevention measures for theft and vandalism include target-hardening (e.g. the
use of locks), access control (e.g. the use of locked gates and fenced yards) and surveillance
by employees (e.g. the use of closed-circuit television, or CCTV). This study assesses the
appropriateness of preventive measures employed by residential builders.
Prior research on building site crime
The construction industry in Australia is recognised as having been subject to numerous
illegal activities in the past, ranging from physical violence or the threat of violence to
the petty pilfering of building materials (Gyles 1992). Theft of construction equipment
and building materials, in particular, is widely considered a common and widespread
problem. However, it is difficult to estimate the scale of the problem due to the lack of
official statistics identifying building site crime, and the absence of a specific reporting
code for police investigation. Moreover, the number of incidents of theft and vandalism
may be underestimated, as many incidents are unlikely to be reported to the police
(Smith & Walmsley 1999).
Some empirical studies have been undertaken to identify the scale of crime relating
to building sites, specifically theft of construction equipment. Smith & Walmsley (1999)
examined the risk, cost and methods of construction equipment (or ‘plant’) theft that took
place in the United Kingdom during 1997. They surveyed several industry sectors that were
4
Theft and vandalism at residential building sites in Australia
likely to use construction equipment, and then focused on companies that reported theft of
plant for the year. Based on responses from a sample of 1,868 businesses, they estimated
that there were 26 thefts per 1,000 items of plant in use in 1997, which was higher than that
for all motor vehicles (18 per 1,000). In Australia, Jeffrey (2001) also conducted a survey on
plant theft within the construction industry. Of 247 residential builders, 68 percent reported
that they had experienced theft of equipment during 1999–2000.
Professional criminals are often thought to be involved in illegal activities within the
construction industry, especially theft of heavy plant equipment. Tim Purbrick, the
manager of the National Plant and Equipment Register, has stated:
although equipment theft can be opportunist, given the size of the equipment
and the specialist assistance required in locating, moving and shipping the
machines overseas, as well as selling them on, it is more common to find
serious and organised criminal gangs involved (Purbrick 2003: 20).
The total value of plant equipment stolen in the United Kingdom is estimated to be between
£25m and £100m a year (Purbrick 2003). In the United States, Thomas (1977) argued
that theft of heavy and expensive equipment from construction sites was organised and
systematic. In addition, contractors within the industry both encouraged and sustained the
operation of the system (Thomas 1977). In Australia, there was an active and well-organised
black market for stolen equipment and building materials in New South Wales (Gyles 1992).
There are other forms of theft from building sites. These include theft by workers of tools
and materials, after-hours pilfering of timber and other materials by opportunist thieves and
thefts by habitual offenders and others of fixtures and appliances (Clarke & Goldstein 2003).
Previous studies found that theft of smaller and transportable equipment was much more
prevalent than theft of heavy equipment (Smith & Walmsley 1999; Jeffrey 2001; Clarke
& Goldstein 2003).
In the study by Smith and Walmsley, it was found that equipment was frequently reported
to be stolen from building and construction sites (24%) or depots and yards (17%) mainly
situated in urban areas. Equipment stolen was generally last seen on a Friday, only to be
found missing on a Monday, indicating that theft incidents were most likely to take place
over a weekend when most equipment was unattended (Jeffrey 2001; Smith & Walmsley
1999).
Previous studies have also shown that lax security within the construction industry facilitates
crime. Relatively few security devices were employed to secure equipment or building sites.
Even where some security measures at the location of theft were in place, they were in
general unsophisticated and relatively easy to remove or alter (Jeffrey 2001; Smith &
Walmsley 1999). In collaboration with the North Carolina police department, Clarke and
Goldstein (2003) analysed security practices and risks of theft from residential building sites
5
Introduction
in Charlotte, North Carolina. They found that delaying the installation of appliances until new
owners had taken up residence was an effective measure.
Researchers at the Scottish Executive Central Research Unit investigated the experience
of crime in Scotland in 1998 across five business sectors: manufacturing, construction,
wholesale and retail, hotels and restaurants, and transport and telecommunications
(Burrows et al. 1999). Within the construction sector, thefts of and from vehicles were
most common, experienced by 23 percent of all the businesses. Another 16 percent
had experienced vandalism to buildings, equipment and vehicles, and 15 percent had
experienced thefts.
Past studies have thus demonstrated that theft from building and construction sites poses
considerable risks to the building industry. Little research has focused on vandalism. The
present study aims to supply information to fill this research need.
Research objectives
The Royal Commission report (Gyles 1992) found that the building and construction industry
has been marked by widespread disregard for the law and unlawful conduct by unions,
employers and individual contractors. In addition, previous research on building site crime
suggests the involvement of professional criminals in illegal activities within the construction
industry. A range of illegal activities involving the industry was identified in the Royal
Commission’s report. These activities include:
physical violence and threats of physical violence•
economic crime such as corrupt, improper and irregular payments and tax avoidance•
breach of safety and award provisions by employers•
petty stealing of building materials.•
The scope of this study was limited to theft and vandalism taking place on residential
building sites. It examined whether these offences were thought by builders to be committed
internally (by people within the industry) or externally (for example, by organised criminals).
Specifically, the study sought to:
assess the prevalence of theft and vandalism on residential building sites throughout •
Australia
provide an estimate of the costs of theft and vandalism•
identify the numbers of incidents covered by insurance and claimed•
assess the number of incidents reported and not reported to the police•
6
Theft and vandalism at residential building sites in Australia
identify the nature of theft and vandalism on residential building sites in terms of time, •
areas and types of items stolen
examine the extent of security measures adopted•
identify areas for improvement to reduce opportunities for theft and vandalism •
on building sites.

Methodology
8
Theft and vandalism at residential building sites in Australia
Sampling procedure
According to the Australian Bureau of Statistics (ABS), there were approximately 33,000
residential builders classified under the house construction industry classification code 4111
in Australia (ABS 1997). For the present study, 7,013 residential builders were selected from
the electronic yellow pages to obtain at least 2,000 cases to allow appropriate statistical
analysis. An introductory letter prior to the telephone survey was sent to each of these
businesses. Of these, 5,294 businesses responded. The remaining 1,719 businesses were
not contacted largely because their telephone numbers were disconnected or unobtainable.
In other cases, numbers were engaged or not answered, being tried more than three times.
Of 5,294 businesses contacted, 3,411 agreed to complete the interview. This was a
response rate of 64 percent.
To qualify for the survey, these 3,411 businesses were screened to find out if they had
carried out residential building work and had operated throughout 2002. As a result,
41 percent of the businesses that agreed to participate failed to qualify for the survey.
Due to this stringent screening, the final sample comprised 2,003 residential builders,
29 percent of those originally contacted.
Questionnaire design
The questionnaire, designed by the Australian Institute of Criminology, covered the following
topics:
builders’ experiences of theft and vandalism on residential building sites in 2002•
builders’ perceptions of the seriousness of theft and vandalism on residential building sites•
the amount and value of property stolen or damaged•
security measures routinely undertaken to prevent theft and vandalism•
the extent of reporting incidents of crime to the police•
the extent of insurance cover for theft and vandalism•
builders’ perceptions of the effectiveness of the police.•
Pilot testing
A total of 60 pilot interviews were conducted by Roy Morgan Research on behalf of the AIC,
using three interviewers. The interviewers reported that the survey was, for the most part,
well received and that the questionnaire was successful. Minor changes were made to the
pilot questionnaire for the main stage of the survey.
9
Methodology
Introductory mailout
An introductory letter was sent to 7,013 residential builders (as defined previously). The
letter, addressed to the company manager, outlined the research and indicated that an
interviewer would make contact within a few days. Residential builders were assured that
the identification of individuals or businesses would not be released or published in any form.
The introductory letter included a contact number for the AIC in case the builder wanted
more information or had any queries prior to the interview.
Interview procedures
Before the survey commenced, field coordinators and interviewers were briefed about the
rationale for the survey, and the questionnaire and concepts. There was also a closely
monitored interviewer practice session.
Interviews were completed by telephone between 3 March and 16 April 2003 using Roy
Morgan Research’s computer-assisted telephone interviewing facilities. All interviewing was
supervised and at least 10 percent of each interviewer’s calls were audited. To maximise
responses, interviewers attempted at least three telephone calls to establish contact
with residential builders, following the initial phone call. The average interview length
was 18 minutes. Data from 2,003 residential builders are included in the final results.
Weighting
The data were weighted to reflect the overall population distribution of residential builders in
Australian states and territories, as well as business size (total number of people employed
during the last pay period) using the ABS 1996–97 population estimates for the private
sector construction industry. In this way, the weighted results of the survey better reflect the
profile of the building industry in Australia, rather than the profile of the builders who took
part in the survey. The main differences are that builders in Queensland and Victoria were
slightly underrepresented in the survey, whereas those in Tasmania and Western Australia
were slightly overrepresented.
10
Theft and vandalism at residential building sites in Australia
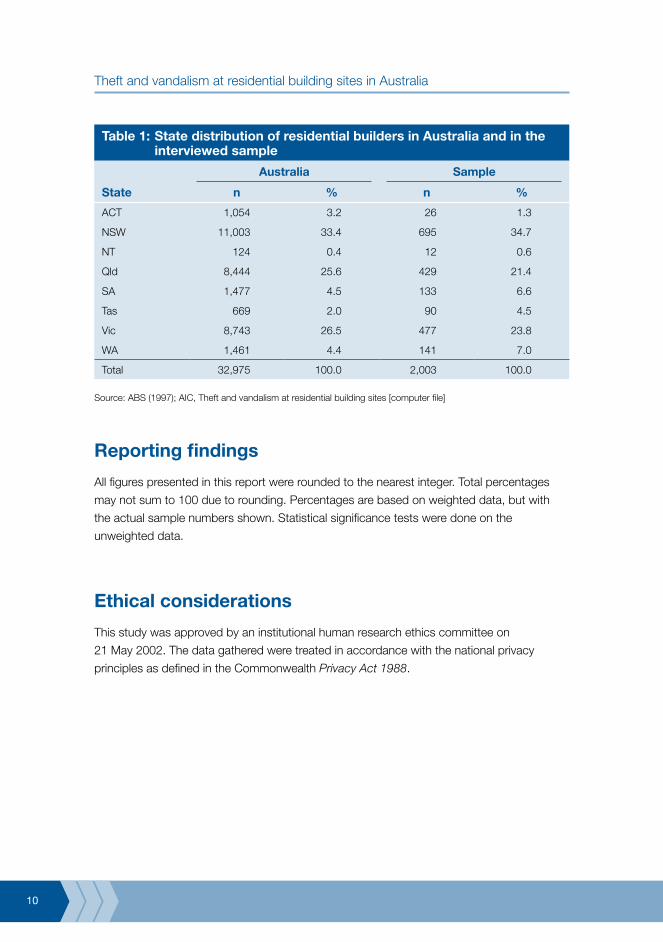
Table 1: State distribution of residential builders in Australia and in the interviewed sample
Australia Sample
State n % n %
ACT 1,054 3.2 26 1.3
NSW 11,003 33.4 695 34.7
NT 124 0.4 12 0.6
Qld 8,444 25.6 429 21.4
SA 1,477 4.5 133 6.6
Tas 669 2.0 90 4.5
Vic 8,743 26.5 477 23.8
WA 1,461 4.4 141 7.0
Total 32,975 100.0 2,003 100.0
Source: ABS (1997); AIC, Theft and vandalism at residential building sites [computer file]
Reporting findings
All figures presented in this report were rounded to the nearest integer. Total percentages
may not sum to 100 due to rounding. Percentages are based on weighted data, but with
the actual sample numbers shown. Statistical significance tests were done on the
unweighted data.
Ethical considerations
This study was approved by an institutional human research ethics committee on
21 May 2002. The data gathered were treated in accordance with the national privacy
principles as defined in the Commonwealth Privacy Act 1988.

Findings
12
Theft and vandalism at residential building sites in Australia
Characteristics of residential builders in Australia
This section outlines the characteristics of residential builders in Australia, including the total
number of people employed during the last pay period in 2002, annual business turnover,
and the total number of houses and/or apartments each residential builder built or modified
in 2002.
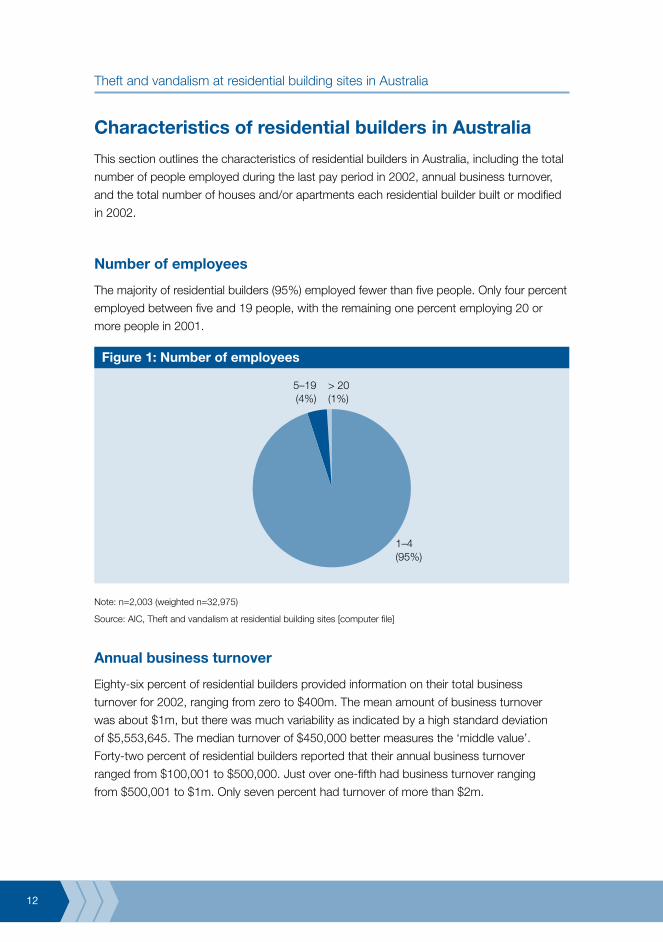
Number of employees
The majority of residential builders (95%) employed fewer than five people. Only four percent
employed between five and 19 people, with the remaining one percent employing 20 or
more people in 2001.
Figure 1: Number of employees
Note: n=2,003 (weighted n=32,975)
Source: AIC, Theft and vandalism at residential building sites [computer file]
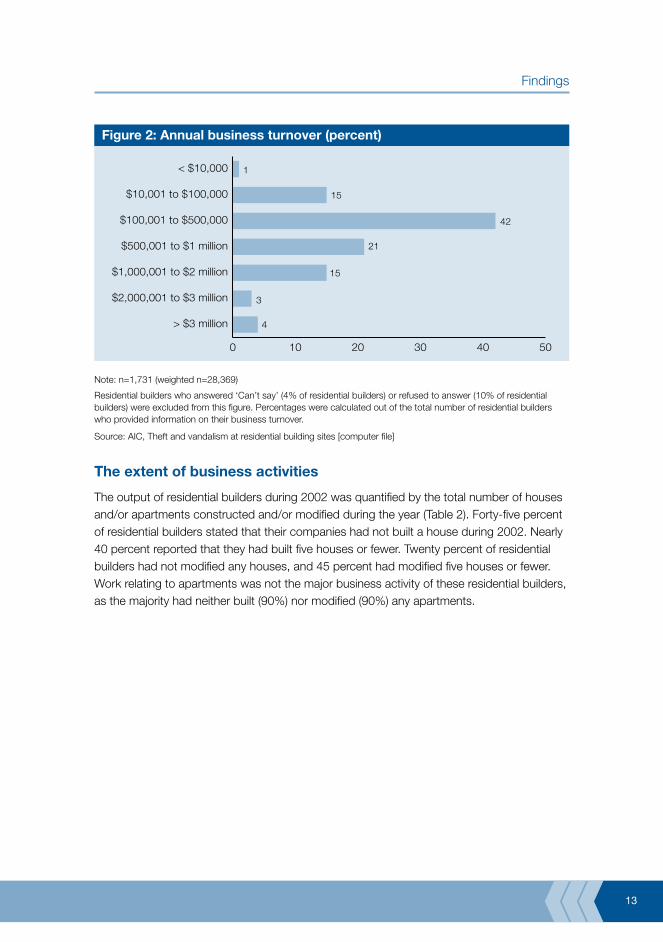
Annual business turnover
Eighty-six percent of residential builders provided information on their total business
turnover for 2002, ranging from zero to $400m. The mean amount of business turnover
was about $1m, but there was much variability as indicated by a high standard deviation
of $5,553,645. The median turnover of $450,000 better measures the ‘middle value’.
Forty-two percent of residential builders reported that their annual business turnover
ranged from $100,001 to $500,000. Just over one-fifth had business turnover ranging
from $500,001 to $1m. Only seven percent had turnover of more than $2m.
5–19 (4%)
> 20 (1%)
1–4 (95%)
13
Findings
Figure 2: Annual business turnover (percent)
0 10 20 30 40 50
> $3 million
$2,000,001 to $3 million
$1,000,001 to $2 million
$500,001 to $1 million
$100,001 to $500,000
$10,001 to $100,000
< $10,000 1
15
42
21
15
3
4
Note: n=1,731 (weighted n=28,369)
Residential builders who answered ‘Can’t say’ (4% of residential builders) or refused to answer (10% of residential builders) were excluded from this figure. Percentages were calculated out of the total number of residential builders who provided information on their business turnover.
Source: AIC, Theft and vandalism at residential building sites [computer file]
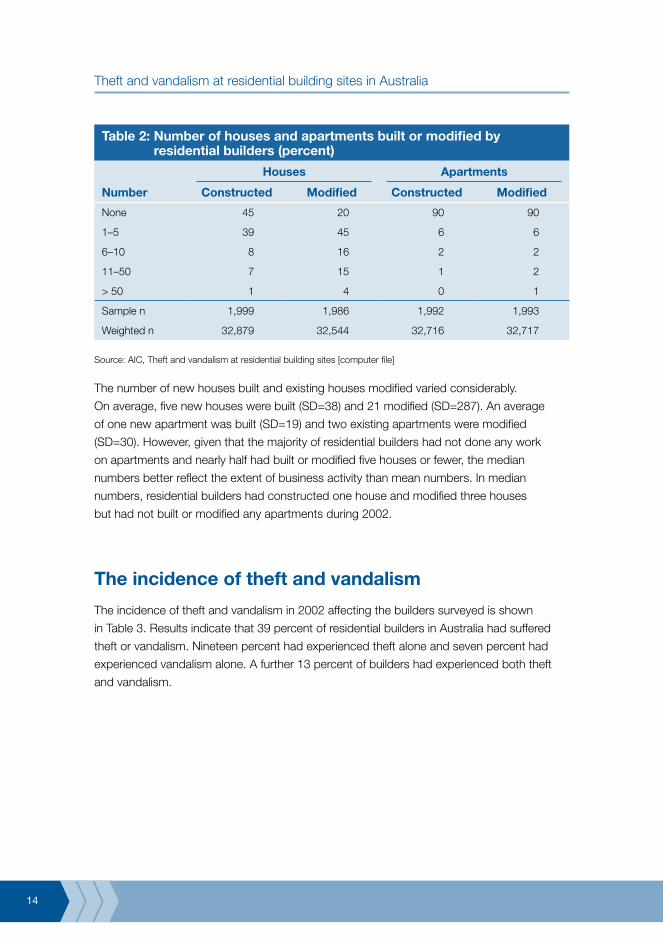
The extent of business activities
The output of residential builders during 2002 was quantified by the total number of houses and/or apartments constructed and/or modified during the year (Table 2). Forty-five percent of residential builders stated that their companies had not built a house during 2002. Nearly 40 percent reported that they had built five houses or fewer. Twenty percent of residential builders had not modified any houses, and 45 percent had modified five houses or fewer. Work relating to apartments was not the major business activity of these residential builders, as the majority had neither built (90%) nor modified (90%) any apartments.
14
Theft and vandalism at residential building sites in Australia
Table 2: Number of houses and apartments built or modified by residential builders (percent)
Houses Apartments
Number Constructed Modified Constructed Modified
None 45 20 90 90
1–5 39 45 6 6
6–10 8 16 2 2
11–50 7 15 1 2
> 50 1 4 0 1
Sample n 1,999 1,986 1,992 1,993
Weighted n 32,879 32,544 32,716 32,717
Source: AIC, Theft and vandalism at residential building sites [computer file]
The number of new houses built and existing houses modified varied considerably.
On average, five new houses were built (SD=38) and 21 modified (SD=287). An average
of one new apartment was built (SD=19) and two existing apartments were modified
(SD=30). However, given that the majority of residential builders had not done any work
on apartments and nearly half had built or modified five houses or fewer, the median
numbers better reflect the extent of business activity than mean numbers. In median
numbers, residential builders had constructed one house and modified three houses
but had not built or modified any apartments during 2002.
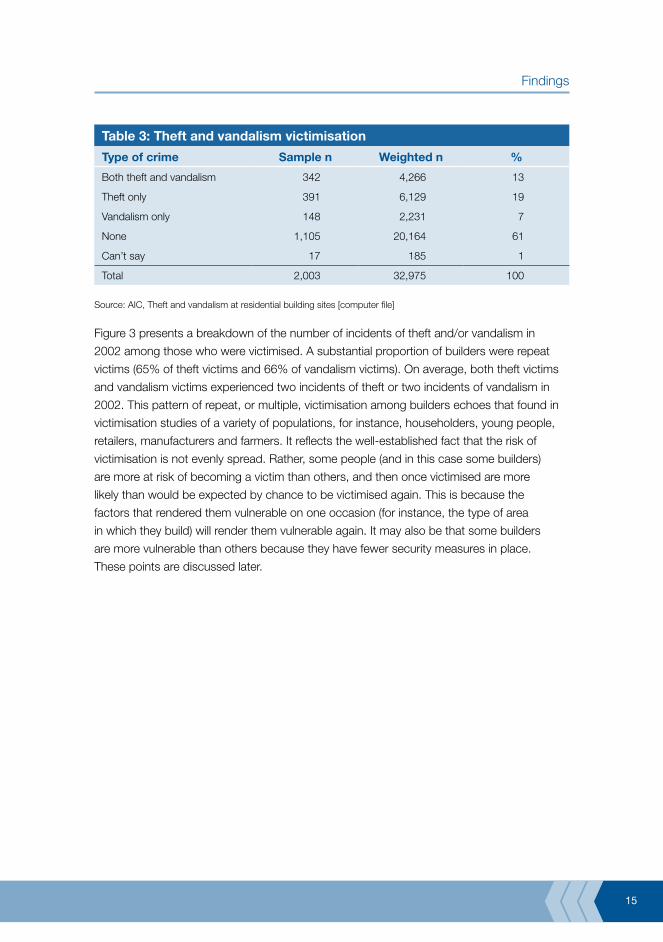
The incidence of theft and vandalism
The incidence of theft and vandalism in 2002 affecting the builders surveyed is shown
in Table 3. Results indicate that 39 percent of residential builders in Australia had suffered
theft or vandalism. Nineteen percent had experienced theft alone and seven percent had
experienced vandalism alone. A further 13 percent of builders had experienced both theft
and vandalism.
15
Findings
Table 3: Theft and vandalism victimisation
Type of crime Sample n Weighted n %
Both theft and vandalism 342 4,266 13
Theft only 391 6,129 19
Vandalism only 148 2,231 7
None 1,105 20,164 61
Can’t say 17 185 1
Total 2,003 32,975 100
Source: AIC, Theft and vandalism at residential building sites [computer file]
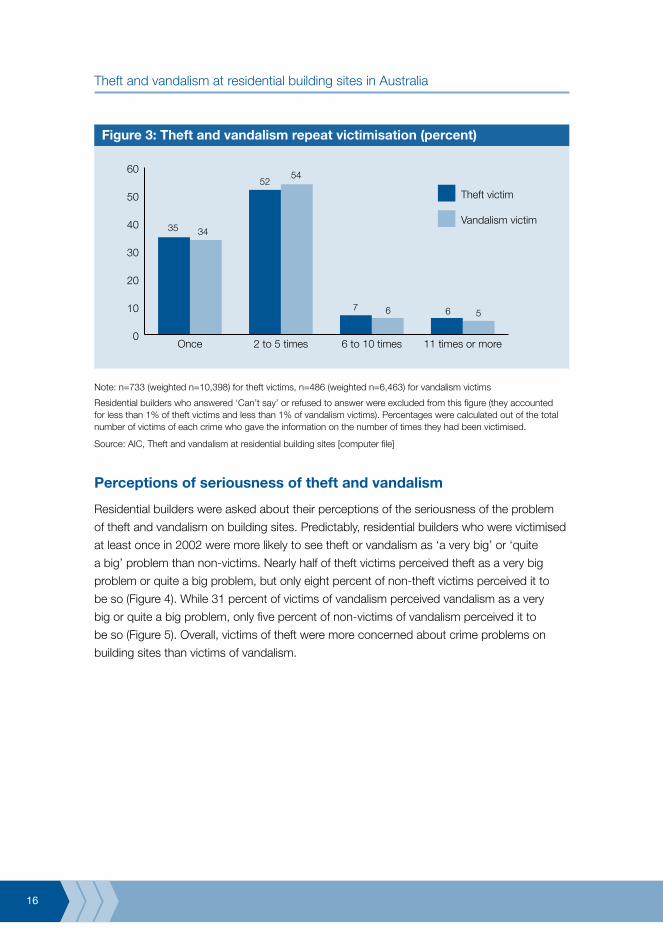
Figure 3 presents a breakdown of the number of incidents of theft and/or vandalism in
2002 among those who were victimised. A substantial proportion of builders were repeat
victims (65% of theft victims and 66% of vandalism victims). On average, both theft victims
and vandalism victims experienced two incidents of theft or two incidents of vandalism in
2002. This pattern of repeat, or multiple, victimisation among builders echoes that found in
victimisation studies of a variety of populations, for instance, householders, young people,
retailers, manufacturers and farmers. It reflects the well-established fact that the risk of
victimisation is not evenly spread. Rather, some people (and in this case some builders)
are more at risk of becoming a victim than others, and then once victimised are more
likely than would be expected by chance to be victimised again. This is because the
factors that rendered them vulnerable on one occasion (for instance, the type of area
in which they build) will render them vulnerable again. It may also be that some builders
are more vulnerable than others because they have fewer security measures in place.
These points are discussed later.
16
Theft and vandalism at residential building sites in Australia
Figure 3: Theft and vandalism repeat victimisation (percent)
0
10
20
30
40
50
60
Vandalism victim
Theft victim
11 times or more6 to 10 times2 to 5 timesOnce
35 34
5254
7 6 6 5
Note: n=733 (weighted n=10,398) for theft victims, n=486 (weighted n=6,463) for vandalism victims
Residential builders who answered ‘Can’t say’ or refused to answer were excluded from this figure (they accounted for less than 1% of theft victims and less than 1% of vandalism victims). Percentages were calculated out of the total number of victims of each crime who gave the information on the number of times they had been victimised.
Source: AIC, Theft and vandalism at residential building sites [computer file]
Perceptions of seriousness of theft and vandalism
Residential builders were asked about their perceptions of the seriousness of the problem
of theft and vandalism on building sites. Predictably, residential builders who were victimised
at least once in 2002 were more likely to see theft or vandalism as ‘a very big’ or ‘quite
a big’ problem than non-victims. Nearly half of theft victims perceived theft as a very big
problem or quite a big problem, but only eight percent of non-theft victims perceived it to
be so (Figure 4). While 31 percent of victims of vandalism perceived vandalism as a very
big or quite a big problem, only five percent of non-victims of vandalism perceived it to
be so (Figure 5). Overall, victims of theft were more concerned about crime problems on
building sites than victims of vandalism.

17
Findings
Figure 4: Perceptions of seriousness of theft (percent)
0
10
20
30
40
50
60
Vandalism victim
Theft victim
11 times or more6 to 10 times2 to 5 timesOnce
35 34
5254
7 6 6 5
Note: n=741 (weighted n=10,470) for theft victims, n=1,256 (weighted n=22,426) for non-victims
Residential builders who answered ‘Can’t say’ or refused to answer were excluded from this figure (they accounted for less than 1% of residential builders). Percentages were calculated out of the total number of residential builders who specified their perceptions of crime within each group (victims and non-victims).
Source: AIC, Theft and vandalism at residential building sites [computer file]
Figure 5: Perceptions of seriousness of vandalism (percent)
0
10
20
30
40
50
60
70
80
Non-victim
Vandalism victim
Not a problemat all
Not muchof a problem
Quite abig problem
A verybig problem
62
25
3
61
28
8
68
Note: n=490 (weighted n=6,474) for vandalism victims, n=1,498 (weighted n=26,304) for non-victims
Residential builders who answered ‘Can’t say’ or refused to answer were excluded from this figure (they accounted for less than 1% of residential builders). Percentages were calculated out of the total number of residential builders who specified their perceptions of crime within each category (victims and non-victims).
Source: AIC, Theft and vandalism at residential building sites [computer file]
18
Theft and vandalism at residential building sites in Australia
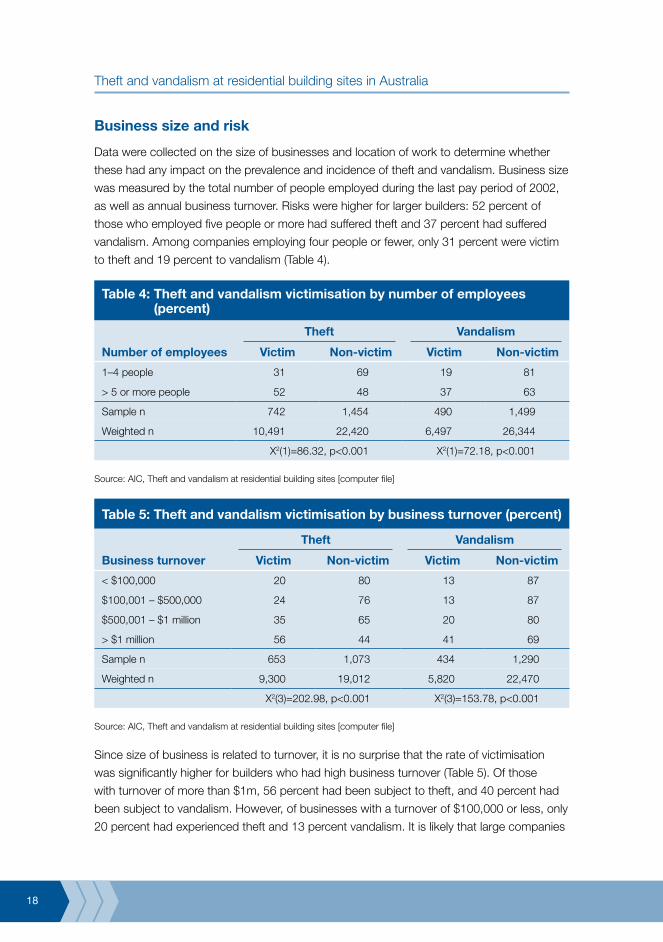
Business size and risk
Data were collected on the size of businesses and location of work to determine whether
these had any impact on the prevalence and incidence of theft and vandalism. Business size
was measured by the total number of people employed during the last pay period of 2002,
as well as annual business turnover. Risks were higher for larger builders: 52 percent of
those who employed five people or more had suffered theft and 37 percent had suffered
vandalism. Among companies employing four people or fewer, only 31 percent were victim
to theft and 19 percent to vandalism (Table 4).
Table 4: Theft and vandalism victimisation by number of employees (percent)
Theft Vandalism
Number of employees Victim Non-victim Victim Non-victim
1–4 people 31 69 19 81
> 5 or more people 52 48 37 63
Sample n 742 1,454 490 1,499
Weighted n 10,491 22,420 6,497 26,344
X2(1)=86.32, p<0.001 X2(1)=72.18, p<0.001
Source: AIC, Theft and vandalism at residential building sites [computer file]
Table 5: Theft and vandalism victimisation by business turnover (percent)
Theft Vandalism
Business turnover Victim Non-victim Victim Non-victim
< $100,000 20 80 13 87
$100,001 – $500,000 24 76 13 87
$500,001 – $1 million 35 65 20 80
> $1 million 56 44 41 69
Sample n 653 1,073 434 1,290
Weighted n 9,300 19,012 5,820 22,470
X2(3)=202.98, p<0.001 X2(3)=153.78, p<0.001
Source: AIC, Theft and vandalism at residential building sites [computer file]
Since size of business is related to turnover, it is no surprise that the rate of victimisation
was significantly higher for builders who had high business turnover (Table 5). Of those
with turnover of more than $1m, 56 percent had been subject to theft, and 40 percent had
been subject to vandalism. However, of businesses with a turnover of $100,000 or less, only
20 percent had experienced theft and 13 percent vandalism. It is likely that large companies
19
Findings
face higher risks because they have more building sites in operation, thereby increasing their
exposure to victimisation In a study of different businesses. In Scotland, Burrows et al. (1999)
found very similar results.
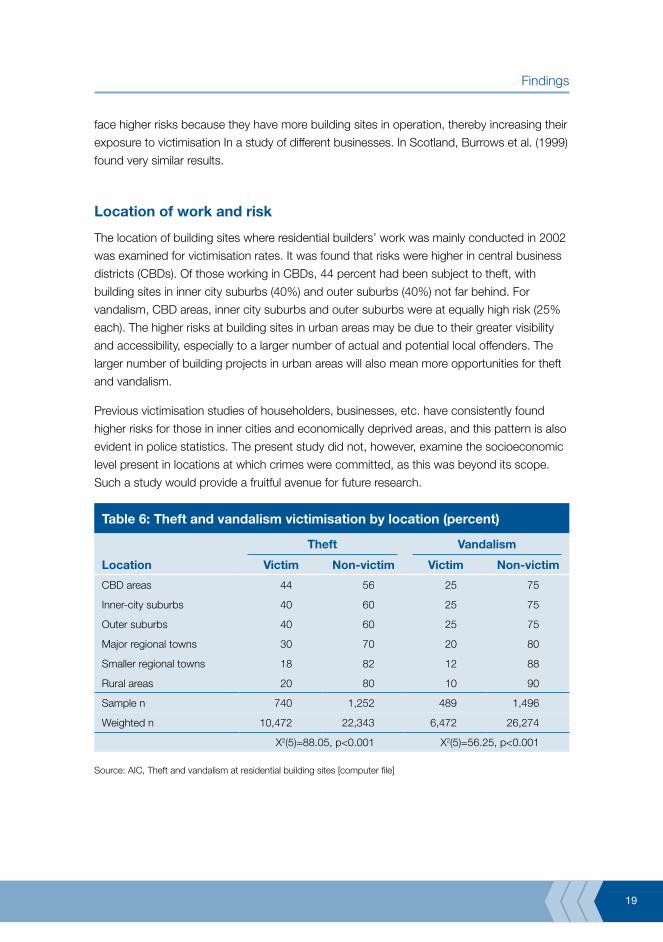
Location of work and risk
The location of building sites where residential builders’ work was mainly conducted in 2002
was examined for victimisation rates. It was found that risks were higher in central business
districts (CBDs). Of those working in CBDs, 44 percent had been subject to theft, with
building sites in inner city suburbs (40%) and outer suburbs (40%) not far behind. For
vandalism, CBD areas, inner city suburbs and outer suburbs were at equally high risk (25%
each). The higher risks at building sites in urban areas may be due to their greater visibility
and accessibility, especially to a larger number of actual and potential local offenders. The
larger number of building projects in urban areas will also mean more opportunities for theft
and vandalism.
Previous victimisation studies of householders, businesses, etc. have consistently found
higher risks for those in inner cities and economically deprived areas, and this pattern is also
evident in police statistics. The present study did not, however, examine the socioeconomic
level present in locations at which crimes were committed, as this was beyond its scope.
Such a study would provide a fruitful avenue for future research.
Table 6: Theft and vandalism victimisation by location (percent)
Theft Vandalism
Location Victim Non-victim Victim Non-victim
CBD areas 44 56 25 75
Inner-city suburbs 40 60 25 75
Outer suburbs 40 60 25 75
Major regional towns 30 70 20 80
Smaller regional towns 18 82 12 88
Rural areas 20 80 10 90
Sample n 740 1,252 489 1,496
Weighted n 10,472 22,343 6,472 26,274
X2(5)=88.05, p<0.001 X2(5)=56.25, p<0.001
Source: AIC, Theft and vandalism at residential building sites [computer file]
20
Theft and vandalism at residential building sites in Australia
The impact and cost of building site theft and vandalism
Costs incurred following incidents of theft and/or vandalism are of particular interest. These
costs were measured in terms of the total value of the loss, net replacement costs and
certain indirect losses:
The total value of the loss was defined as the total value of items stolen or damaged •
(notably the cost of stolen tools, broken windows, etc.)
Net replacement costs were defined as the total value of property loss and damage after •
deducting any insurance payment (if any claims were made) and any property recovered;
direct losses were only applicable to victims who made an insurance claim and/or whose
stolen items were completely or partially recovered.
Indirect losses were defined as financial costs to victims apart from direct losses, that is, •
lost contracts, delays of the completion of a project, penalty clauses or losses caused
through disruption to business.
To simplify the calculation of costs, especially for those victimised more than once, builders
were asked to report on the last incident of theft and vandalism that had occurred. To
reduce response burden, this ‘last incident’ approach is a common feature of victimisation
surveys. It merits a word of caution, however. Some respondents may either forget a less
serious incident if it was the last one to have occurred, or they choose instead to report
on one that was more important, and memorable for them. On balance, the ‘last incident’
approach is likely to inflate the average seriousness of incidents reported.
The impact of theft and vandalism
As shown in Figure 6, more than one in five residential builders who had been victimised
(29% of theft victims and 21% of vandalism victims) indicated that the most recent incident
of theft or vandalism had a very big or some negative impact on their businesses.

21
Findings
Figure 6: Perceived impact of theft and vandalism (percent)
Vandalism victim
Theft victim
6
23
42
29
3841
18
3
0
10
20
30
40
50
No impact at allLittle impactSome impactVery big impact
Note: n=733 (weighted n=10,398) for theft victims, n=487 (weighted n=6,396) for vandalism victims
Residential builders who answered ‘Can’t say’ or refused to answer were excluded from this figure (they accounted for less than 1% of vandalism victims). Percentages were calculated out of the total number of victims of each crime who specified the levels of impact.
Source: AIC, Theft and vandalism at residential building sites [computer file]
Figure 7: Total value of loss suffered by theft and vandalism victims (percent)
0 10 20 30 40 50
Theft victim
Vandalism victim
< $100
$101 – $500
$501 – $1,000
$1,001 – $2,000
$2,001 – $3,000
$3,001 – $4,000
$4,001 – $5,000
> $5,001 38
14
34
34
515
1419
4735
2411
Note: n=733 (weighted n=10,245) for theft victims, n=491 (weighted n=6,227) for vandalism victims
Residential builders who answered ‘Can’t say’ or refused to answer were excluded from this figure (they accounted for 1% of theft victims and 1% of vandalism victims). Percentages were calculated out of the total number of victims of each crime who specified the amount of the loss.
Source: AIC, Theft and vandalism at residential building sites [computer file]
22
Theft and vandalism at residential building sites in Australia
The total value of losses
On average, in the last incident, the loss incurred from vandalism was lower than the loss
incurred from theft. The maximum total loss from theft was $150,000. The mean amount
of total loss was $2,009 (SD=$4,780) and the median amount was $600. For vandalism,
the mean and median amounts of the total losses were $1,156 (SD=$5,643) and $300
respectively.
Figure 7 shows the total value of last incident losses estimated by builders who experienced
theft or vandalism. Half of vandalism victims and over one-third of theft victims reported
losses ranging between $101 and $500. Fourteen percent of vandalism victims and
19 percent of theft victims reported losses of between $501 and $1,000. A very small
percentage of victims of either theft or vandalism reported a loss over $5,000 (8% for theft
and 3% of vandalism respectively). Although the total value of items stolen or vandalised on
the most recent occasion was found not to be significant for each victimised builder, repeat
victimisation could affect businesses significantly.
Net losses
Some victimised businesses recovered compensation from insurance, or recovered some
stolen goods, although the proportion was relatively small. of the mean amount of net losses
incurred from theft was $2,409 (SD=$5,444), while for vandalism it was $991 (SD=$1,147).
The median amounts incurred from theft and vandalism were $600 and $500 respectively.
Indirect losses
In addition to costs incurred in replacing stolen items or restoring damaged premises,
indirect costs may be incurred as a result of theft or vandalism. In this survey, 24 percent
of theft victims and 17 percent of vandalism victims indicated that they had borne some
indirect financial costs resulting from the most recent incident of the crime (such as delays
in the project, penalty clauses and so on). For the minority with indirect losses, the mean
amount lost through theft was $1,873 (SD=$4,143). The mean amount lost from vandalism
was higher at $8,568 (SD=$46,952), although the difference is on a small numerical base
and therefore should be viewed cautiously. For those with indirect losses, the median
amounts incurred from theft and vandalism were $500 and $400 respectively.
These figures of indirect losses are based simply on those who incurred them. Expressing
the figures on the base of all victims gives much lower figures – in the region of $165 for
theft and $360 for vandalism.
23
Findings
Insurance
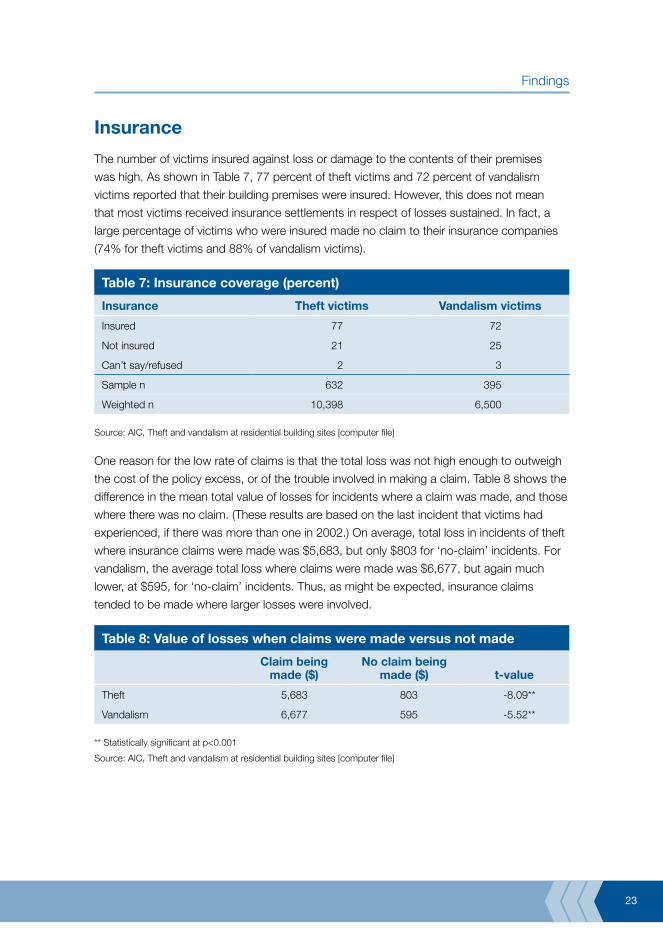
The number of victims insured against loss or damage to the contents of their premises
was high. As shown in Table 7, 77 percent of theft victims and 72 percent of vandalism
victims reported that their building premises were insured. However, this does not mean
that most victims received insurance settlements in respect of losses sustained. In fact, a
large percentage of victims who were insured made no claim to their insurance companies
(74% for theft victims and 88% of vandalism victims).
Table 7: Insurance coverage (percent)
Insurance Theft victims Vandalism victims
Insured 77 72
Not insured 21 25
Can’t say/refused 2 3
Sample n 632 395
Weighted n 10,398 6,500
Source: AIC, Theft and vandalism at residential building sites [computer file]
One reason for the low rate of claims is that the total loss was not high enough to outweigh
the cost of the policy excess, or of the trouble involved in making a claim. Table 8 shows the
difference in the mean total value of losses for incidents where a claim was made, and those
where there was no claim. (These results are based on the last incident that victims had
experienced, if there was more than one in 2002.) On average, total loss in incidents of theft
where insurance claims were made was $5,683, but only $803 for ‘no-claim’ incidents. For
vandalism, the average total loss where claims were made was $6,677, but again much
lower, at $595, for ‘no-claim’ incidents. Thus, as might be expected, insurance claims
tended to be made where larger losses were involved.
Table 8: Value of losses when claims were made versus not made
Claim being made ($)
No claim being made ($) t-value
Theft 5,683 803 -8.09**
Vandalism 6,677 595 -5.52**
** Statistically significant at p<0.001
Source: AIC, Theft and vandalism at residential building sites [computer file]
24
Theft and vandalism at residential building sites in Australia
Reporting crime to the police
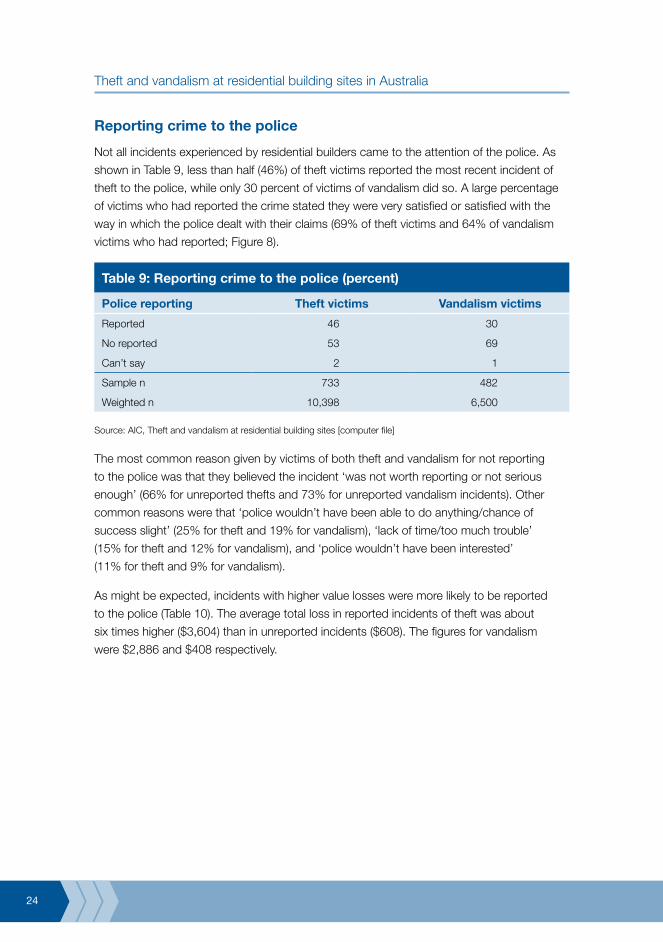
Not all incidents experienced by residential builders came to the attention of the police. As
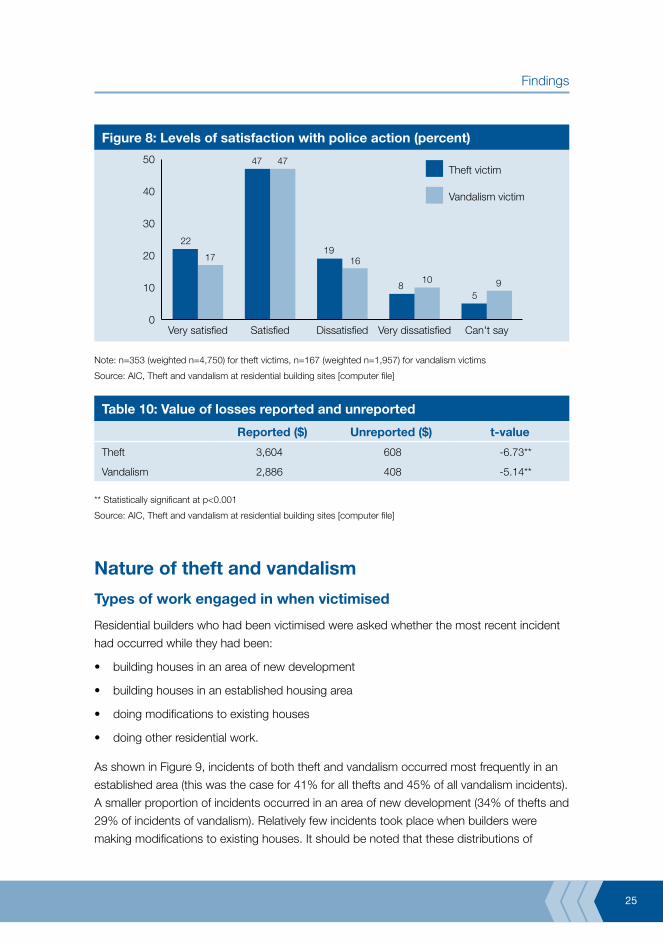
shown in Table 9, less than half (46%) of theft victims reported the most recent incident of
theft to the police, while only 30 percent of victims of vandalism did so. A large percentage
of victims who had reported the crime stated they were very satisfied or satisfied with the
way in which the police dealt with their claims (69% of theft victims and 64% of vandalism
victims who had reported; Figure 8).
Table 9: Reporting crime to the police (percent)
Police reporting Theft victims Vandalism victims
Reported 46 30
No reported 53 69
Can’t say 2 1
Sample n 733 482
Weighted n 10,398 6,500
Source: AIC, Theft and vandalism at residential building sites [computer file]
The most common reason given by victims of both theft and vandalism for not reporting
to the police was that they believed the incident ‘was not worth reporting or not serious
enough’ (66% for unreported thefts and 73% for unreported vandalism incidents). Other
common reasons were that ‘police wouldn’t have been able to do anything/chance of
success slight’ (25% for theft and 19% for vandalism), ‘lack of time/too much trouble’
(15% for theft and 12% for vandalism), and ‘police wouldn’t have been interested’
(11% for theft and 9% for vandalism).
As might be expected, incidents with higher value losses were more likely to be reported
to the police (Table 10). The average total loss in reported incidents of theft was about
six times higher ($3,604) than in unreported incidents ($608). The figures for vandalism
were $2,886 and $408 respectively.
25
Findings
Figure 8: Levels of satisfaction with police action (percent)
0
10
20
30
40
50
Can't sayVery dissatisfiedDissatisfiedSatisfiedVery satisfied
Vandalism victim
Theft victim
22
17
47
1916
810
59
47
Note: n=353 (weighted n=4,750) for theft victims, n=167 (weighted n=1,957) for vandalism victims
Source: AIC, Theft and vandalism at residential building sites [computer file]
Table 10: Value of losses reported and unreported
Reported ($) Unreported ($) t-value
Theft 3,604 608 -6.73**
Vandalism 2,886 408 -5.14**
** Statistically significant at p<0.001
Source: AIC, Theft and vandalism at residential building sites [computer file]
Nature of theft and vandalism
Types of work engaged in when victimised
Residential builders who had been victimised were asked whether the most recent incident
had occurred while they had been:
building houses in an area of new development•
building houses in an established housing area•
doing modifications to existing houses•
doing other residential work.•
As shown in Figure 9, incidents of both theft and vandalism occurred most frequently in an
established area (this was the case for 41% for all thefts and 45% of all vandalism incidents).
A smaller proportion of incidents occurred in an area of new development (34% of thefts and
29% of incidents of vandalism). Relatively few incidents took place when builders were
making modifications to existing houses. It should be noted that these distributions of
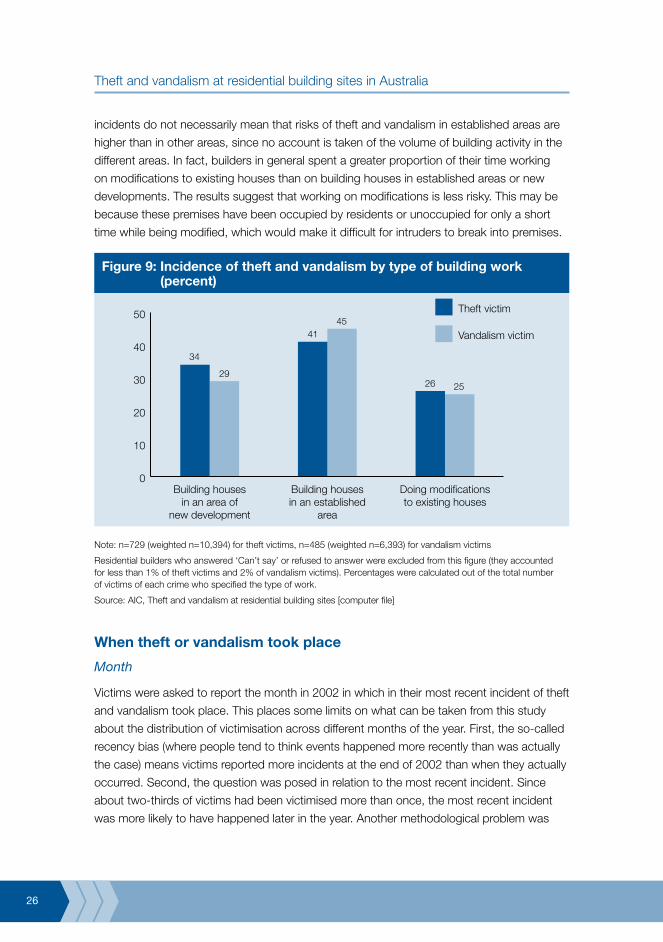
26
Theft and vandalism at residential building sites in Australia
incidents do not necessarily mean that risks of theft and vandalism in established areas are
higher than in other areas, since no account is taken of the volume of building activity in the
different areas. In fact, builders in general spent a greater proportion of their time working
on modifications to existing houses than on building houses in established areas or new
developments. The results suggest that working on modifications is less risky. This may be
because these premises have been occupied by residents or unoccupied for only a short
time while being modified, which would make it difficult for intruders to break into premises.
Figure 9: Incidence of theft and vandalism by type of building work (percent)
Vandalism victim
Theft victim
34
29
4145
26 25
0
10
20
30
40
50
Doing modificationsto existing houses
Building housesin an established
area
Building housesin an area of
new development
Note: n=729 (weighted n=10,394) for theft victims, n=485 (weighted n=6,393) for vandalism victims
Residential builders who answered ‘Can’t say’ or refused to answer were excluded from this figure (they accounted for less than 1% of theft victims and 2% of vandalism victims). Percentages were calculated out of the total number of victims of each crime who specified the type of work.
Source: AIC, Theft and vandalism at residential building sites [computer file]
When theft or vandalism took place
Month
Victims were asked to report the month in 2002 in which in their most recent incident of theft
and vandalism took place. This places some limits on what can be taken from this study
about the distribution of victimisation across different months of the year. First, the so-called
recency bias (where people tend to think events happened more recently than was actually
the case) means victims reported more incidents at the end of 2002 than when they actually
occurred. Second, the question was posed in relation to the most recent incident. Since
about two-thirds of victims had been victimised more than once, the most recent incident
was more likely to have happened later in the year. Another methodological problem was
27
Findings
that six percent of theft victims and 12 percent of vandalism victims could not specify the
month of the most recent incident. Finally, risks of victimisation across time are likely in part
to reflect peaks and troughs in building activity itself.
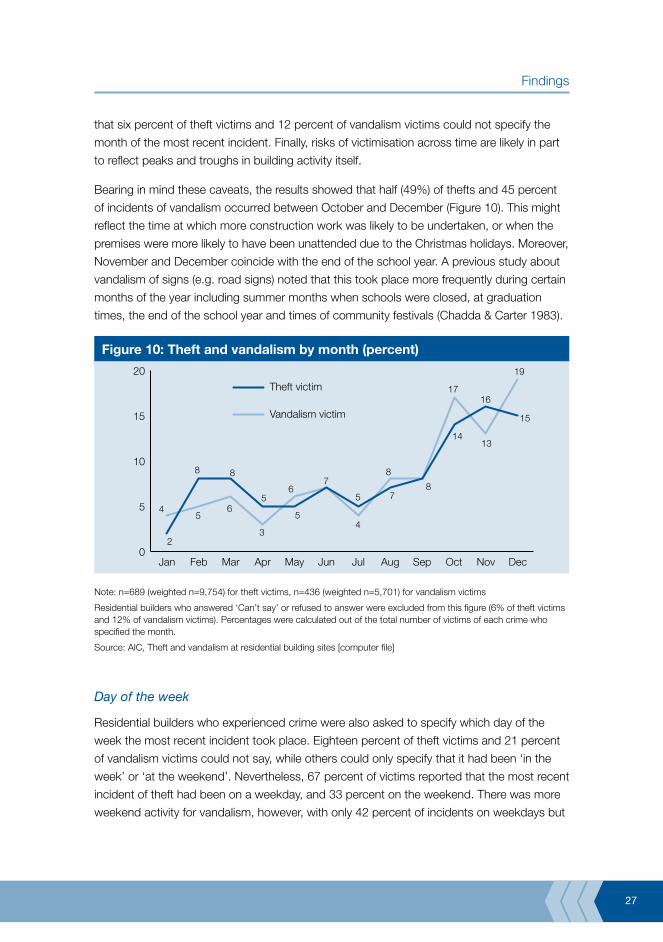
Bearing in mind these caveats, the results showed that half (49%) of thefts and 45 percent
of incidents of vandalism occurred between October and December (Figure 10). This might
reflect the time at which more construction work was likely to be undertaken, or when the
premises were more likely to have been unattended due to the Christmas holidays. Moreover,
November and December coincide with the end of the school year. A previous study about
vandalism of signs (e.g. road signs) noted that this took place more frequently during certain
months of the year including summer months when schools were closed, at graduation
times, the end of the school year and times of community festivals (Chadda & Carter 1983).
Figure 10: Theft and vandalism by month (percent)
2
8
6
8
19
16
15
13
17
5
14
4
87
7
5
8
65
5
3
0
5
10
15
20
4
Vandalism victim
Theft victim
DecNovOctSepAugJulJunMayAprMarFebJan
Note: n=689 (weighted n=9,754) for theft victims, n=436 (weighted n=5,701) for vandalism victims
Residential builders who answered ‘Can’t say’ or refused to answer were excluded from this figure (6% of theft victims and 12% of vandalism victims). Percentages were calculated out of the total number of victims of each crime who specified the month.
Source: AIC, Theft and vandalism at residential building sites [computer file]
Day of the week
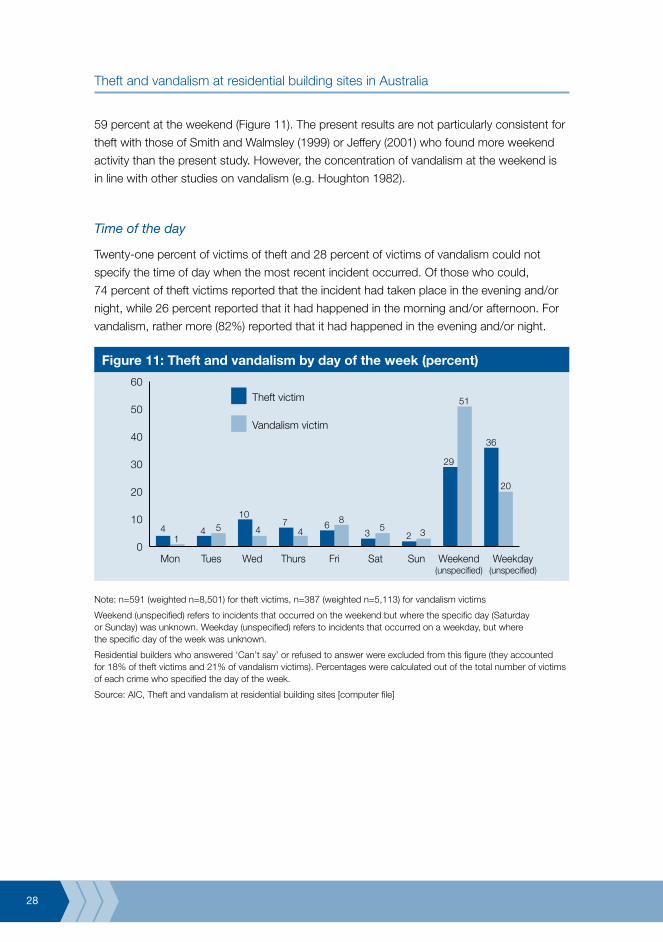
Residential builders who experienced crime were also asked to specify which day of the
week the most recent incident took place. Eighteen percent of theft victims and 21 percent
of vandalism victims could not say, while others could only specify that it had been ‘in the
week’ or ‘at the weekend’. Nevertheless, 67 percent of victims reported that the most recent
incident of theft had been on a weekday, and 33 percent on the weekend. There was more
weekend activity for vandalism, however, with only 42 percent of incidents on weekdays but
28
Theft and vandalism at residential building sites in Australia
59 percent at the weekend (Figure 11). The present results are not particularly consistent for
theft with those of Smith and Walmsley (1999) or Jeffery (2001) who found more weekend
activity than the present study. However, the concentration of vandalism at the weekend is
in line with other studies on vandalism (e.g. Houghton 1982).
Time of the day
Twenty-one percent of victims of theft and 28 percent of victims of vandalism could not
specify the time of day when the most recent incident occurred. Of those who could,
74 percent of theft victims reported that the incident had taken place in the evening and/or
night, while 26 percent reported that it had happened in the morning and/or afternoon. For
vandalism, rather more (82%) reported that it had happened in the evening and/or night.
Figure 11: Theft and vandalism by day of the week (percent)
41
4 510
47
46 8
35
2 3
29
51
36
20
0
10
20
30
40
50
60
Vandalism victim
Theft victim
Weekday(unspecified)
Weekend(unspecified)
SunSatFriThursWedTuesMon
Note: n=591 (weighted n=8,501) for theft victims, n=387 (weighted n=5,113) for vandalism victims
Weekend (unspecified) refers to incidents that occurred on the weekend but where the specific day (Saturday or Sunday) was unknown. Weekday (unspecified) refers to incidents that occurred on a weekday, but where the specific day of the week was unknown.
Residential builders who answered ‘Can’t say’ or refused to answer were excluded from this figure (they accounted for 18% of theft victims and 21% of vandalism victims). Percentages were calculated out of the total number of victims of each crime who specified the day of the week.
Source: AIC, Theft and vandalism at residential building sites [computer file]

29
Findings
Figure 12: Types of items stolen (percent)
43
30
11
8
7
5
5
1
1
12
0 5 10 15 20 25 30 35 40 45 50
Heavy plant equipment
Vehicles
Other items or equipment
Personal and office items
Heating/water heating/air conditioning
Other plant equipment
Whitegoods
Other fittings
Tools
Raw materials
Note: n=632 (weighted n=10,398)
Multiple responses were possible with this question. Percentages were calculated out of the total number of residential builders who fell victim to theft.
Raw materials included bricks, pavers, electrical cables, timber and tiles. Tools included carpentry tools and electrical tools. Other fittings included vanity units, shower screens, baths, ornate doors, cupboards, exhaust fans, light fittings, windows fittings and security fittings. Whitegoods refer to fridges, dishwashers, ovens and stove-tops. Other plant equipment included such things as compactors, scaffolding, generators, brick saws and concrete mixers.
Source: AIC, Theft and vandalism at residential building sites [computer file]
A snapshot of patterns of theft
To more fully investigate the nature of theft on building sites, further questions were
addressed to victims concerning the most recent incident. These questions were:
What was stolen from the building site?• It was found that raw materials were the most frequently stolen item (43%), followed by hand-held tools (30%). Whitegoods were also frequently stolen, but to a much lesser extent (11%) (Figure12).
At what stage of construction did the incident take place?• The risk of theft was the highest in the final stage of construction, with more than half of theft victims reporting the most recent incident occurring at close to the completion of a housing project (that is, at lock-up stage). A further 31 percent reported that it had occurred at the halfway point of the project. Only 16 percent reported that it had occurred when a project had just started.
From which parts of the premises were items stolen?• As might be expected from the types of items frequently stolen, thefts from an open site (42%) or thefts from a house being constructed (40%) were the most common. Thefts from a site shed, shipping container, vehicle or garage were infrequently reported.
Were there any signs of forced-entry?• Nearly one-third of all theft victims stated that the incident had involved some forced entry, most of which involved entry to a house. The majority of builders who had whitegoods stolen reported that they had been stolen from the locked house after they had been completely installed.
30
Theft and vandalism at residential building sites in Australia
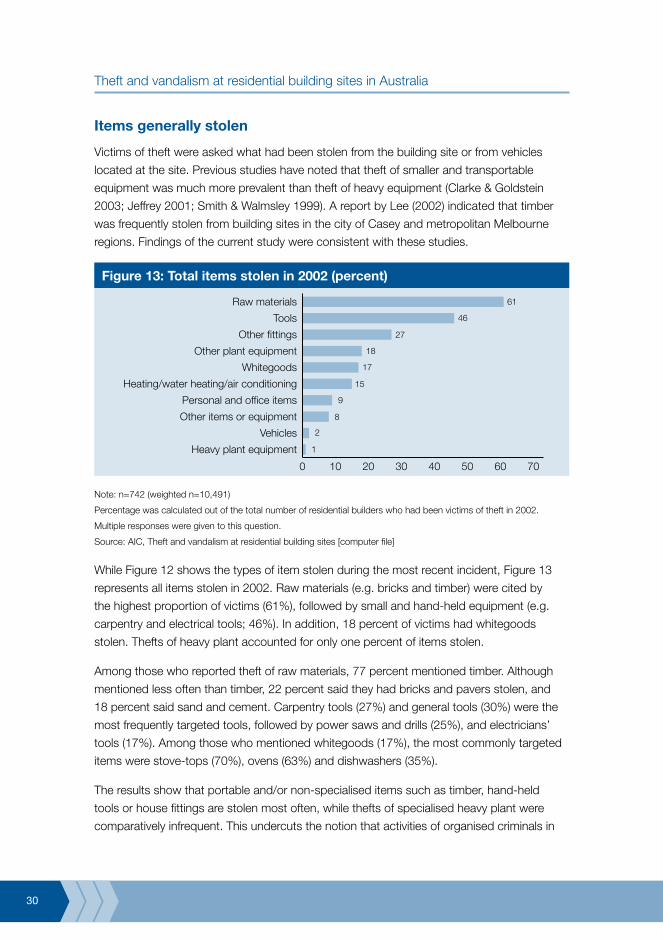
Items generally stolen
Victims of theft were asked what had been stolen from the building site or from vehicles
located at the site. Previous studies have noted that theft of smaller and transportable
equipment was much more prevalent than theft of heavy equipment (Clarke & Goldstein
2003; Jeffrey 2001; Smith & Walmsley 1999). A report by Lee (2002) indicated that timber
was frequently stolen from building sites in the city of Casey and metropolitan Melbourne
regions. Findings of the current study were consistent with these studies.
Figure 13: Total items stolen in 2002 (percent)
61
46
27
18
17
15
9
8
2
1
0 10 20 30 40 50 60 70
Heavy plant equipment
Vehicles
Other items or equipment
Personal and office items
Heating/water heating/air conditioning
Whitegoods
Other plant equipment
Other fittings
Tools
Raw materials
Note: n=742 (weighted n=10,491)
Percentage was calculated out of the total number of residential builders who had been victims of theft in 2002.
Multiple responses were given to this question.
Source: AIC, Theft and vandalism at residential building sites [computer file]
While Figure 12 shows the types of item stolen during the most recent incident, Figure 13
represents all items stolen in 2002. Raw materials (e.g. bricks and timber) were cited by
the highest proportion of victims (61%), followed by small and hand-held equipment (e.g.
carpentry and electrical tools; 46%). In addition, 18 percent of victims had whitegoods
stolen. Thefts of heavy plant accounted for only one percent of items stolen.
Among those who reported theft of raw materials, 77 percent mentioned timber. Although
mentioned less often than timber, 22 percent said they had bricks and pavers stolen, and
18 percent said sand and cement. Carpentry tools (27%) and general tools (30%) were the
most frequently targeted tools, followed by power saws and drills (25%), and electricians’
tools (17%). Among those who mentioned whitegoods (17%), the most commonly targeted
items were stove-tops (70%), ovens (63%) and dishwashers (35%).
The results show that portable and/or non-specialised items such as timber, hand-held
tools or house fittings are stolen most often, while thefts of specialised heavy plant were
comparatively infrequent. This undercuts the notion that activities of organised criminals in
31
Findings
theft from building sites in Australia are the major problem. Results also suggest that there
is a need for additional security measures for high risk items and for the building in general
after whitegoods and heating systems are installed.
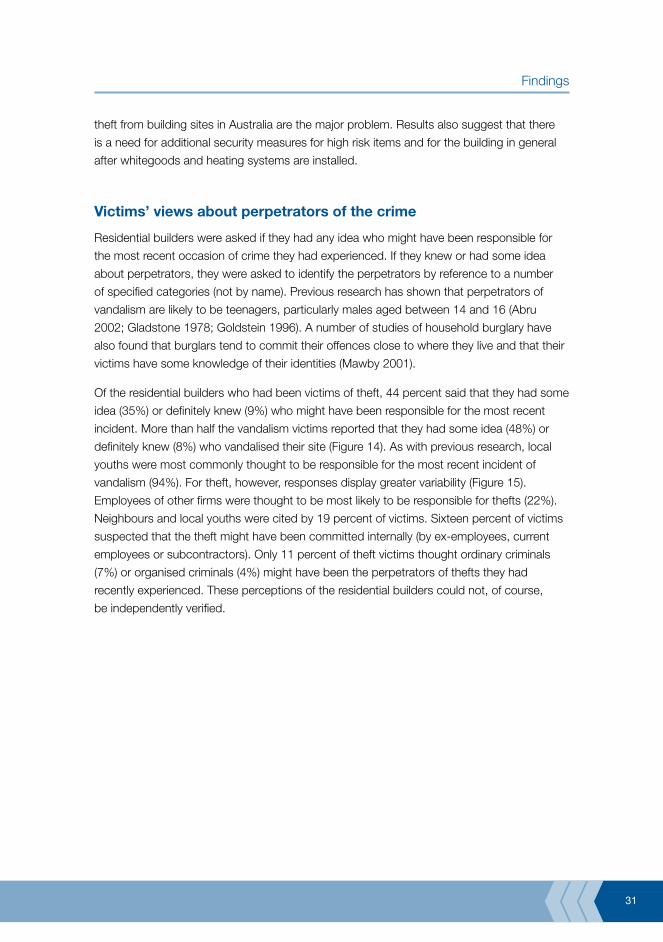
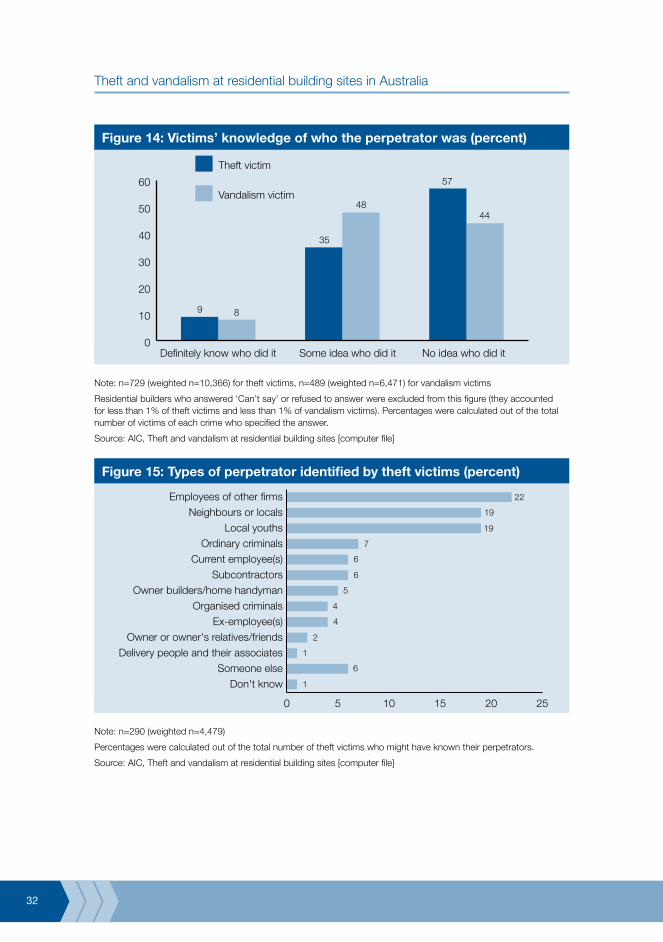
Victims’ views about perpetrators of the crime
Residential builders were asked if they had any idea who might have been responsible for
the most recent occasion of crime they had experienced. If they knew or had some idea
about perpetrators, they were asked to identify the perpetrators by reference to a number
of specified categories (not by name). Previous research has shown that perpetrators of
vandalism are likely to be teenagers, particularly males aged between 14 and 16 (Abru
2002; Gladstone 1978; Goldstein 1996). A number of studies of household burglary have
also found that burglars tend to commit their offences close to where they live and that their
victims have some knowledge of their identities (Mawby 2001).
Of the residential builders who had been victims of theft, 44 percent said that they had some
idea (35%) or definitely knew (9%) who might have been responsible for the most recent
incident. More than half the vandalism victims reported that they had some idea (48%) or
definitely knew (8%) who vandalised their site (Figure 14). As with previous research, local
youths were most commonly thought to be responsible for the most recent incident of
vandalism (94%). For theft, however, responses display greater variability (Figure 15).
Employees of other firms were thought to be most likely to be responsible for thefts (22%).
Neighbours and local youths were cited by 19 percent of victims. Sixteen percent of victims
suspected that the theft might have been committed internally (by ex-employees, current
employees or subcontractors). Only 11 percent of theft victims thought ordinary criminals
(7%) or organised criminals (4%) might have been the perpetrators of thefts they had
recently experienced. These perceptions of the residential builders could not, of course,
be independently verified.
32
Theft and vandalism at residential building sites in Australia
Figure 14: Victims’ knowledge of who the perpetrator was (percent)
9 8
35
48
57
44
0
10
20
30
40
50
60Vandalism victim
Theft victim
No idea who did itSome idea who did itDefinitely know who did it
Note: n=729 (weighted n=10,366) for theft victims, n=489 (weighted n=6,471) for vandalism victims
Residential builders who answered ‘Can’t say’ or refused to answer were excluded from this figure (they accounted for less than 1% of theft victims and less than 1% of vandalism victims). Percentages were calculated out of the total number of victims of each crime who specified the answer.
Source: AIC, Theft and vandalism at residential building sites [computer file]
Figure 15: Types of perpetrator identified by theft victims (percent)
22
19
19
6
6
4
2
6
5
4
1
1
7
0 5 10 15 20 25
Don't knowSomeone else
Delivery people and their associatesOwner or owner's relatives/friends
Ex-employee(s)Organised criminals
Owner builders/home handymanSubcontractors
Current employee(s)Ordinary criminals
Local youthsNeighbours or locals
Employees of other firms
Note: n=290 (weighted n=4,479)
Percentages were calculated out of the total number of theft victims who might have known their perpetrators.
Source: AIC, Theft and vandalism at residential building sites [computer file]
33
Findings
Use of crime prevention measures
Regular use of security hardware and crime prevention measures
Data were collected on the extent to which crime prevention measures were regularly
in place on building sites. In theory, taking security measures should reduce the risks of
crime. For example, Clarke and Goldstein (2003) have shown that delaying installation of
appliances until the new owners have taken up residence is an effective measure to reduce
the risk of theft on building sites. A breakdown of the type of security measures that were
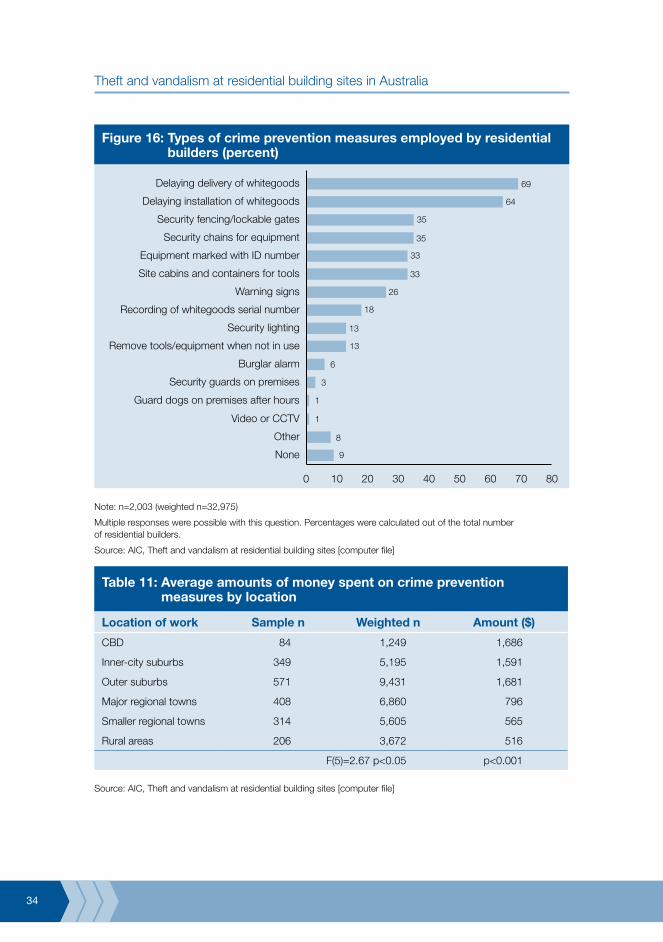
regularly employed by residential builders at the beginning of 2002 is shown in Figure 16.
In the current study, it was found that 64 percent of the 2,003 residential builders followed
the practice of target removal suggested by Clarke and Goldstein (2003) by delaying
the installation of whitegoods until immediately before occupancy. Moreover, 69 percent
reported only taking delivery of whitegoods immediately before installation. Other target
hardening and access control measures were used less often:
security fencing/lockable gates (35%)•
security chains for equipment (35%)•
site cabins and containers for tools (33%)•
equipment marked with identification numbers (33%).•
A small percentage of the residential builders regularly used formal surveillance such
as burglar alarms, security guards, guard dogs or surveillance cameras. Nine percent
of residential builders had not used any of the prevention measures listed in Figure 16.
34
Theft and vandalism at residential building sites in Australia
Figure 16: Types of crime prevention measures employed by residential builders (percent)
69
35
33
26
13
6
1
9
64
35
33
18
13
3
8
0 10 20 30 40 50 60 70 80
None
Other
Video or CCTV
1Guard dogs on premises after hours
Security guards on premises
Burglar alarm
Remove tools/equipment when not in use
Security lighting
Recording of whitegoods serial number
Warning signs
Site cabins and containers for tools
Equipment marked with ID number
Security chains for equipment
Security fencing/lockable gates
Delaying installation of whitegoods
Delaying delivery of whitegoods
Note: n=2,003 (weighted n=32,975)
Multiple responses were possible with this question. Percentages were calculated out of the total number of residential builders.
Source: AIC, Theft and vandalism at residential building sites [computer file]
Table 11: Average amounts of money spent on crime prevention measures by location
Location of work Sample n Weighted n Amount ($)
CBD 84 1,249 1,686
Inner-city suburbs 349 5,195 1,591
Outer suburbs 571 9,431 1,681
Major regional towns 408 6,860 796
Smaller regional towns 314 5,605 565
Rural areas 206 3,672 516
F(5)=2.67 p<0.05 p<0.001
Source: AIC, Theft and vandalism at residential building sites [computer file]
35
Findings
All residential builders were asked to estimate the amount of money they had spent on crime
prevention measures throughout 2002, excluding insurance premiums. The mean amount
was $1,146. The maximum amount spent was $570,000. Fifty-six percent of residential
builders did not spend any money on crime prevention in 2002. They may have felt previous
expenditure was sufficient, and/or have been reluctant to spend more.
Expenditure on crime prevention by those residential builders who were victims in 2002 was
significantly higher than the amount invested by non-victims (t =-5.73 p<0.001). On average,
victims of crime spent $2,240 while non-victims spent $480. This almost certainly reflects
extra spending by victims as a result of their experience, especially if they were repeat victims.
Expenditure by builders in urban areas was higher than elsewhere, reflecting their higher
risks. Builders who mainly worked in CBDs, inner-city suburbs and outer suburbs spent on
average about three times more than builders in rural areas (Table 11, F(5)=2.67, p<0.05).
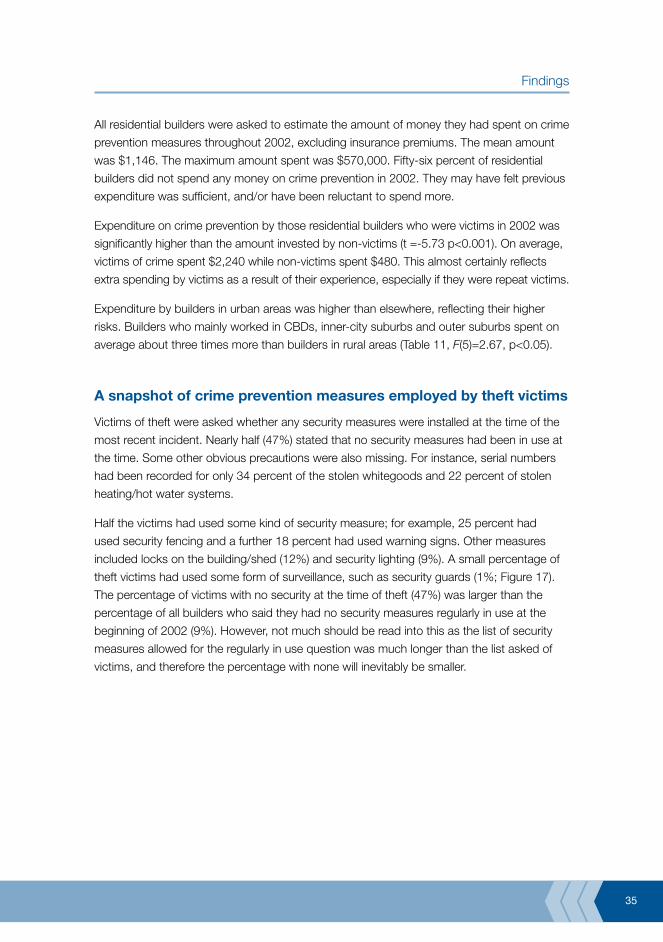
A snapshot of crime prevention measures employed by theft victims
Victims of theft were asked whether any security measures were installed at the time of the
most recent incident. Nearly half (47%) stated that no security measures had been in use at
the time. Some other obvious precautions were also missing. For instance, serial numbers
had been recorded for only 34 percent of the stolen whitegoods and 22 percent of stolen
heating/hot water systems.
Half the victims had used some kind of security measure; for example, 25 percent had
used security fencing and a further 18 percent had used warning signs. Other measures
included locks on the building/shed (12%) and security lighting (9%). A small percentage of
theft victims had used some form of surveillance, such as security guards (1%; Figure 17).
The percentage of victims with no security at the time of theft (47%) was larger than the
percentage of all builders who said they had no security measures regularly in use at the
beginning of 2002 (9%). However, not much should be read into this as the list of security
measures allowed for the regularly in use question was much longer than the list asked of
victims, and therefore the percentage with none will inevitably be smaller.
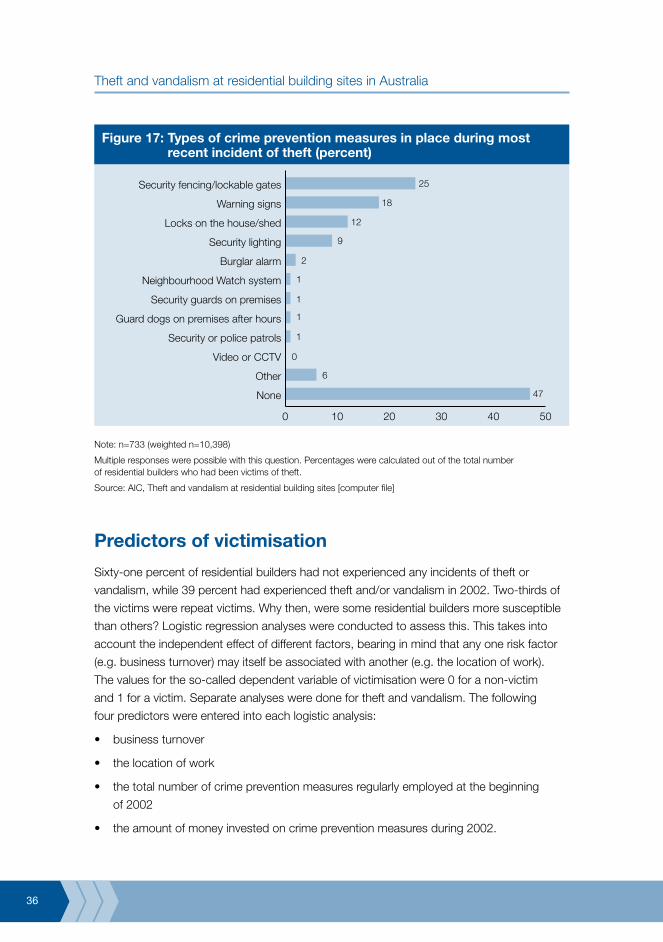
36
Theft and vandalism at residential building sites in Australia
Figure 17: Types of crime prevention measures in place during most recent incident of theft (percent)
25
12
2
18
9
1
1
6
1
1
0
47
0 10 20 30 40 50
None
Other
Video or CCTV
Security or police patrols
Guard dogs on premises after hours
Security guards on premises
Neighbourhood Watch system
Burglar alarm
Security lighting
Locks on the house/shed
Warning signs
Security fencing/lockable gates
Note: n=733 (weighted n=10,398)
Multiple responses were possible with this question. Percentages were calculated out of the total number of residential builders who had been victims of theft.
Source: AIC, Theft and vandalism at residential building sites [computer file]
Predictors of victimisation
Sixty-one percent of residential builders had not experienced any incidents of theft or
vandalism, while 39 percent had experienced theft and/or vandalism in 2002. Two-thirds of
the victims were repeat victims. Why then, were some residential builders more susceptible
than others? Logistic regression analyses were conducted to assess this. This takes into
account the independent effect of different factors, bearing in mind that any one risk factor
(e.g. business turnover) may itself be associated with another (e.g. the location of work).
The values for the so-called dependent variable of victimisation were 0 for a non-victim
and 1 for a victim. Separate analyses were done for theft and vandalism. The following
four predictors were entered into each logistic analysis:
business turnover•
the location of work•
the total number of crime prevention measures regularly employed at the beginning •
of 2002
the amount of money invested on crime prevention measures during 2002.•
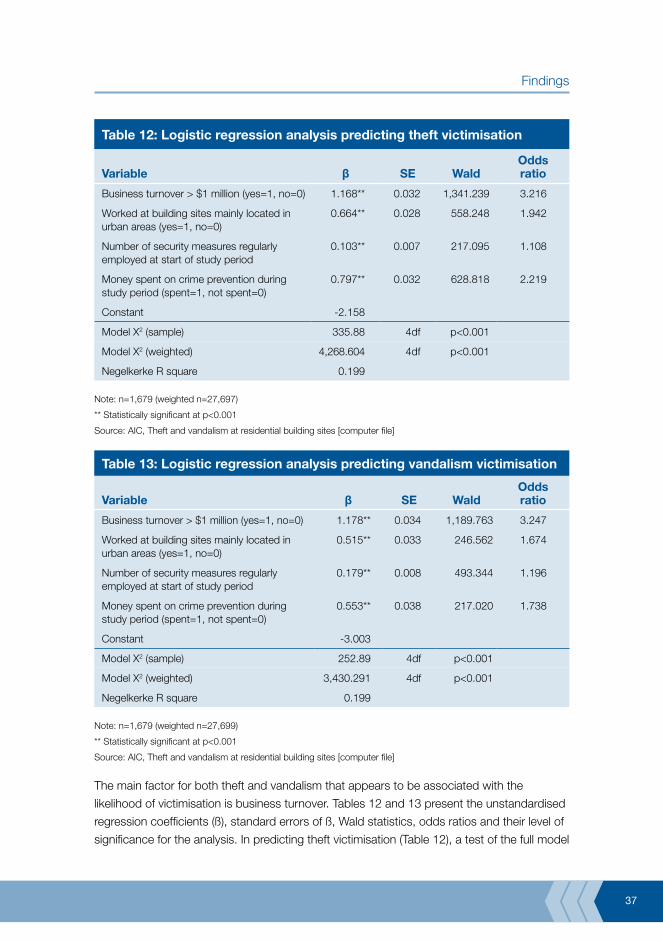
37
Findings
Table 12: Logistic regression analysis predicting theft victimisation
Variable β SE WaldOdds ratio
Business turnover > $1 million (yes=1, no=0) 1.168** 0.032 1,341.239 3.216
Worked at building sites mainly located in urban areas (yes=1, no=0)
0.664** 0.028 558.248 1.942
Number of security measures regularly employed at start of study period
0.103** 0.007 217.095 1.108
Money spent on crime prevention during study period (spent=1, not spent=0)
0.797** 0.032 628.818 2.219
Constant -2.158
Model X2 (sample) 335.88 4df p<0.001
Model X2 (weighted) 4,268.604 4df p<0.001
Negelkerke R square 0.199
Note: n=1,679 (weighted n=27,697)
** Statistically significant at p<0.001
Source: AIC, Theft and vandalism at residential building sites [computer file]
Table 13: Logistic regression analysis predicting vandalism victimisation
Variable β SE WaldOdds ratio
Business turnover > $1 million (yes=1, no=0) 1.178** 0.034 1,189.763 3.247
Worked at building sites mainly located in urban areas (yes=1, no=0)
0.515** 0.033 246.562 1.674
Number of security measures regularly employed at start of study period
0.179** 0.008 493.344 1.196
Money spent on crime prevention during study period (spent=1, not spent=0)
0.553** 0.038 217.020 1.738
Constant -3.003
Model X2 (sample) 252.89 4df p<0.001
Model X2 (weighted) 3,430.291 4df p<0.001
Negelkerke R square 0.199
Note: n=1,679 (weighted n=27,699)
** Statistically significant at p<0.001
Source: AIC, Theft and vandalism at residential building sites [computer file]
The main factor for both theft and vandalism that appears to be associated with the
likelihood of victimisation is business turnover. Tables 12 and 13 present the unstandardised
regression coefficients (ß), standard errors of ß, Wald statistics, odds ratios and their level of
significance for the analysis. In predicting theft victimisation (Table 12), a test of the full model
38
Theft and vandalism at residential building sites in Australia
with all four predictors against a constant-only model was statistically significant in predicting
theft victimisation (X²(4)=4,268.604, p<0.001). Although turnover was most strongly
associated with risk, all of the other three variables (location of work, security measures
employed at the beginning of 2002 and money spent on crime prevention in 2002) also
made a statistically significant contribution.
Residential builders with an annual turnover of $1m or more are about three times more
likely to experience theft than residential builders with annual turnover of less than $1m.
Builders working in urban areas were nearly twice as likely to be victimised. Those with more
security devices in place at the beginning of 2002 also had higher victimisation levels, as did
those who spent more on security in 2002. While, on the face of it, this goes against the
notion that better security is effective, there are more judicious conclusions taken up in
the section.
Very similar results were obtained in predicting vandalism victimisation, as seen in Table 13.
A test of the full model with all four predictors was statistically significant in predicting
victimisation (X²(4)= 3,430.291, p<0.001). Again, businesses with a high turnover were about
three times more likely to experience vandalism than others. Building sites located in urban
areas were also about 1.6 times more likely to have an incident of vandalism than those in
other areas. There was also the same positive relationship between victimisation and the
total number of security measures regularly employed at the beginning of 2002, and the
amount of money invested in security in 2002.

Discussion and conclusion
40
Theft and vandalism at residential building sites in Australia
The results of this study show that one in four residential builders were affected by theft
and/or vandalism on building sites during 2002, and that two-thirds of those victimised
experienced more than one incident – or just over one in 10 builders overall. Median total
losses for victims were $500 for the most recent and presumably typical incident of theft,
and $300 for vandalism. Net losses will have been smaller than this, although not much
more so, since relatively few victims claimed on insurance. Moreover, indirect losses need
to be added. Relatively few victims reported indirect losses, but those who did gave median
values similar to direct losses. There are also the costs of insurance premiums and security
measures, whether as a one-off or ongoing costs.
While about three-quarters of builders were insured for theft and vandalism, the vast majority
who became victims did not make a claim. This was because of the paperwork involved,
and the fact that the losses involved were not high enough to jeopardise their premium
rating. Nonetheless, uncompensated costs, even if small for individual incidents, add
to the overall financial burden of crime for builders. This adds to construction costs and
subsequent housing prices. It has been estimated, for example, that the average price
of a new home increases by one percent as a result of building site thefts (CPV 2003a).
Many previous studies have concentrated on the involvement of professional or organised
criminals in targeted and well-organised theft of heavy plant and equipment from building
sites. This study looked wider and found that only one percent of theft victims reported that
heavy plant and equipment was stolen during 2002. The much greater volume of thefts and
incidents of vandalism seemed more opportunistic in nature and involved non-specialised
and portable items (Jeffery 2001). Thus, six in 10 victims reported that raw materials were
stolen and nearly half mentioned hand-held tools. The opportunistic nature of theft and
vandalism is further evidenced by most theft victims thinking that employees of other
firms and locals and/or neighbours were responsible, as opposed to regular or organised
criminals. Moreover, consistent with previous studies (Abru 2002; Gladstone 1978; Goldstein
1996), the majority of victims of vandalism in this study attributed it to local youths.
Previous research suggests that residential and industrial sites in urban areas are at high
risk of victimisation from theft (Jeffery 2001; Smith & Walmsley 1999). Vandalism tends to
occur in places that are easily accessible (Goldstein 1996). The findings here confirm that
builders who work at sites in urban areas (CBD, inner-city suburbs and outer suburbs) were
about twice as likely to fall victim to both theft and vandalism as builders working in more
remote locations. The present study did not look at other probable factors that could
influence risk, such as site accessibility, the socioeconomic profile of the areas of building
activity or population density. These merit further attention.
The finding that builders with the largest business turnover were most at risk is not surprising
given that they would be engaged in more building projects and have more exposable
assets. On the face of it, it is more surprising that the regression analysis showed that
41
Discussion and conclusion
victims were more likely than non-victims to have had more security measures in place at
the beginning of the year, and to have spent more in the year on security measures. This can
be explained in a number of ways.
Victims might have invested more in additional security in 2002 simply because they •
had been victimised. Barclay and Donnermeyer (2002: 57), in their study on theft and
vandalism on farms in Australia, argued that ‘the precautionary actions were more of
a reaction to having experienced crime rather than a way of reducing victimisation’.
Similar results have been found in relation to householders who experience crime.
Residential builders who had a range of crime prevention measures in place at the •
beginning of 2002 may have been prior victims. Their use of security measures could
actually have reduced incidents in 2002 compared with incidents experienced in
previous years. A longitudinal study across a range of locations would be necessary to
examine the relationship between crime prevention measures and repeat victimisation.
The use of certain security measures may be seen by perpetrators as a challenge or •
imply a history of the premises being targeted, thereby encouraging perpetrators to
offend (Barker & Bridgeman 1994).
The quality of security measures employed may simply be inadequate for the task •
when there is a strong local appetite for theft and vandalism.
The development and implementation of appropriate crime prevention measures can
protect builders from theft and vandalism, especially if they are well thought out. Barker
and Bridgeman (1994: 37) argued:
The most effective preventive strategies use a combination of measures, each
designed to reinforce one another. In selecting measures, it is not sufficient
to base decisions solely on evidence of past success; what works in one
situation may not work in another.
This study suggests that situational prevention measures should be the starting point,
with a particular focus on:
paying better attention to the security of raw materials, tools and appliances that are •
frequently targeted in thefts from building sites. While these need to be readily accessible
to builders themselves and are often on open sites, builders need to weigh their own
convenience better against the risk posed
considering the cost effectiveness of employing after hours security. This will be an •
expensive option, but greater awareness of the fact that most incidents take place
in the evening or at night might sway decisions
improving door and window security (as most appliances are stolen at lock-up stage)•
being particularly attentive to the security of building sites in urban areas •
42
Theft and vandalism at residential building sites in Australia
seeking police help in targeting local youths (who are believed to commit the majority •
of vandalism incidents).
Following from this, the specific crime prevention measures below could help prevent theft
and vandalism on building sites.
Target removal
Protecting raw materials is relatively difficult, as these are often taken from open sites, as
noted, and need to be accessible to builders working to tight deadlines. However, delaying
the delivery of raw materials until immediately before use, preferably on the day they will be
used, would help. It would also help if high-risk tools and equipment (unspecialised and
portable ones) were removed from building sites after use.
Identifying property
Simple and inexpensive measures that can be taken to effectively protect tools and
appliances include keeping good records of serial or identification numbers, and
permanently marking equipment for identification.
Surveillance devices
Most thefts from building sites occur when houses are sufficiently complete to be able to
lock them up. Thus, security measures applicable to residential burglary should come into
play. It would make good sense to ensure that household security systems offered to new
owners are installed and operational as early as practicable. On the basis of the Crime
Prevention Victoria (CPV) work, Lee (2002) recommended that CCTV and site alarms should
be fully operational during the construction process. CCTV systems in particular can be
costly, especially if monitored, but for those at highest risk they may prove cost-effective,
especially if they can be reused on different sites (Barker & Bridgeman 1994).
Natural surveillance
CPV also suggests that improving street and curtilege lighting could be effective in reducing
theft and vandalism by making sites more visible at night. They also endorse involving local
residents in monitoring and reporting suspicious activities. CPV initiated a project in the City
43
Discussion and conclusion
of Casey local government area to increase community awareness of the risks of building
site crime and encourage the reporting of suspicious activities. Given that most incidents
of vandalism are thought to be committed by local youths in the evening at weekends,
specifically enlisting Neighbourhood Watch groups to monitor the activities of local youths
may also help.
Cooperation between government, community and industry
Cooperation between policymakers, the police, communities and the building industry
is necessary for effective prevention strategies. Modern communication technologies can
be engaged for this purpose. CPV, for example, has an interactive website – the virtual
building site – which gives generic tips on reducing risks of building site theft (CPV 2003a).
The website recommends using a number of crime prevention measures, such as warning
signs, delaying delivery and installation of appliances and materials, and marking
all materials and appliances. It also recommends liaison with the local council and
neighbours (CPV 2003b).

References
45
References
All URLs were correct at May 2007
Abru E 2002. Cleaning up after kids: taking the writing off the walls. New South Wales Police
news 82(3): 25–27
Australian Bureau of Statistics (ABS) 1993. Australian and New Zealand standard industrial
classification. ABS cat. no. 1292.0. Canberra: ABS
Australian Bureau of Statistics (ABS) 1997. Private sector construction industry 1996–1997.
ABS cat. no. 8771.0. Canberra: ABS
Barclay E & Donnermeyer J 2002. Property crime and crime prevention on farms in
Australia. Crime prevention and community safety: an international journal 4(4): 47–61
Barker M & Bridgeman C 1994. Preventing vandalism: what works? Crime detection &
prevention series no. 56. London: Police Research Group
Burrows J et al. 1999. Counting the cost: crime against business in Scotland. Edinburgh:
Scottish Executive Central Research Unit
Chadda H & Carter E 1983. Sign vandalism: time for action – now. Institute of Transportation
Engineers journal 53: 17–18
Clarke R 1992. Situational crime prevention: successful case studies. New York: Harrow
and Heston
Clarke R & Goldstein H 2003. Reducing theft at construction sites: lessons from a problem-
oriented project. Washington, DC: US Department of Justice.
http://www.cops.usdoj.gov/mime/open.pdf?Item=804
Crime Prevention Victoria (CPV) 2003a. Virtual building site: security.
http://neighbourhoodwatch.com.au/building/
Crime Prevention Victoria (CPV) 2003b. Preventing building site theft. Effective practice
series report no. 3. http://www.crimeprevention.vic.gov.au
Gladstone F 1978. Vandalism amongst adolescent schoolboys, in Clarke RVG (ed), Tackling
vandalism. Home Office research study no. 47. London: HMSO: 19–39
Goldstein A 1996. The psychology of vandalism. New York & London: Plenum Press
Gyles R 1992. Final report [of the Royal Commission into Productivity in the Building Industry
in New South Wales]. Sydney: Government of New South Wales
Houghton J 1982. Vandalism and theft: a problem for schools. Research report no. 12.
Sydney: NSW Bureau of Crime Statistics and Research
Housing Industry Association (HIA) 2003a. Media release/executive brief 5 June.
Canberra: HIA
Housing Industry Association (HIA) 2003b. Housing Industry Association regarding
professional indemnity insurance 5 August. Canberra: HIA
46
Theft and vandalism at residential building sites in Australia
Housing Industry Association (HIA) 2003c. Media release/executive brief 26 June.
Canberra: HIA
Jeffrey M 2001. An analysis of the extent and nature of theft of equipment within the
construction industry, August 2001. Report no. 1, MEL ref 2001–002. Prepared for Civil
Contractors Federation – NDW OAMPS Insurance Brokers Ltd Hire and Rental Industry
Association
Lee K 2002. Building site crime prevention initiative: final report August 2001 – June 2002.
Melbourne: Crime Prevention Victoria
Mawby R 2001. Burglary. Devon: Willan
Purbrick T 2003. Demolition gang. Police review 12 September
Smith A & Walmsley R 1999. The nature and extent of construction plant theft. Police
research series no. 117. London: Home Office
South Australia Police 2002. Building theft affects you. http://www.sapolice.sa.gov.au/crime/
crime_reduction_section/docs/owners_renovators.pdf
Thomas R 1977. Organised crime in the construction industry. Crime and delinquency no.
23(3): 304–311


