Embed Size (px)
Citation preview

!
!
The!Economic!Impact!of!Reduced!Dredging!of!the!Mississippi!River!Executive!Summary!
By:!!Timothy!P.!Ryan,!Ph.D.!!!!!January!10,!2012!
BIG RIVER COALITION
!
!!The!Economic!Impact!of!Reduced!Mississippi!River!Dredging! 1! !January,!2012!
EXECUTIVE SUMMARY !
• The Mississippi River is the highway to the vast central portion of the United States. Many of the commodities and goods produced in the heartland of the United States are brought to world markets via the Mississippi River to the Gulf of Mexico and beyond to the world economies. Likewise, important products are transported from the rest of the world to the entire United States via the Mississippi River. Much of the Midwest grain and crop production can only competitively enter world markets via waterborne transportation through the Mississippi River. Any increase in costs to U. S. producers, especially farmers, would therefore lead to lost production to foreign competitors. In addition, a large portion of the United States gasoline supply is transported as foreign crude oil to oil refineries on the Mississippi River.
• The Mississippi River system offers users significantly reduced transportation costs when compared to overland methods; however, draft restrictions on the Lower Mississippi River (specifically at Southwest Pass) reduce the positive cost savings. The increased costs associated with draft or channel restrictions negates the competitive advantage U.S. shippers have over competing world markets and threatens the vital competitive advantage of U. S. producers.
• Much of this is threatened by the decision of the Corps of Engineers to reduce dredging activity on the Lower Mississippi River (LMR), specifically at the three areas that require maintenance dredging: the Crossings, the New Orleans Harbor, and Southwest Pass. Historically, the Corps has dredged the River to depths that would allow vessels with draft in excess of 45 feet to navigate the passes to and out of the River. The current USACE budget will lead to significantly reduced widths and depths on the LMR. In the face of the current government fiscal crisis, funding for the Corps of Engineers dredging budget has been cut. According to the Louisiana Congressional delegation, the reduction amounts to $45 million per year. Current discussions call for a dredging program that may only be able to maintain depths of 38 feet in certain areas of the LMR. There are vessel operators that require several feet of clearance below their vessels keels, the most cautious require up to three feet of under-keel clearance. These vessels could then be reduced to drafts of 35 feet when the controlling depth on the LMR is 38 feet.
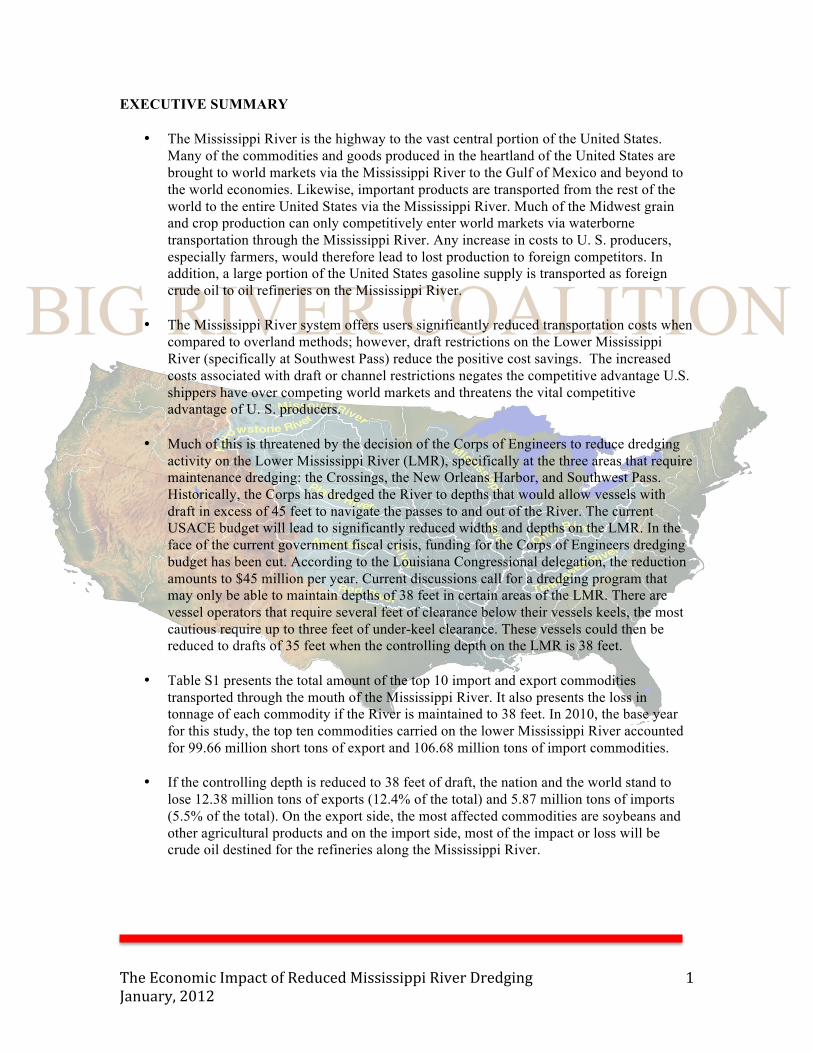
• Table S1 presents the total amount of the top 10 import and export commodities
transported through the mouth of the Mississippi River. It also presents the loss in tonnage of each commodity if the River is maintained to 38 feet. In 2010, the base year for this study, the top ten commodities carried on the lower Mississippi River accounted for 99.66 million short tons of export and 106.68 million tons of import commodities.
• If the controlling depth is reduced to 38 feet of draft, the nation and the world stand to
lose 12.38 million tons of exports (12.4% of the total) and 5.87 million tons of imports (5.5% of the total). On the export side, the most affected commodities are soybeans and other agricultural products and on the import side, most of the impact or loss will be crude oil destined for the refineries along the Mississippi River.
BIG RIVER COALITION
!
!!The!Economic!Impact!of!Reduced!Mississippi!River!Dredging! 2! !January,!2012!
Table S1 Total Tonnage and Tonnage Lost by Commodity at 38 Feet Export Top 10 Total Tonnage Percentage Commodities Tonnage Lost Lost Coal 12,759,567 2,759,394 21.6% Gasoline 1,473,371 23,711 1.6% Corn 35,570,803 923,996 2.6% Pig Iron 1,357,576 39,858 2.9% Crude Oil 12,354,918 4,576,680 37.0% Rice 2,422,224 1,064 0.0% Cyanide Hdrx 1,059,216 - 0.0% Soybean Oil 1,233,169 - 0.0% Soybeans 28,982,631 4,049,330 14.0% Vegetables 2,449,354 4,206 0.2% Total Export 99,662,829 12,378,240 12.4% Import Major Commodities Bauxite 3,448,109 13,580 0.4% Phosphate 1,257,913 51,162 4.1% Coal 1,860,163 59,339 3.2% Fusel 2,099,231 18,551 0.9% Iron Ore 2,043,138 52,352 2.6% Limestone 1,683,764 82,395 4.9% Pig Iron 3,156,734 120,524 3.8% ND Fertilizer 2,034,671 - 0.0% Crude Oil 85,589,492 5,437,667 6.4% Slag Fertilizer 3,509,888 38,550 1.1% Total Import 106,683,103 5,874,120 5.5% Grand Total 206,345,932 18,252,360 8.8% Source: Blue Water Shipping, PIERS, and Author’s Calculations
• Table S2 presents the dollar loss associated with the tonnage loss presented in Table S1. In 2010, the Mississippi River handled over $40.12 billion in just the top ten commodities on the export side and $62.75 billion of import commodities. The dredging restriction could cause a loss of $5.52 billion on the export side and $3.71 billion on the import side. In total, the U. S. economy could stand to lose over $9.23 billion worth of cargo.

BIG RIVER COALITION
!
!!The!Economic!Impact!of!Reduced!Mississippi!River!Dredging! 3! !January,!2012!
Table S2 Total Value Lost by Commodity at 38 Feet Export Major Total Value Percentage Commodities Value Lost Lost Coal $2,141,427,629 $463,106,856 21.6% Gasoline $1,139,832,112 $18,343,617 1.6% Corn $8,938,593,246 $232,191,086 2.6% Pig Iron $278,303,080 $8,170,938 2.9% Crude Oil $8,249,891,392 $3,056,038,818 37.0% Rice $1,352,612,433 $594,144 0.0% Cyanide Hdrx $529,608,000 $- 0.0% Soybean Oil $1,364,828,761 $- 0.0% Soybeans $12,462,429,754 $1,741,197,914 14.0% Vegetables $3,666,327,346 $6,296,324 0.2% Total Exports $40,123,853,755 $5,525,939,696 13.8% Import Major Commodities Bauxite $1,517,114,857 $5,975,021 0.4% Phosphate $225,378,997 $9,166,654 4.1% Coal $312,189,625 $9,958,863 3.2% Fusel $- $- 0.0% Iron Ore $328,496,446 $8,417,153 2.6% Limestone $33,604,670 $1,644,441 4.9% Pig Iron $647,130,470 $24,707,339 3.8% ND Fertilizer $929,925,367 $- 0.0% Crude Oil $57,151,655,182 $3,630,955,976 6.4% Slag Fertilizer $1,604,158,062 $17,618,833 1.1% Total Imports $62,749,653,676 $3,708,444,280 5.9% Grand Total $102,873,507,431 $9,234,383,976 9.0% Source: Blue Water Shipping, PIERS, and Author’s Calculations
• These cargo reductions will have a serious impact on the United States economy in three major ways: a) the loss to the Louisiana economy related to the handling of this cargo; b) the loss to the U. S. producers due to the increased costs of American made goods for export; and c) the loss to the American consumers due to higher gasoline prices that will result from the reductions of imported crude oil.
BIG RIVER COALITION
!
!!The!Economic!Impact!of!Reduced!Mississippi!River!Dredging! 4! !January,!2012!
LOSS TO THE LOUISIANA ECONOMY
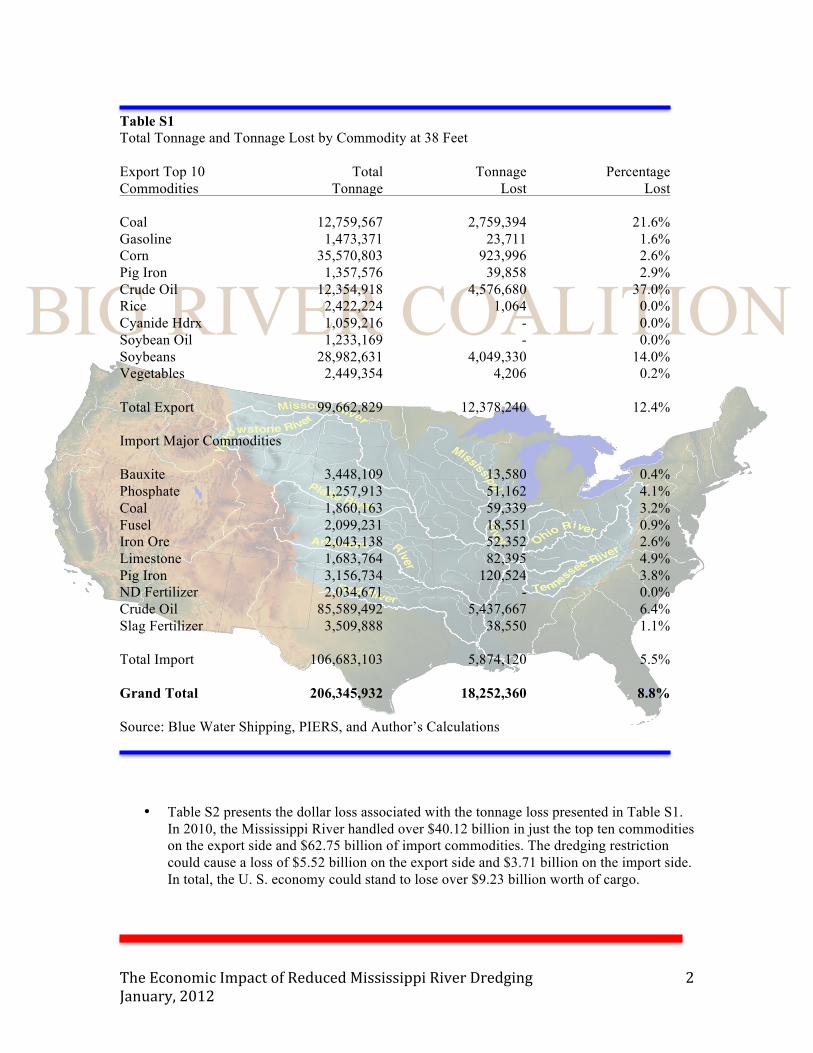
• Over 20% of United States waterborne commerce passes through the Lower Mississippi River and the Louisiana economy. Shipping is big business in Louisiana. Millions of dollars of business and thousands of jobs are related to the handling, financing, processing, and transporting that cargo. The ship movements create a large number of economic opportunities related to the servicing of the vessels that call on the ports along the LMR. The LMR also acts as a magnet for attracting warehousing and manufacturing firms that use the River to import raw materials into the area or export finished products out of the area.
• As a result of the reduced dredging activities of the Corps of Engineers, the Louisiana
economy could lose $268.14 million in direct spending, $155.45 million in secondary spending for a total spending loss of $423.59 million. In addition, the Louisiana economy could lose $117.96 million of income and 3,815 jobs in the state. Local governments could lose $13.24 million annually in tax revenue, the state government could lose $14.54 million in tax revenues, and the federal government could lose $13.05 million annually in income tax revenues. (See Table S3)
Table S3 Total Dollar Loss to the Louisiana Economy Category Total Loss in $s Direct Spending $268,141,204 Secondary Spending $155,447,650 Total Spending $423,588,854 Earnings $117,955,050 Jobs 3,815 State Taxes $14,536,790 Local Taxes $13,237,223 Federal Taxes $13,045,829 S & L Taxes $27,774,013 Total Taxes $40,819,841 Source: Author’s Calculations

BIG RIVER COALITION
!
!!The!Economic!Impact!of!Reduced!Mississippi!River!Dredging! 5! !January,!2012!
LOSS TO U. S. PRODUCERS DUE TO HIGHER COSTS OF TRANSPORTATION
• American producers have two options in the face of the dredging restrictions:
o Option 1 -- reduce production to lower the quantities produced and therefore shipped. Given the fact that the increased costs of shipping the commodities may make American goods, especially farm products, less competitive than foreign produced goods, this is a likely outcome. For this option, the reduction in production would equal the loss in commodities shipped as identified in Tables 11 and 13.
o Option 2 -- to absorb the higher transportation costs. If the producers choose this option, they will find the least cost method of shipping the goods and this will be the cost they will absorb. Given the fact that most of the commodities identified in Tables 11 and 13 are commodities that are shipped in bulk (mostly agricultural products and crude oil), it will still be cheaper to barge these commodities down the Mississippi River and put them on an additional ship to the ultimate destination. The number of additional vessels needed for each commodity depends on the tonnage lost. The average size of an outbound vessel from the Mississippi River in 2010 according to PIERS is 55,151 tons. Thus, a total of 224 additional ocean-going vessels will be needed to transport the cargo lost. That is distributed as follows: Coal (50 ships), Gasoline (0 ship), Corn (17 ships), Pig Iron (1 ships), Crude Oil (83 ships), Rice (0 ships), Cyanide Hydroxide (0 ships), Soybean Oil (0 ships), Soybeans (73 ships), and Vegetable Oils (0 ship). For those commodities listed with zero additional ships, it is assumed that they would be matched with existing ships that have additional capacity (albeit at some cost). The costs of an additional bulk ship of 55,000-ton capacity for a trip from New Orleans to China would be, on average, $1,983,316. The per ship additional costs are the losses that the producers would have to bear in Option 2.
• The economic losses resulting from the dredging restrictions are significant for the
country as a whole. In just one year, under Option 1, American producers, mostly farmers, could lose $5.53 billion in direct losses in production. The ripple effect, or secondary spending effect, could add another $4.97 billion. The total loss to the U. S. economy of the reduced dredging could be $10.50 billion in lost production.
• In addition, the nation’s economy could lose 33,800 jobs as a result of the losses in
production and $1.69 billion in lost income for American workers. These are losses that would be even more significant in the current weak economy. Finally, when the private sector loses production and jobs, state, local, and federal governments suffer losses in revenue. The economic losses resulting from the reduced dredging could cost state and local governments $108.96 million in lost revenues and the federal government would lose $186.91 million in lost personal income tax revenues alone. The total loss to all levels of government could be $295.87 million. See Table S4.
• Under Option 2, in just one year, American producers, mostly farmers, could lose
$445.14 million in direct losses in production. The ripple effect, or secondary spending

BIG RIVER COALITION
!
!!The!Economic!Impact!of!Reduced!Mississippi!River!Dredging! 6! !January,!2012!
effect, could add another $414.11 million. The total loss to the U. S. economy of the reduced dredging could be $859.25 million in lost production under Option 2.
• In addition, the nation’s economy could stand to lose 2,720 jobs as a result of the losses
in production and $136.02 million in lost income for American workers. These are losses that would be even more significant in the current weak economy. Finally, when the private sector declines through lost production and lost jobs, state, local, and federal governments suffer losses in revenue. The economic losses resulting from the reduced dredging could cost state and local governments $8.77 million in lost revenues and the federal government would lose $15.04 million in lost personal income tax revenues alone. The total loss to all levels of government could be $23.81 million. See Table S4.
Table S4 Economic Loss to American Producers Category Economic Loss, Option 1 Economic Loss, Option 2 Direct Spending $5,525,939,696 $445,140,769 Total Spending $10,502,750,760 $859,251,515 Federal taxes $186,912,704 $15,043,687 Total Taxes $295,866,972 $23,812,882 Earnings $1,689,988,285 $136,018,872 Jobs 33,800 2,720 Source: Author’s Calculations LOSS FROM HIGHER GAS PRICES
• The final category of loss is the loss to American consumers associated with higher gasoline prices. The shallower channel could cause the loss of 5,437,667 short tons of crude oil in just one year. There are 7.33 barrels of crude oil in one short ton. Thus, the reduced dredging could cause the loss of 39.86 million barrels of oil. In 2010, U. S. oil refineries used 7.00 billion barrels of crude oil in producing gasoline for American consumers. Thus, the draft restrictions could cause a loss of 0.9% of all crude oil and a corresponding decrease in the amount of gasoline refined from that crude.
• According to a recent study, the average price elasticity of demand for gasoline in the United States is -0.26. That means that a 0.6% increase in the price of gasoline will cause a .26% decrease in quantity demanded. Another way of looking at the elasticity is that a 0.6% reduction in the quantity supplied of gasoline could cause a 2.2% increase in price.
• Thus, it can be anticipated that the reduced channel maintenance and the resulting 0.9% reduction in gasoline supply will result in a 2.2% increase in price. The current average retail price of gasoline is $3.53 (Source: U. S. Energy Information Administration). Thus,

BIG RIVER COALITION
!
!!The!Economic!Impact!of!Reduced!Mississippi!River!Dredging! 7! !January,!2012!
the channel restrictions could cause a $0.08 increase in retail gasoline prices. In 2010, consumers in the United States consumed 18.18 billion gallons of gasoline. The reduced dredging could cause a loss to consumers of $0.08 for every gallon consumed or a total loss of $1.40 billion annually in higher gasoline expenditures. The loss in quantity demanded could be 103.48 million gallons.
• In addition to the direct loss to consumers, there could also be related losses in secondary
spending, government tax revenue, earnings, and jobs. These losses are presented in Table S5.
Table S5 Losses Due to Reductions in Crude Oil Imports Category Loss Barrels of crude oil lost 39,858,100 Barrels of crude oil used in US 7,000,746,000 Percent lost 0.6% Resulting change in gasoline prices 2.2% Current Gasoline Price $3.53 Price Increase $0.08 Total U.S. gasoline consumption in 2010 (in gallons) 18,176,124,000 Reduced consumption related to higher prices (in gallons) 103,484,082 Direct loss to consumers in the U.S. $1,404,995,416 Total secondary loss $1,480,698,255 Total loss to consumers $2,885,693,671 Earnings Loss $47,121,860 Employment Loss 942 Federal Gas Tax Loss $19,041,071 State Gas Tax Loss $31,459,161 Total Gas Tax Loss $50,500,232 Source: Author’s Calculations OVERALL ECONOMIC LOSS
• The final analysis calls for a benefit/cost analysis of the decision to save the $45 million and reduce the Corps’ budget to not allow for dredging to traditional levels. The benefits of this action are the savings to the federal government and the costs are the economic
BIG RIVER COALITION
!
!!The!Economic!Impact!of!Reduced!Mississippi!River!Dredging! 8! !January,!2012!
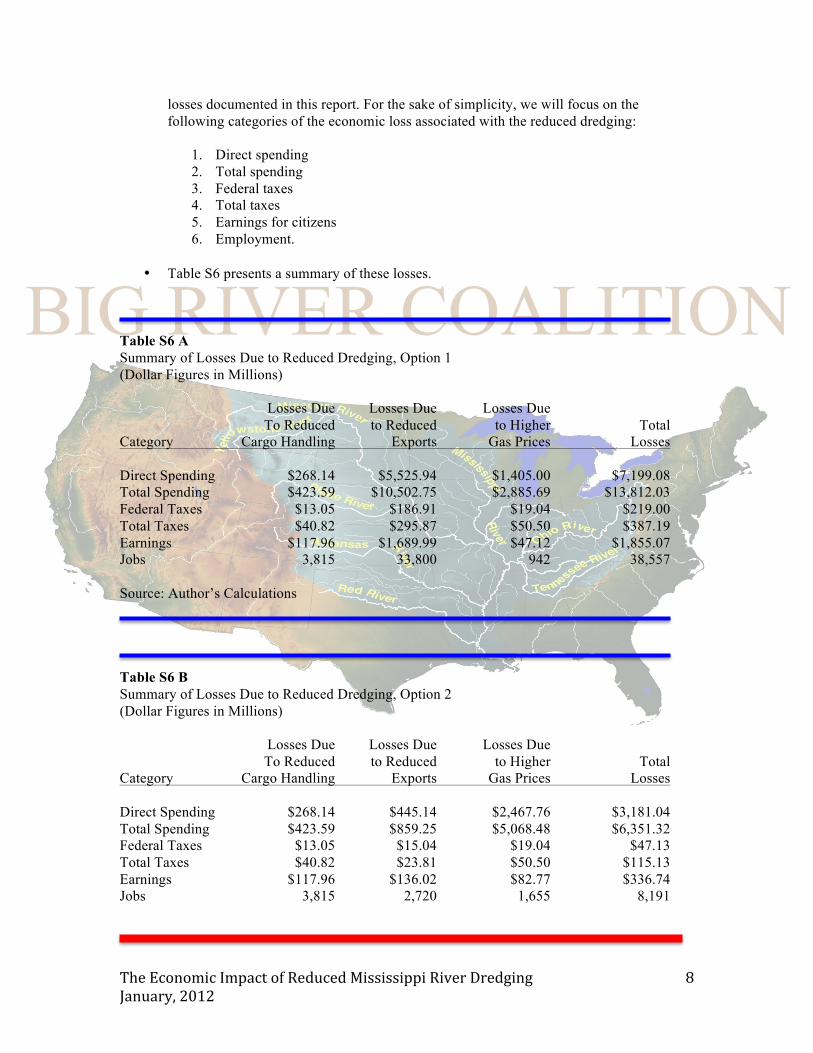
losses documented in this report. For the sake of simplicity, we will focus on the following categories of the economic loss associated with the reduced dredging:
1. Direct spending 2. Total spending 3. Federal taxes 4. Total taxes 5. Earnings for citizens 6. Employment.
• Table S6 presents a summary of these losses.
Table S6 A Summary of Losses Due to Reduced Dredging, Option 1 (Dollar Figures in Millions) Losses Due Losses Due Losses Due To Reduced to Reduced to Higher Total Category Cargo Handling Exports Gas Prices Losses Direct Spending $268.14 $5,525.94 $1,405.00 $7,199.08 Total Spending $423.59 $10,502.75 $2,885.69 $13,812.03 Federal Taxes $13.05 $186.91 $19.04 $219.00 Total Taxes $40.82 $295.87 $50.50 $387.19 Earnings $117.96 $1,689.99 $47.12 $1,855.07 Jobs 3,815 33,800 942 38,557 Source: Author’s Calculations Table S6 B Summary of Losses Due to Reduced Dredging, Option 2 (Dollar Figures in Millions) Losses Due Losses Due Losses Due To Reduced to Reduced to Higher Total Category Cargo Handling Exports Gas Prices Losses Direct Spending $268.14 $445.14 $2,467.76 $3,181.04 Total Spending $423.59 $859.25 $5,068.48 $6,351.32 Federal Taxes $13.05 $15.04 $19.04 $47.13 Total Taxes $40.82 $23.81 $50.50 $115.13 Earnings $117.96 $136.02 $82.77 $336.74 Jobs 3,815 2,720 1,655 8,191
BIG RIVER COALITION
!
!!The!Economic!Impact!of!Reduced!Mississippi!River!Dredging! 9! !January,!2012!
Source: Author’s Calculations
• Thus, in 2012, the first year in which the reduced dredging expenditures will have a full impact, the losses in direct spending could amount to a total of $7,199.08 million or $7.20 billion under Option 1 and $3,181.04 million or $3.18 billion under Option 2. The losses in total spending, including the secondary spending or ripple effect, could be $13,812.03 million or $13.81 billion under Option 1 and $6.35 billion under Option 2.
• The irony of the situation is that even the federal government will lose money by this decision. The loss in federal tax revenues could be $219.00 million annually under Option 1 and $47.13 million under Option 2. In other words, in order to save $45 million, the government could give up $219.00 million or $47.13 in reduced tax revenues on the economic activity lost to the reduced cargo movements. In addition, state and local governments could also lose tax revenue. In total, all governments could lose $387.19 million or $115.13 million in tax revenues to save $45 million.
• Finally, the reduction in dredging frequency could cost U. S. citizens their jobs and part of their income or earnings. The reduction in employment could be 38,557 or 8,191 jobs nationally. Citizens could lose between $336.74 million and $1.86 billion annually in income or earnings.
• The figures described above are for one year only. They are likely to increase over time for two reasons. First, the natural growth of the shipping business that is likely to occur over the next five to ten years as a result of economic growth. The U. S. and worldwide recession has slowed cargo movements through the Mississippi River. The 2010 totals were up 21.9% compared to 2009. Over the ten-year period from 2000 to 2010, the totals were up by 4.8% per year. The second reason that the cargo movements are expected to increase is the opening of the new locks and cargo movement infrastructure of the Panama Canal in 2014. The “new” Panama Canal is expected to increase cargo, especially cargo moving on larger ships that can now be accommodated by the Canal, by 30%. The increase for 2012 through 2014 in the Mississippi River is expected to grow at 4.8% annually and after that by 6.3% annually. Tables S7A and S7B present the expected benefits (federal government savings from reduced dredging activities) and the expected costs (losses due to the reduced cargo movements) from 2012 to 2021.

BIG RIVER COALITION
!
!!The!Economic!Impact!of!Reduced!Mississippi!River!Dredging! 10! !January,!2012!
Table S7 A Annual Costs and Benefits of Reduced Dredging, Option 1 (Dollar Figures in Millions) Dredging Direct Total Federal Year Spending Spending Spending Earnings Taxes 2012 $45.00 $7,199.08 $13,812.03 $1,855.07 $219.00 2013 $46.08 $7,545.21 $14,476.12 $1,944.26 $229.53 2014 $47.18 $7,907.98 $15,172.13 $2,037.74 $240.56 2015 $48.30 $8,402.26 $16,120.45 $2,165.10 $255.60 2016 $49.46 $8,927.44 $17,128.04 $2,300.43 $271.58 2017 $50.64 $9,485.44 $18,198.61 $2,444.22 $288.55 2018 $51.85 $10,078.31 $19,336.09 $2,596.99 $306.59 2019 $53.09 $10,708.25 $20,544.68 $2,759.31 $325.75 2020 $54.36 $11,377.56 $21,828.80 $2,931.78 $346.11 2021 $55.65 $12,088.70 $23,193.19 $3,115.03 $367.74 Present Value $430.64 $79,830.79 $153,162.09 $20,570.88 $2,428.49 Benefit/Cost Ratio NA 0.005 0.003 0.021 0.177 Source: Author’s Calculations Table S7 B Annual Costs and Benefits of Reduced Dredging, Option 2 (Dollar Figures in Millions) Dredging Direct Total Federal Year Spending Spending Spending Earnings Taxes 2012 $45.00 $3,181.04 $6,351.32 $336.74 $47.13 2013 $46.08 $3,333.98 $6,656.69 $352.93 $49.40 2014 $47.18 $3,494.28 $6,976.75 $369.90 $51.77 2015 $48.30 $3,712.69 $7,412.82 $393.02 $55.01 2016 $49.46 $3,944.75 $7,876.15 $417.58 $58.45 2017 $50.64 $4,191.31 $8,368.44 $443.68 $62.10 2018 $51.85 $4,453.28 $8,891.51 $471.42 $65.98 2019 $53.09 $4,731.63 $9,447.26 $500.88 $70.10 2020 $54.36 $5,027.38 $10,037.75 $532.19 $74.49 2021 $55.65 $5,341.61 $10,665.15 $565.45 $79.14 Present Value $430.64 $35,274.66 $70,430.03 $3,734.12 $522.63 Benefit/Cost Ratio NA 0.012 0.006 0.115 0.824 Source: Author’s Calculations

BIG RIVER COALITION
!
!!The!Economic!Impact!of!Reduced!Mississippi!River!Dredging! 11! !January,!2012!
• The case for increased spending on dredging could not be clearer. The present value of the stream is also presented. The future benefits and costs are discounted to the present using the current long-term U. S. Treasury bond rate of 2.77%. The present value of the ten-year projections of the benefits and costs from reduced dredging presents a startling comparison. The benefits of the activity (reducing federal spending on dredging) are outweighed by the costs no matter what measure of costs are used.
• Under Option 1, if direct costs are used as the cost measure, the B/C ratio is .005. In cost
benefit analysis, a B/C ratio of one implies that the benefits and costs are equal. A B/C ratio of more than one implies the benefits outweigh the costs and a B/C ratio of less than one implies the costs outweigh the benefits. If total costs are used as the costs, the B/C ratio is .003. If earnings or income is used, the B/C ratio is .021. Finally, if federal tax revenues are used, the B/C ratio is .177.
• Under Option 2, if direct costs are used as the cost measure, the B/C ratio is .012. If total
costs are used as the cost measure, the B/C ratio is .006. If earnings or income is used, the B/C ratio is .115. Finally, if federal tax revenues are used, the B/C ratio is .824.
• Clearly, no matter what measure of costs is employed, the result is a B/C ratio of
significantly less than one. Under any measure, the decision by the government to reduce the Corps’ funding for dredging is a poor policy decision.
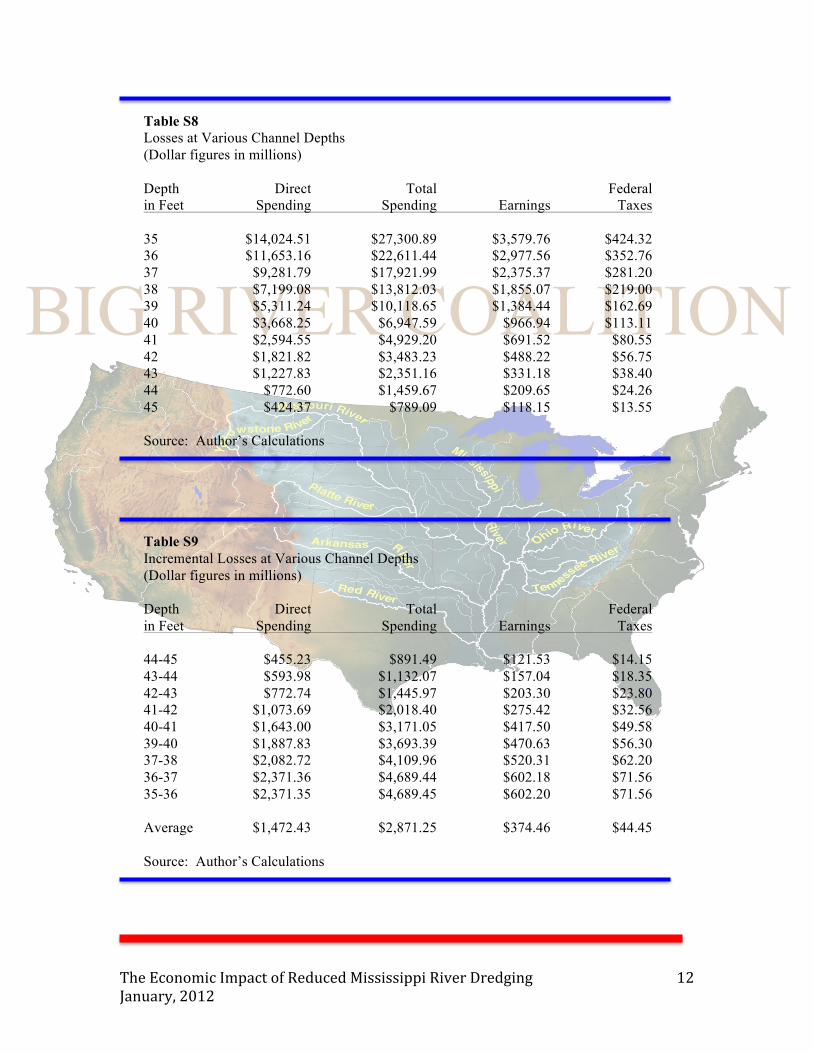
LOSSES AT VARIOUS CHANNEL DEPTHS
• The analysis in this report is based on the Corps maintaining the Lower Mississippi River to a depth of 38 feet. Dredging is not an exact science. The actual depths can be impacted by natural phenomena that occur in the River itself. This section of the report analyzes the impact of dredging the channel to various depths.
• If the channel is dredged to 45 feet, the losses to the United States economy will be $423.37 million in direct spending, $789.09 million in total spending, $118.15 million in earnings or income for American residents, and $13.55 million in federal taxes lost (See Table S8). For every foot below 45 feet, the losses get larger and larger. If the channel is dredged to a depth of only 35 feet, the losses will be $14.02 billion in direct spending, $27.30 billion in total spending, $3.58 billion in earnings, and $424.32 million in federal taxes.
• Table S9 presents the economic losses as we move from 45 feet channel depths to 35
feet. Reducing the channel from 45 to 44 feet will create losses of $455.23 million in direct spending. Reducing it from 44 to 43 will create additional losses of $593.98 million and so forth. As the channel depths get lower the losses get higher and higher. On average, a one foot reduction in the channel creates an additional loss in the first year to the United States economy of $1.47 billion per foot in direct spending, $2.87 billion per foot in total spending, $374.46 million per foot in earnings, and $44.45 million per foot in federal tax revenues.
BIG RIVER COALITION
!
!!The!Economic!Impact!of!Reduced!Mississippi!River!Dredging! 12! !January,!2012!
Table S8 Losses at Various Channel Depths (Dollar figures in millions) Depth Direct Total Federal in Feet Spending Spending Earnings Taxes 35 $14,024.51 $27,300.89 $3,579.76 $424.32 36 $11,653.16 $22,611.44 $2,977.56 $352.76 37 $9,281.79 $17,921.99 $2,375.37 $281.20 38 $7,199.08 $13,812.03 $1,855.07 $219.00 39 $5,311.24 $10,118.65 $1,384.44 $162.69 40 $3,668.25 $6,947.59 $966.94 $113.11 41 $2,594.55 $4,929.20 $691.52 $80.55 42 $1,821.82 $3,483.23 $488.22 $56.75 43 $1,227.83 $2,351.16 $331.18 $38.40 44 $772.60 $1,459.67 $209.65 $24.26 45 $424.37 $789.09 $118.15 $13.55 Source: Author’s Calculations
Table S9 Incremental Losses at Various Channel Depths (Dollar figures in millions) Depth Direct Total Federal in Feet Spending Spending Earnings Taxes 44-45 $455.23 $891.49 $121.53 $14.15 43-44 $593.98 $1,132.07 $157.04 $18.35 42-43 $772.74 $1,445.97 $203.30 $23.80 41-42 $1,073.69 $2,018.40 $275.42 $32.56 40-41 $1,643.00 $3,171.05 $417.50 $49.58 39-40 $1,887.83 $3,693.39 $470.63 $56.30 37-38 $2,082.72 $4,109.96 $520.31 $62.20 36-37 $2,371.36 $4,689.44 $602.18 $71.56 35-36 $2,371.35 $4,689.45 $602.20 $71.56 Average $1,472.43 $2,871.25 $374.46 $44.45 Source: Author’s Calculations