Embed Size (px)
Citation preview

Policy Research Working Paper 7528
The World Bank’s Classification of Countries by Income
Neil FantomUmar Serajuddin
Development Economics Data GroupJanuary 2016
WPS7528P
ublic
Dis
clos
ure
Aut
horiz
edP
ublic
Dis
clos
ure
Aut
horiz
edP
ublic
Dis
clos
ure
Aut
horiz
edP
ublic
Dis
clos
ure
Aut
horiz
ed

Produced by the Research Support Team
Abstract
The Policy Research Working Paper Series disseminates the findings of work in progress to encourage the exchange of ideas about development issues. An objective of the series is to get the findings out quickly, even if the presentations are less than fully polished. The papers carry the names of the authors and should be cited accordingly. The findings, interpretations, and conclusions expressed in this paper are entirely those of the authors. They do not necessarily represent the views of the International Bank for Reconstruction and Development/World Bank and its affiliated organizations, or those of the Executive Directors of the World Bank or the governments they represent.
Policy Research Working Paper 7528
This paper is a product of the Data Group, Development Economics Vice Presidency. It is part of a larger effort by the World Bank to provide open access to its research and make a contribution to development policy discussions around the world. Policy Research Working Papers are also posted on the Web at http://econ.worldbank.org. The authors may be contacted at [email protected].
The World Bank has used an income classification to group countries for analytical purposes for many years. Since the present income classification was first introduced 25 years ago there has been significant change in the global eco-nomic landscape. As real incomes have risen, the number of countries in the low income group has fallen to 31, while the number of high income countries has risen to 80. As countries have transitioned to middle income status, more people are living below the World Bank’s international extreme poverty line in middle income countries than in low income countries. These changes in the world economy, along with a rapid increase in the user base of World Bank data, suggest that a review of the income classification is
needed. A key consideration is the views of users, and this paper finds opinions to be mixed: some critics argue the thresholds are dated and set too low; others find merit in continuing to have a fixed benchmark to assess progress over time. On balance, there is still value in the current approach, based on gross national income per capita, to classifying countries into different groups. However, the paper pro-poses adjustments to the methodology that is used to keep the value of the thresholds for each income group constant over time. Several proposals for changing the current thresh-olds are also presented, which it is hoped will inform further discussion and any decision to adopt a new approach.

The World Bank’s Classification of Countries by Income
Neil Fantom and Umar Serajuddin*
Keywords: income classification; low income countries; middle income countries; GNI per capita (Atlas method); poverty JEL Codes: I3, O1, O2
* Neil Fantom ([email protected]) is a Manager and Umar Serajuddin ([email protected]) is a Senior Economist-Statistician at the Development Data Group (DECDG) of the World Bank.
We acknowledge Aart Kray and David Rosenblatt for detailed comments on this paper. We also thank Eric Swanson and Shahrokh Fardoust for detailed inputs on specific topics, especially the discussion of international inflation, and for conducting many of the interviews with users. We thank Haishan Fu, Shaida Badiee, Dean Jolliffe, and Espen Beer Prydz for helpful discussions. We thank Bala Bhaskhar Naidu Kalimili, Juan Feng, William Prince, Syud Amer Ahmed, Masako Hiraga, Tariq Khokar, and Malvina Pollock for their inputs to the draft, Mizuki Yamanaka for conducting a good deal of the empirical work, and Leila Rafei and Haifa Alqahtani for researching other country classification systems. Special thanks for their time and input are due to colleagues across the World Bank who agreed to be interviewed or provide comments as part of the process of assessing user views, including Asli Demirgüç-Kunt, Shanta Devarajan, Ariel Fiszbein, Caroline Freund, Indermit Gill, Bert Hofman, Jeffrey Lewis, Augusto de la Torre, Andrew Burns, Zia Qureshi, Martin Ravallion, Luis Serven, Hans Timmer, Rui Coutinho, and Tatiana Didier.
2
1. Introduction
The World Bank has used an income classification to group countries for analytical purposes for
many years. The method was presented in the first World Development Report (World Bank,
1978), and its origins can be traced even further back. In 1965, for instance, a published essay
“The Future of the World Bank” used gross national product (GNP) per capita to classify
countries as very poor, poor, middle income, and rich (Reid, 1965).
The current form of the income classification has been used since 1989. It divides
countries into four groups—low income, lower middle income, upper middle income, and high
income—using gross national income (GNI) per capita valued annually in US dollars using a
three-year average exchange rate (World Bank, 1989). The cutoff points between each of the
groups are fixed in real terms: they are adjusted each year in line with price inflation. The
classification is published on http://data.worldbank.org and is revised once a year on July 1, at
the start of the World Bank fiscal year.
The World Bank uses the income classification in World Development Indicators (WDI)
and other presentations of data; the main purpose is analysis. The classification is often mistaken
as being the same as the Bank’s operational guidelines1 that establish lending terms for countries
(International Development Association, 2012). While the income classification itself is not used
for operational decision-making by the World Bank and by itself has no formal official
significance, it uses the same methods to calculate GNI per capita and adjust the thresholds that
are used in the operational guidelines. The methods currently in use for this have previously been
agreed with the World Bank’s Board of Executive Directors (World Bank, 2000).
Multiple users, ranging from policy makers, the business community, media, and
students, have become familiar with the Bank’s datasets and income classification. Over time it
has become part of the development discourse, and academia and the news media frequently find
it a useful benchmark to analyze development trends. The classification is used by other
international organizations and bilateral aid agencies for both analytical and operational
purposes. Some use it to inform decisions regarding resource allocation; governments in Europe
and the United States have used the classification for setting rules regarding preferential trade
1 WorldBankOperationalPolicies,OP3.10.

3
access to countries; while some governments have used the classification to set aspirational
targets, such as achieving the next classification “status” by a certain time period. As Martin
Ravallion (2012) notes: “the attention that these classifications get is not just from ‘analytic
users’. They have huge influence.”
Since the present classification system was first introduced 25 years ago there has been
significant change in the global economic landscape. As real incomes have risen, the number of
countries in the low income grouping has fallen. According to the FY16 classification, there are
now just 31 low income countries (Figure 1). On the other end of the spectrum, the number of
high income countries is 80. In fact, as more countries have transitioned to middle income status,
more people are now living below the Bank’s international extreme poverty line in middle
income countries than in low income countries. The shift has been sweeping: in 1990, virtually
all (an estimated 94 percent) of the world’s extreme poor lived in countries classified as low
income; by 2008 about 74 percent of the world’s extreme poor lived in middle income countries
(Ravallion, 2012; Kanbur and Sumner, 2012). This phenomenon has been referred to as the “new
geography of global poverty” (Kanbur and Sumner, 2012).
Figure1.Numberofcountriesineachclassificationgroup,FY89‒FY16
Source: http://siteresources.worldbank.org/DATASTATISTICS/Resources/OGHIST.xls, accessed November 20, 2015.
49 Low31
46
Lower middle
51
27
Upper middle
53
41
High 80
FY89 FY16

4
Commentators and users have highlighted a number of methodological issues with the
income classification system; for example, Ravallion (2012) and Nielsen (2011) probe the
rationale for setting the threshold levels. Concerns have also been raised about the use of
adjusted market exchange rates to convert GNI into US dollars, as compared with, for instance,
purchasing power parity conversion factors (World Bank, 2000; Henderson, 2015). Keeping the
threshold “fixed” in real terms entails making an adjustment for inflation over time, and the
appropriateness of using the deflator for this purpose—based on the currencies in the IMF
(International Monetary Fund) Special Drawing Rights (SDR) and calculated as a weighted
average of the GDP (gross domestic product) deflators of Japan, the UK, the US, and the Euro
Area—has been questioned on grounds of theory (based on interviews with experts) as well as
relevance (e.g., Kenny, 2011; Sumner, 2012).
The concerns of researchers and commentators are often compounded because of the
classification’s “operational” use outside of the World Bank context. For example, several
donors continue to make aid allocation decisions on the basis of the income classification
(Kanbur and Sumner, 2012; Ravallion, 2012; Sumner, 2012). Consequently, some have argued
for a classification based on alternative measures incorporating poverty and distributional
concerns more explicitly. Ravallion (2009) suggests considering classifications by examining
countries’ internal capacities for redistribution (through taxes) in favor of their poorest citizens.
Similarly, Ceriani and Verme (2014) argue the necessity of understanding whether “a society has
the monetary capacity to reduce its own poverty.” Others have proposed methods of capturing
the multidimensional nature of development to develop country classifications (e.g., Sumner and
Vázquez, 2014; Nielsen, 2011). The recent World Bank Group Strategy (World Bank, 2014) also
recognized that a different approach is needed, stating “As the traditional grouping of developing
countries into income categories becomes less relevant, more attention is needed to the multiple
facets and fragility across the development spectrum.”
This paper attempts to review key issues and challenges confronting the current analytical
income classification system against the backdrop of an evolving global economy and the
requirements of users. It focuses on the benefits and weaknesses of the current GNI-based
method, including alternatives for converting GNI to a common currency for comparison
purposes. The paper also discusses the methodologies used for updating income thresholds over

5
time. Finally, this paper reviews several proposals for using alternate thresholds for income
categories based on the current GNI per capita indicator. It also cites alternative methods of
classification based on other variables, such as poverty levels or multidimensional indices.
The paper reflects information gathered during interviews and discussions with a number
of key internal users of the current system, such as chief economists and selected directors and
managers. It incorporates existing literature, including papers prepared for the Board of
Executive Directors on the operational guidelines, and views of external users gathered through
various channels, including blog posts and online discussions.
2. Mainfindings
The paper finds that per capita GNI continues to be a readily available and reasonable measure
for the purpose of classifying countries for analytical purposes. It correlates well, especially in
terms of rankings, with a number of accepted indicators of development outcomes.
Consequently, the income classification is widely used within and outside the World Bank for
comparing attributes between groups of countries.
While local currency conversion factors based on purchasing power parities (PPP) are
preferable to the use of market exchange rates for comparing per capita GNI using a common
numeraire, the lack of consistent annual time-series estimates from the International Comparison
Program (ICP) limits their use for the annual classification of economies. Had they been used,
the classification would likely be subject to substantial revision when new benchmarks are
published, which is not a desirable feature of such a system.
A known shortcoming with the use of market exchange rates is instability from one year
to the next, and this can also introduce undesirable volatility in the classification system. The
current method employed to mitigate this is known as the “Atlas” method, since it was first used
in the World Bank’s Atlas of Global Development publication. It uses an average of three
exchange rates: the current year, and the previous two years inflated to current year prices. We
find that the method is effective in achieving its objective of reducing volatility of the income
classification.
6
The Atlas method uses the ratio of international inflation, measured by a deflator based
on the economies in the IMF (International Monetary Fund) Special Drawing Rights2 (the “SDR
deflator”3), to the national GDP deflator for the economy in question. The SDR deflator replaced
the United States GDP deflator in the Atlas method calculations in 1994 (World Bank, 1994).
However, GNI per capita estimates are presented in US dollars, and this paper argues that a
return to the use of a measure of US inflation, in place of the SDR deflator, should be
considered.
Similarly, we argue that a change to the methodology for maintaining the value of the
thresholds in constant prices should be considered. As the thresholds and GNI per capita
estimates are presented in US dollars, it is unclear whether “international” inflation, as reflected
by the SDR deflator, is the optimal adjustment factor. An attractive option is to use a measure of
US inflation, as originally used in the World Bank’s operational guidelines.
The paper finds widely differing views on appropriate threshold levels for the income
categories, which largely depend on the intended purpose. Of the several options for
reclassifying the current income categories, Ravallion’s (2009) work suggesting linking low
income status to the internal capacity of countries to eliminate extreme poverty is perhaps most
frequently cited. Another option would be to more closely align the income classification with
the World Bank’s operational classification of countries, which categorizes its borrowing
countries according to their lending eligibility: IDA, IBRD, and Blend. Classifying economies
based on the relative rankings of GNI per capita has also been reviewed in the paper – for
instance, using cutoffs based on inter-quartile ranges. Still other works propose using non-
income dimensions for classification purposes.
While attractive from an analytical viewpoint, we argue that some of these methods
would be difficult to apply to many of the current uses. There are also pragmatic considerations
of moving to a new classification system: for instance, countries would be reclassified based on a
change of method, rather than as a result of economic growth. This suggests that any major
2 ForanexplanationofSpecialDrawingRights,seewww.imf.org/external/np/exr/facts/sdr.htm.3 ForadescriptionoftheSDRdeflator,seehttps://datahelpdesk.worldbank.org/knowledgebase/articles/378829‐what‐is‐the‐sdr‐deflator.

7
change to the classification methodology should be introduced gradually and carefully, perhaps
with overlapping systems for the first few years following any adjustment.
3. Aprimeronthecurrentsystem
The Development Economics and Data Group (DECDG) of the World Bank is responsible for
updating the Bank’s operational guidelines4 each year, and the income classification is derived
from the resulting dataset. The exercise involves gathering data from several sources to calculate
preliminary GNI and population estimates for the previous calendar year. For most borrowing
countries, the designated country economist provides national accounts aggregates from primary
country sources around March; data for high income economies are obtained from the
Organisation for Economic Co-operation and Development (OECD) and Eurostat. Population
estimates are made by DECDG’s demographer using the UN Population Division’s biennial
World Population Prospects, with appropriate adjustments where necessary to estimate resident,
rather than de facto, population numbers—so that they have a comparable basis to GNI. GDP
deflators for the previous two years (for calculating the SDR deflator) are obtained from Eurostat
and the IMF, and annual average exchange rates are obtained from the IMF.
The thresholds for both the operational guidelines and the income classification are
maintained in current prices using a weighted average GDP deflator, based on the currencies in
the IMF Special Drawing Rights: the SDR deflator. Countries are classified against these
thresholds using the most recent GNI per capita estimates, valued in US dollars using currency
conversion factors calculated by the Atlas method: this uses a three-year moving average,
adjusted by national inflation relative to the SDR deflator, to reduce the effect of exchange rate
instability.
The GNI per capita estimates for each country are circulated to the Bank’s regional chief
economists for review, and updates to the thresholds are approved by DECDG management: this
process provides separation between the data collection process and their end use for operational
purposes.
4 WorldBankOperationalPolicy3.10.

8
The GNI per capita estimates and the updated operational thresholds are circulated to the
Board of Executive Directors prior to the end of the financial year, so that these operational
guidelines may be used in operational decision-making in the following financial year. The
income classification is published at the beginning of the financial year, as close to July 1 as
practical.
There is a broad misconception among both Bank staff and external users about the
relationship between the income classification and the Bank’s operational guidelines. In the
minds of many, low income countries equate to countries eligible to borrow from the
International Development Association (IDA), and middle income countries equate to countries
eligible to borrow from the International Bank for Reconstruction and Development (IBRD).
This is not the case, because the threshold levels are different. Furthermore, GNI per capita is
only one of several factors taken into account when determining access to World Bank lending
windows and terms. In the case of IDA, an eligibility threshold guides access to concessional
resources (for FY16, the threshold is GNI per capita US$1,215), but the major determinant is
country creditworthiness. Similarly, while surpassing the IBRD threshold (which is not the same
as the high income threshold) informs decisions about a borrower’s graduation from IBRD,
factors such as the institutional capacity of the country and its credit rating are also considered.
The difference between the two systems is illustrated in Table 1. For example, for FY16,
just 30 of the 77 countries eligible for IDA financing were low income, with the remaining 47
countries classified as middle income. 13 countries classified as high income were still eligible
for IBRD lending.
Table1:NumberofcountrieseligibleforWorldBanklendingandtheirincomeclassification,
forFY16
IDA Blend IBRD Not eligible Total
Low income 29 1 0 1 31
Lower middle income 26 12 12 1 51
Upper middle income 4 5 42 2 53
High income ‐ ‐ 13 67 80
Total 59 18 67 71 215
Source: http://siteresources.worldbank.org/DATASTATISTICS/Resources/CLASS.XLS, accessed November 20, 2015.
9
With regard to the income classification, the low income threshold corresponds to the
procurement related “civil works preference” 5 operational guideline for IDA countries; it was
introduced in the first World Development Indicators, then the statistical annex to the World
Development Report (World Bank, 1978). For FY16, it was set at US$1,045, below the IDA
eligibility threshold of $1,215. The lower middle income threshold is based on the operational
guidelines cutoff for determining access to 17-year IBRD repayment terms (although these terms
are no longer available), and appears to have first been introduced in the 1983 edition of World
Development Indicators (World Bank, 1983c). The high income threshold does not relate to a
cutoff derived from the operational guidelines, but was set at a GNI per capita of US$6,000 in
1987 prices in a paper presented to the Board of Executive Directors in January 1989 (World
Bank, 1989), which also reconfirmed the low and lower middle income threshold levels. The
choice of the high income threshold was made to address anomalies in the classification of high
income and industrialized economies used in World Development Indicators prior to that point.
A few rules are applied regarding rounding, data collection, and revision management.
First, the GNI per capita estimates are rounded so that they end with 0, and the threshold values
are rounded so that they end with a 5: this is done for the practical reason of avoiding ties. The
threshold values, rounded as just described, are the basis on which the thresholds, applicable for
the forthcoming year, are then updated: that is, adjusted for the impact of inflation. Second, to
provide consistency for users, the groupings for the analytical classification are set on July 1 of
each year and are not revised until the following July, even if there are revisions to GNI or
population estimates. Third, countries are reclassified into a higher or lower group once their
GNI per capita crosses any of the three thresholds; there is no “settling” period, unlike the
operational guidelines. Fourth, the current income classifications are applied to historical series
in the World Development Indicators database. That means that historical data aggregates reflect
the country classification groupings in force at the time of the latest database update; while this
occasionally confuses some users, since it means that aggregates for past years are subject to
revision, it is not clear whether there is any other workable alternative.
5 Thesearecountrieswithanincomelevelbelowwhichcivilworkscanbeawardedtoeligibledomesticcontractorsforbidsprocuredunderacompetitive,internationalbiddingprocess.
10
4. Usesoftheclassificationanditsfitnessforpurpose
World Bank staff use the analytical country classification extensively to report levels, trends, and
other characteristics of member countries. For instance, the 2013 World Bank Group Strategy
uses the classification to analyze the global context in which the Bank is now operating (World
Bank, 2013). Using coherent, consistent and well-defined country groupings for such purposes
seems to make sense, especially at regional and Bank-wide levels; for instance, it would be very
confusing if every Bank report and press release used different, ad hoc groupings.
The classification is also widely used by researchers and analysts external to the Bank for
grouping and characterizing countries and reporting summary statistics. Over time, the
classification has become part of the development “landscape.” Commentators talk, for example,
of the policy implications for countries that “graduate” from middle to high income status or
from low to middle income status. There has been talk of the “middle income” trap6 (Im and
Rosenblatt, 2013).
The classification has also been put to uses beyond the analytical purpose for which it
was conceived, and in some instances these extend to resource allocation: examples include the
European Commission, the Global Fund to fight AIDS, Tuberculosis, and Malaria, and the
Millennium Challenge Corporation. It has become commonly used to categorize the world into
“developing” (i.e., low and middle income) and “developed” countries (i.e., high income). For
instance, the OECD’s Development Assistance Committee (DAC) uses the income classification
to distinguish two groups of countries (OECD, 2015): the “developed countries”7 and
“developing countries”: the latter are potential recipients of Official Development Assistance
(ODA). The OECD also uses the analytical income classification for its arrangement on
Officially Supported Export Credits: the lower middle income threshold is the cutoff line
between countries that are eligible for tied aid credits and those that are not (OECD, 2014b). The
US government also uses the Bank’s classification in setting trade policy. For example, the US
Trade Act of 1974 provides that the President would remove “high income” countries as
6 See,forexample,www.economist.com/blogs/graphicdetail/2012/03/focus‐3.7 Essentiallyhighincomecountries,plusG8members,EUmembers,andcountrieswithafirmdateofentryintotheEU.

11
classified by the World Bank from the list of countries benefiting from the US Generalized
System of Preferences (GSP) schemes that grant preferential duties access.
A further use of the classification is for setting and monitoring policy targets. A number
of countries, for example, use the “graduation” from one grouping to the next as a mechanism for
setting a time-bound policy target. For example, the Government of Ghana set a goal of reaching
middle income status by 2015, while the Government of Bangladesh adopted the goal of
transitioning to a middle income country by 2021 under its “Vision 2021” plan (Gimenez,
Jolliffe, and Sharif, 2014).
A number of users within the World Bank were interviewed to obtain their views on the
classification, focusing on whether (and why) there is a need to change or introduce
modifications to the Bank’s current classifications and to establish what issues are relevant for
different regions. The views of commentators and users outside the Bank have been obtained
through blogs and other online discussions, and the team has reviewed a number of papers.
Issues and concerns raised by external users are similar to those of many World Bank staff.
Figure2.Populationineachincomegroup,latestyearofdataavailabilityduringeachfiscal
year(FY00–FY16),millions
Source: World Development Indicators database (accessed November 30, 2015), and print editions 2000 to 2015.
3,536
622
886
2,880
588
2,361
886
1,399
1998 2014
Low
High
Upper middle
Lower middle

12
One criticism of the current income classification is that the thresholds are dated and
somewhat arbitrary. Some feel that it is a less relevant classification now than in the past since
the majority of the world’s extreme poor now live in countries classified as middle income (e.g.,
Kanbur and Sumner, 2012; Ravallion, 2012). Indeed, over 70 percent of the world’s total
population—some 5 billion people—lived in countries classified as middle income in FY16; less
than 10 percent lived in low income countries (see Figure 2). However, Table 2 shows that the
estimated incidence of extreme poverty is considerably higher among low income countries as a
whole (47.2%), compared with lower middle countries (18.7%) or upper middle income
countries (5.4%).
Table2.Extremelypoorpopulationineachincomegroup,2012
Extreme poverty headcount
(% living below US$ 1.90 a day at 2011 PPP)
Share of population (%)
Share of extremely poor population (%)
Low 47.2 8.3 30.1
Lower middle 18.7 39.4 56.3
Upper middle 5.4 32.8 13.6
High 0.0 19.5 0.0
World 12.7 100.0 100.0
Source: World Development Indicators and PovcalNet, accessed on December 8, 2015.
The use of market exchange rates for converting GNI to a common currency is also felt to
be sub-optimal. The common suggestion is to use purchasing power parities (PPP); some argued
that, at least for a period of time, there is a need for both a PPP and US dollar based GNI per
capita classification.
Users also voiced concerns about the volatility of the classification—in other words, an
undesirable characteristic of a country classification system is that reclassifications occur too
frequently. Suggestions to address this were put forward, including restricting classification
changes until a country has been in the new category for a fixed time period, or above a set
percentage of the threshold, or the use of moving averages of the GNI per capita estimates. There
were also proposals for the publication of aggregates with a much closer link to the Bank’s
operational activities. For example, measures could be based on fragile and conflict-affected

13
states (FCS) and non-FCS states, or IDA-eligible and IBRD-eligible countries. Such a
classification is certainly attractive and simple, though it should be noted that analytical
presentations of statistics based on these groupings are readily available in World Development
Indicators and in other World Bank databases.
Another widely expressed concern was that thresholds are absolute figures remaining
constant in real terms. As a result, if average world income continues to increase along current
trends, the high income country threshold will eventually fall below the average world income
level. Figure 3 shows the income thresholds and the average world GNI per capita from 1990 to
2013. Some users hold the opposite view, however, arguing that the absolute nature of the
thresholds is useful for tracking progress over time. But even then some commentators (e.g.,
Ravallion, 2012) feel that the threshold levels need updating to reflect the changing world,
similar to the need to update poverty lines to reflect changing standards of living and societal
preferences.
Figure3.IncomeclassificationthresholdsandaverageworldGNIpercapita(currentUS$,
Atlasmethod,logscale)
Source: http://siteresources.worldbank.org/DATASTATISTICS/Resources/OGHIST.xls, and World Development Indicators, accessed November 30, 2015 (NY.GNP.PCAP.CD)
7,620
Upper middle/high threshold
12,735
4,187
World average
10,779
2,465 Lower‐middle/upper‐middle threshold
4,125
610 Low/lower‐middle
threshold
1,045
1990 2014

14
Some suggest that the current methodology to maintain a fixed threshold in real terms
over time (i.e., adjusting for inflation using the SDR deflator) is inappropriate and unclear (e.g.,
Ravallion, 2012; Sumner, 2012). Options for alternative deflators include narrower measures,
such as a measure of US inflation (since GNI per capita comparisons are presented with the US
dollar as the common numeraire) or measures thought to be more representative of
“international” inflation, such as a measure of average world inflation, or average inflation in
G20 countries. There appears to be no clear answer to this—the initial methodology of the
operational guidelines used US inflation, but anomalous measures in the 1980s caused a change
to the broader SDR inflation measure. Other methods have also been considered and discarded in
the past, such as using average inflation measures of countries with GNI per capita values close
to the thresholds.
Some users suggest an alternative approach to adjusting thresholds is to use constant
price estimates of GNI per capita, with some specified base year. In this case, thresholds would
be set at a constant level, eliminating the need for estimating “international” inflation. While this
seems attractive, there are significant practical problems with this approach. In particular, a
reliable and timely GNI deflator is needed for all countries but is not readily available in many
cases. Another issue is that the choice of base year would be a source of volatility in the country
classification.
5. UsingGNIpercapitaforclassifyingcountries
5.1StrengthsandweaknessesoftheGNIpercapitameasure
The Bank and many other bilateral and multilateral agencies have used GNI8 as a workable and
reasonable measure of economic and institutional development for over fifty years. GNI is a
broad-based measure of income generated by a nation’s residents from international and
domestic activity: GNI per capita measures the average amount of resources available to persons
residing in a given territory. All production of goods and services, with a few exceptions, are
included as income-generating activities, irrespective of whether produced for the market, for
8 DefinedasGrossNationalProductpriortotheintroductionofthetermGrossNationalIncomeinthe1993revisionoftheSystemofNationalAccounts(SNA)(UnitedNations,1993).
15
own use, or provided to others free of charge. In particular, informal, illegal, and subsistence
activities are included. Per capita income reflects both the average economic wellbeing of a
population and its capacity to engage in international financial transactions—a measure of its
creditworthiness. GNI has been widely preferred to GDP because GDP measures income
generated in the domestic economy by both residents and non-residents. Many textbooks on
economic development make extensive use of the GNI per capita variable.
Many other international organizations use their own classification schemes based on
GDP or GNI for operational purposes. The IMF uses a hybrid measure of GDP,9 together with
other measures, to assess the financial contributions of members, their voting power, their access
to financing, and their share of general SDR allocations. The OECD determines the budget
contribution of members based on their capacity to pay, approximated by GNI (with some
modifications) converted at official exchange rates. The European Union (EU) uses GNI per
capita (with PPP conversion factors) to determine the eligibility of EU regions for fund
allocations from the Structural and Cohesion Funds, and the United Nations apportions its
expenditures to member countries based on their capacity to pay, approximated by GNI
converted at official exchange rates, except in cases of excessive fluctuations.
GNI per capita is not, of course, without weaknesses. Although it serves as a proxy for
individuals’ potential command over resources that enhance their wellbeing, it does not indicate
how well income is shared within the community. Critics of the use of average per capita GNI as
one of the criteria for determining the Bank’s lending policy—and, by association, the basis for
the analytic income classification—have focused on the fact that GNI provides only a narrow
measure of development and progress. They regard this as a key deficiency, particularly given
the Bank’s mission of eradicating poverty and increasing shared prosperity.
9 AnaveragemeasurecomputedfromGDPconvertedusingmarketexchangeratesandPPPconversionfactors,weightedat60and40percentrespectively.
16
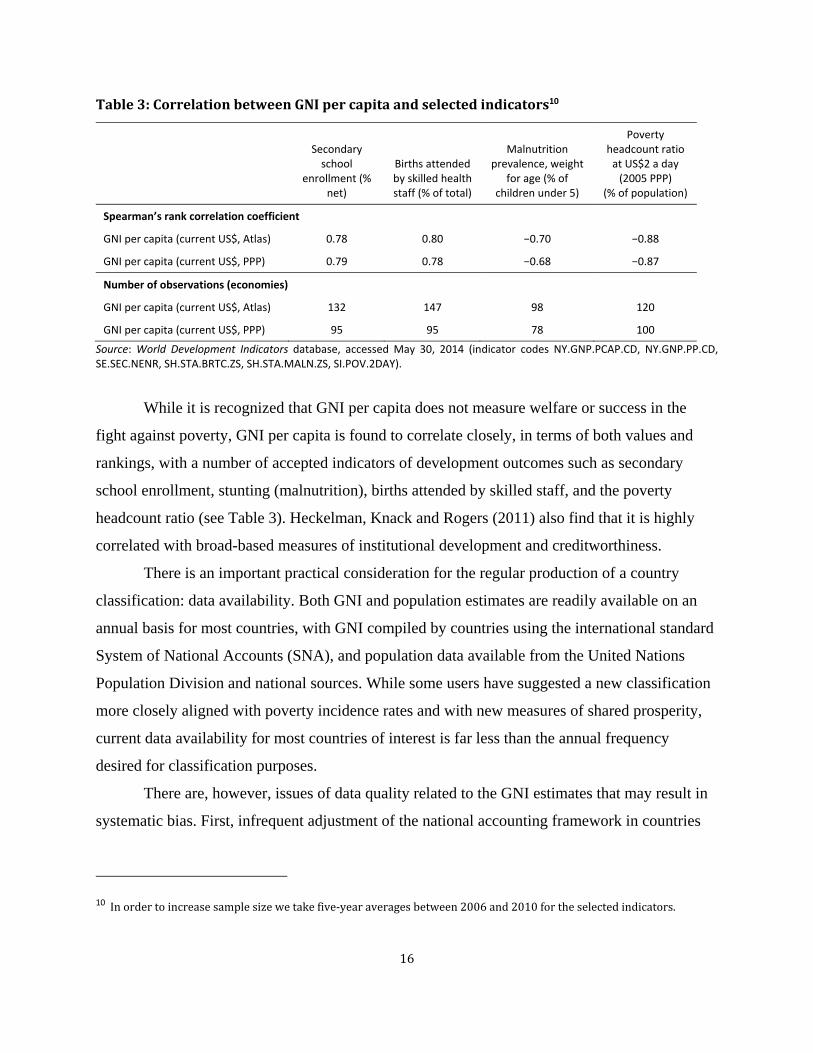
Table3:CorrelationbetweenGNIpercapitaandselectedindicators10
Secondary school
enrollment (% net)
Births attended by skilled health staff (% of total)
Malnutrition prevalence, weight
for age (% of children under 5)
Poverty headcount ratio at US$2 a day (2005 PPP)
(% of population)
Spearman’s rank correlation coefficient
GNI per capita (current US$, Atlas) 0.78 0.80 −0.70 −0.88
GNI per capita (current US$, PPP) 0.79 0.78 −0.68 −0.87
Number of observations (economies)
GNI per capita (current US$, Atlas) 132 147 98 120
GNI per capita (current US$, PPP) 95 95 78 100
Source: World Development Indicators database, accessed May 30, 2014 (indicator codes NY.GNP.PCAP.CD, NY.GNP.PP.CD, SE.SEC.NENR, SH.STA.BRTC.ZS, SH.STA.MALN.ZS, SI.POV.2DAY).
While it is recognized that GNI per capita does not measure welfare or success in the
fight against poverty, GNI per capita is found to correlate closely, in terms of both values and
rankings, with a number of accepted indicators of development outcomes such as secondary
school enrollment, stunting (malnutrition), births attended by skilled staff, and the poverty
headcount ratio (see Table 3). Heckelman, Knack and Rogers (2011) also find that it is highly
correlated with broad-based measures of institutional development and creditworthiness.
There is an important practical consideration for the regular production of a country
classification: data availability. Both GNI and population estimates are readily available on an
annual basis for most countries, with GNI compiled by countries using the international standard
System of National Accounts (SNA), and population data available from the United Nations
Population Division and national sources. While some users have suggested a new classification
more closely aligned with poverty incidence rates and with new measures of shared prosperity,
current data availability for most countries of interest is far less than the annual frequency
desired for classification purposes.
There are, however, issues of data quality related to the GNI estimates that may result in
systematic bias. First, infrequent adjustment of the national accounting framework in countries
10Inordertoincreasesamplesizewetakefive‐yearaveragesbetween2006and2010fortheselectedindicators.

17
undergoing rapid structural change may affect data quality. Second, the measurement of
informal, illegal and subsistence activities is often very approximate in poor countries, but is
likely to be a relatively larger share of GNI than in higher income countries. Third, countries
with weaker statistical systems may also lack adequate data sources and estimation methods for
accurately measuring formal activities; business registers—a fundamental tool for conducting a
sample survey of businesses—may be incomplete and outdated, and survey response rates may
be poor. It is possible that, in some countries, under-estimation of formal activities may be as
large as under-estimation of informal activities (Jerven, 2013).
Non-market production is another potential source of systematic biases in income figures.
Market equivalent prices generally do not exist for measuring the value of most non-market
production, such as government services, own-account production, and the output of non-profit
institutions, and the value of non-market output, by convention, is proxied by production costs
(wages, intermediate consumption, consumption of fixed capital) without adjustments for
productivity or the full cost of use of capital. Because government sector productivity levels
likely vary systematically among countries at different income levels, this may result in a
systematic bias in income measures: an overvaluation in low income countries with low
government productivity levels relative to higher income countries with more robust government
productivity levels. This effect is, however, likely smaller than the effect of under-coverage of
other activities in poorer countries (World Bank, 1989).
A question of the viability of international comparability may arise from the use by
countries of different vintages of international standards for the System of National Accounts
(SNA).11 However, this is believed to be a relatively minor issue, compared with the lack of
adequate data sources and estimation methods for data compilation, especially in poor countries
where statistical capacity is often weakest. Countries are constantly working to increase their
statistical capacity and improve their national accounts estimates, and new source data and
improved methodologies have led to revisions to previous estimates of production and income.
China, for example, increased its estimate of nominal GDP (and GNI) by 17 percent in 2006
11Thecurrentstandardisthe2008versionoftheSystemofNationalAccounts(UnitedNations,2008),althoughmanylowandmiddleincomecountriesusethe1993,1968oreventhe1953versions.

18
based on data from the first national economic census for 2005. Ghana increased its estimate of
nominal GDP for 2006 by around 60 percent in 2010, partly as a result of re-basing its volume
estimates. Nigeria released re-based estimates in 2014, resulting in new estimates of its GDP for
2012 that are above that of South Africa.
To be useful for classification purposes, GNI per capita estimates must be converted into
a common currency so that they can be compared on the same basis. The current analytical
country classification system, and the related operational guidelines, uses the US dollar as the
common currency or numeraire. Conversion factors are estimated from market exchange rates,
adjusted to lessen the impact of any large transitory changes. A clear advantage of using market
exchange rates compared with purchasing power parity exchange rates is that they are readily
available on an annual basis for almost all countries (this issue is discussed further in section
5.3).
5.2ReducingVolatilityoftheGNImeasure:TheAtlasMethod
The Atlas method is designed to smooth the effects of short-term transitory changes in exchange
rates which introduce undesirable volatility into the classification system. The Atlas conversion
factor for any year is the average of a country’s exchange rate for that year and its exchange rates
for the two preceding years, adjusted for the difference between the rate of inflation in the
country and international inflation.12 Consistent with the threshold adjustment, international
inflation is estimated using the SDR deflator, which is itself compiled as a weighted average of
the inflation in the Euro Area, Japan, the UK, and the US (the SDR deflator is discussed in
section 6 of this paper). The current methodology was introduced in 1984 following discussion
by Executive Directors of a report prepared by the Economic Analysis and Projections
Department, in consultation with a panel of experts (World Bank, 1983b).
There have been criticisms of the Atlas method and its theoretical underpinnings, but
nonetheless the weighted three-year moving average is effective in achieving its aim of
smoothing the series. The smoothing effect is achieved in two ways: the use of the moving
12Formoredetails,seehttps://datahelpdesk.worldbank.org/knowledgebase/articles/378832‐what‐is‐the‐world‐bank‐atlas‐method.

19
average, and the choice of weighting: an unweighted average would smooth the series but would
“center” the average exchange rate on the middle value of the three. The weights aim to center
the average on the latest point of the three—they are the ratio of price inflation rates between
each point and the latest point, derived from assumption that if prices rise faster in country A
than in the US, the exchange rate between A and the US will adjust accordingly—all other
factors being equal.
However, some degree of volatility still remains: a few countries that moved up the
income categories fell back within two to three years (Table 4). The number of countries affected
by this “round-tripping” is relatively small, and some of this may be unavoidable, particularly
when it reflects political change, economic shocks, or conflict. Still, changes resulting purely
from large but short-term changes in exchange rates should be minimized; even though a
relatively rare occurrence, it can draw sharp criticism when it occurs, especially when the
resource allocation decisions of development partners are impacted.
Table4:“Volatile”changesintheincomeclassificationbetweenFY02andFY16
World Bank fiscal year 02 03 04 05 06 07 08 09 10 11 12 13 14 15 16
Calendar year of data 00 01 02 03 04 05 06 07 08 09 10 11 12 13 14
Albania LM LM LM LM LM LM LM LM LM UM UM LM UM UM UM
Antigua and Barbuda UM UM H UM UM H H H H UM UM UM H H H
Barbados H UM H UM UM UM H H H H H H H H H
Equatorial Guinea LM L L L UM UM UM H H H H H H H H
Fiji LM LM LM LM LM LM LM UM UM UM LM LM UM UM UM
Hungary UM UM UM UM UM UM UM H H H H H UM UM H
Latvia LM UM UM UM UM UM UM UM UM H UM UM H H H
Malta H UM H H H H H H H H H H H H H
Mauritania L L L L L L L L L L LM L LM LM LM
Solomon Islands L L L L L L L L LM L LM LM LM LM LM
South Sudan .. .. .. .. .. .. .. .. .. .. .. LM L LM L
Turkey UM LM LM LM UM UM UM UM UM UM UM UM UM UM UM
Countries are included in this list if they returned to a classification they had previously held during the fifteen year period between FY02 and FY16 for three years or less; H=high, UM=upper middle, LM=lower middle, L=low.
Source: http://siteresources.worldbank.org/DATASTATISTICS/Resources/OGHIST.xls, accessed November 30, 2016
One option for changing current practice would be to use a “buffer” around the threshold
to help minimize any volatility. So, for example, a country might only be reclassified if it has

20
been consistently above a threshold for three years; or, if a country exceeds the threshold by X
percent; or a combination. The advantages of either system are that they provide a clear early
warning of a likely change, but of course they also introduce a lag in reclassification. Such a
system already exists in the operational guidelines, based on a three-year period.
Other options have been proposed to manage exchange rate volatility. One is to use
longer averaging periods. At some point prior to 1983, for example, the Atlas method used a
seven-year average. But a three-year period was felt to offer the best compromise between
sensitivity to change and smoothing (World Bank, 1983). This still appears to be the case, and
overall there does not seem to be a compelling reason to change current practice.
It should also be noted that GNI per capita estimates can be affected by revisions in the
estimate of both GNI and the total resident population, caused, for example, by new data from
economic and population surveys and censuses, or other sources.
5.3MarketexchangeratesversusPurchasingPowerParity(PPP)conversionfactors
Another well-known issue concerns the conceptual underpinning of the use of market exchange
rates as conversion factors. What one US dollar buys in the United States does not necessarily
correspond to the amount of goods and services that one US dollar would buy in another country,
when converted to that country’s national currency. The implication is that, while the use of
exchange rates may be useful for some purposes—such as measuring countries’ relative
spending power on the world market—they are not the most appropriate choice for the
international comparison of income; they do not fully adjust for the differences in price levels
between countries and therefore do not provide a measure of the relative sizes of the volume of
goods and services they produce. Furthermore, exchange rate based conversions are likely to
result in a systematic downward bias in the measurement of the GNI or GDP of lower income
countries, since they tend to have relatively lower wages than more developed economies, and
thus lower prices on their non-traded goods and services. For that reason, the GNI (and GDP) of
lower income countries will typically be under-estimated when exchange rates are used to
compare their value with those of high income countries.
The solution to this problem is also well known and has been proposed in many previous
discussions about the use of GNI per capita: the alternative conversion factor that addresses some

21
of the weaknesses in the use of exchange rates is one based on purchasing power parities (PPPs).
A PPP is the number of units of a national currency needed to purchase the same amount of
goods and services as a reference currency unit (for example, the US dollar) would buy in the
reference country. PPPs allow more meaningful comparisons to be made across countries for
many indicators—but they are not appropriate for some purposes. For example, international
trade, capital flows, and the values of foreign debt must be measured at market exchange rates.
Still, it seems clear that PPPs are the appropriate conversion factor for country classification
purposes, compared with market exchange rates.
The major constraint to the use of PPPs has been the availability of regular and reliable
time-series estimates for all countries of interest. This issue has been repeatedly discussed by
World Bank Executive Directors (for example, World Bank, 1989, 1994 and 2000) but the
consistent conclusion has been that the coverage and quality of annual PPP data (rather than the
PPP estimates produced at each benchmark year) are not sufficiently robust for operational use.
The international statistical community has undertaken substantial work in recent years to
improve the quality of PPPs, especially in the 2005 and the more recent 2011 benchmark rounds
of the International Comparison Program (ICP). The number of countries participating in the ICP
has increased over time, and price collection procedures, valuation, and computation methods
have all improved substantially.
Despite the improvements, difficulties with using PPP conversion factors for the annual
classification of economies remain, because the ICP produces data for benchmark years only.
This means that the classification system would have to rely on extrapolated or modeled annual
estimates, using proxy measures. While extrapolated estimates are produced and published in
World Development Indicators, each benchmark round so far, including the latest results from
the 2011 round, has resulted in substantial revisions to this series. In turn, this would have likely
resulted in substantial revisions to the classification of countries, which would be both difficult
to explain to users and provide another source of classification volatility.
Possible solutions are to improve extrapolation and interpolation methodologies, or for
the ICP to collect prices in years between benchmarks and publish annual estimates of PPPs.
Another approach could be to restrict changes in country classification to benchmark years only.
While this latter proposal would potentially strengthen the basis for comparison between

22
countries, it risks making the classification substantially less useful to users. More importantly, it
is unlikely to be found acceptable for operational purposes, thereby leading to an income
classification that departs significantly from the operational guidelines.
One pragmatic approach is to use a hybrid based on an average of the two conversion
factors: adjusted market exchange rates and PPPs. This would reduce the impact on the
classification of switching to a PPP-based method, and—depending on the use to which the
classification is put—there may be some justification for maintaining exchange rates in the
formula. For example, market exchange rates provide a better measure of a country’s ability to
service its international obligations and may, therefore, better reflect its creditworthiness. But
there are several disadvantages, including that the PPP-based method would still need to use
annual estimates based on extrapolation from benchmark years, it would still be subject to
substantial periodic revision, and any method of combining the two series may be seen as an
arbitrary choice.
It is also worth noting that the ranking of countries using either conversion method is
very similar. Using data for 2010 (extracted from World Development Indicators on May 30,
2014), the rank correlation coefficient is 0.99. And, as noted earlier, correlations between
selected social indicators and GNI per capita using either market exchange rates or PPPs are
relatively high.
The discussion leads us to the conclusion that market exchange rates, with appropriate
adjustments to mitigate the impact of short-term volatility, continue to provide a reasonable and
practical basis for preparing comparable GNI per capita estimates for use in classifying
countries. We also conclude that the use of PPPs should be considered only when consistent
annual estimates of PPPs are produced by the ICP.
6. Adjustingclassification“cutoffs”overtime
The initial choice of the three threshold levels used in the income classification appears to have
been made largely on pragmatic grounds. The cutoffs for defining the low and lower middle
income thresholds were already in use in the World Bank’s operational guidelines process (for
determining eligibility to “civil works preference” in IDA and “17 year terms” for IBRD) and the
choice of high income threshold was made to rationalize the existing groupings of high income

23
countries (World Bank, 1989). In any case, the result has been groupings that have contained
sufficiently large numbers of countries to be analytically useful. The chosen levels have
occasionally been hotly debated, but it is likely that this would occur in any case, regardless of
the conceptual underpinning.
An equally important discussion as the original choice of threshold levels is the manner
in which they should be adjusted over time. The underlying objective has been to maintain their
value in constant prices, so a method has been needed to account for inflation. Initially, the
thresholds used in the operational guidelines were updated using the US GNP deflator, but this
was changed to the SDR deflator, beginning with the 1982 data (World Bank, 1983b). The
analytical income classification follows the same methodology and uses the SDR deflator to
maintain the thresholds constant in real terms. One way to think of this is to suppose that
thresholds are really set in terms of SDRs, but converted to US dollars for presentation purposes.
Is the SDR deflator is an appropriate measure of inflation in the context of updating the
thresholds? Other choices have certainly been considered. For example, the same methodology
paper that resulted in the use of the SDR deflator (World Bank, 1983b) also proposed that a more
appropriate measure would be the average inflation of countries close to each threshold.
The SDR deflator is essentially a measure of the average inflation (measured by the GNP
deflator) of the countries whose currencies make up the SDR: the Euro Area, the US, the UK,
and Japan. The SDR deflator is calculated by weighting the inflation rates of the countries that
contribute to the SDR basket of currencies according to their weight in the SDR;13 the IMF
calculates the value of the SDR for a five-year period (Table 5).
13Seehttps://datahelpdesk.worldbank.org/knowledgebase/articles/378829‐what‐is‐the‐sdr‐deflator.

24
Table5:SDRweights(1986‒1990and2010‒2014)
Currency 1986‒1990 2010‒2014
Euro14 0.310 0.374
Pound sterling 0.120 0.113
US dollar 0.410 0.419
Yen 0.120 0.094
Source: International Monetary Fund, staff calculations.
One clear feature of the threshold levels is that they have declined relative to average
world GNI per capita (current US$, Atlas). This is of course expected, since the thresholds are
adjusted for inflation only, and not for economic growth. One question is whether the decline has
been at an appropriate pace.
Table 6 provides some additional analysis of the thresholds relative to average world GNI
per capita (Figure 3 also illustrates the same trends). The low/middle income threshold to world
GNI per capita declined from 16 percent in 1982 to 10 percent in 2014, while the lower
middle/upper middle threshold to the world average fell from 65 percent to 38 percent. Another
way to illustrate the trend is that if the ratio of the threshold for low income countries to world
GNI per capita in 2014 had remained at its 1997 (fiscal year 1999) level (that is, about 14
percent), the threshold for FY16 (2014 data) would have been around US$1,500 rather than
US$1,045. As a result, about 12 countries classified in the lower middle income category would
have remained in the low income category.
14PriortotheintroductionoftheEuroonJanuary1,1999,theDeutschemarkandFrenchfrancwererepresentedinthebasket;theirrelativeshareswere0.19and0.12,respectively.

25
Table6:DeclineinthresholdsrelativetoworldGNIpercapita(currentUS$,Atlasmethod),
FY84‒FY16
Bank fiscal year 1978 1984 1989 1999 2009 2016
Calendar year of data 1976 1982 1987 1997 2007 2014
Upper bound thresholds for income groupings, GNI per capita
Low 250 410 480 785 935 1,045
Lower middle .. 1,670 1,940 3,125 3,705 4,125
Upper middle .. .. 6,000 9,655 11,455 12,735
World GNI per capita 1,623 2,567 3,290 5,491 8,294 10,779
Ratio of threshold to World GNI per capita
Low 0.15 0.16 0.15 0.14 0.11 0.10
Lower middle .. 0.65 0.59 0.57 0.45 0.38
Upper middle .. .. 1.82 1.76 1.38 1.18
Source: http://siteresources.worldbank.org/DATASTATISTICS/Resources/OGHIST.xls, World Bank (1978), and World
Development Indicators, accessed November 30, 2015 (series NY.GNP.PCAP.CD)
In recent years, inflation rates in many countries have tended to be higher than in those
countries included in the SDR. It can perhaps be argued that the inflation adjustment factor (that
is, the SDR deflator) does not fully reflect inflation experienced by low and middle income
countries, resulting in thresholds that are too low and push countries into higher income groups
prematurely. For instance, between 2000 and 2011, the adjustment applied to the thresholds on
the basis of the SDR deflator was 36 percent. During the same period the change in the G20
GDP deflator was about 57 percent (in US dollar terms), while the comparable US dollar GDP
deflator for the world increased 60 percent.
Furthermore, when the SDR deflator was first used for the operational guidelines in 1983,
the economies represented in the SDR made up 56 percent of world GNI (using exchange rates
as conversion factors). By 2012 their share had fallen to 51 percent, and the trend has been
downward.15 The decline would likely be sharper if the SDR basket had not been expanded to
include the Euro in 1999. In other words, the countries used to calculate the SDR deflator have
15Source:WorldDevelopmentIndicators,accessedMay30,2014(seriesNY.GNP.MKTP.CD).

26
become less representative of the global economy than when the SDR deflator was first
conceived (it should be noted that the IMF has recently decided to include the Chinese
Renmimbi in the SDR currency basket).16 If a measure of international or world inflation is
considered to be the most appropriate mechanism for adjusting the thresholds, then this historical
performance might indicate that the SDR deflator may not be the most appropriate choice.
For most years, the SDR deflator in US dollars has increased and the income thresholds
have moved up. However, in a number of years, the US dollar appreciated against the SDR, and
as a result the thresholds were adjusted downward despite the fact that all countries except Japan
experienced inflation. On the other hand, increased volatility in international financial markets in
some years and periods of strong depreciation caused the SDR deflator to increase relatively
sharply. So despite the various adjustments and the three-year moving average scheme used to
reduce volatility in GNI estimates, the SDR deflator has itself introduced some unintended
volatility.
A related issue is the weight of the US dollar in the SDR deflator. Although it is
relatively large it may not reflect the significance of the US dollar in international transactions:
in 2008, for example, the currencies of more than 100 countries were linked to the US dollar
(fully dollarized, pegged, or a managed float with dollar as reference currency), and the US
dollar accounted for more than 86 percent of all foreign exchange market turnovers. In addition,
US dollar holdings make up a large share of official foreign exchange reserves (the foreign
currency deposits and bonds maintained by central banks and monetary authorities) and
international trade; the dollar continues to be widely used for invoicing and settling import and
export transactions around the world (Goldberg, 2010; Lin, Fardoust, and Rosenblatt, 2012).
Additionally, at least some element of “international inflation” is reflected in national GNI
deflators through the “pass-through” effect of prices of imported commodities as well as goods
and services. Thus, there could also be some double counting of international inflation.
There are many choices for an alternative deflator to maintain thresholds in constant
prices. For this paper, the performance of a number of candidates have been examined briefly,
16Seehttps://www.imf.org/external/np/sec/pr/2015/pr15540.htm
27
including the US GDP (or GNI) deflator, which is the most obvious candidate if the thresholds
and GNI per capita estimates are to use US dollars as their common numeraire. Other candidates
reviewed include average measures based on G20 countries, average global measures, and
measures which represent the countries close to the thresholds—as suggested in a previous
review (World Bank, 1983b). Different options for producing average measures have been used,
include commonly used simple medians, unweighted and weighted arithmetic means, and the
geometric mean. Weights can be based on relevant macroeconomic variables, such as the size of
currency reserves, the size of exports, GDP, or population size. In all, for this review, 12
different candidate deflators have been examined.
Detailed results are presented in Annex 1. Overall, World unweighted-mean and
population-weighted deflators are more sensitive to changes in lower income economies;
inflation in many lower income economies has been higher than in higher income economies in
the past few years, so these measures tend to provide a much higher measure of inflation for the
period tested than the SDR deflator. Similar results hold when using the average and median
deflators based on countries in bands close to each threshold for the low/middle and lower
middle/upper thresholds. The middle/high threshold deflator follows a similar pattern to the
SDR, US, G20 and GDP-weighted World deflators. Only very small differences are observed in
the World deflator when using weights derived from the SDR weighting method (the value of
reserves held by other governments, plus exports, in US$) or straightforward exchange-rate
based GDP, partly because reserves and exports are converted with market exchange rates.
The deflators with the lowest overall tendency for volatility (i.e., relatively large numbers
of countries changing classification each year) are the SDR, US, G20 and World (GDP
weighted) deflators, reflecting the relative stability over the period reviewed. Deflators that are
based on medians rather than weighted means show the lowest annual variability; the deflators
that use the SDR averaging method, the World unweighted average, or the countries in the
threshold “bands” appear to show the highest volatility. In some cases, more than 10 countries
changed category compared with the previous year.
An alternative approach to adjusting thresholds over time and using current price series
would be to use constant price estimates, with some specified base year. In this case, thresholds
would be set at a constant level, eliminating the need for estimating “international” inflation.

28
While this seems attractive, a significant problem with this approach is that a reliable GNI
deflator is needed for all countries. Another is that the choice of base year may affect the country
classification in undesirable ways.
In our view, the results from this simple examination tend to point to a return to the US
GDP (or GNI) deflator as the preferred adjustment factor for the thresholds. Over the period
reviewed, it has been relatively stable, which was one of the key issues for making the change to
the SDR basket. It also avoids the difficulty of interpretation: the use of the SDR deflator means,
effectively, that the thresholds are maintained in SDR units rather than US dollars but then
converted to US dollars for communication purposes. It would also eliminate the need for the use
of the SDR deflator in the Atlas method, which is another source of confusion; instead, exchange
rates would be adjusted using the ratio of local inflation rates to US inflation. In any case, since
this change would impact the calculation of thresholds and GNI per capita estimates used for
World Bank Group operational purposes, this proposal will need to be further discussed.
7. Redefiningthethresholds,andotherapproaches
If the main purpose of an analytic classification is to provide a mechanism for grouping and
aggregating countries for comparison purposes, then a scheme based purely on the ranking of
countries is a simple and attractive option. An obvious candidate is to divide countries into four
quartiles, based on their relative GNI per capita estimates. This has many advantages: it is simple
to understand; it can be constructed easily from the GNI per capita estimates used for the Bank’s
operational decision-making; the number of each countries in each group is stable, by design; it
does not require the selection of thresholds or procedures to update them each year; and it is
more difficult to make use of the classification for “non-analytic” purposes, such as aid
allocation.
One major disadvantage is that it requires estimates for all countries, or at least a “range”
estimate, since any missing data will affect the position of other countries in the ranking.
However, even in the current system, range estimates are made for all countries, so this
drawback is relatively easy to accommodate. A second problem is that the classification would
be relatively volatile; changes in growth rates of one country compared with another may result
in reclassification of either country. A solution to this would to use a “buffer”: for example,
29
countries would not change classification immediately, but would only be placed in the new
category for two or three years. But the biggest obstacle would appear to be that which affects all
rankings: when one country becomes high income (for example), another country must become
middle income. Some current users of the classification set policy on the basis of gaining a
higher classification status; a ranking based on quartiles may be less fit for this particular
purpose than the current methodology – though it can, of course, be argued that this use is not the
intended analytic purpose of the income classification.
Another approach that would avoid these problems would be to rank countries by
quartiles at a point in time (say for data relating to 2014, i.e. FY16), and set the upper bound of
each group as the new graduation thresholds. Thresholds recalibrated in this way to the current
period would initially include around 50 countries in each income category, and could then be
updated for inflation every year. Changes in country classification would continue from 2016 as
in the current system. Based on current data for the 2014 calendar year, the thresholds would
need to be set around $2,000, $7,000 and $21,000.
As well as the analytical classification, the World Bank also classifies countries for
operational lending purposes; this classification is published as part of Operational Policy 3.10,17
and categorizes borrowing countries according to their lending eligibility: IDA, IBRD, and
Blend. A further operational classification used by the World Bank is the list of countries in
Fragile and Conflict Affected Situations.18 Aggregates and groupings for these categories are
already available in the World Development Indicators database for analytic purposes and may
be more appropriate for analyzing policy questions of interest, such as the multiple facets of
fragility and resilience of countries. One option is to align the income thresholds for low income
and IDA graduation (US$1,045 and US$1,215 GNI per capita, as of July 1, 2015). At present,
many within and outside the World Bank mistakenly assume them to be synonymous and this
confusion can be avoided by linking them. It can also lend clarity to the Bank’s operational
cutoff.
17 http://go.worldbank.org/2DXSXPUD80.18 http://siteresources.worldbank.org/EXTLICUS/Resources/511777‐1269623894864/FY15FragileSituationList.pdf.

30
Several other approaches have been suggested for setting new thresholds so that they
provide a better basis for policy analysis. One idea, derived from the use of the income
classification for aid allocation purposes, is to define low income countries as those that cannot
eliminate absolute poverty by relying on their own resources. Ravallion (2012) estimates that
most countries with per capita incomes of more than US$4,000 (2005 PPP) would conceivably
be able to eradicate extreme poverty (defined as living on less than US$1.25 a day in 2005 PPP
terms) without recourse to external assistance. This equates to a per capita income of almost
US$2,300 using market exchange rates, or roughly double the value of the current low income
threshold.
Another idea, suggested by the AIDS Healthcare Foundation (AHF), is to raise the low
income threshold to $10-$15 per day.19 Their argument is that many countries classified as
middle income have poor health outcomes and a high burden of diseases such as AIDS, TB and
malaria, but they lose access to preferential pricing for certain medicines or to financial support
because some agencies use the low income classification threshold in their resource allocation
models: for example, the Global Fund to Fight AIDS, TB and Malaria. There are suggestions for
adjusting the value of the high income cutoff as well. Pritchett (2006) argues that a plausible
upper-bound poverty line is about US$10 a day (2005 PPP), and according to Kenny (2011), any
country in which average incomes are five times that level—about US$18,250 (2005 PPP)—
could be defined as rich. This turns out to be quite close to current practice: countries near that
level have an average Atlas GNI per capita of about US$11,800, compared with the high income
threshold of US$12,735 in 2014. A conclusion from this is that there are widely differing views
on appropriate threshold levels, and they largely depend on their intended purpose.
A challenge with any of the new approaches described above is that a number of
countries would be reclassified on the basis of a methodology change, rather than as a result of
growth or changes in per capita income. This is not problematic if the classification is used
purely for analytical purposes, but this review has shown that its use extends into resource
allocation models and into policy development. For this reason, any adjustments to the
19Seehttp://raisethemic.org.

31
classification methodology will need to be introduced carefully, perhaps alongside existing
methods.
Other classification schemes have been proposed, for example using cluster analysis
techniques, or using methods based on the construction or use of appropriate indices to replace or
supplement the use of GNI per capita. For example, Nielsen (2011) and Vázquez and Sumner
(2012 and 2014) consider the use of measures of poverty, inequality, and human development.
Other candidates proposed include the Human Development Index of the United Nations
Development Program and the Multidimensional Poverty Index of the Oxford Poverty and
Human Development Initiative. However, some of these composite indicators and methods also
attract criticism, including the arbitrariness in weighting patterns, the implicit trade-offs between
components, and their practicality when based on indicators with poor geographic coverage and
update frequency. Analyses of these alternatives have not been attempted here, though it can be
argued that they can also produce abrupt or inexplicable changes in classifications from one
period to the next. It is also important to note that classifications based on such approaches
would “decouple” the analytical classification of countries from the Bank’s operational
guidelines.
Different classification schemes are already in use by other international agencies;
selected groupings are presented in Annex 2, including those used in the Human Development
Report of UNDP, the World Economic Outlook of the IMF, and the World Economic Situation
and Prospects report of the United Nations. The UN statistical convention of developing and
developed regions and the UN operational categories of Least Developed Countries, Land
Locked Development Countries, and Small Island Developing States are also listed, since these
are commonly used.
8. Conclusion
This paper reviews the methodological details of the current income classification of the World
Bank, highlighting its pros and cons. A classification based on GNI per capita covers almost all
countries in the world and can be updated on an annual basis. While critics argue that the
thresholds of the Bank’s income classification are dated and yet used by many for policy
purposes, it should be emphasized that many also utilize the main benefit of the analytical

32
categories: they provide a useful way of organizing thoughts about development, and the
absolute nature of the thresholds help to track progress over time. Staff interviewed emphasized
that if changes are introduced, it would be important to maintain continuity with the current
system for research and other purposes. Users also stress the need for transparent, easily
understood methodologies.
This paper argues that the use of the SDR deflator to update thresholds should be
reconsidered. Future work can explore evaluating the thresholds themselves and it may be
appropriate to convene a forum for an open discussion of options. The paper presents a few
options for alternative thresholds that provide a basis for further discussion.

33
References
Badiee, S. 2012. “A Review of the Analytical Income Classification.” Let’s Talk Development. http://blogs.worldbank.org/developmenttalk/a-review-of-the-analytical-income-classification
Ceriani, L., and P. Verme. 2014. "The Income Lever and the Allocation of Aid," Journal of Development Studies, 50(11): 1510-1522.
Collier, P. 2007. The Bottom Billion: Why the Poorest Countries Are Failing and What Can Be Done About It. Oxford: Oxford University Press.
Fardoust, S., Y. Kim, and C. Sepulveda. 2010. “Postcrisis Growth and Development: A Development Agenda for the G-20.” Washington, DC: World Bank.
Gimenez, L., D. Jolliffe, and I. Sharif. 2014. “Bangladesh, a Middle Income Country by 2021: What Will It Take in terms of Poverty Reduction?” Bangladesh Development Studies, 37 (1-2): 1-19.
Goldberg, L. 2010. “Is the International Role of the Dollar Changing?” Federal Reserve Bank of New York Research Paper Series - Current Issues in Economics and Finance, 16 (1), January.
Harris, D., N. Moore, and H. Schmitz. 2009. “Country Classifications for a Changing World.” IDS Working Paper Number 326, Institute of Development Studies, Brighton.
Heckelman, J., S. Knack, and F. Rogers. 2011. “Crossing the Threshold: An Analysis of IBRD Graduation Policy.” Policy Research Working Paper, No. 5531, World Bank, Washington, DC.
Henderson, D. 2015. “Comparing Real GDP Across Countries: The Issues Revisited.” Economic Affairs, 35: 286–298.
IDA (International Development Association). 2012. “Review of IDA’s Graduation Policy.” World Bank, Washington DC.
Im, F., and D. Rosenblatt. 2013. Middle-Income traps: a Conceptual and Empirical Survey. Policy Research Working Paper, No. 6594. Washington, DC, World Bank, Washington DC.
IMF (International Monetary Fund) 2010. Press Release No. 10/434. November 15. Washington, DC.
Jerven, M. 2013. Poor Numbers: How We Are Misled by African Development Statistics and What to Do about It. Cornell University Press.
Kanbur, R., and A. Sumner. 2012. “Poor Countries or Poor People? Development Assistance and the New Geography of Poverty.” Journal of International Development, 24(6): 686–65.
Kenny, C. 2011. “What Does It Mean to Be Low Income?” http://www.cgdev.org/blog/what-does-it-mean-be-low-income.
Lin, J., S. Fardoust, and D. Rosenblatt. 2012. “Reform of the International Monetary System: A Jagged History and Uncertain Prospects.” Policy Research Working Paper, No, 6070, World Bank, Washington, DC.
Milanovic, B. 2012. “The Real Winners and Losers of Globalization.” The Globalist, October
34
25. http://www.theglobalist.com/storyid.aspx?storyid=9788 Moss, T., and B. Leo. 2011. “IDA at 65: Moving toward Retirement or a Fragile Lease on Life?”
CGD Working Paper 246, Center for Global Development, Washington, DC. Nielsen, L. 2011. “Classifications of Countries Based on Their Level of Development: How it is
Done and How it Could be Done.” IMF Working Paper WP/11/31. OECD. 2014a. “Geographical Distribution of Financial Flows to Developing Countries - 2014
Edition” Paris: OECD. (http://www.oecd.org/dacstats/daclist.htm) ———. 2014b. “The Export Credits Arrangement text.”
(http://www.oecd.org/tad/exportcredits/theexportcreditsarrangementtext.htm) ———. 2015. “DAC List of ODA Recipients.” Pearson, L., E. Boyle, R. D. Oliveira Campos, C. Dillon, W.Guth, A. Lewis, R. Marjolin, and S.
Okita. 1969. Partners in Development: Report of the Commission on International Development. New York: Praeger.
Pritchett, L. 2006. “Who is Not Poor? Dreaming of a World Truly Free of Poverty. World Bank Research Observer, 21 (1): 1-23.
Ravallion, M. 2012. “Should We Care Equally about Poor People Wherever They May Live?” Let’s Talk Development. http://blogs.worldbank.org/developmenttalk/a-review-of-the-analytical-income-classification
Ravallion, M. 2009. “Do Poorer Countries Have Less Capacity for Redistribution?” Policy Research Working Paper, No, 5046, World Bank, Washington, DC.
Reid, E. 1965. “The Future of the World Bank.” International Bank of Reconstruction and Development (published essay).
Sumner, A. 2012. “Where do the poor live?” World Development, 40(5): 865–877. Sumner, A., and S. Vázquez. 2012. “Beyond Low and Middle Income Countries: What If There
Were Five Clusters of Developing Countries?” IDS Working Paper 404, Institute of Development Studies, Brighton.
UNCTAD (United Nations Conference on Trade and Development). 2012. South-South Trade Monitor, No. 1, June. Geneva.
United Nations. 1993. System of National Accounts. Brussels/Luxembourg, New York, Paris, Washington, D.C., 1993
United Nations. 2008. System of National Accounts. New York, 2008 Vázquez, S., and A. Sumner. 2014. “How Has the Developing World Changed since the Late
1990s? A Dynamic and Multidimensional Taxonomy of Developing Countries.” CGD Working Paper 375, Center For Global Development, Washington D.C.
Ward, M. 2001. “International price levels and global inflation.” Paper presented at Joint World Bank – OECD Seminar on Purchasing Power Parities, Washington D.C.
World Bank. 1978. World Development Report 1978. “Prospects for Growth and Alleviation of

35
Poverty.” ———. 1983a. “Operational Per Capita Income Guidelines.” IBRD SecM83-114, February 8,
1983. ———. 1983b. “Methodological Problems and Proposals Relating to the Estimation of
Internationally Comparable Per Capita GNP Figures.” IBRD SecM83-1120, December 5, 1983.
———. 1983c. World Development Report 1983. New York: Oxford University Press. ———. 1989. “Per Capita Income”. IBRD SecM89-73, January 17, 1989. ———. 1994. “Per Capita Income”. IBRD SecM94-661, June 28, 1994. ———. 2000. “Estimating Per Capita Income for Operational Purposes.” IBRD SecM2000-625.
October 30, 2000. ———. 2013. “A Stronger, Connected, Solutions World Bank Group: An Overview of the
World Bank Group Strategy.” Washington, DC: World Bank.

36
Annex1.Empiricalreviewofalternativedeflators
Deflator name Description Strengths Weaknesses Trend 1996‐2013
(log scale, 1996=100)
1 SDR A weighted mean of GDP deflators of countries represented in the IMF Special Drawing Rights
Composition reflects a large part of global trade and GDP (50% of global economy, 35% of global exports and 93% of world currency reserves held by foreign governments)
Relatively complex to compute and understand; not representative of inflation in emerging and developing economies
2 US GDP
US GDP deflator Data are readily available, historically relatively stable, represents US$ which used in global trade and is the common numeraire for the GNP per capita estimates
Risk of volatility because dependent on a single economy, no representation of emerging and developing economies, US GNP deflator may be more appropriate
3 G20 GDP, SDR method
Weighted mean of GDP deflators of G20 countries; weights are the currency reserves held by foreign government plus exports, in US dollars (these weights reflect the composition of the SDR)
Representative of a large part of global trade or GDP, including emerging economies (e.g. BRICs). G20 85% of the global economy, 80% of global exports and 99% of world currency reserves held by foreign governments; stable over time
Complex to compute and understand; data may not be readily available to compute thresholds by May each year
4 G20 GDP median
Median GDP deflator of G20 countries, using 2013 composition of G20
As other G20 deflators, but data are readily available, deflator is simple to compute and understand, is stable over time and less influenced by outliers than measures based on the mean
Questionable theoretical basis for use of median compared to mean
5 World GDP mean
Simple unweighted mean of GDP deflators of all countries
Data are readily available for many countries, deflator is simple to compute and understand, includes all economies equally
Tendency to be very volatile; influenced by outliers and small economies, which may not be desirable
6 World GDP, SDR method
Weighted mean of GDP deflators of all countries. The weights are the currency reserve held by foreign governments plus exports, in US dollars
Represents all economies in proportion to the impact of each on the global economy in trade and transactions; represents all economies
Complex to compute and understand; data may not be readily available to compute thresholds by May each year

37
Deflator name Description Strengths Weaknesses Trend 1996‐2013
(log scale, 1996=100)
7 World GDP, US$ GDP weighted mean
Weighted mean of GDP deflators of all countries; weights are the size of GDP in US$ (exchange rate based)
Represents all economies in proportion to the size of each economy; data are readily available, deflator is very simple to compute and understand
Does not represent the significance of economies/currencies in world trade transactions
8 World GDP, PPP$ GDP weighted mean
Weighted mean of GDP deflators of all countries; weights are the size of GDP in PPP$
Represents all economies in proportion to the size of each economy, deflator is very simple to compute and understand
Does not represent the significance of economies/currencies in world trade transactions; revision of PPP at each ICP benchmark could have large impact that is difficult to explain to users
9 World GDP, population weighted mean
Weighted mean of GDP deflators of all countries; weights are the size of population
Data are readily available; includes all the economies
Tendency to be very volatile; gives large weight to large population countries; does not represent the significance of currencies in world trade and transactions
10 World GDP median
Median GDP deflator of all countries
Data are readily available; represents all economies equally; robust to outliers and volatility
Could be affected by the change in the number of countries included
11 Threshold panel GDP mean
Unweighted mean of the GDP deflators of ten countries – those five above and below each threshold each year; country composition is not fixed each year
May better represent price inflation of those countries likely affected by the thresholds
Tendency to be very volatile, heavily affected by composition of the panel; typically reflects only a small portion of global trade or GDP; if panel has high variance may still not be representative
12 Threshold panel GDP median
Median of GDP deflators of ten countries ‐ those five above and below each threshold each year; country composition is not fixed each year
May better represent price inflation of those countries likely affected by the thresholds; less volatile than mean (more resistant to impact of outliers)
Tendency to be very volatile still exists, heavily affected by composition of the panel; typically reflects only a small portion of global trade or GDP; if panel has high variance may still not be representative

38
Annex2.Selectedcountryclassificationschemes
Concept, intended use
Groupings Institution Notes
Income, analytical
Low, Lower‐Middle, Upper‐ Middle, High
World Bank For FY16, low income economies are those with a GNI per capita (calculated using the World Bank Atlas method) of $1,045 or less in 2014; middle‐income economies are those with a GNI per capita of more than $1,045 but less than $12,736; high‐income economies are those with a GNI per capita of $12,736 or more. Lower‐middle‐income and upper‐middle‐income economies are separated at a GNI per capita of $4,125.
http://data.worldbank.org/about/country‐and‐lending‐groups (July 2015)
Human Development, analytical
Very High, High, Medium, Low
United Nations (Development Programme)
The 2014 Human Development Report defines four categories of human development achievements using fixed cut‐off points of the Human Development Index. The cut‐off values are obtained as the HDI values calculated using the quartiles of the distributions of component indicators. The cut‐off points are 0.55, 0.7, and 0.8 and will be kept for at least five years and then revised.
http://hdr.undp.org/en/faq‐page/human‐development‐index‐hdi#t292n40 (July 2014)
Development, analytical
Developed and Developing Regions
United Nations (Statistics Division)
There is no established convention for the designation of developed and developing countries or areas in the United Nations system, but in common practice, Japan in Asia, Canada and the United States in northern America, Australia and New Zealand in Oceania, and Europe are considered developed regions or areas. Countries emerging from the former Yugoslavia are treated as developing countries; and countries of eastern Europe and of the Commonwealth of Independent States in Europe are not included under either developed or developing regions. In international trade statistics, the Southern African Customs Union is also treated as a developed region and Israel as a developed country.
http://unstats.un.org/unsd/methods/m49/m49regin.htm (August 2015)
Economic conditions, analytical
Developed, Transition, Developing
United Nations (Department of Economic and Social Affairs)
Used for analysis in the annual World Economic Situation and Prospects report. The composition of these groupings is intended to reflect basic economic country conditions. Several countries (in particular the economies in transition) have characteristics that could place them in more than one category; however, for purposes of analysis, the groupings have been made mutually exclusive.
http://www.un.org/en/development/desa/policy/wesp/wesp_archive/2015wesp_full_en.pdf (August 2015)

39
Concept, intended use
Groupings Institution Notes
Development, operational
Least Developed Countries (LDCs), Land Locked Developing Countries (LLDCs), Small Island Developing States (SIDS)
United Nations (Office of the High Representative for the Least Developed Countries, Landlocked Developing Countries and Small Island Developing States – OHRLLS)
The list of 49 LDCs is based on three criteria: a three‐year average estimate of GNI per capita; a human assets index (HAI); and an economic vulnerability index (EVI). Threshold levels are determined triennially; for 2015, the GNI per capita level for inclusion is $1,035, and the level for graduation is $1,242. To be included on the list of LDCs, a country must satisfy all three criteria, and the population must not exceed 75 million. To be eligible to graduate, a country must reach threshold levels for at least two of the three criteria, or its GNI per capita must exceed twice the graduation threshold level and be sustainable at that level. There are 31 LLDCs, generally among the poorest of the developing countries, with the weakest growth rates, and typically heavily dependent on a very limited number of commodities for their export earnings; 16 are also classified as LDCs. SIDS are a distinct group of 57 developing countries facing specific social, economic and environmental vulnerabilities; the UN recognizes the 38 Member States belonging to the Alliance of Small Island States (AOSIS); AOSIS also includes 19 other island entities that are non‐UN Member States or are not self‐governing or non‐independent territories that are members of UN regional commissions; it excludes Bahrain.
http://unohrlls.org/about‐ldcs/criteria‐for‐ldcs; http://unohrlls.org/about‐lldcs; http://unohrlls.org/about‐sids (August 2015)
Economies, analytical
Advanced, Emerging Market and Developing
International Monetary Fund
The country classification used in the World Economic Outlook (WEO). It is not based on strict criteria, economic or otherwise, but instead has evolved over time to facilitate analysis by providing a reasonably meaningful organization of the data. Some countries are not included if they are not IMF members or because of data limitations. Other analytical country classifications are used in WEO, including source of export earnings, net debtor economies, and economies with arrears. Operational classifications are also used, including Low Income Developing Countries (LIDCs) (countries that were designated in 2013 as eligible for concessional financing from the Poverty Reduction and growth Trust and with per capita gross national income less than US$2,390 in 2011, and Zimbabwe), and Highly Indebted Poor Countries (HIPC).
http://www.imf.org/external/pubs/ft/weo/2015/01/weodata/groups.htm (April 2015)

40
Annex3.Economiesandtheirclassificationbyselectedschemes20
Economy WBG UN – HDR
UN – Statistics
UN – WESP
UN –OHRLLS IMF WEO
Afghanistan Low Low Developing Least
Developed* Emerging Market & Developing
Åland Islands Developed
Albania Upper Middle
High Developed Transition Emerging Market & Developing
Algeria Upper Middle
High Developing Developing Emerging Market & Developing
American Samoa Upper Middle
Developing Small Island Developing
Andorra High Very High Developed
Angola Upper Middle
Low Developing Developing Least
Developed Emerging Market & Developing
Anguilla Developing
Antigua and Barbuda High High Developing Small Island Developing
Emerging Market & Developing
Argentina High Very High Developing Developing Emerging Market & Developing
Armenia Lower Middle
High Developing Transition Land Locked Developing
Emerging Market & Developing
Aruba High Developing Small Island Developing
Australia High Very High Developed Developed Advanced
Austria High Very High Developed Developed Advanced
Azerbaijan Upper Middle
High Developing Transition Land Locked Developing
Emerging Market & Developing
Bahamas, The High High Developing Small Island Developing
Emerging Market & Developing
Bahrain High Very High Developing Developing Emerging Market & Developing
Bangladesh Lower Middle
Medium Developing Developing Least
Developed Emerging Market & Developing
Barbados High High Developing Developing Small Island Developing
Emerging Market & Developing
20NamingconventionsfollowthoseusedbytheWorldBank’sincomeclassification;economiesandterritoriesthatarenotclassifiedbytheWorldBankfollowthenamingconventionsoftheUnitedNations.ClassificationasatthedatesindicatedinAnnex2.*indicateseconomiesthatareclassifiedasbothLeastDevelopedCountriesandLandLockedDevelopingCountries,**indicateseconomiesthatareclassifiedasbothLeastDevelopedCountriesandSmallIslandDevelopingStates.

41
Economy WBG UN – HDR
UN – Statistics
UN – WESP
UN –OHRLLS IMF WEO
Belarus Upper Middle
High Developed Transition Emerging Market & Developing
Belgium High Very High Developed Developed Advanced
Belize Upper Middle
High Developing Small Island Developing
Emerging Market & Developing
Benin Low Low Developing Developing Least
Developed Emerging Market & Developing
Bermuda High Developed
Bhutan Lower Middle
Medium Developing Least
Developed* Emerging Market & Developing
Bolivia Lower Middle
Medium Developing Developing Land Locked Developing
Emerging Market & Developing
Bonaire, Sint Eustatius and Saba
Developing
Bosnia and Herzegovina
Upper Middle
High Developed Transition Emerging Market & Developing
Botswana Upper Middle
Medium Developing Developing Land Locked Developing
Emerging Market & Developing
Brazil Upper Middle
High Developing Developing Emerging Market & Developing
British Virgin Islands Developing
Brunei Darussalam High Very High Developing Developing Emerging Market & Developing
Bulgaria Upper Middle
High Developed Developed Emerging Market & Developing
Burkina Faso Low Low Developing Developing Least
Developed* Emerging Market & Developing
Burundi Low Low Developing Developing Least
Developed* Emerging Market & Developing
Cabo Verde Lower Middle
Medium Developing Developing Small Island Developing
Emerging Market & Developing
Cambodia Low Medium Developing Least
Developed Emerging Market & Developing
Cameroon Lower Middle
Low Developing Developing Emerging Market & Developing
Canada High Very High Developed Developed Advanced
Cayman Islands High Developing
Central African Republic
Low Low Developing Developing Least
Developed* Emerging Market & Developing
Chad Low Low Developing Developing Least
Developed* Emerging Market & Developing

42
Economy WBG UN – HDR
UN – Statistics
UN – WESP
UN –OHRLLS IMF WEO
Channel Islands High Developed
Chile High Very High Developing Developing Emerging Market & Developing
China Upper Middle
High Developing Developing Emerging Market & Developing
Colombia Upper Middle
High Developing Developing Emerging Market & Developing
Comoros Low Low Developing Developing Least
Developed**
Emerging Market & Developing
Congo, Dem. Rep. Low Low Developing Developing Least
Developed Emerging Market & Developing
Congo, Rep. Lower Middle
Medium Developing Developing Emerging Market & Developing
Costa Rica Upper Middle
High Developing Developing Emerging Market & Developing
Cook Islands Developing
Côte d'Ivoire Lower Middle
Low Developing Developing Emerging Market & Developing
Croatia High Very High Developed Developed Emerging Market & Developing
Cuba Upper Middle
Very High Developing Developing Small Island Developing
Curaçao High Developing
Cyprus High Very High Developing Developed Advanced
Czech Republic High Very High Developed Developed Advanced
Denmark High Very High Developed Developed Advanced
Djibouti Lower Middle
Low Developing Developing Least
Developed Emerging Market & Developing
Dominica Upper Middle
High Developing Small Island Developing
Emerging Market & Developing
Dominican Republic Upper Middle
High Developing Developing Small Island Developing
Emerging Market & Developing
Ecuador Upper Middle
High Developing Developing Emerging Market & Developing
Egypt, Arab Rep. Lower Middle
Medium Developing Developing Emerging Market & Developing
El Salvador Lower Middle
Medium Developing Developing Emerging Market & Developing
Equatorial Guinea High Medium Developing Developing Least
Developed Emerging Market & Developing

43
Economy WBG UN – HDR
UN – Statistics
UN – WESP
UN –OHRLLS IMF WEO
Eritrea Low Low Developing Developing Least
Developed Emerging Market & Developing
Estonia High Very High Developed Developed Advanced
Ethiopia Low Low Developing Developing Least
Developed* Emerging Market & Developing
Faeroe Islands High Developed
Falkland Islands (Malvinas)
Developing
Fiji Upper Middle
High Developing Least
Developed**
Emerging Market & Developing
Finland High Very High Developed Developed Advanced
France High Very High Developed Developed Advanced
French Guiana Developing
French Polynesia High Developing Small Island Developing
Gabon Upper Middle
Medium Developing Developing Emerging Market & Developing
Gambia, The Low Low Developing Developing Land Locked Developing
Emerging Market & Developing
Georgia Lower Middle
High Developing Transition Emerging Market & Developing
Germany High Very High Developed Developed Advanced
Ghana Lower Middle
Medium Developing Developing Emerging Market & Developing
Gibraltar Developed
Greece High Very High Developed Developed Advanced
Greenland High Developed
Grenada Upper Middle
High Developing Small Island Developing
Emerging Market & Developing
Guam High Developing Small Island Developing
Guadeloupe Developing
Guatemala Lower Middle
Medium Developing Developing Emerging Market & Developing
Guernsey Developed

44
Economy WBG UN – HDR
UN – Statistics
UN – WESP
UN –OHRLLS IMF WEO
Guinea Low Low Developing Developing Least
Developed Emerging Market & Developing
Guinea‐Bissau Low Low Developing Developing Least
Developed**
Emerging Market & Developing
Guyana Lower Middle
Medium Developing Developing Small Island Developing
Emerging Market & Developing
Haiti Low Low Developing Developing Least
Developed**
Emerging Market & Developing
Holy See Developed
Honduras Lower Middle
Medium Developing Developing Emerging Market & Developing
Hong Kong SAR, China High Very High Developing Developing Advanced
Hungary High Very High Developed Developed Emerging Market & Developing
Iceland High Very High Developed Developed Advanced
India Lower Middle
Medium Developing Developing Emerging Market & Developing
Indonesia Lower Middle
Medium Developing Developing Emerging Market & Developing
Iran, Islamic Rep. Upper Middle
High Developing Developing Emerging Market & Developing
Iraq Upper Middle
Medium Developing Developing Emerging Market & Developing
Ireland High Very High Developed Developed Advanced
Isle of Man High Developed
Israel High Very High Developing Developing Advanced
Italy High Very High Developed Developed Advanced
Jamaica Upper Middle
High Developing Developing Small Island Developing
Emerging Market & Developing
Japan High Very High Developed Developed Advanced
Jersey Developed
Jordan Upper Middle
High Developing Developing Emerging Market & Developing
Kazakhstan Upper Middle
High Developing Transition Land Locked Developing
Emerging Market & Developing
Kenya Lower Middle
Low Developing Developing Emerging Market & Developing

45
Economy WBG UN – HDR
UN – Statistics
UN – WESP
UN –OHRLLS IMF WEO
Kiribati Lower Middle
Medium Developing Least
Developed**
Emerging Market & Developing
Korea, Dem. Rep. Low Developing
Korea, Rep. High Very High Developing Developing Advanced
Kosovo Lower Middle
Emerging Market & Developing
Kuwait High Very High Developing Developing Emerging Market & Developing
Kyrgyz Republic Lower Middle
Medium Developing Transition Land Locked Developing
Emerging Market & Developing
Lao PDR Lower Middle
Medium Developing Least
Developed* Emerging Market & Developing
Latvia High Very High Developed Developed Advanced
Lebanon Upper Middle
High Developing Developing Emerging Market & Developing
Lesotho Lower Middle
Low Developing Developing Least
Developed* Emerging Market & Developing
Liberia Low Low Developing Developing Least
Developed Emerging Market & Developing
Libya Upper Middle
High Developing Developing Emerging Market & Developing
Liechtenstein High Very High Developed
Lithuania High Very High Developed Developed Advanced
Luxembourg High Very High Developed Developed Advanced
Macao SAR, China High Developing
Macedonia, FYR Upper Middle
High Developed Transition Land Locked Developing
Emerging Market & Developing
Madagascar Low Low Developing Developing Least
Developed Emerging Market & Developing
Malawi Low Low Developing Developing Least
Developed* Emerging Market & Developing
Malaysia Upper Middle
High Developing Developing Emerging Market & Developing
Maldives Upper Middle
Medium Developing Small Island Developing
Emerging Market & Developing
Mali Low Low Developing Developing Least
Developed* Emerging Market & Developing
Malta High Very High Developed Developed Advanced

46
Economy WBG UN – HDR
UN – Statistics
UN – WESP
UN –OHRLLS IMF WEO
Marshall Islands Upper Middle
Developing Small Island Developing
Emerging Market & Developing
Martinique Developing
Mauritania Lower Middle
Low Developing Developing Least
Developed Emerging Market & Developing
Mauritius Upper Middle
High Developing Developing Small Island Developing
Emerging Market & Developing
Mayotte Developing
Mexico Upper Middle
High Developing Developing Emerging Market & Developing
Micronesia, Fed. Sts. Lower Middle
Medium Developing Small Island Developing
Emerging Market & Developing
Moldova Lower Middle
Medium Developed Transition Land Locked Developing
Emerging Market & Developing
Monaco High Developed
Mongolia Upper Middle
Medium Developing Land Locked Developing
Emerging Market & Developing
Monserrat Developing
Montenegro Upper Middle
High Developed Transition Emerging Market & Developing
Morocco Lower Middle
Medium Developing Developing Emerging Market & Developing
Mozambique Low Low Developing Developing Least
Developed Emerging Market & Developing
Myanmar Lower Middle
Low Developing Developing Least
Developed Emerging Market & Developing
Namibia Upper Middle
Medium Developing Developing Emerging Market & Developing
Nauru Developing
Nepal Low Low Developing Developing Least
Developed* Emerging Market & Developing
Netherlands High Very High Developed Developed Advanced
New Caledonia High Developing Small Island Developing
New Zealand High Very High Developed Developed Advanced
Nicaragua Lower Middle
Medium Developing Developing Emerging Market & Developing
Niger Low Low Developing Developing Least
Developed* Emerging Market & Developing

47
Economy WBG UN – HDR
UN – Statistics
UN – WESP
UN –OHRLLS IMF WEO
Nigeria Lower Middle
Low Developing Developing Emerging Market & Developing
Niue Developing
Norfolk Island Developed
Northern Mariana Islands
High Developing Small Island Developing
Norway High Very High Developed Developed Advanced
Oman High High Developing Developing Emerging Market & Developing
Pakistan Lower Middle
Low Developing Developing Emerging Market & Developing
Palau Upper Middle
High Developing Small Island Developing
Emerging Market & Developing
Panama Upper Middle
High Developing Developing Emerging Market & Developing
Papua New Guinea Lower Middle
Low Developing Developing Small Island Developing
Emerging Market & Developing
Paraguay Upper Middle
Medium Developing Developing Land Locked Developing
Emerging Market & Developing
Peru Upper Middle
High Developing Developing Emerging Market & Developing
Philippines Lower Middle
Medium Developing Developing Emerging Market & Developing
Pitcairn Developing
Poland High Very High Developed Developed Emerging Market & Developing
Portugal High Very High Developed Developed Advanced
Puerto Rico High Developing Small Island Developing
Qatar High Very High Developing Developing Emerging Market & Developing
Réunion Developing
Romania Upper Middle
High Developed Developed Emerging Market & Developing
Russian Federation High High Developed Transition Emerging Market & Developing
Rwanda Low Low Developing Developing Least
Developed* Emerging Market & Developing
Saint‐Barthélemy Developing

48
Economy WBG UN – HDR
UN – Statistics
UN – WESP
UN –OHRLLS IMF WEO
Saint Pierre and Miquelon
Developed
Samoa Lower Middle
Medium Developing Small Island Developing
Emerging Market & Developing
San Marino High Developed Advanced
São Tomé and Principe
Lower Middle
Medium Developing Developing Least
Developed**
Emerging Market & Developing
Sark Developed
Saudi Arabia High Very High Developing Developing Emerging Market & Developing
Senegal Lower Middle
Low Developing Developing Least
Developed Emerging Market & Developing
Serbia Upper Middle
High Developed Transition Emerging Market & Developing
Seychelles High High Developing Small Island Developing
Emerging Market & Developing
Sierra Leone Low Low Developing Developing Least
Developed Emerging Market & Developing
Singapore High Very High Developing Developing Small Island Developing
Advanced
Sint Maarten (Dutch part)
High Developing
Slovak Republic High Very High Developed Developed Advanced
Slovenia High Very High Developed Developed Advanced
Solomon Islands Lower Middle
Low Developing Least
Developed**
Emerging Market & Developing
Somalia Low Developing Developing Least
Developed
South Africa Upper Middle
Medium Developing Developing Emerging Market & Developing
South Sudan Low Developing Least
Developed* Emerging Market & Developing
Spain High Very High Developed Developed Advanced
Sri Lanka Lower Middle
High Developing Developing Emerging Market & Developing
St. Helena Developing
St. Kitts and Nevis High High Developing Small Island Developing
Emerging Market & Developing
St. Lucia Upper Middle
High Developing Small Island Developing
Emerging Market & Developing

49
Economy WBG UN – HDR
UN – Statistics
UN – WESP
UN –OHRLLS IMF WEO
St. Martin (French part)
High Developing
St. Vincent and the Grenadines
Upper Middle
High Developing Small Island Developing
Emerging Market & Developing
Sudan Lower Middle
Low Developing Developing Least
Developed Emerging Market & Developing
Suriname Upper Middle
High Developing Small Island Developing
Emerging Market & Developing
Svalbard and Jan Mayan Islands
Developed
Swaziland Lower Middle
Low Developing Land Locked Developing
Emerging Market & Developing
Sweden High Very High Developed Developed Advanced
Switzerland High Very High Developed Developed Advanced
Syrian Arab Republic Lower Middle
Medium Developing Developing Emerging Market & Developing
Taiwan, China High Developing
Advanced
Tajikistan Lower Middle
Medium Developing Transition Land Locked Developing
Emerging Market & Developing
Tanzania Low Low Developing Developing Least
Developed Emerging Market & Developing
Thailand Upper Middle
High Developing Developing Emerging Market & Developing
Timor‐Leste Lower Middle
Medium Developing Least
Developed**
Emerging Market & Developing
Togo Low Low Developing Developing Least
Developed Emerging Market & Developing
Tokelau Developing
Tonga Upper Middle
High Developing Small Island Developing
Emerging Market & Developing
Trinidad and Tobago High High Developing Developing Small Island Developing
Emerging Market & Developing
Tunisia Upper Middle
High Developing Developing Emerging Market & Developing
Turkey Upper Middle
High Developing Developing Emerging Market & Developing
Turkmenistan Upper Middle
Medium Developing Transition Land Locked Developing
Emerging Market & Developing
Turks and Caicos Islands
High Developing
Tuvalu Upper Middle
Developing Least
Developed**
Emerging Market & Developing

50
Economy WBG UN – HDR
UN – Statistics
UN – WESP
UN –OHRLLS IMF WEO
Uganda Low Low Developing Developing Least
Developed* Emerging Market & Developing
Ukraine Lower Middle
High Developed Transition Emerging Market & Developing
United Arab Emirates High Very High Developing Developing Emerging Market & Developing
United Kingdom High Very High Developed Developed Advanced
United States High Very High Developed Developed Advanced
Uruguay High High Developing Developing Emerging Market & Developing
Uzbekistan Lower Middle
Medium Developing Transition Land Locked Developing
Emerging Market & Developing
Vanuatu Lower Middle
Medium Developing Least
Developed**
Emerging Market & Developing
Venezuela, RB High High Developing Developing Emerging Market & Developing
Vietnam Lower Middle
Medium Developing Developing Emerging Market & Developing
Virgin Islands (U.S.) High Developing Small Island Developing
Wallis and Fortuna Islands
Developing
West Bank and Gaza Lower Middle
Medium Developing
Western Sahara Developing
Yemen, Rep. Lower Middle
Low Developing Developing Least
Developed Emerging Market & Developing
Zambia Lower Middle
Medium Developing Developing Least
Developed* Emerging Market & Developing
Zimbabwe Low Low Developing Developing Land Locked Developing
Emerging Market & Developing


