Embed Size (px)
Citation preview
The word complexity measure (WCM) in early
phonological development: A longitudinal study from birth to
three years old
Li-mei Chen1 and Yi-Hsiang Liu2
Abstract
Word Complexity Measure (WCM, Stoel-Gammon, 2010) is a system of phonological assessment
for children’s speech productions, a method that focuses on the complexity rather than accuracy. With its
flexible parameter program, the assessment can be adjusted to the phonological properties of different
languages. In the current study, the WCM was used to assess speech production of three
Mandarin-learning children from birth to three years old. In addition to the original parameters in
Stoel-Gammon (2010), the Chinese version of WCM made some adjustments, including incorporating
productions of fricatives, affricates, /ʐ/, /y/, and the late acquired vowels and consonants, to examine the
complexity of speech productions. Major findings in the developmental changes of the first 3 years are:
1) the complexity of the intelligible words increased, with individual differences in the stability of
changes; 2) the complexity of the unintelligible syllables also elaborated; 3) the percentage of simple
words/syllables decreased in both intelligible and unintelligible productions.
Keywords: Production complexity, Mandarin-learning children, Phonological development, Word
complexity measure 1. Introduction
Word Complexity Measure (WCM, Stoel-Gammon, 2010) is a measurement for developmental
phonology and disorder. WCM focuses on the complexity and is based on point-giving process.
Comparing with Percentage of Consonant Correct (PCC, Shriberg & Kwiatkowski, 1982) and the
measurement of whole-word productions (Ingram, 2002), WCM demonstrates advantages in describing
the development of speech production because the parameter in WCM was designed to mirror the
properties of child phonology. The PCC also calculates points in children’s speech for measuring
intelligibility. However, in PCC only the accurate speech sounds are given points in the process, and
those unintelligible utterances are not scored because they are not real words. Namely, the PCC
examines and quantifies the accuracy of the sounds that is articulated correctly. However, children
produce not only the intelligible words but many non-word sounds, especially in the early ages. By
means of the WCM, those unintelligible utterances can also be scored and quantified. Children with
1,2 Department of Foreign Languages and Literature, National Cheng Kung University
The 2015 Conference on Computational Linguistics and Speech ProcessingROCLING 2015, pp. 233-247 The Association for Computational Linguistics and Chinese Language Processing
233

small vocabulary can also be inspected. For example, children with language disorders can also be
examined with this measurement. This may provide a useful tool for clinical assessment. Moreover,
WCM provides phonological development scales with which phonological changes can be tracked. In
addition, children’s forms can be compared with target forms with WCM measures. Namely, both
independent and relational analysis can be done with WCM. The whole-word production (Ingram, 2002)
proposed four measures to estimate speech production of children: 1) the phonological mean length of
utterance (PMLU); 2) the proportion of whole-word proximity; 3) the proportion of whole-word
correctness; 4) the proportion of whole-word variability. The core lies in the PMLU, which gives points
to each word based on two factors: 1) the number of segments in a word; 2) the number of correct
consonants. The former factor demonstrates the independent analysis, and the later the relational
analysis. In this aspect, the measurement of whole-word production is close to the WCM. However, the
WCM can further provide a more comprehensive picture by accounting for both qualitative and
quantitative nature in phonological development (Stoel-Gammon, 2010).
Furthermore, the prevailing advantage of the WCM is the flexible parameters that can be adjusted
to target languages. This measurement was initially designed for English-speaking children, while in the
present some of the parameters of WCM were adjusted to observe Chinese phonological system. The
recorded speech productions were divided into two groups: intelligible words and unintelligible
utterances. Each group was scored separately to prevent improper comparison of speech sounds in
non-words and real words. Based on the phonological parameters, each sample was awarded a
‘complexity score’ and was calculated to get a ratio which mirrored the nature of error and accuracy. In
general cases, first words emerge at the age of 12-15 months (Stoel-Gammon, 1989). The longitudinal
speech productions analyzed in the present study started from about 2 months of age to better observe
the transition from pre-speech vocalization to real-word productions.
2. Methodology
2.1 Participants
Data of 3 typically developing boys (Child A, B, and C) were analyzed from 2 to 36 months of age. This
longitudinal data is part of a larger scale of longitudinal observation of phonetic development in
Mandarin-learning children.
2.2 Procedure
A wireless AKG microphone system was linked to a SONY DAT recorder with a signal-to-noise ratio
above 91 dB for audio recording. The mini-microphone was pinned on infants’ shirt, or placed close to
infants’ mouth. Each recording session lasts for approximately 50 minutes. The caregiver and an
experimenter were presented in each of the recording session. Spontaneous infant vocalizations were
elicited in natural interaction. The sample words were collected based on natural conversation among the
observers, participants, and the parents, and the picture-naming task (after approximately 18 months of
age). Twelve recordings for each participant were analyzed in the study, and nearly 50 speech samples
234
were included in each recording.
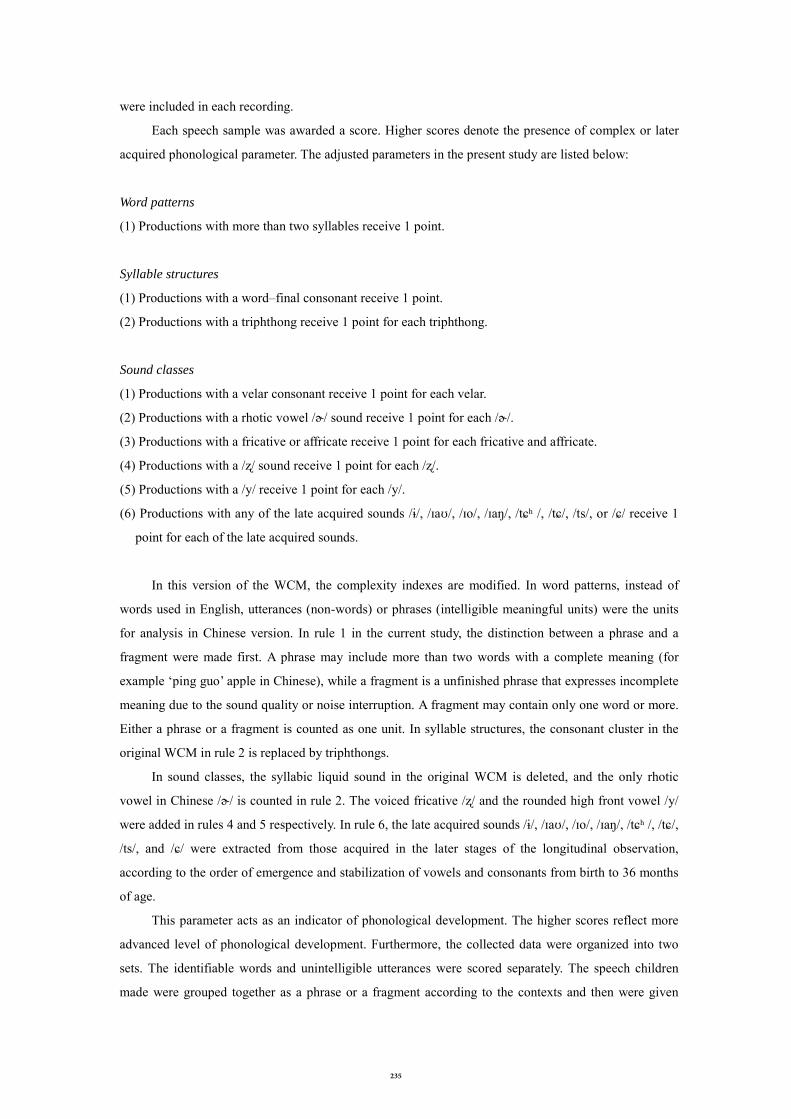
Each speech sample was awarded a score. Higher scores denote the presence of complex or later
acquired phonological parameter. The adjusted parameters in the present study are listed below:
Word patterns
(1) Productions with more than two syllables receive 1 point.
Syllable structures
(1) Productions with a word–final consonant receive 1 point.
(2) Productions with a triphthong receive 1 point for each triphthong.
Sound classes
(1) Productions with a velar consonant receive 1 point for each velar.
(2) Productions with a rhotic vowel /ɚ/ sound receive 1 point for each /ɚ/.
(3) Productions with a fricative or affricate receive 1 point for each fricative and affricate.
(4) Productions with a /ʐ/ sound receive 1 point for each /ʐ/.
(5) Productions with a /y/ receive 1 point for each /y/.
(6) Productions with any of the late acquired sounds /ɨ/, /ɪaʊ/, /ɪo/, /ɪaŋ/, /tɕʰ /, /tɕ/, /ts/, or /ɕ/ receive 1
point for each of the late acquired sounds.
In this version of the WCM, the complexity indexes are modified. In word patterns, instead of
words used in English, utterances (non-words) or phrases (intelligible meaningful units) were the units
for analysis in Chinese version. In rule 1 in the current study, the distinction between a phrase and a
fragment were made first. A phrase may include more than two words with a complete meaning (for
example ‘ping guo’ apple in Chinese), while a fragment is a unfinished phrase that expresses incomplete
meaning due to the sound quality or noise interruption. A fragment may contain only one word or more.
Either a phrase or a fragment is counted as one unit. In syllable structures, the consonant cluster in the
original WCM in rule 2 is replaced by triphthongs.
In sound classes, the syllabic liquid sound in the original WCM is deleted, and the only rhotic
vowel in Chinese /ɚ/ is counted in rule 2. The voiced fricative /ʐ/ and the rounded high front vowel /y/
were added in rules 4 and 5 respectively. In rule 6, the late acquired sounds /ɨ/, /ɪaʊ/, /ɪo/, /ɪaŋ/, /tɕʰ /, /tɕ/,
/ts/, and /ɕ/ were extracted from those acquired in the later stages of the longitudinal observation,
according to the order of emergence and stabilization of vowels and consonants from birth to 36 months
of age.
This parameter acts as an indicator of phonological development. The higher scores reflect more
advanced level of phonological development. Furthermore, the collected data were organized into two
sets. The identifiable words and unintelligible utterances were scored separately. The speech children
made were grouped together as a phrase or a fragment according to the contexts and then were given
235

points through the parameters. Each unit was scored a total point to reflect the quantified level.
Furthermore, the points given by each parameter can also show the qualitative level of development.
Table 1 presents the process of scoring for intelligible words.
Table 1. The 9 parameters and scoring
子音
母音
聲調
國字
grou
p
Phra
se
Frag
men
t
> 2
syl
Fina
l C
Trip
htho
ng
Vela
r
Fr, a
ffri
zr
rho
V
y
Late
acq
uire
d so
und
Tota
l poi
nts
5 23 4 掉 1 p 1 0 2 0 1 0 0 0 1 5
5 16 4 到 1
21 29 5 水 1
8 12 8 了 1
The speech children made were classified as either a phrase or a fragment according to the
contexts and then were given points according to the parameters. Table 1 presents the process of scoring
for intelligible words. The corresponding target form was separately scored. The same process was also
applied to the unintelligible utterances. The WCM assesses developmental phonology through the
independent analysis and the relational analysis. The independent analysis records children’s productions
to track their phonological development, as shown in Table 2. The WCM score presents the complexity
of speech production to show the developmental level of different ages. Hence, the independent analysis
can demonstrate the long-term phonological development of a child. Both quantitative and qualitative
information can be revealed through the independent analysis. Table 2. The independent analysis: children’s phonological development WCM WCM range Words with 0 point
Child (months;days)
Sample words child child Words scored 0/sample words (%)
A(15;09) 1 0 0 1/1 (100%)
A(18;22) 1 0 0 1/1 (100%)
A(21;01) 48 0.91 0-4 25/48 (52%)
A(24;02) 50 1.2 0-5 22/50 (44%)
A(27;18) 50 1.56 0-6 13/50 (26%)
A(30;23) 50 2.44 0-9 7/50 (14%)
A(33;03) 50 2.2 0-7 11/50 (22%)
A(36;09) 50 2.94 0-8 10/50 (20%)
Sample words: the number of words the child produced in this recording session. WCM: the average WCM scores of the child’s production in this recording session. WCM range: the range from the lowest WCM scores to the highest WCM scores. Words with 0 point: the percent of no-point words in all the sample words.
236
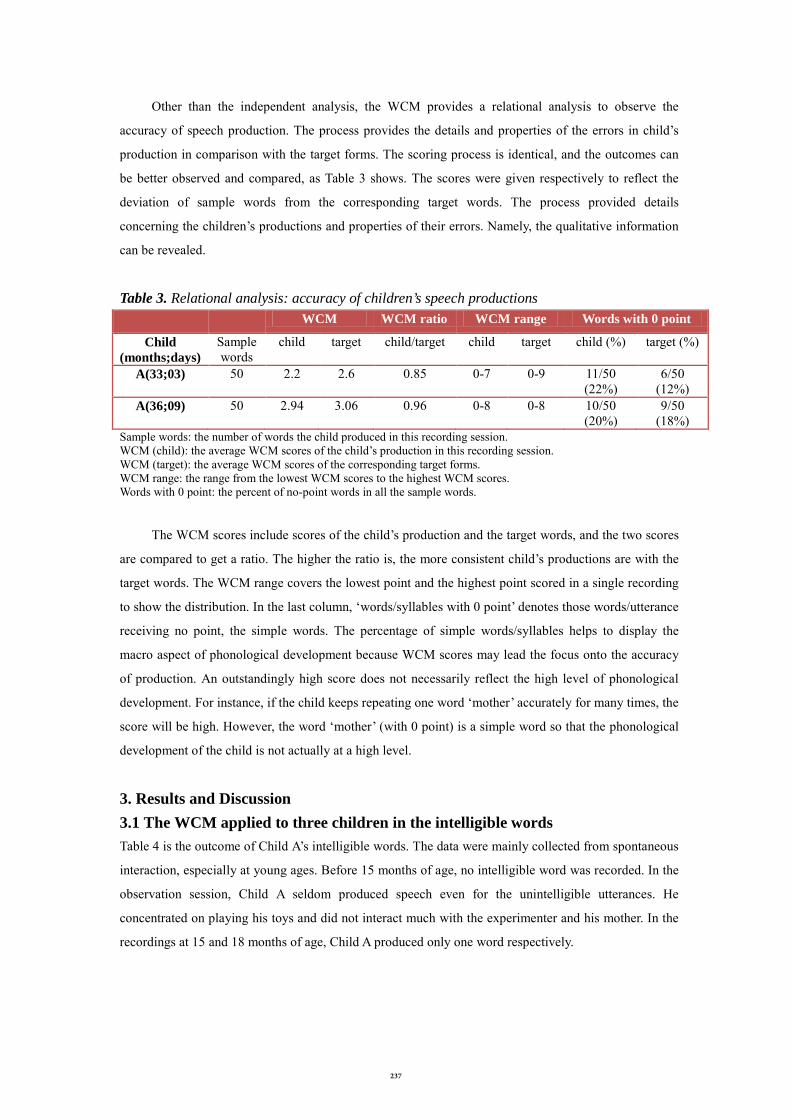
Other than the independent analysis, the WCM provides a relational analysis to observe the
accuracy of speech production. The process provides the details and properties of the errors in child’s
production in comparison with the target forms. The scoring process is identical, and the outcomes can
be better observed and compared, as Table 3 shows. The scores were given respectively to reflect the
deviation of sample words from the corresponding target words. The process provided details
concerning the children’s productions and properties of their errors. Namely, the qualitative information
can be revealed.
Table 3. Relational analysis: accuracy of children’s speech productions WCM WCM ratio WCM range Words with 0 point
Child (months;days)
Sample words
child target child/target child target child (%) target (%)
A(33;03) 50 2.2 2.6 0.85 0-7 0-9 11/50 (22%)
6/50 (12%)
A(36;09) 50 2.94 3.06 0.96 0-8 0-8 10/50 (20%)
9/50 (18%)
Sample words: the number of words the child produced in this recording session. WCM (child): the average WCM scores of the child’s production in this recording session. WCM (target): the average WCM scores of the corresponding target forms. WCM range: the range from the lowest WCM scores to the highest WCM scores. Words with 0 point: the percent of no-point words in all the sample words.
The WCM scores include scores of the child’s production and the target words, and the two scores
are compared to get a ratio. The higher the ratio is, the more consistent child’s productions are with the
target words. The WCM range covers the lowest point and the highest point scored in a single recording
to show the distribution. In the last column, ‘words/syllables with 0 point’ denotes those words/utterance
receiving no point, the simple words. The percentage of simple words/syllables helps to display the
macro aspect of phonological development because WCM scores may lead the focus onto the accuracy
of production. An outstandingly high score does not necessarily reflect the high level of phonological
development. For instance, if the child keeps repeating one word ‘mother’ accurately for many times, the
score will be high. However, the word ‘mother’ (with 0 point) is a simple word so that the phonological
development of the child is not actually at a high level.
3. Results and Discussion 3.1 The WCM applied to three children in the intelligible words Table 4 is the outcome of Child A’s intelligible words. The data were mainly collected from spontaneous
interaction, especially at young ages. Before 15 months of age, no intelligible word was recorded. In the
observation session, Child A seldom produced speech even for the unintelligible utterances. He
concentrated on playing his toys and did not interact much with the experimenter and his mother. In the
recordings at 15 and 18 months of age, Child A produced only one word respectively.
237
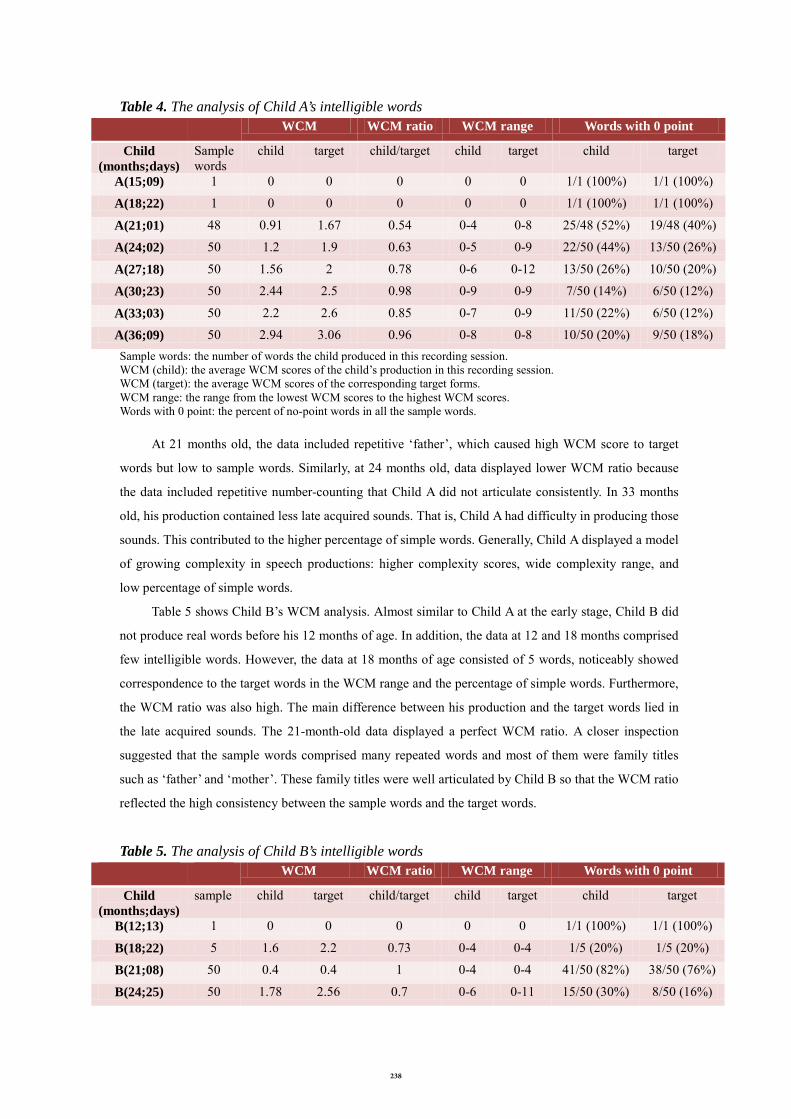
Table 4. The analysis of Child A’s intelligible words WCM WCM ratio WCM range Words with 0 point
Child (months;days)
Sample words
child target child/target child target child target
A(15;09) 1 0 0 0 0 0 1/1 (100%) 1/1 (100%)
A(18;22) 1 0 0 0 0 0 1/1 (100%) 1/1 (100%)
A(21;01) 48 0.91 1.67 0.54 0-4 0-8 25/48 (52%) 19/48 (40%)
A(24;02) 50 1.2 1.9 0.63 0-5 0-9 22/50 (44%) 13/50 (26%)
A(27;18) 50 1.56 2 0.78 0-6 0-12 13/50 (26%) 10/50 (20%)
A(30;23) 50 2.44 2.5 0.98 0-9 0-9 7/50 (14%) 6/50 (12%)
A(33;03) 50 2.2 2.6 0.85 0-7 0-9 11/50 (22%) 6/50 (12%)
A(36;09) 50 2.94 3.06 0.96 0-8 0-8 10/50 (20%) 9/50 (18%) Sample words: the number of words the child produced in this recording session. WCM (child): the average WCM scores of the child’s production in this recording session. WCM (target): the average WCM scores of the corresponding target forms. WCM range: the range from the lowest WCM scores to the highest WCM scores. Words with 0 point: the percent of no-point words in all the sample words.
At 21 months old, the data included repetitive ‘father’, which caused high WCM score to target
words but low to sample words. Similarly, at 24 months old, data displayed lower WCM ratio because
the data included repetitive number-counting that Child A did not articulate consistently. In 33 months
old, his production contained less late acquired sounds. That is, Child A had difficulty in producing those
sounds. This contributed to the higher percentage of simple words. Generally, Child A displayed a model
of growing complexity in speech productions: higher complexity scores, wide complexity range, and
low percentage of simple words.
Table 5 shows Child B’s WCM analysis. Almost similar to Child A at the early stage, Child B did
not produce real words before his 12 months of age. In addition, the data at 12 and 18 months comprised
few intelligible words. However, the data at 18 months of age consisted of 5 words, noticeably showed
correspondence to the target words in the WCM range and the percentage of simple words. Furthermore,
the WCM ratio was also high. The main difference between his production and the target words lied in
the late acquired sounds. The 21-month-old data displayed a perfect WCM ratio. A closer inspection
suggested that the sample words comprised many repeated words and most of them were family titles
such as ‘father’ and ‘mother’. These family titles were well articulated by Child B so that the WCM ratio
reflected the high consistency between the sample words and the target words.
Table 5. The analysis of Child B’s intelligible words WCM WCM ratio WCM range Words with 0 point
Child (months;days)
sample child target child/target child target child target
B(12;13) 1 0 0 0 0 0 1/1 (100%) 1/1 (100%)
B(18;22) 5 1.6 2.2 0.73 0-4 0-4 1/5 (20%) 1/5 (20%)
B(21;08) 50 0.4 0.4 1 0-4 0-4 41/50 (82%) 38/50 (76%)
B(24;25) 50 1.78 2.56 0.7 0-6 0-11 15/50 (30%) 8/50 (16%)
238
B(27;07) 50 1.42 1.98 0.72 0-7 0-8 18/50 (36%) 7/50 (14%)
B(30;01) 37 1.49 2.14 0.7 0-5 0-5 15/37 (41%) 9/37 (24%)
B(33;10) 50 1.52 2.18 0.7 0-7 0-8 22/50 (44%) 18/50 (36%)
B(36;15) 50 1.44 1.7 0.85 0-8 0-7 23/50 (46%) 18/50 (36%) Sample words: the number of words the child produced in this recording session. WCM (child): the average WCM scores of the child’s production in this recording session. WCM (target): the average WCM scores of the corresponding target forms. WCM range: the range from the lowest WCM scores to the highest WCM scores. Words with 0 point: the percent of no-point words in all the sample words.
At 27 months of age, the target words were highly scored in final consonant and the emergence of
fricative/affricate sounds, while productions of Child B were poorly scored in these two parameters. The
point for final consonant in target words was 16 but sample words got no point for final consonant. The
percentage of simple words also showed a gap between the sample words and the target words. In
general, the phonological development of Child B seems slightly slower but stable, and the percentage
of simple words decreases as age grows.
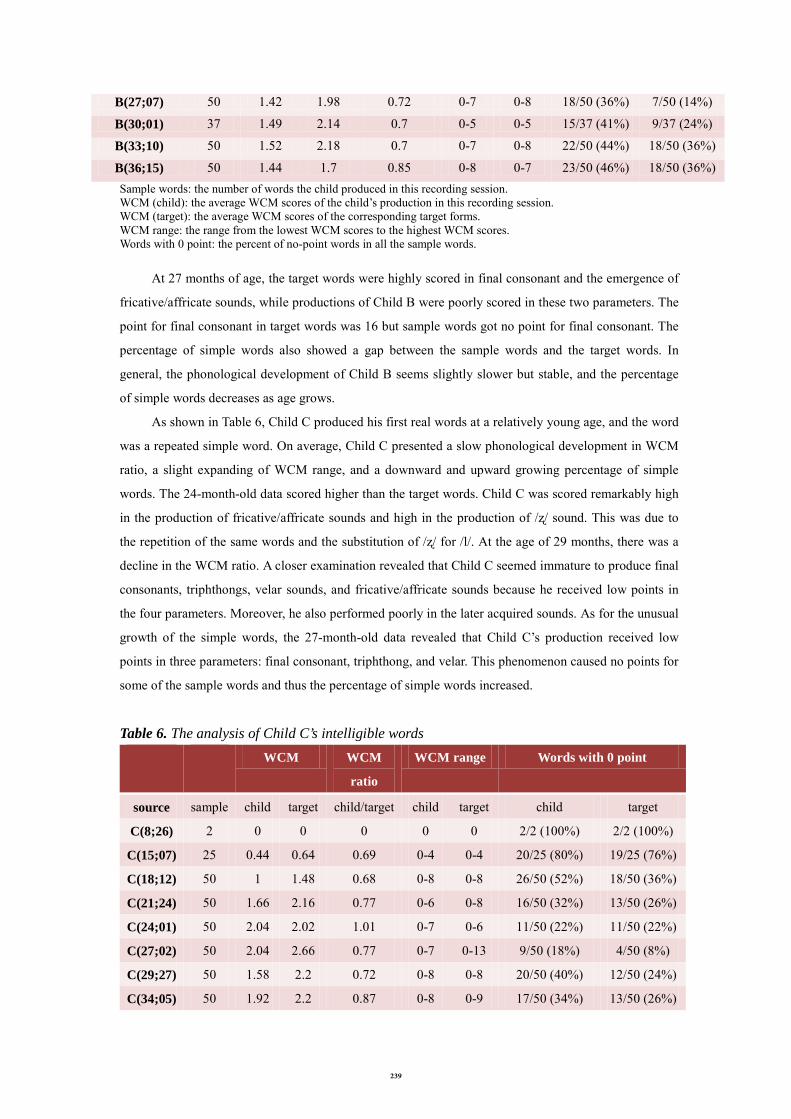
As shown in Table 6, Child C produced his first real words at a relatively young age, and the word
was a repeated simple word. On average, Child C presented a slow phonological development in WCM
ratio, a slight expanding of WCM range, and a downward and upward growing percentage of simple
words. The 24-month-old data scored higher than the target words. Child C was scored remarkably high
in the production of fricative/affricate sounds and high in the production of /ʐ/ sound. This was due to
the repetition of the same words and the substitution of /ʐ/ for /l/. At the age of 29 months, there was a
decline in the WCM ratio. A closer examination revealed that Child C seemed immature to produce final
consonants, triphthongs, velar sounds, and fricative/affricate sounds because he received low points in
the four parameters. Moreover, he also performed poorly in the later acquired sounds. As for the unusual
growth of the simple words, the 27-month-old data revealed that Child C’s production received low
points in three parameters: final consonant, triphthong, and velar. This phenomenon caused no points for
some of the sample words and thus the percentage of simple words increased.
Table 6. The analysis of Child C’s intelligible words
WCM WCM
ratio
WCM range Words with 0 point
source sample child target child/target child target child target
C(8;26) 2 0 0 0 0 0 2/2 (100%) 2/2 (100%)
C(15;07) 25 0.44 0.64 0.69 0-4 0-4 20/25 (80%) 19/25 (76%)
C(18;12) 50 1 1.48 0.68 0-8 0-8 26/50 (52%) 18/50 (36%)
C(21;24) 50 1.66 2.16 0.77 0-6 0-8 16/50 (32%) 13/50 (26%)
C(24;01) 50 2.04 2.02 1.01 0-7 0-6 11/50 (22%) 11/50 (22%)
C(27;02) 50 2.04 2.66 0.77 0-7 0-13 9/50 (18%) 4/50 (8%)
C(29;27) 50 1.58 2.2 0.72 0-8 0-8 20/50 (40%) 12/50 (24%)
C(34;05) 50 1.92 2.2 0.87 0-8 0-9 17/50 (34%) 13/50 (26%)
239

C(35;24) 50 1.72 2.16 0.8 0-9 0-10 21/50 (42%) 16/50 (32%) Sample words: the number of words the child produced in this recording session. WCM (child): the average WCM scores of the child’s production in this recording session. WCM (target): the average WCM scores of the corresponding target forms. WCM range: the range from the lowest WCM scores to the highest WCM scores. Words with 0 point: the percent of no-point words in all the sample words.
3.1.1 Summary and the analysis: the intelligible words
Figure 1. The WCM ratios of intelligible words among three subjects
Figure 1 compares the WCM ratio throughout 10 age stages of the three children. As seen in the
figure, child A started his speech later than the other two but the phonological development seemed more
stable and kept growing. Child C started his first words the earliest but the phonological development
seemed unstable with irregular up-down pattern. Child B’s WCM ratios arouse and dropped, and then
came in plain, and rose in the later stage. Figures 2, 3, 4 present the percentages of simple words in the
productions of the three children respectively.
Figure 2. The simple words in the production of Child A
0
0.2
0.4
0.6
0.8
1
1.2
8 mths 12 mths 15 mths 18 mths 21 mths 24 mths 27 mths 30 mths 33 mths
The WCM ratio
Child A Child B Child C
0%
20%
40%
60%
80%
100%
15;09 18;22 21;01 24;02 27;18 30;23 33;03 36;09
Child A
target
240
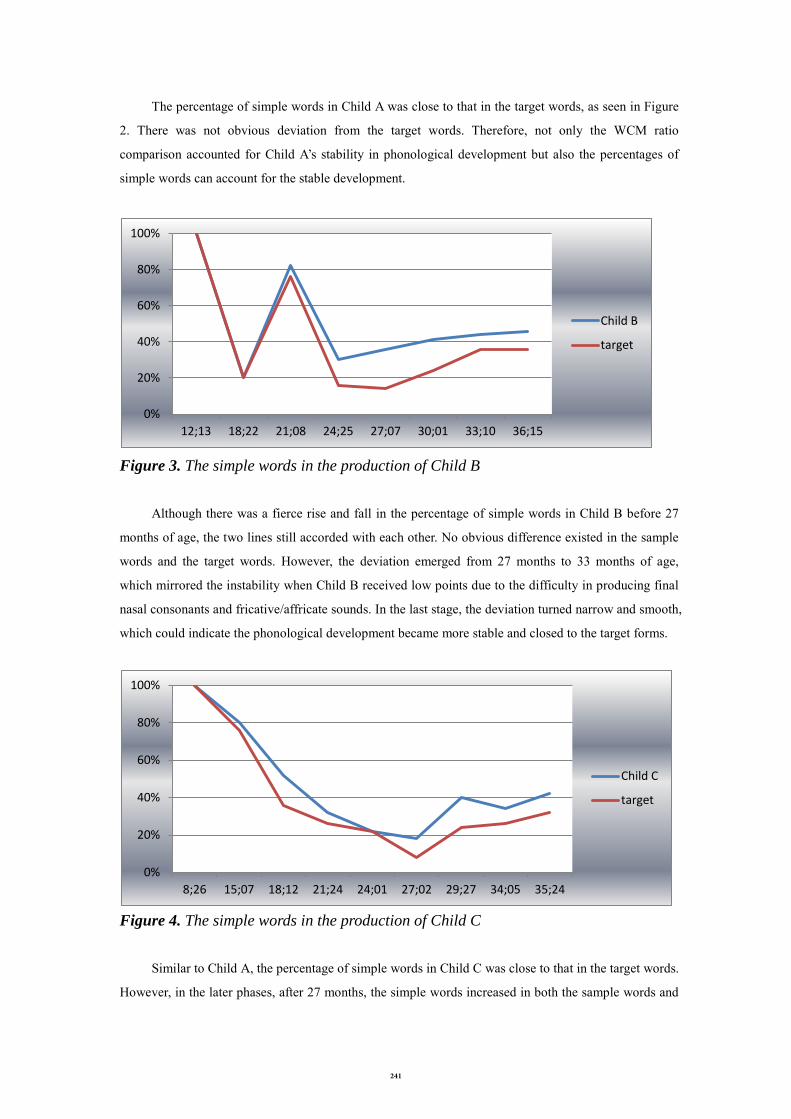
The percentage of simple words in Child A was close to that in the target words, as seen in Figure
2. There was not obvious deviation from the target words. Therefore, not only the WCM ratio
comparison accounted for Child A’s stability in phonological development but also the percentages of
simple words can account for the stable development.
Figure 3. The simple words in the production of Child B
Although there was a fierce rise and fall in the percentage of simple words in Child B before 27
months of age, the two lines still accorded with each other. No obvious difference existed in the sample
words and the target words. However, the deviation emerged from 27 months to 33 months of age,
which mirrored the instability when Child B received low points due to the difficulty in producing final
nasal consonants and fricative/affricate sounds. In the last stage, the deviation turned narrow and smooth,
which could indicate the phonological development became more stable and closed to the target forms.
Figure 4. The simple words in the production of Child C
Similar to Child A, the percentage of simple words in Child C was close to that in the target words.
However, in the later phases, after 27 months, the simple words increased in both the sample words and
0%
20%
40%
60%
80%
100%
12;13 18;22 21;08 24;25 27;07 30;01 33;10 36;15
Child B
target
0%
20%
40%
60%
80%
100%
8;26 15;07 18;12 21;24 24;01 27;02 29;27 34;05 35;24
Child C
target
241
the target words. The reason was that Child C poorly performed in final consonant sounds, triphthongs,
and velar sounds. This phenomenon caused no points for some of the sample words and thus rose the
percentage of simple words.
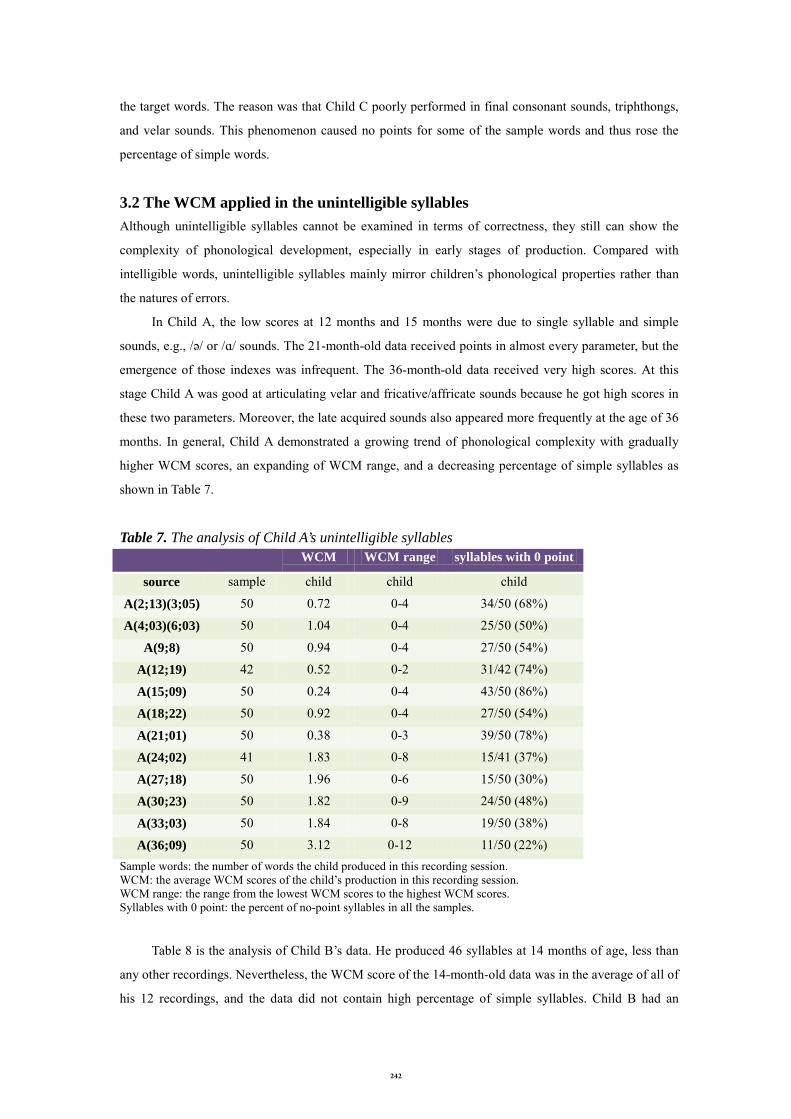
3.2 The WCM applied in the unintelligible syllables Although unintelligible syllables cannot be examined in terms of correctness, they still can show the
complexity of phonological development, especially in early stages of production. Compared with
intelligible words, unintelligible syllables mainly mirror children’s phonological properties rather than
the natures of errors.
In Child A, the low scores at 12 months and 15 months were due to single syllable and simple
sounds, e.g., /ə/ or /ɑ/ sounds. The 21-month-old data received points in almost every parameter, but the
emergence of those indexes was infrequent. The 36-month-old data received very high scores. At this
stage Child A was good at articulating velar and fricative/affricate sounds because he got high scores in
these two parameters. Moreover, the late acquired sounds also appeared more frequently at the age of 36
months. In general, Child A demonstrated a growing trend of phonological complexity with gradually
higher WCM scores, an expanding of WCM range, and a decreasing percentage of simple syllables as
shown in Table 7.
Table 7. The analysis of Child A’s unintelligible syllables WCM WCM range syllables with 0 point
source sample child child child
A(2;13)(3;05) 50 0.72 0-4 34/50 (68%)
A(4;03)(6;03) 50 1.04 0-4 25/50 (50%)
A(9;8) 50 0.94 0-4 27/50 (54%)
A(12;19) 42 0.52 0-2 31/42 (74%)
A(15;09) 50 0.24 0-4 43/50 (86%)
A(18;22) 50 0.92 0-4 27/50 (54%)
A(21;01) 50 0.38 0-3 39/50 (78%)
A(24;02) 41 1.83 0-8 15/41 (37%)
A(27;18) 50 1.96 0-6 15/50 (30%)
A(30;23) 50 1.82 0-9 24/50 (48%)
A(33;03) 50 1.84 0-8 19/50 (38%)
A(36;09) 50 3.12 0-12 11/50 (22%) Sample words: the number of words the child produced in this recording session. WCM: the average WCM scores of the child’s production in this recording session. WCM range: the range from the lowest WCM scores to the highest WCM scores. Syllables with 0 point: the percent of no-point syllables in all the samples.
Table 8 is the analysis of Child B’s data. He produced 46 syllables at 14 months of age, less than
any other recordings. Nevertheless, the WCM score of the 14-month-old data was in the average of all of
his 12 recordings, and the data did not contain high percentage of simple syllables. Child B had an
242
obviously high and a relative low WCM scores in his 4-to-5-month-old data and 12-month-old data. In
the former, Child B articulated phoneme /h/ in almost every syllable, which contributed to a very high
score in the velar sounds. The latter, the points almost gathered in the parameters ‘velar’ and
‘fricative/affricate’ which suggested that Child B was mature in articulating velar sounds and
fricative/affricate sounds. Only one point was respectively given to the final consonant sounds and the
utterances containing more than two syllables. Generally speaking, the WCM scores in Child B were
quite high, yet the percentages of simple syllables were high.
Table 8. The analysis of Child B’s unintelligible syllables WCM WCM range syllables with 0 point
source sample child child child
B(2;13)(3;04) 50 1.3 0-11 28/50 (56%)
B(4;04)(6;05) 50 2.22 0-8 17/50 (34%)
B(9;05) 50 1.26 0-7 28/50 (56%)
B(12;13) 50 0.68 0-4 33/50 (66%)
B(14;28) 46 1.3 0-4 19/46 (41%)
B(18;22) 50 0.92 0-3 23/50 (46%)
B(21;08) 50 1.22 0-5 20/50 (40%)
B(24;25) 50 1.14 0-5 22/50 (44%)
B(27;07) 50 0.96 0-6 28/50 (56%)
B(30;01) 50 0.92 0-5 32/50 (64%)
B(33;10) 50 0.82 0-7 32/50 (64%)
B(36;15) 50 0.82 0-5 29/50 (58%) Sample words: the number of words the child produced in this recording session. WCM: the average WCM scores of the child’s production in this recording session. WCM range: the range from the lowest WCM scores to the highest WCM scores. Syllables with 0 point: the percent of no-point syllables in all the samples.
Child C’s data analysis is shown in Table 9. The data that consisted of less than 50 samples were at
8, 15, and 24 months of age. Child C generally displayed a stable phonological development, except for
the two data that received relatively low WCM scores. The data at 15 months and 18 months included
much more simple syllables. Conversely, the 24-month-old data included low percentage of simple
syllables. The late acquired sounds emerged frequently at this stage.
Table 9. The analysis of Child C’s unintelligible syllables WCM WCM range syllables with 0 point
source sample child child child
C(2;15)(3;02) 50 1.46 0-4 19/50 (38%)
C(4;08)(6;09) 50 1.2 0-4 26/50 (52%)
C(8;26) 43 1.35 0-4 18/43 (42%)
C(12;19) 50 1.04 0-4 28/50 (56%)
243
C(15;07) 44 0.68 0-4 31/44 (70%)
C(18;12) 49 0.98 0-4 30/49 (61%)
C(21;24) 50 1.36 0-7 23/50 (46%)
C(24;01) 39 1.33 0-4 12/39 (31%)
C(27;02) 50 1.08 0-7 25/50 (50%)
C(29;27) 50 1.44 0-10 23/50 (46%)
C(34;05) 50 1.62 0-9 21/50 (42%)
C(35;24) 50 1.6 0-6 18/50 (36%) Sample words: the number of words the child produced in this recording session. WCM: the average WCM scores of the child’s production in this recording session. WCM range: the range from the lowest WCM scores to the highest WCM scores. Syllables with 0 point: the percent of no-point syllables in all the samples. 3.2.1 Summary and the analysis: the unintelligible syllables
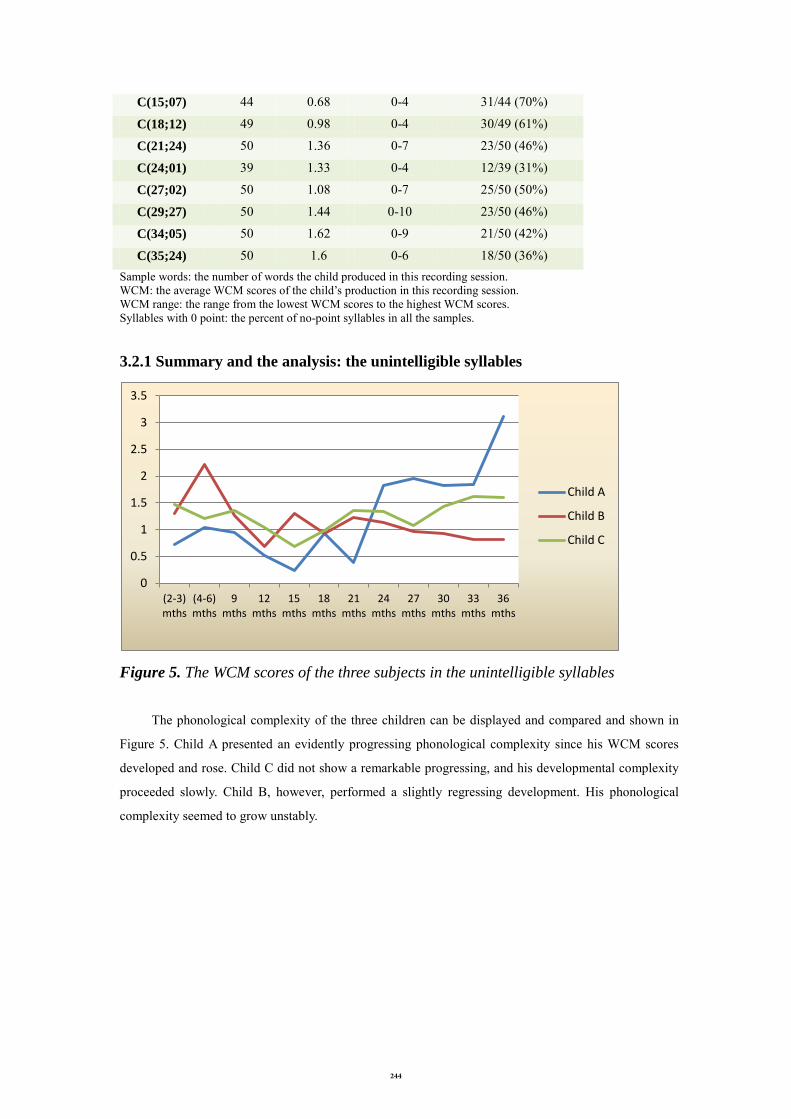
Figure 5. The WCM scores of the three subjects in the unintelligible syllables
The phonological complexity of the three children can be displayed and compared and shown in
Figure 5. Child A presented an evidently progressing phonological complexity since his WCM scores
developed and rose. Child C did not show a remarkable progressing, and his developmental complexity
proceeded slowly. Child B, however, performed a slightly regressing development. His phonological
complexity seemed to grow unstably.
0
0.5
1
1.5
2
2.5
3
3.5
(2-3) mths
(4-6) mths
9 mths
12 mths
15 mths
18 mths
21 mths
24 mths
27 mths
30 mths
33 mths
36 mths
Child A
Child B
Child C
244

Figure 6. The relation between Child A’s WCM scores and the simple syllables
Figure 7. The relation between Child B’s WCM scores and the simple syllables
Figure 8. The relation between Child C’s WCM scores and the simple syllables
0
0.5
1
1.5
2
2.5
3
3.5
Child A WCM
simple syllables
0
0.5
1
1.5
2
2.5
3
3.5
Child B WCM
simple syllables
0
0.5
1
1.5
2
2.5
3
3.5
Child C WCM
simpel syllables
245
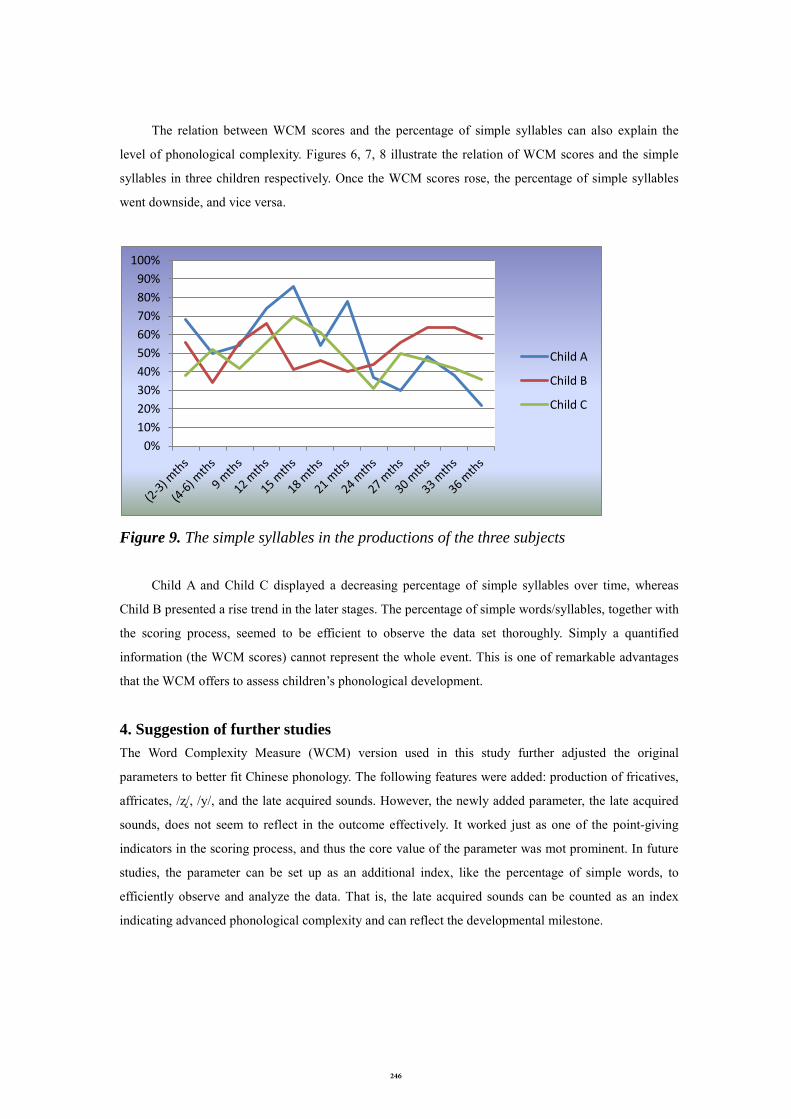
The relation between WCM scores and the percentage of simple syllables can also explain the
level of phonological complexity. Figures 6, 7, 8 illustrate the relation of WCM scores and the simple
syllables in three children respectively. Once the WCM scores rose, the percentage of simple syllables
went downside, and vice versa.
Figure 9. The simple syllables in the productions of the three subjects
Child A and Child C displayed a decreasing percentage of simple syllables over time, whereas
Child B presented a rise trend in the later stages. The percentage of simple words/syllables, together with
the scoring process, seemed to be efficient to observe the data set thoroughly. Simply a quantified
information (the WCM scores) cannot represent the whole event. This is one of remarkable advantages
that the WCM offers to assess children’s phonological development. 4. Suggestion of further studies
The Word Complexity Measure (WCM) version used in this study further adjusted the original
parameters to better fit Chinese phonology. The following features were added: production of fricatives,
affricates, /ʐ/, /y/, and the late acquired sounds. However, the newly added parameter, the late acquired
sounds, does not seem to reflect in the outcome effectively. It worked just as one of the point-giving
indicators in the scoring process, and thus the core value of the parameter was mot prominent. In future
studies, the parameter can be set up as an additional index, like the percentage of simple words, to
efficiently observe and analyze the data. That is, the late acquired sounds can be counted as an index
indicating advanced phonological complexity and can reflect the developmental milestone.
0% 10% 20% 30% 40% 50% 60% 70% 80% 90%
100%
Child A
Child B
Child C
246
References
Carson, P. C., Klee, T., Carson, K. D., & Hime, K. L. (2003). Phonological profiles of 2-year-olds with
delayed language development predicting clinical outcomes at age 3. American Journal of
Speech-Language Pathology, 12, 28-39.
Ingram, D. (2002). The measurement of whole-word productions. Journal of Child Language, 29(4),
713-733.
Moeller, M. P., Hoover, B., Putman, C., Arbataitis, K., Bohnenkamp, G., Peterson, B., Wood, S., Lewis,
D., Pittman, A., & Stelmachowicz, P. (2007). Vocalizations of Infants with Hearing Loss Compared
with Infants with Normal Hearing: Part I - Phonetic development. Ear & Hearing, 28(5), 605-627.
Moeller, M. P., Hoover, B., Putman, C., Arbataitis, K., Bohnenkamp, G., Peterson, B., Wood, S., Lewis,
D., Pittman, A., & Stelmachowicz, P. (2007). Vocalizations of Infants with Hearing Loss Compared
with Infants with Normal Hearing: Part II - Transition to words. Ear & Hearing, 28(5), 628-642.
Morris, R. S. (2009). Test-retest reliability of independent measures of phonology in the assessment of
toddlers' speech. Language, Speech, and Hearing Services in Schools, 40, 46-52.
Paul, R., & Jennings, P. (1992). Phonological behaviors in toddlers with slow expressive language
development. Journal of Speech and Hearing Research, 35, 99-107.
Shriberg, L., Austin, D., Lewis, B., McSweeny, J., & Wilson, D. (1997). The Percentage of
Consonants Correct (PCC) metric: extensions and reliability data. Journal of Speech, Language,
and Hearing Research, 40, 708-722.
Stoel-Gammon, C. (1989). Prespeech and early speech development of two late talkers. First Language,
9, 207-224.
Stoel-Gammon, C. (2010). The word complexity measure: Description and application to
developmental phonology and disorders. Clinical Linguistics & Phonetics, 24(4-5), 271-282.
247


![SSC - prepadda.comprepadda.com/wp-content/uploads/english/ARTICLE IMPORTANT NOTES[].pdf Means to say ( ) Vowel Consonant Consonant Vowel Vowel = Vowel Consonant = Consonant ... I had](https://img.dokumen.tips/doc/110x75/5e4437036ae6ba6d743ded6b/ssc-prepaddacomprepaddacomwp-contentuploadsenglisharticle-important-notes.jpg)