Embed Size (px)
Citation preview

THE WMUR GRANITE STATE POLL THE UNIVERSITY OF NEW HAMPSHIRE SURVEY CENTER
September 13, 2012
RACE FOR PRESIDENT IN NH REMAINS CLOSE, MORE VOTERS UNDECIDED
By: Andrew E. Smith, Ph.D. Chad S. Novak, M.A. UNH Survey Center 603/862-2226 www.unh.edu/survey-center DURHAM, NH – The race between President Barack Obama and Mitt Romney remains tight in New Hampshire, but the percentage of voters who remain undecided has tripled in the last month. A slim majority of voters predict that the Obama/Biden ticket will ultimately win the election.
These findings are based on the latest WMUR Granite State Poll,∗ conducted by the University of New Hampshire Survey Center. Six hundred and thirty-five (635) randomly selected New Hampshire adults were interviewed by landline and cellular telephone between September 4 and September 10, 2012. The margin of sampling error for the survey is +/- 3.9 percent. Included is a subsample of 592 likely general election voters (margin of sampling error +/- 4.0%).
2012 Presidential Election
In the wake of the Democratic and Republican National Conventions, the race between President Barack Obama and Mitt Romney continues to be very close in the battleground state of New Hampshire. In the most recent Granite State Poll, 45% of likely New Hampshire voters plan to vote for Obama, 40% say they will support Romney, 3% prefer some other candidate, and 12% say they are undecided. The percentage of those who say they are undecided has tripled since August, when only 4% were undecided. There is a gender gap that continues to favor Obama -- women prefer Obama over Romney by 14 percentage points, essentially unchanged from 16 percentage points in August. Men continue to favor Romney, but by a slim 5 percentage points, down from 11 percentage points in August. There is a large class difference among women -- Obama’s strongest support comes from college educated women, where he holds a 25 percentage point lead, but this lead disappears among working class women who favor Romney by 1 percentage point. Republicans hold an edge in motivation with 62% of Republicans saying they are very interested in the election compared with 55% of Democrats. Similarly, 69% of Republicans say they often discuss the election with family and friends compared with 61% of Democrats, and among all New Hampshire adults, 90% of Republicans say they will definitely vote compared to 82% of Democrats. However, most likely New Hampshire voters predict that Obama will ultimately win reelection. When asked who they think is more likely to win the 2012 presidential election, 51% think Obama will win reelection, 29% think Romney will win, 1% say some other candidate will, and 19% are unsure of the outcome. Most Democrats (85%) think Obama will win, while only 55% of Republicans predict Romney will win. Independents divided -- 43% think Obama will win, 32% believe Romney will win, and 25% are unsure.
∗ We ask that this copyrighted information be referred to as the Granite State Poll, sponsored by WMUR-TV, and conducted by the University of New Hampshire Survey Center.

Both Obama and Romney have seen support among their base voters waver. Obama currently has the support of 89% of New Hampshire Democrats, down slightly from 92% in August and Romney has the support of only 82% of Republicans, down from 90% in August. Independents remain split, 36% for Romney and 32% for Obama, but 25% are undecided.
41%43% 43% 42%
50%51% 49% 49%
45%49% 50%
47%50%
40%42%
45% 46%
40%
7% 6% 7% 9% 9% 7% 7% 6%
15%
0%
10%
20%
30%
40%
50%
60%
Feb. '11 April '11 July '11 Oct. '11 Feb. '12 Apr. '12 Jul. '12 Aug. '12 Sept. '12
November 2012 General Election - Obama vs. Romney
(Likely 2012 General Election Voters)
Obama Romney Other/Undecided
US President Preference in NH Among Independent Voters
32% 31%35%
32%30%
40% 40%42%
32%
45%49%
41% 42%
47%
35%
41%39%
36%
0%
10%
20%
30%
40%
50%
60%
Feb. '11 April '11 July '11 Oct. '11 Feb. '12 Apr. '12 Jul. '12 Aug. '12 Sept. '12
Obama Romney

Currently, 73% of likely New Hampshire voters say they have definitely decided who they will vote for in November, 16% are leaning towards a candidate, and 10% are still trying to decide. The percentage of those who say they have definitely decided who they will vote for has climbed 2 percentage points in the last month.
Both Democratic and Republican conventions responded to the question of whether the country is better off today than four years ago. New Hampshire likely voters split over this question -- 37% say they are better off today than they were four years ago, 37% say they are worse off, 24% say they are about the same, and 1% are unsure. There is a partisan divide in perceptions with most Democrats (62%) saying they are better off, while 64% of Republicans say they are worse off. Independents are split, with 38% saying they are worse off and 33% better off.
39%
55%
66%71% 73%
25%18% 16%
13%
16%
33%26%
18%15%
10%0%
10%
20%
30%
40%
50%
60%
70%
80%
90%
100%
Feb. '12 Apr. '12 Jul. '12 Aug. '12 Sept. '12
Decided Presidential Vote
(Likely 2012 General Election Voters)
Def. Decided Leaning Towards Someone Still Trying to Decide
37% 37%
24%
13%
64%
21%
33%38%
26%
62%
11%
26%
0%
10%
20%
30%
40%
50%
60%
70%
80%
90%
100%
Better Off Worse Off About the Same
Are You Better Off or Worse Off Than Four Years Ago?
(Likely 2012 General Election Voters)
All NH LVs Republicans Independents Democrats

Candidate Favorability Ratings
Obama’s favorability ratings have improved slightly since August. Obama is currently viewed favorably by 52% of New Hampshire likely voters, 43% have an unfavorable opinion of him, and 6% are neutral or don’t know enough about him to say. Obama’s net favorability rating, the percentage having a favorable opinion minus the percentage having an unfavorable opinion, is +9%, up from +1% in August. New Hampshire Democrats continue to have a very favorable view towards Obama (net favorability rating of +94%), while political independents have a somewhat favorable opinion of him (+12% net). Republicans (-80% net) continue to have a very unfavorable opinion of the President.
Mitt Romney continues to remain less popular than President Obama among New Hampshire voters. Only 45% of New Hampshire likely voters have a favorable opinion of Romney, 48% have an unfavorable opinion of him, and 8% are neutral or don’t know enough about him to say. His net favorability rating is -3%, essentially unchanged from -5% in August. Romney’s net favorability rating has improved slightly among Republicans – it currently stands at +81%, up from +74% in August. He is still viewed unfavorably by Independents (-2% net) and Democrats (-86% net).
52%47% 48%
52%
44%47% 47%
43%
0%
10%
20%
30%
40%
50%
60%
70%
80%
90%
100%
Apr. '12 July '12 Aug. '12 Sep. '12
Favorability Ratings – Barack Obama
(Likely 2012 General Election Voters)
Favorable Unfavorable
36% 38%42%
45%
52%47% 48% 48%
0%
10%
20%
30%
40%
50%
60%
70%
80%
90%
100%
Apr. '12 July '12 Aug. '12 Sep. '12
Favorability Ratings – Mitt Romney
(Likely 2012 General Election Voters)
Favorable Unfavorable

Vice President Job Biden is viewed less favorably than Obama in New Hampshire. Only 39% of New Hampshire likely voters have a favorable opinion of Biden, 43% have an unfavorable opinion of him, and 18% are neutral or don’t know enough about him to say. Biden’s net favorability rating is -4%; +65% among Democrats, -1% among independents, and -78% among Republicans. Romney’s running mate, Wisconsin Congressman Paul Ryan, has similar favorability ratings as Biden. Currently, 39% of New Hampshire likely voters have a favorable opinion of Ryan, 41% have an unfavorable view towards him, and 20% are neutral or don’t know enough to say. Ryan’s net favorability rating is -2%; +71% among Republicans, +2% among independents, and -72% among Democrats.
Presidential Approval
President Obama’s job approval ratings in New Hampshire have improved somewhat in recent months. Currently, 52% of New Hampshire adults say they approve of the job Obama is doing as president, 44% disapprove, and 4% are neutral. By comparison, George W. Bush’s New Hampshire approval rating in September 2004 stood at 51%.
President Obama’s job approval ratings have remained steady among different political groups. Nearly all Democrats (95%) approve of President Obama’s job performance, while four in ten (38%) Independents continue to say they approve and only 10% of Republicans approve.
66%63% 61%
55%48% 50% 51%
46% 46% 44% 46%41%
51% 50%
47% 47%
52%
21%29%
33%40%
47% 46% 44%
50% 49%52%
49%53%
43%47%
48% 49%
44%
0%
10%
20%
30%
40%
50%
60%
70%
80%
90%
100%
Approve Disapprove
Barack Obama Approval, All NH Adults

Granite State Poll Methodology
These findings are based on the latest WMUR Granite State Poll, conducted by the University of New Hampshire Survey Center. Six hundred and thirty-five (635) randomly selected New Hampshire adults were interviewed by landline and cellular telephone between September 4 and September 10, 2012. The margin of sampling error for the survey is +/- 3.9 percent. Included is a subsample of 592 likely general election voters (margin of sampling error +/- 4.0%). The data have been weighted to adjust for numbers of adults and telephone lines within households, respondent sex, and region of the state. In addition to potential sampling error, all surveys have other potential sources of non-sampling error including question order effects, question wording effects, and non-response.
Presidential Approval – All Adults
“GENERALLY SPEAKING, do you approve or disapprove of the way Barack Obama is handling his job as president?”
Approve Neutral Disapprove (N)
Sept. ‘12 52% 4% 44% (635)
Aug. ‘12 47% 4% 49% (579)
July ‘12 47% 5% 48% (517)
Apr. ‘12 50% 3% 47% (535)
Feb. ‘12 51% 6% 43% (524)
Oct. ‘11 41% 6% 53% (551)
July ‘11 46% 6% 49% (512)
Apr. ‘11 44% 5% 52% (502)
Feb. ‘11 46% 4% 49% (519)
Sept. ‘10 46% 4% 50% (514)
July ‘10 51% 5% 44% (502)
Apr. ‘10 50% 4% 46% (506)
Feb. ‘10 48% 5% 47% (495)
Oct. ‘09 55% 5% 40% (503)
July ‘09 61% 6% 33% (556)
Apr. ‘09 63% 8% 29% (500)
Feb. ‘09 66% 14% 21% (614)
Presidential Approval in NH by Party Identification (% Approve)
66% 63% 61%55%
48% 50% 51%
46% 46% 44% 46%41%
51% 50%47%
47%52%
39%36%
26%
15%12% 10%
13%10%
13%4%
10%
6%
10% 11% 9% 9% 10%
65%62% 63% 65%
39%
45% 47%42%
46%
32%
39%35% 34% 36%
41%38% 38%
90%
97%93% 91%
84%
90%85% 86% 88%
85%81%
78%
92% 90%87% 88%
95%
0%
10%
20%
30%
40%
50%
60%
70%
80%
90%
100%
All NH Adults GOP IND DEM

Favorability Rating –Barack Obama - Likely Voters
"Next, I'd like to get your overall opinion of some people who have been in the news. As I read each name, please say if you have a favorable or unfavorable opinion of this person - or if you don’t know enough about him or her to say. President Barack Obama?"
Favorable Neutral/DK Unfavorable NET (N=)
Sept’ 12 52% 5% 43% +9% (592)
Aug. ‘12 48% 6% 47% +1% (553)
July ’12 47% 6% 47% 0% (486)
Apr. ‘12 52% 4% 44% +8% (494)
Favorability Rating – Mitt Romney - Likely Voters
"Next, I'd like to get your overall opinion of some people who have been in the news. As I read each name, please say if you have a favorable or unfavorable opinion of this person - or if you don’t know enough about him or her to say. Former Massachusetts Governor Mitt Romney?"
Favorable Neutral/DK Unfavorable NET (N=)
Sept’ 12 45% 8% 48% -3% (591)
Aug. ‘12 42% 10% 48% -6% (554)
July ’12 38% 14% 47% -9% (518)
Apr. ‘12 36% 12% 52% -15% (495)
Favorability Rating of Vice Presidential Candidates - Likely Voters
"Next, I'd like to get your overall opinion of some people who have been in the news. As I read each name, please say if you have a favorable or unfavorable opinion of this person - or if you don’t know enough about him or her to say. Vice President Joe Biden / Congressman Paul Ryan?"
Favorable Neutral/DK Unfavorable NET (N=)
Joe Biden 39% 18% 43% -4% (592)
Paul Ryan 39% 20% 41% -2% (590)
Decided 2012 Presidential Vote – Likely Voters
“I know that it is early, but have you definitely decided who you will vote for in the election for President in 2012 … are you leaning toward someone … or have you considered some candidates but are still trying to decide?”
Def. Decided
Vote
Leaning
Towards
Someone
Still Trying
To Decide
Don’t Know
(N=)
Sept. ‘12 73% 16% 10% 1% (592)
Aug. ‘12 71% 13% 15% 1% (554)
July ’12 66% 16% 18% 0% (486)
Apr. ‘12 55% 18% 26% 1% (497)
Feb. ‘12 39% 25% 33% 3% (492)

2012 Presidential Trial Heats
(Likely 2012 Voters)
"Suppose the 2012 presidential election was being held today and the candidates were Mitt Romney, the Republican, and Barack Obama, the Democrat, who would you vote for?" [ROTATE CANDIDATES]
Obama Romney Other Undecided (N=)
Sept. ‘12 45% 40% 3% 12% (588)
Aug. ‘12 49% 46% 2% 4% (550)
July ’12 49% 45% 4% 3% (470)
Apr. ‘12 51% 42% 2% 5% (486)
Feb. ‘12 50% 40% 2% 9% (483)
Oct. ‘11 42% 50% 2% 7% (559)
July ‘11 43% 47% 2% 7% (729)
April ‘11 43% 50% 2% 6% (471)
Feb. ‘11 41% 49% 3% 7% (712)
Prediction of Who Will Win 2012 Presidential Election (Likely 2012 Voters)
“Regardless of who you are voting for, which candidate do you think is most likely to win the 2012 presidential election?”
Obama Romney Other Undecided (N=)
Sept. ‘12 51% 29% 1% 19% (592)
Are You Better Off or Worse Off Than Four Years Ago
(Likely 2012 Voters)
“Generally speaking, would you say that you are better off or worse off than you were four years ago?”
Better Off Worse Off About the Same Don’t Know (N=)
Sept. ‘12 37% 37% 24% 1% (587)

Presidential Approval Rating – ALL NH ADULTS
Approve Neutral Disapprove (N=)
STATEWIDE 52% 4% 44% 635
Registered Democrat 89% 5% 6% 142 Registered Undeclared 54% 5% 41% 257 Registered Republican 12% 1% 87% 177 Democrat 95% 1% 4% 273 Independent 38% 15% 47% 107 Republican 10% 3% 88% 248 Liberal 88% 3% 10% 144 Moderate 59% 5% 36% 274 Conservative 13% 3% 84% 178 Support Tea Party 7% 2% 91% 126 Neutral 36% 6% 58% 220 Oppose Tea Party 90% 2% 9% 249 McCain/Palin Voter 7% 3% 90% 233 Obama/Biden Voter 86% 2% 12% 284 Other 30% 13% 57% 33 Did Not Vote in 2008 71% 10% 19% 79 Union household 62% 1% 36% 89 Non union 50% 5% 45% 543 Read Union Leader 41% 3% 57% 191 Read Boston Globe 63% 4% 34% 100 Watch WMUR 48% 5% 47% 392 Listen to NHPR 70% 2% 28% 190 18 to 34 61% 7% 33% 101 35 to 49 48% 4% 49% 134 50 to 64 58% 6% 36% 224 65 and over 42% 1% 57% 154 Working class men 48% 5% 47% 130 College educ. men 45% 3% 53% 181 Working class women 52% 7% 42% 138 College educ. women 61% 4% 35% 183 Male 46% 4% 50% 310 Female 57% 5% 38% 325 High school or less 55% 6% 39% 125 Some college 45% 6% 49% 143 College graduate 45% 3% 52% 231 Post graduate 66% 4% 30% 133 Less than $30K 54% 3% 43% 68 $30K to $60K 52% 10% 38% 100 $60K to $75K 67% 0% 33% 54 $75K to $100K 43% 1% 56% 64 $100K or more 50% 2% 47% 145 Attend services 1 or more/week 42% 4% 54% 147 1 2 times a month 37% 6% 56% 82 Less often 54% 3% 43% 161 Never 60% 5% 34% 217 North Country 59% 3% 38% 58 Central / Lakes 48% 4% 48% 111 Connecticut Valley 59% 4% 36% 94 Mass Border 44% 4% 52% 177 Seacoast 55% 6% 39% 103 Manchester Area 55% 5% 40% 92 First Cong. Dist. 51% 4% 45% 306 Second Cong. Dist. 52% 5% 43% 329

2012 Presidential Election – Likely Voters
Romney & Ryan Obama & Biden Other Undecided (N)
STATEWIDE 40% 45% 3% 12% 588
Registered Democrat 5% 89% 1% 6% 135 Registered Undeclared 33% 46% 4% 17% 242 Registered Republican 82% 7% 1% 9% 174 Democrat 1% 89% 2% 8% 253 Independent 36% 32% 7% 25% 91 Republican 82% 5% 2% 11% 242 Liberal 6% 82% 3% 9% 132 Moderate 31% 52% 3% 15% 262 Conservative 82% 8% 1% 10% 172 Def. decided vote 47% 51% 2% 1% 431 Leaning towards someone 33% 44% 1% 22% 92 Still trying to decide 8% 8% 9% 75% 60 Extremely interested 48% 44% 1% 7% 335 Very interested 37% 45% 3% 15% 188 Somewhat/Not very interested 9% 50% 9% 31% 64 Approve of Obama 2% 82% 3% 12% 305 Neutral 18% 37% 0% 45% 20 Disapprove of Obama 86% 3% 2% 10% 262 Support Tea Party 92% 1% 2% 4% 123 Neutral 48% 27% 3% 21% 196 Oppose Tea Party 6% 84% 1% 8% 236 McCain/Palin Voter 87% 2% 1% 9% 224 Obama/Biden Voter 8% 78% 2% 12% 282 Other 42% 31% 12% 14% 27 Did Not Vote in 2008 10% 62% 4% 23% 50 Union household 36% 57% 1% 5% 82 Non union 41% 43% 3% 13% 504 Read Union Leader 54% 35% 1% 10% 189 Read Boston Globe 31% 58% 2% 9% 95 Watch WMUR 43% 44% 1% 13% 369 Listen to NHPR 24% 65% 1% 10% 181 18 to 34 24% 54% 5% 17% 87 35 to 49 47% 37% 4% 11% 120 50 to 64 32% 54% 2% 12% 219 65 and over 55% 36% 1% 8% 143

2012 Presidential Election – Likely Voters
Romney & Ryan Obama & Biden Other Undecided (N)
STATEWIDE 40% 45% 3% 12% 588
Working class men 42% 39% 6% 12% 115 College educ. men 48% 42% 2% 8% 173 Working class women 42% 41% 1% 16% 119 College educ. women 30% 55% 2% 13% 179 Male 46% 41% 4% 10% 287 Female 35% 49% 1% 14% 300 High school or less 37% 45% 5% 13% 101 Some college 46% 37% 3% 15% 133 College graduate 46% 41% 2% 11% 219 Post graduate 27% 61% 1% 11% 132 Less than $30K 41% 43% 6% 9% 57 $30K to $60K 30% 59% 3% 8% 93 $60K to $75K 29% 60% 1% 9% 54 $75K to $100K 50% 34% 6% 10% 59 $100K or more 42% 43% 1% 14% 143 Attend services 1 or more/week 54% 32% 3% 11% 139 1 2 times a month 48% 35% 2% 16% 76 Less often 38% 48% 1% 13% 147 Never 31% 55% 4% 9% 199 North Country 39% 50% 2% 9% 51 Central / Lakes 43% 39% 2% 15% 103 Connecticut Valley 30% 62% 3% 6% 86 Mass Border 48% 37% 2% 13% 171 Seacoast 33% 49% 3% 15% 95 Manchester Area 39% 46% 4% 12% 83 First Cong. Dist. 40% 44% 3% 13% 282 Second Cong. Dist. 40% 46% 2% 11% 305
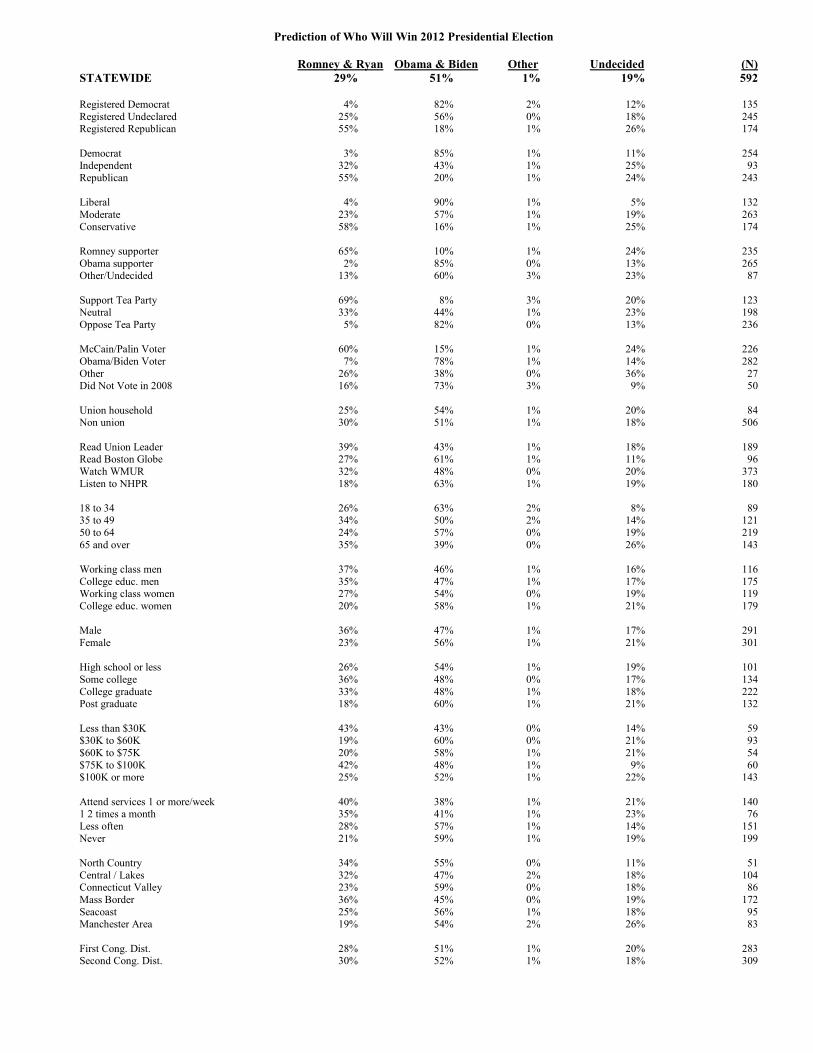
Prediction of Who Will Win 2012 Presidential Election
Romney & Ryan Obama & Biden Other Undecided (N)
STATEWIDE 29% 51% 1% 19% 592
Registered Democrat 4% 82% 2% 12% 135 Registered Undeclared 25% 56% 0% 18% 245 Registered Republican 55% 18% 1% 26% 174 Democrat 3% 85% 1% 11% 254 Independent 32% 43% 1% 25% 93 Republican 55% 20% 1% 24% 243 Liberal 4% 90% 1% 5% 132 Moderate 23% 57% 1% 19% 263 Conservative 58% 16% 1% 25% 174 Romney supporter 65% 10% 1% 24% 235 Obama supporter 2% 85% 0% 13% 265 Other/Undecided 13% 60% 3% 23% 87 Support Tea Party 69% 8% 3% 20% 123 Neutral 33% 44% 1% 23% 198 Oppose Tea Party 5% 82% 0% 13% 236 McCain/Palin Voter 60% 15% 1% 24% 226 Obama/Biden Voter 7% 78% 1% 14% 282 Other 26% 38% 0% 36% 27 Did Not Vote in 2008 16% 73% 3% 9% 50 Union household 25% 54% 1% 20% 84 Non union 30% 51% 1% 18% 506 Read Union Leader 39% 43% 1% 18% 189 Read Boston Globe 27% 61% 1% 11% 96 Watch WMUR 32% 48% 0% 20% 373 Listen to NHPR 18% 63% 1% 19% 180 18 to 34 26% 63% 2% 8% 89 35 to 49 34% 50% 2% 14% 121 50 to 64 24% 57% 0% 19% 219 65 and over 35% 39% 0% 26% 143 Working class men 37% 46% 1% 16% 116 College educ. men 35% 47% 1% 17% 175 Working class women 27% 54% 0% 19% 119 College educ. women 20% 58% 1% 21% 179 Male 36% 47% 1% 17% 291 Female 23% 56% 1% 21% 301 High school or less 26% 54% 1% 19% 101 Some college 36% 48% 0% 17% 134 College graduate 33% 48% 1% 18% 222 Post graduate 18% 60% 1% 21% 132 Less than $30K 43% 43% 0% 14% 59 $30K to $60K 19% 60% 0% 21% 93 $60K to $75K 20% 58% 1% 21% 54 $75K to $100K 42% 48% 1% 9% 60 $100K or more 25% 52% 1% 22% 143 Attend services 1 or more/week 40% 38% 1% 21% 140 1 2 times a month 35% 41% 1% 23% 76 Less often 28% 57% 1% 14% 151 Never 21% 59% 1% 19% 199 North Country 34% 55% 0% 11% 51 Central / Lakes 32% 47% 2% 18% 104 Connecticut Valley 23% 59% 0% 18% 86 Mass Border 36% 45% 0% 19% 172 Seacoast 25% 56% 1% 18% 95 Manchester Area 19% 54% 2% 26% 83 First Cong. Dist. 28% 51% 1% 20% 283 Second Cong. Dist. 30% 52% 1% 18% 309
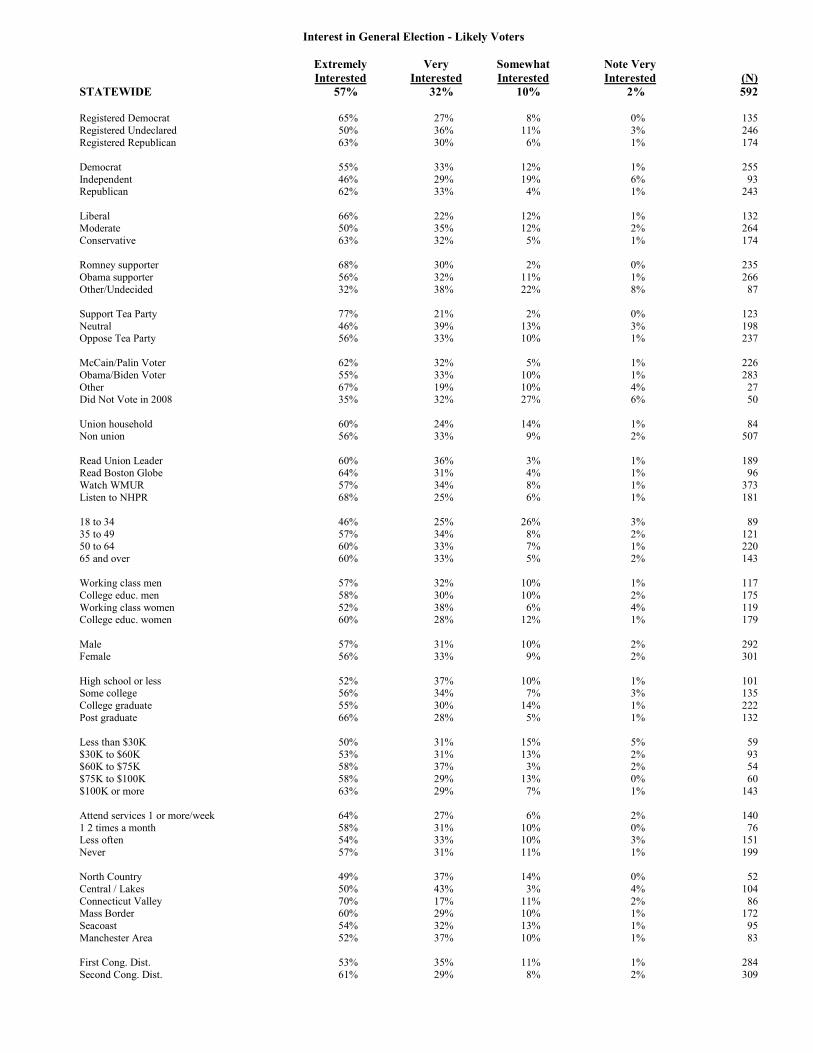
Interest in General Election - Likely Voters
Extremely Very Somewhat Note Very
Interested Interested Interested Interested (N)
STATEWIDE 57% 32% 10% 2% 592
Registered Democrat 65% 27% 8% 0% 135 Registered Undeclared 50% 36% 11% 3% 246 Registered Republican 63% 30% 6% 1% 174 Democrat 55% 33% 12% 1% 255 Independent 46% 29% 19% 6% 93 Republican 62% 33% 4% 1% 243 Liberal 66% 22% 12% 1% 132 Moderate 50% 35% 12% 2% 264 Conservative 63% 32% 5% 1% 174 Romney supporter 68% 30% 2% 0% 235 Obama supporter 56% 32% 11% 1% 266 Other/Undecided 32% 38% 22% 8% 87 Support Tea Party 77% 21% 2% 0% 123 Neutral 46% 39% 13% 3% 198 Oppose Tea Party 56% 33% 10% 1% 237 McCain/Palin Voter 62% 32% 5% 1% 226 Obama/Biden Voter 55% 33% 10% 1% 283 Other 67% 19% 10% 4% 27 Did Not Vote in 2008 35% 32% 27% 6% 50 Union household 60% 24% 14% 1% 84 Non union 56% 33% 9% 2% 507 Read Union Leader 60% 36% 3% 1% 189 Read Boston Globe 64% 31% 4% 1% 96 Watch WMUR 57% 34% 8% 1% 373 Listen to NHPR 68% 25% 6% 1% 181 18 to 34 46% 25% 26% 3% 89 35 to 49 57% 34% 8% 2% 121 50 to 64 60% 33% 7% 1% 220 65 and over 60% 33% 5% 2% 143 Working class men 57% 32% 10% 1% 117 College educ. men 58% 30% 10% 2% 175 Working class women 52% 38% 6% 4% 119 College educ. women 60% 28% 12% 1% 179 Male 57% 31% 10% 2% 292 Female 56% 33% 9% 2% 301 High school or less 52% 37% 10% 1% 101 Some college 56% 34% 7% 3% 135 College graduate 55% 30% 14% 1% 222 Post graduate 66% 28% 5% 1% 132 Less than $30K 50% 31% 15% 5% 59 $30K to $60K 53% 31% 13% 2% 93 $60K to $75K 58% 37% 3% 2% 54 $75K to $100K 58% 29% 13% 0% 60 $100K or more 63% 29% 7% 1% 143 Attend services 1 or more/week 64% 27% 6% 2% 140 1 2 times a month 58% 31% 10% 0% 76 Less often 54% 33% 10% 3% 151 Never 57% 31% 11% 1% 199 North Country 49% 37% 14% 0% 52 Central / Lakes 50% 43% 3% 4% 104 Connecticut Valley 70% 17% 11% 2% 86 Mass Border 60% 29% 10% 1% 172 Seacoast 54% 32% 13% 1% 95 Manchester Area 52% 37% 10% 1% 83 First Cong. Dist. 53% 35% 11% 1% 284 Second Cong. Dist. 61% 29% 8% 2% 309

Discuss Election with Friends or Family - Likely Voters
Often Sometimes Rarely Never DK (N)
STATEWIDE 62% 28% 6% 3% 0% 592
Registered Democrat 61% 30% 6% 2% 1% 135 Registered Undeclared 57% 33% 7% 4% 0% 246 Registered Republican 72% 21% 4% 3% 0% 174 Democrat 61% 30% 7% 2% 0% 255 Independent 51% 34% 8% 7% 0% 93 Republican 69% 25% 4% 2% 0% 243 Liberal 69% 25% 3% 3% 0% 132 Moderate 56% 34% 8% 2% 0% 264 Conservative 69% 22% 4% 4% 0% 174 Romney supporter 72% 22% 4% 2% 0% 235 Obama supporter 63% 29% 6% 2% 0% 266 Other/Undecided 37% 43% 11% 8% 1% 87 Support Tea Party 80% 14% 2% 3% 0% 123 Neutral 52% 38% 7% 3% 0% 198 Oppose Tea Party 64% 28% 6% 2% 1% 237 McCain/Palin Voter 67% 26% 5% 2% 0% 226 Obama/Biden Voter 60% 31% 6% 2% 0% 283 Other 65% 23% 0% 12% 0% 27 Did Not Vote in 2008 53% 25% 14% 7% 0% 50 Union household 66% 25% 7% 3% 0% 84 Non union 62% 29% 6% 3% 0% 507 Read Union Leader 70% 22% 2% 5% 1% 189 Read Boston Globe 74% 22% 2% 1% 0% 96 Watch WMUR 64% 28% 5% 3% 0% 373 Listen to NHPR 72% 20% 4% 3% 1% 181 18 to 34 52% 31% 14% 3% 0% 89 35 to 49 55% 40% 2% 3% 0% 121 50 to 64 68% 26% 4% 2% 0% 220 65 and over 67% 19% 8% 5% 1% 143 Working class men 52% 33% 9% 6% 0% 117 College educ. men 70% 24% 6% 1% 0% 175 Working class women 64% 23% 5% 7% 1% 119 College educ. women 61% 33% 5% 1% 0% 179 Male 63% 27% 7% 3% 0% 292 Female 62% 30% 5% 3% 0% 301 High school or less 51% 35% 9% 4% 1% 101 Some college 64% 23% 5% 8% 0% 135 College graduate 65% 27% 7% 1% 0% 222 Post graduate 65% 31% 3% 1% 0% 132 Less than $30K 55% 17% 18% 10% 0% 59 $30K to $60K 66% 24% 6% 3% 1% 93 $60K to $75K 52% 37% 7% 4% 0% 54 $75K to $100K 62% 34% 3% 0% 0% 60 $100K or more 70% 26% 4% 1% 0% 143 Attend services 1 or more/week 66% 22% 5% 6% 1% 140 1 2 times a month 56% 38% 1% 5% 0% 76 Less often 60% 32% 7% 1% 0% 151 Never 65% 25% 8% 2% 0% 199 North Country 61% 27% 6% 3% 2% 52 Central / Lakes 60% 30% 8% 1% 0% 104 Connecticut Valley 74% 15% 5% 6% 0% 86 Mass Border 62% 29% 7% 2% 0% 172 Seacoast 60% 33% 5% 2% 0% 95 Manchester Area 57% 35% 3% 6% 0% 83 First Cong. Dist. 57% 33% 7% 3% 0% 284 Second Cong. Dist. 67% 24% 5% 3% 0% 309

Decided Presidential Vote - Likely Voters
Def. Leaning Towards Still Trying
Decided Someone To Decide DK (N)
STATEWIDE 73% 16% 10% 1% 592
Registered Democrat 85% 10% 4% 0% 135 Registered Undeclared 65% 20% 14% 1% 246 Registered Republican 79% 12% 8% 1% 174 Democrat 80% 14% 6% 0% 255 Independent 48% 22% 26% 3% 93 Republican 76% 15% 8% 0% 243 Liberal 85% 8% 6% 1% 132 Moderate 66% 20% 13% 1% 264 Conservative 75% 15% 10% 0% 174 Romney supporter 85% 13% 2% 0% 235 Obama supporter 83% 15% 2% 0% 266 Other/Undecided 12% 24% 59% 5% 87 Support Tea Party 86% 8% 6% 0% 123 Neutral 59% 23% 17% 1% 198 Oppose Tea Party 81% 11% 7% 0% 237 McCain/Palin Voter 79% 12% 9% 0% 226 Obama/Biden Voter 74% 17% 9% 1% 283 Other 60% 23% 17% 0% 27 Did Not Vote in 2008 52% 23% 20% 4% 50 Union household 81% 9% 11% 0% 84 Non union 72% 17% 10% 1% 507 Read Union Leader 78% 11% 10% 1% 189 Read Boston Globe 81% 12% 8% 0% 96 Watch WMUR 73% 16% 11% 0% 373 Listen to NHPR 79% 10% 10% 1% 181 18 to 34 60% 19% 18% 2% 89 35 to 49 70% 16% 12% 2% 121 50 to 64 74% 19% 7% 0% 220 65 and over 82% 8% 10% 0% 143 Working class men 70% 17% 12% 1% 117 College educ. men 73% 18% 8% 1% 175 Working class women 76% 10% 12% 2% 119 College educ. women 73% 16% 11% 0% 179 Male 72% 18% 10% 1% 292 Female 75% 13% 11% 1% 301 High school or less 77% 11% 11% 1% 101 Some college 70% 16% 13% 2% 135 College graduate 69% 21% 10% 0% 222 Post graduate 79% 10% 9% 1% 132 Less than $30K 71% 11% 16% 2% 59 $30K to $60K 68% 25% 8% 0% 93 $60K to $75K 76% 14% 10% 0% 54 $75K to $100K 74% 16% 10% 0% 60 $100K or more 72% 16% 12% 1% 143 Attend services 1 or more/week 76% 12% 12% 0% 140 1 2 times a month 70% 14% 15% 1% 76 Less often 71% 15% 14% 1% 151 Never 77% 16% 6% 1% 199 North Country 67% 23% 9% 1% 52 Central / Lakes 78% 10% 11% 1% 104 Connecticut Valley 81% 12% 5% 2% 86 Mass Border 75% 12% 13% 1% 172 Seacoast 67% 24% 8% 0% 95 Manchester Area 67% 19% 14% 0% 83 First Cong. Dist. 70% 18% 11% 0% 284 Second Cong. Dist. 76% 13% 10% 1% 309

Prediction of Who Will Win 2012 Presidential Election - Likely Voters
Romney & Ryan Obama & Biden Other Undecided (N)
STATEWIDE 29% 51% 1% 19% 592
Registered Democrat 4% 82% 2% 12% 135 Registered Undeclared 25% 56% 0% 18% 245 Registered Republican 55% 18% 1% 26% 174 Democrat 3% 85% 1% 11% 254 Independent 32% 43% 1% 25% 93 Republican 55% 20% 1% 24% 243 Liberal 4% 90% 1% 5% 132 Moderate 23% 57% 1% 19% 263 Conservative 58% 16% 1% 25% 174 Romney supporter 65% 10% 1% 24% 235 Obama supporter 2% 85% 0% 13% 265 Other/Undecided 13% 60% 3% 23% 87 Support Tea Party 69% 8% 3% 20% 123 Neutral 33% 44% 1% 23% 198 Oppose Tea Party 5% 82% 0% 13% 236 McCain/Palin Voter 60% 15% 1% 24% 226 Obama/Biden Voter 7% 78% 1% 14% 282 Other 26% 38% 0% 36% 27 Did Not Vote in 2008 16% 73% 3% 9% 50 Union household 25% 54% 1% 20% 84 Non union 30% 51% 1% 18% 506 Read Union Leader 39% 43% 1% 18% 189 Read Boston Globe 27% 61% 1% 11% 96 Watch WMUR 32% 48% 0% 20% 373 Listen to NHPR 18% 63% 1% 19% 180 18 to 34 26% 63% 2% 8% 89 35 to 49 34% 50% 2% 14% 121 50 to 64 24% 57% 0% 19% 219 65 and over 35% 39% 0% 26% 143 Working class men 37% 46% 1% 16% 116 College educ. men 35% 47% 1% 17% 175 Working class women 27% 54% 0% 19% 119 College educ. women 20% 58% 1% 21% 179 Male 36% 47% 1% 17% 291 Female 23% 56% 1% 21% 301 High school or less 26% 54% 1% 19% 101 Some college 36% 48% 0% 17% 134 College graduate 33% 48% 1% 18% 222 Post graduate 18% 60% 1% 21% 132 Less than $30K 43% 43% 0% 14% 59 $30K to $60K 19% 60% 0% 21% 93 $60K to $75K 20% 58% 1% 21% 54 $75K to $100K 42% 48% 1% 9% 60 $100K or more 25% 52% 1% 22% 143 Attend services 1 or more/week 40% 38% 1% 21% 140 1 2 times a month 35% 41% 1% 23% 76 Less often 28% 57% 1% 14% 151 Never 21% 59% 1% 19% 199 North Country 34% 55% 0% 11% 51 Central / Lakes 32% 47% 2% 18% 104 Connecticut Valley 23% 59% 0% 18% 86 Mass Border 36% 45% 0% 19% 172 Seacoast 25% 56% 1% 18% 95 Manchester Area 19% 54% 2% 26% 83 First Cong. Dist. 28% 51% 1% 20% 283 Second Cong. Dist. 30% 52% 1% 18% 309

Favorability Rating - Barack Obama - Likely Voters
Favorable Neutral Unfavorable DK (N)
STATEWIDE 52% 4% 43% 1% 592
Registered Democrat 93% 3% 4% 1% 135 Registered Undeclared 56% 7% 37% 0% 246 Registered Republican 11% 1% 87% 1% 174 Democrat 95% 4% 1% 0% 255 Independent 52% 7% 40% 1% 93 Republican 8% 3% 88% 1% 243 Liberal 91% 1% 7% 1% 132 Moderate 60% 7% 34% 0% 264 Conservative 11% 2% 86% 1% 174 Support Tea Party 5% 1% 95% 0% 123 Neutral 37% 7% 55% 1% 198 Oppose Tea Party 91% 3% 6% 0% 237 McCain/Palin Voter 6% 3% 90% 1% 226 Obama/Biden Voter 87% 4% 9% 0% 283 Other 35% 7% 59% 0% 27 Did Not Vote in 2008 80% 8% 13% 0% 50 Union household 60% 2% 37% 2% 84 Non union 51% 5% 44% 0% 507 Read Union Leader 38% 4% 57% 1% 189 Read Boston Globe 62% 7% 31% 0% 96 Watch WMUR 49% 4% 47% 1% 373 Listen to NHPR 72% 2% 25% 0% 181 18 to 34 61% 9% 30% 0% 89 35 to 49 44% 5% 50% 1% 121 50 to 64 62% 3% 34% 1% 220 65 and over 41% 2% 57% 0% 143 Working class men 51% 3% 45% 0% 117 College educ. men 45% 4% 49% 1% 175 Working class women 51% 6% 43% 1% 119 College educ. women 61% 4% 35% 0% 179 Male 48% 4% 48% 1% 292 Female 57% 4% 38% 0% 301 High school or less 57% 3% 40% 0% 101 Some college 46% 6% 47% 1% 135 College graduate 45% 4% 50% 1% 222 Post graduate 67% 4% 29% 1% 132 Less than $30K 50% 6% 45% 0% 59 $30K to $60K 62% 5% 32% 0% 93 $60K to $75K 67% 2% 31% 0% 54 $75K to $100K 43% 2% 55% 0% 60 $100K or more 49% 3% 47% 2% 143 Attend services 1 or more/week 38% 5% 56% 1% 140 1 2 times a month 39% 4% 57% 0% 76 Less often 54% 5% 40% 1% 151 Never 64% 3% 33% 0% 199 North Country 56% 8% 37% 0% 52 Central / Lakes 52% 0% 47% 0% 104 Connecticut Valley 67% 2% 31% 0% 86 Mass Border 42% 5% 53% 1% 172 Seacoast 58% 5% 37% 1% 95 Manchester Area 51% 8% 39% 2% 83 First Cong. Dist. 51% 6% 43% 1% 284 Second Cong. Dist. 54% 2% 43% 0% 309
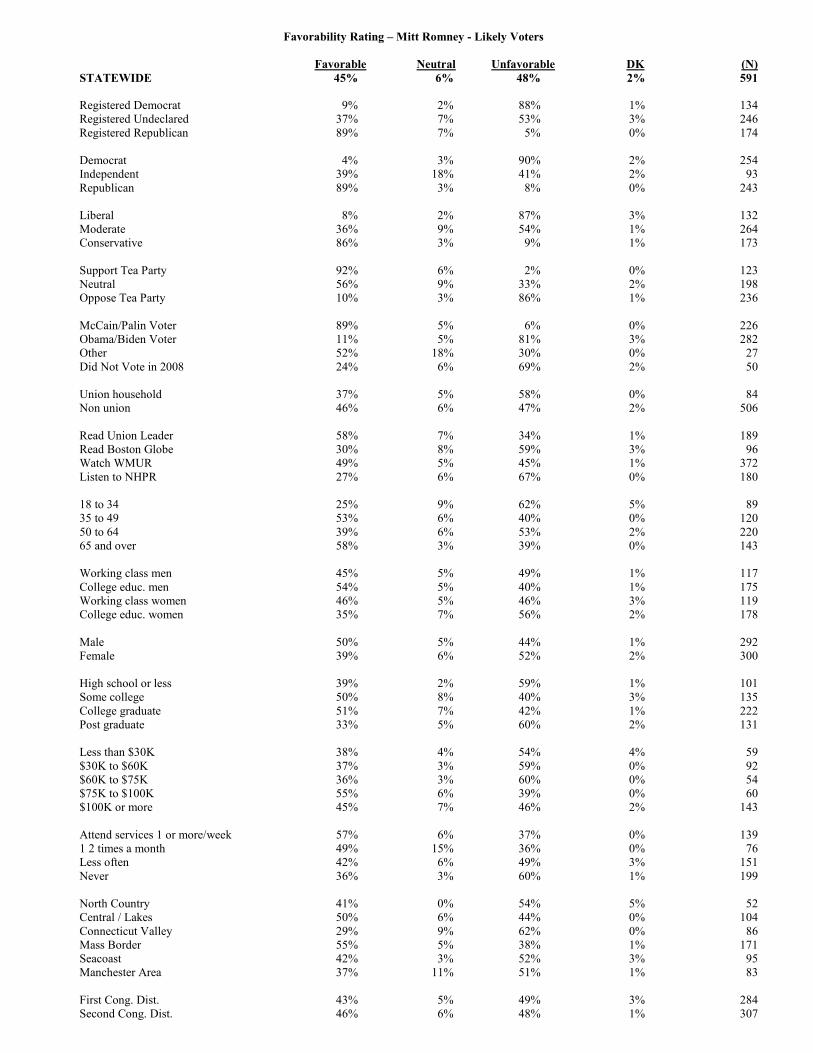
Favorability Rating – Mitt Romney - Likely Voters
Favorable Neutral Unfavorable DK (N)
STATEWIDE 45% 6% 48% 2% 591
Registered Democrat 9% 2% 88% 1% 134 Registered Undeclared 37% 7% 53% 3% 246 Registered Republican 89% 7% 5% 0% 174 Democrat 4% 3% 90% 2% 254 Independent 39% 18% 41% 2% 93 Republican 89% 3% 8% 0% 243 Liberal 8% 2% 87% 3% 132 Moderate 36% 9% 54% 1% 264 Conservative 86% 3% 9% 1% 173 Support Tea Party 92% 6% 2% 0% 123 Neutral 56% 9% 33% 2% 198 Oppose Tea Party 10% 3% 86% 1% 236 McCain/Palin Voter 89% 5% 6% 0% 226 Obama/Biden Voter 11% 5% 81% 3% 282 Other 52% 18% 30% 0% 27 Did Not Vote in 2008 24% 6% 69% 2% 50 Union household 37% 5% 58% 0% 84 Non union 46% 6% 47% 2% 506 Read Union Leader 58% 7% 34% 1% 189 Read Boston Globe 30% 8% 59% 3% 96 Watch WMUR 49% 5% 45% 1% 372 Listen to NHPR 27% 6% 67% 0% 180 18 to 34 25% 9% 62% 5% 89 35 to 49 53% 6% 40% 0% 120 50 to 64 39% 6% 53% 2% 220 65 and over 58% 3% 39% 0% 143 Working class men 45% 5% 49% 1% 117 College educ. men 54% 5% 40% 1% 175 Working class women 46% 5% 46% 3% 119 College educ. women 35% 7% 56% 2% 178 Male 50% 5% 44% 1% 292 Female 39% 6% 52% 2% 300 High school or less 39% 2% 59% 1% 101 Some college 50% 8% 40% 3% 135 College graduate 51% 7% 42% 1% 222 Post graduate 33% 5% 60% 2% 131 Less than $30K 38% 4% 54% 4% 59 $30K to $60K 37% 3% 59% 0% 92 $60K to $75K 36% 3% 60% 0% 54 $75K to $100K 55% 6% 39% 0% 60 $100K or more 45% 7% 46% 2% 143 Attend services 1 or more/week 57% 6% 37% 0% 139 1 2 times a month 49% 15% 36% 0% 76 Less often 42% 6% 49% 3% 151 Never 36% 3% 60% 1% 199 North Country 41% 0% 54% 5% 52 Central / Lakes 50% 6% 44% 0% 104 Connecticut Valley 29% 9% 62% 0% 86 Mass Border 55% 5% 38% 1% 171 Seacoast 42% 3% 52% 3% 95 Manchester Area 37% 11% 51% 1% 83 First Cong. Dist. 43% 5% 49% 3% 284 Second Cong. Dist. 46% 6% 48% 1% 307

Favorability Rating – Joe Biden - Likely Voters
Favorable Neutral Unfavorable DK (N)
STATEWIDE 39% 12% 43% 6% 592
Registered Democrat 75% 11% 8% 6% 135 Registered Undeclared 40% 15% 38% 7% 246 Registered Republican 9% 8% 80% 3% 174 Democrat 73% 12% 8% 7% 255 Independent 35% 18% 36% 12% 93 Republican 5% 8% 83% 4% 243 Liberal 74% 8% 13% 5% 132 Moderate 39% 16% 37% 7% 264 Conservative 12% 7% 76% 5% 174 Support Tea Party 4% 4% 89% 2% 123 Neutral 27% 14% 51% 8% 198 Oppose Tea Party 69% 12% 14% 6% 237 McCain/Palin Voter 6% 8% 84% 2% 226 Obama/Biden Voter 68% 11% 15% 6% 283 Other 18% 33% 32% 16% 27 Did Not Vote in 2008 34% 20% 24% 22% 50 Union household 43% 10% 35% 12% 84 Non union 39% 12% 44% 6% 507 Read Union Leader 33% 10% 53% 4% 189 Read Boston Globe 41% 20% 35% 4% 96 Watch WMUR 36% 13% 46% 4% 373 Listen to NHPR 56% 15% 23% 5% 181 18 to 34 36% 20% 25% 19% 89 35 to 49 31% 14% 50% 6% 121 50 to 64 43% 10% 43% 4% 220 65 and over 42% 5% 48% 4% 143 Working class men 36% 10% 48% 6% 117 College educ. men 33% 13% 47% 7% 175 Working class women 39% 11% 43% 8% 119 College educ. women 47% 11% 37% 5% 179 Male 34% 12% 47% 7% 292 Female 44% 11% 39% 6% 301 High school or less 44% 12% 40% 4% 101 Some college 32% 9% 50% 9% 135 College graduate 33% 12% 49% 6% 222 Post graduate 54% 12% 29% 6% 132 Less than $30K 41% 7% 34% 17% 59 $30K to $60K 51% 11% 33% 5% 93 $60K to $75K 52% 12% 35% 1% 54 $75K to $100K 28% 8% 63% 0% 60 $100K or more 40% 9% 45% 5% 143 Attend services 1 or more/week 35% 12% 49% 4% 140 1 2 times a month 25% 12% 55% 7% 76 Less often 43% 11% 41% 5% 151 Never 43% 10% 38% 9% 199 North Country 44% 8% 38% 10% 52 Central / Lakes 39% 10% 44% 7% 104 Connecticut Valley 49% 11% 32% 8% 86 Mass Border 26% 14% 54% 5% 172 Seacoast 47% 9% 40% 3% 95 Manchester Area 43% 13% 38% 7% 83 First Cong. Dist. 38% 11% 44% 7% 284 Second Cong. Dist. 40% 12% 42% 6% 309

Favorability Rating – Paul Ryan - Likely Voters
Favorable Neutral Unfavorable DK (N)
STATEWIDE 39% 6% 41% 14% 590
Registered Democrat 7% 4% 79% 11% 133 Registered Undeclared 31% 10% 41% 18% 246 Registered Republican 81% 2% 9% 8% 174 Democrat 4% 3% 76% 16% 253 Independent 36% 8% 34% 22% 93 Republican 78% 6% 7% 9% 243 Liberal 9% 5% 75% 11% 130 Moderate 33% 6% 44% 17% 264 Conservative 75% 5% 10% 11% 173 Support Tea Party 88% 3% 3% 6% 123 Neutral 48% 7% 23% 22% 198 Oppose Tea Party 8% 5% 78% 9% 235 McCain/Palin Voter 80% 5% 6% 9% 226 Obama/Biden Voter 10% 5% 70% 15% 281 Other 57% 0% 18% 26% 27 Did Not Vote in 2008 12% 12% 47% 29% 50 Union household 28% 7% 52% 13% 84 Non union 41% 5% 39% 14% 505 Read Union Leader 53% 5% 30% 12% 189 Read Boston Globe 34% 6% 51% 10% 96 Watch WMUR 44% 6% 36% 14% 372 Listen to NHPR 27% 3% 60% 10% 180 18 to 34 19% 12% 42% 27% 89 35 to 49 44% 8% 34% 14% 120 50 to 64 36% 2% 47% 15% 219 65 and over 54% 4% 36% 6% 143 Working class men 38% 3% 45% 14% 117 College educ. men 45% 4% 38% 13% 175 Working class women 40% 11% 30% 19% 118 College educ. women 35% 5% 48% 12% 178 Male 42% 3% 41% 13% 292 Female 37% 8% 41% 15% 299 High school or less 41% 6% 40% 14% 101 Some college 37% 9% 36% 18% 133 College graduate 46% 4% 37% 13% 222 Post graduate 30% 6% 53% 11% 131 Less than $30K 33% 6% 41% 20% 59 $30K to $60K 35% 5% 41% 19% 92 $60K to $75K 22% 6% 55% 17% 54 $75K to $100K 45% 8% 37% 10% 60 $100K or more 42% 2% 41% 15% 143 Attend services 1 or more/week 52% 5% 31% 12% 139 1 2 times a month 48% 6% 30% 16% 76 Less often 37% 7% 42% 15% 150 Never 32% 5% 51% 12% 199 North Country 37% 5% 41% 17% 52 Central / Lakes 45% 5% 39% 11% 104 Connecticut Valley 30% 2% 49% 19% 86 Mass Border 48% 9% 34% 9% 171 Seacoast 33% 4% 51% 12% 95 Manchester Area 35% 5% 36% 24% 82 First Cong. Dist. 37% 4% 42% 16% 283 Second Cong. Dist. 41% 7% 40% 12% 307
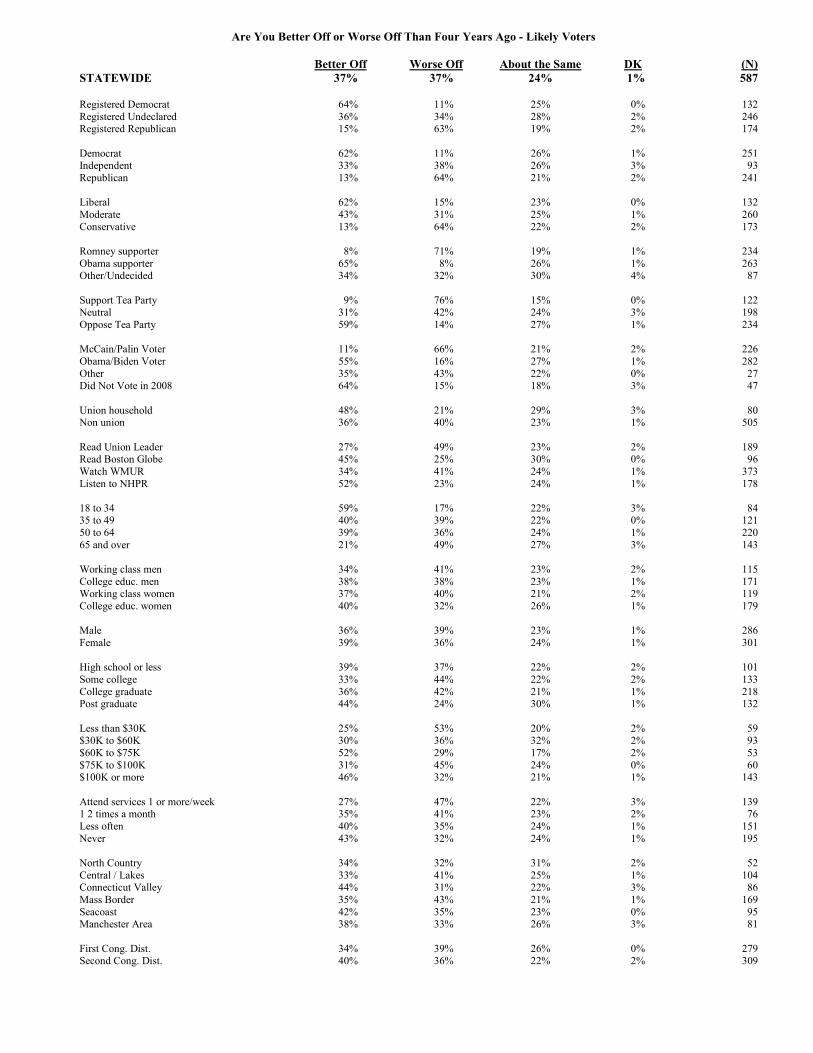
Are You Better Off or Worse Off Than Four Years Ago - Likely Voters
Better Off Worse Off About the Same DK (N)
STATEWIDE 37% 37% 24% 1% 587
Registered Democrat 64% 11% 25% 0% 132 Registered Undeclared 36% 34% 28% 2% 246 Registered Republican 15% 63% 19% 2% 174 Democrat 62% 11% 26% 1% 251 Independent 33% 38% 26% 3% 93 Republican 13% 64% 21% 2% 241 Liberal 62% 15% 23% 0% 132 Moderate 43% 31% 25% 1% 260 Conservative 13% 64% 22% 2% 173 Romney supporter 8% 71% 19% 1% 234 Obama supporter 65% 8% 26% 1% 263 Other/Undecided 34% 32% 30% 4% 87 Support Tea Party 9% 76% 15% 0% 122 Neutral 31% 42% 24% 3% 198 Oppose Tea Party 59% 14% 27% 1% 234 McCain/Palin Voter 11% 66% 21% 2% 226 Obama/Biden Voter 55% 16% 27% 1% 282 Other 35% 43% 22% 0% 27 Did Not Vote in 2008 64% 15% 18% 3% 47 Union household 48% 21% 29% 3% 80 Non union 36% 40% 23% 1% 505 Read Union Leader 27% 49% 23% 2% 189 Read Boston Globe 45% 25% 30% 0% 96 Watch WMUR 34% 41% 24% 1% 373 Listen to NHPR 52% 23% 24% 1% 178 18 to 34 59% 17% 22% 3% 84 35 to 49 40% 39% 22% 0% 121 50 to 64 39% 36% 24% 1% 220 65 and over 21% 49% 27% 3% 143 Working class men 34% 41% 23% 2% 115 College educ. men 38% 38% 23% 1% 171 Working class women 37% 40% 21% 2% 119 College educ. women 40% 32% 26% 1% 179 Male 36% 39% 23% 1% 286 Female 39% 36% 24% 1% 301 High school or less 39% 37% 22% 2% 101 Some college 33% 44% 22% 2% 133 College graduate 36% 42% 21% 1% 218 Post graduate 44% 24% 30% 1% 132 Less than $30K 25% 53% 20% 2% 59 $30K to $60K 30% 36% 32% 2% 93 $60K to $75K 52% 29% 17% 2% 53 $75K to $100K 31% 45% 24% 0% 60 $100K or more 46% 32% 21% 1% 143 Attend services 1 or more/week 27% 47% 22% 3% 139 1 2 times a month 35% 41% 23% 2% 76 Less often 40% 35% 24% 1% 151 Never 43% 32% 24% 1% 195 North Country 34% 32% 31% 2% 52 Central / Lakes 33% 41% 25% 1% 104 Connecticut Valley 44% 31% 22% 3% 86 Mass Border 35% 43% 21% 1% 169 Seacoast 42% 35% 23% 0% 95 Manchester Area 38% 33% 26% 3% 81 First Cong. Dist. 34% 39% 26% 0% 279 Second Cong. Dist. 40% 36% 22% 2% 309