Embed Size (px)
Citation preview


The Wiley Handbook of Developmental Psychopathology


The Wiley Handbook of Developmental Psychopathology
Edited by
Luna C. CentifantiDavid M. Williams

This edition first published 2017© 2017 John Wiley & Sons Ltd
All rights reserved. No part of this publication may be reproduced, stored in a retrieval system, or transmitted, in any form or by any means, electronic, mechanical, photocopying, recording or otherwise, except as permitted by law. Advice on how to obtain permission to reuse material from this title is available at http://www.wiley.com/go/permissions.
The right of Luna C. Centifanti and David M. Williams to be identified as the authors of the editorial material in this work has been asserted in accordance with law.
Registered OfficesJohn Wiley & Sons, Inc., 111 River Street, Hoboken, NJ 07030, USA
John Wiley & Sons Ltd, The Atrium, Southern Gate, Chichester, West Sussex, PO19 8SQ, UK
Editorial OfficeThe Atrium, Southern Gate, Chichester, West Sussex, PO19 8SQ, UK
For details of our global editorial offices, customer services, and more information about Wiley products visit us at www.wiley.com.
Wiley also publishes its books in a variety of electronic formats and by print‐on‐demand. Some content that appears in standard print versions of this book may not be available in other formats.
Limit of Liability/Disclaimer of WarrantyWhile the publisher and author have used their best efforts in preparing this book, they make no representations or warranties with respect to the accuracy or completeness of the contents of this book and specifically disclaim any implied warranties of merchantability or fitness for a particular purpose. It is sold on the understanding that the publisher is not engaged in rendering professional services and neither the publisher nor the authors shall be liable for damages arising herefrom. If professional advice or other expert assistance is required, the services of a competent professional should be sought.
Library of Congress Cataloging‐in‐Publication Data
Names: Centifanti, Luna C., 1974– editor. | Williams, David M., 1980– editor.Title: The Wiley handbook of developmental psychopathology / [edited by] Luna C. Centifanti,
David M. Williams.Description: Hoboken, NJ : John Wiley & Sons, 2017. | Includes bibliographical references and index.Identifiers: LCCN 2016055391 (print) | LCCN 2017001686 (ebook) |
ISBN 9781118554555 (cloth) | ISBN 9781118554548 (pdf) | ISBN 9781118554531 (epub)Subjects: LCSH: Psychology, Pathological–Handbooks, manuals, etc. |
Developmental psychology–Handbooks, manuals, etc.Classification: LCC RC454.4 .W544 2017 (print) | LCC RC454.4 (ebook) | DDC 616.89–dc23LC record available at https://lccn.loc.gov/2016055391
Cover Image: © alepvfoto/FotoliaCover Design: Wiley
Set in 10/12pt Galliard by SPi Global, Pondicherry, India
10 9 8 7 6 5 4 3 2 1
Contents
List of Contributors ix
Section I Developmental Psychopathology: An up‐to‐date Historical and Methodological Overview 1
Part 1 Methods for Studying Developmental Psychopathology 3
1 Developmental Trajectories of Psychopathology: An Overview of Approaches and Applications 5Nathalie M. G. Fontaine and Isaac T. Petersen
2 Family‐based Quasi‐experimental Designs for Studying Environmental Risk Factors 29Henrik Larsson and Brian M. D’Onofrio
3 Using Mobile Technologies to Advance the Study of Psychopathology among Children and Adolescents 45Madeleine J. George, Michael A. Russell, and Candice L. Odgers
4 Opening Minds: The Arts and Developmental Psychopathology 61Nicola Shaughnessy
Section II Cognitive, Neurobiological, and Genetic Influences 87
Part 1 Cognition/ Socioemotional Factors 89
5 Profiles of Executive Control in Autism Spectrum Disorder, Attention Deficit Hyperactivity Disorder, and Tourette’s Syndrome: Performance‐Based versus Real‐World Measures 91Cynthia S. Peng and Gregory L. Wallace
6 Domain‐specific and Domain‐general Approaches to Developmental Disorders: The Example of Specific Language Impairment 139Nicola Botting and Chloë Marshall

vi Contents
7 Empathy Problems in Youth with Disruptive Behavior Disorders, with and without Callous Unemotional Traits 161Jarla Pijper, Minet de Wied, Stephanie van Goozen, and Wim H. J. Meeus
Part 2 Developmental Neurobiology 179
8 Developmental Cognitive Neuroscience 181Stefanie Hoehl
9 Early Neurocognitive Markers of Developmental Psychopathology 197Emily J.H. Jones and Mark H. Johnson
10 Sleep and Anxiety 215Alice Jones Bartoli and Alice M. Gregory
Part 3 Genetics 233
11 The Genetic Basis of Psychological Traits in Infancy: Implications for Understanding the Causes of Developmental Psychopathology 235Kostas A. Papageorgiou and Angelica Ronald
12 Generalist Genes and Developmental Psychopathology 259Yulia Kovas and Maria Grazia Tosto
13 Comorbidity 273David M. Williams
Section III Environmental Influences 287
Part 1 Family/Peer Issues 289
14 Parenting Influences on Development and Psychopathology 291David J. Hawes
15 Peer Processes and Child Psychopathology: A Focus on Externalizing Behaviors 311Luna C. Muñoz Centifanti, Scott Risser, and Bethany Little
16 Environmental Influences: The Special Case of Gender 335Hedwig Eisenbarth
Part 2 Adverse Circumstances – Upbringing 343
17 Development under Adverse Circumstances as a Risk for Psychopathology: An Intergenerational Study of Children from Disadvantaged High‐Risk Backgrounds 345Dale M. Stack, Lisa A. Serbin, Célia Matte‐Gagné, Danielle Kingdon, Kelly Doiron, and Alex E. Schwartzman
18 Family Context and Psychopathology: The Mediating Role of Children’s Emotion Regulation 365Amanda Sheffield Morris, Benjamin J. Houltberg, Michael M. Criss, and Cara D. Bosler

Contents vii
Part 3 Adverse Events and Cultural Influences 391
19 Disasters and the Development of Psychopathology in Youth: An Ecological Perspective 393Carl F. Weems and Brandon G. Scott
20 Cultural Perspectives and Influences on Developmental Psychopathology: Lessons about Risk, Disorder, and Wellbeing from the Study of the Indigenous Peoples of North America 411Jacob A. Burack, Ashley Reynolds, Oriane Landry, Gillian Klassen, Natalie Russo, and Stephanie A. Fryberg
Section IV DSM‐5 and the Future of Developmental Psychopathology Research 431
Part 1 Psychiatric and Diagnostic Impact 433
21 Overview of Key Changes in the DSM‐5 and Clinical Implications for Child and Adolescent Mental Health Practice 435Valsamma Eapen and Rudi Crncec
22 Autistic Traits in the Development of Non‐Autistic Psychopathology 455William Mandy
23 A Brief History of the Diagnostic Classification of Childhood Externalizing Disorders 475Paul J. Frick and Laura C. Thornton
Part 2 Legal, Societal, and Policy Impact 497
24 How can Developmental Psychopathology Influence Social and Legal Policy? Adolescence, Mental Health, and Decision Making 499Kathryn L. Modecki and Bep Norma Uink
Index 519


Nathalie M. G. Fontaine, School of Criminology, University of Montreal
Isaac T. Petersen, Department of Psychological and Brain Sciences, Indiana University
Henrik Larsson, Department of Medical Epidemiology and Biostatistics, Karolinska Institute, Stockholm, Sweden
Brian M D’Onofrio, Department of Psychological and Brain Sciences, Indiana University, Bloomington, IN, USA
Madeleine J. George, Duke University
Michael A. Russell, Penn State University
Candice L. Odgers, Duke University
Nicola Shaughnessy, School of Arts, University of Kent
Cynthia S. Peng, Department of Speech, Language, and Hearing Sciences, George Washington University, USA
Gregory L. Wallace, Department of Speech, Language, and Hearing Sciences, George Washington University, USA
Nicola Botting, Division of Language and Communication Science, School of Health Sciences, City, University of London
Chloe Marshall, UCL Institute of Education, University College London
Jarla Pijper, Adolescent Development, Utrecht University & Clinical Child and Adolescent Studies, Leiden University
Minet de Wied, Adolescent Development, Utrecht University
Stephanie van Goozen, Clinical Child and Adolescent Studies, Leiden University & School of Psychology, Cardiff University
Wim H. J. Meeus, Adolescent Development, Utrecht University & Developmental Psychology, Tilburg University
List of Contributors

x List of Contributors
Stefanie Hoehl, 1. Max Planck Institute for Human Cognitive and Brain Sciences, Leipzig, Germany; 2. Department of Applied Psychology: Health, Development, Enhancement and Intervention, University of Vienna
Emily J.H. Jones, Brain and Cognitive Development, Birkbeck, University of London
Mark H. Johnson, Brain and Cognitive Development, Birkbeck, University of London
Dr Alice Jones Bartoli, University of London
Prof Alice M. Gregory, Goldsmiths, University of London
Kostas A. Papageorgiou, 1. School of Psychology, Queen’s University Belfast, UK; 2. Department of Psychology, Tomsk State University, Russia
Angelica Ronald, Department of Psychological Sciences, Birkbeck, University of London
Yulia Kovas, (1) Goldsmiths, University of London; (2) Tomsk State University
Maria Grazia Tosto, Tomsk State University
David M. Williams, School of Psychology, University of Kent
David J. Hawes, PhD, School of Psychology, The University of Sydney
Luna C. Muñoz Centifanti, University of Liverpool, UK
Scott Risser, Montana Tech, USA
Bethany Little, Durham University, UK & Vrije Universiteit, Netherlands
Hedwig Eisenbarth, University of Southampton
Dale M. Stack, Concordia University, Department of Psychology and Centre for Research in Human Development
Lisa A. Serbin, Concordia University, Department of Psychology and Centre for Research in Human Development
Célia Matte‐Gagné, Concordia University, Department of Psychology and Centre for Research in Human Development
Danielle Kingdon, Concordia University, Department of Psychology and Centre for Research in Human Development
Kelly Doiron, Concordia University, Department of Psychology and Centre for Research in Human Development
Alex E. Schwartzman, Concordia University, Department of Psychology and Centre for Research in Human Development
Amanda Sheffield Morris, Oklahoma State University
Benjamin J. Houltberg, Fuller Theological Seminary
Michael M. Criss, Oklahoma State University
Cara D. Bosler, Oklahoma State University

List of Contributors xi
Carl F. Weems, Iowa State University
Brandon G. Scott, Arizona State University
Jacob A. Burack, Department of Educational and Counselling Psychology, McGill University, Montreal, Quebec, Canada
Ashley Reynolds, Department of Psychology, Concordia University, Montreal, Quebec, Canada
Oriane Landry, School of Psychology and Public Health, La Trobe University Melbourne, VIC, Australia
Gillian Klassen, Department of Educational and Counselling Psychology, McGill University, Montreal, Quebec, Canada
Natalie Russo, Department of Psychology, Syracuse University, Syracuse, New York, USA
Stephanie A. Fryberg, Department of Psychology and American Indian Studies, University of Washington, Seattle, Washington, USA
Valsamma Eapen, School of Psychiatry, Faculty of Medicine, University of New South Wales, Australia
Rudi Črnčec, School of Psychiatry, Faculty of Medicine, University of New South Wales, Australia
William Mandy Department of Clinical, Educational and Health Psychology, Division of Psychology & Language Sciences, Faculty of Brain Sciences, University College London
Paul J. Frick, Louisiana State University & Australian Catholic University
Laura C. Thornton, Boys Town, Omaha, Nebraska USA
Kathryn L. Modecki, Griffith University, Brisbane, Australia
Bep Norma Uink, Murdoch University, Western Australia


Developmental Psychopathology: An up‐to‐date Historical
and Methodological Overview
Section I


Methods for Studying Developmental Psychopathology
Part 1


The Wiley Handbook of Developmental Psychopathology, First Edition. Edited by Luna C. Centifanti and David M. Williams. © 2017 John Wiley & Sons Ltd. Published 2017 by John Wiley & Sons Ltd.
Developmental Trajectories of Psychopathology
An Overview of Approaches and ApplicationsNathalie M. G. Fontaine and Isaac T. Petersen
1
Introduction
Developmental psychopathology concerns the study of the development of psychological disorders (e.g., depression, anxiety, schizophrenia, conduct problems), risk and protective factors, as well as outcomes, through a lifecourse perspective (Cicchetti, 1989; Rutter, 1990). Longitudinal studies, which involve repeated measures of the same variables from the same individuals, are crucial to investigate change (increases or decreases), but also stability, of psychopathology over time. Indeed, unlike cross‐ sectional studies, in which different individuals are compared at one time point, longitudinal studies allow for (1) the exploration of within‐individual change (or stability)—that is, how each individual develops over time—and (2) between individual differences—including the investigation of distinct patterns of change (or stability) over time across individuals and factors associated with these distinct patterns (Singer & Willett, 2003).
More specifically, longitudinal data enable testing hypotheses about the development of behaviors, the developmental association between different, yet related behaviors (e.g., hyperactivity and physical aggression) and the factors associated with stability or change of behaviors over time. The identification of factors associated with persistence or change in behavior (increasing or decreasing patterns) can shed light on the vulnerabilities associated with severe and persistent psychopathology. In turn, a better understanding of risk processes in the development of psychopathology can help in the development of effective intervention strategies that target protective factors associated with desistance or decreased levels of psychopathology. Longitudinal data can therefore be useful for testing developmental theories about psychopathology as well as the effectiveness of prevention and treatment programs (Cicchetti & Toth, 1992).
New advances in statistical approaches over the last decades help in maximizing what we can learn using longitudinal data in the field of psychopathology (Nagin, 2005). Methodologists have developed various statistical approaches, which include and are known variously as growth curve models (GCMs), random coefficient models, multilevel models, mixed models, mixed‐effects models, hierarchical linear models,

6 Nathalie M. G. Fontaine and Isaac T. Petersen
group‐based trajectory models (GBTMs), latent class growth models (LCGMs), and growth mixture models (GMMs) (Muthén, 2004; Nagin, 2005; Singer & Willett, 2003). The approaches have been applied with a rapid rise in many areas of developmental psychopathology research (Curran, Obeidat, & Losardo, 2010; Nagin & Odgers, 2010), including conduct problems (Nagin & Tremblay, 1999), depression/anxiety (Côté et al., 2009), callous‐unemotional traits (Fontaine, Rijsdijk, McCrory, & Viding, 2010), and substance use problems (Hu et al., 2008). These approaches have also been applied to assess heterogeneity in treatment responses to clinical trials (Muthén et al., 2002).
Statistical approaches for longitudinal data can be complex in terms of selecting the optimal approach, fitting the models to the data and interpreting the findings with respect to hypothesis and theory (Curran et al., 2010). In this chapter, we introduce some of the approaches and applications, particularly to non‐technical readers, including researchers, clinicians, and graduate students, who may not have yet received an extensive training in this area. References to more detailed and complete technical developments on these approaches are offered for interested readers. We first provide an overview of the approaches, with a focus on GCM, GBTM and GMM, namely approaches focusing on developmental trajectories (Muthén, 2004; Nagin & Odgers, 2010). Next, we present selected examples of applications of these models in the field of developmental psychopathology and clinical psychology. Finally, we discuss methodological considerations when applying these models and interpreting the findings.
Overview of the Approaches
This section presents an overview of three approaches applied to longitudinal data, and more specifically to trajectory modeling: GCM, GBTM and GMM. We selected these three approaches because they share a common analytical goal, namely to examine differences or variability across members of a population in their developmental trajectories (Nagin & Odgers, 2010). A developmental trajectory can be defined as the course of a behavior over time or age (Nagin, 1999). Because these trajectory analyses examine longitudinal data with more than two measurement occasions, they have key advantages over analytical approaches that do not examine trajectories (Beauchaine, Webster‐Stratton, & Reid, 2005; Gueorguieva & Krystal, 2004). First, trajectory analyses tend to have better reliability and greater power to detect behavioral change than simple pre–post or difference score designs. Second, trajectory analyses have greater flexibility with unbalanced designs, unequal spacing of time points, and tolerate missing data, unlike repeated measures analysis of variance (ANOVA). Third, trajectory analyses are less likely to inflate the Type I error rate than are repeated measures ANOVA analyses, which have more strict assumptions (e.g., sphericity). Fourth, trajectory analyses often allow multiple outcomes to be examined in the same analysis. Although these approaches share a common goal, they make distinct assumptions about the distribution of trajectories in the population. Figure 1.1 presents hypothetical trajectories according to the GCM, GBTM, and the GMM approaches. In a nutshell, it is assumed with GCM that all individuals come from the same population and can be described by the same parameters of change. It is not assumed, however, that individuals’ change is identical—the model captures the average developmental trend and person‐specific variations around the average trend using the same parameters of

Developmental Trajectories of Psychopathology 7
change. GBTM and GMM, by contrast to GCM, assume that some individuals come from distinct subpopulations, as captured by different subgroups. These subgroups can be described by different parameters of change. In other words, the models allow different individuals to follow different trajectories, but only GBTM and GMM allow
Approach
GMM
GBTM
GCM
Trajectories Description
0
5
10
15
20
25
6 12 18 24
Beh
avio
r
Age
Assumes that all individuals come from the same population, but allows individuals’ change to differ—that is, the model captures the variations that are specific to each individual (random effects). The thin black lines denote the observed data points, the thick solid black line denotes the average trajectory of change and the shaded gray area around the line denotes the individual variations(Shiyko et al., 2012).
Assumes that some individuals come from distinct subpopula-tions, as captured by different subgroups. The subgroups are assumed to be homogenous regarding change—that is, that all individuals on a particular trajectory have the same pattern of behavior over time. The thin black lines denote the observed data points. For each trajectory, the thick solid black line denotes the average trajectory of change (Shiyko et al., 2012).
Assumes that some individuals come from distinct subpopula-tions, as captured by different subgroups. However, contrary to GBTM, heterogeneity within each subgroup is also consid-ered in GMM—that is, variations that are specific to each individual (random effects) like in GCM can also be modeled. The thin black lines denote the observed data points. For each trajectory, the thick solid black line denotes the average trajectory of change and the shaded gray area around the line denotes the individual variations (Shiyko et al., 2012).
0
5
10
15
20
25
6 12 18 24
Beh
avio
r
Age
Chronic
Late-onset
Normative
0
5
10
15
20
25
6 12 18 24
Beh
avio
r
Age
Chronic
Late-onset
Normative
Figure 1.1 Hypothetical Trajectories According to the GCM, GBTM, and the GMM Approaches.

8 Nathalie M. G. Fontaine and Isaac T. Petersen
subgroups (that are not captured by model predictors) of individuals with qualitatively different forms of change.
A number of differences exist between GCM, GBTM and GMM approaches. Researchers in developmental psychopathology often have to decide what approach they should apply. We present below a brief summary of the assumptions underlying each approach to help readers decide the optimal strategy for a given research question or hypothesis. Table 1.1 presents a summary of the key outputs of the three different approaches.
GCM
In their simplest form, GCMs typically fit a best‐fit straight line to each individual’s trajectory of change over time. Each individual’s line is allowed to have a different starting point (intercept) and direction and steepness of change (slope). Each individual’s best‐fit line is slightly adjusted to take into account the trajectories of the other individuals in the sample—a phenomenon known as shrinkage because individuals’ GCM estimates are shrunk towards the mean estimate for the sample, making the GCM estimates more reliable (i.e., having less measurement error) than estimates from simple regression (Hox, 2010). Based on theory and/or how well the model fits the data, the modeler can decide whether each parameter (intercept, slope) is the same (fixed effect) or allowed to differ (random effect) between individuals. GCM can be extended to consider nonlinear forms of change, such as polynomial (e.g., quadratic), exponential, and logistic forms.
GCM can be fit in a structural equation modeling (SEM) or hierarchical linear modeling (HLM; also known as multilevel modeling, mixed modeling, or mixed‐effects modeling; Raudenbush & Bryk, 2002) framework. In general, SEM is more advanced and flexible than HLM. SEM, unlike HLM, allows specifying latent variables that represent the common variance among observed (manifest) variables, and have less measurement error. Unlike HLM, SEM also allows specifying multiple outcomes in the same analysis and more flexibility in specifying correlated residuals (which, if residuals covary, would violate assumptions if unspecified). However, SEM typically requires a larger sample size than does HLM. In addition, HLM is more flexible when participants are not sampled at the same time points because HLM uses data in long form (rather than wide form in SEM). In long form, each row represents a combination of participant and measurement occasion (i.e., 100 participants × 3 measurement occasions = 300 rows, 100 variables = 100 columns). In wide form, each row represents one participant, with columns representing combinations of variable and measurement occasion (i.e., 100 participants = 100 rows, 100 variables × 3
Table 1.1 Summary of the key outputs of the GCM, GBTM, and the GMM approaches.
GCM GBTM GMM
Intercept and slope of development ✔ ✔
(for each trajectory)✔
(for each trajectory)
Individual‐specific effects (random effects) ✔ ✔
(for each trajectory)
Proportion of the population following each developmental trajectory
✔ ✔

Developmental Trajectories of Psychopathology 9
measurement occasions = 300 columns). If participants are not sampled at the same time points, however, wide form can be computationally cumbersome because it can result in too many columns where most participants have missing values (see Table 1.2 for an example of data in wide form and in long form). HLM (which uses long form—a more efficient data structure with less missingness when participants are sampled at different time points) can be advantageous in these circumstances. See Curran (2003) and Bauer (2003) for further discussion of similarities and differences between the two approaches, and when to use each.
GCM assumes that all individuals in the sample come from the same population and can be described by the same parameters of change (e.g., everyone could be described with a quadratic trajectory—a U‐shaped trajectory—in which scores of psychopathology would first decrease and then increase over time). GCM does not necessarily assume, however, that all individuals show identical change. For example, a polynomial GCM can allow each individual to have different intercepts, slopes, and curvatures. GCM grasps the average developmental trend and person‐specific variation around the average trend (random effect) using the same parameters of change for the population. Furthermore, GCM can also allow subgroups (e.g., males and females) with different trajectories, but the subgroups have to be described by the same parameters of change. Thus, individual or subgroup differences in GCM trajectories are assumed to reflect quantitative differences in degree rather than qualitative differences in kind. To examine qualitative differences between subgroups of individuals that are not captured by model predictors, however, one must use another type of model such as GBTM or GMM.
GBTM
GBTM has been developed by Nagin and colleagues (Nagin, 1999, 2005; Nagin & Tremblay, 1999). With this approach, the population under study is considered to be composed of qualitatively distinct subgroups that are not detectable using measured
Table 1.2 Example of data in wide form and in long form. Data on externalizing problems in wide and long forms for three participants and four time points.
Wide form Long form
ID Sex Ext_1 Ext_2 Ext_3 Ext_4 ID Sex Time Ext
1 F 1 0 2 Missing 1 F 1 1
2 F 2 6 8 Missing 1 F 2 0
3 M 4 7 6 8 1 F 3 2
2 F 1 2
2 F 2 6
2 F 3 8
3 M 1 4
3 M 2 7
3 M 3 6
3 M 4 8
Abbreviations: ID = identification number; Ext = externalizing problems.

10 Nathalie M. G. Fontaine and Isaac T. Petersen
characteristics (Nagin & Odgers, 2010). For instance, in a study on depressive symptoms, two different subgroups of individuals could compose the population, hypothetically one subgroup with a genetic vulnerability for depression and one without the vulnerability. If the subgroups are not distinguishable based on measured characteristics, we could assume that the dataset is composed of a combination of two different subgroups (Nagin & Odgers, 2010). Using GBTM, distinct statistical processes would be involved to explain the development of depressive symptoms in the two subgroups. Owing to distinct etiologies, the different subgroups might show different trajectories, which is the qualitative heterogeneity we seek to capture with subgroups in GBTM (as opposed to quantitative heterogeneity in GCM). The distinct subgroups are assumed to be homogeneous regarding change—that is, that all individuals on a particular trajectory have the same pattern of psychopathology (e.g., depressive symptoms) over time. Whether or not the trajectories really differ qualitatively as hypothesized may be subject to interpretation (Bauer & Reyes, 2010). In some instances, the trajectories may reflect points on a continuum as if a continuous variable was divided into different ordered‐categorical levels (e.g., low levels, moderate levels and high levels of psychopathological symptoms). Still, the subgroups’ trajectories could be distinguished by different predictors (e.g., childhood maltreatment) or be associated with different outcomes (e.g., job dissatisfaction).
Key outputs of GBTM are the proportion of the population following each trajectory and each individual’s probability of being classified in each trajectory (probability of membership in each trajectory). GBTM takes into account uncertainty in group assignment. Table 1.3 presents, as an example, hypothetical scores of conduct problems between ages 6 to 12 for four participants. Based on their scores and assuming that the GBTM estimated four trajectories (i.e., stable high, increasing, decreasing and stable low), the model should most likely classify with a high probability (e.g., 0.75 and above) Sam as following a stable high trajectory, Gabby as following an increasing trajectory, and Max as following a decreasing trajectory. Fred’s assignment to a group may be more challenging. For instance, Fred may have 0.51 probability to follow the stable high trajectory, 0.20 probability to follow the stable low trajectory, 0.10 probability to follow the increasing trajectory, and 0.19 probability to follow the decreasing trajectory (the probabilities sum to 1). Based on the probabilities, Fred would be classified in the stable high trajectory. Although using the trajectory membership (i.e., the assignment to trajectories according to the probabilities of each individual’s most likely group membership) can be clinically relevant, it is important to consider that the trajectories are most likely approximations of a more complex reality (Nagin & Odgers, 2010).
Table 1.3 Hypothetical scores of conduct problems from 6 to 12 years old for four participants.
Participants
Scores of conduct problems between 6 to 12 years old
6 7 8 9 10 11 12
Sam 9 8 6 10 8 6 7Gabby 2 4 5 4 6 8 10Max 10 7 7 6 4 2 1Fred 7 2 6 3 8 4 6

Developmental Trajectories of Psychopathology 11
GMM
GMM has been developed by Muthén and colleagues (Muthén & Shedden, 1999). This approach allows both qualitatively different patterns of change and quantitative differences within each pattern (Bauer & Reyes, 2010). Similarly to GBTM, the population under study is assumed to be composed of qualitatively distinct subgroups. However, heterogeneity within each subgroup is also considered—that is, variations that are specific to each individual (random effects) as in GCM can also be modeled within each subgroup. In GMM, the subgroups could not be explained by the between‐individual variability accounted for by individual‐specific effects in a single GCM (random effects). Instead, different single GCMs capture the population variability across time. In GMM, two or more GCMs are used to estimate the population variability in developmental trajectories. Key outputs of such an approach are two or more GCMs and estimates of the proportion of the population following each GCM.
Both GBTM and GMM provide helpful information about the shape and levels of the trajectories. The main difference between the two approaches is that GMM includes random effects (i.e., individual‐specific effects) in each trajectory, whereas GBTM does not. Adding random effects can lead to a fewer number of trajectories because it allows for more within‐group variability in individual‐level trajectory (Nagin & Odgers, 2010).
Examples of Applications
Studying Externalizing and Internalizing Problems Using GCM
In the following section, we present examples of how GCM can be used to study externalizing and internalizing problems across ages. We discuss linear (i.e., linear trend over time) and nonlinear (e.g., quadratic trend over time) models.
Linear Growth Curves The most common GCMs fit linear growth curves. Owens and Shaw (2003) examined linear trajectories of mother‐reported externalizing problems of children (n = 299) from 2 to 6 years of age from low‐income families. On average, children showed decreases in externalizing problems over time. Children with more externalizing problems at age 6 were characterized by more negative emotionality as infants and having depressed mothers, mothers who were less accepting of the child’s behavior, and parents with more inter‐parental conflict. Keiley, Bates, Dodge, and Pettit (2000) used SEM to simultaneously examine linear growth curves of mothers’ and teachers’ reports of children’s (n = 405) internalizing and externalizing problems from 5 to 12 years of age. Demonstrating the developmental comorbidity between internalizing and externalizing problems, intercepts and slopes of internalizing problems were positively correlated with the intercepts and slopes, respectively, of externalizing problems. In other words, the higher one’s initial level of internalizing problems, the higher one’s initial level of externalizing problems (and the greater one’s increases in internalizing problems, the greater one’s increases in externalizing problems). Children with higher intercepts of externalizing problems included children rejected by peers, children from lower socioeconomic status (SES) families, and European American (compared to African American) children. Children with greater increases of externalizing problems included boys, rejected children, and African American (compared to European American) children. In summary, GCMs

12 Nathalie M. G. Fontaine and Isaac T. Petersen
can test the effect of risk and protective factors on intercepts (initial level) and slopes (growth/change) of developmental trajectories, and can fit multiple behaviors simultaneously to understand their codevelopment.
Nonlinear Growth Curves In addition to linear growth curves, previous studies using GCMs have examined nonlinear growth curves. Studies have examined polynomial trajectories of externalizing problems, including quadratic (e.g., Bongers, Koot, van der Ende, & Verhulst, 2003), cubic (e.g., Nærde, Ogden, Janson, & Zachrisson, 2014), and quartic (e.g., Petersen, Bates, Dodge, Lansford, & Pettit, 2014) trajectories. Bongers and colleagues (2003) examined quadratic trajectories of parent‐reported externalizing problems (in addition to other behavior problems) in 2,076 Dutch children from ages 4 to 18 years. The sample showed curvilinear decreases in externalizing problems over time, on average. Boys had higher intercepts and steeper slopes (greater decreases) than girls, yet were reported to show more externalizing problems than girls across time. Nærde and colleagues (2014) examined cubic trajectories of parent‐reported physical aggression in 1,159 Norwegian children from 8 to 26 months of age. Aggression increased from 8 months, with a peak around 20 to 22 months, followed by a decrease to 26 months. Higher intercepts were found among boys (compared to girls), those having a same‐age sibling, higher levels of parental distress, lower parental education, more difficult child temperament, and higher levels of child activity. Slopes of aggression were predicted by the presence of a same‐age sibling and high child‐activity level. It is worth noting that it can be quite difficult to interpret the predictors of polynomial terms (Grimm, Ram, & Hamagami, 2011). In any case, GCMs can fit nonlinear trajectories and estimate the effects of risk and protective factors on the level and growth of these trajectories.
Joint Development of Related yet Different Behaviors Using GBTM
In this section, we present an example of trajectory modeling of two related yet different behaviors. This type of model (referred to as a dual or joint model) allows examining the developmental relations between two behaviors of interest (Nagin, 2005; Nagin & Tremblay, 2001). The joint model has three key outputs: (1) the developmental trajectories for each type of behavior; (2) the probability of membership in each joint trajectory (which reflects the proportion of individuals belonging simultaneously to trajectories of both types of behaviors (e.g., being classified in the high trajectory of one type of behavior and in the low trajectory of the second type of behavior); and (3) the probabilities linking membership in trajectories across behaviors (e.g., the probability of following a high trajectory of one type of behavior given the trajectory membership of the other behavior).
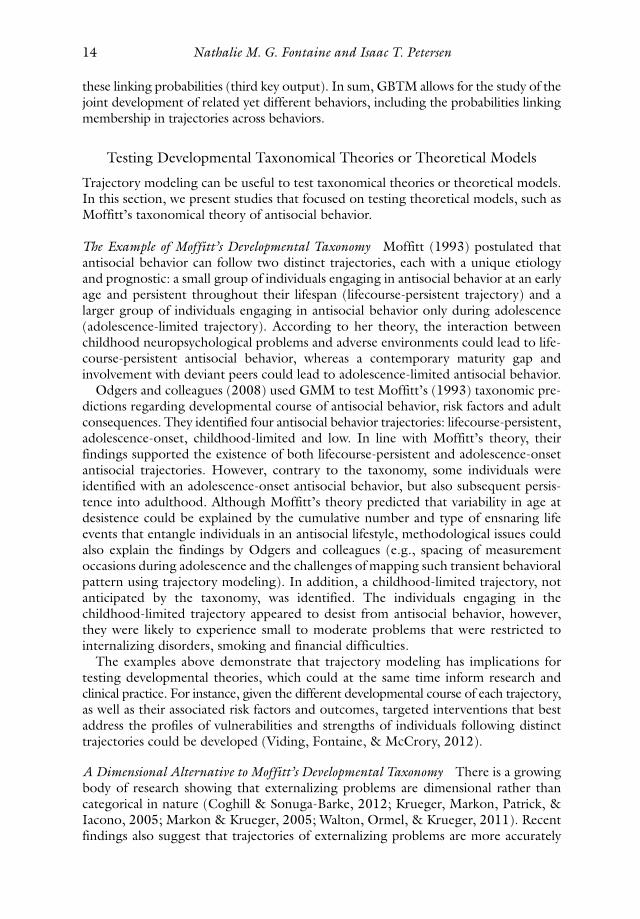
In a study of girls from a population‐based sample (n = 881), Fontaine and colleagues (2008) examined the joint developmental trajectories of physical aggression and hyperactivity between 6 to 12 years old (teachers assessed the behaviors yearly) using GBTM. They identified four trajectories of hyperactivity (None/Low, Moderate declining, Moderate stable and High declining) and three trajectories of physical aggression (None/Low, Moderate, and High declining) (first key output). They also found that about 10% of the girls belonged to the high trajectory of hyperactivity without high levels of physical aggression, that a small proportion of the girls (less than 1% of the sample) belonged to the high trajectory of physical aggression without high levels of hyperactivity, that about 9% of the girls belonged to the high

Developmental Trajectories of Psychopathology 13
trajectory of hyperactivity and the high trajectory of physical aggression, and that the remainder of the sample encompassed all other trajectory combinations (second key output). Finally, they found an asymmetric developmental association between hyperactivity and physical aggression; in other words, girls with high levels of physical aggression were highly likely to have high levels of hyperactivity (probability = 0.96), but girls with high levels of hyperactivity were only moderately likely to have high levels of physical aggression (probability = 0.45). In addition, girls who were not hyperactive were likely not to be physically aggressive (probability = 0.91), but girls who were not physically aggressive could show moderate levels of hyperactivity (probability = 0.28 for moderate declining levels and probability = 0.20 for moderate stable levels). Figure 1.2 illustrates
0None/Low
HYPModerate
declining HYP
Part A
Part B
Moderatestable HYP
High decliningHYP
0.1
0.2
0.3
0.4
0.5
Pro
babi
litie
s of
PA
0.6
0.7
0.8
0.9
1
High declining PA
Moderate PA
None/Low PA
High decliningPA
Moderate PANone/Low PA0
0.1
0.2
0.3
0.4
0.5
0.6
Pro
babi
litie
s of
HY
P 0.7
0.8
0.9
1
High declining HYP
Moderate stable HYP
Moderate declining HYP
None/Low HYP
Figure 1.2 Linking Probabilities between the Trajectories of Hyperactivity and Physical Aggression (Based on Fontaine et al., 2008). Part A: Probabilities of Physical Aggression (PA) Conditional on Hyperactivity (HYP); Part B: Probabilities of Hyperactivity (HYP) Conditional on Physical Aggression (PA).
14 Nathalie M. G. Fontaine and Isaac T. Petersen
these linking probabilities (third key output). In sum, GBTM allows for the study of the joint development of related yet different behaviors, including the probabilities linking membership in trajectories across behaviors.
Testing Developmental Taxonomical Theories or Theoretical Models
Trajectory modeling can be useful to test taxonomical theories or theoretical models. In this section, we present studies that focused on testing theoretical models, such as Moffitt’s taxonomical theory of antisocial behavior.
The Example of Moffitt’s Developmental Taxonomy Moffitt (1993) postulated that antisocial behavior can follow two distinct trajectories, each with a unique etiology and prognostic: a small group of individuals engaging in antisocial behavior at an early age and persistent throughout their lifespan (lifecourse‐persistent trajectory) and a larger group of individuals engaging in antisocial behavior only during adolescence (adolescence‐limited trajectory). According to her theory, the interaction between childhood neuropsychological problems and adverse environments could lead to lifecourse‐persistent antisocial behavior, whereas a contemporary maturity gap and involvement with deviant peers could lead to adolescence‐limited antisocial behavior.
Odgers and colleagues (2008) used GMM to test Moffitt’s (1993) taxonomic predictions regarding developmental course of antisocial behavior, risk factors and adult consequences. They identified four antisocial behavior trajectories: lifecourse‐persistent, adolescence‐onset, childhood‐limited and low. In line with Moffitt’s theory, their findings supported the existence of both lifecourse‐persistent and adolescence‐onset antisocial trajectories. However, contrary to the taxonomy, some individuals were identified with an adolescence‐onset antisocial behavior, but also subsequent persistence into adulthood. Although Moffitt’s theory predicted that variability in age at desistence could be explained by the cumulative number and type of ensnaring life events that entangle individuals in an antisocial lifestyle, methodological issues could also explain the findings by Odgers and colleagues (e.g., spacing of measurement occasions during adolescence and the challenges of mapping such transient behavioral pattern using trajectory modeling). In addition, a childhood‐limited trajectory, not anticipated by the taxonomy, was identified. The individuals engaging in the childhood‐limited trajectory appeared to desist from antisocial behavior, however, they were likely to experience small to moderate problems that were restricted to internalizing disorders, smoking and financial difficulties.
The examples above demonstrate that trajectory modeling has implications for testing developmental theories, which could at the same time inform research and clinical practice. For instance, given the different developmental course of each trajectory, as well as their associated risk factors and outcomes, targeted interventions that best address the profiles of vulnerabilities and strengths of individuals following distinct trajectories could be developed (Viding, Fontaine, & McCrory, 2012).
A Dimensional Alternative to Moffitt’s Developmental Taxonomy There is a growing body of research showing that externalizing problems are dimensional rather than categorical in nature (Coghill & Sonuga‐Barke, 2012; Krueger, Markon, Patrick, & Iacono, 2005; Markon & Krueger, 2005; Walton, Ormel, & Krueger, 2011). Recent findings also suggest that trajectories of externalizing problems are more accurately

Developmental Trajectories of Psychopathology 15
modeled dimensionally than with Moffitt’s (1993) subgroups (Walters, 2011, 2012; Walters & Ruscio, 2013; for a review, see Fairchild, van Goozen, Calder, & Goodyer, 2013). The dimensional nature of the development of externalizing problems suggests that GCM may be useful when modeling trajectories of externalizing problems because GCM seeks to capture quantitative variation in individuals’ trajectories.
However, one difficulty in measuring change in externalizing problems across long developmental periods is that the meaning of externalizing behaviors changes with development. For instance, physical aggression is more common in young children than adolescents (Miller, Vaillancourt, & Boyle, 2009), so physical aggression may likely represent a more severe trait level of externalizing behaviors in adolescence than it does in early childhood. Because the meaning of externalizing behaviors changes with development (known as heterotypic continuity), the same measure may have a different meaning at different ages. Thus, developmental changes in the construct of externalizing behavior may necessitate changes in measurement. A widely used measurement system for externalizing behavior, the Achenbach System of Empirically Based Assessment (ASEBA; Achenbach, 2009) accommodates changes in the construct of externalizing behaviors by including different items at different ages in development. A key challenge is ensuring that differences across time reflect actual change rather than differences in the meaning of the measure. One approach to make scores on different measures statistically comparable is to use a proportion score (Little, 2013), where the child’s problem sum is divided by the total possible score on the measure.
Petersen and colleagues (2015) examined GCMs of externalizing problems from 5 to 27 years of age (n = 585) using proportion scores of ratings by mothers, fathers, teachers, peers and self‐report on the ASEBA. Quartic (fourth‐degree polynomial) trajectories were the best‐fitting form of change. On average, externalizing problems decreased from early childhood to preadolescence (ages 5–11), increased during adolescence (11–16), and decreased from late adolescence to adulthood (16–27). Yet there were great individual differences in intercepts and slopes that were predicted by risk factors reflecting family process, peer process, stress, and individual characteristics. The quartic model with these risk factors as predictors was fairly accurate, and accounted for 70% of the variability in the development of externalizing problems. In sum, GCMs can accurately capture dimensional individual differences in the development of externalizing problems over long developmental spans with changing measures.
Testing the Effectiveness of Interventions Using Trajectory Modeling
Trajectory modeling can be applied to assess the effects of intervention strategies nested in longitudinal studies, such as longitudinal randomized trials. In the following section, we present studies in which GBTM, GMM and GCM were applied to examine interventions’ effects in longitudinal randomized trials.
GBTM and GMM to Test the Effectiveness of Randomized Preventive Interventions GBTM and GMM can be used to examine the impact of interventions on subgroups characterized by different growth trajectories, that is the effects on populations that include individuals who have normative and non‐normative patterns. The strength of such analysis is that it allows the assessment of intervention effects on the different trajectories rather than focusing on overall intervention effects at a specific time point.

16 Nathalie M. G. Fontaine and Isaac T. Petersen
Lacourse and colleagues (2002) used GBTM to assess the effects of a randomized multimodal preventive intervention in boys (n = 909). Boys with high levels of disruptive behavior (based on the teachers’ assessment in kindergarten) were randomly assigned to the intervention group (n = 42) or the control group (n = 115). The rest of the sample was considered to be at low risk (based on the teacher’s assessment of disruptiveness in kindergarten). The intervention took place when the boys were aged between 7 and 9 years old. GBTM was used to identify the trajectories for three different outcomes between 11 and 17 years old, that is physical aggression, vandalism and theft (based on self‐reports). For each outcome, six trajectories were identified (i.e., Low 1, Low 2, Low rising, Low decline, Medium decline, and High rising). The authors examined the probabilities of following the trajectories of physical aggression, vandalism, and theft depending on whether the participants were in the intervention group, the control group or the low‐risk group. Results suggested that the intervention changed the course of antisocial behavior throughout adolescence, especially physical aggression. Boys in the intervention group compared to those in the control group were more likely to follow the lowest‐level trajectory of physical aggression and were less likely to follow high‐level trajectories of physical aggression.
Using GMM, Muthén and colleagues (2002) examined the effects of a randomized intervention aimed at reducing aggressive behavior in children (119 boys were in the intervention group and 80 boys were in the control group). The intervention was applied during the first and second grade, and the children were followed from the first to seventh grade with respect to the course of aggressive behavior. The authors notably tested whether or not intervention effects differed across trajectories. They found that the estimated four‐trajectory model fitted the data well (e.g., High, Medium, Low and Late‐starters), and that the benefits from the intervention were more evident for boys who were initially more aggressive (i.e., the rate of change over time for the boys in the High trajectory was greater for the ones in the intervention group compared to their counterparts in the control group).
According to Muthén and colleagues (2002), trajectory‐modeling techniques should not be used as a substitute for examining significant overall effects of an intervention (e.g., when the group that received the experimental treatment is compared with the control group on the outcomes of interest regardless of the trajectory membership). Reliance on trajectory modeling in the absence of overall effects of an intervention could result in spurious findings given the multiple comparisons issue (as more comparisons are performed, it becomes more likely that the treatment and control groups will appear to differ on at least one aspect by random chance alone). They recommended that trajectory modeling should be carried out by comparing the estimated trajectories with those from existing empirical data or theory. Still, the identification of different intervention effects for individuals following distinct trajectories can be clinically useful. For instance, this information could be used for designing intervention studies where specific interventions could be implemented to address the strengths and vulnerabilities of individuals following different trajectories based on longitudinal screening procedures (Muthén et al., 2002).
GCM to Test Predictors, Moderators and Mediators of Treatment Response Beauchaine and colleagues (2005) examined predictors, moderators, and mediators of treatment response among 514 3–8‐year‐old children treated for conduct problems. Children were randomly assigned to a waitlist condition or to one or more combinations of