Embed Size (px)
Citation preview

FAOWATER
REPORTS
35
ISSN 1020-1203
The wealth of wasteThe economics of wastewater use in agriculture

The wealth of waste:The economics of wastewater use in agriculture
By
James WinpennyWychood Economic Consulting Ltd.,United Kingdom
Ingo HeinzTechnische UniversitatätDortmund, Germany
Sasha Koo-OshimaFAO Land and Water Divsion
and Case Study Authors
Miguel SalgotUniversity of Barcelona, Spain
Jaime ColladoICID, Mexico
Francesc HernandezUniversity of Valencia, Spain
Roberta TorricelliUniversity of Barcelona, Spain
FOOD AND AGRICULTURE ORGANIZATION OF THE UNITED NATIONS Roma 2010
FAO WATER
REPORTS
35


iii
Contents
Acknowledgments X
Summary XI
List of Acronyms XV
1. Introduction to wastewater reuse 11.1 Background, context and key issues 1
1.2 Purpose of the report 1
1.3 The global context 2
1.4 The case for reusing wastewater 8
1.5 Wastewater reuse in practice 11
1.6 Public health concerns & guidelines 14
Health protection measures 16
1.7 Wastewater quality: the basic treatment processes 18
1.8 Environmental, infrastructural and legal issues 19
2. A regional perspective: introduction to the case studies from Spain & Mexico 23
2.1 Spain: Llobregat Delta 242.2.1 Site features 242.1.2 Wastewater treatment 262.1.3 Expansion of effluent reuse in agriculture 282.1.4 Intersectoral water exchange 29
2.2 Spain: Tordera Delta & Costa Brava 312.2.1 Site features 312.2.2 The Mas Pijoan Farm – a microcosm of effluent reuse 332.2.3 Options for the future 34
2.3 Mexico: Mexico City & Tula Valley 362.3.1. Site features 362.3.2 Impacts of water reclamation on agriculture 37
2.4 Mexico: Guanajuato City & La Purisima irrigation project 382.4.1 Site features 38
2.5 Durango City & Guadelupe Victoria irrigation module 402.5.1 Background 402.5.2 Site features 412.5.3 Scope for intersectoral water exchanges 422.5.4 Longer term prospects 44
2.6 Concluding overview of case studies 44
iv
3. An economic methodology for assessing the feasibility of using recycled water in agriculture 47
3.1 Introduction: a three-fold approach 47
3.2 Economic Appraisal: cost-benefit analysis (CBA) 483.2.1 Benefits (see also 3A6) 503.2.2 Costs (see also 3A5) 503.2.3 Some practical steps for the use of CBA or Cost-Effective Analysis (CEA) in effluent reuse projects 51
3.3 Cost-effectiveness analysis (CEA) 58
3.4. Financial feasibility 593.4.1 Financial impact on key stakeholders 593.4.2 Financial instruments and transfers 603.4.3. Funding the project 62
Appendix to Chapter 3: Further guidance on the methodology of cost-benefit and cost-effectiveness analysis relevant to the economic appraisal of wastewater reuse projects. 633 A1. Adjusting for economic distortions 63
3 A2. Taxes, subsidies & transfer payments 63
3 A3. Tradeables, non-tradeables & unquantifiable items 63
3 A4. Value of health and disease 64
3 A5. Costs 64
3 A6. Benefits 66
3 A7. Estimating discount rates 67
3 A8. Risk assessment and appraisal 68
4. Results and conclusions from case study analyses 714.1 Spain: Llobregat Delta 71
4.1.1 Overall situation 714.1.2 Specification of preferred options 714.1.3 Implications of the CBA 734.1.4 Financial feasibility 76
4.2 Tordera Delta & Costa Brava 774.2.1 Overall situation 774.2.2. Project specification 784.2.3 Assessment of project impact 78
4.3. Mexico 834.3.1.Mexico City & Tula Valley 834.3.2 Guanajuato City & La Purísima 834.3.3 Durango City & Guadalupe Victoria irrigation module 84
4.4 Issues arising from the use of the economic methodology 86
4.5. Policy implications of results of case studies 87
5. A planning framework for wastewater reuse 895.1 The process of project planning 89
5.2 Identification of problem & project objectives 91
5.3 Definition of study area and background information 92
5.4 Market assessment & market assurances 94
5.5. Identification of project alternatives 96

v
5.6 Appraisal and ranking of project alternatives 96
5.7 Project implementation plan 98
5.8 Technical issues 99
6. Conclusions 1056.1 Context and Starting Point 105
6.2 Synergies and win-win outcomes 108
6.3 The feasibility of water reuse 108
6.4 Public awareness 109
References 111
ANNEXAdditional Bibliographical References 115
OFFICIAL DOUCMENTS RELEVANT TO MEXICO CASE STUDIES 121
vii
List of figures
1.1 Actual renewable water and groundwater resources perinhabitant in 2005 5
1.2 Water intensity use index by country around 20015 5
1.3 Municipal water reuse schemes, by field of application 12
1.4 Options for the reduction of viral, bacterial and protozoan pathogens by different combinations of health protection measures
that achieve the health-based target of ≤10-6 DALYs per person per year 15
2.1 Deflection channels in the lower-Llobregat river course 26
2.2 Mas Pijoan irrigation pipeline scheme (2006) 33
4.1.a Project infrastructure 74
4.1.b Map of WWPT and reclaimed water. Irrigated agriculture area 75
5.1 Project planning process 895.2 Pathway of wastewater from source to points of use or discharge 99
List of maps
2.1 Llobregat river basin 25
2.2 Wastewater treatment plants 27
2.3 Reclaimed water demand in the Llobregat Delta 31
2.4 a and b. Tordera River Delta and exploiting well distributions 32
2.5 Castell-Platja d’Aro WWTP 35
2.6 Mexico City and Tula Valley irrigation districts 36
2.7 Irrigation units downstream Guanajuato City 39
2.8 Durango City and Guadalupe Victoria Irrigation Module 41
2.9 Network between Blanes desalination plant and water supplier in Tordera Delta 43

viii
List of tables
1.1 Threshold values used to characterise water stress within a region 4
1.2 Competition for conventional water resources in agricultural areas 6
1.3 Values of water use in the USA, by sector 10
1.4 Agricultural crops grown with untreated and treated municipal wastewater 14
1.5 Water quality categories for different final uses of reclaimed
wastewater defined by the Aquarec project 16
1.6 Examples of crops irrigated with treated wastewater 17
1.7 Factors affecting the choice of irrigation method and special measures required for reclaimed water applications 19
1.8 Classification of cultivation practices as a function of the health risk
for agricultural workers 20
1.9 Levels of risk associated with different types of crops irrigated with reclaimed water 20
2.1 Case material sites 23
2.2 Wastewater output and reuse in Llobregat delta (2006) 28
2.3 Action planned in Delta de Llobregat and Barcelona metropolitan area to improve water management 30
2.4 Projected multi-purpose use of reclaimed water in Llobregat Delta for 2015 30
2.5 Investment cost of expansion of reclaimed water use at
Platja d’Aro area 35
2.6 Additional water availability in Tula Valley due to reclaimed wastewaters 38
2.7 Overview of case studies 45
3.1 Total economic value 53
3.2 Financial impact of effluent reuse on major stakeholders 58
4.1 Costs and benefits of projects 70
4.2 Proposed allocation of extra reclaimed water in Platja d’Aro area 76
4.3 Blanes project: cost and benefit categories 77
4.4 Costs and benefits of Platja d’Aro WWTP upgrade (€ million) 77
4.5 Comparison between past and present situation at Mas Pijoan Farm 79
4.6 A cost-benefit framework for an intersectoral agreement in Durango City 83
5.1 Outline of a wastewater reclamation and reuse facilities plan 88
5.2 Study area characteristics and baseline information 91
5.3 Steps in gathering background information for a reclaimed water market assessment 93
5.4 Information required for a reclaimed water market survey of potential users 93

ix
5.5 Farmers’ potential concerns about reclaimed water 94
5.6 Water reuse: examples of project alternatives 95
5.7 Major cost elements of wastewater reuse systems 98
5,8 Reclaimed water quality and effects on agricultural use 100
5.9 Waterborne pathogens or chemicals of health concern present in wastewater 101
5.10 Summary of health risks associated with the use of wastewater for irrigation 102
List of boxes
1.1 Integrated wastewater treatment and reuse in Tunisia 12
1.2 Potential impact of EU Water Framework Directive on wastewater reuse 13
2.1 Water policy in the Llobregat delta 29
2.2 The Mas Pijoan Ranch 34
3.1 Estimating social time preference 67
4.1 Preferred options at Sant Feliu and El Prat WWTPs 72
4.2 Global Water Intelligence quote 88
5.1 The planning framework 89
5.2 Criteria for project choice 97

x
Acknowledgements
This document is carried out by FAO Headquarter Programme Funds with the participation of the Mexican National Committee for the International Commission on Irrigation and Drainage (ICID), Spanish Universities of Barcelona and Valencia, the Catalonian Water Agency, Dortmund University of Germany, and James Winpenny of Wychwood Economic Consulting, Ltd., UK. The work upon which the final report is based was originally synthesized by Prof. Ingo Heinz of Dortmund University with Case Studies prepared by: Jaime Collado, Miguel Salgot, Francesc Hernandez, Roberta Torricelli, and Lorenzo Galbiati.
The review of the document was conducted by: Richard Mills of California State Water Resources Control Board; Curtis Cooper of the U.S. Environment Protection Agency, Robert S. Kerr Environmental Research Center; Natalie Fonder of Faculté des Sciences Agronomique de Gembloux; and the FAO Land and Water Division.
Many thanks are due to: James Winpenny who made substantial contributions to the task of drawing together the material to form a single coherent and authoritative document; Sasha Koo-Oshima who initiated the study and was the FAO Programme Officer in charge of Water Quality and the Environment; Pasquale Steduto, the Chief of Land and Water Division who provided the budget; and Luis Rendon, President of the Mexican ICID and Irrigation Districts Manager of the Mexican National Water Commission who facilitated the project sites. Photo-editorial and graphic design assistance was received from Bouchra El Zein and Simone Morini.
Additional appreciations are due to field mission contributors and organizers: MexicoEngr. Sergio Soto Priante, Deputy General Director for Hydro-agricultural Infrastructure, Mexican National Water CommissionEngr. Filemón Rodríguez, Tula Reservoir ID003Engr. José Rodríguez, La Purisima Irrigation ModuleEngr. Carlos Rascón, ID052 DurangoEngr. Miguel Calderón, Durango Municipal Water Utility Eugenio Garcia, Presidente of Water User Association, Cortazar Irrigation ModuleRamiro Merino, Manager of Cortazar Irrigation ModulePedro Caudillo Mendiola, Productores Agricolas de al Presa la PurisimaIgnacio Acosta Mena, Productores Agricolas de al Presa la Purisima (Presidente)Farmers of the represented Irrigation DistrictsFAO-Representation to Mexico – Norman Bellino and Maria Carmen CulebroJaime Collado, Vice President of ICID Mexico, Organizer of Mexico field missionSpainLorenzo Galbiati, Agència Catalana de l’Aigua, Water pricing and financeEnric Queralt Creus, Comunitat d’Usuaris d’Aigùes del Delta del LlobregatElena Isla, Parc Agrari del Baix LlobregatRamon Terricabras Maranges, Parc Agrari del Baix LlobregatLuis Sala i Genoher, Consorci de la Costa BravaFarmers of river deltas represented in this report, andMiguel Salgot, University of Barcelona and EU Aquarec, Organizer of the spanishfield mission

xi
Summary
REUSE AS A RESPONSE TO WATER SCARCITYThe use of reclaimed water in agriculture is an option that is increasingly being investigated and taken up in regions with water scarcity, growing urban populations and growing demand for irrigation water. This report presents an economic framework for the assessment of the use of reclaimed water in agriculture, as part of a comprehensive planning process in water resource allocation strategies to provide for a more economically efficient and sustainable water utilization. Many regions of the world are experiencing growing water stress. This arises from a relentless growth of demand for water in the face of static, or diminishing, supply and periodic droughts due to climatic factors. Water stress is also caused by pollution from increasing amounts of wastewater from expanding cities, much of it only partially treated, and from the contamination of aquifers from various sources. Such water pollution makes scarcity worse by reducing the amount of freshwater that is safe to use. Water scarcity in all its aspects has serious economic, social and even political costs.
At times of serious scarcity, national authorities are inclined to divert water from farmers to cities since water has a higher economic value in urban and industrial use than for most agricultural purposes. In these circumstances, the use of reclaimed water in agriculture enables freshwater to be exchanged for more economically and socially valuable purposes, whilst providing farmers with reliable and nutrient-rich water. This exchange also has potential environmental benefits, reducing the pollution of wastewater downstream and allowing the assimilation of its nutrients into plants. Recycling water can potentially offer a “triple dividend” - to urban users, farmers and the environment.
Reclaimed water use can help to mitigate the damaging effects of local water scarcity. It is not the only option for bringing supply and demand into a better balance – and this report shows how different options can be analysed for comparison – but in many cases it is a cost effective solution, as the growing number of reuse schemes in different parts of the world testify. A recent comprehensive survey found over 3,300 water reclamation facilities worldwide. Agriculture is the predominant user of reclaimed water, and its use for this purpose has been reported in around 50 countries, on 10% of all irrigated land.
BENEFITS OF REUSEThe feasibility of reuse will depend on local circumstances, which will affect the balance of costs and benefits. The major benefit in most cases is likely to be the value of the fresh water exchanged for high-value urban or industrial use. This would lessen the cost for municipal authorities of seeking their supplies through more expensive means. In addition, reuse prevents untreated wastewater discharge to coastal and groundwater systems with ecosystem and tourism benefits.
Depending on the local situation, there could also be benefits to farmers if they can avoid some of the costs of pumping groundwater, while the nutrient present in the wastewater could save some of the expense of fertilizer. There could also be benefits to the local environment from reduced flows of untreated wastewater – though the interruption in the downstream water cycle could have other, less beneficial, effects.

xii
The costs and benefits of reuse projectsThe costs of the reuse option could include the installation or upgrade of wastewatertreatment plants (WWTPs) to produce effluent of the desired standard, any addition or modification to the infrastructure for water and reclaimed water distribution, the extra recurrent costs of treatment, and the cost of any produce restrictions imposed by the use of reclaimed water in irrigation. Where climatic and geographical features are suitable, low-cost treatment of wastewater may be an option through the use of stabilisation ponds, constructed wetlands, etc. The net cost of treatment may also be reduced through the reuse of biogas for energy and power in the intensive treatment processes, or potentially through the sale of carbon offsets.
ECONOMIC JUSTIFICATIONThe economic appraisal of the project should be from a regional basin viewpoint, comparing its economic costs and benefits. Judging by the evidence of our case studies, it is unlikely that schemes could be economically justified with reference only to agriculture. Although farmers may be net beneficiaries from using treated wastewater, compared with their previous or alternative sources of water, this depends very much on local circumstances, and in any event their net benefits are unlikely to offset the full costs of the scheme. On the other hand, the benefits to urban and industrial users could be relatively sizeable, and in most cases would be the principal justification for the project. The net impact of the project on the local and downstream environment will also be very site-specific, and there are likely to be both benefits and costs.
FINANCIAL FEASIBILITYOnce the basic economic justification of the project is established, the next step is to examine its financial feasibility. The distribution of the costs and benefits of the project between different stakeholders is crucial to its feasibility. Its impact on the finances of the various stakeholders – national government, regional water authority, farmers, municipal utility and/or other major players – should be assessed. Financial gainers and payers should be identified to gauge the incentives, or conversely the penalties, to be applied and the type of funding that would be appropriate. Water charges, taxes, subsidies, soft loans, environmental service payments, and other instruments could all form part of the financing proposals.
A PLANNING FRAMEWORK The economic framework for wastewater reuse presented in chapters 3 and 4 is intended to fit within a comprehensive planning framework. A sound and methodical planning approach will assist in identifying all the relevant factors necessary for the decision to proceed with a project. Chapter 5 presents such a planning framework, its key elements being: identification of problem and project objectives; definition of study area and background information; market assessment and market assurances; identification of project alternatives; appraisal and ranking of project alternatives; and implementation. Among the major specific technical issues to be addressed are: facilities and infrastructure, balancing supply and demand, wastewater quality, and public health risks and safeguards.
FACTORS ESSENTIAL FOR THE SUCCESS OF REUSE PROJECTSThe feasibility of reuse projects hinges on several key factors. The physical and geographical features of the area should be conducive to an exchange of water rights between the parties concerned. The extra costs (of treatment and infrastructure) should be affordable in relation to benefits. Farmers should be supportive, which depends on

xiii
the net impact on their incomes, the status of their rights to freshwater, and what are their alternatives. Public health authorities should be satisfied that the projects pose no undue risks, after reasonable precautions have been taken. Finally, the environmental impact should be acceptable: the same impact may be acceptable or not in different circumstances, and different authorities will place a different weight on specific impacts in forming an overall judgement.1
A REALITY CHECK – CASE STUDIES FROM SPAIN AND MEXICOOn a global scale, only a small proportion of treated wastewater is currently used for agriculture, but the practice is growing in many countries, and in some regions a high proportion of reclaimed water is used in irrigation. The variety of case material presented from Spain and Mexico provides a good field testing for the approach presented in Chapter 3 on Methodologies of Cost-Benefit and Cost-Effective Analyses. Chapter 4 on case study results demonstrates that the methodology presented for appraising wastewater reuse projects is viable. Although the Cost-Benefit Analysis analyticalframework is well able to incorporate the interests of municipalities and farmers, there is an important third party at the table – the environment – which needs a champion and a custodian. Reflecting the needs of the environment, valuing its assets and services, and ensuring that its financing needs are met, is a challenge to analysts in this area. The case studies confirm that reuse is an area ripe for the application and refinement of the tools of environmental cost-benefit analysis.
The case material demonstrates that certain items of costs and benefits are more robust than others. On the cost side, the capital costs of treatment units, pumps and canals can be estimated with high confidence, and their operating costs (pumping, chemicals, labour, etc.) are also fairly evident. The technology of wastewater treatment and its future level of unit costs are liable to change, and future options should not be prematurely foreclosed.
Most of the case studies stress the perceived benefits to farmers from the nutrient properties of effluent, plus savings in groundwater pumping and the greater reliability of effluent compared with other sources of water in arid and semi-arid climates. While pumping costs are reasonably firm, the benefits of fertilization depend on local empirical evidence (“with and without project”). The value of reliable wastewater also needs to be demonstrated more convincingly, e.g., by a closer study of farmers’ response behaviour where water supply is erratic or scarce.
From the viewpoint of urban water demand, the case studies reflect the widespread view that water supply tariffs are too low, hence there is a pervasive underestimation of the benefits created by developing new solutions to growing demand. However, some of the cases illustrate the importance (stressed in chapter 3) of distinguishing genuinely new benefits, on the one hand, from the avoided costs of meeting existing demand in a different way.
The analysis of the case studies has implications for policy towards the use of reclaimed water, depending on what its principal objectives are:
as a feasible and cost-effective means of meeting the growing demands of agriculture for water in regions of growing water scarcity and competition for its use. This motive also applies in situations where demand is not necessarily rising, but where periodic water scarcity is a problem for farmers planning their annual crop patterns. The case studies contain evidence (revealed preferences)of farmers responding positively to the use of effluent in these situations, as
1 Local environmental policy (pollution taxes, payments for environmental services, incentives for the recovery of heat from biogas, etc.) could tilt the balance in favour of reuse schemes.

xiv
a temporary expedient or long term solution. However, effluent reuse is one amongst a number of options at farm level to minimizing exposure to water risk. Moreover, the creation of expensive distribution and storage facilities, with a high recurrent cost, in order to furnish water for low value farm purposes, is not always warranted – unless there are benefits to other sectors.as an environmental solution to the growing volume of wastewater effluent and its potential for downstream pollution. The Mexico City-Tula case is the clearest example of the mutual benefit for the City and farmers from disposing of urban sewage and effluent to agriculture – and allowing natural processes to carry out some of the purification en route. Reuse schemes allow the dispersion of effluent and its assimilation across a wide area, as compared to the point source pollution from WWTPs. The reuse of effluent nutrients in crop production, rather than their removal and effective destruction during advanced processes of wastewater treatment also has a strong appeal to many Greens. The case studies confirm these environmental benefits of using reclaimed water. as a “win-win” project that is a solution to urban water demand, while also delivering the agricultural and environmental benefits stated above. The Llobregat sites and Durango City are clear-cut examples of potential win-win propositions since in both cases it is physically and geographically feasible for farmers to exchange their current entitlements to freshwater for effluent, and for the cities to gain access to the freshwater rights that are thus “released.”
Whether or not “win-win” outcomes occur depends on legal and other barriers being overcome, as well as successful negotiation over the financial arrangements between the parties to the deal. It must not be assumed that farmers will readily give up their rights to freshwater, without further consideration of their operational situations. Most farmers prefer to have several water sources as insurance against drought. A cost-benefit approach helps to set the parameters for agreements between the main stakeholders, which in this report are assumed to be farmers, cities and the natural environment. It helps to define the interests of the parties in moving towards, or resisting, agreements that change the status quo. Where the balance between costs and benefits for one party (e.g. farmers) is very fine, the existence of a large potential net benefit to another (e.g.city or environment) can provide “headroom” for agreement by indicating the economic or financial bounty available to lubricate the deal.
The overall message the report seeks to convey is that the recycling of urban wastewater is a key link in Integrated Water Resource Management (IWRM) that can fulfill several different, but interrelated objectives. These are expressed as win-win propositions,delivering simultaneous benefits to farmers, cities and natural environmental systems, part of the solutions to the urgent global problems of food, clean water, the safe disposal of wastes and the protection of vital aquatic ecosystems. The traditional “linear society” is not a sustainable solution and the “circular society” has to become the new standard.
The annex to the report contains an extensive bibliography, testimony to the large and growing interest amongst the professional and policy communities in this important topic.

xv
List of Acronyms
ACA Catalonian Water Agency
BAT Best Available Technology
BCR Benefit-Cost Ratio
BOD Biological Oxygen Demand
BOT Build Operate Transfer
CBA Cost-Benefit Analysis
CEA Cost-Effective Analysis
CRF Capital Recovery Factor
DALY Disability Adjusted Life Years
DBOT Design Build Operate Transfer
EA Economic Appraisal
EDR Electrodialysis Reversal
EU European Union
FAO Food and Agriculture Organization of the United Nations
FYRR First Year Rate of Return
HACCP Hazard Analysis and Critical Control Points
IRR Internal Rate of Return
IWRM Integrated Water Resources Management
MCA Multi-Criteria Analysis
NDMA N -nitroso-dimethyamine
NPV Net Present Value
OC Opportunity Cost
PES Payment for Environmental Services
QALY Quality Adjusted Life Years
QMRA Quantitative Microbial Risk Analysis
SEEAW System of Environmental-Economic Accounting for Water
STP Social Time Presence
WFD Water Framework Directive
WHO World Health Organization
WTP Willingness to Pay
WWTP Wastewater Treatment Plant

1
Chapter 1
Introduction to wastewater reuse
1.1 BACKGROUND, CONTEXT AND KEY ISSUESThe reuse of treated wastewater in agriculture is an option that is increasingly being investigated and taken up in regions with water scarcity, growing urban populations and growing demand for irrigation water. Many regions of the world are experiencing growing water stress. This arises from a relentless growth of demand for water in the face of static, or diminishing, supply and periodic droughts. Climate change is adding to these pressures: it is estimated that a global warming of 2 degrees Celsius could lead to a situation where 1 to 2 billion more people may no longer have enough water to meet their consumption, hygiene and food needs.
Water stress is also caused by pollution from the growth of wastewater and run-off from expanding cities, much of it only partially treated, from the release of agricultural fertilizer, and from the contamination of aquifers from various sources. This pollution causes eutrophication of surface water, one result of which is the formation of algal blooms, such water pollution makes scarcity worse by reducing the amount of freshwater that is safe to use by humans. The same factors are causing hypoxia (oxygen depletion) in estuaries and coastal waters, causing harm to fisheries and other aquatic life and negatively impacting ecosystem integrity. This is concern both to the environment and to local economies dependent on tourism and fisheries.
Water scarcity has heavy economic, social and political costs. The drought in Kenya in 1998-2000 is estimated to have reduced GDP by 16% over this period, falling with particular severity on industrial output, hydropower, agriculture and livestock. The cost of mitigating water crises is currently entailing huge sums in regions as diverse as California, Northern China and Australia.
At times of serious scarcity, national authorities are inclined to divert water from farmers to cities since water has a higher economic value in urban and industrial uses than for most agricultural purposes. In these circumstances, the reuse of treated wastewater for agriculture enables freshwater to be exchanged for more economically and socially valuable purposes, whilst providing farmers with reliable and nutrient-rich water. This exchange also has potential environmental benefits, reducing the release of wastewater effluent downstream, and allowing the assimilation of its nutrients into the soil.
Wastewater reuse projects can therefore offer a potential double or even triple “dividend” - to urban users, farmers and the environment. In typical situations of growing water stress the use of reclaimed water must be considered as an available option. In such cases the “without project” scenario will incur costs that will grow over time, and alternative solutions have serious costs of their own. To reject the reuse option could be costly in such situations.
1.2 PURPOSE OF THE REPORTAgriculture accounts for around 70% of global water use, mainly in the growth of crops for food and raw materials and for processing agricultural products. When rainfall is insufficient to sustain crops, irrigation is necessary and adds to the cost of agricultural operations.
The Wealth of Waste: The economics of wastewater use in agriculture2
The lack of natural water resources from aquifers, rivers, and lakes has led to the growing recycling of domestic and municipal wastewater (both treated and untreated) for irrigation. Recycling water1 for this purpose raises issues of water quality, the health of the general public and farm workers, public acceptability, the marketability of crops, and how such projects can be financed, amongst other matters. Some of these issues also arise with the use of freshwater, while others apply with special emphasis, or specifically, to the use of recycled water. There is a large literature on water resource economics, dealing with the role of water in economic development and the evaluation of alternatives to serve various water needs. The development of the agriculture sector has been the most important and initial phase in the economic development and well-being of many countries, and agriculture remains as a key to food security and growth in much of the world.
Although guidance is available on the economics of water resources in agriculture (Gittinger, 1982; Turner et al., 2004), there is an unfulfilled need for guidance on the specific issues arising in the use of recycled water. This report is an attempt to fill this gap. Recycling includes both untreated and treated wastewater. While the economic concepts discussed in this report are applicable to untreated (raw) and treated (reclaimed) wastewater and to many types of reuse, the main focus of this report is on the use of reclaimed water from community sewerage systems for irrigated agriculture.
This report addresses the economic and financial issues and the methodology and procedures involved in the analysis of water recycling projects. The issue is dealt with in the wider context of water resources and covers human health, water quality, acceptability, institutional constraints, and other factors, all of which have economic implications and affect the feasibility of reuse schemes.
The current chapter provides a contextual background. Chapter 2 introduces the case material, drawn from regions of Spain and Mexico. Chapter 3 contains the methodology proposed for the economic analysis of projects, together with the procedure for determining its financial feasibility. Chapter 4 applies this methodology to the analysis of the case studies. Finally, chapter 5 proposes a broader planning framework into which the economic and financial analyses can fit. Chapter 6 draws some conclusions from the report that are relevant to policy makers and professionals working on this topic.
1.3 THE GLOBAL CONTEXTEarth contains an estimated 1 351 million cubic km of water. Only 0.003 percent of this is classified as fresh water resources, that is, water that can be a source for drinking, hygiene, agriculture, and industry. Most fresh water is remote from civilization or too difficult to capture for use. The Food and Agriculture Organization of the United Nations (FAO) estimates that only about 9 000 to 14 000 km3 are economically available for human use each year (FAOWATER, 2008).
The world’s population is growing at a rate of about 1.2 percent per annum and is expected to grow by two billion by 2030. Providing adequate water for all these people will be a major challenge. Water is essential not only for direct human consumption and household purposes, but also for producing the food and manufactured goods necessary for life and improved standards of living. The common needs for water fall into the following categories:
drinking wateragriculture
1 In this report, wastewater treated to a level allowing for its beneficial reuse (normally tertiary) is referred to as reclaimed water. Otherwise, it is referred to as wastewater, which includes both raw sewage and wastewater treated to lesser levels.. Recycled water includes both reclaimed water and wastewater in the above senses. See the Glossary for these and other definitions.

Chapter 1 - Introduction to wastewater reuse 3
personal hygiene and public sanitationdomestic uses (food preparation, cleaning, outdoor uses)commerce and servicesindustryrecreation and tourismcommercial fisheries, and environmental and ecological maintenance, conservation and protection.
Many countries struggle to meet current water needs for basic sustenance and sanitation. The problem is compounded by increasing standards of living which increase the per capita use of water.
Converting from rainfed to irrigated agriculture can increase yields of most crops by 100 to 400 percent and can permit the growth of different crops with higher income value. Humid-climate species can be grown in arid areas. Shifting away from rainfed agriculture often means that water must be available at unnatural times and locations, requiring infrastructure energy and labour. Even relying on groundwater directly beneath farms is becoming a problem as water tables fall. Because irrigation leaves salts behind in the soil, the rate of water application may have to be increased over time to counter salinization, though in many places rainfall can achieve this function. Compared to the daily drinking water requirement of 2 to 4 litres per person, producing a day’s food requirement takes 2 000 to 5 000 litres of water per head. As a result, agriculture is by far the largest user of water, accounting for almost 70 percent of all withdrawals - up to 95 percent in developing countries - and demand is increasing (FAOWATER, 2008).
Improvements in lifestyle and the use of labour-saving devices also demand more water. Some examples are:
community sewerage systems and toilets using water for the conveyance and disposal of human waste;household appliances such as dishwashers and garbage grinders;domestic hot water devices increasing the use of water for bathing;gardening and residential landscaping;leisure activities such as golf courses and aquatic parks;urban greenery for local amenity;increased consumption of manufactured goods;dietary changes involving higher consumption of foodstuffs with greater water requirements and; tourism and recreation increase with incomes, and many of these activities are water-intensive.
Meeting these water demands has often come with great environmental cost. In a well-known example, the Aral Sea has lost 85 percent of its inflow due to irrigated cotton production on its main feeder rivers. The fall in level by 16 metres between 1981 and 1990 has led to the disappearance of 20 of its 24 species of fish, the loss of almost the entire fish catch, and the creation of toxic dust-salt from the dry seabed, killing crops on nearby farmland (FAOWATER, 2008). This tragic episode illustrates the claim of the natural environment as a legitimate user of water.
Scarcity, stress and competitionClimate change is likely to aggravate the scarcity of water that is being driven by other basic forces. On one authoritative view, global warming of 2 º C would lead to a situation where “between 100 million and 400 million more people could be at risk of hunger, and 1 to 2 billion more people may no longer have enough water to meet their consumption, hygiene and food needs” (World Bank, 2009).
The Wealth of Waste: The economics of wastewater use in agriculture4
The heavy economic cost of water scarcity is illustrated by estimates of the impact on Kenya’s GDP of the La Niña drought of 1998-2000. Overall, this reduced GDP by 16% over this period, the reductions falling with particular severity on industrial production (58%), hydropower (26%), agriculture (10%) and livestock output (6%) (World Bank, 2004).
There are many other partial estimations of the high costs of water scarcity (Orr, 2009):
The cost of water crisis management in California is estimated to be US$1.6 billion annually by 2020.The emergency overhaul of Australia’s water supply regime, triggered by the 2007 drought but resulting from a longer period of imbalance between supply and demand, is expected to cost US$ 10 billion.In China the scheme to channel billions of cubic meters of water from the Yangtze River to farmers along the dwindling Yellow River involves massive outlays, not yet fully estimated.Libya’s Man-Made River project to pump 730 million m3 annually from below the Sahara Desert to coastal water users costs US$ 25 billion each year.
The natural environment, a silent water stakeholder, is bearing much of the water stress, which will rebound at some stage on the supply of water for human needs. In the Australian Murray-Darling basin, 30% of the normal river flow is needed for environmental purposes, yet irrigated farming takes 80% of the available water. Recently, practically no water from the Murray-Darling River has reached the sea. In China 25% of the flow of the Yellow River is needed to maintain the environment, yet less than 10% is actually available after human withdrawal. In 1997 the River was dry up to 600 km inland for 226 days (World Economic Forum, 2009).
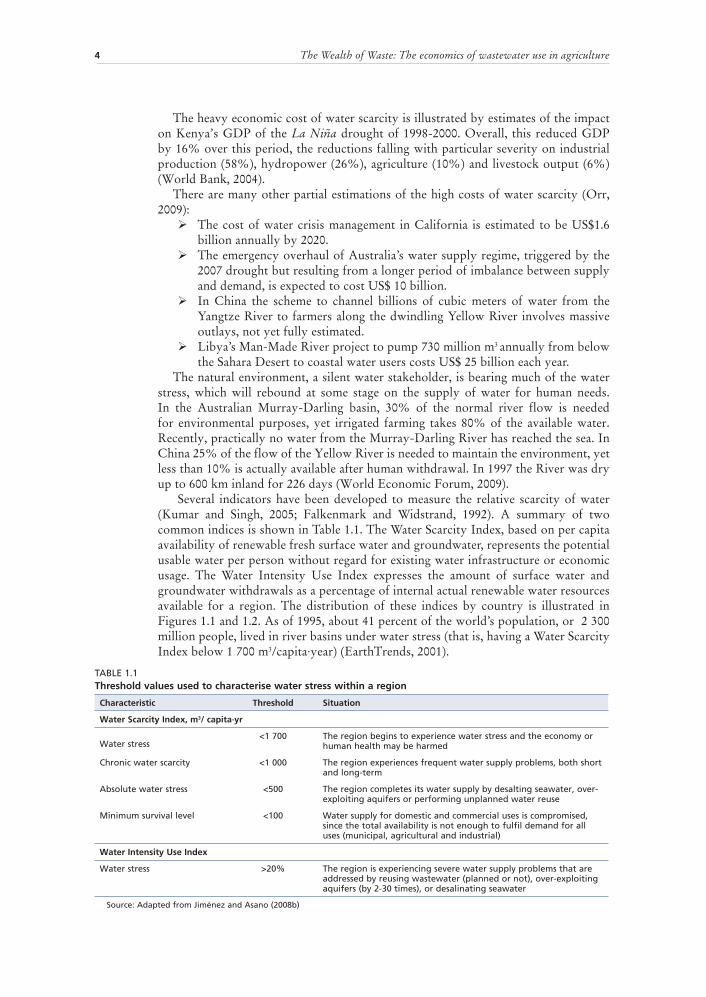
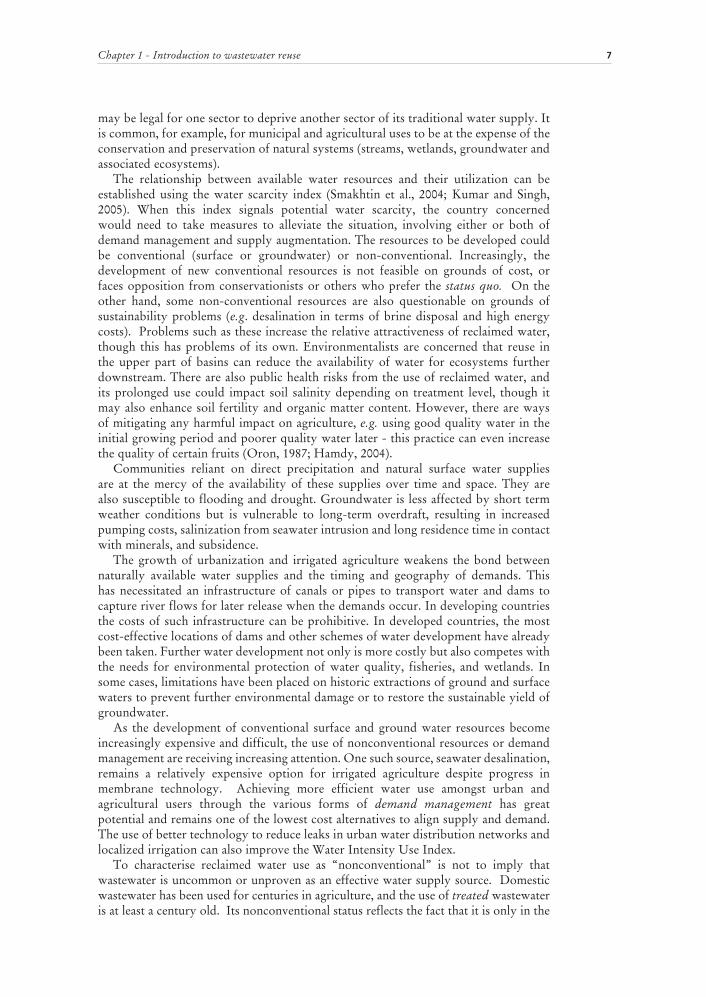
Several indicators have been developed to measure the relative scarcity of water (Kumar and Singh, 2005; Falkenmark and Widstrand, 1992). A summary of two common indices is shown in Table 1.1. The Water Scarcity Index, based on per capita availability of renewable fresh surface water and groundwater, represents the potential usable water per person without regard for existing water infrastructure or economic usage. The Water Intensity Use Index expresses the amount of surface water and groundwater withdrawals as a percentage of internal actual renewable water resources available for a region. The distribution of these indices by country is illustrated in Figures 1.1 and 1.2. As of 1995, about 41 percent of the world’s population, or 2 300 million people, lived in river basins under water stress (that is, having a Water Scarcity Index below 1 700 m3/capita∙year) (EarthTrends, 2001).
TABLE 1.1Threshold values used to characterise water stress within a region
Characteristic Threshold Situation
Water Scarcity Index, m3/ capita∙yr
Water stress<1 700 The region begins to experience water stress and the economy or
human health may be harmed
Chronic water scarcity <1 000 The region experiences frequent water supply problems, both short and long-term
Absolute water stress <500 The region completes its water supply by desalting seawater, over-exploiting aquifers or performing unplanned water reuse
Minimum survival level <100 Water supply for domestic and commercial uses is compromised, since the total availability is not enough to fulfil demand for all uses (municipal, agricultural and industrial)
Water Intensity Use Index
Water stress >20% The region is experiencing severe water supply problems that are addressed by reusing wastewater (planned or not), over-exploiting aquifers (by 2-30 times), or desalinating seawater
Source: Adapted from Jiménez and Asano (2008b)
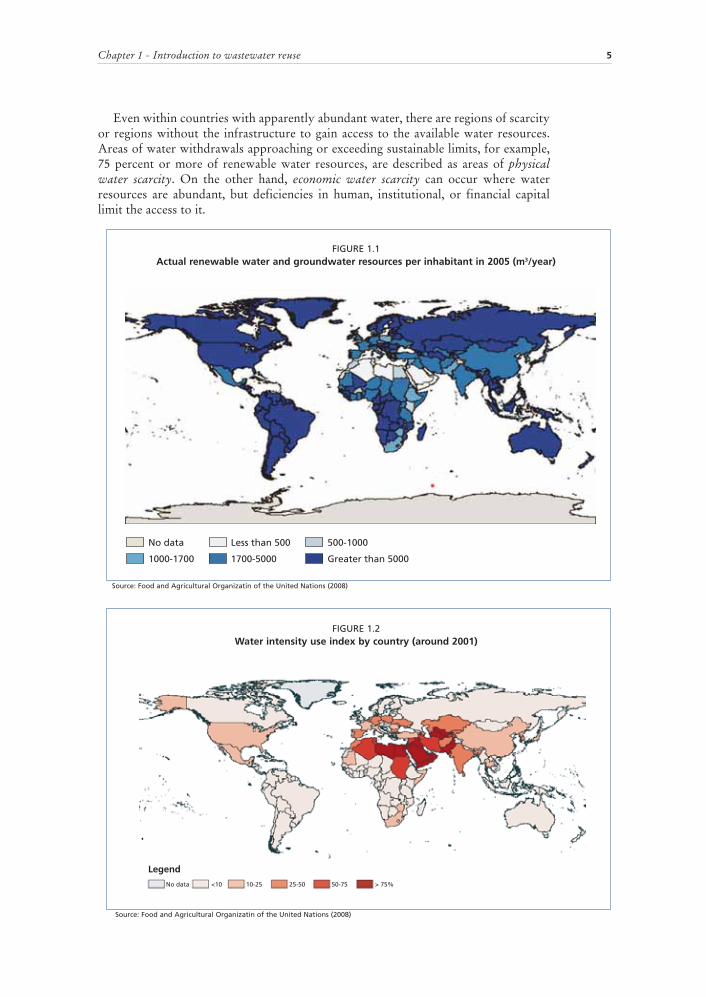
Chapter 1 - Introduction to wastewater reuse 5
Even within countries with apparently abundant water, there are regions of scarcity or regions without the infrastructure to gain access to the available water resources. Areas of water withdrawals approaching or exceeding sustainable limits, for example, 75 percent or more of renewable water resources, are described as areas of physicalwater scarcity. On the other hand, economic water scarcity can occur where water resources are abundant, but deficiencies in human, institutional, or financial capital limit the access to it.
FIGURE 1.1 Actual renewable water and groundwater resources per inhabitant in 2005 (m3/year)
Source: Food and Agricultural Organizatin of the United Nations (2008)
FIGURE 1.2 Water intensity use index by country (around 2001)
Source: Food and Agricultural Organizatin of the United Nations (2008)

The Wealth of Waste: The economics of wastewater use in agriculture6
As water demands approach the limits of available resources, or the capacity of existing systems for water supply, competition between water sectors can arise. Urban areas with a sizeable industrial base often have greater economic capacity or political power to fund the infrastructure to develop new water supplies or reallocate existing supplies from agricultural to urban areas. In the competition for water, human needs often prevail over aquatic needs to sustain ecosystems and fisheries. Some of the factors or impacts related to water use sectors are summarised in Table 1.2.
Competition for water resources is often at the expense of agriculture and the traditional economies dependent on it. Water traditionally has been considered a common public good. Without government controls however, this public good can be abused and access to water lost to sectors with political and economic power. Upstream users can both diminish and pollute the water reaching downstream users.
In addition to social inequities, civil and even physical conflict can result from the competition for water. Where there is no established legal framework, or where this is violated, conflicts can result within regions or even between nations when one entity extracts water to the detriment of another (Trondalen, 2004; McCann, 2005; Tamas, 2003). Some legal systems establish priorities in the rights to use water, often giving domestic and urban use a higher priority than industrial or agricultural use. Thus, it
TABLE 1.2Competition for conventional water resources in agricultural areas
Location User sector Potential competitive factors and impacts
Areas with aridor semiarid climate conditions
Agriculture Optimal temperatures for crops but irrigation necessary to sustain agriculture; over-extraction or illegal extraction of water, especially for high-revenue agriculture
Industry Economic advantage over agriculture to purchase needed water, may pollute water resources
Urban/domestic Bad water quality and scarcity of water, especially in the lowest part of basins
Industrial areas Agriculture Tends to be marginal because industrial jobs are better paid and agriculture is often a secondary occupation, though with exceptions, such as where the agrofood industry is important
Industry Has economic or political priority in obtaining water it needs
Urban/domestic Usually in exponential growth as jobs congregate around industry; has economic or political leverage in getting water, increased pressure on existing water resources
Coastline Agriculture in hot climates
Vulnerable, unless protected; uncompetitive for jobs and water
Leisure activities/tourism in hot climates
Increasing uses of water for people and activities (e.g., golf or water parks)
Industry Growth in areas of good transportation infrastructure (harbours, motorways, railways)
Small islands in arid and semiarid climates (e.g., Mediterranean)
Agriculture Uncompetitive against tourism for jobs or water
Leisure activities/tourism High revenue activity, economically dominant for jobs, water and land
River basins Ecosystems Damaged without regulatory protection due to reduced flows from human activities
Urban Economic and political advantage to obtain needed water (even overexploiting water in a non-sustainable way)
Agriculture/livestock Source of water pollution
Industry Water demands are usually not consumptive, temperature pollution from discharges by power generation facilities; source of persistent organic chemicals
Groundwater dominant regions
All sectors Frequently groundwater overdraft, seawater intrusion and contamination
Agriculture Soil permeability reduced
Urban Reduced natural recharge due to impermeable surfacesSource: Author's compilation
Chapter 1 - Introduction to wastewater reuse 7
may be legal for one sector to deprive another sector of its traditional water supply. It is common, for example, for municipal and agricultural uses to be at the expense of the conservation and preservation of natural systems (streams, wetlands, groundwater and associated ecosystems).
The relationship between available water resources and their utilization can be established using the water scarcity index (Smakhtin et al., 2004; Kumar and Singh, 2005). When this index signals potential water scarcity, the country concerned would need to take measures to alleviate the situation, involving either or both of demand management and supply augmentation. The resources to be developed could be conventional (surface or groundwater) or non-conventional. Increasingly, the development of new conventional resources is not feasible on grounds of cost, or faces opposition from conservationists or others who prefer the status quo. On the other hand, some non-conventional resources are also questionable on grounds of sustainability problems (e.g. desalination in terms of brine disposal and high energy costs). Problems such as these increase the relative attractiveness of reclaimed water, though this has problems of its own. Environmentalists are concerned that reuse in the upper part of basins can reduce the availability of water for ecosystems further downstream. There are also public health risks from the use of reclaimed water, and its prolonged use could impact soil salinity depending on treatment level, though it may also enhance soil fertility and organic matter content. However, there are ways of mitigating any harmful impact on agriculture, e.g. using good quality water in the initial growing period and poorer quality water later - this practice can even increase the quality of certain fruits (Oron, 1987; Hamdy, 2004).
Communities reliant on direct precipitation and natural surface water supplies are at the mercy of the availability of these supplies over time and space. They are also susceptible to flooding and drought. Groundwater is less affected by short term weather conditions but is vulnerable to long-term overdraft, resulting in increased pumping costs, salinization from seawater intrusion and long residence time in contact with minerals, and subsidence.
The growth of urbanization and irrigated agriculture weakens the bond between naturally available water supplies and the timing and geography of demands. This has necessitated an infrastructure of canals or pipes to transport water and dams to capture river flows for later release when the demands occur. In developing countries the costs of such infrastructure can be prohibitive. In developed countries, the most cost-effective locations of dams and other schemes of water development have already been taken. Further water development not only is more costly but also competes with the needs for environmental protection of water quality, fisheries, and wetlands. In some cases, limitations have been placed on historic extractions of ground and surface waters to prevent further environmental damage or to restore the sustainable yield of groundwater.
As the development of conventional surface and ground water resources become increasingly expensive and difficult, the use of nonconventional resources or demand management are receiving increasing attention. One such source, seawater desalination, remains a relatively expensive option for irrigated agriculture despite progress in membrane technology. Achieving more efficient water use amongst urban and agricultural users through the various forms of demand management has great potential and remains one of the lowest cost alternatives to align supply and demand. The use of better technology to reduce leaks in urban water distribution networks and localized irrigation can also improve the Water Intensity Use Index.
To characterise reclaimed water use as “nonconventional” is not to imply that wastewater is uncommon or unproven as an effective water supply source. Domestic wastewater has been used for centuries in agriculture, and the use of treated wastewater is at least a century old. Its nonconventional status reflects the fact that it is only in the

The Wealth of Waste: The economics of wastewater use in agriculture8
last 30 years that the use of reclaimed water has become prominent in water resources planning. With adequate treatment, wastewater is suitable for many urban, industrial and agricultural uses. Though still not approved in many countries, reclaimed water is used for drinking in some locations, such as Namibia (Lahnsteiner and Lempert, 2007).
1.4 THE CASE FOR REUSING WASTEWATERReusing wastewater is an important option for Integrated Water Resources Management (IWRM) which is concerned with managing all aspects of the water cycle, and with optimizing the use of water in all its aspects. The World Summit on Sustainable Development in 2002 called for all countries to develop IWRM and water efficiency plans. This approach includes the following elements, amongst others:
assessment of water needs in collaboration with end users;examination of all the water sources available; andmatching water supplies to needs based on the quantity, quality and reliability required for the various purposes and the costs of supply relative to the benefits in each case.
The reclamation of wastewater and its reuse in agriculture is gaining wider acceptance in many parts of the world. In many water-scarce countries, wastewater has become important in bridging the demand and supply of water in different uses. The drivers of wastewater reuse are somewhat different in developed and developing countries, but there are common problems of increasing population and food demand, water shortages, and concern about environmental pollution. All these forces make reclaimed water a potentially valuable resource.
Water reuse does, however, entail changes in the traditional frameworks for water allocation, funding structures, fixing of water-quality standards, regulatory frameworks, and institutional mandates. It involves good governance at all levels in order to develop a holistic approach and sets of consistent policies for water allocation meeting multiple user needs.
Economic values of water in different usesFundamental to reuse is the insight that water is an economic good, as recognised in the Dublin Statement on Water and Sustainable Development of 1992: “Water has an economic value in all its competing uses and should be recognised as an economic good.” A distinction needs to be made between the value, cost and price of water, which are often very different from each other. The economic value of water is particularly apparent in situations of water scarcity. Water has different economic values in its different uses. It has an economic cost of supply, which also varies in different situations and for different purposes. Water provided to a particular user, in a specific place, at a certain time has an economic benefit, but also entails an economic cost. The relationship between the specific benefit and the specific cost is the basis of the economic justification for supplying that user. Finally, the price of water is a financial or fiscal transaction between the provider and the user, which is often closely controlled by public authorities, and often bears little relation either to its value in specific uses, nor its cost of supply.
Allocating water purely on the basis of such economic principles is complicated, and difficult to apply in practice (Turner, 2004; Winpenny, 1997). However, the basic concept of comparing the costs and benefits of supplying water in specific locations and to specific categories of users is fundamental to wastewater reuse projects, and this requires some estimation – however rough – of the benefits of the water to the potential users.
The methods of valuing water are eclectic, and depend on the sector concerned, the type of use, and the information available.

Chapter 1 - Introduction to wastewater reuse 9
Household consumption is commonly valued using Willingness To Pay (WTP) evidence from direct surveys using structured questionnaires or various kinds of “choice experiments”. This “stated value” approach can be supplemented and cross-checked by “revealed preference” evidence, such as inferring users’ preferences from their changes in consumption following a tariff change or by estimating what they are actually spending at present. Irrigation water use can be valued in either of two different ways. The marginal productivity of water (the extra value of output that can be obtained from additional applications of water) can be estimated from changes in yields during crop-water trials. Alternatively, the more common approach (the “net-back” method) is to derive the value of water as the residual from farm budget data, after all other costs have been allowed for. This latter method makes the crude assumption that all the residual, or unexplained, farm surplus is due to water, rather than to other factors.Industrial water use valuation poses a greater problem. For most industrial (and commercial) enterprises, water is a tiny part of their total costs. It would therefore be misleading to use the “residual method” as in irrigation, and attribute the whole residual surplus to water. Much industrial bulk water is self-supplied from wells and rivers. Many firms recycle water by treating and reusing waste flows. One valuation device is to regard the cost of recycling as the upper limit on industrial willingness-to-pay, since above this level firms would rationally recycle rather than buy in. A crude short-cut to industrial water valuation is to estimate ratios of gross output or value-added to the volume of water involved in different processes. Whilst these ratios can signal the water-intensity of different industrial sectors, they do not indicate the real productivity of water.
The above uses all involve the abstraction of water. Water also has in-stream values for waste assimilation and dilution, flushing sediment, the functioning of ecological systems, navigation, and various kinds of recreation (fishing, water sports, sight-seeing, rambling, etc.). There are various valuation options. Often, these natural functions of water (assimilation, dilution, flushing) can be compared with the extra cost of alternatives (dredging, treatment). The value of water for navigation can be imputed from its cost advantage over the next cheapest transport mode (e.g. railways). The value of water for recreation and ecological purposes (the maintenance of low flow regimes and wetlands) is generally estimated by WTP or travel cost2 surveys. It is increasingly common to use the benefit transfer approach to derive empirical values for these environmental effects – as the term suggests, evidence is transferred from situations where it is available to locations and projects which seem to be broadly comparable3.Hydropower water usage is normally valued according to the cost advantage of hydro over thermal and other alternative ways of generating electricity. In this, as in other cases, it is important to compare like with like, and to be clear about the basis of the estimate4.
2 The travel cost valuation method infers the valuation that visitors place on a free amenity from the amount of time and expense they incur in getting to the site.
3 A database exists of such studies (www.evri.ca), and a number of results are reviewed in van Beukering et al. (1998) and Turner et al. 2004.
4 If a short term approach is taken, capacity is assumed to be fixed for both alternatives to be compared. In the long term, new investment can be made in either. Marginal and average costs will also differ, for both alternatives.

The Wealth of Waste: The economics of wastewater use in agriculture10
There have been several comprehensive studies of the economic values of water in different uses, and a number of more selective exercises. One of the earliest was done for the US National Water Commission in 1972, a subsequent one in 1986 at Resources for the Future, and another, also for the Resources for the Future , in 1997. These all use data from the USA, but more selective studies from other regions broadly endorse their results. Table 1.3 indicates the results of a comparative study.
The sectors of most concern for the current report are agriculture, households, irrigation and the various facets of the environment. The evidence presented here is that the value of water for agricultural irrigation of many low-value crops (typically food grains and animal fodder) is very low. By the same token, water values can be high for high-value crops (e.g. fruit, vegetables, flowers) where the water is reliable, likewise for supplementary irrigation taken as insurance against drought. These results are supported by the actual prices paid for water where water markets exist. In short, the value attached to irrigation water depends heavily on how reliable it is and on the type of crop being produced. Values tend to be higher for privately-owned groundwater than for publicly supplied surface water schemes.
Household values are relatively high, but this is not a homogeneous category. Water used for truly essential needs such as drinking, cooking and basic hygiene is only a minor part of typical daily use, the rest being used for “lifestyle” or productive purposes. In affluent regions with a warm climate a high proportion of water is used for outdoor purposes such as garden watering and swimming pools. Households tend to place a higher value on indoor than outdoor uses, though this would not apply where water is used for productive purposes. In some societies, much of the water provided for households is used for growing crops and feeding livestock (in other words, it is supplied for multiple use purposes).
In practice the valuation of water for household use is commonly taken to be equivalent to the average tariff, which usually underestimates its economic cost of supply, and ignores the consumer surplus5 involved. This is typically the approach used in the case studies presented in this report.
The value of water in its environmental uses is not adequately represented in the studies described above – which relate mainly to use values, particularly recreation.In fact, recreational values show great variation, depending on the visitation rate, location of the site, quality of water, and type of recreation (with fishing and shooting
5 The difference between what consumers would be willing-to-pay, and what they actually have to pay.
TABLE 1.3Values of water use in the USA, by sector
1994 US$ acre/foot of water
Sector/Use Average Minimum Maximum
In situ
Waste disposal 3 0 12
Recreational/habitat 48 0 2 642
Navigation 146 0 483
Hydropower 25 1 113
Withdrawal
Irrigation 75 0 1 228
Industrial 282 28 802
Thermal power 34 9 63
Domestic 194 37 573
Source: quoted in Turner et. al. 2004
Chapter 1 - Introduction to wastewater reuse 11
licences attracting high fees in some countries). The various methods of valuing the non-use environmental benefits of water are described in Chapter 36. In some cases the environmental value of water is expressed through cities and regions purchasing the rights to water sufficient to meet their environmental needs.
The above discussion of economic values has been in the context of sectors, projects or specific uses. However, exercises are also underway to estimate the value of water at a macroeconomic level. One such is the System of Environmental-Economic Accounting for Water (SEEAW) being developed by the UN Statistics Division (UN, 2008).
SEEAW provides a conceptual framework for organising hydrological and economic information in a coherent and consistent manner. It is an elaboration of the handbook Integrated Environmental and Economic Accounting 2003 of the United Nations, which describes the interaction between the economy and the environment. Both this document and the SEEAW use the basic framework of the 1993 System of National Accounts, which is the international standard. When fully developed, SEEAW would permit a consistent analysis of the contribution of water to the economy and the impact of the economy on water resources. Because it covers all important environmental-economic interactions, it is ideal for capturing cross-sectional issues such as IWRM as well as a range of other relevant features
The contribution of natural resources such as cropland, forests, pastureland and minerals to economic output is already reflected in national accounts, and estimates have been made of the value of such assets as natural capital7. These assets yield a future stream of income/benefits and constitute an important form of wealth for well-endowed countries. Conversely, where they are depleted (through exploitation, deforestation, overgrazing causing desertification, etc.) this represents a loss of capital and wealth, which will reduce future income from these sources. Water is part of natural capital: used sustainably (up to its renewable limit) it provides a recurring bounty to national income, but if its aquifers or surface storage is over-exploited, or if its reserves are contaminated, this is tantamount to capital depletion which will reduce future national income.
1.5 WASTEWATER REUSE IN PRACTICEThe global extent of wastewater reuseCurrently, there are over 3 300 water reclamation facilities worldwide with varying degrees of treatment and for various applications: agricultural irrigation, urban landscaping and recreational uses, industrial cooling and processing, and indirectpotable water production such as groundwater recharge (Aquarec, 2006). Most of these were in Japan (over 1 800) and the USA (over 800), but Australia and the EU had 450 and 230 projects, respectively. The Mediterranean and Middle East had around 100 sites, Latin America 50 and Sub-Saharan Africa 20. These numbers are growing rapidly8.
Figure 1.3 shows the number of municipal water reuse schemes across different regions of the world according to field of reuse application. Applications are arranged in four main categories: agriculture, urban, industrial and mixed (multipurpose).
It is estimated that, within the next 50 years, more than 40% of the world’s population will live in countries facing water stress or water scarcity. Growing competition between the agricultural and urban uses of high-quality freshwater supplies, particularly in arid, semi-arid and densely populated regions, will increase the
6 And more fully in Turner (2004).7 This particular exercise from the World Bank did not include water as one of the types of natural
capital.8 The monthly journal Global Water Intelligence contains a regular Reuse Tracker with data on all new
reuse projects.

The Wealth of Waste: The economics of wastewater use in agriculture12
BOX 1.1
Integrated wastewater treatment and reuse in Tunisia
Tunisia has a high coverage of sanitation, with 96% in urban areas, 65% in rural areas and 87% overall. Industries also have to comply with national standards for the discharge of wastewater into sewers, and are given subsidies for pre-treatment processes. 78% of wastewater collected is treated, mainly to secondary biological standards.
30-43% of treated wastewater is used for agricultural and landscape irrigation. Reclaimed water is used on 8 100 ha to irrigate industrial and fodder crops, cereals, vineyards, citrus and other fruit trees. Regulations allow the use of secondary-treated effluent on all crops except vegetables, whether eaten raw or cooked. Golf courses are also irrigated with treated effluent.
Tunisia launched its national water reuse programme in the 1980s. Treatment and reuse needs are combined and considered at the planning stage. Some pilot projects have been launched or are under study for industrial use and groundwater recharge, irrigation of forests and highways and wetlands development. The annual volume of reclaimed water is expected to reach 290 Mm3 in 2020, when it will be equivalent to 18% of groundwater resources and could be used to counter seawater intrusion in coastal aquifers.
Source: Bahri (2009) p. 26
FIGURE 1.3 Municipal water reuse schemes, by field of application (AQUAREC, 2006)

Chapter 1 - Introduction to wastewater reuse 13
pressure on this ever scarcer resource. Wastewater may be a more reliable year-round source of water than other sources available to farmers, though this is dependent on the primary sources of urban water also being reliable. The value of recycled water has long been recognized by farmers not only as a water resource, but also for the nutrients it contains for plant growth and soil conditioning properties. Currently, the total land irrigated with raw or partially diluted wastewater is estimated at 20 million hectares in fifty countries, which is approximately 10% of total irrigated land (FAO Wastewater Database). Recycling and reuse of wastewater can relieve pressure on water resources due to abstraction from surface water or aquifers, provided that its impact on downstream flows is manageable (Box 1.1).
In Europe, most of the reuse schemes are located in the coastal areas and islands of the semi-arid Mediterranean regions and in highly urbanized areas. Water scarcity is a common constraint in the Mediterranean region with varying precipitation, sometimes below 300 mm to 500 mm per year in southern parts of Spain, Italy, Greece, Malta and Israel. At times, water resources may fall below the chronic water scarcity level of 1 000 m3 per inhabitant per year. Long distances between water sources and users also create serious regional and local water shortages, and water scarcity may worsen with the influx of peak summer tourists to the Mediterranean coasts and demographic growth, as well as drought and potential climate change-related impacts.
A limited number of European countries have guidelines or regulations on wastewater reclamation and reuse. Article 12 of the European Wastewater Directive 91/271/CEE states: “treated wastewater shall be reused whenever appropriate.” The term ‘appropriate’ still lacks legal definition, and the EU countries themselves have to develop their own national regulations. Nevertheless, water reuse is an option for implementation in the European Water Framework Directive (WFD) that emphasizes
BOX 1.2
Potential impact of EU Water Framework Directive on wastewater reuse
* Requirement for municipal water conservation plans, emphasizing reuse.* Pressure for development of financial incentives for local governments, developers, and property
owners to adopt water conservation and reuse measures and implement public education programs. Incentives can include tax incentives, tax credits, grants and low interest loans. If there is an absence of subsidies, incentives to improve environmental performance by forcing users to innovate or reduce water use might be considered.
* Requirement that, by 2010 water pricing policies be introduced that provide incentives to efficient water uses, aiming to achieve a good ecological status of the water bodies.
* As part of river basin development plans, need to identify the least expensive water supply alternatives that provide the highest level of water sustainability at the river catchment level.
* In pricing conventional and alternative water supplies, need to ensure that the user bears the costs of providing and using water, reflecting its true costs. This implies a stricter application of two major principles: the polluter-pays principle and the full cost-recovery principle, which means that: “the recovery of the costs of water services including environmental and resource costs associated with damage or negative impact on the environment should be taken into account” when applying the polluter pays principle. This implies that tariffs related to conventional and alternative water sources will have to be reviewed and adjusted. The financial, social and environmental burdens of effluent disposal to the environment should be considered in the economic analysis; thus the true value of reclaimed water would be reflected net of externalities.
Source: Aquarec (2006)

The Wealth of Waste: The economics of wastewater use in agriculture14
the need to integrate health, environmental standards, service provision and financial regulation for the water cycle, in order to achieve overall efficiency and protection of the water cycle (Okun, 2002). The WFD encourages the integration of water reuse options in an integrated water supply and disposal system, in various ways (Box 1.2).
Reclaimed water for agricultural useThere is evidence of the reuse of wastewater in agriculture since ancient Greek and Roman civilisations (Angelakis and Durham, 2008). Because agriculture uses nearly 70 percent of water withdrawals, it is to be expected that in times and regions of water scarcity farmers would turn to domestic or urban wastewater as a water source. While recycled water is a relatively small component of water supply overall, in some countries it has a prominent role, especially for agriculture - as in Kuwait where reused water accounts for up to 35 percent of total water extraction. In agriculture, the UN has estimated that at least 20 million ha in 50 countries are irrigated with raw or partially diluted wastewater, around 10 percent of total irrigated land. About 525 000 ha are irrigated with reclaimed water. Despite progress in the control of water pollution from municipal wastewater, irrigation with untreated wastewater still prevails (Jiménez and Asano, 2008a; Jiménez and Asano, 2008b; Lazarova and Bahri, 2008; Bahri, 2009).
Agriculture is the predominant user of reclaimed water, as it is of freshwater. The use of reclaimed water for agricultural irrigation has been reported in at least 44 countries with a total use of over 15 Mm3/d (Jiménez and Asano, 2008b). The wide array of crops grown with untreated and treated wastewater is shown in Table 1.4 (this table is not comprehensive, but it illustrates the most common crops). Many more varieties of crops could be grown with reclaimed water under appropriate conditions (Asano et al., 2007; Lazarova and Bahri, 2005; Mujeriego, 1990; Pescod, 1992; Pettygrove and Asano, 1985).
1.6 PUBLIC HEALTH CONCERNS & GUIDELINESConcern about the risks to public health from the greater use of recycled water is a serious obstacle to the greater spread of this practice.
Many countries base their rules and regulations on this matter on a combination of the California guidelines - the first publications on this topic – and WHO recommendations. For many years, the California standards were the only legally valid reference for reclamation and reuse with the goal of zero risk and with expensive compliance requirements. For example, they stipulate that unrestricted reuse of wastewater requires, after secondary treatment, additionally advanced treatment with a coagulation/filtration step followed by chlorination/de-chlorination to strive for a 0 Fecal Coliform/100 mL limit (Aquarec, 2006) to produce an effluent that is virtually pathogen-free. This technology, referred to as the Title 22 benchmark, is considered
TABLE 1.4Agricultural crops grown with untreated and treated municipal wastewater
Types Examples of crops
Field crops Barley, corn (maize, Zea mays), oats, wheat
Fibre and seed crops Cotton, flower and vegetable seeds
Vegetable crops that can be consumed raw Broccoli, cabbage, cauliflower, celery, chilli pepper, green tomato (tomatillo), lettuce, pepper, tomato
Vegetable crops that will be processed before consumption Artichoke, asparagus, beans, onion, peanut, potato, spinach, squash, sugar beet, sunflower
Fodder and forage crops Alfalfa, barley, clover, cowpea, hay, maize, pasture
Orchards and vineyards Fruit trees, apple, avocado, citrus, lemon, peach, pistachio, plum, olive, date palms, grapevines
Nurseries Flowers
Commercial woodlands Conifers, eucalyptus, poplar, other treesSources: Asano et al. (2007), Jiménez and Asano (2008), Lazarova and Bahri (2005), Pescod (1992), California State WaterResources Control Board (1990).

Chapter 1 - Introduction to wastewater reuse 15
the yardstick for unrestricted irrigation, against which all other systems are evaluated because of its long history of successful practice. In Europe, more than half of the tertiary treatment technology is derived from this concept even though full Title 22 treatment is applied only in a few instances (Koo-Oshima, 2009).
In 2006 WHO guidelines for safe use of wastewater apply risk management approaches under the Stockholm Framework and recommend defining realistic health-based targets and assessing and managing risks. The guidelines refer to the level of wastewater treatment, crop restriction, wastewater application methods and human exposure control. The health based targets used by WHO apply a reference level of acceptable risk [e.g. 10-6 Disability Adjusted Life Years (DALYs)]. The DALY is a quantitative indicator of ‘burden of disease’ that reflects the total amount of healthy life lost; that is, the quality of life reduced due to a disability, or the lifetime lost due to premature mortality. Depending on circumstances, various health protection measures - barriers - are possible, including waste treatment, crop restriction, adaptation of irrigation technique and application time, and control of human exposure.
Partial treatment to a less demanding standard may be sufficient if combined with other risk reduction measures to achieve the ≤10-6 risk (or 1 in 100 000). Figure 1.4 shows the options for risk reduction from pathogens (i.e., viruses, bacteria, protozoa, helminths) in recycled water used for irrigation (WHO, 2006). A major observed risk is from helminths in developing countries where sewage is used with no or minimal treatment. Epidemiological studies from Mexico have reported that children of farmers who live near fields irrigated with untreated wastewater have a higher prevalence of round worm infections than the general population (Peasey et al., 2000). In these studies, infection rates are inversely correlated with the level of sewage treatment.
FIGURE 1. 4 Options for the reduction of viral, bacterial and protozoan pathogens by different combinations of
health protection measures that achieve the health-based target of ≤10−6 DALYs per person per year. (WHO, 2006)

The Wealth of Waste: The economics of wastewater use in agriculture16
TABLE 1.5Water quality categories for different final uses of reclaimed wastewater defined by the Aquarec project (Salgot et al., 2006)
Microbialcategory
Chemicalcategory
Specific final use
I 1 Residential uses (gardening, toilet flushing, home air conditioning systems, car washing)
-1 Aquifer recharge by direct injection
II 1 Bathing water
III 1
Urban uses and facilities: irrigation of open access landscape areas (parks, golf courses, sport fields ...); street cleaning, fire-fighting , ornamental impoundments and decorative fountain; greenhouse crops irrigation-Irrigation of raw-consumed food crops. Fruit trees sprinkler irrigated: unrestricted irrigation.
IV
1Irrigation of pasture for milking or meat animals: Irrigation of industrial crops for canning industry and crops not raw-consumed. Irrigation of fruit trees except by sprinkling; irrigation of industrial crops, nurseries, folder, cereals and oleaginous seeds.
2 Impoundments, water bodies and streams for recreational use in which the public's contact with the water is permitted (except bathing)
V
1 Irrigation of forested areas, landscape areas and restricted access areas; forestry
2 Impoundments, water bodies and streams for recreational use in which the public' contact with the water is permitted (except bathing)
3 Aquifer recharge by localised percolation through the soil
VI 2 Surface water quality, impoundments, water bodies and streams for recreational use, in which the public's contact with the water is not permitted
VII 4 Industrial cooling except for the food industry
Source: Direct aquifer recharge should be drinking water quality, potable water should not be produced from reclaimed wateswater without advanced tertiary treatment like reverse osmosis or percolation through the soil (i.e. indirect aquifer recharge).
Instead of focusing only on the quality of wastewater at its point of use, the WHO-FAO guidelines recommend defining realistic health-based targets and assessing and managing risks along the continuum – from wastewater generation to consumption of produce cultivated with wastewater – to achieve these targets. This allows a regulatory and monitoring system in line with the socio-economic realities of the country or locality.
For the EU, the Aquarec project proposes seven quality categories for different types of reuses (Table 1.5) with microbial and chemical limits for each category (Salgot et al., 2006).
In addition to microbial contaminants in wastewater, chemical contaminants can also be expected from: inorganic salts, nutrients, heavy metals in organic matter, detergents, trace pollutants, pesticides, chlorination by-products such as N-nitroso-dimethyamine (NDMA), chloroform, and endocrine disrupting chemicals and pharmaceuticals. Highly saline irrigation water can severely degrade soils as well as high boron concentrations (>0.4 mg/L) with toxic effects on plants.
Health protection measures A variety of health protection measures can be used to reduce health risks to consumers, workers and their families and local communities, some of which have already been mentioned. Hazards associated with the consumption of wastewater-irrigated products include excreta-related pathogens and some toxic chemicals. The risk from infectious pathogens is significantly reduced if foods are eaten after thorough cooking. Cooking has little or no impact on the concentrations of toxic chemicals that might be present. The following health protection measures (barriers) have an impact on product consumers:
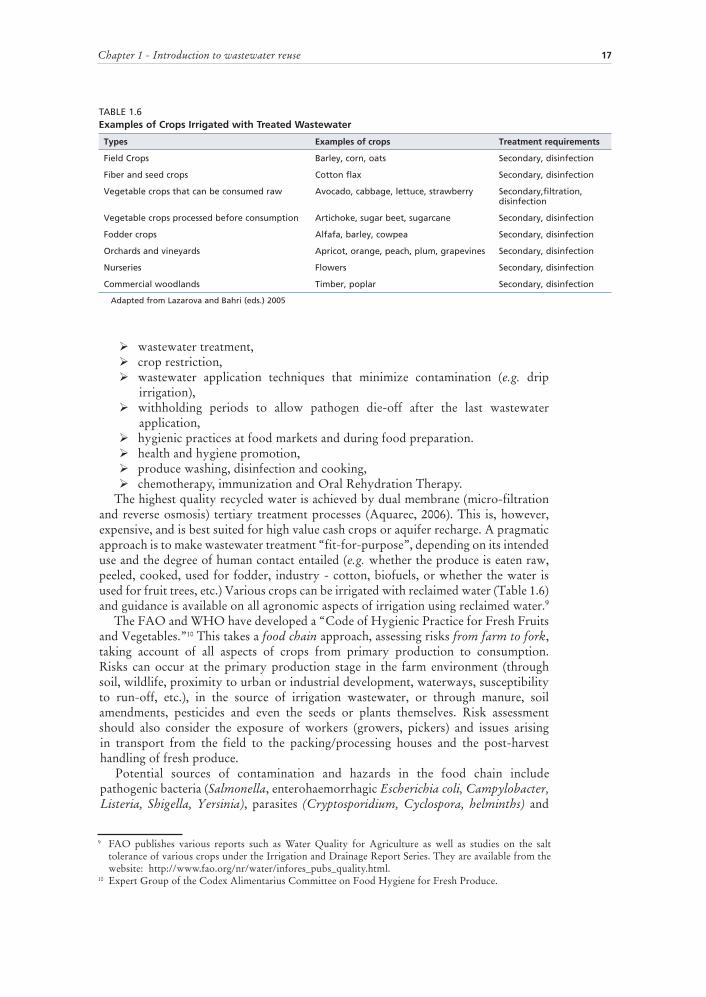
Chapter 1 - Introduction to wastewater reuse 17
TABLE 1.6Examples of Crops Irrigated with Treated Wastewater
Types Examples of crops Treatment requirements
Field Crops Barley, corn, oats Secondary, disinfection
Fiber and seed crops Cotton flax Secondary, disinfection
Vegetable crops that can be consumed raw Avocado, cabbage, lettuce, strawberry Secondary,filtration,disinfection
Vegetable crops processed before consumption Artichoke, sugar beet, sugarcane Secondary, disinfection
Fodder crops Alfafa, barley, cowpea Secondary, disinfection
Orchards and vineyards Apricot, orange, peach, plum, grapevines Secondary, disinfection
Nurseries Flowers Secondary, disinfection
Commercial woodlands Timber, poplar Secondary, disinfection
Adapted from Lazarova and Bahri (eds.) 2005
wastewater treatment,crop restriction,wastewater application techniques that minimize contamination (e.g. drip irrigation),withholding periods to allow pathogen die-off after the last wastewater application,hygienic practices at food markets and during food preparation. health and hygiene promotion, produce washing, disinfection and cooking,chemotherapy, immunization and Oral Rehydration Therapy.
The highest quality recycled water is achieved by dual membrane (micro-filtration and reverse osmosis) tertiary treatment processes (Aquarec, 2006). This is, however, expensive, and is best suited for high value cash crops or aquifer recharge. A pragmatic approach is to make wastewater treatment “fit-for-purpose”, depending on its intended use and the degree of human contact entailed (e.g. whether the produce is eaten raw, peeled, cooked, used for fodder, industry - cotton, biofuels, or whether the water is used for fruit trees, etc.) Various crops can be irrigated with reclaimed water (Table 1.6) and guidance is available on all agronomic aspects of irrigation using reclaimed water.9
The FAO and WHO have developed a “Code of Hygienic Practice for Fresh Fruits and Vegetables.”10 This takes a food chain approach, assessing risks from farm to fork,taking account of all aspects of crops from primary production to consumption. Risks can occur at the primary production stage in the farm environment (through soil, wildlife, proximity to urban or industrial development, waterways, susceptibility to run-off, etc.), in the source of irrigation wastewater, or through manure, soil amendments, pesticides and even the seeds or plants themselves. Risk assessment should also consider the exposure of workers (growers, pickers) and issues arising in transport from the field to the packing/processing houses and the post-harvest handling of fresh produce.
Potential sources of contamination and hazards in the food chain include pathogenic bacteria (Salmonella, enterohaemorrhagic Escherichia coli, Campylobacter, Listeria, Shigella, Yersinia), parasites (Cryptosporidium, Cyclospora, helminths) and
9 FAO publishes various reports such as Water Quality for Agriculture as well as studies on the salt tolerance of various crops under the Irrigation and Drainage Report Series. They are available from the website: http://www.fao.org/nr/water/infores_pubs_quality.html.
10 Expert Group of the Codex Alimentarius Committee on Food Hygiene for Fresh Produce.

The Wealth of Waste: The economics of wastewater use in agriculture18
viruses (hepatitis A, noroviruses). Recently, problems have emerged with pathogens in fresh produce. Leafy greens pose the greatest concern in respect of microbiological hazards. Leafy greens are grown and exported in large volume and have been linked with multiple outbreaks involving many cases of illness in at least three regions of the world. These crops are grown and processed in diverse and complex ways ranging from in-field packing to pre-cutting and bagging which can amplify foodborne pathogens. International standards such as Codex Alimentarius (WHO, 1993) play a critical role in protecting the health of consumers and facilitating international trade.
1.7 WASTEWATER QUALITY: THE BASIC TREATMENT PROCESSESMunicipal sewage treatment involves the main processes (WELL, undated) illustrated below but extensive definitions are not provided here as they can be found in specific engineering texts. In addition, it is beyond the scope of this report to include discussions on lagoons and extensive treatment systems.
Preliminary: screening and grit removal to remove coarse solid and other large materials often found in raw wastewater. It includes coarse screening and grit removal.Primary: sedimentation – simple settlement of solid material in a primary settling tank. Solid particles settle at the bottom, and oils and greases rise to the top. This material is removed as sludge, for separate treatment. Secondary: the further removal of common pollutants, usually by biological processes to remove dissolved organic material. Wastewater from primary treatment flows into an aeration tank, to which micro-organisms are added to consume the remaining organic matter. Following aeration, the mixture is clarified. The residue is removed as sludge, for separate treatment and disposal.Tertiary: involves the removal of specific pollutants, e.g. nitrogen or phosphorus, or specific industrial pollutants. The effluent may then be disinfected to kill harmful micro-organisms by chlorination or ultraviolet disinfection. The residual chlorine is then removed. Processing of solids and sludge: solids from the primary and secondary processes are sent to a digester which produces by-products including methane and water. The final residue is sent to landfills or incinerators, or used in agriculture for fertilizer or soil beneficiation11.
Although untreated sewage is quite widely used in agriculture in many locations, the more typical situation involves the reuse of effluent treated to at least secondary levels. As noted in section 1.6 this can meet public health concerns, with appropriate use limitations and safeguards. Effluent treated to secondary levels still contains nutrients of value to farmers, whereas tertiary treatment removes nitrogen and phosphorus which are crucial ingredients for fertilization.
In certain localities (e.g. the Llobregat Delta taken as one of the case studies in Chapter 2) the wastewater effluent has an excessively high salt content, which needs to be removed to make it usable by farmers. In this specific case, an Electrodialysis Reversal (EDR) unit is being installed to provide additional treatment for the effluent being sent to farms.
The choice of the degree of wastewater treatment is normally made for reasons of environment, amenity and public health. However, where extra treatment is being considered as part of a reuse project it is desirable to minimize costs by employing technologies that can offer long-term reliable operation, low operating costs, minimize the use of chemicals and be as compact as possible (Sorgini, 2007). Where space permits, the additional facilities can be built inside the existing WWTP premises.
11 Disposal of sludge at sea is another option, though this is now banned in EU countries, and elsewhere.

Chapter 1 - Introduction to wastewater reuse 19
1.8 ENVIRONMENTAL, INFRASTRUCTURAL AND LEGAL ISSUESEnvironmentalThe potential impact of using recycled water on human health was considered in section 1.6. Wastewater contains potential pathogens for plants, animals and humans transmitted through the food-web or the environment: nitrates, Giardia and Cryptosporidium, endocrine disruptors, other persistent organics, etc., have been matters of recent concern.
Different types and degrees of wastewater treatment can affect the presence of contaminants in the effluent released for recycling. Where this contains heavy metals or other harmful substances there is a risk of their long term build-up in soil. In some cases the contaminant may be present in the source water (as in the Spanish case studies, where salinity is a problem being dealt with through a reverse-osmosis desalination unit).
Discharging inadequately treated wastewater could cause eutrophication of surface waters – hence the environmental directives of the EU and other countries requirement treatment to tertiary levels in specified cases. In these circumstances, farmers confer an environmental benefit by using recycled water where nutrients such as phosphorous and nitrogen are absorbed by the crop rather than discharged into other water bodies.
Water reuse may be a means of reducing wastewater discharges. Reclaimed water has also been used to restore wetlands or streams or groundwater aquifers by replenishing flows and water table levels. Reclaimed water may provide a source of water to promote growth in water scarce regions or to increase income of resource-poor urban and peri-urban farmers.
TABLE 1.7Factors affecting the choice of irrigation method and special measures required for reclaimed water applications
Irrigation Method Factors affecting choice Special measures for irrigation with reclaimed water
Flood irrigation Lowest cost
Exact levelling not required
Low water use efficiency
Low level of health protection
Thorough protection of field workers, crop handlers, and consumers (eg. protective equipment)
Furrow irrigation Low cost
Levelling may be needed
Low water use efficiency
Medium level of health protection
Protection of field workers, possibly of crop handlers and consumers (eg. protective equipment)
Sprinkler irrigation Medium to high cost
Medium water use efficiency
Levelling not required
Low level of health protection (due to aerosols)
Minimum distance 50-100 m from houses and roads
Water quality restrictions (pathogen removal)
Anaerobic wastes should not be used due to odour nuisance
Use if mini-sprinklers
Subsurface and drip irrigation High cost
High water use efficiency
Higher yields
Highest level of health protection
No protection measures required
Water quality restrictions (filtration) to prevent emitters from clogging
Source: Lazarova and Bahri (2005, 2008).

The Wealth of Waste: The economics of wastewater use in agriculture20
TABLE 1.8Classification of cultivation practices as a function of the health risk for agricultural workers
Low risk of infection High risk of infection
Mechanized cultural practices
Mechanized harvesting practices
Crop dried prior to harvesting
Long dry periods between irrigations
High dust areas
Hand cultivation
Hand harvest of food crops
Moving sprinkler equipment
Direct contact with irrigation water
Source: Lazarova and Bahri (2005)
TABLE 1.9Levels of risk associated with different types of crops irrigated with reclaimed water
Lowest risk to consumer, but field worker protection still needed
Medium risk to consumer and handler Highest risk to consumer, field worker, and handler
Agricultural irrigation
Industrial crops not for human consumption (e.g., cotton, sisal)
Crops normally processed by heat or drying before human consumption (grains, oilseeds, sugar beets)
Vegetables and fruit grown exclusively for canning or other processing that effectively destroys pathogens
Fodder crops and other animal feed crops that are sun-dried and harvested before consumption by animals
Pasture, green fodder crops
Crops for human consumption that do not come into direct contact with wastewater, on condition that none must be picked off the ground and that sprinkler irrigation must not be used (e.g., tree crops, vineyards)
Crops for human consumption normally eaten only after cooking (e.g., potatoes, eggplant, beets)
Crops for human consumption, the peel of which is not eaton (e.g., melons, citrus fruits, bananas, nuts, groundnuts)
Any crop not identified as high risk if sprinkler irrigation is used
Any crops eaten uncooked and grown in close contact with wastewater effluent (e.g., fresh vegetables such as lettuce or carrots, spray-irrigated fruits)
Spray irrigation regardless of type of crop within 100 m of residential areas or places of public access
Landscape irrigation
Landscape irrigation in fenced areas without public access (e.g., nurseries, forests, green belts)
Golf courses with automated irrigation scheduling
Golf courses with manual irrigation
Landscape irrigation with public access (e.g., parks, school playgrounds, lawns)
Source: Lazarova and Bahri (2005)
Infrastructure and conveyanceIn some situations (most of the case studies in chapter 2), treated wastewater of the required quality is available in sufficient quantities, or decisions have been taken to upgrade existing WWTPs to produce such effluent. However, in other cases some upgrading of WWTPs will be required and there may even be a need to add specific processes (e.g. desalination) to render the wastewater suitable for farm use.
Local geography is important for the feasibility of recycling schemes. The source of reclaimed water needs to be in reasonable proximity to the intended users, in order to minimise the need for new conveyors and the cost of pumping. If existing conveyors could be used, this would obviously be advantageous. Equally, if not more, importantly, the economics of reuse schemes normally rely on an exchange of fresh water entitlements between farmers and cities: this must be physically and geographically feasible. The freshwater entitlement must be accessible to the city at a reasonable cost, with minimal new conveyance infrastructure and pumping, compared with the alternatives. The case studies in chapter 2 include cases where the transfer is highly feasible in these terms, as well as those where its feasibility is not obvious.

Chapter 1 - Introduction to wastewater reuse 21
Irrigation infrastructure and methodsThe second aspect is the feasibility of reuse from the viewpoint of irrigation infrastructure. Certain methods of irrigation may reduce the exposure of crops to pathogens, whereas others are not suitable. Sprinklers, for instance, are not advisable for lettuce irrigation, due to the capacity of the crop to hold water between its leaves and thus improve the survival of pathogens. Other crops need specific irrigation methods, e.g., forage grass is usually irrigated with sprinklers and is difficult to do so with drippers unless the soil is heavy.
Some of the general problems of using reclaimed water for irrigation are the likelihood of algal and rooted macrophyte growth in open channels, the formation of biofilms in pipelines, and the re-growth of pathogens along the reclamation and reuse systems. Some of these effects can be mitigated by using chemicals or other means that change the composition of reclaimed water.
Irrigation practices and devices (e.g. drip or porous pipes) which limit contact with humans, sensitive parts of the environment, or parts of plants, are less risky to health than those (e.g. sprinklers, aerosols) which broadcast reclaimed water in a diffused manner. Some of the factors to consider in the choice of irrigation method, from the viewpoint of the impact on workers and consumers, are illustrated in Tables 1.7, 1.8 and 1.9.
Legal framework & water rightsWastewater reuse commonly involves a transfer of entitlements to freshwater between farmers and municipalities (or other water users). In principle, both parties should be able to benefit from such an exchange of rights where conditions are favorable. However, unless compulsion is ruled out, a voluntary exchange depends on the farmers having secure and alienable rights to the water that they can transfer – either in water markets or in return for compensation. They must possess such legal rights, and their national legal system must permit the transfer or sale of these rights to others. Many legal systems do not provide these assurances. Consequently, municipalities, which stand to gain (or save) financially, and which could fund reuse projects, may not get sufficient reassurance of their rights to the freshwater “exchanged” for the recycled effluent. Where the water problems of a city or region are sufficiently grave, some compulsion might be required to achieve a solution. Even then, however, questions of rights and compensation are likely to arise.
Formal or informal legal rights may also attach to the use of wastewater (treated or not) by farmers or other groups, who may claim compensation if this is diverted for use elsewhere (Bahri, 2009).

23
Chapter 2
A regional perspective: introduction to the case studies from Spain & Mexico
This chapter introduces the case studies that provide the real-world context for the consideration of the topic of this report. Following the presentation of the economic methodology in Chapter 3, economic and financial data drawn from these cases studies is used in Chapter 4 to provide a practical illustration of how the analysis can be carried out, with some indicative results.
Case material is drawn from five regions of Spain and Mexico (Table 2.1).Mexico: Case studies
Mexico City & Tula ValleyGuanajuato City & La Purísima irrigation module.Durango City & Guadalupe Victoria irrigation module.
The sites were chosen to indicate both the potential and the practical difficulties arising in water recycling, whether of treated (reclaimed) or untreated wastewater. All the sites have the potential for “win-win” outcomes, in the sense that water recycling can benefit two or more of the parties to the transaction, taken to be urban water authorities (“cities”), farmers, and environmental custodians for the sake of this discussion.
Several types of “win-win” projects are represented in the case studies:farmers cede their freshwater rights to cities in return for assured supplies of reclaimed water containing nutrients (Sant Feliu, El Prat, Durango);farmers accept reclaimed water as a complement or alternative to pumping of depleting aquifers, giving them greater reliability and cost savings, with environmental gains (Tordera Delta);the provision of reclaimed water and (untreated) wastewater to agriculture as a solution for urban wastewater treatment and disposal, as well as offering benefits to farmers (Mexico City/Tula, Guanajuato/La Purisima, Gava-Viladecans pre-1986).
Although the principal motives of these various arrangements differ, each offers potential benefits to all three stakeholders mentioned above.
The attraction of these arrangements to the farmers is normally the security of supply of the effluent water, its fertilising properties, and any savings in their own groundwater pumping. The appeal of such projects to cities may be their access to extra fresh water at lower costs than they would otherwise pay, or the opportunity to dispose of wastewater (treated or not) more advantageously than otherwise. The environment is also a potential beneficiary where, for example, it is
TABLE 2.1Case material sites
Spain: Case studies:
Llobregat Delta
Sant Feliu de Llobregat
El Prat de Llobregat
Gavà-Viladecans
Tordera Delta and Costa Brava
Blanes
Castell-Platja d’Aro
Mexico: Case studies
Mexico City & Tula Valley
Guanajuato City & La Purísima irrigation module
Durango City & Guadalupe Victoria irrigation module
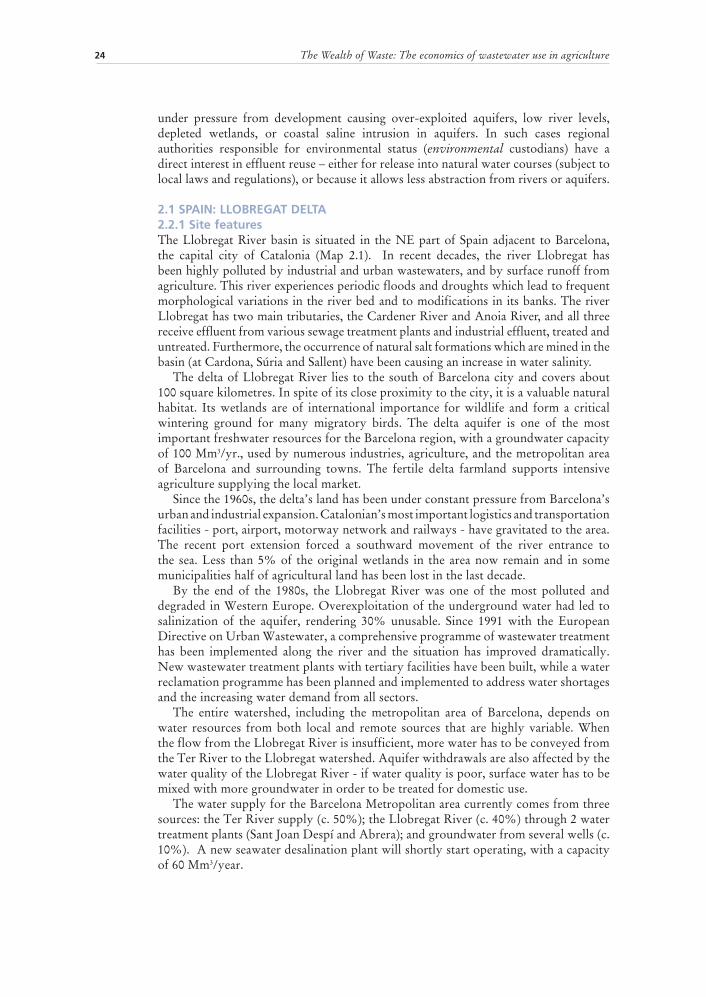
The Wealth of Waste: The economics of wastewater use in agriculture24
under pressure from development causing over-exploited aquifers, low river levels, depleted wetlands, or coastal saline intrusion in aquifers. In such cases regional authorities responsible for environmental status (environmental custodians) have a direct interest in effluent reuse – either for release into natural water courses (subject to local laws and regulations), or because it allows less abstraction from rivers or aquifers.
2.1 SPAIN: LLOBREGAT DELTA2.2.1 Site featuresThe Llobregat River basin is situated in the NE part of Spain adjacent to Barcelona, the capital city of Catalonia (Map 2.1). In recent decades, the river Llobregat has been highly polluted by industrial and urban wastewaters, and by surface runoff from agriculture. This river experiences periodic floods and droughts which lead to frequent morphological variations in the river bed and to modifications in its banks. The river Llobregat has two main tributaries, the Cardener River and Anoia River, and all three receive effluent from various sewage treatment plants and industrial effluent, treated and untreated. Furthermore, the occurrence of natural salt formations which are mined in the basin (at Cardona, Súria and Sallent) have been causing an increase in water salinity.
The delta of Llobregat River lies to the south of Barcelona city and covers about 100 square kilometres. In spite of its close proximity to the city, it is a valuable natural habitat. Its wetlands are of international importance for wildlife and form a critical wintering ground for many migratory birds. The delta aquifer is one of the most important freshwater resources for the Barcelona region, with a groundwater capacity of 100 Mm3/yr., used by numerous industries, agriculture, and the metropolitan area of Barcelona and surrounding towns. The fertile delta farmland supports intensive agriculture supplying the local market.
Since the 1960s, the delta’s land has been under constant pressure from Barcelona’s urban and industrial expansion. Catalonian’s most important logistics and transportation facilities - port, airport, motorway network and railways - have gravitated to the area. The recent port extension forced a southward movement of the river entrance to the sea. Less than 5% of the original wetlands in the area now remain and in some municipalities half of agricultural land has been lost in the last decade.
By the end of the 1980s, the Llobregat River was one of the most polluted and degraded in Western Europe. Overexploitation of the underground water had led to salinization of the aquifer, rendering 30% unusable. Since 1991 with the European Directive on Urban Wastewater, a comprehensive programme of wastewater treatment has been implemented along the river and the situation has improved dramatically. New wastewater treatment plants with tertiary facilities have been built, while a water reclamation programme has been planned and implemented to address water shortages and the increasing water demand from all sectors.
The entire watershed, including the metropolitan area of Barcelona, depends on water resources from both local and remote sources that are highly variable. When the flow from the Llobregat River is insufficient, more water has to be conveyed from the Ter River to the Llobregat watershed. Aquifer withdrawals are also affected by the water quality of the Llobregat River - if water quality is poor, surface water has to be mixed with more groundwater in order to be treated for domestic use.
The water supply for the Barcelona Metropolitan area currently comes from three sources: the Ter River supply (c. 50%); the Llobregat River (c. 40%) through 2 water treatment plants (Sant Joan Despí and Abrera); and groundwater from several wells (c. 10%). A new seawater desalination plant will shortly start operating, with a capacity of 60 Mm3/year.

Chapter 2 - A regional perspective: introduction to the case studies from Sapin & Mexico 25
MAP 2.1Llobregat river basin

The Wealth of Waste: The economics of wastewater use in agriculture26
Infrastructure exists to prevent excessive pollution of the river by intercepting specific effluents, such as the channels receiving treated urban wastewater from Rubí and those collecting brine from the salt-mine sites (Figure 2.1). Apart from these, there is a major irrigation channel on the right side of the river, the Canal de la Dreta, which provides water extracted from the middle course of the river to horticulture. On the left side of the river the Infanta Canal was also built for irrigation purposes, but now its main role is to divert treated wastewater from industries and towns away from the river so as to improve the latter’s water quality. The aquifer is used mainly for irrigation, having a lower salinity than the river, except in the areas with seawater intrusion.
The Llobregat River is the main source of irrigation water, via the Canal de la Dreta, and a small amount via the Canal de la Infanta. At present, in drought conditions, the extraction of the Llobregat aquifers exceeds the natural recharge of 5.6 Mm3/yr. This over-exploitation has led to a new policy aimed at restoring the river basin’s natural state based partly on the reclamation and reuse of treated wastewater.
2.1.2 Wastewater treatmentIn the study area there are two main wastewater treatment plants (WWTPs): The Sant Feliu de Llobregat WWTP and El Prat de Llobregat WWTP, both with tertiary treatment – see Map 2.2. A third WWTP operates on the western edge of the delta at Gavà-Viladecans, which is discussed below.
Effluent from the Sant Feliu de Llobregat WWTP is fully treated to tertiary levels and available for use in irrigated agriculture. The effluent volume - around 19 Mm3/yr – can be transferred to the Canal de la Dreta to be used for irrigation purposes on
FIGURE 2.1 Deflection channels in the lower Llobregat River course

Chapter 2 - A regional perspective: introduction to the case studies from Sapin & Mexico 27
the right side of the Llobregat delta. The effluent is usually mixed with well water in order to reach an acceptable water quality for irrigation purposes. The irrigated areas are located in Sant Viçenc dels Horts, a village in the north part of the delta. Currently, only a small proportion of the effluent is actually used by farmers (about 0.2 Mm3/yr), who view it as a last resort to be used in drought periods when sufficient fresh water is not available.
El Prat de Llobregat WWTP, with a wastewater generation of around 120 Mm3/yr, is one of the biggest treatment plants not only in Spain but in the whole of Europe. The treatment plant, serving more than 2 million inhabitants, generates 4.5 Mm3/yr of wastewater treated to tertiary levels that can be used to supply the ecological flow of the lower part of the Llobregat river, and to provide water for agricultural irrigation and to supply water to wetlands in the river deltaic areas. An important part of the reclaimed flow will also be used to create a hydraulic barrier to seawater intrusion in the Llobregat lower delta aquifer.
El Prat de Llobregat WWTP can collect the treated wastewater of other facilities located in the medium-upper part of the river. However, the concentration of industrial activity and the salts added by urban uses of water increase the salinity of the effluent and affect its reuse. The treatment facilities of the plant were improved in 2006 in order to obtain the required water quality for reuse. Two different tertiary treatment lines were built, each with its appropriate technology for the expected reuse purposes. Water intended for the coastal seawater intrusion hydraulic barrier is additionally processed with micro filtration and reverse osmosis.
Although the infrastructure exists, the reclaimed water generated by the El Prat de Llobregat WWTP is not currently used in irrigated agriculture. Farmers prefer to use the aquifer as their main water source, supplemented by the Llobregat river water via the Canal de la Dreta. However, extraction from the abovementioned channel by farmers is prohibited in drought periods and, at such times, farmers are obliged to use reclaimed wastewater from the El Prat de Llobregrat WWTP.
MAP 2.2Wastewater treatment plants
Source: Food and Agricultural Organizatin of the United Nations (2008)

The Wealth of Waste: The economics of wastewater use in agriculture28
Ten kilometers west of El Prat de Llobregat the Gavà-Viladecans agricultural region produces artichokes, tomatoes and other vegetables. Until 1986 the villages of Gavà and Viladecans had no wastewater treatment plant and, before that time, farmers used untreated wastewater distributed via a network of channels. These channels are now used to distribute the output from the WWTP as well as channelling excess water and rainwater. The Llobregat right irrigation channel (Canal de la Dreta) used by the other growers of the delta is too far from this area, so the local farmers accepted the use of effluent treated at the new plant.The treated effluent from the Gavà-Viladecans WWTP is channeled to local farmers who pump it for their own purposes. This effluent is not used directly for irrigation, but is used for stabilizing the hydrological balance in this area. Some of the effluent is also used to recharge wetlands. Due to potential health risks, there are plans to install a tertiary treatment unit which would enable higher value crops (e.g. tomatoes) to be grown with the treated effluent. However, for the immediate future there is unlikely to be any increase in the agricultural use of reclaimed water since farmers already benefit from it indirectly.
In summary, in Gavà-Viladecans and other parts of the Llobregat Delta, there are at present few direct uses of treated wastewater in agriculture, but the reclaimed water is direct uses of treated wastewater in agriculture, but the reclaimed water is being applied to stabilize the hydrological balance in the area (Map 2.3).
2.1.3 Expansion of effluent reuse in agricultureAt each of the three areas, the Catalonian Water Agency (ACA) plans to expand the use of the treated effluents of the WWTPs for agricultural irrigation and other purposes.
Table 2.2 indicates that rain-fed farming is limited to 15% of the total cultivated land, mainly in the area of Sant Feliu de Llobregat. Farmers use fresh water from the Llobregat River through the Canal de la Dreta, with an annual flow of c. 19 Mm3. The effluent from the tertiary treatment of the Sant Feliu WTTP can be transferred to the Canal de la Dreta to be used for irrigation purposes on the right side of the Llobregat delta (Figure 2.1). Normally, the limit for agricultural use of water from the Llobregat river is 1.5 m3/s, but in periods of water shortage this use is reduced to 0.8 m3/s. At such times, the farmers are obliged to use treated wastewater from the Sant Feliu de
TABLE 2.2Wastewater output and re-use in Llobregat delta (2006)
Treated wastewater (Mm3/yr) SecondaryTertiary
120.384.50
19.1019.10
14.5314.53
Treated effluent use (Mm3/yr) Sea disposalAquifer rechargeWetlandsLlobregat riverAgriculture irrigation
99.77*0.01.53.00.0**
0.00.0no
19.420.225
9.78*nonono
4.74***
Cultivated area (ha) Rain fedIrrigation
58743
40235
171524
Total water used in agricultural irrigation (Mm3/yr)****
6.00 1.78 4.20
* Effluent from Secondary treatment
** Potentially via right irrigation channel (Canal de la Dreta)
*** Via delta canals. Ambient reuse, with indirect agricultural use.
**** Does not include unregistered water extraction
no: Option not possible

Chapter 2 - A regional perspective: introduction to the case studies from Sapin & Mexico 29
Llobregat WWTP, which is the only water flow in the Canal de la Dreta. Therefore, this effluent is used only in drought periods (currently about 0.2 Mm3/yr) and, due to its high salinity, the effluent is mixed with well water in order to reach an acceptable water quality for irrigation purposes.
The groundwater used by farmers in this area is estimated to amount to about 5 Mm3/yr. Farmers actually take a major proportion of their irrigation needs from the aquifers, but this is not fully registered by the authorities and aggregate groundwater use is only estimated from the aquifer balance.
For the foreseeable future, wastewater treatment capacity is not the major constraint in expanding effluent reuse in agriculture. There is currently huge capacity in the Llobregat Delta for generating tertiary treated wastewater which, at present, is hardly used for agricultural irrigation. In the long term, there are options for producing more treated effluent by upgrading existing or building new WWTPs.
2.1.4 Intersectoral water exchangeAssessing the economic efficiency of reclaimed water use cannot be confined to a single sector such as agriculture - a broader perspective at river basin or watershed level is needed. Such an assessment should be informed by the concept of integrated water resource management (IWRM) that considers all water-related issues and their interdependencies, as far as possible.
Box 2.1 provides a summary of the water policy for the Llobregat Delta, involving a mixture of solutions, including desalination, the further use of remote resources (and, conversely, reducing their use when seawater desalination is in operation), further treatment of wastewater, and environmental measures to restore aquifers, replenish wetlands and create a hydrological barrier against seawater intrusion. The recycling of wastewater for irrigated agriculture, both directly and indirectly, through environmental measures and aquifer recharge, fits well with the strategies of IWRM.
The main projects for implementing this policy are listed in Table 2.3.
BOX 2.1
Water policy in the Llobregat Delta
To augment water availability in the metropolitan area of Barcelona, a water treatment plant is under construction to desalinate seawater with a capacity of 60 Mm3/yr. From 2009, this water will be pumped via a distribution station into the pipeline network supplying Barcelona with drinking water. This will not only increase water availability but will also reduce the conductivity (salinity) of the El Prat WWTP effluent.
The full range of measures being planned by the Catalonian Water Agency (ACA) include the desalination of treated wastewater from WTTPs, deflection of industrial wastewater, desalination for potable water, and greater use of remote resources with lower conductivity from the Ter river. (However, stakeholders from the Ter basin are now claiming the return part of their water concession on the grounds that the new desalination plant makes the use of remote sources unnecessary). Part of the reclaimed water from the El Prat WTTP will be used to recharge the aquifer serving as a hydrological barrier against seawater intrusion. All these measures aim to tackle future water shortages in the Llobregat Delta, as well as improving the water quality and the ecological status of the Llobregat river basin.
The ACA’s theme of integrated water management is embedded in a Water Reuse Programme in the context of the overall Catalonian Hydrological Plan for internal basins. The Water Reuse Programme has a planned budget of 180 M€ and a target for reusing 20% of the total treated wastewater.

The Wealth of Waste: The economics of wastewater use in agriculture30
A further project is the construction of a Reverse Osmosis treatment plant (RO) at the El Prat de Llobregat WWTP as an advanced form of treatment for reclaimed water in order for its use in aquifer recharge for creating a hydrological barrier against seawater intrusion (24 M€).
All these actions will mitigate the current and future water problems at the Llobregat Delta, and they will facilitate directly and indirectly water reclamation. Thereduction of the conductivity (salinity) of the El Prat WWTP effluents and upgrading the tertiary treatment at Sant Feliu WWTP will facilitate intersectorial water transfer between agriculture and the city.
It is intended that the reclaimed water from the El Prat and Sant Feliu WWTPs will be used for several purposes (Table 2.4).
As table 2.4 shows, in the near future the reuse of treated wastewater will become increasingly important not only for agricultural irrigation but also for industrial water use and for enhancements of water quality and wetlands (Map 2.3). The conductivity of reclaimed water will need to be reduced to make it more suitable for agricultural irrigation, thus enabling freshwater currently used by farmers to be exchanged for what would otherwise be taken by other users in the Delta.
As noted earlier, both the El Prat and Sant Feliu WWTPs have tertiary treatment.
TABLE 2.4Projected multi-purpose use of reclaimed water in Llobregat Delta for 2015
WWTP El Prat de Llobregat
Mm³/yr
WTTP San Feliu de Llobregat
Mm³/yr
Agriculture 11.83 7.32
Rzver stream flow 10.37 -
Wetlands 6.31 -
Seawater barrier 0.91 -
Municipalities - 0.11
Recreation - 0.37
Industry 5.48 -
Total 34.9 7.8
TABLE 2.3Action planned in Delta de Llobregat and Barcelona metropolitan area to improve water management
Action Purpose Investment Cost M€
Desalination plant El Prat de Llobregat, storage and pipelines
Improve drinking water quality and reduce the salinity of the entire system,
420.0
Desalination (EDR) at Abrera drinking water plant
Reduce conductivity of Sant Feliu WWTP’s effluent; improve drinking water quality
65.0
Desalination (RO) of Llobregat River at Sant Joan Despi drinking water plant
Reduce conductivity of El Prat WWTP’s effluent; improve drinking water quality (especially for THM)
60.5
Industrial and mining effluent collectors Reduce salinity of Lobregat river 15.5
Desalination (EDR) at Municipality of Sant Boi de Llobregat*
Reduce conductivity of reclaimed water from El Prat WWTP for irrigation
14.0
Pipelines for industrial reuse Reuse of industrial effluent 1.5
New Tertiary treatment in Sant Feliu and pipelines*
Reduce conductivity of reclaimed water for irrigation 1.1
Total 577.6*Actions that facilitate directly the intersectoral water transfer at Llobregat Delta
Chapter 2 - A regional perspective: introduction to the case studies from Sapin & Mexico 31
Agricultural reuse of effluent dates from the summer of 2007 when a group of farmers started to use reclaimed wastewater mixed with well water. The Catalonian Water Agency (ACA) recommended this mixing in order to avoid long-term soil degradation due to the high salinity of the effluent. Neither of the two WWTPs has sufficient effluent quality to meet farm water requirements, so further measures will be needed including desalination of the effluents and building of new pipelines for water conveyance.
As it happens, the irrigation Canal de la Dreta starts upstream of Barcelona’s main drinking water treatment plant Sant Joan Despí. The use of reclaimed water in agriculture would potentially avoid a diversion of river water in the order of 19 Mm3/yr that is currently used for irrigation purposes. This amount would become available for domestic water supply, thereby avoiding conveyance of water from remote sources such as the Ter River.
In effect, the reuse scenario would lead to an intersectoral water exchange between agriculture and the metropolitan area of Barcelona. Whether this is economically rational is examined in Chapter 4 within a framework of cost-benefit analysis. A key question is whether farmers would be ready to replace freshwater with the reclaimed water (even it had good quality) and how they can be encouraged to do this. The net impacts on farmers’ income would be a crucial consideration.
2.2 SPAIN: TORDERA DELTA & COSTA BRAVA2.2.1 Site featuresThe Tordera River Delta, North-East of Barcelona, starts in the point where the Santa Coloma River joins the main flow up to the Mediterranean Sea – Maps 2.4a and b illustrate the Tordera Delta and exploiting well distribution locations. In the study area there are two WWTPs, one in the town of Blanes and the other in the town of Tordera, both with tertiary treatment. Effluent from the Blanes plant (around 3.5 Mm3/yr) is used mainly for recharging the aquifer, though a few farmers also use it for irrigation. The Tordera WWTP, producing around 1 Mm3/yr reclaimed effluent, uses artificial wetlands (purification ponds) for its tertiary treatment. The reclaimed water is currently being discharged into the Tordera River since its pumping facilities (powered by solar energy) are not working (these are needed to convey the wastewater to wetlands for recharging the aquifer). At the moment, none of the Tordera reclaimed water is used by farmers, despite the existence of an irrigation channel.
The Catalonian Water Agency has undertaken several measures to address the growing regional water shortage and pressures on the local aquifers:
MAP 2.3Reclaimed water demand in the Llobregat Delta

The Wealth of Waste: The economics of wastewater use in agriculture32
Construction of a seawater desalination plant in 2004 at Blanes. This plant provides almost 10 Mm3/yr to three drinking water treatment plants (including Tossa-Lloret de Mar, Blanes and Palafolls and North Maresme towns). See Map 2.9. The extraction of groundwater totalling 40 Mm3/yr from the Tordera River aquifer could be reduced by about 10 Mm3/yr. Upgrading the Blanes WWTP to tertiary treatment in order to reduce the discharge of secondary effluent into the sea through a submarine outfall, and to produce effluent of a quality suitable for recharging the Tordera aquifer.Drawing up a plan to regulate extractions from the aquifer.Providing farmers with reclaimed water for agricultural irrigation.
The farm areas around Blanes WWTP are in three municipalities - Blanes, Malgrat de Mar and Palafolls – with a total cultivated land of around 774 ha, of which 608 ha grow horticultural crops. Irrigation water is taken entirely from groundwater, with no recourse to surface supply (the Tordera River bed is completely dry during summer
months at the time when the water demand from crops is highest).
The Blanes WWTP, having tertiary treatment with nutrient removal, produces reclaimed water of a quality suitable to recharge the overdrawn Tordera aquifer. Currently, almost all the effluent is used for groundwater recharge through the river bed, with only a minimum percentage diverted to the outfall and only a few farmers using the reclaimed water. Until 2006 in fact, no farmers used reclaimed water from the WWTP, but the overexploitation of the aquifer caused some of them to ask for a concession to use reclaimed water since their wells had run dry. Two farmers formed a community of irrigation users called Mas Rabassa and undertook to build pipelines, a pumping station and a water reservoir to take the effluent. The Catalonian Government funded 70% of the project capital cost; the remaining part being paid by the farmers. This scheme started operating in 2007, and it is likely that more farmers will soon be in the same situation.
A future scenario could be for more use of the Blanes WWTP recycled water in irrigated agriculture, and the complete replacement of groundwater by reclaimed water. This option would save farmers the cost of groundwater pumping, though they would be unlikely to receive fertilization benefits due to the removal of nutrients at the tertiary WWTP. There would be
MAP 2.4 bWastewater treatment plants
MAP 2.4 aWell distribution locations in the Tordera Delta

Chapter 2 - A regional perspective: introduction to the case studies from Sapin & Mexico 33
additional benefits to the local environment, and for other water users through the exchange of freshwater rights for the effluent. This option is appraised in Chapter 4.
To the west of Blanes, another WWTP providing reclaimed water is located at the area of Mid-Costa Brava – Map 2.5. The Castell-Platja d’Aro WWTP, built in 1983, started to supply reclaimed water to farmers around its plant in 2003. This WWTP generates 5.50 Mm3/yr of effluent, of which 0.98 Mm3/yr is treated to tertiary level. The latter is used for agricultural irrigation (0.216 Mm3/yr), golf course watering (0.510 Mm3/yr) and groundwater recharge (0.263 Mm3/yr). The remainder (3.54 Mm3/yr) of secondary treated effluent is discharged into the sea. Farmers are mainly milk producers growing their own fodder, along with winter cereals and summer corn. The effluent from the Platja d’Aro WWTP is rich in nutrients, mainly nitrogen, which is particulary suitable for high nutrient demanding crops like corn. (Map 2.5)
2.2.2 The Mas Pijoan Farm – a microcosm of effluent reuseThe following is one example (Box 2.2 and Figure 2.2) of reclaimed water use in this area.
The farmer concerned no longer has to compete for groundwater with nearby residential and agricultural users, which caused difficulties at previous periods of high groundwater pumping rates. Reliability of water is an obvious benefit, and other farmers in the vicinity have shown interest in using reclaimed water (Muñoz and Sala 2007). Only 30-50% of total effluent from the Castell-Platja d’Aro WWTP is reused, indicating its potential to relieve situations such as that in the municipality of Llagostera, where groundwater is extracted from even greater depths - 80-120 metres - resulting in even greater pumping costs than in the Solius area.
Pumping station
Water deflection
Wells
FIGURE 2.2 Mas Pijoan irrigatin pipeline scheme (2006)

The Wealth of Waste: The economics of wastewater use in agriculture34
In areas such as these, where treated effluent is potentially part of the solution for irrigation needs, future plans for building or upgrading WWTPs should carefully weigh the optimal degree of treatment (i.e., nutrient removal) since higher nutrient concentrations can make the reuse of treated wastewater more attractive from the viewpoint of fertilization, while it may ipso facto give rise to limitations on the water’s use.
2.2.3 Options for the future In the next two years ACA foresees an enlargement of the tertiary treatment capacity of the Platja d’Aro WWTP by 30%, reaching a flow rate of 20,000 m3/day design capacity. Although reclaimed water has been used in this district since 1989, when the golf course started to irrigate with effluent, still only 22% of the total treated water in the plant is reused. Despite interest among potentially new users, the main limitation is the current tertiary treatment capacity. The greater availability of treated effluent would be of great interest to two municipalities (Castell-Platja d’Aro, Santa Cristina d’Aro), farmers in Llagostera and local golf courses.
ACA has been considering how to adjust the quantity and quality of wastewater treatment to satisfy potential demand. One option is to produce two different types of reclaimed water: one without nutrients for golf courses and municipalities and another one with nutrients for agricultural irrigation. The second option is producing only one
BOX 2.2
The Mas Pijoan Ranch
The Mas Pijoan Farm uses 0.137 Mm3/yr of reclaimed water. The farm is located in Solius, a community belonging to Santa Cristina d’Aro municipality. The farm has 300 cattle on 150 ha, 40 ha of which are irrigated for barley, rye, oats and corn for fodder. Until 2003, the farm worked on 35 ha irrigated from the local aquifer. The yield of wells at the beginning of the summer could reach 150 m3/h, but would decrease during the season to 20m3/h, thus water could not be guaranteed at crucial crop growing stages.
Competition for water in the area was always high. Managers of the nearby golf courses shifted in 1998 to the use of reclaimed water due to recurrent shortages in their groundwater supplies and the prohibition on the use of groundwater for irrigation. The Mas Pijoan Farm found that connecting to the reclaimed water pipeline of the Costa Brava Golf Course was a reasonable solution – Figure 2.2. The Golf Course irrigation is in operation from 9 pm to 7 am, and the water is supplied to agriculture during the rest of the day. The agreement between the golf course and the farmer includes the operation of a reversible pumping station to ensure that the golf course can be supplied from the storage pond of Mas Pijoan using well water if necessary. The arrangement has provided mutual reliability and flexibility to both users.
The cost of connecting the existing pipeline to the storage pond was 70% funded by the European Agricultural Fund for Rural Development (EAFRD). Total private investment was 80,000 €. The farmer signed a 25 year service contract to share the use and associated operation and maintenance cost of the reclaimed water pipeline from the Golf course.
The cost of connecting the existing pipeline to the storage pond was 70% funded by the European Agricultural Fund for Rural Development (EAFRD). Total private investment was 80,000 €. The farmer signed a 25 year service contract to share the use and associated operation and maintenance cost of the reclaimed water pipeline from the Golf course.
Between 2003 and 2006 this arrangement enabled the farmer to increase total irrigated land from 35 ha to 41.6 ha, due to the reliability of the reclaimed water, amounting to 136,000 m3/yr in 2006, or 65% of his water needs. The balance of water used by the farm is drawn from groundwater supplies. Overall, the ranch is irrigated partly with reclaimed water, partly with well water and partly with a mixture of the two.

Chapter 2 - A regional perspective: introduction to the case studies from Sapin & Mexico 35
denitrified effluent for all users. The first option is, however, uneconomic due to the high cost of running two treatment lines in the same plant which would not be justified in terms of chemical fertilizers saved by farmers.
A more realistic strategy for Platja d’Aro is an increase in the reclaimed water production with a single effluent quality, with the construction of new pumping stations, pipelines and water reservoirs. If the construction costs of these facilities were shared with each of the potential effluent users in proportion to their expected use, the situation would be as depicted in Table 2.5.
Of the total investment cost of around 7.7 M€, 16% would be required for the enlargement of tertiary treatment, 48% for the pipelines and 33% for storage facilities.
As part of the above scenario it has been decided to install a nutrient removal system at the Platja d’Aro WWTP. The reduction of the nutrient content of the reclaimed water by approximately 70% will diminish its value as fertilizer, but farmers would
TABLE 2.5Investment cost of expansion of reclaimed water use at Platja d’Aro area
Requested reclaimed water Investment cost**
Mm³/yr M€
Agriculture 1.263 4.3
Municipalities 0.288 1.5
Golf courses 0.658 0.7
ACA* 1.0 1.2
Total 3.209 7.7* Dedicated for improving the ecologic water flow of Ridaura river
** Rounded values
MAP 2.5Castell-Platja D’Aro WWTP

The Wealth of Waste: The economics of wastewater use in agriculture36
expect to raise income through the greater availability and reliability of the water. The shift from groundwater to reclaimed water for irrigation would avoid (or defer) the construction of a new pipeline to convey water from the Ter River to meet the increasing water demand in this area of Costa Brava. These benefits and cost savings are further discussed and quantified in Chapter 4.
2.3 MEXICO: MEXICO CITY & TULA VALLEY2.3.1. Site featuresThe Tula, Ajacuba and Alfajayucan irrigation districts are the product of raw wastewater from Mexico City. Almost 90 000 ha of irrigated land, previously with very poor soils, now depend on nearly 1 500 Mm3/yr of Mexico City’s untreated wastewater. Their other water sources are part of the Tula River’s flow, a small amount of groundwater, and the reuse of irrigation returns (which in turn contain untreated wastewater). In effect, Mexico City uses these areas for the natural treatment and disposal of its wastewater (Map 2.6).
The transfer of Mexico City’s untreated wastewater to the Tula Valley has grown over more than a century. This wastewater has stimulated agricultural production in the Mezquital Valley, the central part of the Tula River basin, where the Tula, Ajacuba and Alfajayucan irrigation districts are located.
During its flow from Mexico City to the Tula Valley the quality of the wastewater improves due to the processes of biological degradation, photo-dissociation, adsorption, absorption, oxydation, precipitation and dilution. These processes explain the self-purifying capacity of water when it flows in streams and through the soil, as well as when it is stored in impoundments. Notwithstanding this, health problems can arise: workers who shun sensible precautions and consumers of maize and alfalfa grown1
with untreated wastewater are at risk of infection. With these risks in view, Mexico
1 Against official advice and in contravention of regulations.
Map 2.6Mexico City and Tula Valley Irrigation Districts

Chapter 2 - A regional perspective: introduction to the case studies from Sapin & Mexico 37
City is planning to build six treatment plants with a total capacity of 40 m3/s, equivalent to 1 261 Mm3/yr, covering almost all its wastewater.
The system of water use rights in the form of water dowries, assignments, and concessions does not stipulate any specific water quality. As a result, no irrigation district can legally complain about the quality of water they receive. Quite the contrary, since farmers prefer to have residual waters because of the organic matter they contain, which allows them to increase soil productivity without using fertilizers or soil enhancers.
Nevertheless, all wastewater discharges must comply with the Mexican Official Norm NOM-001-ECOL-1996 that establishes the maximum limits of contaminants that residual waters may discharge into national water bodies. The Federal Law of Rights contains a provision whereby wastewater dischargers who exceed the permitted contaminant concentrations pay charges, according to the Polluter Pays Principle.
Most of the cultivation in the Mexico and Tula Valleys involves long stalk and industrial crops. In the Mexico Valley the crop pattern is usually 58% corn, 30% green alfalfa, 5% oat forage, 2% grass, 2% barley, and the rest various other crops. In the Tula Valley the typical crop pattern is 42% green alfalfa, 39% corn, 7% grass, 3% oat forage, 2% barley, and the remainder miscellaneous crops. Furrow irrigation is the main method used in these two valleys.
The synergy between Mexico City and the Tula Valley evolved from the need to drain the renewable runoff in the closed basin where the city is located. Initially, centuries ago, this was confined to freshwater discharged from the city’s streamflows, but over time untreated wastewater became part of the flow. By this means the city saved money in the treatment cost of urban residual water and meanwhile farmers benefited by applying it to land (wastewater natural treatment).
There are benefits to both parties. Mexico City saves the water treatment cost, but also gets rid of the excess water volumes it cannot store and reuse within its area. The Tula Valley, for its part, obtains an economic benefit from economizing in fertilizers from the use of nutrient-loaded waters, and also improves its soils, increases water infiltration to its aquifers, augments the baseflow in surface streamflows, and improves the yield of springs. On the debit side, the Tula region has experienced (in 1991) public health problems from farm workers who failed to use gloves and boots, domestic water users who were not connected to water supplies from a municipal water utility, and farmers that planted and sold unauthorized “restricted” crops.
It may be possible to recycle water for use in certain industrial processes and municipal uses able to take water of the quality concerned. Such measures would also diminish the abstraction of surface and ground waters. Water reuse is facilitated in those municipal areas which have separate water distribution networks: one for potable water and another for treated wastewater, to overcome the cost of distributing it through cistern trucks. Some Municipalities specify a certain order of preference for the reuse of treated wastewaters, which may override the economic incentives to use this source.
2.3.2 Impacts of water reclamation on agricultureTable 2.6 indicates the additional volume of reclaimed, untreated wastewaters flowing into the Tula Valley from Mexico City. The recharge is partly due to infiltration while water is being conveyed by unlined rivers and channels at Tula Valley, and partly to leaching through the soil. In this region groundwater is mainly used for municipal purposes, while surface water goes to irrigated agriculture.
The total net water used in agriculture is around 749 Mm3/yr, as delivered at the entrance of the irrigation district.
Wastewater has been used for irrigated agriculture in the Tula Valley for more than a century (since 1890) and there is no empirical basis for a “before and after” or “with and without” comparison. Moreover, the volume of wastewater used and the irrigated surface have changed continuously over this period. The economic benefits resulting
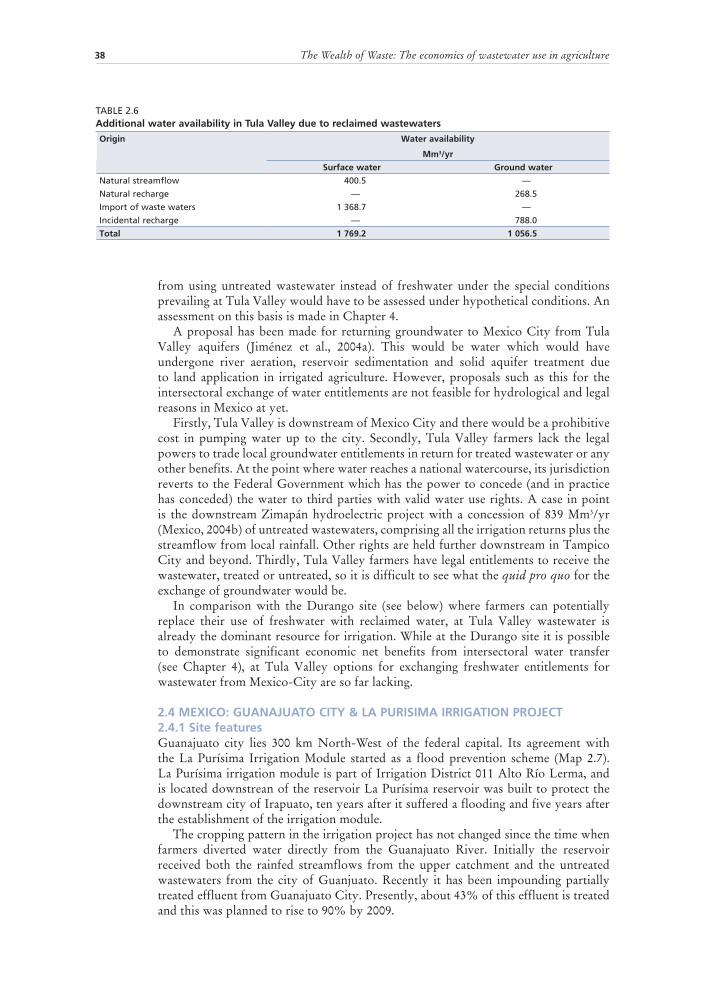
The Wealth of Waste: The economics of wastewater use in agriculture38
from using untreated wastewater instead of freshwater under the special conditions prevailing at Tula Valley would have to be assessed under hypothetical conditions. An assessment on this basis is made in Chapter 4.
A proposal has been made for returning groundwater to Mexico City from Tula Valley aquifers (Jiménez et al., 2004a). This would be water which would have undergone river aeration, reservoir sedimentation and solid aquifer treatment due to land application in irrigated agriculture. However, proposals such as this for the intersectoral exchange of water entitlements are not feasible for hydrological and legal reasons in Mexico at yet.
Firstly, Tula Valley is downstream of Mexico City and there would be a prohibitive cost in pumping water up to the city. Secondly, Tula Valley farmers lack the legal powers to trade local groundwater entitlements in return for treated wastewater or any other benefits. At the point where water reaches a national watercourse, its jurisdiction reverts to the Federal Government which has the power to concede (and in practice has conceded) the water to third parties with valid water use rights. A case in point is the downstream Zimapán hydroelectric project with a concession of 839 Mm3/yr(Mexico, 2004b) of untreated wastewaters, comprising all the irrigation returns plus the streamflow from local rainfall. Other rights are held further downstream in Tampico City and beyond. Thirdly, Tula Valley farmers have legal entitlements to receive the wastewater, treated or untreated, so it is difficult to see what the quid pro quo for the exchange of groundwater would be.
In comparison with the Durango site (see below) where farmers can potentially replace their use of freshwater with reclaimed water, at Tula Valley wastewater is already the dominant resource for irrigation. While at the Durango site it is possible to demonstrate significant economic net benefits from intersectoral water transfer (see Chapter 4), at Tula Valley options for exchanging freshwater entitlements for wastewater from Mexico-City are so far lacking.
2.4 MEXICO: GUANAJUATO CITY & LA PURISIMA IRRIGATION PROJECT2.4.1 Site featuresGuanajuato city lies 300 km North-West of the federal capital. Its agreement with the La Purísima Irrigation Module started as a flood prevention scheme (Map 2.7). La Purísima irrigation module is part of Irrigation District 011 Alto Río Lerma, and is located downstrean of the reservoir La Purísima reservoir was built to protect the downstream city of Irapuato, ten years after it suffered a flooding and five years after the establishment of the irrigation module.
The cropping pattern in the irrigation project has not changed since the time when farmers diverted water directly from the Guanajuato River. Initially the reservoir received both the rainfed streamflows from the upper catchment and the untreated wastewaters from the city of Guanjuato. Recently it has been impounding partially treated effluent from Guanajuato City. Presently, about 43% of this effluent is treated and this was planned to rise to 90% by 2009.
TABLE 2.6Additional water availability in Tula Valley due to reclaimed wastewaters
Origin Water availability
Mm3/yr
Surface water Ground water
Natural streamflow 400.5 —
Natural recharge — 268.5
Import of waste waters 1 368.7 —
Incidental recharge — 788.0
Total 1 769.2 1 056.5

Chapter 2 - A regional perspective: introduction to the case studies from Sapin & Mexico 39
The WWTP built in 2002 treats Guanajuato City wastewater and the residual waters of metropolitan areas located upstream. The plant discharges around 4.3 Mm3/yr to the Guanajuato River. The first phase of a second treatment plant is due for completion imminently, which will have a treatment capacity of 3.15 Mm3/yr. Plans for the second phase of this plant would add another 3.15 Mm3/yr of treated discharges. With the completion of the whole project, the volume of treated effluent would amount to about 10.7 Mm3/yr, more than 90% of the wastewater of Guanajuato city and metropolitan areas projected for 2010.
MAP 2.7Irrigation Units Downstream Guanajuato City

The Wealth of Waste: The economics of wastewater use in agriculture40
This volume of water would support about 1 070 ha of grain farming using furrow irrigation. The La Purísima irrigation module has water rights for 25.2 Mm3/yr to service an area of around 4 000 hectares. From La Purisima reservoir’s total capacity of 195.7 Mm3, 85.7 Mm3 is reserved for flood control, and its active capacity is limited to 110 Mm3. From this storage volume, 25 Mm3 is reserved for sediments (dead capacity), leaving only 85 Mm3 for irrigation purposes. The water source for La Purísima irrigation module is the water stored at La Purísima reservoir, whether it comes from rainfed streamflows, agricultural return flows or municipal wastewater, treated or untreated.
At La Purísima Module the main crops are wheat (83%), barley (11%) and tomatillo (4%). However, there is a trend to reduce wheat in favour of barley, which needs less water. The main irrigation channel has enough potential energy to enable sprinkler irrigation or even to produce hydropower with minicentrals. All the water used at La Purísima Module is from surface sources.
In this case, as in the Tula Valley situation, the “win-win” potential consists of the benefits to farmers from the use of nutrient-laden wastewater, and the benefit to the city from being able to dispose of its wastewater in this way. Recycling water for use by farmers does not and would not affect the overall volume of water they receive. Their main concern will be the impact on their operations of receiving a mixture of water with a much higher content of treated effluent from the new WWTP, which would limit any benefits from fertilization. In theory, farmers could receive offsetting gains from the freedom to grow a wider range of crops, with fewer public health hazards. The recent progressive increase in the proportion of wastewater treated in the city is actually reducing the “win-win” range, since the city has decided to incur the cost of treating wastewater however it is disposed, while farmers receive a mixture which could be worth less to them than previously.
As in the Tula Valley, the conditions for a water/wastewater exchange between Guanajuato city and the farmers in La Purisima are absent, for several reasons. Firstly, farmers have no rights to freshwater to exchange with the city – their water comes from the reservoir which contains a mixture of untreated and treated wastewater and water from other sources. Secondly, they have rights to water in the reservoir, whatever its origin and whether the wastewater in it is treated or not. Thirdly, the City has no alternative to returning its wastewater, treated as now required by law, to the river, and cannot deny its use to downstream irrigators.
2.5 DURANGO CITY & GUADELUPE VICTORIA IRRIGATION MODULE2.5.1 BackgroundNegotiations between Durango City (around 800 km north-west of the federal capital) and the Left Margin of the Guadalupe Victoria Irrigation Module (part of Irrigation District 052 in the State of Durango, see Map 2.8) began in response to recurrent droughts, and it has evolved into an arrangement beneficial to both parties. (Map 2.8)
The left margin of the Guadalupe Victoria Irrigation Module, which is adjacent to the city of Durango, had been seeking more water resources by increasing the active capacity of the Guadalupe Victoria reservoir. This was finally accomplished in 2006 with an increase in the height of the spillway crest, allowing storage of an additional 10 Mm3 of water. Prior to that, the irrigators had an arrangement to use the city’s treated wastewater from a WWTP that started operations in 1995. In 2000 an inter-connector pipe was built from the aerated lagoons of the WWTP to the left margin main channel flowing from Guadalupe Victoria reservoir.

Chapter 2 - A regional perspective: introduction to the case studies from Sapin & Mexico 41
At the present time, consideration is being given to the possibility of Durango city acquiring rights to the clear surface waters originally granted as a concession to irrigated agriculture in exchange for reclaimed water to be used by the farmers. Such an exchange of water use rights would have several benefits: the aquifer would cease to be overexploited; the municipality would get water of a good quality at a smaller cost; energy would be saved in reduced pumping of the aquifer; and the irrigators would receive some biodegradable nutrient loads for their crops.
2.5.2 Site featuresIrrigation District 052 in the State of Durango has a command area of 18 504 ha and water use rights for 134 383 Mm3/yr. The Guadalupe Victoria irrigation module adjacent to Durango City has a command area of 9 399.75 ha, about 2 775 in the leftmargin and 6 625 in the right margin. The left margin, with 504 irrigators, is the closest part of the irrigation module to Durango City. The source of water for the left margin is the Guadalupe Victoria reservoir via the left and right margin channels. In addition, there are 167 farmers on 663 ha with precarious unofficial rights receiving the irrigation service only when there are water surpluses. This study is limited to the left margin side of the irrigation module, as this is the only one using residual water and in a position to exchange its rights with Durango City.
MAP 2.8Durango City and Guadalupe Victoria Irrigation Module

The Wealth of Waste: The economics of wastewater use in agriculture42
The left margin has water rights for 63.259 Mm3/yr, coming from Tunal River streamflows and stored at Guadalupe Victoria reservoir. This reservoir was built in 1962 with a nominal capacity of 80 Mm3 , and an active capacity of 65 Mm3 . In 2006, the total capacity was increased to 93 Mm3, of which 11.9 Mm3 is earmarked for flood control, and 4 Mm3 is dead capacity, leaving 77.1 Mm3 as active capacity.
The city of Durango has a population of about 526 700, and its drinking water is provided from an assignment of 61.3 Mm3/yr of groundwater. The city is entitled to discharge 48.25 Mm3/yr of wastewater effluent to the Sauceda and Durango rivers. Its aquifer is becoming seriously depleted: some decades ago the 76 wells drilled at the Guadiana Valley were pumping at a depth of 30 to 40 meters; whereas, now pumping is at depths of 100 to 120 meters, and at that depth the water has larger salt and mineral concentrations. It is estimated that the aquifer depletion rate is of the order of 30 centimeters per year, and the current overdraft is 34.91 Mm3/yr.
The main crops produced in the Guadalupe Victoria Irrigation Module are corn, 56%, sorghum, 18%, beans, 13%, alfalfa, 8%, and oats, 5%. Although the 63 Mm3/yr of surface water concession is enough for about 6 000 ha sown with basic grains using furrow irrigation, there have been some periods of water scarcity which have led farmers to use effluent from the city of Durango.
In January, 1998, Durango City water and wastewater utility started operating an aerated lagoon WWTP with a capacity of 63.1 Mm3/yr which has been treating on average 48.25 Mm3/yr. The plant, with six lagoons of 200 x 100 x 4.5 m and one reservoir of 400 x 300 x 1.5 m, has the capacity to give primary treatment to all the water used for municipal purposes in Durango City and to furnish about 76.3% of the water requirements or the adjacent irrigated areas.
In 2000 an inter-connector pipeline was built between the WWTP and the left principal channel from the Guadalupe Victoria reservoir to convey about 10 Mm3/yr of the treated wastewater to the irrigation module. This was the subject of an informal agreement between the municipal utility and the farmers of Guadalupe Victoria irrigation module2. At present, it is estimated that the Guadalupe Victoria irrigation module uses around 14 to 18 Mm3/yr of the reclaimed water from the city, which is more than the amount stipulated in the agreement.
2.5.3 Scope for intersectoral water exchangesThe Guadalupe Victoria irrigation module currently uses water from various sources: freshwater from the Guadalupe Victoria reservoir, groundwater from the Guadiana Valley aquifer, treated effluent from Durango City, and untreated urban wastewater diverted from the Acequia Grande creek. The water quality both from the WWTP and the Acequia Grande creek exceeds the amount of fecal coliforms allowed by the Mexican Official Norm (NOM-001-ECOL-1996) for the discharge of effluent to freshwater bodies. But they are within the limits allowed by NOM-002-ECOL-1996 applying to forage and long stalk crops, and even for grasses, provided there is an interval between irrigation and grazing of 14 to 20 days. The BOD of the WWTP effluent (between 50 and 90 mg/l) is well within the norm of 150 mg/l. The municipality of Durango is planning the construction of a second WWTP in the southern part of the city.
One possible scenario is to use part of the surface water stored at Guadalupe Victoria reservoir to supply municipal requirements, avoiding the current over-exploitation of the Guadiana Valley aquifer. At present the city’s assignment of water for drinking purposes (61.292 Mm3/yr) accounts for practically the whole of the aquifer’s annual
2 The legal standing of this agreement is unclear: the constitutional powers of the municipality to award a concession of this type is uncertain, and it was done in the absence of approval from the National Water Commission.

Chapter 2 - A regional perspective: introduction to the case studies from Sapin & Mexico 43
recharge. The situation would be eased by an agreement to cover at least 10 Mm3/yrof drinking water requirements with the surface streamflows stored at the Guadalupe Victoria reservoir, and to supply at least 10 Mm3/yr of treated urban residual waters to the Guadalupe Victoria irrigation module. The city would keep a small number of wells (10-15) for industrial use.
From the farmers’ viewpoint, the use of reclaimed water has enabled increases (up to 30%) in the production of corn, alfalfa and oats compared to the alternative, with a saving of up to 50% in the cost of fertilizer. This indicates the scale of potential farmers’ benefits from the arrangement. However, the Durango water utility’s attempts to recover its treatment costs from the farmers (estimated to be $320 000/month) have not been agreed. Two difficulties have arisen. Firstly, there is no proper legal basis for charging agriculture users since the city has to treat its wastewaters whether they are used subsequently or not. Secondly, there is no feasible alternative outlet for the effluent since Durango City cannot divert the natural course of the river, nor withhold residual waters nor grant water use rights to anyone anywhere. (In the latter context, an approach to a thermal power plant in the region with a view to its use of the wastewater for cooling purposes has not borne fruit).
MAP 2.9Network between Blanes desalination plant and water supplier in Tordera Delta

The Wealth of Waste: The economics of wastewater use in agriculture44
2.5.4 Longer term prospects The current arrangement described above involves a limited use of effluent by farmers, subject to an informal agreement for 10 Mm3/yr, though in practice running at more than this. However, in the long run, a feasible arrangement may be to cover practically all the water required by both parties, whereby all municipal water would be supplied from the reservoir and all the reclaimed water would be used in irrigated agriculture. As noted, the full Guadalupe Victoria irrigation module has a surface freshwater concession of 63.259 Mm3/yr and the city of Durango a ground water assignment of 61.292 Mm3/yr.
The second WWTP now being planned would increase the available volume of wastewater. The inter-connector pipeline would need to be enlarged and extended to serve the entire command area of the Guadalupe Victoria irrigation module comprising 9 399 ha, and a regulation pond would also be required. The scope for recovering any of these costs from farmers is not expected since the City is legally required to cover the costs of sanitation.
In a longer term perspective, there is scope to increase the efficiency of water use in irrigation through drip irrigation, sprinklers, the use of centre- pivot or lateral- move systems and other methods. The greater use of greenhouses and changes in the cropping pattern would bring benefits to farmers and ease their adjustment to growing food under water scarcity conditions and competition for water use.
2.6 CONCLUDING OVERVIEW OF CASE STUDIESTable 2.7 offers an overview of the five case studies, with a preliminary assessment of their potential for the reuse of treated effluent in agriculture, and the likelihood of farmers trading their existing rights for freshwater in exchange for recycled water.
Motives and concerns. Growing water scarcity is a concern in three of the sites, pollution of rivers in three and aquifer stress in four. Public health issues have not, however, been prominent, apart from an isolated episode in the Tula Valley in 1991.
Current usage of recycled water. In the Spanish cases, effluent is only used in agriculture during drought years, diluted with groundwater. However, it is used indirectly through aquifer recharge. In the Mexican cases, untreated effluent is used on a large scale in the Tula Valley, and treated wastewater is used (in one case diluted) in the other two sites.
Availability of recycled water for further reuse. All the sites are increasing their capacity for recycling water. Some have recently added capacity, others have new capacity either actively planned or under implementation.
Degree of wastewater treatment. Both the Spanish sites treat to tertiary level (with the exception of one WWTP which treats to secondary level), in compliance with EU directives. Mexico City’s current programme of investment in WWTPs is based on tertiary treatment,3 whereas Durango currently treats to primary and Guanaguato to secondary levels.
Feasibility of effluent reuse in agriculture.4 This refers to any technical, legal, or public health reasons affecting effluent reuse including the availability of infrastructure to convey effluent to the targeted users. Effluent reuse in agriculture seems to be feasible in all the sites subject to any produce restrictions of operational conditions required for public health and environmental reasons.
3 used indirectly in Gava Viladecans for aquifer recharge4 At present about 12% of the collected wastewater is treated (139Mm3/yr), of which 31 is re-used in aquifer
recharge, 26 in watering green areas, 25 for filling lakes, 23 for irrigation within city boundaries, 11 in industry, 7 in commerce and 16 is lost to leakage.

Chapter 2 - A regional perspective: introduction to the case studies from Sapin & Mexico 45
5Potential for the intersectoral exchange of freshwater rights for recycled water.All 6the sites have the potential (in some cases already realised) for “win-win” arrangements between cities, farmers and the environment involving the use of reclaimed water. Concerning the specific issue of the exchange of farmers’ freshwater rights for reclaimed water from the cities, the situation sketched in this chapter is highly varied. In the Spanish cases, recycled water reuse has stronger prospects for environmental purposes than directly for agriculture, although there is some scope for the latter. In Mexico the potential for an exchange is clearest in Durango. In the other two cases, farmers already make extensive use of recycled water, in one case mixed with water from other sources. This arrangement will continue to be part of the two cities’ wastewater treatment and disposal plans, which they are legally obliged to do, and which confers continuing benefits to farmers.
TABLE 2.7Overview of case studies
Llobregat Tordera Delta Mexico City/Tula V.
Guanajuato Durango
Motives & concerns:
water shortages
pollution of rivers
aquifer stress
public health
Yes
Yes
Yes
-
Yes
-
Yes
-
No
Yes
Yes
No
Yes-
Yes
-
-
Yes
-
Yes
-
Current usage of effluent for:
agriculture
environment/aquifer
other (e.g. golf)
Emergencyonly4
High
-
Minimal
Some
Some
High
Some
-
High (diluted)
-
-
Some
-
-
Availability of effluent
(high, low, none)
High (planned) High High Rising Rising
Degree of wastewater treatment (untreated=0, primary = 1, secondary =2, tertiary =3)
3 (2 in G-V) 3 0* (but heavy investmentin treatment planned)
2 1
Feasibility (technical, legal, health) of effluent reuse in agriculture.
High High High High High
Potential for inter-sectoral exchange of water rights between cities and:
agriculture
environment
other
Some
High
-
Some
High
-
Some
Some
Some
Low
Low
Low
High
Some
-
n.b.further explanation of categories and entries in text * 12% is 3

47
Chapter 3
An economic methodology for assessing the feasibility of using recycled water in agriculture
It is assumed that readers of this Chapter have some familiarity with elementary cost-benefit analysis (CBA), as used by applied economists, municipal and civil engineers, agronomists, public health specialists, and professionals from other disciplines relevant to the topic of this report. It may also be used by such readers better to understand or assess the technical merit of studies that are done by others, rather than actually carrying out such studies themselves.
The Chapter does not start from scratch, but explains those specific features of CBA relevant to the topic of this report, and some potentially difficult issues in its application. To the maximum extent possible, the text uses simple and clear language, avoids jargon and all unnecessary mathematical notation.
Further guidance on specific aspects of CBA can be found in the Appendix to this chapter, to which references are made in brackets (e.g. 3A3) in the main text.
3.1 INTRODUCTION: A THREE-FOLD APPROACHProposals to use recycled water in agriculture or for other purposes need to be economically justified, cost-effective and financially feasible. This chapter explains how these three criteria can be applied in practice.
The economic justification will be carried out using a framework of cost-benefit analysis from the standpoint of an agency acting in the overall public interest and applying the principles of Integrated Water Resource Management (IWRM). Such a hypothetical agency could be a national Ministry of Planning or a regional water authority1, concerned whether the project was “worth doing” on national cost-benefit grounds. In many key respects this perspective coincides with a watershed viewpoint, since it considers the water cycle in its entirety and aims to optimise the use of water for all major purposes – human household needs, agricultural irrigation, navigation, flood control, industrial use, hydropower, wildlife and the various other environmental demands, consistent with IWRM.
The report takes a particular segment of this spectrum, namely, wastewater generated by urban users which is available for treatment and recycling to farmers, or for releasing into the natural environment (for aquifer recharge, river and wetland replenishment, creating a hydraulic barrier to coastal saline intrusion, etc.). The principles explained in this chapter could equally be used in the analysis of projects at other points or other users in the water cycle, such as recycling irrigation effluent back into agriculture, or reusing urban wastewater for further urban or industrial purposes, etc.
1 Sub-national institutions may be “captured” by local, regional, sectoral or other sectional interests and hence may not fully embody the “national interest”. In both the countries represented by the case studies – Spain and Mexico – the regions are autonomous and have considerable powers vis-a-vis other regions and central government. In both countries water is an issue guaranteed to arouse strong regional feelings. This will be an important consideration for the assessment of financial feasibility, but the assumption of “national interest” remains a crucial part of the economic justification, especially where central government or external funding is involved.

The Wealth of Waste: The economics of wastewater use in agriculture48
Once a scheme can be demonstrated to be worth doing, on the grounds that its benefits exceed its costs, the next step is to establish that it is cost-effective – that it achieves its objectives at minimum costs2. This entails an analysis of the preferred project in comparison with other, alternative, methods of meeting the objectives. A number of the case studies examined in this report (Chapters 2 and 4) demonstrate the cost superiority of the preferred project in relation to the next best alternative, and present the result as an avoided cost of the preferred project.3
The final hurdle for the preferred project, once it can be shown to be worth doing and cost-effective, is to considering its financial feasibility. This takes the analysis into a different realm, in which the narrower sectional interests of various stakeholder groups are considered. Its main elements are:
Assessment of the project’s impact on the financial status of key stakeholders: central government, regional water boards, municipal utilities, farmers etc., including identification of the main gainers and losers, with estimates of their gain/loss. It should include an estimation of the financial implications of the project for public capital and recurrent budgets. This part of the analysis provides a basis for understanding the incentives of crucial stakeholders – especially farmers - to support, or resist, the project.Proposals for financial instruments and transfers to create equitable conditions to make the project acceptable, and to provide suitable incentives for its major stakeholders. This would include an assessment of the scope and modalities for water charges, other financial levies or, conversely, subsidies, and innovative financial mechanisms such as payments for environmental services for farmers or other stakeholders. Finally, considering the above, proposals should be made for funding the project, considering the various sources available, and the most appropriate solution for the case in question.
3.2 ECONOMIC APPRAISAL: COST-BENEFIT ANALYSIS (CBA)The economic appraisal (EA) of projects is a tool for making choice in the allocation of scarce resources. It is a method of systematically assessing and comparing proposals4
using objective and rational criteria. It can apply to a single and well-defined act of investment (a project), a group or series of projects (an investment programme) or even a policy or piece of legislation. It can also be used to justify specific items of recurrent spending. The pre-conditions for the use of EA are that the proposal should be coherent, have clear boundaries, its effects should be identifiable, and the bulk of costs and benefits should be quantifiable and capable of valuation.
Most kinds of EA use a cost-benefit framework. As the name implies, this identifies and compares the costs and benefits expected from the proposal and provides a decision rule – benefits should exceed costs – and a criterion for comparing and ranking proposals – the size of net benefits (Net Present Value). The latter can also be expressed as a Benefit-Cost Ratio.
CBA rests on certain basic concepts:There are always alternatives. The analyst should ensure that other solutions have been considered and that the proposal under scrutiny is the best available. The proposal should be the most effective in achieving the aims of the project, and/or the most feasible (e.g. practical, timely, acceptable), as well as being
2 Or costs that are acceptable or affordable to the public3 Note in this context that avoided cost is only a valid criterion if the preferred project is worth doing in
the first place. If it fails on CBA grounds, avoided cost is irrelevant.4 In the remainder of this Guide, the terms proposals, projects and investments can be used
interchangeably.

Chapter 3 - An economic methodology for assessing the feasibility of using recycled water in agriculture 49
the most cost-effective of options available. Ideally, the CBA will analyse the alternative options and produce a ranking based on their respective net benefits. Where this is not feasible – in the common case of a yes/no decision on a single project – some preliminary consideration should have been given to the obvious alternatives (see below).Do nothing is one option to be considered. The net costs and benefits of the proposal should be carefully compared to the effects of “doing nothing”. This may mean literally what it says, but it is more likely to involve some minimum level of activity or a continuation along the current trajectory - “business as usual”. The without project scenario provides the benchmark against which the project is judged. If this scenario is badly drawn the case for the project will be flawed.Resources used in the project normally have alternative uses. They should be valued at their opportunity cost, which is their value to society in their best alternative use. Even currently unemployed resources, such as idle land or temporarily unemployed workers, have a positive opportunity cost taking a longer view. CBA is a quantitative decision tool. Costs and benefits should be quantified as far as is feasible. They should be expressed in common units to achieve rigour, objectivity and consistency. Not all costs and benefits can be quantified or valued, and the presentation of results should be very clear about unquantified items and their importance, which may be decisive. This applies particularly to environmental amenity and public health impacts. The treatment of time is an integral feature of CBA, especially for assets with long lives, and/or streams of benefits and costs extending well into the future, such as irrigation systems, WWTPs and other items of water infrastructure. The timing of costs and benefits, and how these streams compare, is crucial information. Hence the use of discounting, which reflects both society’s time preference and what the capital employed in the project could earn in alternative uses.
The standpoint adopted in this report is that of an agency providing integrated water services to a variety of users (including the environment), as opposed to that of an operator of a stand-alone facility. This agency will be concerned with the impact of a new investment on its total operations, rather than on the cash flow of facilities considered in isolation. The total benefit from using recycled water will vary in each situation, but will usually be a mixture of avoided costs and new benefits5.
In principle, in a situation of static demand, all benefits will consist of avoided costs,namely, savings in the cost of supplying a given demand. Where, conversely, demand for water is on an increasing trend, the reuse of treated wastewater enables freshwater to be exchanged for use in new purposes – by municipalities, industry, the expansion of irrigated farming, or for various environmental purposes. These are new benefits.
Where there is growing demand for water, aquifer depletion, or growing environmental “water deficits” – typified by all the case studies in this report – it is very likely that fresh water “released” or exchanged by reuse projects will be used for other purposes6. Thus the more common situation is where benefits consist of a mixture of avoided cost and new benefits. The balance between types of benefit, and the size of each, depends on the assumptions made about the growth in demand for water in these various uses.
5 An avoided cost is treated as a benefit6 Even if no conscious decision for conservation is made, less abstraction of water from surface bodies or
groundwater will increase the retention of water in aquifers, or increase river levels. These effects could create environmental benefits.

The Wealth of Waste: The economics of wastewater use in agriculture50
3.2.1 Benefits (see also 3A6)7The major types of benefit that can be expected from the reuse of treated wastewater are:
The avoided cost of abstraction, transmission, treatment, and distribution of fresh water. These avoided costs include both capital and recurrent cost items, divided between public authorities responsible for the delivery of water to irrigators’ fields, and the farmers (or their organisations) where they abstract or pump their own supplies. Farmers may avoid the costs of groundwater pumping – where they take recycled water instead – though they may still need some pumping to operate their irrigation devices such as drips. Farmers may also benefit from pumping at shallower depths – where the water is used to recharge the aquifer.Savings in the cost of fertilizer due to the nutrient content of wastewater.Organic matter, nitrogen and phosphorus left in wastewater has been shown to be beneficial to the productivity of crops, and saves some of the cost of artificial fertilizer8. These benefits will be reduced from higher standards of treatment that removes some of these nutrients. Not all the nutrient present may be used by the crop, and there may also be long term detrimental effects related to soil salinity and heavy metals from the presence of certain elements in the effluent, which should be recorded on the cost side of the balance (see below).Savings in the cost of wastewater treatment if nutrients are left in the effluent. (This benefit depends on the quality of the wastewater and the pre-existing level of treatment: in other situations, it may be necessary to increase the level of treatment in order to make it acceptable for reuse).The greater reliability of reused wastewater, compared to supplies obtained from other sources. This cannot be guaranteed in every case (a shortage of freshwater in a drought will reduce the volume of wastewater available) but where it does arise, a proxy estimate for reliability might be the avoided cost of water storage as insurance, or the avoided losses from reduced harvests. Environmental benefits from reduced abstraction from rivers or aquifers, or from point source pollution of rivers and coastal systems from the effluent of wastewater treatment plants. (In many countries untreated or partially-treated effluent from WWTPs is the largest polluter of downstream waters). If the use of reclaimed water requires treatment to a higher level than would otherwise be done, it is justifiable to credit some environmental benefit to offset the extra cost of treatment. But if the extra treatment merely raises the standard of effluent to that required by national or regional (e.g. European Union) legislation, the environmental benefits from higher wastewater treatment cannot legitimately be credited to the project.
3.2.2 Costs (see also 3A5)The typical costs involved in these projects are:
Capital costs entailed in treatment of the wastewater (either to secondary or tertiary level), involving adjustments to an existing WWTP or the installation of a new unit. Where an existing WWTP which theoretically has the appropriate capacity is not working effectively, repair and restitution may be necessary. Recurring operational or routine maintenance costs of operating treatment facilities (typically, power, chemicals, labour, raw materials, etc.). It should be recalled that some recent state-of-the-art facilities have a high degree of energy
7 See also, Hussain et. al. (2001 and 2002)8 Molden (2007) reports research results in Mexico and Pakistan (pp 438, 439)

Chapter 3 - An economic methodology for assessing the feasibility of using recycled water in agriculture 51
recycling (e.g. from burning the methane by-product for energy) which has the effect of lowering (and in extreme cases eliminating) the net cost of operating wastewater treatment works.Installation of new infrastructure for distributing the treated effluent from the WWTP to the irrigation areas (pipes, tanks, reservoirs, pumps, etc.) and recurring costs entailed (power for pumping, cleaning, etc.).Cost of produce restrictions – farmers’ loss of income due to any restrictions on the type of crops they can irrigate with the effluent.Any longer term effect on soil structure and fertility from elements in the effluent which are not dealt with at the treatment stage (e.g. by desalination to control salinity), which diminish farmers’ future incomes.Costs of other public health measures entailed in handling and using treated effluent (e.g. public information, and the extra monitoring entailed, which could be onerous in some countries). It is simplest to assume that produce restrictions and public health measures successfully eliminate public health risk. Otherwise, it will be necessary to estimate public health costs directly (see next item).Residual public health costs from the reuse of effluent, after all other produce restrictions and public health and safety measures. A common approach is to estimate the probable increase in DALYs9 due to this project and find some means of valuing these (see section 3.2.3. and 3A4 in the appendix to this chapter).Environmental costs, e.g. from reduced dilution of rivers and other water bodies due to the diversion of effluent to irrigators. Although wastewater reuse has a number of environmental benefits, which would predominate over costs in many cases, the interruption of the water cycle that it entails could cause harm to aquatic habitats and the morphology of rivers and coastal waters if the volume is high. These effects are highly site-specific. For guidance on the valuation of these costs see 3.2.3. and 3A3 in the appendix to this chapter.
The analysis should indicate the distribution of the above costs between the main stakeholders - farmers, water utilities, local governments, regional water authorities, etc. In theory, the existence of a net benefit enables the gainers from a project to compensate the losers, though in reality it can be difficult to design and implement compensation mechanisms. Even so, it is important to identify where costs fall in relation to benefits.
3.2.3 Some practical steps for the use of CBA or Cost-Effective Analysis (CEA) in effluent reuse projectsData for the abovementioned benefits and costs should be compiled and entered in the analysis in the following sequence, depending on whether CBA or CEA is chosen as the decision criterion.
CBA consists of:estimating all the costs and benefits attributable to a project, as in sections 3.2.1 and 3.2.2 above, and applying the appropriate valuation method (see below); adjusting market values to produce economic values and expressing values in common currency units and constant prices;allocating costs and benefits to each year of the project and producing a net sum for each year (positive or negative); discounting the annual flows by an appropriate discount rate to produce a net
present value (see also 3A7);justifying the project by the appropriate decision rule – positive net present value or Benefit-Cost Ratio.
9 Disability-Adjusted Life Years

The Wealth of Waste: The economics of wastewater use in agriculture52
CEA involves:defining the objective of the project expressed in quantitative terms (e.g.delivering an extra x m3 per day to farmers, urban households, etc.; identifying the possible options for achieving the above objectives and producing a short list of preferred alternatives;estimating the costs of the various options using the categories in section 3.2.2.; andchoosing the one with the least (discounted) total cost of achieving the particular objective. The total cost can be divided by the output or physical quantities involved in the project, where this is feasible (e.g. volume of effluent, or freshwater exchanged) to produce a cost per unit.
This section discusses some of the important practical issues involved in conducting CBA and CEA in this sector. A fuller and more detailed account can be found in the appendix to this chapter.
Determining economic values (see also 3A1)Prices found in markets and actually paid by farmers, households, governments, etc. are often a misleading guide to the underlying economic values of the goods and services involved. In broad terms, the value of an output is measured by what buyers are willing to pay for it, while the value of an input to production is its opportunitycost to other members of society. (Its value in the next best alternative use - what other potential users forfeit from its use for the purpose in question).
The prices of outputs and inputs used in effluent reuse projects may be distorted by taxes, subsidies, quotas, monopoly power, controls and other factors which cause actual prices to diverge from their economic levels as defined above. Distortions are common in agriculture, where crop prices can be fixed above or below prevailing free market levels, while inputs of equipment, supplies, irrigation water and electricity (for pumping) may be subsidized in various ways. In these circumstances, farmers’ net incomes can be an unreliable indicator of a project’s economic justification in national CBA terms. In principle, unsubsidized free-market prices should be applied to all major outputs and inputs of agriculture.
Likewise, for the increased use of water by urban and industrial consumers, the household price of water is typically less than its economic cost of supply. It is often also lower than people’s willingness to pay for it, where this has been surveyed. The nominal tariff for water, or alternatively the average revenue received per unit sold10, can be taken as a minimum value of water for urban use. Where this is evidently too low, some upward adjustment can be made for appraisal purposes, using other national or international yardsticks. The same applies to water sold for industrial use, though this is less likely to be subsidized, and is often a source of cross-subsidy to households and institutional users.
Taxes, subsidies & transfer payments (see also 3A2)Values should exclude taxes, subsidies and other transfer payments on the grounds that, for the nation as a whole, they are merely transfer payments between different groups. These transfers do not represent real scarcity values – on the contrary they may disguise the true opportunity cost of the item. Income and corporate taxes should be excluded from the analysis, as well as major indirect taxes affecting the project (e.g. export taxes, import tariffs, excise taxes) and subsidies and other transfers between citizens and the state. Charges and duties that represent payment for actual services (e.g. the cost
10 This will be higher or lower than the nominal tariff, depending on the net effect of illegal connections, inefficient billing, corruption of meter readers, etc.

Chapter 3 - An economic methodology for assessing the feasibility of using recycled water in agriculture 53
of recycling projects), as well as benefits corresponding to services rendered, should, on the other hand, be included as costs and benefits, respectively. Pollution taxes (e.g.those paid by farmers for non-point pollution, or by municipal wastewater treatment plants for effluent discharge) can be regarded as a proxy for environmental damage, in which case they should be entered as a real cost or (where they are avoided through a reuse scheme) an avoided cost (= benefit).
Inflation and constant pricesThe analysis should be conducted in constant prices, normally those of the year in which the study is carried out. Predicting price inflation more than 1-2 years ahead is difficult11 and errors continued over a period of years would cause the results of the analysis to become seriously distorted. Using constant prices is equivalent to assuming that future inflation will have a neutral impact on the main cost and benefit items concerned (i.e. relative values will be unchanged). If, on the contrary, there are good reasons to believe that the relative value of an important item will change (e.g. the international price of a key commodity such as oil, or the future cost of desalination due to technical advances) this can be factored in. It would also be prudent to include this in the sensitivity analysis.
Discounting & the choice of discount rate (see also 3A7)The use of discounting in CBA, especially for long-lived infrastructure projects with major social and environmental impacts, such as effluent reuse projects, has attracted a great deal of discussion and controversy. This is partly an issue of the discount rate chosen, but more fundamentally because the discount rate performs several different, and often incompatible, purposes, which do not necessarily imply the same rate. The difficult issues involved are discussed further in the appendix to this chapter. Briefly, discounting can serve any or all of the following purposes:
A reflection of the rate of social time preference (STP) expressed by governments for the present over the future. The STP reflects the trade-off between the future benefits from public investments and the present sacrifices necessary to make these investments. A reminder of the opportunity cost (OC) of capital used in the project (what it could earn if used for other purposes).A capital rationing device to apportion the available capital investment budget over the most attractive bunch of projects. This may be referred to as the “market-clearing” rate.A practical measure for comparing projects with different time profiles of costs and benefits. By converting (i.e. discounting) the costs and benefits from alternative reuse projects arising at different times in the future into present values the net present value (NPV) of each of the projects can be determined.
Governments have to choose a middle course between setting a rate that is too low, and one that is too high. The dangers of setting the discount rate too low (or even at zero) are: encouragement of capital-intensive projects, a particular concern in countries with capital shortages and labour surpluses; encouragement of a higher pace of investment in less productive schemes (those that would not pass a higher threshold rate of return); the risk of a sub-optimal allocation of scarce capital; and failure to reflect the high premium on short-term costs and benefits of poor communities with an uncertain future.
11 For highly developed financial markets expectations of future inflation can be inferred from the difference between the rate of interest offered by long term bonds and that of bonds indexed to inflation.
The Wealth of Waste: The economics of wastewater use in agriculture54
On the other hand, the disadvantages of setting rates too high include: possible discouragement of productive investment; minimizing the long term impacts of both costs and benefits of projects12; hastening the rate of exploitation of renewable natural resources; a stimulus to an exploitative rather than conservationist approach; and disregarding the interests of future generations.
Many Governments set their own target discount rates for selecting public investment projects and, where these exist, they should be used in CBA analyses– though with an appreciation of the different purposes they serve, and the compromises that are involved in their estimation13. Where standard public sector discount rates are not available, analysts will have to select their own, bearing in mind that discount rates should be in real terms and risk-free, and that rates based on social time preference are likely to give lower rates than those influenced by opportunity cost and market-clearing criteria.
Projects of a type, or in a sector, that would be seriously disadvantaged by the use of the chosen discount rate should be considered for special appraisal (e.g. for environmental projects, using the various ways of reckoning non-market costs and benefits14).
Choice of analysis period The technical or physical life of a project is the number of years over which it can go on producing its expected output, with reasonable maintenance and the occasional essential repair. Many water infrastructure assets have a physical life measured in decades (even centuries).
There are two ways of dealing with maintenance in a CBA. The first is to include in annual costs all the maintenance, repairs, minor replacements, etc. needed to keep the project generating its designed level of benefits for an indefinite future. The project should then have a residual value at the end of its economic life, which is credited as a future benefit of the project. The residual value may arise either as future net benefit potential, or as scrap value, or as second hand value. The second approach is to build in obsolescence, with minimum recurrent costs, with a scenario involving zero residual value at the end of the project’s life.
But the economic life is the period relevant to employment of the capital in question, which is often much shorter than the physical life of the asset. The economic life is influenced by the level of the discount rate: at 10%, a benefit or cost stream loses half its value after 7 years, and at this rate there is little point in extending the analysis beyond 15 years because future values are so heavily discounted15.
Assessing public health impacts: DALYs and QALYs (see also 3A4)The impact of effluent reuse on public health can enter CBA or CEA in several ways, which commonly start with DALYs or QALYs. The Disability Adjusted Life Year
12 At 10% any impact arising after 15 years would have little effect on the result of a CBA. This would make it difficult to justify projects with long-term benefits, or take adequate account of costs arising in the distant future.
13 The Spanish and Mexican case studies in Chapter 4 use a discount rate of 6%.14 One possible method is equivalent to lowering the discount rate. Where it is judged that environmental
values will rise relative to others, such as the amenity value of an unspoiled landscape in the midst of rapid urbanization or agricultural intensification, it may be justifiable to increase a given benefit stream in real terms over time).
15 If, at the end of the appraisal period, the project’s assets are in reasonable condition and capable of generating further benefits, they can be given a residual value. If the appraisal period is 20 years, an assessment should be made of how many more years’ of physical life the project would have, given adequate maintenance and periodic repairs. The future stream of net benefits, starting in year 21, should be reduced to an NPV (applying the discount factor for year 21), which represents the residual value of the asset. In most cases, discounting will ensure that residual value is not a critical decision factor.

Chapter 3 - An economic methodology for assessing the feasibility of using recycled water in agriculture 55
(DALY) attempts to measure the burden of disease and illness by reflecting the total amount of healthy life lost from all causes, whether from premature mortality or from some degree of disability during a period of time. The Quality Adjusted Life Year (QALY) is the measure more commonly used for health service planning in developed countries. As in the case of the DALY, it multiplies each life year gained with a health intervention by a quality-weighting factor that reflects the person’s quality of life in the health state for that year.
The burden of disease, expressed in DALYs, measures the present value of the future stream of disability-free life lost as a result of death, disease or injury in a particular year. Public health measures would normally produce positive DALYs, while health hazards such as pathogenic viruses in recycled water would score negative DALYs. This approach avoids the direct valuation of health gains and costs, though the comparative weighting of different health states and physical conditions is still controversial.
Information about DALYs or QALYs can be used in CBA or CEA in various ways:i. Different projects, involving, for example, various types and levels of effluent
treatment and/or use limitations score different DALYs. Minimizing the impact of a project on DALYs could be a selection criterion to complement (or even override) other decision criteria.
ii. In assessing public health policy, DALYs and QALYs can indicate the relative effectiveness of different sanitation measures in producing improvement in health per unit of spending. This metric might be applied to the public health measures that would accompany an effluent reuse project.
iii. Complying with a target level of DALYs might be a mandatory criterion for the project, in which case projects could be ranked according to their cost-effectiveness in meeting the DALY criterion. For instance, WHO/FAO guidelines on the safe use of reclaimed water indicate a reference level of “acceptable risk” of 10-6 DALYs.16 Figure 1.4 in section 1.6 illustrates different options for reducing pathogens to the acceptable risk level, each of which would have its own cost tag.
iv. The DALY could be converted into monetary values using the various economic methods for valuing life and health states. These are all controversial (3A4).
Estimation of environmental costs and benefits17
The impact of an effluent reuse project on the natural environment may be difficult to quantify, and even more problematic to express in monetary form. Table 3.1 recaps the various components of the Total Economic Value of a natural resource such as water.
16 See section 1.6 of this report17 further guidance is available in Turner, et. al., (2004), and Hermans et.al. 2006
TABLE 3.1Total Economic Value
Use values Non-use values Other values
Consumptive use Existence value Option value
Recreational, aesthetic & educational use Bequest value Quasi-option value
Distant value use Philanthropic value
Indirect use
*Source: Turner et. al. FAO, 2004 (p. 55)
The Wealth of Waste: The economics of wastewater use in agriculture56
In the category of use values, direct use values arise from direct interaction with water resources, as in consumptive uses (e.g. irrigation) or non-consumptive (swimming, fishing, enjoyment of view). Distant use values arise through enjoyment via the media, such as TV and magazines. Indirect use values do not entail direct interaction with water, and include flood protection from the presence of wetlands, or the use of aquifer recharge to remove pollutants. Non-use and other values depend onethical and altruistic concerns to preserve the functioning resource or ecosystem.
Depending on which of these elements arises, various possible methods exist for estimating its economic value. Some consumptive uses of water, such as farm irrigation and golf course watering, can be valued using impacts on productivity using market prices (adjusted as necessary, as discussed above). But most other values have to be approached using other methods, including the following:
Willingness-to-pay. People affected by the project are asked, through carefully crafted interviews or questionnaires, how much a particular “state of nature” or a change in this is worth to them – what they would be Willing To Pay (WTP) for this. For a change adversely affecting them, they are asked their Willingness-To-Accept compensation18. This method is also known as contingent valuation. In effluent reuse schemes, it can apply to reduced effluent pollution, a higher level of “environmental” river or wetland flows or, conversely, to restrictions on public use of certain land, odours, etc. Discrete choice and choice experiments are a further development of WTP in which respondents are presented with hypothetical choices between options, some of which are monetised, others not. Their valuation of non-monetised options are inferred from the preferences they express. Defensive expenditure and avertive behaviour. Values can be inferred by observing what people actually spend in order to shield themselves from the effects of a particular event (e.g. what farmers spend on buying and storing water to insure against irregular supply).Hedonic pricing infers the values people place on environmental quality by observing what they pay for goods, typically properties, incorporating environmental attributes. This could be used by observing changes in, or the differential values of, land and houses affected –positively and negatively – by reuse projects. However, care should be taken to avoid double-counting of benefits: if the change in land values is due to changes in the incomes of farms due to adoption of the scheme, only one of these methods can be used to estimate the effect. Travel cost. Peoples’ valuation of a (free) natural habitat or local amenity is inferred from the amounts they spend (time, transport) on travelling to the site in question. This estimation method could apply to any effects (positive or negative) on land use, recreation or amenity resulting from a reuse project.Replacement cost and shadow projects. Where a project threatens a valuable site or habitat a budget can be included in the CBA to replace or relocate it. This can be regarded either as a real cost to the project, or as a hypothetical appraisal device to balance against its claimed benefits. A shadow project is one that would fully offset the negative effects of the project under study. (In the USA “wetland banking” requires the sponsor of a project to replace the wetland that will be destroyed by the project by the creation or restoration of another wetland elsewhere).
18 WTP and WTA measures will give different results.

Chapter 3 - An economic methodology for assessing the feasibility of using recycled water in agriculture 57
Decision rulesFollowing the completion of the CBA various criteria can be used, either singly or in combination, to decide whether to proceed. The main decision rules are as follows:
Net present value (NPV). A positive NPV, expressed in currency units, indicates that the net return on the project exceeds the discount rate used. By applying a discount rate the future costs and benefits are converted to present values. A reuse project is economically feasible if the present value of the benefits exceeds that of the costs. A positive NPV is a necessary, but not a sufficient, condition for proceeding – see below.
Internal rate of return (IRR), sometimes referred to as the Economic Internal Rate of Return (EIRR). This is the percent discount rate at which the streams of costs and benefits are equalised. The IRR should be above the discount rate used as a “test” or “cut-off” threshold19.
Benefit-cost ratio (BCR). This expresses the total discounted benefits as a ratio of the total discounted costs (e.g. 1.5:1.0). The difference between the two discounted streams is the same as the NPV, but the BCR has the merit of relating the size of NPV to the scale of resources (costs) being employed on the project. For instance, a large project may have a respectable positive NPV, but three smaller projects might have larger total NPVs and would be a better use of available capital.
The choice of decision rule to use depends on the circumstances of the decision. There are broadly three situations.
A yes-no decision on a single project, using a predetermined threshold indicator (e.g. a test discount rate). All three decision rules will converge on the same result. A project with a positive NPV at the test discount rate will have an IRR greater than this discount rate and a CR greater than 1.0.Choice between mutually exclusive projects (e.g. different sites for a WWTP, different routes for a canal or pipeline for distribution of treated effluent.). The decision rule should be to maximise NPV at the chosen discount rate20.Where a number of projects compete for a limited pool of finance a ranking is needed. The best procedure is to rank projects by descending order of their BCRs.
Other common decision rules are:Least cost option: where the benefits of all alternative projects are the same, the criterion
of choice is the smallest NPV of costs. This is the basic decision rule used in CEA. First Year Rate of Return (FYRR). Where a project satisfies other criteria but where
the timing of the investment is an important part of the decision, the FYRR can be used to determine optimal timing. The FYRR is the benefits of the project in its first year of operation as a percent of total costs, both discounted. If the FYRR is below the discount rate used, the project could advantageously be delayed.
Payback period. This is a common financial rule of thumb: the period over which the initial investment outlay is expected to be fully recovered. It answers the question, “how soon before I can expect to get my money back?,” which will be a legitimate concern of both farmers and municipal utilities and water companies.
Annualized costs and benefits. By using the capital recovery factor (CRF) all the future costs and benefits of a project are converted into present annual figures. The CRF is a factor by which the capital investment at the beginning of a project’s life is multiplied to get an equivalent recovery cost sufficient to repay the present investment
19 In theory, in certain restrictive conditions a project will not have a unique IRR, hence the NPV is more reliable. However, for those accustomed to thinking of rates of return, the IRR is more intelligible.
20 Even if the smaller project has a higher BCR than the larger one- which has a higher NPV. This is somewhat counter-intuitive, but is still a rational use of resources.

The Wealth of Waste: The economics of wastewater use in agriculture58
after the project’s life. By this means, the yearly cost of a reuse project can be compared, for example, with the economic benefit of freshwater released by farmers and conveyed to cities per year.
The assessment and management of risk is an important dimension to the appraisal, and the way it is presented to decision makers (see also 3A8).
Economic appraisal with limited availability of informationThe data requirements of the appraisal methods described above are potentially considerable, calling for resources, time and budgets that may be unrealistic in all circumstances. In these cases there is a place for appraisal methods and decision rules based on short-cut approaches or the application of benefit transfer.
Short-cut approaches effectively by-pass full appraisal if, as a result of preliminary investigation, it appears that the magnitudes of costs or benefits are such that a decision can be taken without further refinement.
Identification of critical variables. The preliminary analysis may indicate what the critical variables would be, pointing to areas of investigation where attention should be focused if resources were scarce or time constraints were pressing. This kind of analysis can be tailored to the risk preferences of key stakeholders, indicating what further information or action is required on those aspects of the project of specific concern.
Benefit transfer is another method of economising on research and analytical resources, by selecting evidence on the topic in question from comparable situations elsewhere. Information can be sought, for instance, on the scale of benefits from wetland restoration, the value of recreational benefits, willingness-to-pay evidence on the value of cleaner rivers with minimum flow levels, WTP for the avoidance of bad smells, etc. A number of databases are maintained by university institutes, national environment agencies and international agencies which can be accessed by practitioners21.
3.3 COST-EFFECTIVENESS ANALYSIS (CEA)CEA is appropriate where the benefits of a project are difficult to value or quantify, and where a number of options are available to achieve the objectives of the project. CEA is also useful where the methodology of benefit estimation is controversial, which is typical of environmental and public health benefits. CEA compares alternative ways of delivering given benefits, such as a specific volume of water demand in municipalities or agriculture.
As noted in the previous section, CEA involves defining the objective of the project in quantitative terms, identifying the options for achieving it, estimating the costs of the various options and choosing the one with the least (discounted) total cost. The total cost can be divided by the output or physical quantities involved in the project, where this is feasible (e.g. volume of water in m3) to produce a cost per unit, which may be more meaningful.22
In a CEA the justification for project A is the cost advantage of reuse compared, let us say, to projects B, C, D and E - alternative options to balance supply and projected demand, such as demand management, desalination, conveyance of water from a distant source, re-lining of distribution channels, etc. CEA avoids the difficulty of estimating use values of water23: as the previous section noted, in CBA water tariffs are often used as a proxy for benefits, but this is very imperfect in view of the widespread under-pricing of water, while the estimation of non-use values (e.g. environmental quality) has challenges of its own.
21 One of the largest is the Environmental Valuation Reference Inventory (EVRI) on www.evri.ca. Also, van Beukering et. al. 1998.
22 Where both the future financial costs and the water volumes are discounted at an appropriate rate.23 See Turner, 2004.

Chapter 3 - An economic methodology for assessing the feasibility of using recycled water in agriculture 59
Problems arise with CEA where different options produce uneven results and are not strictly comparable, e.g. some will over-achieve on the main target but underachieve on important secondary matters. Some options may produce secondary benefits as a side effect. A common situation in recycling projects might arise when a particular level of wastewater treatment and safe disposal is required by law, but different options for doing this have different levels of benefit associated with them. In cases of this kind, elements of both CBA and CEA would be present in the analysis, and the value of benefits could be netted off the costs of each alternative in the choice of the least-cost option. Where it is impossible to ensure identical achievement, options may need to be weighted according to their different impacts, which complicate the use of a simple CEA metric.
3.4. FINANCIAL FEASIBILITY3.4.1 Financial impact on key stakeholdersThe analysis should start from an assessment of the project’s impact on the financial status of key stakeholders: central government, regional water boards, municipal utilities, farmers, etc., including identification of the main gainers and losers, with estimates of their gain/loss. It should include an estimation of the financial implications of the project for public capital and recurrent budgets. This part of the analysis provides a basis for understanding the incentives of crucial stakeholders, especially farmers, to support, or resist, the project.
Central governmentDepending on where the national constitutional responsibility falls, the financial implications of major water infrastructure projects may fall to central government. In this case, responsibility for arranging funding, charges and subsidies to farmers, and financial support to local water providers (e.g. covering deficits of local utilities) will be governmental issues. Where there are international implications (e.g. for the EU, the Common Agricultural Policy or the Water Framework Directive) or transboundary issues (e.g. sharing of rivers or aquifers), or where external finance is involved, the central government will also have a financial interest.
Regional water boardsIn the common situation where regional water boards or state governments are delegated the responsibility for major water infrastructure and water services they are likely to be involved in the funding, including cost recovery and fiscal transfers, of projects. In many countries, including Spain and Mexico, any effect on the movement of water between different river basins is highly contentious and sensitive, and its impact on the major regional parties involved needs to be very carefully assessed. There may also be adverse impacts of recycling on downstream water users with financial implications (such as compensation payments).
Municipal utilitiesWater recycling projects would normally have a major impact on the financial situation of utilities. Where there is an exchange of the freshwater rights of farmers for recycled water, there would be a positive impact on cities from the avoided cost of more expensive solutions, possibly in savings on wastewater treatment (depending on local environmental regulations), and extra sales of urban water. On the other hand, the capital and operating costs of any new treatment facilities and distribution systems would fall on the utility in the first instance. The utility may also avoid some pollution charges on effluent from its WWTPs. Its policy on cost recovery from farmers and urban water consumers would be a critical influence on the utility’s finances.

The Wealth of Waste: The economics of wastewater use in agriculture60
FarmersFarmers stand to benefit financially from securing a more reliable supply of irrigation water, containing nutrients which enable them to save some fertilizer costs. They may also avoid some abstraction costs, such as groundwater pumping. On the negative side of the balance, they may have limitations placed on what they can use the water for. The critical issue for farmers is how cost recovery is apportioned. Several case studies show that farmers may well benefit financially from effluent reuse if they do not have to bear the cost of any new treatment facility or distribution infrastructure. However, if these costs are passed onto participating farmers, the latter may lose financially. This analysis has to make some assumption about charges for the effluent in comparison with those for fresh water – which would be a crucial influence on farmers’ uptake.
Table 3.2 depicts a simple matrix illustrating how the financial impact of effluent reuse on the key parties can be presented.
3.4.2 Financial instruments and transfersFollowing on from the above, this part of the analysis should aim to make proposals for financial instruments and transfers to create the equitable conditions for the reuse project to become acceptable, and to provide suitable incentives for its major stakeholders to become fully involved. This would include an assessment of the scope and modalities for water charges, other financial levies, trading schemes, subsidies
TABLE 3.2Financial impact of effluent re-use on major stakeholdersImpacts should be quantified in US $ or Euros, making a distinction between single one-off payments (e.g. capital investments) andrecurrent items occurring annually
Stakeholder Positive impacts Negative impacts Key factors
Centralgovernment
Avoided cost of major inter-state freshwater projects or other new major infrastructure
Initial capital cost of project;Net fiscal cost of transfers and compensation paid to other stakeholders
Delineation of fiscal & financialresponsibilities between different layers of administration; water pricing policy;Access to external funding;Mandatory health & environmental standards (e.g. EU)
Stategovernments,regional water authorities
Revenues from sale of bulk fresh water to cities; Fiscal Revenues from further development of urban and rural areas due to greater water security
Capital funding of schemes & O&M costs;Purchase(*) of effluent from municipal WWTPs;Any fiscal transfers entailed
Division of financial & fiscal responsibilities between central, regional and local governments;Local environmental & public health regulations
Municipal utilities Avoided costs of alternative water solutions;Savings in effluent treatment costs;Extra revenues * fromurban water sales; reduced pollution charges
Capital and operating costs of new facilities and infrastructure;Costs of public health measures & restrictions on amenity
Tariff policy for effluent and fresh water;Apportionment of costs between users and authorities;**
Degree of current and future urban shortages
Farmers Greater reliability of effluent;Savings in abstraction & pumping;Savings in fertiliser; increase in yields and sales revenue
Cost of produce restrictions;Reduced amenity, reflected in price of land
How much of project cost borne by & recovered from farmers;Alternatives available, e.g. own groundwater;Price charged for effluent, compared to that of fresh water;Ability to sell existing water entitlement *;Severity of produce restrictions
* Note that in most European countries, water cannot be sold but the costs could be recovered.** According to EU policy, all costs must be included in final price.

Chapter 3 - An economic methodology for assessing the feasibility of using recycled water in agriculture 61
and innovative financial mechanisms such as payments for environmental services. In principle, farmers should contribute to the costs of reuse projects if they benefit significantly from increased sales revenue and cost savings in pumping conventional resources and/or fertilizer. But from another point of view, economic incentives should be used if necessary to encourage farmers to join recycling projects.
ChargesIf it were decided that the costs of the project would be recovered from farmers, a charge for use of the treated effluent would be the most obvious option. The feasibility of charges would be greater the fewer alternatives farmers have (in some countries peri-urban farmers are accustomed to using effluent for irrigation, and sometimes this is the only option available). A price differential in favour of the effluent would also attract farmers into the scheme.
The feasibility of using irrigation charges for cost recovery is not a straightforward matter, though – in OECD countries at least – rates of cost recovery for O&M are increasing in most countries. The recovery of capital expenditure through tariffs is less common though this is also increasing.24
Outside the OECD, there are greater barriers to imposing, or raising, irrigation charges. However, the present – generally low or even zero – level of charges is the result of specific local social, political and economic factors. In most cases, irrigation charges would need to increase to levels that are politically unfeasible in order to have serious effects on demand. Greater cost recovery from farmers, though often a desirable aim, is easier to bring about within a wider and longer term framework of reform in which farmers have more control over their supplies, greater influence over use of revenues, and a higher standard of service.25
Trading schemesWhere farmers have customary or contractual entitlements to water, water trading may be an option, where they would sell their rights to other users as part of the agreement to take effluent. There are various preconditions for such water markets: trading must be legally permissible; it should be physically feasible in the sense that the new users are accessible and the infrastructure exists to convey the water; the interest of the environment and third parties should be protected; and the transactions costs of trading should not be excessive.
Subsidies to farmersAny subsidies paid to farmers taking wastewater effluent can be justified in several ways.
They can be regarded as a payment for environmental services (PES). Theservices in this case are the reuse of effluent, thereby avoiding the use of fresh surface or ground water, or enabling the recharge of depleted aquifers or restoration of minimum flows in rivers. The precise rationale for the PES, the form it takes, the amount involved, and the source of finance for it, all depend on local factors.26
A separate but related argument for farmers’ subsidy rests on grounds of “fairness”- the case for sharing the financial bounty enjoyed by the regional or urban water authority from the effluent reuse scheme, compared to the withoutproject scenario. Farmers are crucial to making this kind of project happen.
24 OECD: Managing water for all: An OECD perspective on pricing and financing. 2009. pp 138-139.25 F.Molle & J.Berkoff (eds.) Irrigation water pricing: the gap between theory and practice. IWMI/CABI
2007.26 FAO The state of food and agriculture 2007: Paying farmers for environmental services.

The Wealth of Waste: The economics of wastewater use in agriculture62
Compensation for the other market distortions that affect farmers, such as “cheap food” policies that depress farm gate prices, or tariffs on imported machinery and chemical products. This is not, however, a good argument for cheap irrigation water which produces distortions of its own. Farmers may need compensation for any net costs entailed in their use of effluent, such as produce or land use restrictions, or any long term negative effects on the productivity of their land (e.g. from the build up of harmful residues in the soil). These costs need to be offset against the likely fertilization benefits from nutrients present in the effluent. Another factor in some peri-urban farm situations is that competition for fresh water is such that farmers have no alternative to the use of effluent for irrigation.
The simplest form of subsidy would be to provide the effluent free of charge. This would be relatively easy to administer and monitor. Because it would be proportionate to farmers’ use of the effluent, it would also be efficient (creating the right incentive) and equitable between farmers with different rates of uptake. If it were desirable or necessary to go further, subsidies could also be applied to the construction of the infrastructure for conveying and distributing the effluent to farmers’ fields.
3.4.3. Funding the projectFinally, considering the above, proposals should be made for funding the project, considering the various sources available, and the most appropriate solution for the case in question. The broad choices are the following:
Cost recovery from users (charges to farmers, tariffs for other uses of the fresh water exchanged for the effluent);External grants or loans on concessional terms (e.g. from the EU or international environmental funds);Subsidies from central, regional, or local governments for capital and/or recurrent expenses (e.g. in Spain the regional government of Catalunya announced a wastewater reuse programme in 2009 to be funded entirely by the public sector, though some projects will involve joint-financing with municipalities or local water companies; 27
Equity from private users of the effluent (e.g. in the Spanish Tordera Delta a golf course paid for pipes and pumps to convey effluent, and a community of irrigation users financed pipelines, a pumping station and a reservoir);Stand-alone commercial ventures for treating or otherwise acquiring the effluent and selling it to farmers and other users, funded from equity and commercial finance, typically under a concession form of contract. This may involve sizeable investment in WWTPs (e.g. the Mexican Atotonilco WWTP with the aim of treated wastewater for reuse in irrigation. Bids are invited under a Build-Operate-Transfer (BOT) structure, with 49% of costs coming from the National Infrastructure Fund and the remainder from the private concessionaire. The Matahuala and El Morro WWTPs will have similar aims and financing structures -DBOT28 and BOT, respectively29;Cost savings of municipal water utilities due to avoided expenditures for alternative solutions, such as construction of pipelines to convey distant freshwater or of desalination plants. Where the costs of these alternatives have been provided for in public budgets, recycling projects can take up part of these allocations.
27 Global Water Intelligence (GWI), August 2009, p. 14.28 Design, Build, Operate, Transfer.29 GWI, August 2009, p. 51-52.

Chapter 3 - An economic methodology for assessing the feasibility of using recycled water in agriculture 63
Appendix to Chapter 3: Further guidance on the methodology of cost-benefit and cost-effectiveness analysis relevant to the economic appraisal of wastewater reuse projects.The following topics are included:3A1. Adjusting for economic distortions3A2. Taxes, subsidies & transfer payments3A3. Tradeables, non-tradeables and unquantifiable items3A4. Value of health and disease3A5. Costs3A6. Benefits3A7. Estimating discount rates3A8. Risk assessment and appraisal
3 A1. Adjusting for economic distortionsIf the price of a project’s output is greatly distorted, there is a likelihood of the wrong decision being taken. Much of the early cost-benefit literature favored the use of foreign exchange as the numeraire in which costs and benefits should be expressed. More recently, widespread economic liberalization in both developed and developing countries has reduced the need for comprehensive price adjustments.30
Distortions in the prices of goods and factors of production such as land and labor may persist, particularly where trade barriers are important and/or the national currency is seriously under- or over-valued. Particular products (e.g. energy, water) may also be distorted by subsidies or taxes. In these cases, some adjustment to actual prices may be required.
In these circumstances, the broad options are to use either domestic prices, with the worst distortions ironed out by ad hoc adjustments, or to use a foreign exchange unit of account by converting domestic values into their equivalent border prices. Deriving a set of border values can be an elaborate exercise and will not be feasible in every case.
3 A2. Taxes, subsidies & transfer paymentsValues should exclude taxes, subsidies and other transfer payments on the grounds that, for the nation as a whole, they are merely transfer payments between different groups. These transfers do not represent real scarcity values – on the contrary they may disguise the true opportunity cost of the item. Income and corporate taxes should be excluded from the analysis, as well as major indirect taxes affecting the project (e.g.export taxes, import tariffs, excise taxes) and subsidies and other transfers between citizens and the state. Charges and duties that represent payment for actual services, as well as benefits corresponding to services rendered, should, on the other hand, be included as costs and benefits, respectively.
3 A3. Tradeables, non-tradeables & unquantifiable itemsTradeable items, such as oil, machinery and pipes, can be valued at their border prices (import or export values, converted at the prevailing exchange rate). Imports should be valued c.i.f. (cost, insurance & freight, which represent resource costs to the economy), and exports f.o.b. (free on board, excluding transport costs overseas). Where the current exchange rate is substantially different from estimated free market equilibrium levels, the latter should be used where it can be accurately inferred (e.g. from purchasing
30 The UK’s Treasury recommends: “Costs and benefits should normally be based on market prices as they usually reflect the best alternative uses that the goods or services could be put to (the opportunity cost)….” (UK Treasury Green Book, 2004 version).

The Wealth of Waste: The economics of wastewater use in agriculture64
power parity estimates). Some goods and services are not actually traded, though they potentially have an overseas market and a border price. Examples relevant to recycling projects include crops produced for the farmer’s own consumption, electric power, etc. The valuation principles for these items are the same as for actually traded goods. Non-tradeables marketed domestically include land, water and some other public utilities, etc. Many goods with a low value-to-bulk ratio may be in practice non-tradeable, e.g. bricks, rubble, water, but could be traded in certain circumstances. In principle, they should be valued against the general yardstick of marginal social benefit to consumers Certain items, such as land and labor, can be subject to specific valuation principles that are previously discussed.
In summary, items that are actually or potentially tradeable should be valued at border prices. Non-tradeables are more difficult: in many cases market prices can be used where they are a reasonable reflection of marginal social benefit. Specific valuation methods are applicable to certain common non-tradeables in such areas as health & education and environment.
3 A4. Value of health and diseaseSection 3.2.3. described how DALYs and QALYs can be used in measuring the public health impact of a recycling project. Cost-effectiveness analysis can then choose the best option for achieving a given public health outcome defined by the DALY/QALY. However, in certain circumstances there is interest in estimating the economic value of health states (DALY/QALY) resulting from these projects.
All such estimation methods are controversial and pose severe methodological problems. Two possible approaches are outlined below:
Inference from policy decisions (Revealed Preference): in this approach the implicit value of health status is inferred from policymakers’ choice of particular safety and health measures (e.g. a programme to spend $1 million on public health measures calculated to produce 50 QALYs implies a valuation of $20 000 per QALY). Some public health administrations are believed to use threshold values for QALYs in allocating resources between different health interventions in a cost-effective manner. In principle, these threshold values can be used to infer policymakers’ valuation of a QALY31.
The direct valuation of changes in health status due to public health measures can be done by one or both of the following techniques:
willingness-to-pay; how much individuals would be willing to pay (WTP) to avoid a particular illness, accident or incapacity;using the human capital approach to measure the benefits in terms of the income an individual would gain from avoiding incapacity due to health.
Although the search for an acceptable and robust estimation method continues, it faces formidable methodological as well as social and political challenges. The conclusion of a recent authoritative review is:
“There is, in fact, no commonly agreed method for valuing QALYs, raising the question of how best to decide on the economic benefit of healthcare programmes or interventions.” (Asim & Petrou, 2005).
3 A5. CostsGeneral pointsThe notion of opportunity costs should underlie the treatment of costs in CBA. The cost of a project is the loss to the rest of society from using the resources for this purpose. Costs already incurred at the point of decision (e.g. a partially built project) should be disregarded for the purpose of the decision. Sunk costs should be ignored,
31 however, public authorities are reluctant to explicitly reveal these threshold values. See Asim & Petrou (2005)

Chapter 3 - An economic methodology for assessing the feasibility of using recycled water in agriculture 65
and only incremental costs reckoned in. If a project causes a loss of benefits, this too is a cost (e.g. draining a wetland to build a WWTP).
Costs can be either tangible (e.g. wages) or intangible (e.g. loss of amenity, destruction of wildlife habitat). In principle, both should be brought into the analysis: techniques are available for estimating non-market costs as well as benefits (Figure 3.1).
Costs can be internal to the project, or external to it (externalities). An externality is a project impact which does not directly affect the project sponsor, and which the private sponsor will not normally factor into the decision to proceed. Externalities may be either tangible or intangible. Externalities may be either costs or benefits. Publicagencies should ensure that they are reflected in the project decision, by using various possible valuation methods.
Specific cost itemsCertain financial costs should be excluded from a CBA. These include taxes and transfer values, which have already been discussed, and depreciation allowances. Depreciation is an accounting device used to maximise tax advantage by spreading expenditure on a capital asset over its lifetime, and does not correspond to real opportunity cost. Capitalcharges represent the annual financial costs of the investment (interest and capital repayments). Some projects include payments into a sinking fund, which is intended to create the funds necessary to replace the project at some future date, or repay the initial debt. In both these cases, a CBA captures the point through discounting. A project that achieves a positive NPV at a discount rate reflecting the cost of capital can by definition recover all its capital costs during its lifetime.
The use of non-renewable natural resources (e.g. fossil groundwater) or, the use of renewables in excess of their rate of replenishment (e.g. groundwater, or water stored from stream flow), are similar to mining projects. Part of their cost is the depletion costor user cost from using up finite resources. Conceptually, this cost arises in the future, when alternative resources have to be developed earlier as a result of the project’s consumption now. The depletion or user cost is the value of the extra future spending needed to tap alternative natural sources or, more precisely, the discounted cost of bringing forward by [say, one] year the use of alternatives, where they are available.
Contingencies included in cost budgets are of various kinds. Physical contingencies are extra quantities of work, materials, pieces of equipment, etc., included “to be on the safe side”, since a shortfall in cost provision for such extra items might have a disproportionate impact on the project. They should, however, be excluded from CBA because the Base Case should be the best possible estimate of the project’s contents and costs. Price contingencies cover cost increases that may arise over and above the prices used in the Base Case scenario. These may be provisions against general inflation, which should be excluded since the analysis should be conducted in constant prices. In principle, the Base Case should contain the analyst’s best estimate of costs, and genuine uncertainty should be dealt with by including an item for contingent liability (see below).
Contingent liabilities are real costs that should be included. These are the cost of commitments that will fall on the sponsor, or government, if certain events happen (e.g. guarantees and performance bonds that may be called, cancellation penalties, redundancy payments). The probability (expected value) of these events, discounted according to the year(s) in which they might arise, are real costs to be included in CBA.The following cost items are also likely to arise in recycling projects:
Land. The opportunity cost of land is its value in its best alternative use. In a freely functioning and undistorted market, this is reflected in its market price. However, land is often treated as though it were free to the project and useless for anything else, whereas in reality it always has an alternative use, which may be more valuable than the one proposed.

The Wealth of Waste: The economics of wastewater use in agriculture66
Labor. In most countries labor markets do not properly “clear” in the sense that wages smoothly adjust to price workers in and out of jobs. Unemployment may persist, either of a chronic nature, or seasonal, or structural (e.g. immediately after the closure of an important local employer). Using a shadow wage below the actual wage paid can correct for this distortion, and may be a better reflection of the true opportunity cost of the labor. While theoretically correct in certain cases, this practice has been widely abused and should be used cautiously and skeptically. Even in the midst of widespread rural underemployment, labor shortages arise at certain times. Except for projects where employment creation is the main objective, labor costs should not be entered as a project benefit. Subsidized raw materials & energy. Projects may benefit from the presence of plentiful local resources, such as hydropower, oil, water, etc., which are provided at a below-market cost to the project. The CBA should, however, include these items at their opportunity value, which may be their price as an exportable item (net of transport, etc.), their value in other uses, or the future benefit of not using them and preserving them for later (oil, stored water, etc).
3 A6. BenefitsConsumer and producer surplusesThe welfare gain from a project is the sum of the consumer and producer surpluses that it generates. The consumer surplus is the difference between what consumers would be willing to pay (or what they were paying previously), and what they actually have to pay with the project. This category of benefit is likely to be important for goods and services that are not priced, or whose prices fail to reflect their true values. Relevant examples include: improvements in household water supply; more reliable irrigation services, etc. The actual amount previously spent (cash, time) is one yardstick against which welfare can be measured. Where this is not available, willingness-to-pay (WTP) surveys can be done, or data from benefit transfers (see below) used.
The producer surplus is the difference between the product price obtained and the unit cost of production, normally equivalent to profit. This can arise for producers in various circumstances, whether public or private, serving monopoly or competitive markets. It applies to water utilities and any other suppliers of treated wastewater whose economic and financial situation is changed by a project. The fact that many water utilities, WWTPs and irrigation agencies operate at a financial loss due to their tariff policies does not invalidate this concept (the surplus can be negative, but still become larger or smaller as a result of a recycling project).
Benefit transferGrowing use is being made of the benefit transfer method of generating values for CBA, where the alternative is to conduct lengthy and complicated original surveys. This applies particularly in environmental and health appraisals. The method is to tap into databases of existing empirical studies in the sector in ques-tion and extract data from those whose features seem most relevant to the charac-teristics of the project being appraised.
Wider social and economic benefitsWater recycling projects may be promoted by invoking a range of positive effects, beyond those quantified in the CBA. These can include job creation, regional multiplier effects, backward and forward linkages into the local and regional economy, etc. The normal convention is to treat projects as marginal, in the sense that they do not have substantial impacts on other sectors or projects, and do not greatly affect the price of their major inputs or outputs.

Chapter 3 - An economic methodology for assessing the feasibility of using recycled water in agriculture 67
A project may have forward linkages benefiting sectors that use its output (e.g.irrigation water, extra water for urban or industrial use), or backward linkages to those that supplying a project’s inputs (e.g. pumping services, water treatment equipment, maintenance). In regions of water scarcity, the extra usable water that recycling could provide might have clear forward linkages for water-using sectors.
Multiplier effects arise when an investment project in an area with surplus capacity generates successive rounds of spending as the original injection of funds works through the local economy. In theory, the total eventual increase in income is a multiple of the original investment. In practice, spending from an investment project “leaks” in various ways, e.g. through higher prices of goods and services where there is no spare capacity, and imports from abroad or from other regions. Such effects would weaken the multiplier effect.
3 A7. Estimating discount ratesAs noted in the main text of this Chapter, there are various criteria for the choice of discount rates, the two most common being the rate of social time preference (STP), and the opportunity cost of capital (OC).
The STP is derived from estimates of the pure rate of time preference, the marginal utility of income as incomes change, and the expected growth in per capita incomes. (see Box 3.1). The first two of these components cannot be directly observed, and the third is a forecast. Box 3.1 indicates how changing the values of STP for countries at different stages of development affect the overall rate of STP. The results are purely illustrative and should not be taken as guides for a specific country.
Estimates of the OC can be guided by observations of national capital markets, in particular the real long term rate of return on private capital, adjusted for risk. Although this may be feasible for countries with strong and liquid financial and capital markets, many poorer countries have limited capital markets where the rates of return on capital are not sufficiently transparent. In repressed capital markets, governments are able to borrow at artificially low rates, hence this is not always a reliable benchmark for the choice of discount rate. The minimum OC could be regarded as what the recipient government could earn by depositing the funds safely in international financial markets, adjusted for the foreign exchange risk.
BOX 3.1
Estimating social time preference
Social time preference is obtained from the formula:S = p + u.gWhere:S = social rate of time preferenceP = pure rate of time preference, the rate at which utility is discountedU = rate at which marginal utility declines as consumption increasesG = expected growth in consumption per head.In developed countries, the following parameters are typical: p = 2%; u = 1.5%; g = 2%, giving a
value for s of 5.0%In a poor developing country with good growth prospects it is plausible to substitute values of
p=5% and G= 3% giving s = 6.5%.For a poor country with poor, or negative growth prospects, the higher value for p would be wholly
or partly offset by low or negative values of g.
Source: OECD, (1995) p. 130

The Wealth of Waste: The economics of wastewater use in agriculture68
3 A8. Risk assessment and appraisalRisk assessmentDuring appraisal, analysts should identify the main areas of risk to which the project is exposed. Some of these will be common to all projects, others specific to the project in hand. Examples of generic risks would include demand for the good or service, output price, construction costs and implementation period, funding problems, failures of counterparties to live up to commitments, untried technology, failure to get timely planning approval, etc. For large and complex projects it may be useful to compile a risk register.
The next step is to judge the importance of the risks identified, which requires a view on:
the possible range of deviation from the values used in the Base Case, and the probabilities of these deviations occurring.
Except for the largest projects, it will not be feasible to carry out this routine for all risks. A more pragmatic approach would be to consult professional opinion and refer to previous experience to identify the most important risks and feasible magnitudes for their possible deviations from Base Case values. The Base Case should incorporate (expected values of) the best available information on the project, while data on the possible deviations should be retained for sensitivity analysis (see below).
Risk mitigation & managementActive risk management involves identifying risks well ahead and installing mechanisms to minimise their occurrence. It requires processes to monitor risks and feed back information, and controls in place to mitigate adverse consequences.
The potential impact of risks on the Base Case can be demonstrated through sensitivity analysis. Potential variations in crucial project variables are tested for their impact on Base Case NPV/IRR. For instance, if a 20% shortfall of benefits (e.g. uptake of recycled water by farmers) compared to Base Case reduces the IRR to 4%, while an increase of operating costs (of the WWTP and pumping) of the same proportion only reduces IRR to 6%, this would indicate that the project is more sensitive to lower benefits than to higher than expected operating costs. The moral for project planners is to concentrate more on securing demand, than to spend further time on refining costs.
Another way of presenting this same information is through the use of switchingvalues. These show, for each important project variable, how much it would need to change to reduce the NPV to zero. Variables which are not very crucial to the project could vary greatly before they affected the NPV, whereas highly sensitive items would only need to vary by a small proportion to plunge the project into difficulties.
The outcome of sensitivity and switching value testing is an opinion on how robustthe project is to changes in its key variables.
Risk perception, appetite and aversenessThe foregoing discussion has been based on the assumption that project sponsors and stakeholders are risk-neutral and that the assessment of risks is objective and widely agreed. This is misleading where, as in anything to do with water, there are important subjective perceptions and attitudes to risk.
Many supposedly “objective” risks have a large judgmental component, especially where new and complicated hazards are concerned. Perceptions of risk by “expert opinion” may differ widely from those of the general public, or groups who believe themselves to be at specific risk. The potential risks to public health from the use of effluent to irrigate food crops may objectively be very small, but public opinion may distrust “expert” judgements on this matter.

Chapter 3 - An economic methodology for assessing the feasibility of using recycled water in agriculture 69
In the context of this report, a farmer may lose the market for an entire crop if public health incidents can be traced back to his farm. The risk appetite of the sponsor and stakeholders cannot be ignored. In theory, differences in risk perception and in risk appetite can be allowed for by attaching utility weights (as well as probabilities) to the various possible outcomes to produce an expected utility. A more practical solution is to set out the risks in ways comprehensible to the decision-takers and use decision-rules which are tailored to the sponsor’s risk preferences (see below).
Irreversibility & special risksWhere future uncertainty is particularly important for a project, there is an optionvalue in retaining the freedom to proceed or not. Delaying a decision gives time for new data and evidence to be gathered, while implementing the project immediately closes down the option. This is serious if the project has irreversible effects, for instance on the natural environment. Postponement may be justified where there is a good chance of relevant data becoming available (the value of such extra data is referred to as a quasi-option value).
One of the most difficult judgements to be made is over zero-infinity problems, namely, risks with a low probability but a very high severity (e.g. the irreversible contamination of an important aquifer, or the extinction of a protected species due to construction of a new WWTP in a wetland area). Using the normal expected value framework (outcomes x probability) is unlikely to give such events the weight they deserve in the decision. The Precautionary Principle32 is likely to be invoked in such cases, and policymakers may prefer to avoid the risk entirely, or heavily over-insure against its consequences.
Information for managing riskThe results of CBA should be presented to sponsors, decision-makers and other stakeholders in ways, which are informative in the light of their respective risk appetites and preferences. Reducing the results of a CBA to a single indicator (IRR, NPV, BCA, etc.) and nothing else is a waste of information, and will not satisfy the anxieties and needs of sponsors. Which indicators and decision-rules are presented should be decided following consultation with sponsors and examination of their attitudes to risk. Where risks are particularly important, the basic indicators (NPV, etc.) should be accompanied by full data showing the results of sensitivity analysis and switching values, with worst possible scenarios highlighted.
Most projects would benefit from further study. However, this takes time and resources, and delays the start – which itself has costs. The judgement has to be made whether the long term benefits from a better project, with fewer uncertainties and less risk, justify the higher short term cost of studies, piloting, and deferment of benefits. How much better could the decision be by waiting? Is it worth the wait?
Sensitivity analysis can indicate areas of the project where the reduction of uncertainty would pay particular dividends, by reducing a downside variation or improving the prospect of an upside movement. This enables the analyst to focus on the value of information - the sum that would be worth spending on extra information, in relation to the potential benefit to project returns that might be expected.
32 “where there are threats of serious or irreversible damage to the environment, lack of full scientific certainty should not be used as a reason for postponing cost-effective measures to prevent environmental degradation”. (Gilpin, 1996, p. 178)

71
Chapter 4
Results and conclusions from case study analyses
This chapter illustrates how the economic methodology described in chapter 3 can be applied in the choice and appraisal of projects for the reuse of wastewater effluent in agriculture and other purposes. The case material used here is based on the actual situations in Spain and Mexico portrayed in chapter 2.
Although care has been taken in the choice and analysis of the data, the results presented here should not be regarded as a comprehensive and determinate feasibility study of the projects in question. The examples are intended to demonstrate a method of appraisal, the kind of data that needs to be collected, how they can be interpreted by policy makers, and how the projects can be made financially feasible. A full feasibility study would need to be part of the process of planning described more fully in chapter 5.
4.1 SPAIN: LLOBREGAT DELTA 4.1.1 Overall situationThe Llobregat River Delta covers c. 100 square kilometers of land situated in the North Eastern part of Spain adjacent to the major city of Barcelona. It is a valuable natural habitat, but also under relentless pressure from the city’s urban and industrial growth. The river has become highly polluted and degraded, and the important groundwater aquifer, widely used by all sectors, is suffering seawater intrusion. The flow of the river is highly variable, and the main alternative source lies at some distance. In dry periods farmers compensate for reduced surface water with greater pumping of groundwater, and treated effluent is starting to be used on a small extent, mixed with groundwater. Effluent is also used for groundwater recharge and other environmental purposes.
Against this background, the regional water authority is considering bringing effluent reuse into its future water strategies. There is ample effluent available, treated to secondary and tertiary levels, and the existing WWTPs are being modified to reduce the salinity of the present effluent. There are plans to reuse the effluent in agriculture, for various environmental purposes, and in industry, which would exchange freshwater for metropolitan use and reduce the further depletion of the aquifer.
4.1.2 Specification of preferred optionsFollowing preliminary screening, a preferred option has been selected for further appraisal at each of the two main WWTPs in the Delta, Sant Feliu de Llobregat (Sant Feliu) and El Prat de Llobregat (El Prat) (Box 4.1).
The reclaimed water from the Sant Feliu WWTP could be used on farms on the left side of the Llobregat River. The reclaimed water would be conveyed via the Infanta Canal to the farmlands and the freshwater released would be available to augment the Llobregat River and local aquifers.
For the El Prat WWTP, the concept is to pump effluent upstream to a regulatory pond from which water will flow into the Canal de la Dreta. Currently, freshwater with an average conductivity of 1.5 dS/m from the Llobregat River is conveyed via this channel to irrigate farm lands. The use of effluent in irrigation would require the desalination of the WWTP effluent by EDR and facilities to pump it to the Canal de la Dreta and a storage pond. The average salinity of the irrigation water would be reduced from 2.9 to 1.2 dS/m. The existing distribution network could be used to convey effluent to the fields.

The Wealth of Waste: The economics of wastewater use in agriculture72
Salinity is a crucial limiting factor for agricultural irrigation. Seawater intrusion into the aquifer limits its use by some farmers. However, farmers are more reluctant to use effluent from the El Prat WWTP because of its high salinity (average is 2 944 dS/cm), due partly to the presence of potash mines in the northern part of the watershed.
Cost-benefit analysis: resultsThe basic building blocks for the CBA are contained in Table 4.1 which indicates the capital and annual costs incurred by the proposed new facilities, and the aggregate benefits expected
from the reuse of effluent and the redeployment of freshwater to the city. For this exercise, no adjustment is made to the nominal market values of the cost
and benefit items. For simplicity it is assumed that the whole capital cost is incurred at the end of year one, and that the recurrent costs and benefits arise, unchanged, in years 2-25 (extending the analysis beyond a 25 year period would make no substantial difference to the results).
BOX 4.1
Preferred options at Sant Feliu and El Prat WWTPs
Sant Feliu: project specificationConstruction of a new tertiary treatmentunit at the WWTP, involving increase intreated water volume & nutrient reduction; Installation of a pipeline network to convey reclaimed water formunicipal, recreational and agricultural uses;Extension of use of reclaimed water infarm irrigation via the Infanta Canal on the left side of the Llobregat River;Release of freshwater by farmers currently extracted from Infanta Canal.
Expected project impactsReplaces pumping of surface water (from Llobregat River);Replaces pumping of groundwater by farmers (3 Mm3/yr), saving pumping costs;Increased water availability, quality and reliability;Farmers cease rain-fed agriculture and irrigate thewhole cultivated area (+ 14.5%) with increases in their net sales revenues;Reduction of fertilizer use.
El Prat: project specificationConstruction of EDR (electrodyalisisreversal) unit to reduce salinity of effluent at Sant Boi; Pumping desalinated effluent toirrigation Canal de la Dreta;Distributing the effluent to farmers;Using the freshwater released by farmersfor urban domestic water supply.
Expected project impactsSurface and groundwater use for agriculture avoided;Farmers save groundwater pumping costs;Increase in water availability, quality & reliability;Reduction of fertilizer use;Avoided costs of groundwater extraction for domestic water use.
TABLE 4.1Costs and benefits of projects
Euros (million) El Prat:Irrigated area 801 haEffluent vol. 13.0 Mm3/yr
Sant Feliu:Irrigated area 275 haEffluent vol. 7.3 Mm3/yr
Capital cost of new treatment units:
(EDR unit)
14.00
(tertiary unit)
1.12
O&M cost of treatment p.a. 2.6 0.51
Cost of conveying effluent p.a. 0.12 0.20
Cost of conveying water released for urban use p.a.
1.43 0.81
Net new benefits to agriculture p.a.
0.35 0.46
Value of water exchanged for city use p.a.
14.43 8.12

Chapter 4 - Results and conclusions from case study analyses 73
For El Prat, the steps are as follows (values in million Euros):Net benefits (benefits less costs). Year 1: minus 14.00. Years 2-25: plus 10.63.
Applying a 6% discount factor to this stream of net benefits gives a Net Present Valueof 114.54. 1 The corresponding Benefit-Cost Ratio is obtained by comparing the Present Values of the benefit and cost streams separately, in this case 188.88 to 66.19, or 2.85 to 1.0.For Sant Feliu the corresponding steps are:
Net benefits. Year 1 minus 1.12. Years 2-25 plus 7.06. Net Present Value = 69.49Benefit-Cost Ratio = 109.65 to 20.47, or 5.35 to 1.0.If the values contained in Table 4.2 are plausible, both projects appear highly
attractive in economic terms to the regional water authority. By far the largest benefit of both projects is the value of the extra freshwater made available for the city, whereas the net benefit to farmers, though positive, is much less. If a sensitivity analysis wereto be done, it would show that the overall NPV would be highly sensitive to the size of urban water benefits that are assumed here. On the other hand, the switching value of urban water benefits (the % decline that would reduce the projects’ NPV to zero) would also be very large, a sign of robustness in the projects.
Comments on the key variables follow.O&M treatment cost. 0.2 €/m3 for desalination by EDR. , 0.07 €/m3 for the tertiary treatment.Costs of conveyance of effluent and fresh water. Pumping costs of 0.11 €/m3.It is reasonable to assume that existing infrastructure would suffice to take the extra fresh water for the city. Water not used for the Canal is conveyed in the river down to the drinking water treatment plant, and the reclaimed water from the tertiary treatment unit crosses the river using a siphon to reach the Canal located nearby. Pumping costs would be very small.Benefits to agriculture. Assumes reliable supply of reclaimed water at Sant Feliu enables an increase in the irrigated area of 14.5%. The benefit is made up of increased sales revenue (in Euro million) 0.388, savings in the cost of groundwater pumping 0.06, and savings in fertilizer 0.01. At El Prat the benefits consist of savings in groundwater pumping costs 0.32 and savings in fertilizer 0.03. It is assumed there would be no produce restrictions due to the use of effluent. It is also assumed at this stage of the analysis that none of the costs of treatment or conveyance would fall on the farmers. Value of water exchanged for city use. This is valued at 1.11 €/m3, based on current tariffs in this region, which is a very conservative estimate of its full economic cost.Choice of discount rate. The rate used is 6%, as used by the regional consultants.
4.1.3 Implications of the CBAThe cost of water reclamation (extra treatment and conveyance) will not be offset by the value added in agriculture due to savings in fertilizer, groundwater pumping and the benefits from farming larger irrigated areas. This implies that neither of the preferred schemes makes economic sense as an agricultural cost-saving measure without considering the schemes in the broader regional context.
1 The present value (PV) of 1.0 per annum over 25 years at 6% is 12.78. Multiplied by the actual annual net benefit this gives PV of 135.85. Since this only starts in year 2 a discount factor of 0.94 is applied to produce an NPV of 127.70 . Deducting the capital cost in year 1 (discounting by the first year rate at 6%) gives an NPV of 114.54.

The Wealth of Waste: The economics of wastewater use in agriculture74
However, taking a broader view of the projects in the context of growing urban demand for water, there are sizeable net benefits from releasing river water for urban use. Water shortages in the Barcelona region may have been factors in the relocation of several firms out of the area, and the drought of the last five years has severely constrained household and municipal use. In this perspective, the potential value of the extra freshwater for the city strongly justifies for the projects.
Apart from this, the infrastructure for conveying water from one place to another has been built, and it is relatively cheap to exchange the water since all the key sites are close together. Sufficient storage is also available since the river is well regulated for most of the time, except in a few occasions of heavy rains in the mountains.
Though both the projects appraised here appear economically attractive in drawing up a regional water strategy, they would need to be compared with other means of providing (including conserving) urban water to test whether the benefits they provide can be delivered cost effectively, in other words, more cheaply than the alternatives. This evidence is not available for the purpose of this report, hence no Cost-effectivenessAnalysis is presented here.
FIGURE 4.1 a Project infrastructure
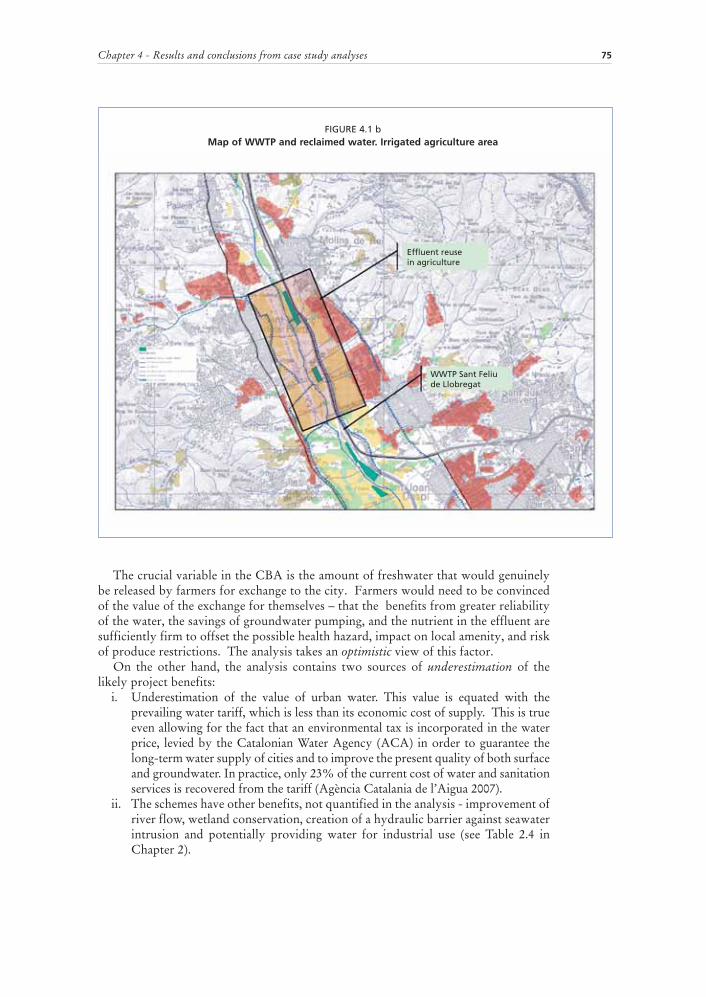
Chapter 4 - Results and conclusions from case study analyses 75
The crucial variable in the CBA is the amount of freshwater that would genuinely be released by farmers for exchange to the city. Farmers would need to be convinced of the value of the exchange for themselves – that the benefits from greater reliability of the water, the savings of groundwater pumping, and the nutrient in the effluent are sufficiently firm to offset the possible health hazard, impact on local amenity, and risk of produce restrictions. The analysis takes an optimistic view of this factor.
On the other hand, the analysis contains two sources of underestimation of the likely project benefits:
i. Underestimation of the value of urban water. This value is equated with the prevailing water tariff, which is less than its economic cost of supply. This is true even allowing for the fact that an environmental tax is incorporated in the water price, levied by the Catalonian Water Agency (ACA) in order to guarantee the long-term water supply of cities and to improve the present quality of both surface and groundwater. In practice, only 23% of the current cost of water and sanitation services is recovered from the tariff (Agència Catalania de l’Aigua 2007).
ii. The schemes have other benefits, not quantified in the analysis - improvement of river flow, wetland conservation, creation of a hydraulic barrier against seawater intrusion and potentially providing water for industrial use (see Table 2.4 in Chapter 2).
FIGURE 4.1 bMap of WWTP and reclaimed water. Irrigated agriculture area

The Wealth of Waste: The economics of wastewater use in agriculture76
4.1.4 Financial feasibilityi) financial impact on key stakeholdersFarmers In the Sant Feliu area, the project would have a relatively modest impact on farmers’ costs through savings in pumping and fertilization, and the greater benefit would be the extra sales revenue expected from an expansion in the irrigated portion of land2.Farmers in the El Prat area would only enjoy the cost savings from pumping and fertilization. Up to the present farmers have resisted the use of reclaimed water due to its high salinity, compared with river water, but with the new desalination unit at the treatment works this factor would disappear.MunicipalityGiven the tightly constrained demand for water at present, the City should be able to sell all the newly released amounts of freshwater at least at the prevailing water tariff. The city’s water company is restricted in charging the full economic tariff, and may be unable to benefit fully from the extra sales revenue, or benefits to costs from economies of scale. Hence it is difficult to predict the final impact of the projects on municipal finances in this specific instance.
Nevertheless, the potential for fiscal gain is there. Revenues from the extra water sales would exceed the capital costs and incremental O&M cost of the exchange. If both WWTP projects and their associated works were implemented, on the evidence of Table 4.1 the city utility would make an annual financial gain of €16.883 million, in exchange for the initial capital outlays of €15.12 million. Any decision to raise tariffs in real terms would improve the project’s financial appeal even more. In other circumstances, the city would also save Pollution Charges payable on wastewater released from the WWTPs, but in this instance the treated wastewater goes directly into the sea and no Pollution Charge arises.
A full dossier on this project would, of course, have to include a comparison of this scheme with the cost of other options for delivering the same volumes of fresh water, which is not available for this report.
ii) financial instruments and transfersThe analysis would support the view that most, if not all, of the cost of this project would have to be recovered from outside agriculture. On this evidence, there is little basis for charging farmers a cost-recovering level of tariffs for use of the effluent, which would have to be c. 0.40 €/m3 for El Prat and 0.22 €/m3 at Sant Feliu.4 These are greatly in excess of anything considered realistic in Spanish agriculture at present. On the other hand, the levels of urban tariffs (1.1 €/m3) are already considered to be well below the economic cost-recovering levels, and there may be scope to raise these, particularly in the context of demand management at times of scarcity. In the absence of compulsion or other kinds of administrative coercion, the voluntary participation of farmers in freshwater/effluent exchange may depend on subsidies, since the offer of free effluent may not be enough. Negotiations with farmers together with agricultural advisors may result in co-operative agreements with the commitments made by each of the parties laid down in contracts.
2 The assumption in this analysis is that such an expansion in irrigated area would only be possible through the use of reclaimed water. Otherwise, these benefits could also be obtained in the without-project case.
3 The sum of the annual value of fresh water exchanged for city use, minus the total of annual costs (excluding initial capital costs).
4 Calculated as follows: El Prat: present value of cost stream over 25 years Euro 66.19, divided by annual volume of effluent 13 Mm3 for 25 years discounted at 6% = 0.398 €/m3. Sant Feliu: PV costs Eur 20.47 divided by volume of effluent over 25 years, discounted at 6% = 0.219 €/m3.

Chapter 4 - Results and conclusions from case study analyses 77
The option of developing markets for the sale and purchase of water rights is a long term theoretical possibility which would substitute for a subsidy scheme. Farmers would then be able to sell their fresh water rights to the city, in exchange for cash and/or effluent. Such a scheme would depend on farmers having secure legal entitlement to a given amount of fresh water (from surface sources or aquifers), and the existence of a national legal framework for such exchanges.
iii) funding the projectIn the Llobregat Delta, the investment cost of water development projects is financed in part from EU programmes and the Catalonian Water Agency. In 2009 the regional government of Catalunya announced a programme of wastewater reuse to be funded entirely by the public sector, though some projects would involve co-financing with municipalities or local water companies.5 In the neighbouring region of Aragon the regional government has started implementing a major programme of wastewater treatment funded by a public-private partnership model.6 In various other countries7
effluent reuse projects have been funded under private Build-Operate-Transfer and similar types of concession. Such concessions require the creation of a project structure with a Special Project Vehicle whereby the concessionaire receives revenues from the public sponsor (off taker), since in many cases the recovery of costs directly from farmers is unlikely to be feasible.
4.2 TORDERA DELTA & COSTA BRAVA4.2.1 Overall situationThe Delta of the River Tordera lies half in the Southern boundary of the Costa Brava (Girona Province coastline) and the other half in the North of Barcelona province, in North-Eastern Spain. It contains two WWTPs, at Blanes (Girona) and Tordera(Barcelona), both with tertiary treatment. Effluent from Blanes is used mainly for recharging the aquifer through river discharge and subsequent infiltration in a highly permeable river bed, though a few farmers also use it for irrigation. Reclaimed water from Tordera is currently being discharged into the Tordera River but, once its solar-powered pumps are operational, the effluent will also be used to recharge the aquifer. Farmers in the vicinity rely on groundwater since the Tordera River is completely dry during summer months when the water demand from crops is highest. However, several farmers are starting to use reclaimed water to supplement their normal sources.
In the Southern Costa Brava, the Castell-Platja d’Aro WWTP, started to supply effluent to farmers around its plant in 2003. Most of this effluent is treated to secondary levels, but around 20% is treated to tertiary levels and this is used for golf course watering and groundwater recharge, with the residue discharged into the sea. Plans are imminent for upgrading the tertiary treatment capacity of the WWTP, which would have a mixed impact on agriculture, reducing its nutrient content while broadening its applicability to other crops, and also making the effluent more usable by municipalities and golf courses. An important choice to be made is whether to produce effluent of a single quality, or of two qualities, aimed at different users.
This section outlines the analysis required for the economic justification for the projects at Blanes and Platja d’Aro. The former is brief, since data is lacking on certain key points, but the latter is more complete.
5 Global Water Intelligence (GWI), Aug 2009, p. 14.6 OECD, Strategic financial planning for water supply and sanitation, 2009.7 GWI “Reuse tracker” (a regular feature of the journal)

The Wealth of Waste: The economics of wastewater use in agriculture78
4.2.2. Project specificationAt Blanes the proposal is to reuse the tertiary effluent from the WWTP (cur-rently 3.15 Mm3/yr, to be increased to 5.05 Mm3/yr) for agriculture, which would replace all use of groundwater by farmers.
At Platja d’Aro the regional water authority ACA foresees an enlargement of the tertiary treatment capacity of the WWTP by 30% to a 20 000 m3/day design capacity flow rate. Currently only 22% of the total treated water in the plant is reclaimed. The upgrade would respond to the potential demand from new users (e.g. the municipalities of Castell-Platja d’Aro and Santa Cristina d’Aro, farmers in Llagostera – a neighbouring municipality - and golf courses).
Following consideration of the option of differential effluent treatment standards for different users, it has been decided on grounds of cost to produce a single effluent quality. The project also includes new pumping stations, pipelines and water reservoirs. The total investment cost would be around 7.7 M€, 16% for the enlargement of tertiary treatment, 48% for the pipelines and 33% for storage facilities.
The extra reclaimed water would be allocated between uses as in Table 4.2.
4.2.3 Assessment of project impactBlanesTable 4.3 indicates the principal cost and benefit items that would constitute the CBA, with data filled where available. Certain key values that are not available for the purpose of this report are indicated.
The information provided in Table 4.3 does not permit an economic judgement on this proposal, but it does indicate where further data searches should concentrate. The cost of enlarging the existing tertiary wastewater capacity is unknown, though the cost of the distribution infrastructure seems substantial relative to the known benefits to farmers. It is assumed farmers will get no benefit from the fertilization properties of the effluent since most nutrients will have been removed. They will benefit from savings in the relatively heavy pumping costs (which are likely to grow in the future since pumping depths are large and increasing).
The two key potential benefits, which along with the incremental capital cost of treatment would largely determine the feasibility of the project, are unknown at present. The effluent would provide greater security of supply and economic benefit to farmers (for instance, enabling them to plant more valuable crops needing greater certainty of water8). The experience of the Mas Pijoan farm discussed below is relevant.
The other crucial benefit, the value of groundwater left in the aquifer, depends on regional policy – whether to keep the water in the ground, or to allow other users to exploit it. In the former case, the values would be environmental, in the latter case the value of the water to future users, whose identities are currently unknown.
8 though produce restrictions might apply to the use of effluent, compared with groundwater
TABLE 4.2Proposed allocation of extra reclaimed water in Platja d’Aro area
Requested reclaimed water
Mm3/yr
Agriculture (plots adjacent to WWTP, and farmers in Soilius & Llogostera) 1.263
Municipalities (Platja d’Aro & Santa Cristina d’Aro) 0.288
Golf and Pitch & Putt courses (6) 0.658
Improving water flow in Ridaura River for ecological purposes 1.0
Total 3.209

Chapter 4 - Results and conclusions from case study analyses 79
Platja d’AroThe enlarged tertiary treatment at the WWTP would reduce the nutrient content in the effluent by about 70%, which would diminish the potential savings in farmers’ fertilizer costs. Thus, the main benefits to agriculture from the project would be the following:
i. The increase in crop production due to enhanced water availability. The use of reclaimed water will ensure less variable yields and sales revenues per ha as they are less reliant on uncertain water supplies.
ii. The avoided cost of groundwater pumping.iii. A small reduction in fertilizer costs would still remain.Benefits for municipalities would consist of the value of extra water available
for domestic use. This would come from the release of 3.2 Mm3/yr of groundwater currently extracted for agriculture. The benefits from use of the water for golf courses or other tourism purposes are not estimated, though are likely to be positive.
The project could benefit the environment through aquifer recharge: one possible estimate for this benefit is the savings in the cost of groundwater pumping because of the shallower aquifer level.
The balance sheet of costs and benefits is set out in Table 4.4.
TABLE 4.3Blanes project: cost and benefit categories (€ M)
1 Capital cost of tertiary treatment Not available[Incremental cost of raising tertiary output from 3.15 to 5.05 Mm3/yr]
2 Capital cost of pipelines, pumps, etc. to convey effluent to fields 5.05
3 Annual O&M costs (mainly pumping) for conveyance of effluent to farms (0.02/m3 x 5.05 Mm3)
0.10
4 Savings in groundwater pumping costs (0.11 x 5.05 Mm3) 0.55
5 Savings in fertilization zero
6 Avoided losses in farm revenues due to water shortages in drought years
unquantified
7 Value of groundwater left in aquifer unknown
Items 1 and 2 are initial one-off costs, other items are annual flows
TABLE 4.4Costs and benefits of Platja d’Aro WWTP upgrade (Euro million)
1 Capital investment cost: total
tertiary effluent treatment;
pipelines;
pumping;
storage;
7.70
1.20
3.68
0.25
2.55
2 Incremental annual O&M costs of treatment (0.05 €/m3), pumping,conveyance, etc (0.10 €/m3)
Treatment: 0.16
Conveyance: 0.32
Total 0.48
3 Increased farm sales revenue (net):From future expansion from 41.6 to 291 ha
[0.874]
4 Savings in groundwater pumping 0.007
5 Savings in fertiliser cost 0.004
6 Value of groundwater released for urban and other potential use: 3.2 Mm3 @ 1.1 €/m3
[3.52]
7 Sales of effluent to municipalities 0.28 Mm3 @ 1.1 €/m3 0.30
8 Sales of effluent to golf & pitch & putt courses: 0.65 Mm3 @ 1.1 €/m3 0.71

The Wealth of Waste: The economics of wastewater use in agriculture80
The broad picture from Table 4.4 is that, for an investment of € 7.7 million and annual O&M costs of € 0.48 million, existing farmers will receive very modest savings in pumping and fertiliser costs (€ 0.011 million). Some of the effluent would be sold to municipalities and recreational establishments for €1.01/m3. The costs and benefits mentioned so far are reasonably robust.
The reuse of effluent would relieve pressure on the groundwater aquifer of up to 3.2 Mm3/yr if it is assumed that all the users stated in Table 4.2 would otherwise draw their water from the groundwater. This would create an environmental benefit, since the aquifer is diminishing and suffering from saline intrusion. If it is public policy to arrest the diminution of the aquifer, then this is purely an environmental benefit, which can be valued appropriately. If there is no such policy to stabilise the aquifer, the groundwater “saved” by the reuse of effluent would be available for other users. Since this benefit is uncertain, it is omitted from the Base Case CBA calculation below.
Another uncertain feature of the CBA arises from the possibility that part of the effluent from the upgraded WWTP would be available for a major expansion of agriculture in the Llagostera area, currently constrained by the availability of suitable water. This could be a major future benefit (which preliminary studies have estimated to be € 0.874 M/yr) but is somewhat speculative at present, and is also omitted from the Base Case CBA below.
Cost-benefit analysis - Base CaseAs in the Llobregat case, no adjustment is made to the nominal values of the cost and benefit streams. It is assumed for simplicity that the whole capital cost is incurred at the end of year 1 and that the annual streams continue at a constant level for 25 years. The results are as follows (in Euro million):
i. Present Value of costs (1 + 2, discounted at 6%): 12.99ii. Present Value of benefits (4, 5, 7, 8, at 6%): 12.26 iii. Net Present Value (ii minus i) minus 0.73iv. Benefit-Cost Ratio (ii: i) 0.94 to 1.0The result of this Base Case analysis is that there is a small negative NPV when only
the “basic” benefits are reckoned. This may be considered a pessimistic rendering, for several reasons:
The value of the groundwater “saved” is omitted due to its uncertainty. The main problem is a lack of the capacity of the aquifer to supply enough water. Several years ago, Platja d’Aro and other neighbouring municipalities started to be supplied by the El Pasteral dam.No account is taken of the potential value of the effluent to new irrigated land to be developed in Llagostera.The benefits for non-agricultural users (such as golf courses and other municipal purposes) are partly considered.There is no reckoning of the environmental benefits of reduced pollution of seawater, nor of the benefits from enhanced flow of the River Ridaura, which is practically dry for most of the year.
Clearly, either of the first two factors above would swing the NPV into a sizeable positive amount. Likewise, inclusion of a relatively small environmental value under the third category would make the project economically justifiable. The project is sensitive to the size of revenues from the sale of effluent, and highly sensitive to inclusion of the value of groundwater saved or released, and to its benefits for irrigation yet to be developed.
The preliminary analysis above indicates that further investigation could fruitfully focus on the potential use of the effluent by farmers in the Llagostera area, who hold the key to this project’s feasibility.

Chapter 4 - Results and conclusions from case study analyses 81
Cost-effectiveness AnalysisIf the project is only marginal at best, the avoided cost of the next best (“next worse”) project is irrelevant since the project is not worth doing. However, if the omitted benefits above were reinstated, the project would become worthwhile. Then question arises, would there be more cost-effective ways of achieving its objectives?
While a comprehensive review of alternatives is not available, some estimation has been made of the cost of providing the water volume by desalination and, alternatively, the conveyance of water from the Ter River through a newly constructed pipeline. The reference costs for sea water desalination have been taken as 0.45-1.00 €/m3. For comparison, the unit cost of the Platja d’Aro WWTP project based on Table 4.5 values is 0.339 €/m3, which would give it a cost advantage, though the quality of effluent would differ in the two cases.
A simple estimation has also been made of the cost of bringing freshwater from the Ter River through the new pipeline. Based on capital costs of € 27 M and annual O&M of € 0.54 M the unit cost of this solution for a comparable volume (though of freshwater) would be 0.82 €/m3 10, more expensive than the Platja d’Aro WWTP but in the range of competitiveness with sea water desalination.
The significance of Mas Pijoan FarmThe account of the Mas Pijoan case in Chapter 2 is indicative of the gains that farmers can make from using reliable supplies of treated effluent, compared to pumping groundwater. The evolution of farm operations between 2003 and 2006, before and after use of the effluent, is shown in Table 4.5. In short, the farm was able to expand its irrigated area, reduce its reliance on groundwater and increase its crop yield by 40%. These results are being watched with interest by the farmers in the neighbouring area of Llagostera, where groundwater is extracted from depths ranging from 80-120 metres, even greater than in the Solius area used in the Base Case.
9 The NPV of the initial capital cost (€ 7.7M) and the annual operating costs (€ 0.48 M)of the new facility are discounted by 0.94 to obtain their PV at the beginning of year 2. This is divided by the volume of the extra water (3.2 M/yr) for 25 years beginning in year 2 discounted at 6%. (The present value (NPV) of 1.0 per annum over 25 years at 6% is 12.78. Since the flows of water and costs are assumed to only start in year 2 a discount factor of 0.94 is applied.)
10 By the same process as that described in the above footnote
TABLE 4.5Comparison between past and present situation at Mas Pijoan Farm
Situation in 2003 Situation in 2006 Change compared to 2003 (%)
Total irrigated land (ha) 35 41.6 +18.9
Land irrigated with reclaimed water (ha) 0 25 -
Land irrigated with mixed water (ha) 0 7.6 -
Land irrigated with well water (ha) 35 9 -74.3
Well water used (m3/yr) 175 000 71 240 -59.3
Reclaimed water used (m3/yr) 0 136 760 -
Crop yield (kg/ha) 50 000 70 000 +40

The Wealth of Waste: The economics of wastewater use in agriculture82
Financial feasibilityi) Financial impact on key stakeholdersIn Blanes farmers would directly benefit from savings in pumping costs and from the greater reliability of effluent compared with existing sources. On the other hand, there may be produce restrictions. The immediate financial impact on the municipality is likely to be negative since there is no obvious possibility of “exchanging” the reused effluent for freshwater rights that can be sold elsewhere. The only current outlet for the effluent is agriculture which is unlikely to be able to pay for the whole capital cost of extra treatment, distribution and pumping. Any environmental benefits would need to be compensated by the regional or national authorities. In this case example, the aquifer has been declared “overexploited” which would allow the authorities to use some degree of compulsion. Although the formal trading of rights is illegal, some negotiation is possible.
The situation in the Platja d’Aro has similarities to that in Blanes but with two principal differences. Firstly, there are potential non-agricultural off-takers for the effluent in the shape of municipal and recreational users who can defray part of the cost through tariff revenues. Secondly, there is a promising agricultural demand for the effluent in Llagostera with the possibility of a contract with farmers developing new irrigable land. As in Blanes, the value of water left in the aquifer is difficult to determine without having regional authoritative policy on this issue.ii). Financial instruments and transfersIn both areas, there are limited opportunities for exchanging reclaimed water for freshwater rights, hence most of the cost of the projects would have to be recovered either from farmers or from environmental custodians. The illustrative economic cost of the treated effluent in the Platja d’Aro scheme (0.31 €/m3) is much higher than the cost of pumping groundwater (0.11 €/m3) and the price of reclaimed water set by the Consorci de Costa Brava of 0.08 €/m3. There is no present source of cross-subsidy from farmers – even in Platja d’Aro, where urban and recreational users could in principle afford the economic tariff. They only account for a minor part of consumption. The option of developing water markets is not much more promising since farmers have only rights over groundwater which is difficult to trade for both legal and cost reasons.
There remains a justification of subsidies to farmers on the grounds of environmental service providers, as compensation for maintaining the aquifer level, though the aquifer is no longer used as a source of water. iii). Funding the projectsThe initial investment costs of these projects could attract capital grants and soft loans from regional and central government and from EU schemes. In the Mas Pijoan scheme, 70% of the cost of connecting to the existing pipeline was provided by the European Agricultural Fund for Rural Development. It would also be reasonable to look to participating farmers for a contribution to the capital cost of distributing reclaimed water to their fields, where water from other sources is becoming scarce and unreliable. An agricultural water charge equivalent to the average cost of pumping groundwater (~ 0.11 €/m3) would cover a minor part (in Platja d’Aro around one quarter) of the recurrent costs of supply.
Prospects of funding these projects from private concessions are not promising, except if the concessionaires are remunerated directly by municipalities through off-taker agreements for the effluent. Cost recovery from the users (mainly farmers) is unlikely, so long as they can pump groundwater at less than the tariff.

Chapter 4 - Results and conclusions from case study analyses 83
4.3. MEXICO4.3.1.Mexico City & Tula ValleyOverall situationFarmers in the Tula Valley irrigate their fields with free untreated wastewater from Mexico City, supplemented by other local water sources. The relationship between the City and Tula Valley is synergistic: the arrangement benefits both sides – providing the City with a downstream outlet for large volumes of untreated wastewater, and the farmers with ample nutrient-laden water to irrigate their crops. It would be possible to estimate the cumulative benefits to the City from the possibility of delaying its investment in advanced wastewater treatment until now, as well as the benefits to farmers of using wastewater in comparison with other possible water sources, of less fertility. Such an exercise would be interesting to countries and regions at an earlier stage of considering wastewater strategies, but in the present case it would be academic since decisions have been taken and alternatives for both parties seem few.
As a result of the City’s on-going programme of investment in WWTPs, most of the wastewater will soon be treated to tertiary level. In theory this will widen the applicability of the reclaimed water for other crops, and further reduce any public health hazards, but will require farmers to apply fertilizer to offset the reduction in the nutrient content of the recycled water. Rough estimates done by the case study authors suggest that farm productivity could be 18% higher with the use of wastewater, compared with using freshwater.
The situation as described above is likely to continue: neither party has any strong reason to change it, nor the means to do so. There is little scope for an intersectoral exchange – of farmers’ freshwater rights in return for continued supply of reclaimed water – such as was discussed above in the Spanish cases. A proposal has, for example, been made (Jimenez Cisneros, 2004a) for the City to take some of the aquifer water in the Tula Valley that has been recharged with the wastewater effluent and other sources. This would be part of an exchange for the continued supply of (treated) wastewater. However, there are physical and other obstacles to an exchange of water use rights between the farmers and the City – explained in chapter 2 that could limit exchanges of this nature, even if either party wished to do so – which is not obvious.
Cost-benefit and cost-effectiveness analysis only has traction where policymakers have choices, and these are severely limited in the Mexico City-Tula situation by the decision to implement the WWTP investment programme, by hydrological realities, by farmers’ use rights, and the rights of users even further downstream.
4.3.2 Guanajuato City & La PurísimaOverall situationThis case has some similarities with the previous one. The farmers in La Purisima irrigation scheme draw water from a reservoir fed partly by fresh river water and partly from treated wastewater from the City’s WWTP, which is upgrading its secondary treatment capacity. Their rights to water do not take account of the quality of the water concerned.
In this case farmers already use recycled water contained in the river feeding the reservoir, and upgrading the level of treatment would make little effective difference to the volume of water they received out of the reservoir. Farmers’ main concern would be the impact on their operations of receiving a mixture of water with a much higher content of treated effluent from the new WWTP, which would reduce the previous benefits from fertilization. Farmers could, however, receive offsetting gains from the freedom to grow a wider range of crops. Rough estimates conducted by the case study authors suggest that farm productivity could be 10% higher compared with the (hypothetical) use of wholly freshwater.
The Wealth of Waste: The economics of wastewater use in agriculture84
As in the Tula Valley, there does not appear to be scope for an exchange of water use rights between farmers and the city, for reasons explained in chapter 2. Farmers would appear to be the passive recipients of any change in effluent quality decided by the city and – so long as they depend exclusively on the reservoir – they have no means of reducing their exposure to such changes.
4.3.3 Durango City & Guadalupe Victoria irrigation moduleOverall situationConsideration is being given to the scope for Durango city acquiring rights to the clear surface waters originally granted as a concession to irrigation farmers in the Guadalupe Victoria area adjacent to the city. This would be in exchange for providing reclaimed water to be used by the farmers.
Such an exchange of water use rights would have several benefits: the aquifer would cease to be overexploited; the municipality would get water of a good quality at a lower cost; energy would be saved in reduced pumping of the aquifer; and the irrigators would receive some biodegradable nutrient loads for their crops.
There is a precedent for the agricultural reuse of effluent. Between 2000 and 2006 the irrigators had an arrangement to use the city’s treated wastewater to supplement their regular supply of reservoir water. This was mainly motivated by their need to secure supply in drought periods. In 2000 an inter-connector pipe was built from the aerated lagoons of the WWTP to the left margin main channel flowing from Guadalupe Victoria reservoir. Since 2006 effluent supplied under this arrangement has diminished, since the spillway crest of the reservoir has been raised, providing additional storage of 10 Mm3 of water.
Project specification: the basis of a possible agreementThe situation has an arithmetical symmetry which makes an agreement between the city and the farmers appealing: the full Guadalupe Victoria irrigation module has a surface freshwater concession of 63 259 Mm3/yr, while the city of Durango has a ground water assignment of 61 292 Mm3/yr. The latter accounts for practically the whole of the aquifer’s annual recharge. An arrangement for all municipal water to be supplied from the reservoir and all the reclaimed water would be used in irrigated agriculture would cover practically all the water required by both parties for the foreseeable future. This would avoid the current over-exploitation of the Guadiana Valley aquifer.
Such a long term agreement would require irrigators to formally cede their rights to surface water in exchange for treated urban wastewaters. More investment in infrastructure would also be required to make the outcome feasible. The second WWTP now being planned would increase the available volume of wastewater, and the existing inter-connecting pipeline would need to be enlarged and extended to serve the entire 9 399 ha command area of the Guadalupe Victoria irrigation module, and a regulation pond would also be required.
In the short term, a more limited arrangement might be envisaged, whereby farmers would relinquish their rights to 10 Mm3/yr of surface streamflows stored at the Guadalupe Victoria reservoir, in return for receiving 10 Mm3/yr of treated urban residual waters delivered to the Guadalupe Victoria irrigation module. The city would keep a small number of wells (10-15) for industrial use.
For illustrative purposes, a cost-benefit framework for the development of such an intersectoral agreement is sketched in (Table 4.6). In principle, the agreement could cover any level of water exchange, but for the purpose of exposition the full amount of the irrigation freshwater concession (63 Mm3/yr) is taken as the Base Case. Table 4.6 indicates that all the data necessary for a proper CBA are not yet avail-able. The crucial items in any decision are likely to be:

Chapter 4 - Results and conclusions from case study analyses 85
The value placed on keeping water in the aquifer and avoiding further groundwater depletion (this was estimated by the case study authors to be c. $0.88/m3). This is mainly an environmental benefit, which will affect local streams and wetlands, and therefore wildlife and amenity. But there would also be gains to users who continue to pump the aquifer (e.g. local industry), and the aquifer would also have monetary value as water storage as protection of future drought (insurance value).The city’s savings in the cost of pumping groundwater from increasing depths. This has not been estimated, but is likely to be sizeable.
The assumption above is that the reuse agreement would enable the city to satisfy its municipal water need by replacing groundwater with surface water from the reservoir. This is, of course, a simplification of what is likely to happen, but insofar as it is valid, it indicates that the benefit of the agreement to the city would be as an avoided cost ratherthan creating any new benefits. The economic value of the water sold in the city would, ex hypothesis, be the same as before (though its financial value would probably be less, since the basis of charges has to be the actual cost of supply, which would be lower for surface water than groundwater). The city thus has to weigh the incremental cost of the project (enlarging the inter-connector, pumping effluent to farmers) against the benefits of savings in groundwater pumping and avoiding further aquifer depletion.
Farmers benefit from the nutrient value of the effluent, but may face produce restrictions due to their use of effluent rather than clear surface water.
Both parties, the city and farmers, would have to consider the cost-effectiveness of the arrangement compared with alternative ways of meeting their needs. Although the detailed alternatives are not available to this report, the options for the City might include further enlarging freshwater storage, transmitting water from more distant sources, and demand management including the reduction of losses in distribution. Alternatives for farmers to improve their own water security might be increasing water efficiency by changes to their irrigation techniques and the system for delivering water to their plots.
The financial impact on the city is likely to be positive, through savings in recurrent costs of obtaining water. For farmers the benefit seems more marginal, and – depending on their legal rights to the reservoir water – there may be a basis for compensation for the forfeit of such rights.
TABLE 4.6A cost-benefit framework for an intersectoral agreement in Durango City Values in millions of Mexican Pesos
1 Capital cost of wastewater treatment It is assumed that the cost of the second WWTP is required anyway to conform with national environmental regulations, hence should not be attributed to the reuse project
2 Capital cost of the inter-connector pipeline from the WWTP(s) to the irrigation areas
Cost of original inter-connector ($9.5M) is a sunk cost. Cost of enlarging this is ~ $1M/km]
3 Net difference in annual O&M for conveying effluent from WWTPs to farmers, compared with farmers’ original cost of conveying fresh water from reservoir to fields.
n.a.. [local convention is to assume this is 2% of capital cost of item 2 above. O&M cost of treatment should not be attributed to this project]
4 Farmers’ avoided cost of fertilizer 17.17
5 Durango City: avoided cost of groundwater pumping n.a.
6 Environmental benefits to aquifer n.a. [Difficult to quantify, and dependent on public policies towards aquifer use]
7 Cost of produce restrictions: net loss of farm income n.a.
n.a. = not available

The Wealth of Waste: The economics of wastewater use in agriculture86
4.4 ISSUES ARISING FROM THE USE OF THE ECONOMIC METHODOLOGYThe variety of case material presented from Spain and Mexico provides a good field testing for the approach presented in Chapter 3, and demonstrates that this is an appropriate framework of analysis for projects involving the reuse of effluent. In general, the framework presented, consisting of the three-fold approach – Cost-BenefitAnalysis, Cost-Effectiveness Analysis, and finally Financial Feasibility – has proved its merits as a method of justifying the projects concerned.
The viewpoint adopted by the hypothetical CBA analyst in this report is that of the national or regional water or environmental authority. Such an agency takes an “IWRM” stance on water management, taking account of the interests of all relevant stakeholders. Although the two that are most prominent in this report are municipalities and farmers, there is an important third part at the table – the environment – which needs a champion and a custodian. Reflecting the needs of the environment, valuing its assets and services and ensuring that its financing needs are met, is a challenge to analysts in this area. The case studies confirm that effluent reuse is an area ripe for the application and refinement of the tools of environmental cost-benefit analysis.
The case material demonstrates that certain items of costs and benefits are more robust than others. On the cost side, the capital costs of treatment units, pumps and canals can be estimated with some confidence, and their operating costs (pumping, chemicals, labor, etc.) are also fairly evident. The technology of wastewater treatment (including desalination) is, however, evolving, and it is difficult to make firm assumptions about future unit costs. Turning to benefits, most of the case studies rely on the perceived benefits to farmers from the nutrient properties of effluent, savings in groundwater pumping, and the greater reliability of effluent compared with other sources in arid climates. While pumping costs are reasonably firm, the benefits of fertilization depend on local empirical evidence (“with and without project”), which is patchy and will need to be reinforced, for instance through agronomic trials. The benefits of reliability also need to be demonstrated more convincingly, possibly by closer study of farmers’ response behavior (insurance, aversive actions, etc.).
From the viewpoint of urban water demand, the case studies reflect the widespread view that water supply tariffs are too low, hence there is a pervasive underestimation of the benefits created by developing new solutions to growing demand (e.g. Llobregat). However, some of the cases (e.g. Durango) illustrate the importance (stressed in chapter 3) of distinguishing genuinely new benefits, on the one hand, from the avoided costs of meeting existing demand in a different way.
In several cases the data were missing or incomplete, and a comprehensive CBA was not feasible. In these and all other cases, however, the use of sensitivity analysis (including switching value estimation) provides a good guide to the “value of information” approach – where scarce research time should be focused in cases where data is weak across the board. The following is a list of other items where information proved to be problematic:
Market prices were typically used, without adjustment to reflect economic scarcity values or transfer payments;Calibration of the potential public health risk from using effluent, and information on the impact of produce restrictions;The downstream impact (on other users, the environment, etc.) of recycling water;The appropriate rate of discount for projects of this nature (justification of the rate employed, typically 6%);The difficulty in some cases of carrying out cost-effectiveness analysis because of the wide variety of alternative options available, and the need to place the project in the context of regional strategies (e.g. that of the regional Government of Catalunya);

Chapter 4 - Results and conclusions from case study analyses 87
Environmental impacts, which are difficult to value at any time, crucially depend on government policies and regulations. The value of restoring groundwater levels is a recurring issue in the case studies, another is the impact of higher effluent quality on receptor water bodies. Where official regulations on these matters apply, a CEA approach is more appropriate for project decisions. None of the case studies appeared to involve protected species, which is a complicating issue in many water resource projects elsewhere. In several case studies, the result hinges on how environmental impacts are valued, which emphasize the importance of developing the methodologies and experience in this area11.
4.5. POLICY IMPLICATIONS OF RESULTS OF CASE STUDIESThere are several ways of viewing the purpose of effluent reuse projects:
as a feasible and cost-effective means of meeting the growing demands of agriculture for water in regions of growing water scarcity and competition for its use. This motive also applies in situations where demand is not necessarily rising, but where periodic water scarcity is a problem for farmers planning their annual crop patterns. The case studies contain evidence (revealed preferences)of farmers responding positively to the use of effluent in these situations, as a temporary expedient or long term solution. However, effluent reuse is one amongst a number of options at farm level to minimizing exposure to water risk. Moreover, the creation of expensive distribution and storage facilities, with a high recurrent cost, in order to furnish water for low value farm purposes, is not always warranted – unless there are benefits to other sectors (see below).as an environmental solution to the growing volume of wastewater effluent and its potential for downstream pollution. The Mexico City-Tula case is the clearest example of the mutual benefit for the City and farmers from disposing of urban sewage and effluent to agriculture – and allowing natural processes to carry out some of the purification en route. Reuse schemes allow the dispersion of effluent and its assimilation across a wide area, as compared to the point source pollution from WWTPs. The reuse of effluent nutrients in crop production, rather than their removal and effective destruction during advanced processes of wastewater treatment also has a strong appeal to many Greens. The case studies confirm these environmental benefits of using reclaimed water. as a “win-win” project that is a solution to urban water demand, while also delivering the agricultural and environmental benefits stated above. The Llobregat sites and Durango City are clear-cut examples of potential win-win propositions since in both cases it is physically and geographically feasible for farmers to exchange their current entitlements to freshwater for effluent, and for the cities to gain access to the freshwater rights that are thus “released”. (Whether or not this actually happens depends on legal and other barriers being overcome, as well as successful negotiation over the financial arrangements between the parties to the deal. It must not be assumed that farmers will readily give up rights – as a general observation on the cases, the assent of farmers is presumed too readily, without further consideration of their operational situations. Most farmers prefer to have several water sources as insurance).
Much of this report, and all the case studies, are concerned with producing “win-win” outcomes of the third kind above. In two of the cases (Mexico City-Tula and Guanajuato) the scope for a win-win outcome is not fully apparent, since crucial
11 Turner et. al. (2004), Hermans et. al.(2006)

The Wealth of Waste: The economics of wastewater use in agriculture88
elements of feasibility are either absent or yet to be determined. In other cases (Blanes, Platja d’Aro) the freshwater rights “released” by farmers are from groundwater – which could be a potential source of urban water, or may be better left in the aquifer for environmental reasons. The basis of a win-win exchange in such situations is tenuous.
Needless to say, a “win-win” outcome only happens when farmers really do relinquish their freshwater rights in favor of urban users. This currently only happens in a minority of cases (Box 4.2).
A CBA approach helps to set the parameters for agreements between the main stakeholders, which in this report are assumed to be farmers, cities and the natural environment. It helps to define the interests of the parties in moving towards, or resisting, agreements that change the status quo. Where the balance between costs and benefits for one party (e.g. farmers) is very fine, the existence of a large potential net benefit to another (e.g. city or environment) can provide “headroom” for agreement by indicating the economic or financial bounty available to lubricate a deal.
BOX 4.2
Global water Intellignece quote
“At the moment, reused water is mainly supplied to low-value applications such as agricultural irrigation, with pretty much no ceiling on demand. Around a third of all reused water is given away for free, and two-thirds is sold at an extremely low price, which means that although investment into facilities is relatively high, there is very little return. There is little more than environmental concern to motivate reuse projects, and reused water is failing to offer much-needed relief to the pressures of urban potable supply. “
Global Water Intelligence, October 2009, p. 6.

89
Chapter 5
A planning framework for wastewater reuse
The economic framework for wastewater reuse presented in chapters 3 and 4 should fit within a comprehensive planning framework. A sound and methodical planning approach will assist in identifying all the relevant factors necessary for the decision to proceed with a project. This final chapter presents such a planning framework, relating back to the key issues introduced in chapter 1 and fitting them into a comprehensive approach, which incorporates the economic and financial methodology expounded in this report.
The contents of this chapter are set out in Box 5.1
5.1 THE PROCESS OF PROJECT PLANNINGThe typical stages of project planning are shown in Fig. 5.1. The process may be iterative. Reconnaissance level planning may occur initially for the analysis of project concepts based on limited data. If this preliminary analysis is favorable, the planning stages may be repeated with more detailed data gathering, definition of project alternatives, and analysis of each alternative.
The assumptions, data, and analyses should be documented in a facilitiesplanning report to provide a basis for public review and for decision-makers to decide whether to proceed to implement the project. A suggested outline of such a report is shown in Table 5.1. This outline can also serve as a checklist of topics to evaluate during planning.
The interrelatedness of water supply, wastewater management and environmental protection lends greater importance to Integrated Water Resources Planning. Wastewater reclamation and reuse is a bridge
FIGURE 5.1Project planning process
Source: Adapted from Mills and Asano (1998)
BOX 5.1
The planning frameworkProject planning process 5.1
Identification of problem & project objectives 5.2
Definition of study area & background information 5.3
Market assessment & market assurances 5.4
Identification of project alternatives 5.5
Appraisal & ranking of project alternatives 5.6
Implementation 5.7
Specific technical issues: 5.8
Facilities & infrastructure
Balancing supply and demand
Wastewater quality
Public health risks & safeguards
On-farm issues

The Wealth of Waste: The economics of wastewater use in agriculture90
between water supply and wastewater management and is able to address a broader set of goals than is typical of single-purpose projects. Ideally, regional planning involving a broad spectrum of water supply and water quality goals would precede detailed planning for a wastewater reuse project. When such master planning has not taken place, it will be more important to address the larger water supply and wastewater management context in a facilities plan for water reuse.
The successful implementation of a project depends on its acceptance by the general public and the relevant body of public administration. Using reclaimed water as a water source raises concerns about public health, water availability, and costs. Farmers have concerns about their water rights, the availability and quality of reclaimed water, its effects on soils and crops, and its impact on farm operations and income. Water reuse often crosses jurisdictional boundaries of several agencies responsible for regulation, operation, and financing. Thus, participation of the public and stakeholders must be a part of the planning and decision-making (Asano et al., 2007; Wegner-Gwidt, 1998). Stakeholders that should be involved include:
TABLE 5.1Outline of a wastewater reclamation and reuse facilities plan
1 Study area characteristics: geography, geology, climate, groundwater basins, surface waters, land use, and population growth
2 Water supply characteristics and facilities: agency jurisdictions, sources and qualities of supplies, description of major facilities and existing capacities, water use trends, future facilities needs, groundwater management and problems, present and future freshwater costs, subsidies, and customer prices
3 Wastewater characteristics and facilities: agency jurisdictions, description of major facilities, quantity and quality of treated effluent, seasonal and hourly flow and quality variations, future facilities needs, need for source control of constituents affecting reuse, and description of existing reuse (users, quantities, contractual and pricing agreements)
4 Treatment requirements for discharge and reuse and other restrictions: health- and water quality-related requirements, user-specific water quality requirements, and use-area controls
5 Reclaimed water market assessment: description of market analysis procedures, inventory of potential reclaimed water users and results of user survey
6 Project alternative analysis: planning and design assumptions; evaluation of the full array of alternatives to achieve twhe water supply, pollution control, or other project objectives; preliminary screening of alternatives based on feasibility criteria; selection of limited alternatives for more detailed review, including one or more reclamation alternatives and at least one base alternative that does not involve reclamation for comparison; for each alternative, presentation of capital and operation and maintenance costs, engineering feasibility, economic analyses, financial analyses, energy analysis, water quality effects, public and market acceptance, water rights effects, environmental and social effects; and comparison of alternatives and selection, including consideration of the following alternatives
a. water reclamation alternatives: levels of treatment, treatment processes, pipeline route alternatives, alternative markets based on different levels of treatment and service areas, storage alternatives
b. freshwater or other water supply alternatives to reclaimed water
c. water pollution control alternatives to water reclamation
d without- project alternative
7 Recommended plan: description of proposed facilities, preliminary design criteria, projected cost, list of potential users and commitments, quantity and variation of reclaimed water demand in relation to supply, reliability of supply and need for supplemental or backup water supply, implementation plan, and operational plan
8 Construction financing plan and revenue program: sources and timing of funds for design and construction; pricing policy of reclaimed water; cost allocation between water supply benefits and pollution control purpose; projection of future reclaimed water use, freshwater prices, reclamation project costs, unit costs, unit prices, total revenue, subsidies, sunk costs and indebtedness; and analysis of sensitivity to changed conditionsConstruction financing plan and revenue program: sources and timing of funds for design and construction; pricing policy of reclaimed water; cost allocation between water supply benefits and pollution control purpose; projection of future reclaimed water use, freshwater prices, reclamation project costs, unit costs, unit prices, total revenue, subsidies, sunk costs and indebtedness; and analysis of sensitivity to changed conditions
Source: Adapted from Mills and Asano (1998).

Chapter 5 - A planning framework for wastewater reuser 91
End users of reclaimed water, such as farmersWater supply agenciesMunicipal wastewater treatment and management agenciesNeighbours and passers-byRegional water and wastewater authoritiesCustomers or consumers of agricultural goodsLocal associationsEnvironmental organisationsWater quality and public health regulatory authoritiesEconomic development authoritiesPotential financial assistance organisationsAgro-food industriesOther people impacted directly or indirectly with reclaimed water use.
An important decision to be made at the start of planning is the time horizon appropriate for the planning period. There are four time horizons to consider in the planning and design of projects:
Planning period is the total period for which the need of the facility will be assessed and alternatives evaluated for their cost-effectiveness and long-term implementation.Design period is the period over which a component of the facilities is expected to reach full capacity use.Useful life is the estimated period during which a facility or component of a facility will be operated before replacement or abandonment.Financing period is the period over which debts must be serviced and repaid, and the required return on the investment is achieved.
These four time periods should be kept distinct and applied appropriately in the various analyses of planning (Mills and Asano, 1998).
Many components of water supply and water reuse projects have useful lives of 50 years or more. Some major water developments, such as dams, may have capacities to meet water demands many years into the future. To document the full costs and future benefits of a project, it may be necessary to establish a long planning period, such as 50 years. However, it is difficult to predict economic conditions and future growth trends so far into the future.
Most water, wastewater and water reuse projects can be planned adequately with a time horizon of 20 years. The economic analysis can allow for facilities that have useful lives shorter or longer than 20 years (see chapter 3). In addition, because of the uncertainties in predicting the future, it is often not desirable to construct facilities with capacities to meet a demand period longer than 20 years. Phasing construction to meet future capacities in smaller increments is often the most cost-effective approach. A 20-year planning period can allow for a long-term framework or master plan to anticipate long-term trends and needs while at the same time analysing phased construction in the most cost-effective manner.
5.2 IDENTIFICATION OF PROBLEM & PROJECT OBJECTIVESPlanners should be clear what problems are to be addressed and which objectives are expected to be achieved. The reuse of water is not normally an objective in itself, rather it is a means to a broader and more fundamental social objective, such as:
A reliable water supplyPublic health protectionEnvironmental protection and restorationRegional or sectoral economic developmentFinally, for many developing countries, the use of treated or untreated wastewater in agriculture is crucial for ensuring the food supply (WHO-FAO, 2006).

The Wealth of Waste: The economics of wastewater use in agriculture92
Multi-objective planning in a context of integrated water resources planning (IWRM) can provide greater understanding of the relationships between water sources, demands, recycled water, and agricultural development needs. Through this understanding there is greater opportunity for formulating water reuse projects with a broader group of beneficiaries and thus gaining more public support.
Reliability may be a key issue, in the sense that supply is insufficient to meet existing demands or to prevent expected future shortages. This may be a particularly serious issue for agriculture, because of the shared use of water sources, the supply and demand of water in all sectors in a region should be considered. Agriculture may have adequate water supplies, but there may be opportunities to shift current freshwater use from one area to another within a region or from the agricultural sector to the urban sector by using reclaimed water. This exchange could create a more optimal use of all water resources in a region to meet current and future demands.
Water reuse may be a means of improving public health, at risk from poorly treated or improperly disposed of municipal or domestic wastewater. Reuse may drive an improvement in wastewater treatment, which would benefit the health of farmworkers and consumers of agricultural products currently grown with untreated or partially treated wastewater. However, the use of recycled water introduces a public health concern of its own that must be considered.
Discharging inadequately treated wastewater can cause environmental damage to aquatic resources. Conversely, water reuse may be a means of reducing wastewater discharges. Reclaimed water has also been used to restore wetlands or streams by replenishing flows that have disappeared due to development or to supply newly constructed wetlands to replace wetlands lost to urban and commercial developments.
For economically depressed areas, reclaimed water may provide a source of water to promote economic growth in a region or increase income of farmers. A sustainable water supply may allow farmers to be less vulnerable to weather conditions or to shift to more profitable crops.
The fundamental objectives described above should be considered primary objectives. It is also important to identify secondary objectives in establishing the criteria for evaluating project alternatives. Some examples of secondary objectives might be:
Sustainability, such as, preventing soil sodicity;Public health protection, such as, preventing negative health impacts from use of reclaimed water;Crop productivity, such as, maintaining adequate irrigation water quality.
Care should be taken not to let secondary objectives divert attention from the ultimate goals of addressing fundamental social needs.
5.3 DEFINITION OF STUDY AREA AND BACKGROUND INFORMATIONAn initial planning task is to establish the geographic scope of analysis. The study area should then be characterised for baseline (existing) and future conditions. This information becomes the factual framework upon which to formulate project alternatives, the sizing of facilities, and the project’s costs and benefits.
The study area must be wide enough to include the water sources, demands and wastewater management needs that could be affected by a water reuse project. In some cases where water is imported from outside the region, the analysis will have to address the interrelationship between these sources and the region. The study area must also encompass all potential water reuse opportunities within a reasonable geographic area surrounding the wastewater sources. Where water resources are shared between areas or use sectors, the study area should include an analysis of water sources and needs for all shared areas to identify opportunities for shifting water sources from one area to another, or one sector to another, by using reclaimed water to replace fresh water.
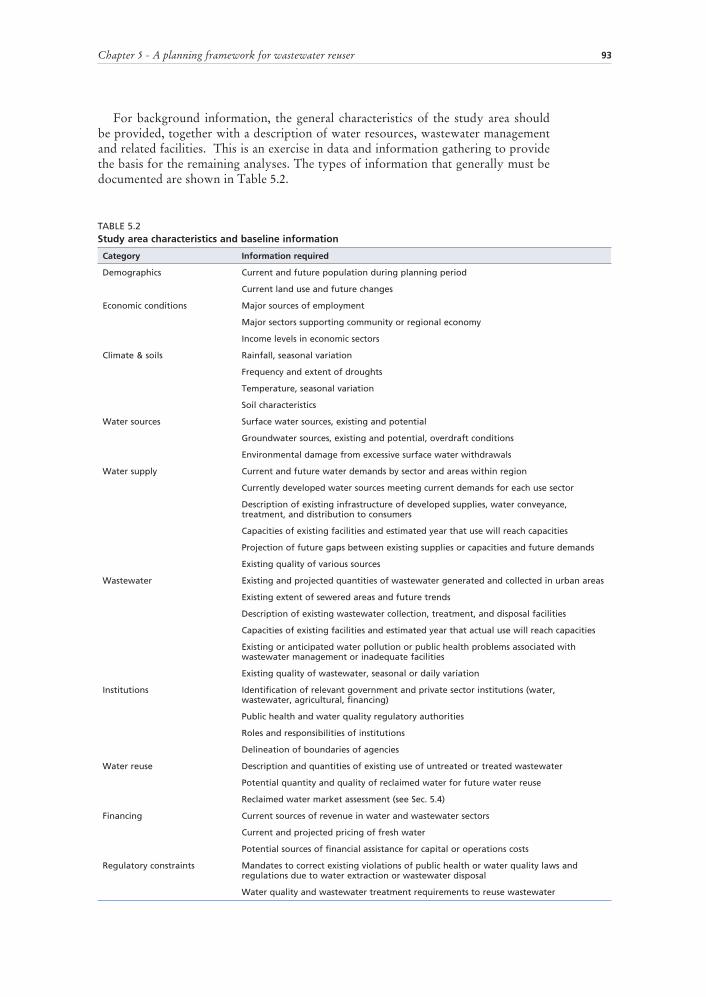
Chapter 5 - A planning framework for wastewater reuser 93
For background information, the general characteristics of the study area should be provided, together with a description of water resources, wastewater management and related facilities. This is an exercise in data and information gathering to provide the basis for the remaining analyses. The types of information that generally must be documented are shown in Table 5.2.
TABLE 5.2Study area characteristics and baseline information
Category Information required
Demographics Current and future population during planning period
Current land use and future changes
Economic conditions Major sources of employment
Major sectors supporting community or regional economy
Income levels in economic sectors
Climate & soils Rainfall, seasonal variation
Frequency and extent of droughts
Temperature, seasonal variation
Soil characteristics
Water sources Surface water sources, existing and potential
Groundwater sources, existing and potential, overdraft conditions
Environmental damage from excessive surface water withdrawals
Water supply Current and future water demands by sector and areas within region
Currently developed water sources meeting current demands for each use sector
Description of existing infrastructure of developed supplies, water conveyance, treatment, and distribution to consumers
Capacities of existing facilities and estimated year that use will reach capacities
Projection of future gaps between existing supplies or capacities and future demands
Existing quality of various sources
Wastewater Existing and projected quantities of wastewater generated and collected in urban areas
Existing extent of sewered areas and future trends
Description of existing wastewater collection, treatment, and disposal facilities
Capacities of existing facilities and estimated year that actual use will reach capacities
Existing or anticipated water pollution or public health problems associated with wastewater management or inadequate facilities
Existing quality of wastewater, seasonal or daily variation
Institutions Identification of relevant government and private sector institutions (water, wastewater, agricultural, financing)
Public health and water quality regulatory authorities
Roles and responsibilities of institutions
Delineation of boundaries of agencies
Water reuse Description and quantities of existing use of untreated or treated wastewater
Potential quantity and quality of reclaimed water for future water reuse
Reclaimed water market assessment (see Sec. 5.4)
Financing Current sources of revenue in water and wastewater sectors
Current and projected pricing of fresh water
Potential sources of financial assistance for capital or operations costs
Regulatory constraints Mandates to correct existing violations of public health or water quality laws and regulations due to water extraction or wastewater disposal
Water quality and wastewater treatment requirements to reuse wastewater

The Wealth of Waste: The economics of wastewater use in agriculture94
5.4 MARKET ASSESSMENT & MARKET ASSURANCESA particularly important criterion for assessing water reuse projects is the capability and willingness of water users to take reclaimed water in the quantities estimated, and the prices or costs that will be borne by the users. Early in the planning process a market assessment should be performed to determine the potential users of reclaimed water and the conditions that must be met to gain user acceptance. When a decision is made to proceed with implementation of a project, generally some form of market assurance will be needed to ensure users will participate in the project when it is constructed.
Market AssessmentAfter background information on the study area has been collected, a potential geographic area for the delivery of reclaimed water should be determined. Within this area, a comprehensive assessment of all potential types and areas of use for reclaimed water should be made. This is the market assessment. Even if the initial motivation of a study is to look for sources of water for the agricultural sector, the potential for use of reclaimed water in the urban and industrial sectors should not be ignored. Upon full analysis, the best and most economical use of reclaimed water may be in the urban sector, leaving more fresh water for the agricultural sector. Other options, such as desalination of seawater or interregional water transfer, should also be taken into consideration.
There are two aspects to the market assessment: 1) gathering of background data and information related to generic uses and sources of water and 2) gathering of data and information on specific potential customers or users of reclaimed water. The types of background information that is necessary are shown in Table 5.3 in a rough chronological order. Based on this information, individual users, including farmers or their representatives, can be interviewed to determine their existing sources, farming practices, water costs, needs, and expectations, as shown in Table 5.4.
Ultimately, a water reuse project will not be successful without the support of the actual and potential users of the reclaimed water. Farmers will compare the farming practices for using reclaimed water to current practices with respect to suitability for crops, yield, water costs, and the potential problems in marketability of crops due toperceptions of the public or agricultural produce distributors (WHO, 2006). The market assessment should identify all potential concerns of farmers so that they can be addressed at the planning stage. Because intermediate wholesale agricultural producedistributors may play a key role in whether crops grown with reclaimed water can bemarketed, the market assessment should also include contacting the distributors to determine their concerns and attitudes.
Market AssurancesWater users are more reluctant to use reclaimed water than freshwater, for many reasons, some of which are shown in Table 5.5. Even potential users expressing a favourable attitude toward reclaimed water during a market assessment interview may reclaimed water when it becomes reality. It is often desirable to obtain some form of legally binding arrangement or contract to assure that farmers or others will actually take the reclaimed water once the project is completed. he success of such contracts depends on the economic incentives they contain for farmer (e.g. expected increase in income). Such a contract should include all relevant conditions, technical and financial, of the services to be provided in order to ensure transparency and full understanding of the terms of the agreement. Some governments or water purveyors have the legal authority to mandate the use of reclaimed water (Asano et al., 2007)
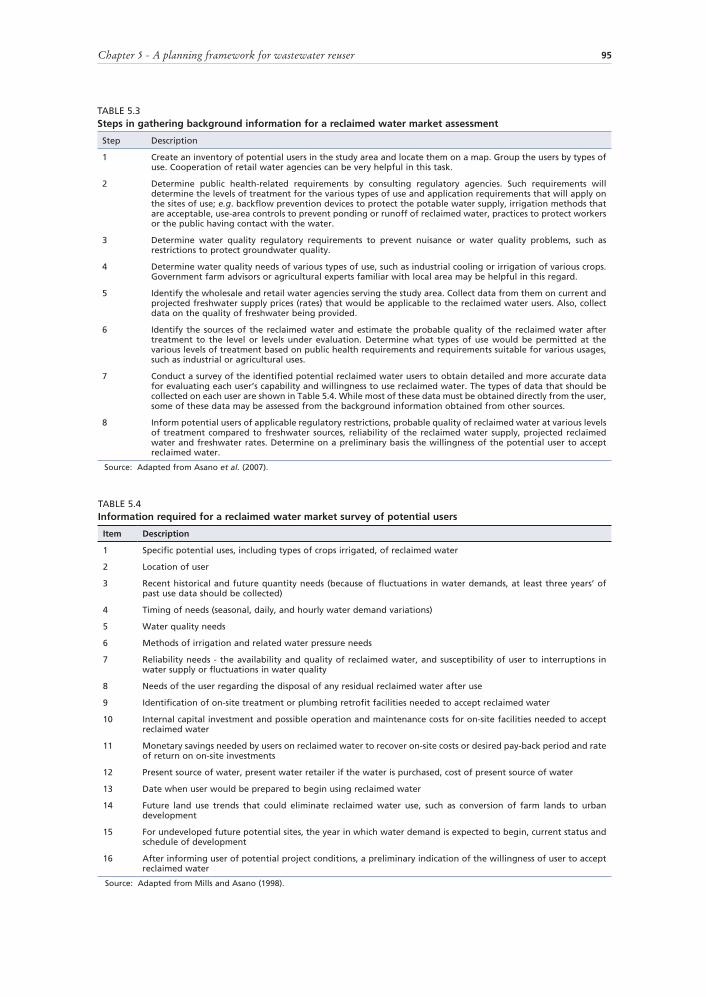
Chapter 5 - A planning framework for wastewater reuser 95
TABLE 5.3Steps in gathering background information for a reclaimed water market assessment
Step Description
1 Create an inventory of potential users in the study area and locate them on a map. Group the users by types of use. Cooperation of retail water agencies can be very helpful in this task.
2 Determine public health-related requirements by consulting regulatory agencies. Such requirements will determine the levels of treatment for the various types of use and application requirements that will apply on the sites of use; e.g. backflow prevention devices to protect the potable water supply, irrigation methods that are acceptable, use-area controls to prevent ponding or runoff of reclaimed water, practices to protect workers or the public having contact with the water.
3 Determine water quality regulatory requirements to prevent nuisance or water quality problems, such as restrictions to protect groundwater quality.
4 Determine water quality needs of various types of use, such as industrial cooling or irrigation of various crops. Government farm advisors or agricultural experts familiar with local area may be helpful in this regard.
5 Identify the wholesale and retail water agencies serving the study area. Collect data from them on current and projected freshwater supply prices (rates) that would be applicable to the reclaimed water users. Also, collect data on the quality of freshwater being provided.
6 Identify the sources of the reclaimed water and estimate the probable quality of the reclaimed water after treatment to the level or levels under evaluation. Determine what types of use would be permitted at the various levels of treatment based on public health requirements and requirements suitable for various usages, such as industrial or agricultural uses.
7 Conduct a survey of the identified potential reclaimed water users to obtain detailed and more accurate data for evaluating each user’s capability and willingness to use reclaimed water. The types of data that should be collected on each user are shown in Table 5.4. While most of these data must be obtained directly from the user, some of these data may be assessed from the background information obtained from other sources.
8 Inform potential users of applicable regulatory restrictions, probable quality of reclaimed water at various levels of treatment compared to freshwater sources, reliability of the reclaimed water supply, projected reclaimed water and freshwater rates. Determine on a preliminary basis the willingness of the potential user to accept reclaimed water.
Source: Adapted from Asano et al. (2007).
TABLE 5.4Information required for a reclaimed water market survey of potential users
Item Description
1 Specific potential uses, including types of crops irrigated, of reclaimed water
2 Location of user
3 Recent historical and future quantity needs (because of fluctuations in water demands, at least three years’ of past use data should be collected)
4 Timing of needs (seasonal, daily, and hourly water demand variations)
5 Water quality needs
6 Methods of irrigation and related water pressure needs
7 Reliability needs - the availability and quality of reclaimed water, and susceptibility of user to interruptions in water supply or fluctuations in water quality
8 Needs of the user regarding the disposal of any residual reclaimed water after use
9 Identification of on-site treatment or plumbing retrofit facilities needed to accept reclaimed water
10 Internal capital investment and possible operation and maintenance costs for on-site facilities needed to accept reclaimed water
11 Monetary savings needed by users on reclaimed water to recover on-site costs or desired pay-back period and rate of return on on-site investments
12 Present source of water, present water retailer if the water is purchased, cost of present source of water
13 Date when user would be prepared to begin using reclaimed water
14 Future land use trends that could eliminate reclaimed water use, such as conversion of farm lands to urban development
15 For undeveloped future potential sites, the year in which water demand is expected to begin, current status and schedule of development
16 After informing user of potential project conditions, a preliminary indication of the willingness of user to accept reclaimed water
Source: Adapted from Mills and Asano (1998).

The Wealth of Waste: The economics of wastewater use in agriculture96
5.5. IDENTIFICATION OF PROJECT ALTERNATIVESBased on the objectives of the project, the information available on existing infrastructure and the market assessment, a number of potential alternative water recycling and intersectoral water transfer projects usually become apparent. In the ideal situation, these reuse alternatives would be analysed simultaneously with other water supply and wastewater management options in an integrated water resources context. Even where this is not possible, water reuse must
still be analysed in relation to other water supply and wastewater options that meet the same fundamental objectives (e.g. construction or upgrading of WWTPs, desalination of seawater, interbasin transfers).
To determine the net impact of a project, it is necessary to compare what the future would look like, respectively with, and without, the project (Asano et al., 2007; Gittinger, 1982; Mills and Asano, 1998). This would reveal the impacts, costs, and benefits of the alternative of doing nothing, or the without project alternative. The without projectalternative depicts the situation that will arise from “business as usual” – the operation of existing infrastructure of water and wastewater facilities.
Since there are opportunities to shift water between areas or use sectors, it may be necessary to identify alternatives for serving individual areas or sectors, as a basis of comparison. While multi-regional or multi-sectoral comparison can greatly add to the complexity of analyses, it can identify multiple beneficiaries, thereby creating political and financial support for a water reuse project.
Examples of potential project alternatives that may be relevant to justification of a water reuse project are provided in Table 5.6. Note that even within a general project concept there may be alternative features to consider, such as alternative treatment technologies.
5.6 APPRAISAL AND RANKING OF PROJECT ALTERNATIVESThis report (chapter 1 and the current chapter) highlights a number of important criteria by which wastewater reuse projects should be judged. Although economic and financial criteria have been given a central place in the report (chapters 3 and 4) in a planning decision they take their place alongside other considerations. Box 5.2 illustrates what a list of criteria for project choice might include (Mills and Asano, 1998; WHO, 2006).
Not all of these criteria are of equal status. Depending on the local situation and public policy, some criteria will be paramount (e.g.. reduction of downstream effluent pollution, overcoming a growing scarcity of water for agriculture, minimising the cost of increasing freshwater supply to cities). Other criteria will be permissive (e.g. satisfactory public health safeguards, mitigation of environmental damage, legal feasibility). Certain criteria (e.g. existence of a satisfactory market demand for the effluent reuse) can be wrapped into others (such as the economic and financial feasibility, which would include sensitivity analysis of the impact of demand variations). Some criteria (economic, financial) can be monetised, some can be quantified in non-monetary terms, others are of a qualitative nature.
TABLE 5.5Farmers’ potential concerns about reclaimed water
Price of reclaimed water relative to freshwater costs
Inability to finance on-site conversion costs
Concerns over water quality and effects on crops and soil
Inability to prevent worker exposure to reclaimed water
Possibility of farm field worker objections
Lack of reliable reclaimed water supply
Water supply costs insignificant relative to inconvenience of reclaimed water
Liability to public health or third party claims
Restrictions on crop selection, marketability of crops, income
Problems selling crops to produce distributors or consumers
Source: Adapted from Mills and Asano (1998).

Chapter 5 - A planning framework for wastewater reuser 97
One approach is to accept certain criteria as paramount, and to treat the planning exercise as maximising (or optimising) the primary criterion(a) subject to meeting the constraints imposed by other criteria. For example, the primary objective might be minimising the economic cost of obtaining extra freshwater for cities, subject to satisfactory safeguards for public health, environment, etc., and its feasibility on technical, legal and market demands.
Another approach is through multi-criteria analysis (MCA) which involves scaling, scoring and weighting of each criterion (Snell, 1997). This is a formal mathematical optimising method, which can be applied flexibly to accommodate the subjective or explicitly imposed weights of decision makers, regulators or politicians. This flexibility comes from maximizing first a single criterion subject to acceptable levels to the others and then varying the criterion and the weights. MCA may well prove to be a more acceptable and durable method of making planning decisions since it contains information about all the key considerations entailed in each situation, including non-monetary impacts.
TABLE 5.6Water reuse: examples of project alternatives
Functional category Example of alternatives or variations
Freshwater supply(single purpose)
No project (existing infrastructure)Surface water storage (dams)Groundwater augmentation and storage (recharge, aquifer storage and recovery)Interbasin transfersDesalination (seawater or brackish water
Water demand management Urban and agricultural water conservation
Wastewater management(single purpose)
No project (existing infrastructure)More WWTPsAlternative treatment technologiesStream discharge of treated wastewaterLand application of treated wastewater with or without beneficial reuse
Water reuse (single ormultiple purpose)
No project (existing infrastructure)Alternative uses of reclaimed waterAlternative locations for use of reclaimed waterDecentralised treatment locations to increase accessibility to more use locations (satellite treatment plants)Alternative treatment technologiesAlternative levels of treatment (existing and new, primary, secondary, tertiary, advanced)Alternative routes for distribution pipelines or canalsInter-regional or intersectoral shifts in freshwater entitlements (water rights trading)One or multiple levels of treatmentOne or multiple wastewater treatment plants
BOX 5.2
Criteria for Project Choice
Economic justification Financial feasibility Public health impact Public acceptability Environmental impact Technical feasibility Market and demand Legal and institutional feasibility Etc.

The Wealth of Waste: The economics of wastewater use in agriculture98
MCA is likely to involve trade-offs – where a project performs well on one criterion, but poorly on another, compared to another project with the opposite scoring. The more criteria are included, the more difficult and complex this trading-off becomes. Aggregating the results of scoring on different criteria involves an implicit weighting (“all criteria are of equal importance”) or priority setting based on arbitrary and subjective factors (“environmental issues are paramount”). However, the systematic variation in weights can produce a set of non-inferior solutions in which no objective can be improved without decreasing the others (the Pareto optimal result).
A simple process of multi-criteria analysis would involve the following elements:For each of the project alternatives identified (section 5.5):
i) list the criteria applicable to the project (Box 5.2);ii) for each criterion create a scale of judgement (e.g. good, satisfactory, poor,
unacceptable or a scale of zero to 1) based on the factors appropriate for each (e.g. for the economic justification, the NPV or the BCA, for public health risks, acceptable or unacceptable according to the legally mandated standards in place);
iii) score each of the project alternatives according to each of the criteria, e.g.tick for one of the boxes (good, poor, etc.). As a refinement, the projects could be scaled numerically from 0-5, 0-10, etc. where 0 = unacceptable, and 10 is excellent.
iv) produce a score for each project, showing the ticks in each box, with the option of producing a single composite score from the scaling. The criteria may need to have different weights, following consultation with the main stakeholders.
v) choose a preferred project based on the above scores. Alternatively, produce a short list by eliminating those with poorer ratings and apply an overriding criterion (e.g. economic BCR) to select the final preferred option.
5.7 PROJECT IMPLEMENTATION PLANThe production of a project implementation plan should precede a final decision to proceed with a water reuse project. Many elements must be put in place for the project to succeed, not least the agreement by the many interested parties. Postponing the resolution of difficult issues until late in the design phase or even until after construction is completed can lead to false expectations and even project failure. All the key activities involved in implementation should be identified. A responsible entity should be identified and a performance schedule produced for each of the following activities:
Facilities designConstructionWastewater treatment operationReclaimed water conveyance and delivery to users (farmers or irrigation districts)Construction financingRevenue or tax collection for project operations and debt paymentTechnical assistance to farmers during project start-up and long-term problem resolutionAnalysis, monitoring and evaluation.
It is likely that more than one agency would need to be involved in all these activities, in which case contractual agreements will be needed between agencies to define their responsibilities and reimbursement for costs incurred. At the conclusion of planning there should be general agreement on the framework for responsibilities and willingness to participate in a project, even though contractual details may still have to

Chapter 5 - A planning framework for wastewater reuser 99
be negotiated. Contracts or other legally binding arrangements usually will be needed with farmers, as discussed in Section 5.4. At the conclusion of planning there should be some form of written affirmation by farmers or their representatives and municipalities of willingness to enter into contracts at an early date. In the contracts, the commitments for each of the parties involved are to be specified (e.g. volumes and quality of treated wastewater and released freshwater, use of water-saving irrigation technologies, charges on water users, compensation payments, period of validity, etc.).
5.8 TECHNICAL ISSUESMunicipal wastewater consists of domestic, commercial, or industrial waste discharged into a sewage collection system. To this may be added stormwater run-off, unless this is collected separately. This run-off can be highly polluted. The wastewater passes through the following facilities on its way to being transformed into reclaimed water (effluent) and delivered to use sites:
Sewer collection systemWastewater treatment plant (note that a reclaimed water unit could be outside the WWTP and managed separately)Reclaimed water distribution system On-site facilities at reuse sites.
Figure 5.2 contains a flow chart of the path of wastewater from source to point of use. Various costs are associated with each segment of wastewater management and reuse, as shown in Table 5.7. Reclaimed water may incur special costs that would not be required for freshwater use, for example, worker and public protection, and environmental protection, extra water for leaching soils, or protection of potable water systems, especially in urban areas. Some facilities are necessary for wastewater discharge, regardless of whether wastewater is reused. For the purpose of economic and financial analyses the differential, or incremental, costs of wastewater reuse, compared with “normal” wastewater treatment and disposal, should be identified and estimated.
FIGURE 5.2 Pathway of wastewater from source to points of use or discharge

The Wealth of Waste: The economics of wastewater use in agriculture100
At various points in the water cycle shown in Figure 5.2 the water/wastewater is stored and mixed with water from other sources. The characteristics of water and wastewater can change significantly when held for any period, especially when mixed, hence the importance of controls at the point of end use.
Certain of the specific cost items arising in a water reclamation and reuse system include:
Supplemental fresh water to maintain supply reliability in the reclaimed water distribution system.Backflow prevention devices on potable water lines entering use sites to prevent potable water contaminated on the use site from flowing back into the community drinking water supply.
Some of the other technical issues requiring attention are discussed below (see also Asano, 1998; Asano et al., 2007; Lazarova and Bahri, 2005a; Pescod, 1992; WHO, 2006).
Balance of supply and demand The reliability of reclaimed and recycled water is dependent on the abstraction and storage of the original freshwater that it is derived from. In certain circumstances, this may make it more reliable than farmers’ alternative water sources. In any case, irrigation needs have different seasonal peaks and troughs than household demand. Raw wastewater has its own variable flow characteristics:
i) The quantity of wastewater in most communities varies widely, peaking in daytime and reaching a low during the night.
ii) Rainwater can leak into sewer systems, resulting in higher wastewater flows during storms or during rainfall seasons.
iii) Wastewater flows may have seasonal or other variations due to tourism, seasonal industries, or other conditions.
TABLE 5.7Major cost elements of wastewater reuse systems
System segment Major cost elements
Physical facilities and associated costs Other costs
A Wastewater generation Pre-treatment (especially by industry) to prevent constituents toxic to humans or crops being discharged into sewers
Source control regulatory system
B Sewage collection system Construction, operation and maintenance costs for pipes, pump stations
C Wastewater treatment for discharge or reuse
Construction, operation and maintenance costs for treatment facilities
Regulatory system to set treatment or effluent quality standards and to monitor treated water quality, worker protection
D Additional wastewater treatment for reuse
Construction, operation and maintenance costs for treatment facilities
Regulatory system to set treatment or effluent quality standards and to monitor treated water quality, worker protection
E Untreated wastewater or reclaimed water distribution system
Construction, operation and maintenance costs for pipes, canals, water storage
F Reuse site Construction, operation and maintenance costs for pipes, canals, meters or water measurement devices, valves, irrigation equipment; re-plumbing of existing sites to separate potable from nonpotable pipes
Additional water purchase to leach salts from soil, worker protection, negative effects on farm production and income, education of local residents, groundwater monitoring, regulatory surveillance
G Effluent discharge system Construction, operation and maintenance costs of pipes
Regulatory surveillance

Chapter 5 - A planning framework for wastewater reuser 101
On the demand side, each water user has its own characteristics. Urban landscaping has its own regular needs, which are different from those of agricultural irrigation. Irrigation serves the transpiration needs of the crops, leaching to maintain soil quality, and in some cases a warming or cooling function for crops in extreme climates. The water demand from agriculture could change as it converts to reclaimed water, possibly resulting in increased water demand to increase crop yields, grow different crops or support more plantings during the growing season. Since reclaimed water may contain elements not present in freshwater, it may be necessary to increase applied water to leach out excess salts from the soil. Commercial and industrial customers can also vary their demand by time of day, days of the week, or season.
There is little or no control on the raw wastewater flows discharging from the sewer system. Whether treated or untreated, the wastewater must either be used directly, applied to land, discharged into a stream or other surface water, or stored until it can be used or safely discharged. Storage is usually required in reclaimed water distribution systems. Long-term or seasonal storage is often used where agricultural use takes place or where the discharge of wastewater is prohibited due to protection measures for surface waters. Short-term storage is most often used in urban settings where seasonal storage is not practical or there is insufficient demand to justify carrying wet weather flows into dry seasons for use.
Short-term storage can match reclaimed water to hourly water demands. For example, urban landscape irrigation is often done at night, when wastewater flows are at their lowest, to avoid human contact with reclaimed water in parks or school yards. Equilibrium storage is often incorporated into wastewater treatment plants to even out hourly flows, allowing downstream treatment processes to operate more efficiently at uniform flow rates. Design considerations and sizing techniques are addressed in several references (Asano et al., 2007; Mills and Asano, 1998).
Water qualityRegardless of its source, the quality of water is a critical concern to agriculture (Ayers and Westcot, 1985). The common uses of potable water in households and commercial and industrial premises contribute salinity and chemicals that are not removed in normal wastewater treatment. Reclaimed water may have higher concentration of some chemicals and additional constituents than are usually found in fresh water, but these can be removed before use (e.g. the RO desalination unit in the Llobregat cases in Chapter 2).
Water quality in relation to public health is addressed below and in chapter 1 (see also Asano et al., 2007; Lazarova and Bahri, 2005a; Pescod, 1992; Pettygrove and Aano, 1985). In the agricultural context, elements present in reclaimed water can have beneficial or negative effects. The main categories of water quality constituents and their effects are shown in Table 5.8.
Some of these negative impacts can be mitigated. Certain constituents can be reduced through source control, by preventing chemicals being discharged into sewers. Water softeners used in households replenished by sodium salts contribute to both salinity and sodicity and have been banned in some communities. Industrial sources of boron or other chemicals can be restricted. Another option is restriction on the delivery of reclaimed water during sensitive phases of plant growth, e.g. using good quality water in the initial growing period and worse quality water later on. This practice can even increase the quality of several fruits (Oron, 1987; Hamdy, 2004). The cropping pattern can be changed to favor more tolerant species or varieties. All these effects and mitigation measures have potential impacts on the overall costs and benefits and farm income resulting from use of reclaimed water.

The Wealth of Waste: The economics of wastewater use in agriculture102
Public health (see also chapter 1)The main sources of pathogens in wastewater are households, hospitals and office buildings. Commercial and industrial uses of potable water can add harmful chemicals to wastewater. The degree of pathogen and chemical removal by wastewater treatment depends on the levels of treatment and technologies used. The risk to health depends on the infectivity of the pathogens, their concentrations in reclaimed water, and the extent of human contact. Acceptable levels of risk can be achieved through levels of wastewater treatment appropriate to the types of uses and the associated human contact as well as practicing multi-barrier risk management strategies in Good Agriculture Practices.
Table 5.9 gives examples of wastewater constituents of concern to public health. Through adequate treatment of wastewater, the proper handling of reclaimed water, and farming practices, the transmission of disease can be prevented or reduced. Table 5.10 shows the populations exposed to risk, and their means of exposure to pathogen or chemicals in reclaimed water.
In addition to their direct exposure to reclaimed water, people are also at risk from pathogens and chemicals passed through the food chain in crops or into groundwater and streams through percolation or farm runoff. The points of exposure (with reference to points in Fig. 5.2) and the groups exposed can be summarised as follows:
Untreated or treated wastewater discharge to surface waters (downstream of point G): fishermen, swimmers, bathers, downstream users of drinking waterWastewater treatment (points C and D): workersIrrigation (point F): agricultural field workers, local residents or passers-byCrop handling (point F and later): workers, crop consumersExcess percolation of irrigation water (point F and later): consumers of groundwaterRunoff from agricultural fields to streams and canals (point F and later): fishermen, swimmers, bathers, downstream users of drinking water, local residentsCrop ingestion (after point F): crop consumers.
TABLE 5.8Reclaimed water quality and effects on agricultural use
Category Example of constituents Potential effects
Nutrients and trace elements NitrogenPhosphorusPotassiumCalciumMagnesiumSulfate
Positive:Essential for plant growthReduced need for fertilisersNegative:Phytotoxic in excessive concentrationsExcessive foliar growth, delayed maturation, poor quality crop (due to excessive nitrogen during flowering/fruiting phase)Toxic to livestock in high concentrations in animal feedBiofilms in pipelinesAlgal growth in open storage or canals
Suspended solids ParticulatesAlgae in wastewater or subsequent growth in storage caused by reclaimed water nutrients
Clogging of irrigation infrastructures, particularly in sprinkler and drip irrigation emitters
Salinity Total dissolved solids (Electrical conductivity)
Plant stress and growth reduction directly from irrigation water or salt accumulation in soil from irrigation water
Sodicity Sodium (Sodium adsorption ratio) Soil impermeability
Specific ion toxic elements SodiumChlorideBoron
Phytotoxicity (leaf damage, dieback, reduced productivity)

Chapter 5 - A planning framework for wastewater reuser 103
The health risks that can be encountered are summarised in Table 5.10.Wastewater treatment is the most fundamental barrier to the transmission of disease, but other precautions are also necessary. The methods of exposure control for the risk groups are as follows (Lazarova and Bahri, 2005b).
1. Wastewater treatment workers, agricultural field workers, and crop handlers:* Use adequate wastewater treatment, including disinfection* Use of protective clothing, such as boots and gloves* Maintenance of high levels of hygiene* Immunisation against or chemotherapeutic control of selected infections (if
reclaimed water is not well disinfected).2. Users of streams or canals (fishermen, swimmers, etc.):
* Adequate wastewater treatment, including disinfection, before discharge* Restrictions on stream uses* Informing stream users, warning signs.
3. Crop consumers:* Adequate wastewater treatment, including disinfection, based on crop and
level of exposure* Washing and cooking agricultural produce before consumption* High standards of food hygiene, which should be emphasised in the health
education, appropriate to the type of wastewater treatment and consumer exposure
* Restrictions on the types of crops grown with reclaimed water.4. Local residents:
* Using adequate wastewater treatment appropriate for the potential exposure* Informing them of the use of wastewater and the precautions to avoid fields
or canals, warning signs* Not using sprinklers within 50-100m of houses or roads, depending on the
level of wastewater treatment.5. All groups:
* Source control on sewer system to prevent toxic chemicals from entering wastewater.
There is a trade-off between the level of wastewater treatment and the degree of restrictions and precautions required for workers and consumers. It may be difficult to control the behaviour of workers, residents, or consumers through hygiene, education, or field practices. Farmers may resist the imposition of restrictions on the type of crops they can grow, such as food crops eaten without cooking.
TABLE 5.9Waterborne pathogens or chemicals of health concern present in wastewater
Contaminant category Specific examples Consequences
Excreta-relatedpathogens
Bacteria
Helminths
Protozoa
Viruses
Human diseases (direct or indirect infection)
Skin irritants Undetermined, but likely mixture of chemical and microbial agents
Contact dermatitis
Vector-borne pathogens
Plasmodium spp.
Wuchereria bancrofti
Human diseases
Chemicals Heavy metals
Organic compounds
Inorganic compounds
Acute or chronic human illness (direct contact or indirect through food)
Source: Adapted from World Health Organization, 2006.

The Wealth of Waste: The economics of wastewater use in agriculture104
Health risks from the use of wastewater in agriculture have been investigated in two separate areas of research: quantitative microbial risk analysis (QMRA) applied to irrigation and epidemiology (Mara et al., 2007). In the recent years, there has been a movement to apply the HACCP (Hazard Analysis and Critical Control Points) concept to wastewater reclamation and reuse (Westrell et al., 2003). The HACCP procedures were initially established for foodstuffs and aeronautical and pharmaceutical industries, where the final objective is to generate safe products.
Taking into consideration agricultural practices, hygiene, food processing, and the degree of human exposure, and in the light of the calculated risk for various pathogens, certain use practices and levels of wastewater treatment have been established by regulation (U.S.EPA and U.S.AID, 2004). The third edition of the WHO and FAO guidelines for the safe use of wastewater, excreta and greywater, published in 2006, is an extensive update of two previous editions, expanded to include new scientific evidence and contemporary approaches to risk management (Asano et al., 2007; WHO, 2006). Although it is technically feasible to obtain any required quality of water effluent from a particular type of wastewater, the treatment could be so expensive as to make reclamation non- feasible. In this case, the recommended practice is to use Best Available Technology (BAT) which involves use of the best adapted technology to every specific case, considering all the issues related to end-quality treatment, reclamation and reuse.
TABLE 5.10Summary of health risks associated with the use of wastewater for irrigation
Group exposed Health risks
Helminth infections Bacterial/virus infections Protozoal infections
Consumers Significant risk of helminth infection for both adults and children with untreated wastewater
Cholera, thyphoid and shigellosis outbreacks reported from use of untreated wastewater; seropositive responses for Helicobacter pylori (untreated; increase in non-specific diarrhoea when water quality exceeds 104 thermotolerantcoliforms /100ml)
Evidence of parasitic protozoa found on wastewater-irrigated vegetable surfaces, but no direct evidence of disease transmission
Farm workers and their families
Significant risk of helmith infection for both adults and children in contact with untreated wastewater; increased risk of hookworm infection for workers who do not wear shoes; risk for helmith infection remains, especially for children, even when wastewater is treated to <1 helminth egg per litre; adults are not at increased risk at this helminth concentration
Increased risk of diarrhoeal disease in young children with wastewater contact if water quality exceeds 104 thermotolerant coliforms/100 ml; elevated risk of Salmonellainfection in children exposed to untreated watewater; elevated seroresponse to norovirus in adults exposed to partially treated wastewater
Risk of Giardia intestinalis infection reported to be insignificant for contact with both untreated and treated wastewater; however, another sutdy in Pakistan has estimated a treefold increase in risk of Giardia infection for farmers using raw wastewater compared with irrigation with fresh water; increased risk of amoebiasis observed with contact with untreated wastewater
Nearbycommunities
Transmission of helminth infections not studied for sprinkler irrigation, but same as above for flood or furrow irrgation with heavy contact
Sprinkler irrigation with poor water quality (106-108 total coliforms/100ml) and high aerosol exposure associated with increased rates of infection; use of partially treated water (104-105
thermotolerant coliforms/100 ml or less) in sprinkler irrigation is not associated with increased viral infection rates
No data on transmission of protozoan infections during sprinkler irrigation with wastewater
Source: World Health Organisation - FAO Guidelines (2006)

105
Chapter 6
Conclusions
6.1 CONTEXT AND STARTING POINTThe use of recycled water (treated and untreated) in agriculture is widespread and increasing in regions with water scarcity, growing urban populations and rising demand for irrigation water.
Many regions of the world are experiencing growing water stress, arising from a relentless growth of demand for water in the face of static, or diminishing, supply and periodic droughts. Water stress is aggravated by pollution caused by wastewater from expanding cities, much of it only partially treated, and from the contamination of aquifers from various sources. Such water pollution makes scarcity worse by reducing the amount of freshwater that is safe to use without proper treatment.
Climate change is adding to these pressures: it is estimated that global warming of 2 degrees Celsius could lead to a situation where 1 to 2 billion more people may no longer have enough water to meet their consumption, hygiene and food needs. The evidence of recent prolonged droughts, and the impact on social and economic life of severe seasonal water shortages, shows the high economic, social and political costs of water shortages.
Recycling water is a proven option for bringing supply and demand into a better balance. It is not the only option, but in many cases it is an acceptable and cost effective solution, as the growing number of reuse schemes in different parts of the world testify1. A recent comprehensive survey found over 3,300 water reclamation facilities worldwide and is growing.
Water recycling and Integrated Water Resources ManagementWater recycling fits the IWRM paradigm – “…a process which promotes the coordinated development and management of water, land and related resources, in order to maximise the resultant economic and social welfare in an equitable manner without compromising the sustainability of vital ecosystems.”2 Recycling avoids putting further pressure on freshwater where it is becoming scarce, and reduces wastewater pollution for downstream users and the natural environment.
The reuse of wastewater is a means of recycling not only water but also nutrients, which would otherwise be wasted3 during the process of treatment and disposal. “Closing the nutrient loop” entails the return of nutrients, principally nitrogen and phosphate, to the soil where they can benefit plant growth, rather than releasing them into rivers, estuaries, wetlands or coastal waters where they cause harm (variously, eutrophication, algal blooms, fish kills, hypoxia, etc.). The heavy environmental, and eventually economic, cost of such nutrient pollution is a growing concern.
1 E.g. “Queensland’s Traveston Dam proposal has been rejected by the Australian federal government, meaning the state will have to implement alternative water resourcing strategies, including desalination and reuse.” Global Water Intelligence, Nov 2009.
2 Global Water Partnership, Integrated Water Resources Management TAC Background Papers No 4, 2000, p. 22
3 or separated, for instance into sludge.

From waste to resource: the economics of wastewater reuse in agriculture106
6.2 SYNERGIES AND WIN-WIN OUTCOMESAgriculture is the principal focus of this report. Agriculture is the predominant global user of reclaimed water, and its use for this purpose has been reported in around 50 countries, on 10% of all irrigated land. However, it is necessary to place water recycling in a broader context.
Reuse of water can be the source of win-win outcomes, in which several different aims can be achieved, and several stakeholders can benefit simultaneously. For the purpose of exposition, this report has divided stakeholders into three parties – urban authorities (cities), farmers, and the environment (represented by environmental custodians). However, the use of recycled water also appeals to industry, power stations and recreational establishments, and a number of cities are considering using reclaimed water for various municipal purposes, often as an alternative to desalination. The report has implications for each of these potential stakeholders.
AgricultureThe use of untreated or partially treated wastewater is already widespread in urban and peri-urban agriculture, which is an important source of fresh vegetables in many poor cities (Bahri, 2009). The systems for providing this water are often low cost and improvised, treatment costs are absent or minimal, and because of proximity the cost of conveyance and pumping are relatively small. These factors, together with the relatively high value of the produce, make this practice economic. In the course of economic development, and as environmental standards rise, wastewater will increasingly be treated, but in the meantime for many countries the agricultural use of untreated or partially treated wastewater will remain. In these situations a realistic policy response will involve a combination of measures to safeguard public health (see below).
In other situations, and more generally, reuse may be a feasible response to the demands of agriculture in regions of growing water scarcity and competition for its use. There is evidence in the case studies of farmers responding positively to the use of recycled water, either as a sole source, mixed with water from other sources, or used indirectly from recharged aquifers. Reuse has been used both as a temporary expedient in years of drought, and as a long term solution.
Reuse is one amongst a number of options at farm level for improving long term water security and minimizing exposure to seasonal water risk. Where it entails the creation of an expensive distribution network and storage facilities4, with a high recurrent cost for pumping, in order to furnish water for low value farm purposes, recycling may not be warranted unless there are benefits to other sectors. Where sizeable new infrastructure is required, recycling schemes may not be justifiable purely from their agricultural benefits. Although farmers may be net beneficiaries from using treated wastewater, compared with their previous or alternative sources of water, this depends very much on local circumstances, and in any event their net benefits may not offset the full costs of the scheme. This underlines the importance of viewing reuse as an element in IWRM, with reference to costs and benefits for water management more generally.
Cities Cities are interested in recycling mainly from two points of view - as a solution for wastewater treatment and disposal, and as a potential source of water for household and other municipal use.
Rapid urbanisation has focused attention on recycling as a potential environmentally sustainable solution for wastewater treatment and disposal. The context for this is the growing volume of wastewater, the heavy costs of advanced treatment, and the
4 As well as extra specific treatment where necessary, such as the removal of excessive salts.

Chapter 6 - Conclusions 107
downstream pollution caused by untreated and partially treated effluent. There are great differences between cities in their levels of development and available options, which affect their choices of wastewater disposal. It is estimated that in sub-Saharan Africa, less than 1% of wastewater is treated (Keraita et. al. 2009). Yet in 3 out of 4 cities in developing countries wastewater is used for irrigation without any effective treatment. In many West African cities, more than 90% of vegetables consumed are grown within the cities, which implies that a high proportion are grown using untreated urban wastewater.
Reuse is an everyday reality for many such locations, and the efforts of national and international authorities have concentrated on promoting the “multiple barrier” approach to risk management, including technically, economically and socially appropriate non-treatment options for health protection, based on WHO, FAO and UNEP Guidelines (Keraita et. al. 2009). Where climate and space permits, various low-cost treatment methods (e.g. waste stabilisation lagoons) can also be used as an additional safeguard. Strong arguments have been made for making national policies on wastewater treatment more realistic and pragmatic, in short for: “...a paradigm shift where water reuse defines the required degree of treatment, where technical solutions have to match capacities, and where urban source treatment will be implemented along a multiple-barrier approach combining treatment and different health protection measures”(Bahri, 2009, p. 52).
For countries at an intermediate level of development, the use of land disposal for untreated wastewater has been widely resorted to. The Mexico City-Tula case is typical of mutual benefits that have accrued, in this case over a century or more, for the City and farmers from disposing of untreated urban wastewater to agriculture, allowing natural processes to carry out some of the purification en route. Recycling allows the dispersion of effluent and its assimilation across a wide area, as compared to the point source pollution from WWTPs. The reuse of wastewater nutrients in crop production (as well as carbon sequestration potential in soil organic matter), rather than their removal and separation during advanced processes of wastewater treatment, is appealing on grounds of efficiency and environmental sustainability.
The second important motive for recycling is as part of the solution for urban water consumption. In the course of their economic development, cities increase their fiscal resources and raise their environmental standards so that, over time, a growing proportion of their wastewaters is treated, to progressively higher standards. This wastewater can be recycled for various urban and industrial uses, such as watering public gardens, industrial cooling and other processes, replenishing aquifers, and – where systems were installed that allowed this – toilet flushing. Using recycled water for these purposes avoids the fresh abstraction of river water or groundwater, where these are scarce. The ultimate development of recycling is direct reuse for all household purposes, including drinking (as in Windhoek, Namibia), though this is still rare (Bahri, 2009). There is an active and rapidly growing market for wastewater reuse projects, much of it aimed at urban and industrial use (GWI, 2009).
One form of “win-win” agreement examined in this report is the surrender of farmers’ freshwater entitlements to cities, in return for assured supplies of reclaimed water. This would enable cities to gain access to freshwater at a lower cost than otherwise, to use for any purpose including drinking water. For them to take part voluntarily in such an agreement, farmers would receive water which should be at least as reliable as their alternative sources, and which would contain nutrients for the growth of their crops. Depending on location, there may also be environmental benefits from such a deal.
The case studies illustrate situations with both the presence and absence of conditions for making such an intersectoral exchange feasible. The Llobregat sites in Spain and Durango City in Mexico are examples where physical and geographical conditions

From waste to resource: the economics of wastewater reuse in agriculture108
appear to be positive, and where legal and economic factors could dictate the outcome. In the other cases there are obvious barriers to an intersectoral agreement of this kind.
6.3 THE FEASIBILITY OF WATER REUSEThe feasibility of reuse projects hinges on a number of key factors. The physical and geographical features of the area should be conducive to the transfer of water between the parties concerned. Where an exchange of water rights is entailed, rights must be legally clear and alienable5. Any extra costs of treatment, plus that of installing the necessary infrastructure, should be affordable in relation to expected benefits. Farmers should be supportive, which depends on the net impact on their incomes, the status of their rights to freshwater, and what their alternatives are. Environmental impacts should be acceptable.
It is important that public health authorities are satisfied that the projects pose no undue risks, after reasonable precautions have been taken. National and international regulations and guidelines such as those promulgated by the WHO and FAO are available to guide the use of reclaimed wastewater in agriculture. Depending on circumstances, the options for health protection include the level of wastewater treatment, crop restriction, adaptation of irrigation technique and application time, and the control of human exposure.
Chapters 3 and 4 of this report dwell on the financial feasibility of recycling schemes as a necessary complement to the economic analysis. The vantage point of the economic methodology described in this report is the national interest6: if a project has sufficient net benefits in national socio-economic terms, it is considered to be justified. However, this is a necessary but not a sufficient condition for it to be implemented, since all the key stakeholders involved in the project need to be persuaded that they will be net beneficiaries. An essential part of building the case for recycling is to analyse the balance between its financial costs and benefits specific to each party.
Consequently the feasibility study should contain an analysis of the project’s impact on the financial status of key stakeholders, including central and municipal government, regional water boards, utilities, farmers, and other interested parties. This should identify the main gainers and losers, with estimates of their gain or loss. It should also contain an estimation of the financial implications of the project for public capital and recurrent budgets. This part of the analysis provides a basis for understanding the incentives of crucial stakeholders, including farmers, to support, or resist, the project.
Where benefits and costs are out of balance, or not sufficiently decisive, for key parties, proposals will be necessary for financial instruments and transfers that would create conditions to make the project acceptable, and to provide suitable incentives for its major participants. This may entail both penalties (e.g. water charges, pollution taxes or other financial levies) or positive inducements (e.g. subsidies and innovative financial mechanisms such as paying farmers for environmental services7).The financial architecture of the project resulting from this analysis will influence the funding of the project, e.g. whether national or international subsidies should be sought, how far it can be self-financing, or whether commercial finance or private equity is feasible.8
5 capable of being exchanged, e.g. bought and sold, between different parties, in accordance with local legal systems
6 Which for many, though not all, purposes will coincide with that of the region or river basin.7 As described in FAO (2007).8 A growing number of reuse projects are funded from commercial sources, including public-private
partnerships (BOTs), though these tend to be for industrial and urban non-potable uses.

Chapter 6 - Conclusions 109
6.4 PUBLIC AWARENESSRecycling depends on public acceptance, which in turn relies on awareness and understanding of the issues involved. In different contexts and cultures “wastewater” has connotations and resonances which have to be addressed. Public health and consumer concerns need to be dealt with transparently, using guidelines and procedures outlined in this report. Groups and whole communities affected by water recycling scheme have to be engaged in the decision-making and planning process, as outlined in Chapter 5.
Water issues are rising in the agenda of public actions, especially in the context of adaptation to climate change. Questions about the sustainability of current trends in urbanisation, water quality, environmental stress, and the needs of future food production – to name some driving issues – are leading to radical rethinking of water supply, use and disposal systems.9 The costs of water scarcity and water stress, on the one hand, and the expense and limitations of traditional responses to it, on the other, are key drivers of the new level of interest in recycling. From being an unfashionable and unspoken residual element of the water cycle, wastewater is emerging as a key link in IWRM.
9 E.g. in the TECHNEAU programme of the SAFIR Project of the European Commission Research DG.

111
References
CHAPTER 1Angelakis, A.N., and Durham, B. 2008. “Water recycling and reuse in EUREAU countries:
Trends and challenges,” Desalination, 218 (2008): 3-8.AQUAREC. 2006). Integrated concepts for reuse of upgraded wastewater. EVK1-CT-2002-
00130 EU funded project. Work Package 2: Guideline for quality standards for water reuse in Europe. Salgot, M; Huertas, E. (editors). University of Barcelona.
Asano, T., Burton, F.L., Leverenz, H.L., Tsuchihashi, R., Tchobanoglous, G. 2007. Water reuse. Issues, technologies, and applications. Metcalf & Eddy / AECOM. McGraw-Hill, New York.
Bahri, A. 2009. Managing the other side of the water cycle: making wastewater an asset.TEC Background Paper No. 13. Global Water Partnership, Stockholm.
California State Water Resources Control Board. 1990. California Municipal Wastewater Reclamation in 1987, Sacramento, California.
Dublin Statement. 1992: Dublin Statement on Water and Sustainable Devleopment. International Conference on Water and the Environment, Dublin.
Earth Trends. 2001. “Annual Renewable Water Supply Per Person by River Basin, 1995,”EarthTrends: The Environmental Information Portal, World Resources Institute, http://earthtrends.wri.org/maps_spatial/maps_detail_static.php?map_select=264&theme=2(accessed 2 December 2008).
Falkenmark, M., Widstrand, C. 1992. “Population and water resources: A delicate balance,” Population Bulletin, Population Reference Bureau, 47(3), 1-36.
FAO WATER. 2008. “Water at a Glance: The relationship between water, agriculture, food security and poverty”, Water Development and Management Unit, Food and Agriculture Organization of the United Nations, http://www.fao.org/nr/water/docs/waterataglance.pdf(accessed 23 November 2008).
Food and Agricultural Organization of the United Nations. 2008. AQUASTAT, FAO’s Information System on Water and Agriculture, http://www.fao.org/nr/water/aquastat/globalmaps/index.stm (accessed 2 December 2008).
FAO Wastewater Database. 2009. http://www.fao.org/nr/water/infores_databases_wastewater.html
Gittinger, J.P. 1982. Economic Analysis of Agricultural Projects, Second Edition. The Johns Hopkins University Press, Baltimore, Maryland. Published for the Economic Development Institute of the World Bank. Also published in Indonesia under the title Analisa Ekonomi Proyek-Proyek Pertanian, in France as Analyse économique des projets agricoles, and in Spain as Análisis económico de proyectos agrícolas.
Hamdy, A. 2004. Non-conventional water resources: salinity and saline irrigation practices and management. WASAMED meeting, Cairo.
Jiménez, B., and Asano, T. (eds.) 2008a. Water Reuse: An International Survey of current practice, issues and needs, IWA Publishing, London.
Jiménez, B., and Asano. T. 2008b “Water reclamation and reuse around the world,” Chap. 1, in B. Jiménez and T. Asano (eds.), Water Reuse: An International Survey of current practice, issues and needs, IWA Publishing, London.
Koo-Oshima, S. 2009 “Water resource allocation strategies: opportunities for wastewater reuse in agriculture”. Conference paper for Malta Water Resources Authority produced by Land and Water Division, FAO, Rome.
From waste to resource: the economics of wastewater reuse in agriculture112
Kumar, M.D., Singh, O.P. 2005. Virtual water in global food and water policy making: is there a need for rethinking. Water Resources Management, 19: 759-789.
Lahnsteiner, J., Lempert, G. 2007. Water management in Windhoek, Namibia. Water Science & Technology. 55 (1-2): 441-4
Lazarova, V., Bahri, A. (eds.) 2005. Water Reuse for Irrigation: Agriculture, Landscapes, and Turf Grass, CRC Press, Boca Raton, Florida, USA.
Lazarova, V., Bahri, A. 2008. “Water reuse practices for agriculture,” Chap. 10, in Jiménez B. and T. Asano (eds.), Water Reuse: An International Survey of current practice, issues and needs, IWA Publishing, London.
McCann, B. 2005. Shared resources in the Middle East. Water 21, August 2005: 16-19.Mujeriego, R. (ed.) (1990). Manual Práctico de Riego con Agua Residual Municipal
Regenerada, Edicions de la Universitat Poletécnica de Catalunya, Barcelona (Spanish translation of Pettygrove and Asano, 1985).
Okun, D.A. 2002. “Water reuse introduces the need to integrate both water supply and wastewater management at local and regulatory level. Water Science & Technology. 46(6-7): 273-280.
Oron, G. 1987. Marginal-water application in arid zones. GeoJournal. 15 (3): 259-266.Orr, S.A. Cartwright and Tickner, D. 2009. Understanding water risks. A primer on
the consequences of water scarcity for government and business. WorldWide Fund for Nature, Godalming, UK.
Peasey, A., Blumenthal, U., Mara, D. and Ruiz-Palacios, G. 2000. A review of policy and standards for wastewater reuse in agriculture: a Latin American perspective. WELLStudy, WEDC, University of Loughborough, UK (http:/www.lboro.ac.uk/well/.)
Pescod, M. B. 1992. Wastewater treatment and use in agriculture, FAO Irrigation and Drainage Paper 47, Food and Agriculture Organization of the United Nations, Rome.
Pettygrove, G. S., Asano T. (eds.). 1985. Irrigation with Reclaimed Municipal Wastewater: A Guidance Manual, Lewis Publishers, Chelsea, Michigan (originally published under same title as Report No. 84-1 wr by California State Water Resources Control Board, Sacramento, California, 1984).
Salgot, M., Angelakis, A.N. 2001. Guidelines and regulations on wastewater reuse. Chapter 23 in Decentralised Sanitation and Reuse. Concepts, systems and Implementation. Lens, P.; Zeeman, G.; Lettinga, G. (editors). IWA Publishing.
Salgot, M., Huertas, E., Weber, S.; Dott, W,: Hollender, J. 2006. Wastewater reuse and risk: definition of key objectives. Desalination 187: 29-40.
Smakhtin, V., Revenga, C., Döll, P. 2004. A pilot global assessment of environmental water requirements and scarcity. 29 (3): 307-317.
Sorgini, L. 2007. Water reuse. An evaluation of the technologies and their benefits. Water Environment & Technology, 19 (8): 54-59.
Tamas, P. 2003. Water resources scarcity and conflict: Review of applicable indicators and systems of reference. IHP-VI/Technical Documents in Hydrology/PC-CP Series/No. 21, UNESCO / IHP / WWAP, Paris.
Trondalen, J.M. 2004. Growing controversy over “wise international water governance”. Water Science & Technology. 49 (7): 61-66.
Turner, K., Georgiou, S., Clark, R., Brouwer, R. and Burke, J. 2004. Economic valuation of water resources in agriculture: From the sectoral to a functional perspective of natural resource management, FAO Water Reports 27, Food and Agriculture Organization of the United Nations, Rome.
WELL. (undated). Wastewater treatment options. Technical Brief No 64 produced by Water and Environmental Health at London and Loughborough (WELL).
WHO. 1989. Health guidelines for the use of wastewater in agriculture and aquaculture. Technical report series No. 778. World Health Organization, Geneva.
WHO. 1993 Codex Alimentarius – Guidelines for the application of the Hazard Analysis and Critical Control Point (HACCP) System. Alinorm 93/13A. Appendix II. WHO, Geneva.

References 113
WHO. 2006. WHO guidelines for the safe use of wastewater, excreta and greywater. 3rd ed. Vol. 2: Wastewater use in agriculture. World Health Organization, Geneva.
Winpenny, J. 1997. “Sustainable management of water resources: an economic view”. Chapter in Auty R.M and K. Brown (eds.) Approaches to sustainable development. Pinter, London & Washington.
World Bank. 2004. Towards a water-secure Kenya. Water Resources Sector memorandum,Report 28398-KE. World Bank, Washington DC.
World Bank. 2009. Development and climate change. Advance Overview of the 2010World Development Report. World Bank, Washington, DC.
World Economic Forum. 2009. The bubble is close to bursting: a forecast of the main economic and geopolitical water issues likely to arise in the world during the next two decades. World Economic Forum, Geneva.
CHAPTER 2Jiménez Cisneros, B., Mazari, M., Domínguez, R. and Cifuentes, E. 2004 a. Water in the
Valley of Mexico, in Jiménez, B. and L. Marín (Eds.) The Water in Mexico as Seen by the Academy, Mexican Academy of Sciences, Mexico City, Mexico, , pp. 15-32. (In Spanish).
Mexico. Federal Executive Power. 2004 b. National Water Commission, Water Statistics in Mexico, 2004 Edition, Mexico City, Mexico, 141 pp. (In English).
CHAPTER 3Asim, O., and Petrou, S. 2005. Valuing a QALY: review of current controversies. Expert
review of farmacoeconomics and outcomes research. 5(6): 667-669.FAO. 2007. The state of food and agriculture 2007: Paying farmers for environmental
services. FAO, Rome.Hermans, L., Renault, D., Emerton, L. Perrot-Maitre, D.,Nguyen-Khoa D. and Smith,
L. 2006 Stakeholder-oriented valuation to support water resources management processes. FAO Water Reports 30. FAO, Rome.
Hussain, I., Raschid, L., Hanjra, M.A., Marikar, F. and van der Hoek, W. 2001. Aframework for analysing socioeconomic, health and environmental impacts of wastewater use in agriculture in developing countries. Working paper 26. IWMI, Colombo.
Hussain, I., Raschid, L., Hanjra, M.A., Marikar, F. andvan der Hoek, W. Wastewater use in agriculture. Review of impacts and methodological issues in valuing impacts. Working Paper 37. IWMI, Colombo.
Molden, D. (ed.). 2007. Water for food, water for life: a Comprehensive Assessment of water management in agriculture. International Water Management Institute and Earthscan, London.
Molle, F & Berkoff, J. (eds.). 2007. Irrigation water pricing: the gap between theory and practice. Published under the auspices of the International Water Management Institute by . CABI, UK.
OECD. Managing water for all: An OECD perspective on pricing and financing. 2009. pp 138-139. OECD, Paris.
OECD. 1995: The economic appraisal of environmental projects and policies: a practical guide (written by James Winpenny). OECD, Paris.
Turner, K., Georgiou, S. R., Clark, R., Brouwer, and Burke, J. 2004. Economic valuation of water resources in agriculture: From the sectoral to a functional perspective of natural resource management, FAO Water Reports 27, Food and Agriculture Organization of the United Nations, Rome.
UK Treasury. 2004. The Green Book: Appraisal and evaluation in Central Government.London.
Van Beukering, P., van Drunen, M., Dorland, K., Jansen, H., Ozdemiroglu, E. andPearce, D. 1998. External economic benefits and costs in water and solid waste investments. Methodology, Guidelines and Case Studies. IVM Institute for Environmental Studies,

From waste to resource: the economics of wastewater reuse in agriculture114
Vrije Universiteit, Amsterdam.
CHAPTER 4Global Water Intelligence. 2009. Vol. 10 (10) Oct. p. 6. www.globalwaterintel.com
CHAPTER 5Asano, T. (ed.) 1998. Wastewater Reclamation and Reuse, Water Quality Management
Library 10, CRC Press, Boca Raton, Florida (originally published by Technomic Publishing, Lancaster, Pennsylvania), USA.
Asano, T., Burton, F.L., Leverenz, H.L., Tsuchihashi, R., Tchobanoglous, G. 2007. Water reuse: Issues, technologies, and applications, Metcalf & Eddy / AECOM. McGraw-Hill, New York.
Ayers, R. S., Westcot, D. W. 1985. Water quality for agriculture, FAO Irrigation and Drainage Paper 29 (Rev. 1), Food and Agriculture Organization of the United Nations, Rome.
Gittinger, J. P. 1982. Economic Analysis of Agricultural Projects, Second Edition. The Johns Hopkins University Press, Baltimore, Maryland. Published for the Economic Development Institute of the World Bank. Also published in Indonesia under the title Analisa Ekonomi Proyek-Proyek Pertanian, in France as Analyse économique des projets agricoles, and in Spain as Análisis económico de proyectos agrícolas.
Hamdy, A. 2004. Non-conventional water resources: salinity and saline irrigation practices and management. WASAMED meeting, Cairo,
Lazarova, V., Bahri, A. (eds.) 2005a. Water Reuse for Irrigation: Agriculture, Landscapes, and Turf Grass, CRC Press, Boca Raton, Florida, USA.
Lazarova, V., Bahri, A. 2005b. “Code of Practices for Health Protection,” Chap. 4, in V. Lazarova and A. Bahri (eds.) Water Reuse for Irrigation: Agriculture, Landscapes, and Turf Grass, CRC Press, Boca Raton, Florida, USA.
Mara, D.D., Sleigh, P.A., Blumenthal, U.J., Carr, R.M. 2007. Health risks in wastewater irrigation: Comparing estimates from quantitative microbial risk analysis and epidemiological studies. Journal of Water and Health 5 (2): III-IV.
Mills, R.A., Asano, T. 1998. “Planning and Analysis of Water Reuse Projects,” Chap. 2, in T. Asano (ed.), Wastewater Reclamation and Reuse, Water Quality Management Library 10, CRC Press, Boca Raton, Florida (originally published by Technomic Publishing, Lancaster, Pennsylvania), USA.
Oron, G. 1987. “Marginal water application in arid zones” GeoJournal 15 (3): 259-266Pescod, M. B. 1992. Wastewater treatment and use in agriculture, FAO Irrigation and
Drainage Paper 47, Food and Agriculture Organization of the United Nations, Rome.Pettygrove, G. S., Asano, T. (eds.) 1985. Irrigation with Reclaimed Municipal Wastewater:
A Guidance Manual, Lewis Publishers, Chelsea, Michigan (originally published under same title as Report No. 84-1 by California State Water Resources Control Board, Sacramento, California, 1984).
State of California. 2001. California Health Laws Related to Recycled Water, “The Purple Book”: Excerpts from the Health and Safety Code, Water Code, and Titles 22 and 17 of the California Code of Regulations, California Department of Public Health, accessed on-line: http://www.cdph.ca.gov/certlic/drinkingwater/Documents/Recharge/Purplebookupdate6-01.PDF
U.S.EPA., U.S.AID 2004. Guidelines for water reuse. Report No. EPA/625/R-04/108. U.S. Environmental Protection Agency and U.S. Agency for International Development, Washington, D.C.
Wegner-Gwidt, J. 1998. “Public support and education for water reuse,” Chap. 31, in T. Asano (ed.), Wastewater Reclamation and Reuse, Water Quality Management Library

References 115
10, CRC Press, Boca Raton, Florida (originally published by Technomic Publishing, Lancaster, Pennsylvania), USA.
Westrell, T., Schönning, C., Stenström, T.A., Ashbolt, N. J. 2003. QMRA and HACCP for management of pathogens in wastewater and sewage sludge treatment and reuse. Proceedings of the 4th international symposium on wastewater reclamation and reuse. Mexico City.
World Health Organization. 1993. Codex Alimentarius – Guidelines for the application of the Hazard Analysis and Critical Control Point (HACCP) System. Alinorm 93/13A. Appendix II. World Health Organization, Geneva.
World Health Organization. 2006. WHO Guidelines for the safe use of wastewater, excreta and greywater. Volume II: Wastewater use in agriculture, World Health Organization, Geneva.
CHAPTER 6 Bahri, A. 2009. Managing the other side of the water cycle: making wastewater an asset.
TEC Background Paper No. 13. Global Water Partnership, Stockholm.Global Water Intelligence. 2009. Vol. 10 (10) Oct. p. 6. www.globalwaterintel.com

From waste to resource: the economics of wastewater reuse in agriculture116
Additional Bibliographical References
Abu-Madi, M., R. Al-Sa’ed, O. Braadbaart and G. Alaerts. 2007. Viability of Increasing the Tariff of Freshwater for Irrigation as a tool to Stimualte Wastewater Reus in the MENA Region. 6th IWA Specialist Conference on Wastewater Reclamation and Reuse for Sustainability: Guiding the growth of water resuse, October 9-12, Antwerp, Belgium.http://www.wrrs2007.org.
Agència Catalana de l’Aigua. 2007: Implementation of the Water Framework Directive in Catalonia. Pressures and Impacts Analysis. Barcelona.
Anderson, J. 2002: The Environmental Benefits of water recycling and reuse. IWA Regional Symposium on Water Recycling in Mediterranean Region, 26-29 September, Iraklio, Greece, 11-20.
Andreu, J., Rossi G., Vagliasindi F. and Vela A. (eds.) 2006: Drought Management and Planning for Water Resources. CRC Press, Boca Raton, FL.
Angelakis, A.N., Marecos do Monte, M.H.F., Bontoux, L. and Asano, T. 1999. The status of wastewater reuse practice in the Mediterranean basin: Need for guidelines, Water Research, 33, (10). Elsevier.
Asano, T. (Ed.). 1998. Wastewater Reclamation and Reuse, Vol.10, Water Quality Management Library, Technomie Publishing Inc. Lancaster, PA USA.
Asano, T. 1991. Planning and implementation for Water Reuse Projects, Water Science and Technology, 10, (9).
Asano, T., F.L. Burton, H.L. Leverenz, R. Tsuchihashi and G. Tchobanoglous 2007: Water Resuse. Issues, Technologies, and Applications. New York.
Aquarec. 2006: Integrated Concepts for Reuse of Upgraded Wastewater. Handbook on feasibility studies for water reuse systems. Aachen; http://www.aquarec.org.
Aquarec. 2006a: Integrated Concepts for Reuse of Upgraded Wastewater), Research project funded by the European Commission. Final Report. EVK1-CT-2002-00130. Luxembourg, http://www.aquarec.org.
Aquarec. 2006b: Water reuse system management manuel. Project Report. EVK1-CT-2002-00130. Luxembourg.
Aquarec. 2006c: Handbook on feasibility studies for water reuse systems (= Workpage 4: Development o analysis tools for social, economic and ecological effects of water reuse), EVK1-CT-2002-00130. Luxembourg.
Asim, O., Petrou, S. 2005. Valuing a QALY: a review of current controversies. ExpertReview of Pharmacoeconomics and Outcomes Research. 5(6): 667-669.
Australia. Natural Resource Management Ministerial Council. Environment Protection and Heritage Council. National Guidelines on Water Recycling – Managing Health and Environmental Risks – Impact Assessment, Sydney, Australia, 2005, 85 pp.
Bate, R.N., Dubourg, W.R. 1997: A Net-back Analysis of Irrigation Water Demand in East Anglia. Journal of Environmental Management, 49, 311-322.
Bazza, M. 2002: Wastewater recycling and reuse in the near east region: Experiences and issues. IWA Regional Symposium on Water Recycling in Mediterranean Region, 26-29 September, Iraklio, Greece, 44-59.
Berbel, J. 2005. Water pricing and irrigation: A review of the European Experience. Molle F. Berkhoff J. and Barker R. (Eds): Irrigation water pricing policy in context: Exploring the gap between theory and practice. Published by IWMI/CABI.

References 117
Blumenthal, U. J., A. Peasey, G. Ruiz-Palacios, and Mara, D.D. Guidelines for Wastewater Reuse in Agriculture and Aquaculture: Recommended Revisions Based on New Research Evidence, Task No. 68, Part 1, Loughborough University, Loughborough, United Kingdom, June, 2000, 67 pp.
Borràs, G., Soler, M. and Sala, L. 2007. Summary of data concerning the quality of the reclaimed water produced at the Blanes Reclamatiion Plant (Costa Brava, Gironda, Catalonia). Proceedings of the 6th IWA Speialist Conference on Wastewater Reclamation and Reuse for Sustainability: Guiding the growth of water reuse. Antwerp, Belgium, October 9-12.
Borràs, G. 2002. Water Reuse in Catalonia, Spain: The case of the Tordera Delta. Proceedingsof the IWA Regional Symposium on Recycling in Mediterranean Region.Datzira. Iraklio, Greece, 26-29 September.
Catalonian Water Agency. 2006. Hidronomica convention.http://www.mediambient.gencat.net/aca/en//agencia/dades_ec/recuperacio.jsp#tit3Collado, J., Study to Produce a Proposal to Regulate the Annual Authorized Extraction
Volumes of National Surface Waters in the San Juan River Basin, Final Report to North American Development Bank Contract No. 75170154, of a work performed for the [Mexican] National Water Commission, June, 2006 a, 103 pp. + vii. (In Spanish).
Collado, J., Legal Characteristics of the National Waters in Mexico, XIX National Conference of Hydraulics, Cuernavaca, Morelos, Mexico, November (2006 b 9, pp. (In Spanish).
Drechsel, P. , Keraita, B., Amoah, P., Abaidoo, R.C., Raschid-Sally, L. and Bahri, A. 2007: Reducing health risks from wastewater use in urban and peri-urban sub-Saharan Africa – Applying the 2006 WHO guidelines. 6th IWA Specialist Conference on Wastewater Reclamation and Reuse for Sustainability: Guiding the growth of water resuse, October 9-12, Antwerp, Belgium. http://www.wrrs2007.org.
Durham, B. and Mierzejewski, M. 2002. Water reuse and zero liquid discharge: A sustainable water resource solution. IWA Regional Symposium on Water Recycling in Mediterranean Region, Iraklio, Greece, 26-29 September.
European Commission. DG ENV. 2000. Papers on the valuation of mortality. Workshop convened by the European Commission.
http://www.europa.eu.int/comm/environment/enveco/others/value_of_life.htmFAO. 1992. Wastewater treatment and use in agriculture – FAO irrigation and drainage
paper 47. Chapter 8. Rome.FAO. 2003a. Unlocking the water potential of agriculture. Rome.FAO. 2003b. World agriculture: towards 2015/2030. London, Earthscan Publications Ltd.
London.FAO. 2004. Economic valuation of water resources in agriculture: From the sectoral to a
functional perspective of natural management. FAO Water Reports No. 27. Rome.FAO. 2006. Water desalination for agricultural applications. Proceedings of the FAO Expert
Consultation on Water Desalination for Agricultural Applications, 26-27 2004, Rome.FAO. 2007. The State of Food and Agriculture 2007. Paying farmers for environmental
services. http://www.fao.org/docrep/010/yr1200e/yr1200e00.HTM.FAO. 2007a. Agriculture and Water Scarcity: a Pragmatic Approach to Water Use
Efficiency and Agricultural Productivity. Committee on Agriculture, Twentieth Session, COAG/2007/7, Rome, 25-28 April.
Feitelson, E. and Haddad M. 2001. Management of shared groundwater resources: The Israeli-Palestine case with an international perspective. Boston, Dordrecht, London.
Florida Reuse Coordinating Committee. 1996. Guidelines for preparation of reuse feasibility studies for consumptive use permit applicants. Issued by Florida Department of Environmental Protection, http://www.dep.state.fl.us/water/reuse/docs/feasibility.pdf .
Griffin, R.C. 2006. Water Resource Economics. The Analysis of Scarcity, Policies and Projects. Cambridge and London.

From waste to resource: the economics of wastewater reuse in agriculture118
Heinz, I. 2004. How can the Water Framework Directive cost categories be made more feasible? Economica delle fronti di energia e dell’ambiente, no. 3, 47-57.
Hernández, F., Urkiaga, A., de las Fuentes, L.,Bis, B., Koksis, T., Balasz, B., Chiru, E. 2006. Handbook on feasibility studies for water resuse systems. Aquarec: Integrated concepts for reuse of upgraded wastewater. WP 4.
Hidalgo, M.D. and Irusta, R. 2004. Reutilización de agua residual tratada de origen municipal en agricultura, VII Congreso Nacional del Medio Ambiente. Madrid (Spain).
Jewell, W. J. and Seabrook, B. L. A History of Land Application as a Treatment Alternative,U. S. Environmental Protection Agency, Technical Report MCD-40, Washington, D. C., 1979, 83 pp. + viii.
Jimenez, B. and Chavez, A. 2004). Quality assessment of an aquifer recharged with wastewater for its potential use as drinking source: El Mezquital case” Water Science and Technology 50 (2) : 269-273.
Jiménez Cisneros, B., Siebe, C. and Cifuentes, E. 2004 b). Intentional and Non-Intentional Water Reuse in the Tula Valley, in Jiménez, B. and L. Marín (Eds.) The Water in Mexico as Seen by the Academy, Mexican Academy of Sciences, Mexico City, Mexico, , pp. 33-55. (In Spanish).
Kretschmer N., Ribbe, L. and Gaese, H. 2000. Wastewater reuse for agriculture. Technology Resource Management & Development – Scientific Contributions for Sustainable Development, Vol. 2, http://www.google.de/search?hl=de&q=Kretschmer+Nicole+Wastewater+reuse+for+Agriculture&btnG=Google-Suche&meta=.
Lazarova, V., and Bahri, A. 2008. “Water reuse practices for agriculture,” Chap. 10, in B. Jiménez and T. Asano (eds.), Water Reuse: An International Survey of current practice, issues and needs, IWA Publishing, London.
MacDonald, D.H. 2004. The economics of water: Taking full account of first use, reuse and return to the environment. CSIRO Land and Water Client Report for the Australian Water Conservation and Reuse Research Program (AWCRRP).
Mancini, G., Sipala, S. and Vagliasindi, F.G.A. 2003. Criteria for marginal water treatment and reuse under drought conditions, International Workshop on Water Management under drought conditions, Valencia (Spain), 26-28 March.
Mara, D.D., Sleigh, P.A., Blumenthal, U.J., Carr, R.M. 2007). Health risks in wastewater irrigation: Comparing estimates from quantitative microbial risk analysis and epidemiological studies. Journal of Water and Health 5 (2): III-IV.
Maria, A. The Costs of Water Pollution in India, Centre d’Économie Industrielle, Ecole Nationale Supérieure des Mines de Paris, Paris, France, 2003, 55 pp.
Martínez Omaña, M. C., Libreros Muñoz, H. V., Quiñones Castillo, A. M., Montesillo Cedillo, J. L., López Hernández, R. I, and Ortiz Rendón, G. A. 2004 c), Water Management at the Federal District: Challenges and Proposals, National Autonomous University of Mexico, Mexico City, Mexico, 199 pp. (In Spanish).
Molle, F. and Berkhoff, J. 2006. Cities versus Agriculture: Revisiting Intersectorial Water Transfers, Potential Gains and Conflicts. Research Report 10. International Water Management Institute IWMI, Colombo. http://www.idrc.ca/en/ev-97317-201-1-DO_TOPIC.html.
Moss J., Wolff, G., Gladden, G., Guttieriez, E. 2003. Valuing water for better governance. How to promote dialogue to balance social, environmental, and economic values? WhitePaper sponsored by CEO PANEL Business and Industry. Prepared for the Third World Water Forum in Osaka, Japan, March 2003. http://www.ceopanel.org.
Muñoz, J. and Sala, L. 2007. Environmental criteria for alternative removal in treated wastewater. Proceedings of the 6th IWA Spealist Conference on Wastewater Reclamation and Reuse for Sustainability: Guiding the growth of water reuse. October 9-12, Antwerp, Belgium. http://www.wrrs2007.org.

References 119
Mujeriego, R. (ed.) 1990. Manual Práctico de Riego con Agua Residual Municipal Regenerada, Edicions de la Universitat Poletécnica de Catalunya, Barcelona (Spanish translation of Pettygrove and Asano, 1985.
Mushkin S.J. and Dunlop, D. W. 1979. Health: What is it worth? Measures of Health Benefits. New York.
OECD. 1999. The Price of Water: Trends in OECD Countries. Paris.OECD. 1994. Managing the environment: the role of economic instruments. Paris.Onkal, G. and Demir, I. 2006. Cost analysis of alternative methods for wastewater handling
in small communities”, Journal of Environmental Management, 79: 357-363.Perló Cohen, M. and González Reynoso, A. E. 2005 War for Water in the Valley of
Mexico?: Study Over the Hydraulic Relationships Between the Federal District and the State of Mexico, National Autonomous University of Mexico and Friedrich Ebert Stiftung, Mexico City, 2005, 141 pp. (In Spanish).
Renzetti, S. 2003. Full Cost Accounting for Water Supply and Sewage Treatment: A Case Study of the Niagara Region, Canada, World Bank’s Water Resources Management Group on Economic Instrument, http://worldbank.org.
Richard, D. 1998. “The cost of wastewater reclamation and reuse,” Chap. 29, in T. Asano (ed.), Wastewater Reclamation and Reuse, Water Quality Management Library 10, CRC Press, Boca Raton, Florida (originally published by Technomic Publishing, Lancaster, Pennsylvania), USA.
Rijsberman, F., 2006 “Water Management for Food and the Environment: Increasing Green and Blue Water Productivity to Balance Water for Food and Environment”, Framework Theme 4: Water Management for Food and the Environment, 4th World Water Forum,Mexico City, Mexico, March 2006, 16 pp.
Sala, L. and Serra, M 2004. Towards sustainability in water recycling. Water Sciences and Technology Vol 50, No 2, 1-7.
Seguí, L. 2004. Sistemas de Regeneración y Reutilización de Aguas Residuales. Metodología para el Análisis Técnico-Económico y Casos. Tesis Doctoral. Universidad Politécnica de Cataluña.
Shuval, H. I., Adin, A. Fattal, B., Rawitz, E. and Yekutiel, P. 1986 Wastewater Irrigation in Developing Countries: Health Effects and Technical Solutions, UNPD Project Management Report Number 6, World Bank Technical Paper Number 51, Washington, D. C., 1986, 324 pp. + xxxi.
Sipala S., Mancini, G. and Vagliasindi, F.G.A. 2002. Development of a web-based tool for the calculation of costs of different wastewater treatment and reuse scenarios. IWA Regional Symposium on Water Recycling in Mediterranean Region, Iraklio, Greece,26-29 September.
Snell, M. 1997. Cost-benefit analysis for engineers and planners. Thomas Telford, London.Spulber, N. and Sabbaghi, A. 1998. Economics of Water Resources : From Regulation to
Privatization. Dordrecht, London.State of California. 1978. Wastewater reclamation criteria. California Administrative code,
Title 22, Division A, Environmental Health. Department of Health Services. California.Swierc, J., Page, D., van Leeuwen, J., Dillon, P. 2005. Preliminary hazard analysis and
critical control points plan (HACCP) - Salisbury stormwater to drinking water aquifer storage transfer and recovery (ASTR) Project. Land and water technical report No. 20/05, CSIRO, Adelaide.
Tortajada, C. 2006. Who Has Access to Water? Case Study of Mexico City Metropolitan Area,Human Development Report 2006, Human Development Report Office Occasional Paper, United Nations Develoment Programme, New York, New York, 2006, 47 pp.
Tortajada, C. and Castelán, E. 2003. Water Management for a Megacity: Mexico City Metropolitan Area. Royal Swedish Academy of Sciences, Ambio, 32,2, 124-129.

From waste to resource: the economics of wastewater reuse in agriculture120
U.S.Environmental Protection Agency. and U.S. Agency for International Development.1992. Guidelines for water reuse. Report No. EPA/625/R-92/004. EPA,Washington, D.C.
U.S.Environmental Protection Agency and U.S. Agency for International Development2004. Guidelines for water reuse. Report No. EPA/625/R-04/108, 2nd edition. EPA,Washington, D.C.
U.S.Environmental Protection Agency. 2006 Land Treatment of Municipal Wastewater Effluents, Technical Report EPA/625/R-06/016 , Washington, D. C., 2006, 194 pp. + xiv.
United Nations Educational, Scientific, and Cultural Organization. 2006 “Water: A Shared Responsibility”, The United Nations World Water Development Report 2, Berhahn Books, New York, New York, 2006, 584 pp. + xvi.
UN Millennium Project. 2005, Health, Dignity, and Development: What Will it Take?Earthscan, London.
United Nations Statistics Division. 2007 System of Environmental-Economic Accounting for Water, Final Draft, March, 2007, 198 pp. + v.
Van Beukering, P., van Drunen, M., .Dorland, K., Jansen, H., Ozdemiroglu, E. and Pearce, D. 1998. External economic benefits and costs in water and solid waste investments. Methodology, Guidelines and Case Studies. IVM Institute for Environmental Studies, Vrije Universiteit, Amsterdam.
Westrell,T., Schönning,C., Stenström,T.A., Ashbolt, N.J. 2003. QMRA and HACCP for management of pathogens in wastewater and sewage sludge treatment and reuse. Proceedings of the 4th international symposium on wastewater reclamation and reuse. Mexico City.
WHO Guidelines. 2004. Guidelines for drinking water quality, 3rd ed. Geneva.WHO Guidelines. 2006. WHO Guidelines for the safe use of wastewater, excreta and
greywater. Volume II: Wastewater use in agriculture. Geneva. World Bank. Agriculture for Development 2007 , World Development Report 2008,
Washington, D. C., 2007, 365 pp. + xviii.World Health Organization. WHO Guidelines for the Safe Use of Wastewater, Excreta
and Greywater, Volume II: Wastewater Use In Agriculture, Geneva, Switzerland, 196 pp. + xxiii.
World Water Council. 2006 “Task Force on Financing Water for All, Report 1: Enhancing Access to Finance for Local Governments, Financing Water for Agriculture”, World Water Council, Marseilles, France, 2006, 61 pp. + xiii.

References 121
OFFICIAL DOCUMENTS RELEVANT TO MEXICO CASE STUDIESMexico. Federal District Executive Power. Master Plan of Potable Water for the Federal
District 1997-2010, Mexico City, Mexico, July, 1997 a. (In Spanish).Mexico. Federal District Executive Power. Regulations of Water and Drainage Service for
the Federal District, Mexico City, Mexico, October, 1997 b. (In Spanish).Mexico. Federal District Executive Power. General Direction of Hydraulic Construction
and Operation, Compendium of the Water Situation in the Federal District, Mexico City, Mexico, 1998 a. (In Spanish).
Mexico. Federal District Executive Power. Environmental and Territorial Ordering Attorney General of the Federal District, Anual Report 2003: Water, Mexico City, Mexico, May, 2004 a, 28 pp. (In Spanish).
Mexico. Federal District Executive Power. General Development Plan 2007-2012, Mexico City, Mexico, January, 2007, 80 pp. + xxxii. (In Spanish).
Mexico. Federal District Legislative Assembly. Financial Code of the Federal District 2007, Official Federation Diary, Mexico City, Mexico, December 31, 2006 a, 393 pp. (In Spanish).
Mexico. Federal Executive Power. National Institute of Statistics, Geography and Informatics, Good Production Activities, Economical Census 1999: Mining and Oil Extraction, Electricity, and Water Collection, Treatment and Supply, 2001 a, Aguascalientes, Aguascalientes, Mexico, 373 pp. (In Spanish).
Mexico. Federal Executive Power. National Institute of Statistics, Geography and Informatics, Economic and Ecological Accounting System 1999-2004, 2006 b, Aguascalientes, Aguascalientes, Mexico, 166 pp. (In Spanish).
Mexico. Federal Executive Power. National Water Commission, Surface Water Availability in Panuco River Basin, Official Federation Diary, Mexico City, Mexico, October 26, 1998 b, 3 pp. (In Spanish).
Mexico. Federal Executive Power. National Water Commission, Water Cost, Value and Price in Mexico, National Water Commission, Javier Barros Sierra Foundation and Technological Autonomous Institute of Mexico, Mexico City, Mexico, 2000, 232 pp. (In Spanish).
Mexico. Federal Executive Power. National Water Commission, Determination of the Ground Water Availability if the Guadiana Valley Aquifer, State of Durango, Mexico City, Mexico, 2002, 29 pp. (In Spanish).
Mexico. Federal Executive Power. National Water Commission, Budget Self-Sufficiency Fees for Irrigation Districts 2000-2002, Mexico City, Mexico, 2003 a, 349 pp. (In Spanish).
Mexico. Federal Executive Power. National Water Commission, Ground Water Availability in 188 Aquifers, Official Federation Diary, Mexico City, Mexico, January 31, 2003 b, 113 pp. (In Spanish).
Mexico. Federal Executive Power. National Water Commission, Basic Compendium of Water 2004: Regional Office XIII, Mexico City Valley and Cutzamala System Waters,Mexico City, Mexico, 2004 c, 149 pp. (In Spanish).
Mexico. Federal Executive Power. National Water Commission, Situation of the Potable Water, Sewage and Sanitation Subsector as of December 2003, Mexico City, Mexico, 2004 d, 159 pp. (In Spanish).
Mexico. Federal Executive Power. National Water Commission, National Inventory of Municipal Potabilization and Treatment Plants in Operation, 2005 Edition, Mexico City, Mexico, 2005 a, 237 pp. (In Spanish).
Mexico. Federal Executive Power. National Water Commission, Directive Plan for the Integral Modernization of Irrigation District 003 Tula, Mexico City, Mexico, 2005 b, 329 pp. (In Spanish).
Mexico. Federal Executive Power. National Water Commission, Cost-Benefit Analysis of the Integral Modernization of Irrigation District 003 Tula, Mexico City, Mexico, 2005 c, 127 pp. (In Spanish).

From waste to resource: the economics of wastewater reuse in agriculture122
Mexico. Federal Executive Power. National Water Commission, Directive Plan for the Integral Modernization of Irrigation District 011 Alto Río Lerma, Mexico City, Mexico, 2005 d, 329 pp. (In Spanish).
Mexico. Federal Executive Power. National Water Commission, Cost-Benefit Analysis of the Rehabilitation and Modernization Program of Irrigation District 011 Alto Río Lerma,Mexico City, Mexico, 2005 e, 78 pp. (In Spanish).
Mexico. Federal Executive Power. National Water Commission, Water Statistics in Mexico, 2005 Edition, Mexico City, Mexico, 2005 f, 104 pp. (In Spanish).
Mexico. Federal Executive Power. National Water Commission, Statistics on Water 2005: Waters of the Valley of Mexico and the Cutzamala System, Regional Office XIII, Mexico City, Mexico, 2005 g, 110 pp.
Mexico. Federal Executive Power. National Water Commission, Water Statistics in Mexico, 2006 Edition, Mexico City, Mexico, 2006 c, 198 pp. (In Spanish).
Mexico. Federal Executive Power. National Water Commission, Agricultural Statistics in Irrigation Districts, 2004-2005 Edition, Mexico City, Mexico, 2006 d, 413 pp. (In Spanish).
Mexico. Federal Executive Power. National Water Commission, Wastewater Management in Metropolitan Mexico City and its Contribution to the Development of Mexico and Tula Valleys, Local Action LA1703, presented in Session FT1.02 Wastewater Management to Fight Poverty, World Water Forum IV, Mexico City, Mexico, 2006 e, 14 pp. (In Spanish).
Mexico. Federal Executive Power. National Water Commission, Water Management in Mexico: Advances and Challenges 2006, Mexico City, Mexico, 2006 f, 249 pp. (In Spanish).
Mexico. Federal Executive Power. National Water Commission, Director Plan for the Integral Modernization of Irrigation District 011 Alto Río Lerma, Mexico City, Mexico, 2006 g, 231 pp. (In Spanish).
Mexico. Federal Executive Power. National Water Commission, Cost-Benefit Analysis for the Integral Modernization of Irrigation District 011 Alto Río Lerma, Mexico City, Mexico, 2006 h, 127 pp. (In Spanish).
Mexico. Federal Executive Power. National Water Commission, Agricultural and Water Use Statistics in Irrigation Districts, 1990-2006, Mexico City, Mexico, 2007 b. (In Spanish).
Mexico. Federal Executive Power. National Water Commission, Agricultural Statistics in Irrigation Units, 2004-2005, Mexico City, Mexico, 2007 c, 514 pp. + viii. (In Spanish).
Mexico. Federal Executive Power. National Water Commission, Water Statistics in Mexico, 2007 Edition, Mexico City, Mexico, 2007 d, 257 pp. (In Spanish).
Mexico. Federal Executive Power. National Water Commission, Directive Plan for the Integral Modernization of Irrigation District 052 State of Durango, Mexico City, Mexico, 2007 e, 129 pp. (In preparation ). (In Spanish).
Mexico. Federal Executive Power. National Water Commission, Cost-Benefit Analysis of the Integral Modernization of Irrigation District 052 State of Durango, Mexico City, Mexico, 2007 f, 127 pp. (In Spanish).
Mexico. Federal Executive Power. National Water Commission and Mexican Institute of Water Technology, Indicators of Industrial Water Use: Food Industry, National Water Commission and Mexican Institute of Water Technology, Mexico City, Mexico, 2001 b, 129 pp. (In Spanish).
Mexico. Federal Executive Power. Environmental, Natural Resources and Fishing Secretary, NOM-001-ECOL-1996, Official Federation Diary, Mexico City, Mexico, June 24, 1996, 33 pp. (In Spanish).
Mexico. Federal Executive Power. Environmental, Natural Resources and Fishing Secretary and National Institute of Ecology, Third National Communication to the Parts of the United Nations Frame Convention on Climate Change, Mexico City, Mexico, October, 2006 i, 208 pp. + xl. (In Spanish).

References 123
Mexico. Federal Executive Power. Agriculture, Cattle Raising, Rural Development. Fishing and Nourishment Secretary, Operating Rules for the Water Use Rights Acquisition Program, Official Federation Diary, Mexico City, Mexico, August 12, 2003 c, pp. 47-56. (In Spanish).
Mexico. Federal Executive Power. Environmental, Natural Resources and Fishing Secretary, Technical Studies to Determine the Surface Water Availability in the Pánuco River Basin, Official Federation Diary, Mexico City, Mexico, October 26, 1998 c, pp. 7-9. (In Spanish).
Mexico. Federal Legislative Power, Decree from which there are Reformed, Added and Abolished Diverse Dispositions to the National Waters Law, Official Federation Diary, Mexico City, Mexico, April 29, 2004 d, pp. 27-98. (In Spanish).
Mexico. Federal Legislative Power, Federal Law of Rights 2007 (Applicable Dispositions to National Waters), Official Federation Diary, Mexico City, Mexico, December 27, 2006 j, 70 pp. (In Spanish).
Mexico. Municipal Executive Power of Durango, Public Services Regulations for the Durango Municipality, Municipal Resolution No. 289, Durango City, Durango, Mexico, November, 1997 c, 53 pp. (In Spanish).
Mexico. Municipal Executive Power of Durango, Public Services Regulations for the Durango Municipality, Municipal Resolution No. 8694, Durango City, Durango, Mexico, Durango Municipal Gazette No. 146, August 19, 2005 h, 42 pp. (In Spanish).
Mexico. State Legislative Power of Durango, Income Law for Durango Municipality, Durango, in the Fiscal Year 2007, Decree No. 384, Official Diary of the State of Durango No. 49, Durango City, Durango, Mexico, June 21, 2007 g, 139 pp. (In Spanish).
Mexico. Municipal Executive Power of Guanajuato, By-Laws of the Municipal System of Potable Water and Sewerage of Guanajuato Municipality (SIMAPAG), Official Diary of the State of Guanajuato, Year LXXXVIII, Volume CXXXIX, No. 41, Resolution 4897, May 22, 2001 c, 36 pp. (In Spanish).
Mexico. Municipal Executive Power of Guanajuato, Planning By-Laws for the Integral Development of Guanajuato Municipality, Official Diary of the State of Guanajuato, Year LXXXVIII, Volume CXXXIX, No. 72, Resolution 20, September 7, 2001 d, 11 pp. (In Spanish).
Mexico. State Legislative Power of Guanajuato, Income Law for Guanajuato Municipality, Guanajuato, in the Fiscal Year 2007, Decree No. 17, Official Diary of the State of Guanajuato, Year XCIII, Volume CXLIV, No. 202, Guanajuato City, Guanajuato, Mexico, December 19, 2006 k, pp. 99-158. (In Spanish).
Mexico. State Executive Power of Guanajuato. Guanajuato State Water Commission (CEAG). Municipality of Guanajuato City. Municipal System of Potable Water and Sewerage (SIMAPAG), Sectorial Diagnosis of Potable Water and Sanitation 2000-2005,Guanajuato City, Guanajuato, Mexico, 2007 h, 2 pp. (In Spanish).
Adams, W.M. 1993. Indigenous use of wetlands and sustainable development in West Africa. Geog. J., 159(2): 209–218.
Adamus, P.R. & Stockwell, L.T. 1983. A method for wetland functional assessment: volume 1 – critical review and evaluation concepts. Report FHWA–IP–82–83. Washington, DC, US Department of Transportation, Federal Highway Administration.
Adey, S. 2007. A journey without maps: towards sustainable subsistence agriculture in South Africa. Wageningen, Netherlands, Wageningen University and Research Centre.
Adger, W.N. 2000. Social and ecological resilience: are they related? Prog. Hum. Geog., 24:347–364.
Ahmed, R., Haque, M.R. & Khan, M.S.I. 2004. Introduction to community-based hoar and floodplain resource management. Dhaka, IUCN Bangladesh Country Office.
Barbier, E.B. 1993. Sustainable use of wetlands – valuing tropical wetland benefits: economic methodologies and applications. Geog. J., 159(1): 22–32.

From waste to resource: the economics of wastewater reuse in agriculture124
Barbier, E.B., Acreman, M. & Knowler, D. 1997. Economic valuation of wetlands: a guide for policy makers and planners. Gland, Switzerland, Ramsar Convention Bureau.
Bastian, R.K. & Benforado, J. 1988. Water quality functions of wetlands: natural and managed systems. In D.D. Hook, W.H. McKee, H.K. Smith, J. Gregory, V.G. Burrell, M.R. DeVoe, R.E. Sojka, S. Gilbert, R. Banks, L.H. Stolzy, C. Brooks, T.D. Matthews & T.H. Shear, eds. The ecology and management of wetlands, volume 1: ecology of wetlands,pp. 87–97. Portland, USA, Timber Press.
Bayliss-Smith, T. & Golson, J. 1992. Wetland agriculture in New Guinea highlands prehistory. In B. Coles, ed. The wetland revolution in prehistory, pp. 15–27. Exeter, UK, The Prehistoric Society and WARP, University of Exeter.
Berg, J. van den, Salleh, N., Demies, M. & Amir, J. 2004. Rapid diagnostic appraisal of non timber forest products of the Maludam National Park Betong Division Sarawak. Sarawak, Malaysia, Forest Department. Joint Working Group Malaysia – the Netherlands: development and management of Maludam National Park.
Bernard, P.S. 2003. The ecological implications of the water spirit beliefs in southern Africa. In A. Watson & J. Sproull, eds. Proceedings of the Seventh World Wilderness Congress Symposium: science and stewardship to protect and sustain wilderness values; 2001 November 2–8; Port Elizabeth, South Africa.
Blake, D.J.H. 2006. The Songkhram River wetlands – a critical floodplain ecosystem of the lower Mekong basin. Paper for 9th International River Symposium, 2006, Brisbane, Australia. (available at www.riversymposium.com).
Blake, D.J.H. & Pitakthepsombut, R. 2006a. Situation analysis: lower Songkhram River basin, Thailand. Bangkok, Mekong Wetlands Biodiversity Conservation and Sustainable Use Programme.
Blake, D.J.H. & Pitakthepsombut, R. 2006b. Tai Baan Research – from community awareness to adaptive wetland management in the lower Mekong basin. Paper for 9th International River Symposium, 2006, Brisbane Australia. (available at www.riversymposium.com).
Bondestam, L. 1974. People and capitalism in the northeast lowlands of Ethiopia. J. Mod. Afr. Stud., 12(3): 423–439.
Bullock, A. & Acreman, M. 2003. The role of wetlands in the hydrological cycle. Hydrol.Earth Sys. Sci., 7: 358–389.
Bwathondi, P.O.J. & Mwamsojo, G.U.J. 1993. The status of the fishery resource in the wetlands of Tanzania. In G.L. Kamukala & S. Crafter, eds. Wetlands of Tanzania. Proceedings of a seminar on the wetlands of Tanzania, Ngorogoro, Tanzania, 20–27 November, 1991, pp. 49–60. Gland, Switzerland, IUCN.
Carter, V. & Novitzki, R.P. 1988. Some comments on the relation between groundwater and wetlands. In D.D. Hook, W.H. McKee, H.K. Smith, J. Gregory, V.G. Burrell, M.R. DeVoe, R.E. Sojka, S. Gilbert, R. Banks, L.H. Stolzy, C. Brooks, T.D. Matthews & T.H. Shear, eds. The ecology and management of wetlands volume 1: ecology of wetlands,pp. 68–86. Portland, USA, Timber Press.
Chabwela, H.N. 1992. Wetlands as potential sites for the future of tourism development. In R.J.C. Jeffery, H.N. Chabwela, G. Howard & P.J. Dugan, eds. Managing the wetlands of Kafue Flats and Bangweulu Basin, Proceedings of the WWF–Zambia Wetlands Project Workshop, Musungwa Safari Lodge, Kafue National Park, Zambia, 5–7 November 1986,pp. 71–73. Gland, Switzerland, IUCN.
Colchester, M., Jiwan, N, Andiko, Sirait, M., Firdaus, A.Y., Surambo, A. & Pane, H. 2006. Promised land: palm oil and land acquisition in Indonesia: implications for local communities and indigenous peoples. Moreton in the Marsh, UK, Forest Peoples Programme, and Bogor, Indonesia, Sawit Watch.
Comprehensive Assessment of Water Management in Agriculture (CA). 2007. Water for food, water for life: a comprehensive assessment of water management in agriculture.London, Earthscan; and Colombo, IWMI.

References 125
Davis, T.J. 1994. The Ramsar Convention manual: a guide to the convention on wetlands of international importance, especially as waterfowl habitat. Gland, Switzerland, Ramsar Convention Bureau.
De Merona, B. 1992. Fish communities and fishing in a floodplain lake of central Amazonia. InE. Maltby, P.J. Dugan & J.C. Lefeuvre, eds. Conservation and development: the sustainable use of wetland resources, Proceedings of the Third International Wetlands Conference, Rennes, France, 19 – 23 September 1988, pp. 165–177Gland, Switzerland, IUCN.
Denevan, W.M. 1982. Hydraulic agriculture in the American tropics: forms, measures and recent research. In K.V. Flannery, ed. Maya subsistence. pp. 181–204. London, Academic Press.
Denny, P. 1994. Biodiversity and wetlands. Wetl. Ecol. Man., 3(1): 55–61.Denny, P. 1997. Implementation of constructed wetlands in developing countries. Wat. Sci.
Technol., 35(5): 27–34.Dey, M.M. & Prein, M. 2004. Community based fish culture in seasonally flooded rice fields
in Bangladesh and Vietnam. Paper presented at New directions for a diverse planet: proceedings of the 4th International Crop Science Congress, 26 September – 1 October 2004, Brisbane, Australia.
Dijk, G. van. 1991. The status of semi-natural grasslands in Europe. In P.D. Goriup, L.A. Batten & A. Norton, eds. The conservation of lowland dry grassland birds in Europe – Proceedings of an international seminar held at the University of Reading, 20–22 March 1991, pp. 154–236. Peterborough, UK, Joint Nature Conservation Committee.
Dixon, A.B. 2003. Indigenous management of wetlands: experiences in Ethiopia. Aldershot, UK, Ashgate.
Dixon, A.B. & Wood, A.P. 2003. Wetland cultivation and hydrological management in East Africa: matching community and hydrological needs through sustainable wetland use. Nat. Res. For., 27(2): 117–129.
Dixon, A.B. & Wood, A.P. 2007. Local institutions for wetland management in Ethiopia: sustainability and state intervention. In B. van Koppen, M. Giordano & J. Butterworth, eds. Community-based water law and water resources management reform in developing countries. Comprehensive Assessment of Water Management in Agriculture Series 5. Wallingford, UK, CABI International.
Drew, W., Ewel, K.C., Naylor, R.L. & Sigrah, A. 2005. A tropical freshwater wetland: III. Direct use values and other goods and services. Wetl. Ecol. Man., 13: 685–693.
Dries, I. 1989. Development of wetlands in Sierra Leone: farmers’ rationality opposed to government policy. In M. Marchand & H.A. Udo, eds. The people’s role in wetland management, Proceedings of the International Conference in Leiden, The Netherlands, June 5–8 1989, pp. 833–843. Leiden, Netherlands, Centre for Environmental Studies, Leiden University.
Dries, I. 1991. Development of wetlands in Sierra Leone: farmers’ rationality opposed to government policy. Lands. Urb. Plan., 20: 223–229.
Dugan, P., ed. 1993. Wetlands in danger. London, Mitchell Beazley.Dugan, P.J. 1990. Wetland conservation: a review of current issues and action. Gland,
Switzerland, IUCN.Duim, V.R. van der & Henkens, R.J.H.G. 2007. Wetlands, poverty reduction and sustainable
tourism development: opportunities and constraints. Wageningen, Netherlands, Wetlands International.
Etherington, J.R. 1983. Wetland ecology. Studies in Biology No. 154. London, Edward Arnold.
FAO. 1998. Wetland classification and characterization for sustainable agricultural development. Harare, FAO Subregional Office for East and Southern Africa (available at http://www.fao.org)

From waste to resource: the economics of wastewater reuse in agriculture126
FAO. 2002. Wetland development and management in SADC countries. Proceedings of a subregional workshop, 19–23 November, 2001, Harare, Zimbabwe, by K. Frenken & I. Mharapara, eds. Harare, FAO Subregional Office for East and Southern Africa (available at ftp://ftp.fao.org).
FAO. 2003. The role and nutritional value of aquatic resources in the livelihoods of rural people – a participatory assessment in Attapeu Province, Lao PDR, by E. Meusch, J. Yhoung-Aree, R. Friend & S.J. Funge-Smith. Bangkok, FAO Regional Office Asia and the Pacific.
FAO. 2006. Stakeholder-oriented valuation to support water resources management processes – confronting concepts with local practices. Water Report No. 30. Rome, FAO, IWMI, IUCN, Imperial College London. 75 pp.
FAO & The WorldFish Center. 2004. Culture of fish in rice fields, by M. Halwart & M.V. Gupta, eds. 83 pp.
Finlayson, C.M., Davidson, N.C., Spiers, A.G. & Stephenson, N.J. 1999. Global wetland inventory – current status and future priorities. Mar. Fresh. Res., 50: 717–727.
GAWI. 2006. Guidelines on agriculture, wetlands and water resources interactions project (GAWI): project proposal. (mimeo)
Gluckman, M. 1941. The economy of the central Barotse plain. Rhodes-Livingstone Papers, No. 7. Manchester, UK, Manchester University Press.
Gopal, B. 1987. Water hyacinth. Aquatic Plant Studies No. 1. Amsterdam, Netherlands, Elsevier.
Gopal, B. 1999. Natural and constructed wetlands for wastewater treatment: potentials and problems. Wat. Sci. Technol., 40(3): 27–35.
Gregory, R. & Guttman, H. 2002. The ricefield catch and rural food security. In P. Edwards, D.C. Little & H. Demaine, eds. Rural aquaculture, pp. 1–13. Wallingford, UK, CABI Publishing.
Hooijer, A., Silvius, M., Wosten, H. & Page, S. 2006. PEAT-CO2. Assessment of CO2 emissions from drained peatlands in SE Asia. Delft Hydraulics Report Q3043. Delft, Netherlands.
Hughes, F.M.R. 1996. Wetlands. In W.M. Adams, S.A. Goudie & A.R. Orme, eds. Thephysical geography of Africa, pp. 267–286. Oxford, UK, Oxford University Press.
Hughes, J.M.R. 1992. Use and abuse of wetlands. In A.M. Mannion & S.R. Bowlby, eds. Environmental issues in the 1990’s, pp. 211–226. Chichester, UK, Wiley.
Inland Valley Consortium, West African Rice Development Association. 1997. Aframework for regional cooperation for the sustainable development of inland valley agro-ecosystems in Sub-Saharan Africa. Bouake, Côte d’Ivoire, Inland Valley Consortium, West African Rice Development Association.
IUCN, Thua Thien Hue PPC and FAO. 2006 Project proposal for the Huong River Basin Integrated Water Management Project. Unpublished. 70 pp.
Kiersch, B., Hermans, L. & Halsema, van, G. 2005. Payment schemes for water related environmental services; a financial mechanism for natural resources management. Experiences from Latin America and the Caribbean. Paper for UNECE seminar on environmental services and financing for the protection and sustainable use of ecosystems, 10–11 October 2005, Geneva, Switzerland.
Kimmage, K. 1991. Small scale irrigation initiatives in Nigeria: the problems of equity and sustainability. Appl. Geog., 11: 5–20.
Kivaisi, A.K. 2001. The potential for constructed wetlands for wastewater treatment and reuse in developing countries: a review. Ecol. Eng., 16: 545–560.
Lorenzen, K., Khoa, S.N. & Garaway, C. 2006. Management of impacts of irrigation development on fisheries – guidance manual. Penang, Malaysia, WorldFish; Colombo, IWMI; and London, Imperial College.
Maltby, E. 1986. Waterlogged wealth: why waste the world’s wet places? London, Earthscan, IIED.

References 127
Marie, J. 2000. Delmasig: hommes, milieux, enjeux spatiaux et fonciers dan le delta interieur du Niger (Mali). Paris, HDR, Univ. Paris –X.
McCann, J.C. 1995. People of the plow. An agricultural history of Ethiopia, 1800–1990.Wisconsin, USA, University of Wisconsin Press.
McEldowney, S., Hardman, D.J. & Waite, S. 1993. Pollution: ecology and treatment.London, Longman Scientific and Technical.
Meinzen-Dick, R. & Bakker, M. 1999. Irrigation systems as multiple-use commons: water use in Kirindi Oya, Sri Lanka. Agric. Hum. Val., 16: 281–293.
Mihayo, J.M. 1993. Water supply from wetlands in Tanzania. In G.L. Kamukala & S.A. Crafter, eds. Wetlands of Tanzania, Proceedings of a Seminar on the Wetlands of Tanzania. Morogoro, Tanzania, 20–27 November 1991, pp. 67–72. Gland, Switzerland, IUCN.
Millennium Ecosystem Assessment (MA). 2005a Ecosystems and human well-being: synthesis. Washington, DC, World Resources Institute.
Millennium Ecosystem Assessment (MA). 2005b. Ecosystems and human well-being: wetlands and water synthesis. Washington, DC, World Resources Institute.
Mitsch, W.J., Mitsch, R.H. & Turner, R.E. 1994. Wetlands of the old and new worlds: ecology and management. In W.L Mitsch, ed. Global wetlands: old world and new,pp. 3–56. Amsterdam, Netherlands, Elsevier.
Molle, F. & Floch, P. 2007. Water poverty and the governance of megaprojects: the Thai “water grid”. Working Paper. Mekong Programme on Water, Environment and Resilience. Chiang Mai, Thailand, IRD/IWMI/M-POWER.
Mulugeta, S. 2004. Socio-economic determinants of wetland cultivation in Kemise, Illubabor Zone, Southwest Ethiopia. E. Afr. Soc. Sci. Res. Rev., 20(1): 93–114.
Muthuri, F. 1993. Plant products from freshwater wetlands. In S.A. Crafter, S.G. Njuguna & G.W. Howard, eds. Wetlands of Kenya, Proceedings of the KWWG Seminar on Wetlands of Kenya, Nairobi, Kenya, 3–5 July 1991, pp. 109–113. Gland, Switzerland, IUCN.
Ocampo-Thomason, P. 2006. Mangroves, people and cockles: impacts of the shrimp-farming industry on mangrove communities in Esmeraldas Province, Ecuador. In C.T. Hoanh, T.P. Tuong, J.W. Gowing & B. Hardy, eds. Environment and livelihoods in tropical coastal zones, pp. 140–153. Wallingford, UK, CAB International.
Odum, E.P. 1979. The value of wetlands: a hierarchical approach. In P.E. Greeson, P.E. Clark & J.R. Clark, eds. Wetland functions and values: the state of our understanding,pp. 1–25. Bethesda, USA, American Water Resources Association.
Omari, C.K. 1993. Social and cultural values of wetlands in Tanzania. In G.L. Kamukala & S.A. Crafter, eds. Wetlands of Tanzania, Proceedings of a Seminar on the Wetlands of Tanzania. Morogoro, Tanzania, 20–27 November 1991, pp. 95–102. Gland, Switzerland, IUCN.
Owen, R., Verbeek, K., Jackson, J. & Steenhuis, T. 1994. Dambo farming in Zimbabwe: water management, cropping and soil potentials for smallholder farming in the wetlands.New York, USA, CIIFAD, and Harare, University of Zimbabwe.
Pattnaik, A. 2005. The restoration of the Chilika Lagoon, a coastal wetland in India: the achievement of combined integrated water resources management and enhanced community participation. Cases study for the FAO/Netherlands conference on water for food and ecosystems (available at http://www.fao.org).
Primavera, J.H. 1995 Mangroves and brackishwater pond culture in the Philippines. Hydrobiologia, 295: 303–309.
Roberts, N. 1988. Dambos in development: management of a fragile ecological resource. J.Biogeog., 15: 141–148.
Roggeri, H. 1998 Tropical freshwater wetlands: a guide to current knowledge and sustainable management. Dordrecht, Netherlands, Kluwer Academic Publishers.

From waste to resource: the economics of wastewater reuse in agriculture128
Sanyanga, R.A. 1994. Tourism and wetlands management in Zimbabwe with special reference to the Zambezi river system. In T. Matiza & S.A. Crafter, eds. Wetlands ecology and priorities for conservation in Zimbabwe, Proceedings of a seminar on the wetlands of Zimbabwe, Harare, 13–15th January 1992, pp. 79–85. Gland, Switzerland, IUCN.
Scoones, I. 1991. Wetlands in drylands: the agro-ecology of savannah systems in Africa.London, IIED Drylands Programme.
Silvius, M.J., Oneka, M. & Verhagen, A. 2000 Wetlands: lifelines for people at the edge. Phys. Chem. Earth Part B, 25: 645–652.
Soerjani, M. 1992. Utilisation of wetland plant resources by rice farmers in Indonesia. In E. Maltby, P.J. Dugan & J.C. Lefeuvre, eds. Conservation and development: the sustainable use of wetland resources, Proceedings of the Third International Wetlands Conference, Rennes, France, 19–23rd September 1988, pp. 21–29. Gland, Switzerland, IUCN.
Turner, B. 1984. Changing land use patterns in the fadamas of northern Nigeria. In E. Scott, ed. Life before the drought, pp 149–170. Boston, USA, Allen & Unwin.
Turner, B. 1989. The role of fadamas in land resources management in northern Nigeria. InE.A. Olofin & S. Patrick, eds. Land administration and development in northern Nigeria: case studies, pp 103–111. Kano, Nigeria, Department of Geography, Bayero University.
Turner, B. 1994. Small-scale irrigation in developing countries. Land Use Pol., 11(4): 251–261.
Turner, R.K. 1988. Wetland conservation: economics and ethics. In D. Collard, D.W. Pearce & D. Ulph, eds. Economics, growth and sustainable environments: essays in memory of Richard Lecomber, pp. 121–151. London, MacMillan.
Turner, R.K., Brouwer, R., Georgiou, S. & Bateman, I.J. 2000. Ecosystem functions and services: an integrated framework and case study for environmental evaluation. CSERGE Working Paper GEC 2001–21. Norwich, UK, University of East Anglia; and London, University College.
United Nations Economic Commission for Europe (UNECE). 2007. Recommendationson payments for ecosystem services in integrated water resources management. United Nations Economic Commission for Europe – Convention on the Protection and Use of Transboundary Watercourses and International Lakes. New York and Geneva, United Nations. 51 pp.
United Nations Environment Programme (UNEP), Global Environmental Facility, Global Environmental Centre & Wetlands International. 2007. Assessment on peatlands, biodiversity and climate change. Executive summary. Nairobi, UNEP.
Williams, J. 2006. Resource management and Maori attitudes to water in southern New Zealand. N. Z. Geog., 62: 73–80.
Wood, A.P. 2001. Gender and wetland development. In Y. Dellalegn, ed. The wetlands of Ethiopia, pp. 58–66. Gland, Switzerland, IUCN.
Wood, A.P. & Dixon, A.B. 2002. Sustainable wetland management in Illubabor Zone. Research Report Summaries. Huddersfield, UK, Wetlands & Natural Resources Research Group, Huddersfield University.
Wood, A.P., Rushworth, G. & Corr, J. 2005. Human impact on the valley systems of the southwest Ethiopian Highlands: implications for development. Paper presented at the Institute of British Geographers / Royal Geographical Society Annual Conference, London, September 2005.
Wood, A.P., Hailu, A., Abbot, P.G, & Dixon, A.B. 2002. Sustainable management of wetlands in Ethiopia: local knowledge versus government policy. In M. Gawler, ed. Strategies for wise use of wetlands: best practices in participatory management, Proceedings of a Workshop held at the 2nd International Conference on Wetlands and Development, November 1998, Dakar, Senegal, pp. 81–88. Gland, Switzerland, IUCN.
Woodhouse, H., Bernstein, H. & Hulme, D. 2000 African enclosures? The social dynamics of wetlands in drylands. Oxford, UK, James Currey.

References 129
Zimmerer, K.S. 1991. Wetland production and smallholder persistence: agricultural change in a highland Peruvian region. Ann. Assoc. Amer. Geog., 81(3): 443–463.
Zingstra, H. 2005. Integrated river basin management of the River Sava. Wageningen, Netherlands, Wageningen International.
Zwarts, L., Beukering, van, P., Kone, B. & Wymenga, E. 2005. The Niger, a lifeline: effective management in the upper Niger basin. Wageningen, Netherlands, RIZA/Wetlands International.
1 Prevention of water pollution by agriculture and related activities, 1993 (E/S)
2 Irrigation water delivery models, 1994 (E)3 Water harvesting for improved agricultural
production, 1994 (E)4 Use of remote sensing techniques in
irrigation and drainage, 1995 (E)5 Irrigation management transfer, 1995 (E)6 Methodology for water policy review and
reform, 1995 (E)7 Irrigation in Africa in figures/L’irrigation en
Afrique en chiffres, 1995 (E/F)8 Irrigation scheduling: from theory to
practice,1996 (E)9 Irrigation in the Near East Region in figures,
1997 (E)10 Quality control of wastewater for irrigated
crop production, 1997 (E)11 Seawater intrusion in coastal aquifers
– Guide lines for study, monitoring and control, 1997 (E)
12 Modernization of irrigation schemes: past experiences and future options, 1997 (E)
13 Management of agricultural drainage water quality, 1997 (E)
14 Irrigation technology transfer in support of food security, 1997 (E)
15 Irrigation in the countries of the former Soviet Union in figures, 1997 (E) (also published as RAP Publication 1997/22)
16 Télédétection et ressources en eau/Remote sensing and water resources, 1997 (F/E)
17 Institutional and technical options in the development and management of small-scale irrigation, 1998 (E)
18 Irrigation in Asia in figures, 1999 (E)19 Modern water control and management
practices in irrigation – Impact on performance, 1999 (E)
20 El riego en América Latina y el Caribe en cifras/Irrigation in Latin America and the Caribbean in figures, 2000 (S/E)
21 Water quality management and control of water pollution, 2000 (E)
22 Deficit irrigation practices, 2002 (E)23 Review of world water resources by
country, 2003 (E)24 Rethinking the approach to groundwater
and food security, 2003 (E)25 Groundwater management: the search for
practical approaches, 2003 (E)26 Capacity development in irrigation and
drainage. Issues, challenges and the way ahead, 2004 (E)
27 Economic valuation of water resources: from the sectoral to a functional perspective of natural resources management, 2004 (E)
28 Water charging in irrigated agriculture – An analysis of international experience, 2004 (E) efforts and results, 2007 (E)
29 Irrigation in Africa in figures – AQUASTAT survey – 2005, 2005 (E/F)
30 Stakeholder-oriented valuation to support water resources management processes – Confronting concepts with local practice, 2006 (E)
31 Demand for products of irrigated agriculture in sub-Saharan Africa, 2006 (E)
32 Irrigation management transfer – Worldwide, 2008 (E/S)
33 Scoping agriculture–wetland interactions – Towards a sustainable multiple-response strategy, 2008 (E)
34 Irrigation in the Middle East region in figures AQUASTAT Survey- 2008, 2009 (E)
35 The Wealth of Waste: The economics of wastewater use in agriculture, 2010 (E)
FAO TECHNICAL PAPERS
FAO WATER REPORTS
Availability: July 2010Ar – Arabic Multil – MultilingualC – Chinese * Out of printE – English ** In preparationF – FrenchP – PortugueseS – Spanish
The FAO Technical Papers are available through theauthorized FAO Sales Agents or directly from Sales andMarketing Group, FAO, Viale delle Terme di Caracalla,00153 Rome, Italy.