Embed Size (px)
Citation preview

The Water Emissions Inventory, a Planning Support System aimed at reducing the pollution of water bodies
Karlsruher Flussgebietstage May 26th -27th 2011
GRETA VOS –FLEMISCH ENVIRONMENT AGENCY
http://weiss.vmm.be [email protected]

Why an emission inventory system
Project description
The concept of WEISS
Using GIS
2 Case studies
WEISS briefly stated
CONTENTS
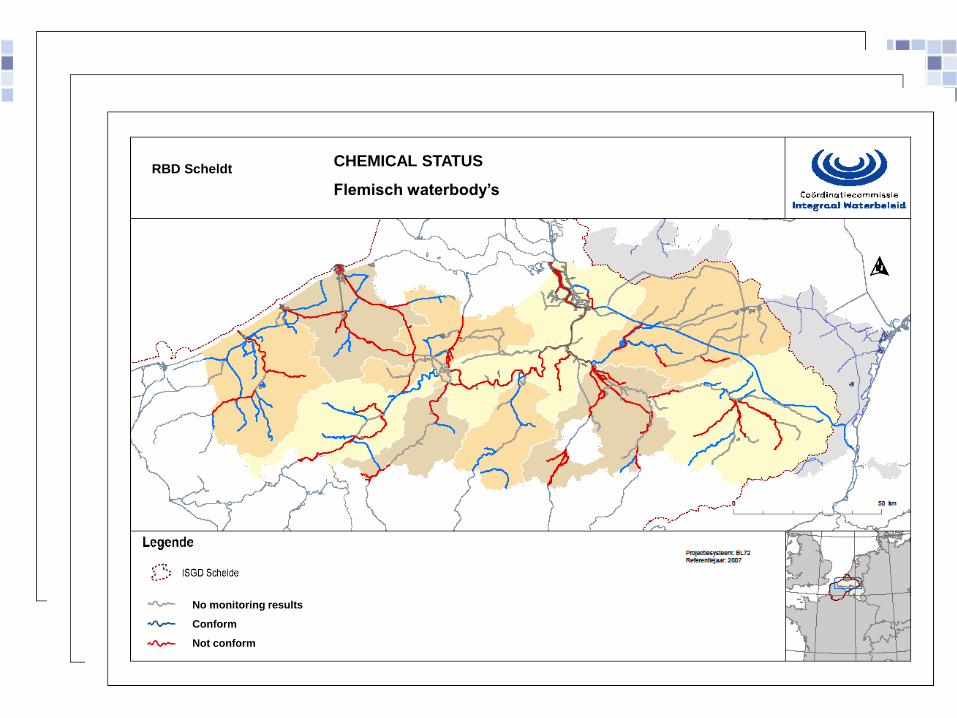
RBD Scheldt
ECOLOGICAL POTENTIAL
Natural Waterbody’s (WB)
RBD Scheldt
ECOLOGICAL POTENTIAL
Artificial & strongly changed WB RBD Scheldt
CHEMICAL STATUS
Flemisch waterbody’s
No monitoring results
Conform
Not conform

2000/60/EC Water Framework Directive Objectives
Assist in establishing and implementing targeted reduction and phasing out measures regarding priority and priority hazardous substances
Assist in checking the compliance of the reduction and phasing out measures with the provisions of the WFD (art 4)
Estimate the efficiency of the RBMP Programme of Measures (PoM)
Allow the establishment of the emission trends over time and other indicators
Identify gaps in knowledge, thus the need to develop strategies/policies
Why an emission inventory?

Data for (mandatory) reporting:
Evaluation of the impact of human activity on the status of surface waters (WFD art. 5)
The European Pollutant Release and Transfer Register regulation (E-PRTR)
Reporting by operators (art. 5)
Releases from diffuse sources (art. 9)
Inventory on discharges, emissions, losses (EQS Dir. art. 5)
State of Environment (SoE) assessment of Europe’s water environment (SoE emissions)
OECD-Eurostat Joint water questionnaire
Why an emission inventory?

2010 LIFE presentation 6
LIFE+ project, domain Environment Policy and Governance
Timing: 2010 – 2012
Partners: Flemisch Environment Agency
Flemisch Institute for Technological Research
Budget:
Total project budget: 980 k€
Contribution EC: 470 k€
Project description


Detailed geographical context
Project description

Local stakeholders
Policy makers, researchers, potential end-users active in: International River Basin District Scheldt International River Basin District Meuse
European stakeholders
Sister organisations of VMM in EU member states EU Directorate General Environment (DG Env) European Environmental Agency (EEA)
Stakeholders

Concept
Preliminary Requirements
Analysis
Design of Architecture
and System Core
Develop a Version
Deliver the Version
Elicit End-user Feedback
Incorporate End-user Feedback
Deliver Final
Version
Action 2 to 4
Action 5 Action 9-10
Action 6 to 8
Development of WEISS Evolutionary Delivery Model
Evaluating for the use in the own region
2012
Demonstration of the final model
End 2012
Feedback from potential users
User requirement document
Jun 2010– March 2011

Why an emission inventory system
Project description
The concept of WEISS
Using GIS
2 Case studies
WEISS briefly stated
CONTENTS

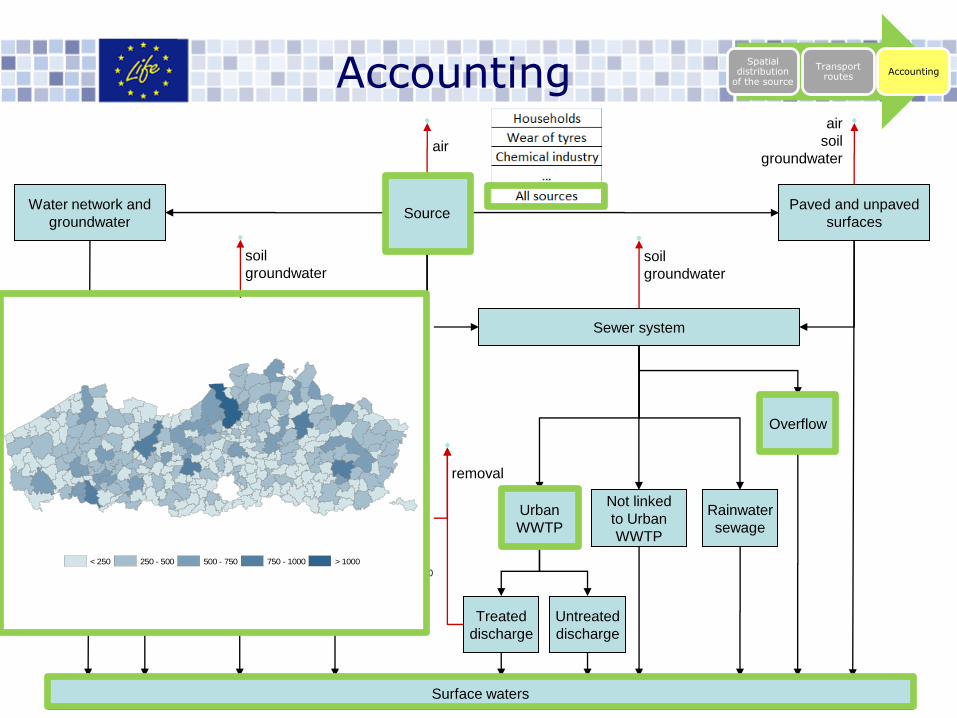
Functional scheme of WEISS
Gross
emissions
Net
emissions
No retention
calculations
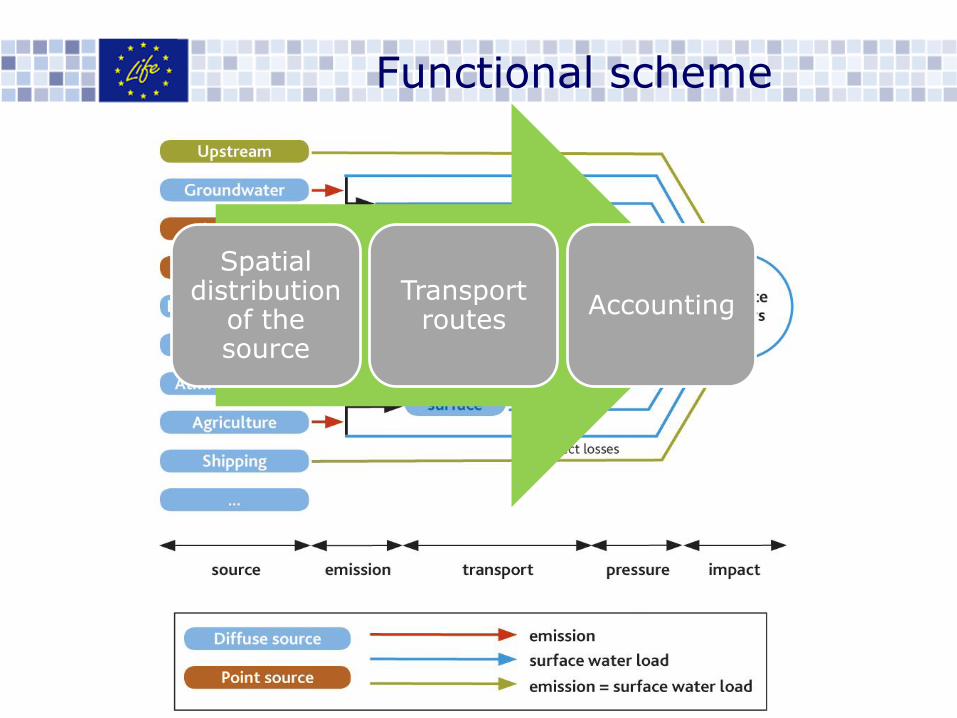
Spatial distribution
of the source
Transport routes
Accounting
Functional scheme

Diffuse source: bottom-up approach Gross Emission Value
(GEV) = Emission Factor (EF)
X Emission Explanatory
Variable (EEV)
Spatial distribution
of the source
Transport routes
Accounting
Point source: known (x,y)
coordinates + measured emission
values
Sources

Water network and
groundwater
Paved and unpaved
surfaces Source
removal
Surface waters
Overflow
Treated
discharge
Rainwater
sewage
Sewer system
Not linked
to Urban
WWTP
Urban
WWTP
Untreated
discharge
Spatial distribution
of the source
Transport routes
Accounting
Private drain
Rainwater
sewage
Not linked
to Individual
WWTP
Individual
WWTP
air
soil
groundwater air
soil
groundwater
soil
groundwater
Material flow scheme
Private drain
Overflow
Treated
discharge
Rainwater
sewage
Sewer system
Source Paved and unpaved
surfaces
Not linked
to Urban
WWTP
Urban
WWTP
Untreated
discharge
Water network and
groundwater
Rainwater
sewage
Not linked
to Individual
WWTP
Individual
WWTP
air
removal
air
soil
groundwater
Surface waters
soil
groundwater
Spatial distribution
of the source
Transport routes
Accounting
2.010
509
513
613
1.014
1.146
1.648
1.733
7.952
12.774
37.226
119.695
0 20.000 40.000 60.000 80.000 100.000 120.000 140.000
overige bronnen
w assen en chemisch reinigen
gezondheidszorg en maatschappelijke dienstverlenin
chemische industrie
lekkage motorolie
textiel
vervaardiging van voedings- en genotmiddelen
hotels en restaurants
slijtage banden
huishoudens
corrosie zinken opp.
niet verklaarde vrachtnot explained
corrosion surface Zn
households
wear of tyres
hotels/restaurants
food production
textile
leakage oil
chemical industry
health care/social service
washing/chemical cleaning
other sources
soil
groundwater
9.918
2.272
3.013
3.608
4.901
6.832
8.538
8.814
13.169
17.811
38.377
29.941
0 5.000 10.000 15.000 20.000 25.000 30.000 35.000 40.000 45.000
overige bronnen
vervaardiging van voedings- en genotmiddelen
lekkage motorolie
dierlijke mest
chemische industrie
directe depositie opp.w ater
metallurgie
erosie bodem
huishoudens
slijtage banden
corrosie zinken opp.
niet verklaarde vrachtnot explained
corrosion Zn surface
wear of tyres
households
soil erosion
metallurgy
direct deposition
chemical industry
manure
leakage oil
food production
other sources < 250 250 - 500 500 - 750 750 - 1000 > 1000
Accounting

Why an emission inventory system
Project description
The concept of WEISS
Using GIS
2 Case studies
WEISS briefly stated
CONTENTS

Spatial distribution of the Source
Surface sources
Line & network sources
Point sources
Transport route from Source to Surface Water
Sewage network
Sewage treatment zones
Treatment facilities
Run-off at the earth surface
Discharge in the surface waters
Accounting for various Geographical entities
Administrative entities
Hydrologic entities
Any other spatial entity
Along water networks
Groundwater
GIS in WEISS
Spatial distribution
of the source
Transport routes
Accounting
Various GIS-modules, models and operators

Spatial distribution of the Source
Surface sources
Line & network sources
Point sources
Transport route from Source to Surface Water
Sewage network
Sewage treatment zones
Treatment facilities
Run-off at the earth surface
Discharge in the surface waters
Accounting for various Geographical entities
Administrative entities
Hydrologic entities
Any other spatial entity
Along water networks
Groundwater
SPATIAL DISTRIBUTION SOURCE Point source Point source Line source Linear distribution Proportional to link characteristics Surface source Proportional distribution Dasymetric mapping Spatial interpolation Overlay analysis Spatial modelling
Spatial distribution
of the source
Transport routes
Accounting GIS in WEISS
Karlsruher Flussgebietstage May 26th -27th 2011
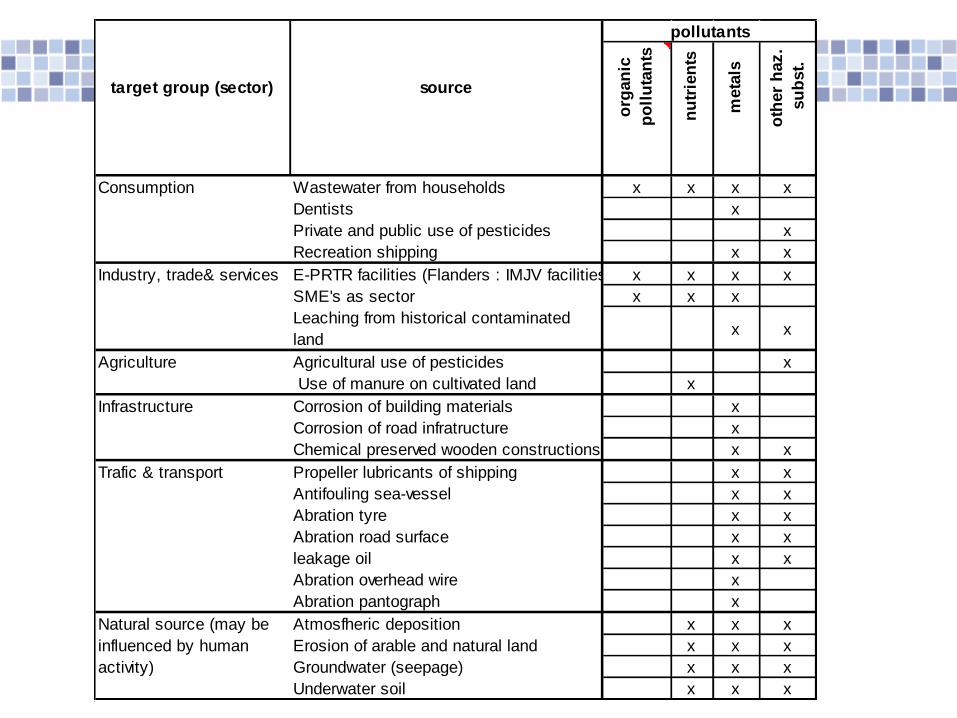
target group (sector) source
org
an
ic
po
llu
tan
ts
nu
trie
nts
meta
ls
oth
er
haz.
su
bst.
Consumption Wastewater from households x x x x
Dentists x
Private and public use of pesticides x
Recreation shipping x x
Industry, trade& services E-PRTR facilities (Flanders : IMJV facilities) x x x x
SME's as sector x x x
Leaching from historical contaminated
landx x
Agriculture Agricultural use of pesticides x
Use of manure on cultivated land x
Infrastructure Corrosion of building materials x
Corrosion of road infratructure x
Chemical preserved wooden constructions x x
Trafic & transport Propeller lubricants of shipping x x
Antifouling sea-vessel x x
Abration tyre x x
Abration road surface x x
leakage oil x x
Abration overhead wire x
Abration pantograph x
Atmosfheric deposition x x x
Erosion of arable and natural land x x x
Groundwater (seepage) x x x
Underwater soil x x x
Natural source (may be
influenced by human
activity)
pollutants

point
source
line
source
SPATIAL ALLOCATION SOURCE PATHWAYS ACCOUNTING
M
O
D
E
L
B
L
O
C
K
S
surface
source
sewage
system water
networks
ground-
water
direct
discharge
hydrologi-
cal
entities administra-
tive
entities surface
source
sewage
system direct
discharge
other
pathways
hydrologi-
cal
entities administra-
tive
entities other
spatial
entities
point
source
hydrologi-
cal
entities
sewage
system direct
discharge runoff
other
pathways
Why an emission inventory system
Project description
The concept of WEISS
Using GIS
2 Case studies
WEISS briefly stated
CONTENTS

Case study 1:
Emissions of heavy metals generated by the corrosion of
building materials

Functional scheme

Distribution of buildings
(1 map per type)
Gross emissions
(1 map per metal: Cu, Zn, Pb)
GEV
Step 1B: Generating gross emission maps

Source Paved and unpaved
surfaces
Water network and
groundwater
Overflow
Treated
discharge
Rainwater
sewage
Sewer system
Not linked
to Urban
WWTP
Urban
WWTP
Untreated
discharge
Private drain
Rainwater
sewage
Not linked
to Individual
WWTP
Individual
WWTP
removal
air
air
soil
groundwater
Surface waters
soil
groundwater
Step 2: Transporting emissions from source to sink

Municipality map
Catchments of Flanders
Hydrological entities
Administrative entities
Net emissions
(1 map per metal: Cu, Zn, Pb)
Any area
Step 3: Accounting of the loads

Removed
Direct losses and discharges
After individual treatment
Zone B
Zone C
UWWTP Overflow
UWWTP UTD
UWWTP Discharge
20
40
60
80
100
120
140
160
2
4
6
8
10
12
14
16
0 0Zinc Copper Lead
To
ns
per
yea
r
Quantification of the heavy metals in the nodes of the
material flow scheme
Reduction to obtain after optimalisation of the sewer system
Planning and Policy applications

0
2
4
6
8
10
12
1998 2002 2005
ton
/year
Cu
removal
net
0
2
4
6
8
10
12
14
1998 2002 2005
ton
/year
Pb
removal
net
0
20
40
60
80
100
120
140
160
1998 2002 2005
ton
/year
Zn
removal
net
Historical analysis 1998 - 2002 - 2005

Overflow frequency 4% -> 3%
Example Scenario Analysis
Lead emission from the corrosion of buildingmaterials
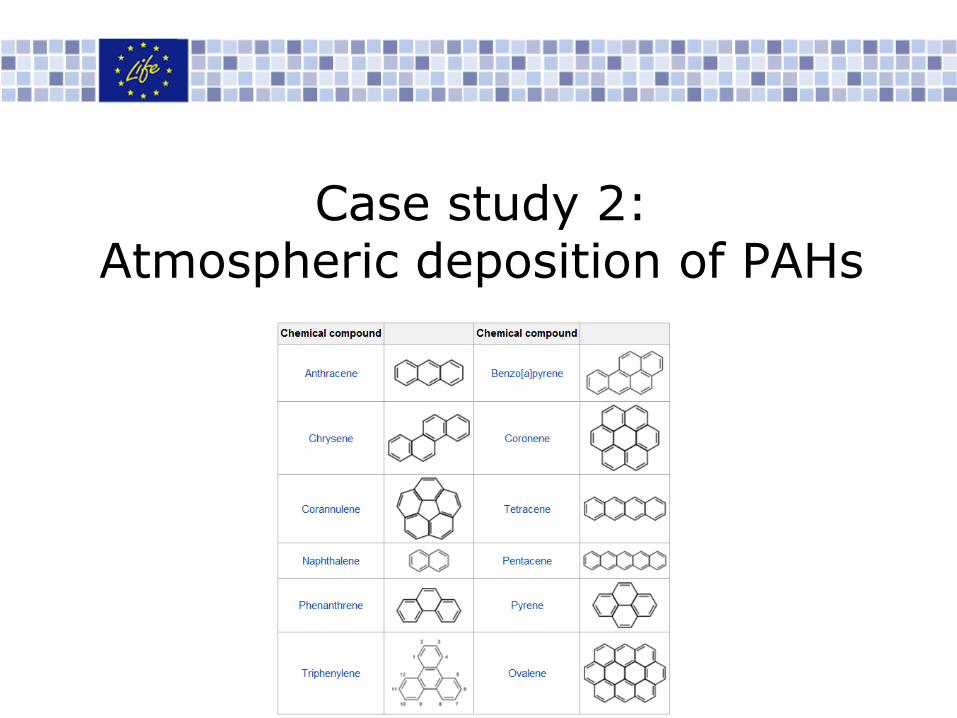
Case study 2:
Atmospheric deposition of PAHs

Functional scheme

Step 1: Gross emission map
Deposition of benzo(a)pyrene on soil

Source Paved and unpaved
surfaces
Water network and
groundwater
Overflow
Treated
discharge
Rainwater
sewage
Sewer system
Not linked
to Urban
WWTP
Urban
WWTP
Untreated
discharge
Private drain
Rainwater
sewage
Not linked
to Individual
WWTP
Individual
WWTP
removal
air
air
soil
groundwater
Surface waters
soil
groundwater
Step 2: Transporting emissions from source to sink
soil
groundwater

Runoff model: runoff coefficients/LDD
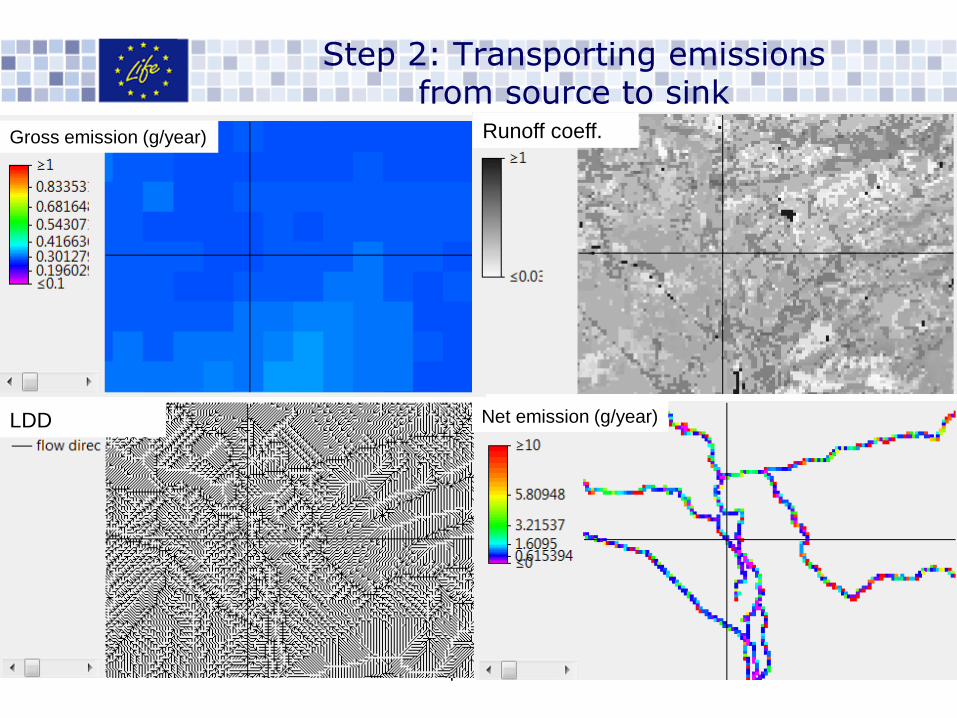
Step 2: Transporting emissions from source to sink
2008 LIFE presentation 36
Step 2: Transporting emissions from source to sink
Gross emission (g/year)
LDD
Runoff coeff.
Net emission (g/year)

Municipality map
Catchments of Flanders
Hydrological entities
Administrative entities
Maps in every node of the material flow scheme
Any area
Step 3: Accounting of the loads

WEISS calculates emissions from source to sink
Making an inventory of all water pollutant sources
Monitoring and reporting
Scenario, planning and policy assessment
The strengths of the system
The explicit geographical approach
The generic character of the framework and methodology
New sources
New pathways
New pollutants
New study areas
=> “The system grows along with the data”
WEISS briefly stated … (1)

WEISS does NOT:
Involve water quality modelling in the water bodies itself;
Model physical or chemical transformation of pollutants dissolved in water while transported;
Model seasonal variations in the emissions, their transport, and accounting.
WEISS briefly stated … (2)

2010 LIFE presentation 40
WEISS LIFE+ main outputs
Website: http://weiss.vmm.be
Requirements and product specification documents
3 prototypes -> final model
Technical Documentation
Training material
WEISS briefly stated … (3)