Embed Size (px)
Citation preview

1
THE VILLAGE DEVELOPMENT INDEX AS AN INDICATOR FOR THE PROGRESS OF DEVELOPMENT IN INDONESIA1)
Mulyanto
University of Sebelas Maret (UNS) Surakarta, Indonesia
Indah Susilowati University of Diponegoro (UNDIP) Semarang, Indonesia
ABSTRACT
The purposes of this study are to construct the Village Development Index (VDI) for measuring the progress of village development in Indonesia, and to analyze the differences on VDI by viewing the differences of 3 villages typology and integrating of 4 control variables into VDI.
VDI is composed of by using 9 indicators. Each indicator consists of some variables derived from secondary data published by Statistics Indonesia on the document of Subdistrict in the Vigures year 2010. The simple average method is used to construct VDI. Meanwhile the correlation of product moment and analyses of variace are used to analize the differences of VDI.
Authors find of that the values of VDI in average for the village with rice cultivated area have the highes score compared with other. The higher value of percentage of agriculture cultivated area, the higher value in VDI. On the other side, the village with crops cultivated area have the smallest score in VDI.
The villages which have a positive net migration, they will have a high of VDI. There is no a regularly relationship between VDI and distance control variable. In the case of villages with rice and crops cultivated area, if population of male is more than female, the value of VDI will be higher. This condition doesn’t happen in the village with other area.
Keywords: Village Development, Index System, Classification of Village, Indicator
of Development, Central Java - Indonesia
JEL Classification: r12, r58
1)Paper for presentation in the Eighth Annual Conference of Asia-Pacific Economic
Association (APEA) held in Nanyang Technological University, Singapore on June 28-29th, 2012. This paper is part of the Ph.D Dissertation at Postgraduate Program - University of Diponegoro (UNDIP) Semarang – Indonesia. Process of writing dissertation is under supervisor and counselor of Prof. Indah Susilowati as Promoter and Prof. Mudjahirin Thohir and Prof. Waridin as Co-Promoter respectively. The views expressed in this paper are the views of the student and do not necessarily reflect the views of both Promoter and Co-Promoter. In this paper authors examine by using 196 villages collected in one regency from all samples about 1,406 villages in six regencies in Central Java - Indonesia. The student, Mulyanto can be contacted by email to: [email protected].

2
I. INTRODUCTION
We know that the real Gross Domestic Product (GDP) per capita is not a perfect measure of development progress in many countries in the world, irrespective of whether it is adjusted for purchasing power differences among countries or not (see Ogwang (1997), Wang (2007), Zgurovsky (2007)). As a consequence, researchers have devoted much effort to developing the composite indices of development progress. For examples, Morris (1979) had developed the composite indices called by the Physical Quality of Life Index (PQLI). This effort was continued by Mahbub ul Haq (UNDP, 2006) by using the composed indices called by the Human Development Index (HDI) in 1990s.
Morris (1979) used two main indicators, health indicator and education indicator. Both of these indicators were measured by infant mortality rates, life expectancy at age one, and literacy percentage rates. Meanwhile, Mahbub ul Haq in 1990s (UNDP, 2006) had also developed the Morris’s model by adding other indicator, namely the indicator of income indicated by GDP corrected by Power Purchasing Parity (PPP).
In recent years, there were a lot of composite indices for measuring the progress of development in the specific area. For examples: Indicators of Good Governance (IGG) developed by Philippine Institute for Development Studies (1999); Regional Attractiveness Index (RAI) constructed by the Price-Water-houseCooper (2001); Urban Governance Index (UGI) arranged by UN-HABITAT (2002) for the Global Campaign on Urban Governance; Environ-mental Sustainability Index (ESI) developed by Yale University (2005); Indica-tors of Sustainability Development (ISD) construced by United Nations (2007); and also the Vulnerability and Resilience Index (VRI) developed by Malta University (2008).
For measuring and evaluating the progress of development in provinces in People’s Republic of China, Wang (2007) had developed the index called by a Regional Development Index (RDI). In this study, Wang used 10 field indices (and one reference index) to measure regional development in different fields. They were: (i) Level of economic development; (ii) Productivity and Research & Development; (iii) Human development; (iv) Education; (v) Social equity; (vi) Public services; (vii) Social security; (viii) Infrastructure; (ix) Environment protection; (x) Institutional development; and (xi) Natural resources and geographic location (reference index). Wang (2007) would like to get proof that regional disparities in the PRC were the result of a combination of geographic location, economic policy, and other factors such as infrastructural conditions as be found by economists in the previous studies.
On the other hand, BAPPENAS (Indonesia - State Planning Agency) in 1991 had also constructed a Regional Development Index (RDI). This RDI was developed to measuring the regional development in 26 provinces in Indonesia by using secondary data in years 1994, 1996 and 1998. This study was done before the program of regional autonomy has been implemented in Indonesia since 2001. BAPPENAS used 3 indicators to construct the RDI, namely: (i) Indicator of government’s capacity and capability; (ii) Indicator of regional development; and (iii) Indicator of public empowernment. Each of indicators was derived into 3 Sub Indicators.

3
By using the RDI, progress and evaluation on regional development can be measured and evaluated together, so RDI be able to provide to us some useful information about the progress of regional development at provincial level or other level. This study wants to develop RDI model that had been developed by Wang (2007) and Bappenas (2001) for the context of village government by doing adjustment to some indicators and variables used in this study. This index would be called the Village Development Index (VDI).
VDI is very important to evaluate the result of development in Indonesia. This is necessary because in recent years, the government of Indonesia has increased of expenditures from central to local pass through national budget on infrastructure, education, health and other sectors via the general allocation grant (DAU: dana alokasi umum) and also via the specific allocation grant (DAK: dana alokasi khusus). Those grants have been allocated toward to regional governments (provinces, regencies, and cities).
Those mechanisms above are purposed to achieve the equity and equality in regional development programs. However, incentive mechanisms by these grants have not been changed and the central effort has received a limited response from local governments, in particular from the village governments. As evidence, the poor people in Indonesia classified by urban and rural area during years 1996-2011are still excessively (see Table 1.1 below).
The purposes of this study is to construct VDI for measuring and evaluating the progress of village development in Indonesia. Besides that this studi are also to analyze the differences of VDI by viewing the differences of 3 village typology and integrating 4 control variables into VDI model. The available secondary data published by BPS (Statistics Indonesia) on the document of Kecamatan Dalam Angka (Subdistrict in Vigures) year 2010, will be used to construct the VDI.
This paper will be classified into 5 sections. In Section II will be established of VDI and indicator selection strategy. In Section III will be described about methodology and data. Section IV presents the result of study. Section V is a short summary of some interesting points.
II. VDI AND INDICATOR SELECTION STRATEGY
VDI is constructed by using 9 indicators, namely: (i) village apparatus capacity and scope of public service, (ii) village’s asset and finances; (iii) village economic infrastructure; (iv) village transportation and communication infrastructure; (v) village institution and public participation, (vi) village public prosperity, (vii) village public education, (viii) village public health, and finally (ix) village family prosperity.
Each of 9 indicators directly presents a certain field of development in the village government, and they will together constitute to the VDI. Each indicator consists of several variables, which are based on one or more basic secondary data published by BPS Year 2010. This study uses in total of 37 basic variables. Technical explanation of the indicators and several variables used in this study as follows:

4
Table 1.1 Poverty Line, Number, and Percentage of Poor People in Indonesia Classified by Urban and Rural, Year 1996-2011
Source: Statistics Indonesia. (2011). Trends of the Selected Socio-Economic Indi-
cators of Indonesia, p.47.
1. Vllage Apparatus Capacity and Scope of Public Service
a. Ratio of the number of village government staff/apparatus to the number of village population times by 1,000
b. Ratio of the number of village government staff/apparatus to the number of village households times by 1,000
c. Ratio of the number of village government staff/apparatus to the land area of village
d. Percentage of the number of village government staff/apparatus with educational attainment in senior high school and over
2. Village’s Asset and Finances
a. Ratio of the village fund allocation to the number of households b. Ratio of the land and building taxes to the number of households c. Ratio of the village revenue in the village budget to the number of
households d. Ratio of the village land ownership to the number of households times by
1,000

5
3. Village Economic Infrastructure
a. Ratio of the number of trading and financing facilities to the number of population times by 1,000
b. Ratio of the number of micro, small and medium enterprises to the number of population times by 1,000
c. Percentage of the number of employment in agriculture sector to the total number of employment
d. Percentage of the number of employment in industry sector to the total number of employment
4. Village Transportation and Communication Infrastructure
a. The number of cars and motorcycles to the number of households times by 100
b. Ratio of length of roads asphalted to the total number of length of roads times by 100
c. Ratio the total number of length of roads to the land area of village d. Ratio the number of telecomunication facilities to the number of house-
holds times by 100
5. Village Institution and Public Participation
a. Ratio of the number of mutual assistance association in the village (RW: Rukun Warga) to the number of population times by 1,000
b. Ratio of the number of neighborhood association (RT: Rukun Tetangga) to the number of population times by 1,000
c. Ratio of the number of worship facilities (house for religius service) to the number of population times by 1,000
6. Village Public Prosperity
a. Ratio of the number of paddy production to the number of population b. Percentace of poor people to the number of households c. The number of the divorce event during 1 year in the village d. Ratio of the number of animal husbandry / animal livestock to the
number of households e. Ratio of the number of poultry livestock to the number of households
7. Village Public Education
a. Ratio of the number of primary school building to the number of pupils times by 100
b. Ratio of the number of pupils to the number of teachers in primary school level
c. Ratio of the number of pupils in primary school to the number of school age population 7-12 years times by 100
d. Percentage of population with educational attainment in senior high school and over to number of population age 5 year over
8. Village Public Health
a. Ratio of the number of health facilities to the number of population times by 1,000
b. Ratio of the number of medical staff to the number of population times by 1,000

6
c. Percentage of the number of latrine/toilet ownership by family to the number of households
d. Infant bird rate per 1.000 e. Infant mortality rate per 1,000
9. Village Family Prosperity
a. Ratio of the number of population to the number of households b. Dependency ratio (percentage of the number of unproductive population
to the number of productive population) c. Percentage of the number of permanent house ownership by family to the
total number of house ownership in the village. d. Percentage of the number of active family planning acceptor to the
number of the married couple in fertility condition.
III. METHOLOGY AND DATA
For constructing the VDI as an instrument for measuring the progress of village development in Indonesia, the authors used about 196 villages in one regency (Sragen Regency) in Central Java – Indonesia (see Vigure 3.1 below).
Data used in this study was scondary data publised by BPS / Statistics Indonesia (BPS Sragen Regency – Central Java – Indonesia) in the year of 2010. Administratively, Sragen Regency is devided into 20 subdistrics and about 196 villages. According to BPS (2008) in the survei of villages potential data, villages in Sragen could be classified into 3 villages, namely: (i) village with rice/paddy cultivated area (about 182 villages), (ii) village with crops cultivated area (about 8 villages), and (iii) village with other area (about 6 villages).
By using 9 indicators to construct the VDI and applying it into 3 kinds of villages typology, this study wants to analyze the differences in the progress of village development indicated by VDI, if they are viewed by differences in the typologi / classifivation of the villages. At the same time, 4 control variables are also integrated in this model, namely: (i) percentage of agriculture planted area, (ii) net migration, (iii) distance variable; and (iv) sex ratio variable.
As the same as with the method used by Wang (2007), the authors also use the index system for constructing the VDI. It measures the levels of development in different dimensions based on available secondary data in the village and also focuses on the relative position of each village to the other.
To derive aggregated field indices and the overall index (the VDI), data need to be normalized, so all the basic indicators are transformed into a 0-10 score. The scores 0 and 10 indicate the positions of the relevant villages at the lowest and highest levels of village development. For positive indicators (greater numbers reflect higher level of development), the scores are calculated using the following formula (Agarwal and Samanta (2006) and Wang (2007)):

7
Vigure 3.1 The Map of Central Java – Indonesia Divided into 29 Regencies and 6 Cities Year 2011
Indonesia (2010) - 33 Provinces - 399 Regencies - 98 Cities - 6,652 Subdistricts - 77,012 Villages Central Java (2011) - 29 Regencies - 6 Cities - 573 Subdistricts - 8,577 Villages Sragen Regency - 20 Subdistricts - 196 Villages (a) 182 Paddy Villages (b) 8 Crops Villages (c) 6 Others Villages

8
Vi – Vmin
Ith village = ----------------------- x 10 …...……................................… (3.1) Vmax – Vmin
For negative indicators (smaller numbers reflect a higher level of village development), the following formula is used:
Vmax – Vi
Ith village = ----------------------- x 10 …...……................................… (3.2) Vmax – Vmin
Formulae (3.1) and (3.2) will be applied into 37 basic variables before the VDI will be resulted. An important issue related with constructing to the total index (the VDI) is how to determine the weight of each field index (9 indicators) in order to construct and get the overall index (the VDI).
In this study, authors use the simple average method for weighting the each indicator to result the VDI. This method was ever applied by Wang (2007). According to Wang (2007), when the number of indicator included is relatively large, this method usually lead to very similar results with the method using the weighting based on the judgment of analysts or experts, and the method using a principle component analysis. This method has also benefit, especially to give consistent measures from year to year, so that changes in the level of develop-ment in each village can be correctly traced. For this reason, a simple average method is adopted in this study.
Finally, to get the value of the VDI in term of total index, the formula can be written as follow: 9
VDI (i) = Σ a. Indic. (ij) .................................................................... (3.3) j=1
Where:
VDI : The Village Development Index i : Village for i Σ : Sum of overall indicators j : Indicator for j a : weight by using tha simple average method Indic. : Overall Indicators (9 indicators)
To achieve the goals of this study, 3 instruments of statistical analyses will be applied, that are: (i) the correlation of product moment analysis, (ii) one way anova (analysis of variance), and (iii) two ways anova. The correlation of product moment will be used to know the degree of correlation between the value of VDI and the value of each indicator constructing VDI. One way anova will be used to analysis the differences of VDI in average viewed by the differences of village typology / classification. And, finally two ways anova will be applied to get some interesting information about the differences of VDI in average if some control variables integrated into the VDI model previously.

9
IV. RESULT OF STUDY
From Table 4.1 and Tabel 4.2, we can see that the number of villages in each group aren’t same. The villages with rice/paddy cultivated area are very dominant in the number, about 182 villages from the total samples about 196 villages. This situation is presumed as a factor that the degree of correlation among group are very different, both in values and in direction.
Seemingly, values and ranks in the total samples are very influenced by the samples from the villages with paddy/rice cultivated area. In those groups, the indicator of village transportation and communication infrastructure have the highest value of the degree of correlation compared with other villages. Meanwhile, for the villages with crops cultivated area and the village with other area, indicator of village public health have the highes value in the degree of correlation compared with the other villages.
From the result of analysis of one way anova as we can see in appendix 1 and also in Table 4.3, we can conclude that the variable of the village typology (Tip_Des) isn’t significant at the 5% level (this variable is significant at the 15% level). This indicates that if we use the degree of significant at the 5% level, the average of the Village Developmet Index (VDI) isn’t influenced by the differences of the village typology.
Villages with paddy/rice cultivated area has the highes value in average compared with the villages with crops cultivated area and the village with other area. The values are 3.789 for paddy villages; 3.498 for crops villages; and 3.773 for other villages. Differences of paddy villages and crops villages are 0.3087; Paddy villages and other villages are 0.0015; and other villages and crops villages are 0.3072 (see Table 4.3 belows).
By integrating 4 control variables into the one way analysis, the authors find out that the model of VDI will experience many changing in the values. As stated above, 4 control variables will integrate in the VDI model, that are: (i) percentage of agriculture planted area, (ii) net migration variable, (iii) distance variable between the central of regency and the village office; and finally (iv) sex ratio variable. Two ways analyses of variance will apply to analyze and to overcome this conditions.

10
Table 4.1. The Village Development Index (VDI) and 9 Indicators in Average Values in the Case of Sragen Regency, Central Java, Indonesia Grouped by Village Typology in Term of the Value and Rank
Total Samples (n = 196)
Villages of Paddy (n = 182)
Villages of Crops (n = 6)
Others Villages (n = 8) Indicators Influencing the Village Development Index (VDI)
Value Rank Value Rank Value Rank Value Rank (1) (2) (3) (4) (5) (6) (7) (8) (9)
01. Village apparatus capacity and scope of public service 5.116 1 5.108 1 5.062 2 5.342 1
02. Village’s asset and finances 2.564 8 2.584 8 2.203 7 2.379 8
03. Village economic infrastructure 2.346 9 2.370 9 2.202 8 1.902 9
04. Village transportation and communication infrastructure 2.987 7 3.033 7 1.617 9 2.986 7
05. Village institution and public participation 3.415 6 3.404 6 3.986 3 3.227 6
06. Village public prosperity 5.102 2 5.097 2 5.225 1 5.128 2
07. Village public education 4.019 4 4.026 4 3.718 5 4.091 4
08. Village public health 3.553 5 3.541 5 3.269 6 4.032 5
09. Village family prosperity 4.840 3 4.865 3 3.967 4 4.927 3
Village Development Index (VDI) 3.771 3.781 3.472 3.779
Source: Summarized from the result of analyses of secondary data by using SPPS computer program (2012).

11
Table 4.2 The Degree of Correlation between the Village Development Index (VDI) and Each Indicator Influencing the VDI in the Case of Sragen Regency, Central Java, Indonesia, Grouped by Village Typology in Term of the Value and Rank
Total Samples (n = 196)
Villages of Paddy (n = 182)
Villages of Crops (n = 6)
Others Villages (n = 8) Indicators Influencing the Village Development Index (VDI)
Value Rank Value Rank Value Rank Value Rank (1) (2) (3) (4) (5) (6) (7) (8) (9)
01. Village apparatus capacity and scope of public service -0.012 - -0.024 - 0.604 - 0.166 -
02. Village’s asset and finances 0.521 (**) 2 0.540 (**) 2 0.611 - 0.040 -
03. Village economic infrastructure 0.245 (**) 8 0.250 (**) 8 -0.514 - 0.365 -
04. Village transportation and communication infrastructure 0.624 (**) 1 0.614 (**) 1 0.740 - 0.618 -
05. Village institution and public participation 0.340 (**) 6 0.358 (**) 6 0.759 - -0.285 -
06. Village public prosperity 0.469 (**) 4 0.481 (**) 4 0.848 (*) 2 -0.154 -
07. Village public education 0.516 (**) 3 0.533 (**) 3 -0.220 - 0.428 -
08. Village public health 0.325 (**) 7 0.303 (**) 7 0.907 (*) 1 0.713 (*) 1
09. Village family prosperity 0.445 (**) 5 0.441 (**) 5 0.767 - -0.407 -
Notes: **) Correlation is significant at the 0.01 level (2-tailed). *) Correlation is significant at the 0.05 level (2-tailed).
Source: Summarized from the result of analyses of secondary data by using SPPS computer program (2012).

12
Table 4.3 The Differences in Average of Value of VDI Viewed by Village Typology in the Case of Sragen Regency, Central Java, Indonesia
VDI No. Typology of Villages N
Value RankDifference in Average of VDI
(1) (2) (3) (4) (5) (6)
1. Paddy Villages 182 3.789 1 Paddy – Crops = 0.3087 2. Crops Villages 6 3.495 3 Paddy – Others = 0.0015 3. Othes Villages 8 3.773 2 Others – Crops = 0.3072
Source: Summarized from the result of analyses of secondary data by using SPPS computer program (2012).
By integrating the control variable of percentage of agriculture planted area (agriculture land) into the VDI model grouped into 3 village typology, as we can be seen in Vigure 4.1 and Table 4.3; we can conclude that regularly pattern only happens in the village typology of paddy/rice villages.
Notes: Indeks Pembangunan Desa (= Village Development Index); Tipologi
Desa (= Village Typology); Rasio Luas Lahan (= Percentage of Agri-culture Planted Area to the Total Area of Villages); Pertanian Padi (= Paddy/Rice Villages); Pertanian Palawija (= Crops Villages); and Sektor Lainnya (Other Villages)
Source: Summarized from the result of analyses of secondary data by using SPPS computer program (2012)
Vigure 4.1 Estimated Marginal Means of Village Development Index Viewed by Village Typology and Variable of Percentage of Agriculture Planted Area (Agriculture Land)

13
The values of VDI in the paddy/rice villages will be higher if the percentage of agriculture planted area or agriculture land will also be wider. The higher of percentage of cultivated area for agriculture, the higher in value of VDI for the villages of paddy/rice cultivated area . Table 4.4 The Differences in Average of Value of VDI Viewed by Variable of
Percentage of Agriculture Planted Area (Agriculture Land) in the Case of Sragen Regency, Central Java, Indonesia
VDI No. Typology of Villages N
Value RankDifference in Average of
VDI
(1) (2) (3) (4) (5) (6)
1. Agricul. Land < 25% 38 3.6566 4 No.4 – No.3 = 0.0702 2. Agricul. Land 25 - < 50 50 3.7557 3 No.4 – No.2 = 0.1269 3. Agricul. Land 50 - < 75% 98 3.8124 2 No.4 – No.1 = 0.2260 4. Agricul. Land ≥ 75% 10 3.8826 1 No.3 – No.2 = 0.0567 No.3 – No.1 = 0.1558
No.2 – No.1 = 0.0991
Source: Summarized from the result of analyses of secondary data by using SPPS computer program (2012)
For control variable is net migration, from the Table 4.5 and the Vigure
4.2; we can see that the villages with in migration variabel are more than out migration, they will have the value of VDI is more/higher too. Difference in variable of in migration and out migration are 0.329 in term of index measurement.
Table 4.5 The Differences in Average of Value of VDI Viewed by Variable of Net
Migration in the Case of Sragen Regency, Central Java, Indonesia
VDI No. Typology of Villages N
Value RankDifference in Average of
VDI
(1) (2) (3) (4) (5) (6)
1. In Migration is more 84 3.747 1 No.1 – No.2 = 0.329
2. Out Migratis is more 112 3.419 2
Source: Summarized from the result of analyses of secondary data by using SPPS computer program (2012)
For the villages with crops planted area, they have the smallest in value of VDI, both in the context of in migtration is more than out migration and the context of in migtration is less than out migration. Gap in values of those are also higher than the others (about 0.811 in term of index measuremet). Meanwhile the value gap in paddy/rice villages are the smallest (about 0.036 in term of index measurement). And, finally the gap values for the other village are about 0.137 in term of index measurement. In this context, attention from local government to the villages with crops planted area is very important.

14
Notes: Indeks Pembangunan Desa (= Village Development Index); Tipologi
Desa (= Village Typology); Banyak Penduduk Datang (= in migtration is more than out migration); Banyak Penduduk Pindah/Pergi (= in migtration is less than out migration); Pertanian Padi (= Paddy/Rice Villages); Pertanian Palawija (= Crops Villages); and Sektor Lainnya (Other Villages).
Source: Summarized from the result of analyses of secondary data by using SPPS computer program (2012)
Vigure 4.2 Estimated Marginal Means of Village Development Index Viewed by Village Typology and Variable of Migration (In Migration and Out Migration)
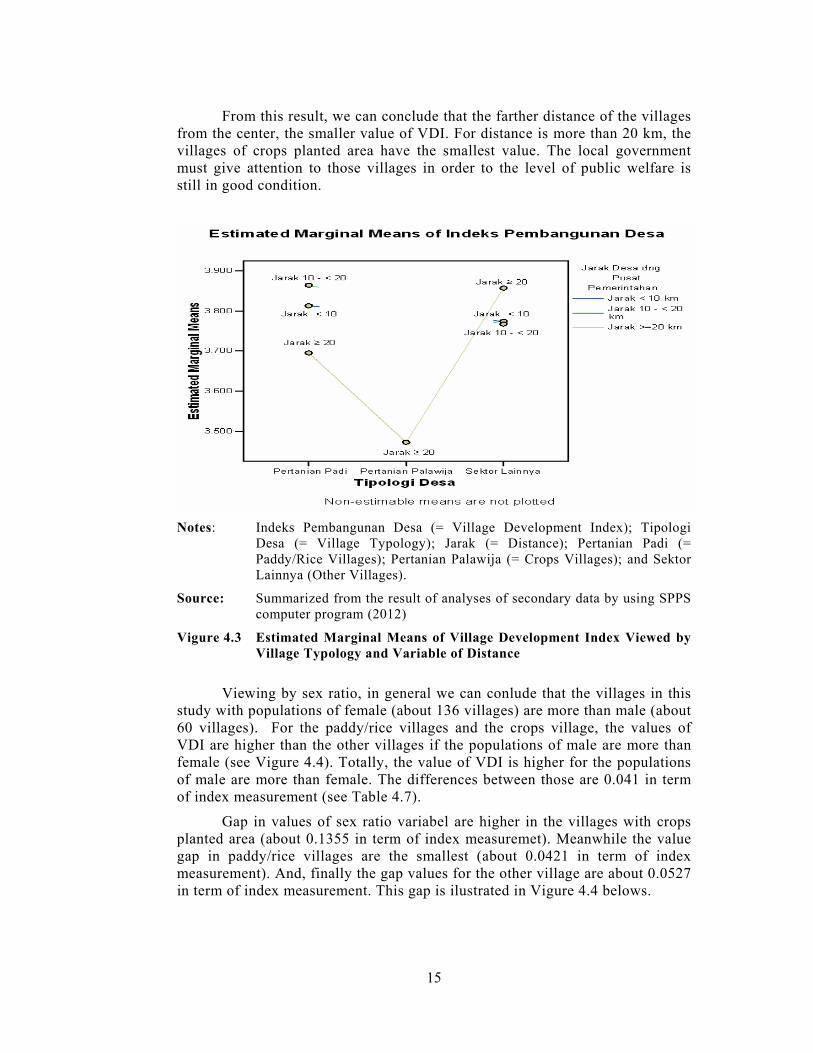
From Table 4.6 and Vigure 4.3, we can see that they aren’t a regularly pattern between the value of VDI and the variabel of distance. Sequencing of the value of VDI isn’t from Center to Medium and to Outskirts, but from Medium to Center and to Outskirts.
Table 4.6 The Differences in Average of Value of VDI Viewed by Variable of
Distance in the Case of Sragen Regency, Central Java, Indonesia
IPDesa No. Typology of Villages N
Value Rank Difference in Average of VDI
(1) (2) (3) (4) (5) (6)
1. Distance < 10 km 33 3.793 2 Medium – Center = 0.0447 2. Distance 10 - < 20 km 76 3.816 1 Medium – Outskirts = 0.1748 3. Distance ≥ 20 km 87 3.675 3 Center – Outskirts = 0.1301
Notes: Distance < 10 km (= Center); Distance 10 - < 20 (= Medium); and Distance ≥ 20 km (= Outskirts).
Source: Summarized from the result of analyses of secondary data by using SPPS computer program (2012)
15
From this result, we can conclude that the farther distance of the villages from the center, the smaller value of VDI. For distance is more than 20 km, the villages of crops planted area have the smallest value. The local government must give attention to those villages in order to the level of public welfare is still in good condition.
Notes: Indeks Pembangunan Desa (= Village Development Index); Tipologi
Desa (= Village Typology); Jarak (= Distance); Pertanian Padi (= Paddy/Rice Villages); Pertanian Palawija (= Crops Villages); and Sektor Lainnya (Other Villages).
Source: Summarized from the result of analyses of secondary data by using SPPS computer program (2012)
Vigure 4.3 Estimated Marginal Means of Village Development Index Viewed by Village Typology and Variable of Distance
Viewing by sex ratio, in general we can conlude that the villages in this study with populations of female (about 136 villages) are more than male (about 60 villages). For the paddy/rice villages and the crops village, the values of VDI are higher than the other villages if the populations of male are more than female (see Vigure 4.4). Totally, the value of VDI is higher for the populations of male are more than female. The differences between those are 0.041 in term of index measurement (see Table 4.7).
Gap in values of sex ratio variabel are higher in the villages with crops planted area (about 0.1355 in term of index measuremet). Meanwhile the value gap in paddy/rice villages are the smallest (about 0.0421 in term of index measurement). And, finally the gap values for the other village are about 0.0527 in term of index measurement. This gap is ilustrated in Vigure 4.4 belows.

16
Table 4.7 The Differences in Average of Value of VDI Viewed by Sex Ratio Variable in the Case of Sragen Regency, Central Java, Indonesia
95% Confidence Interval Sex Rasio Mean Std.
Error Lower Bound Upper Bound
Male is more than female 3.706 (1) 0.112 3.486 3.927
Female is more than male 3.665 (2) 0.082 3.503 3.826
VDI No. Typology of Villages N
Value RankDifference in Average of
VDI
(1) (2) (3) (4) (5) (6)
1. Male is more than female 60 3.706 1 No.1 – No.2 = 0.041
2. Female is more than male 136 3.665 2
Source: Summarized from the result of analyses of secondary data by using SPPS computer program (2012)
Notes: Indeks Pembangunan Desa (= Village Development Index); Tipologi Desa (= Village Typology); Lebih Banyak Penduduk Pria (= Male is more than female); Lebih Banyak Penduduk Wanita (= Female is more than male); Pertanian Padi (= Paddy/Rice Villages); Pertanian Palawija (= Crops Villages); and Sektor Lainnya (Others Villages).
Source: Summarized from the result of analyses of secondary data by using SPPS computer program (2012)
Vigure 4.4 Estimated Marginal Means of Village Development Index Viewed by Village Typology and Sex Ratio Variable

17
V. SUMMARY, FINDINGS AND IMPLICATION
The VDI is very important to measure and evaluate the result of village development in Indonesia. This VDI is necessary in recent years because the government of Indonesia has increased of expenditures from central to local government (provinces, regencies, and cities). So, the VDI can be instruments for knowing the level of development in the villages context. In particular to knowing the level of equity and equality of the village development.
The villages with paddy/rice cultivated area, from 9 indicators, the indicator of village transportation and communication infrastructure have the highest value of the degree of correlation compared with other villages. Meanwhile, for the villages with crops cultivated area and the village with other area, indicator of village public health have the highes value in the degree of correlation compared with other villages.
There are regularly pattern in the village typology of paddy/rice villages. The values of VDI in this case will be higher if the percentage of agriculture planted area or agriculture land will also be wider. As its implication, the local government must be capable to care this condition in order to the wide of agriculture land doesn’t change and reduce because of using for another activities.
The villages with the crops planted area have the smallest in value of VDI, both in the context of in migration is more than out migration and the context of in migration is less than out migration. In this context, attention from local government to the villages with crops planted area is very important, in particulary to reduce imbalance of villages development.
The farther distance of the villages from the center, the smaller value of VDI. For distance is more than 20 km, the villages of crops planted area have the smallest value. The local government must give attention to those villages in order to the level of public welfare is still in good condition and in good distribution.
Finally, this study is very important to be developed in the future time in Indonesia, and also in other countries. In Indonesia, recently, laws regarding the villages government and villages development are being criticized by the Indonesian Legislative Assembly. So, VDI is very necessary to give some information to some one and other who interested in the studies about villages development.
18
REFERENCES AND DATA SOURCES
Abizadeh, Sohrab and John Gray. (1985). Wagner’s Law: A Pooled Time-Seri-
es, Cross-Section Comparison. National Tax Journal, No. 2, p. 209-18. Agarwal, Manmohan and Sayan Samanta. (2006). Structural Adjustment,
Governance, Economic Growth and Social Progress. Journal of Interna-tional Trade and Economic Development, V. 15, Sept. No.3, p.387-401.
Badan Perencanaan Pembangunan Nasional (Bappenas). (2001). Indeks Pemba-
ngunan Daerah (Regional Development Index). Draft/Rancangan dalam Bentuk Ringkasan. Bappenas. Jakarta.
Badan Pusat Statistik (BPS) Kabupaten Sragen. (2010). Kecamatan Dalam
Angka di Seluruh Kecamatan (20 Kecamatan) di Kabupaten Sragen Tahun 2009. BPS Kabupaten Sragen. Sragen.
Blanchflower, David G. and Andrew J. Oswald. (2005). Policy Forum: Some
Policy Implications of Behavioural Economics - Happiness and the Human Development Index: The Paradox of Australia. The Australian Economic Review, Vol. 38, No. 3, p. 307-18.
Briguglio, Lino, Gordon Cordina, Nadia Farrugia and Stephanie Vella. (2008).
Economic Vulnerability and Resilience: Concepts and Measurements. Research Paper No. 2008/55, May. UNU World Institute for Develop-ment Economics Research (UNU-WIDER). Helsinki-Finland.
Cahill, Miles B. (2005). Is the Human Development Index Redundant? Eastern
Economic Journal, Vol.31, No.1, Winter, p.1-5. Gusztav, N. (2005). Intergrated Rural Development: The Concept and Its Opera-
tion. Institute of Economics, Hongarian Academic of Science Discussion Paper, No. MT-DP 2005/6.
Islam, Sadequl. (1995). The Human Development Index and Per Capita GDP.
Applied Economics Letters, Vol.2, p.166-76. Kazmier, Leonard J. and Norval F. Pohl. (1987). Basic Statistics for Business
and Economics, Second Edition. McGraw-Hill Book Company. Singapore.
Manasan, Rosario G., Eduardo T. Gonzalez and Romualdo B. Gaffud. (1999).
Indicators of Good Governance: Developing an Index of Governance Quality at the LGU Level, Discussion Paper Series, No. 99-04, March. Philippine Institute for Development Studies. Philippine.
Morris, Morris David. (1979). Measuring the Conditions of the World’s Poor:
The Physical Quality of Live Index. Pergamon Press. USA.
19
Nafziger, E. Wayne. (2006). Economics Development, Fourth Edition. Cam-bridge University Press. Cambridge.
Ogwang, Tomson. (1997). The Choice of Principal Variables for Computing the
Physical Quality of Life Index. Journal of Economic and Social Mea-surement No. 23, p. 213-21.
Price-WaterhouseCooper. (2001). Regions and Development: The Regional
Attractiveness Index. Makalah, Dapat diakses di http://www2.nos.noaa. gov/gomexcoastal_resil/batonr_mar08/06_reams.pdf, downloaded on WEdnesday, 17th September 2008, at 08.55 WIB.
Rahman, Tauhidur. (2007). Measuring the Well-Being Across Countries.
Applied Economic Leters, Nomor 14, p. 779 – 783. Stevens, Candice. (2005). Measuring Sustainable Development. Statistics Brief
OECD, No.10, September, p. 1-8. Streeten, Paul (1996). A Modified Human Development Index and International
Comparison. Applied Economics Letters, Vol.3, pp.677–82. UNDP. (2006). Human Development Report 2006 (Beyond Scarcity: Power,
Poverty and the Global Water Crisis. Palgrave Macmillan Ltd. New York.
UN-HABITAT. (2002). Urban Governance Index (UGI): A Tool to Measure
Progress in Achieving Good Urban Governance [Global Campaign on Urban Governance]. Makalah/Paper, dapat diakses di http://www. Impac-talliance.org/file_download.php?location=S_U&filename= 1153 3840311 Urban_Governance_Index.pdf, downloaded on Wednesday, 17th September 2008, at 10.21 WIB.
Wang, Xiaolu. (2007). Who’s in First? A Regional Development Index for the
People’s Republic of China’s Provinces, ADB Institute Discussion Paper, No.66, May, pp.1-31.
Wonnacott, Thomas H. and Ronald J. Wonnacott. (1990). Introductory Statistics
for Business and Economics, Fourth Edition. John Wiley and Sons. Singapore.
Yale University. (2005). Environmental Sustainability Index: Benchmarking
National Environmental Stewardship. Yale Center for Environmental Law and Policy. New Haven-USA.
Zgurovsky, Michael. (2007). Impact of the Information Society on Sustainable
Development: Global and Regional Aspects, Data Science Journal, Vol. 6 (Supplement), March, pp.S137-S145.

20
APPENDIXES Appendix 1. The Result of Analyses of One Way Anova
Descriptive Statistics
Dependent Variable: Village Development Index
Village Typology Mean Std. Deviation N (1) (2) (3) (4)
Paddy / race villages 3.781 0.3672 182 Crops villages 3.472 0.3697 6 Others villages 3.779 0.1309 8 Total 3.771 0.3635 196
Source: Summarized from the result of analyses of secondary data by using SPPS computer program (2012)
Dependent Variable: Village Development Index
95% Confidence Interval Village Typology Mean Std. Error
Lower Bound Upper Bound (1) (2) (3) (4) (5)
Paddy / race villages 3.789 (1) 0.029 3.731 3.847 Crops villages 3.495 (3) 0.157 3.184 3.805 Others villages 3.773 (2) 0.133 3.511 4.035
Source: Summarized from the result of analyses of secondary data by using SPPS computer program (2012
Tests of Between-Subjects Effects:
Dependent Variable: Village Development Index
Source Type III Sum of Squares df Mean
Square F Sig.
Corrected Model .554(a) 2 0.277 2.121 0.123 Intercept 409.572 1 409.572 3135.297 0.000 Village Typology .554 2 0.277 2.121 0.123 Error 25.212 193 0.131 Total 2813.381 196 Corrected Total 25.766 195
a R Squared = .022 (Adjusted R Squared = .011) Source: Summarized from the result of analyses of secondary data by using
SPPS computer program (2012)

21
Appendix 2.a. The Result of Analyses of Two Ways Anova
Tests of Between-Subjects Effects
Dependent Variable: Village Development Index
Source Type III Sum of Squares df Mean
Square F Sig.
Corrected Model 1.477(a) 8 0.185 1.421 0.190
Intercept 388.112 1 388.112 2987.906 0.000
Vill_Tip * Agri.Land 0.309 3 0.103 0.792 0.500
Vill_Tip 0.265 2 0.132 1.019 0.363
Agri.Land 0.309 3 0.103 0.792 0.500
Error 24.290 187 0.130
Total 2813.396 196
Corrected Total 25.767 195
a R Squared = .057 (Adjusted R Squared = .017)
Tests of Between-Subjects Effects
Dependent Variable: Village Development Index
Source Type III Sum of Squares df Mean Square F Sig.
Corrected Model 1.193(a) 5 0.239 1.844 0.106
Intercept 263.124 1 263.124 2034.365 0.000
Vill_Tip 1.110 2 0.555 4.293 0.015
Migration 0.551 1 0.551 4.261 0.040
Vill_Tip * Migration 0.506 2 0.253 1.956 0.144
Error 24.574 190 0.129
Total 2,813.396 196
Corrected Total 25.767 195
a R Squared = .046 (Adjusted R Squared = .021) Dependent Variable: Village Development Index
95% Confidence Interval Net Migration Mean Std. Error
Lower Bound Upper Bound
Out Migration is more 3.419 (2) 0.139 3.145 3.693
In Migration is more 3.747 (1) 0.077 3.595 3.899
Source: Summarized from the result of analyses of secondary data by using
SPPS computer program (2012)

22
Appendix 2.b. The Result of Analyses of Two Ways Anova
Tests of Between-Subjects Effects
Dependent Variable: Village Development Index
Source Type III Sum of Squares df Mean Square F Sig.
Corrected Model 1.666 (a) 6 0.278 2.178 0.047
Intercept 318.289 1 318.289 2,496.036 0.000
Vill_Tip 0.287 2 0.143 1.124 0.327
Distance 0.006 2 0.003 0.024 0.976
Vill_Tip * Duistance 0.056 2 0.028 0.221 0.802
Error 24.101 189 0.128
Total 2813.396 196
Corrected Total 25.767 195
a R Squared = .065 (Adjusted R Squared = .035)
Dependent Variable: Village Development Index
95% Confidence Interval Distance between Center and Village Office Mean Std. Error
Lower Bound Upper Bound
Distance < 10 km 3.793 (a) 0.181 3.436 4.151 Distance 10 - < 20 km 3.816 (a) 0.076 3.666 3.965 Distance ≥20 km 3.675 0.129 3.420 3.930
a Based on modified population marginal mean.
Tests of Between-Subjects Effects
Dependent Variable: Village Development Index
Source Type III Sum of Squares df Mean Square F Sig.
Corrected Model 0.652 (a) 5 0.130 0.986 0.428
Intercept 373.449 1 373.449 2825.155 0.000
Vill_Tip 0.447 2 0.223 1.691 0.187
Sex Ratio 0.012 1 0.012 0.090 0.764
Vill_Tip * Sex Ratio 0.028 2 0.014 0.107 0.898
Error 25.116 190 0.132
Total 2813.396 196
Corrected Total 25.767 195
a R Squared = .025 (Adjusted R Squared = .000) Source: Summarized from the result of analyses of secondary data by using
SPPS computer program (2012)