Embed Size (px)
Citation preview

THE VERMONT HAPPINESS INITIATIVE
Conducted in September, 2013
By The Center for Rural Studies
at the University of Vermont
Results of the
2013 Statewide
Happiness Study

1
DRAFT as of 2-22-2014
Contents Introduction................................................................ 2
Methodology................................................................. 2
Results..................................................................... 2
Frequency Tables............................................................ 2
Demographics .............................................................. 2
Median Age .............................................................. 2
Gender .................................................................. 2
Race/Ethnicity .......................................................... 2
Marital status .......................................................... 3
Living Arrangements ..................................................... 3
Residence Type .......................................................... 3
Educational Attainment .................................................. 3
Have children under 18 .................................................. 3
Household Income ........................................................ 3
County of Residence ..................................................... 4
American Time Use Survey (ATUS) question set .............................. 4
Cantril’s Ladder of life question ......................................... 4
United Kingdom’s Quality of Life question set ............................. 5
Gross National Happiness Domain results ................................... 5
Results from individual questions comprising composite domain categories .. 5
County Comparisons ....................................................... 15
Tom Barefoot, Gross National Happiness USA [email protected]
Michael Moser, Center for Rural Studies University of Vermoont [email protected]
Wermont Wellbeing Survey September 2013
www.gnhusa.org/

2
Introduction The Vermont Well-being Survey is based on four decades of development of well-being, happiness and quality of
life surveys and recent efforts to standardize the questions and format of these surveys to increase the ability to
compare data around the world.
The Happiness study selected and adapted 250 items from published surveys that measured the same constructs and
selected items which appeared to measure the GNH domains of:
Psychological well-being (Assesses satisfaction and optimism in individual life)
Physical health (Measures self-rated health, disability, exercise, sleep, and nutrition)
Time balance (Measures the use of time for recreation and socializing with family and friends.)
Community vitality (Focuses on relationships and interactions in communities)
Social connectedness (Examines sense of belonging and vitality of affectionate relationships)
Education and cultural access (Evaluates participation in educational and cultural events)
Environmental quality/access to nature (Measures the quality of local water, air, and soil)
Good governance (Assesses how the population views local government)
Material well-being (Evaluates individual and family income as well as financial security)
Work experience (Evaluates satisfaction with working life)
Methodology The Center for Rural Studies, located at the University of Vermont, contracted with Gross National Happiness USA
to field the first state-based, statistically-significant Happiness Study in the U.S. Vermont Happiness data were
collected from September 9th
through the 22nd
, 2013. Specially-trained callers utilized a random sample of Vermont
phone numbers and interviewed only respondents that were 18 years of age or more. Calling took place during
weekdays and weekends between the hours of 9am and 8pm. A total of 426 completed responses were collected
ensuring a confidence level of 95% and a confidence interval (Margin of Error) of +/-4.9%. This means that if this
study were conducted 100 times, 95 of those times, the results provided below would fall within +/-4.9% of what
was found in this effort. This is a commonly-accepted threshold for social science research of this type.
Results Results were weighted to ensure that respondent characteristics were representative to actual population
characteristics. 2012 American Community Survey data were used to compare respondent demographics when
possible. Comparisons for weighted and un-weighted results and for national happiness study results are reported
here for the demographics, UK Quality of Life, Ladder, American Time Use and Happiness Domain questions.
Calculations may not equal to 100 due to rounding.
Frequency Tables
Demographics
Median Age
VT
Un-weighted
VT
Weighted
VT
Census Total Pop
U.S.
Un-weighted
U.S.
Census Total Pop
62 49 41.5 54 37
Gender
(Percent)
VT
Un-weighted
VT
Weighted
VT
Census 18+
U.S.
Un-weighted
U.S.
Census 18+
Female 60.8 57.6 51.2 46.7 51.4
Male 39.2 42.4 48.8 53.3 48.6
Race/Ethnicity
(Percent)
VT
Un-weighted
VT
Weighted
VT
Census Total Pop
U.S.
Un-weighted
U.S.
Census Total Pop
African American 0.5 0.5
1.0
(Black/African
American- not
Hispanic/Latino)
4.3
12.3
(Black/African
American- not
Hispanic/Latino)
Hispanic 0.0 0.0 1.6 (Hispanic or
Latino) 3.8
16.9 (Hispanic or
Latino)

3
Caucasian 94.6 92.0 94.0 (Not
Hispanic/Latino) 86.3
62.8 (Not
Hispanic/Latino)
Asian American 0.5 .4 NA 1.1 NA
Native American 2.2 1.4 NA 0.7 NA
South Asian/Indian
Subcontinent 0.0 0.0 NA 0.9 NA
Multi-racial 2.0 5.2 2.0 2.5 2.9
Middle Eastern 0.2 .5 NA 0.5 NA
Marital status
(Percent)
VT
Un-weighted
VT
Weighted
VT
Census 15+
U.S.
Un-weighted
U.S.
Census 15+
Currently Single 11.2 20.3 NA 21.3 NA
Married 60.6 56.4 49.8 58.2 50.3
Domestic partnership 2.7 4.7 NA 5.4 NA
Divorced 11.5 9.8 12.1 11.2 11.1
Separated 0.7 .9 1.4 1.6 2.2
Widowed 13.2 7.9 5.9 2.3 5.9
Living Arrangements
(Percent)
VT
Un-weighted
VT
Weighted
VT
Census Total
Pop
U.S.
Un-weighted
U.S.
Census Total
Pop
Live alone 24.8 17.6 27.9 17.0 27.8
Living with roommates or
housemates 7.8 13.7 9.9 8.4 6.2
Married or Coupled with no
children 38.3 28.4 30.8 35.7 27.4
Married or Coupled with a child or
children in the household 25.5 35.2 18.2 32.0 20.7
Single-parent with a child or
children in the household 3.6 5.0 9.1 7.0 11.4
Residence Type
(Percent)
VT
Un-weighted
VT
Weighted
In open country but not on a farm 30.2 32.0
On a farm 5.5 6.6
In a small town 42.7 38.5
In an urban / suburban area 21.6 22.9
Educational Attainment
(Percent)
VT
Un-weighted
VT
Weighted
VT
Census 18+
U.S.
Un-weighted
U.S.
Census 18+
Less than 9th grade 1.4 0.9 2.7 0.0 5.3
Some high school, but no degree 3.4 4.6 5.8 1.4 8.5
High school degree or equivalent 19.5 25.7 30.0 7.2 28.4
Skills training and/or an
apprenticeship 5.8
Removed for
Calculation* NA 3.5 NA
Some college 18.8 17.0 21.0 24.5 23.9
Undergraduate degree (e.g. a BA) 24.5 28.2 20.3 32.3 17.0
Graduate degree (e.g. a Master’s) 26.7 23.7 12.0 31.1 9.6
*This category was removed from this calculation for Census data comparability.
Have children under 18
(Percent)
VT
Un-weighted
VT
Weighted
VT
Census Total
Pop
U.S.
Un-weighted
U.S.
Census Total
Pop
Yes 20.3 30.8 27.2 29.4 32.1
Household Income
(Percent)
VT
Un-weighted
VT
Weighted
VT
Census Total
Pop
U.S.
Un-weighted
U.S. Census
Total Pop

4
Less than $30,000 23.9 28.1 26.9 17.0 29.6
$30,000-$74,999 38.8 35.8 40.1 38.1 37.2
$75,000-$124,999 27.2 26.5 21.7 31.1 19.8
$125,000 or more 10.1 9.6 11.4 13.8 13.7
County of Residence (Percent) VT Weighted VT Census Total Pop
Addison 7.2 5.9
Bennington 7.5 5.9
Caledonia 5.0 5.0
Chittenden 23.1 25.3
Essex 0.9 1.0
Franklin 6.3 7.7
Grand Isle 2.7 1.1
Lamoille 3.1 4.0
Orange 4.8 4.6
Orleans 2.1 4.3
Rutland 7.3 9.7
Washington 13.0 9.5
Windham 9.3 7.0
Windsor 7.8 9.0
Total 100.0 100.0
American Time Use Survey (ATUS) question set Utilized by the U.S. Bureau of Labor Statistics: The American Time Use Survey (ATUS) provides nationally
representative estimates of how, where, and with whom Americans spend their time, and is the only federal survey
providing data on the full range of nonmarket activities, from childcare to volunteering.-
http://www.bls.gov/tus/overview.htm#1
How frequently in the past 12 months
have you participated in the activities
of a group or organization such as a
neighborhood association, political
party, church or religious org, sports
group, hobby or leisure club,
charitable org or any other group?
(Percent)
VT
Un-weighted
VT
Weighted
VT
ATUS*
U.S.
Un-weighted
U.S.
ATUS*
I have participated in neighborhood
associations or groups more than
twice in the past year.
61.6 61.0 44.0
I have participated in neighborhood
associations or groups once or twice
in the past year.
10.6 11.0 10.3
I belong to such groups but have not
participated in any during the past
year.
3.8 2.5 7.7
I do not belong to any neighborhood
associations or groups. 24.0 25.5 38.1
*Bureau of Labor Statistics ATUS data not available at report time.
Cantril’s Ladder of life question The Cantril Scale, which has been used by a wide variety of researchers since its initial development by Hadley
Cantril, is an example of one type of wellbeing assessment. At the same time, scholarly research has revealed that
measurement of wellbeing is multifaceted, including a continuum from judgments of life (life evaluation) to feelings
(daily affect). Different measures of wellbeing provide different perspectives on the process by which respondents
reflect on or experience their lives. The Cantril Scale measures wellbeing closer to the end of the continuum
representing judgments of life or life evaluation (Diener, Kahneman, Tov, & Arora, 2009). Research conducted
across countries around the world (Deaton, 2008) indicates substantial correlations between the Cantril Scale and
income. This contrasts with measures of feelings or affect which appear to be more closely correlated with variables

5
such as social time (Harter & Arora, 2008).- http://www.gallup.com/poll/122453/understanding-gallup-uses-cantril-
scale.aspx
Now, please imagine a ladder with the steps numbered from
zero at the bottom to ten at the top. Suppose we say that the top
of the ladder represents the best possible life for you and the
bottom of the ladder represents the worst possible. If the top
step is 10 and the bottom step is 0, on which step of the ladder
do you feel you personally stand at the present time? (Mean)
VT
Un-weighted
VT
Weighted
U.S.
Un-
weighted
Mean Score 7.4 7.0 6.6
United Kingdom’s Quality of Life question set
United Kingdom (UK) Quality of Life Domain (Means) VT
Un-weighted
VT
Weighted UK
On a scale of 0 to 10 where 0 is "not at all satisfied" and 10 is
"extremely satisfied", how satisfied are you with your life
nowadays?
7.7 7.5 7.4
On a scale of 0 to 10, where 0 is not at all happy and 10 is
extremely happy, how happy did you feel yesterday? 7.6 7.5 7.4
On a scale of 0 to 10, where 0 is not at all anxious and 10 is
extremely anxious, how anxious did you feel yesterday? 3.3 3.2 3.4
On a 0 to 10 scale, where 0 is not at all worthwhile and 10 is
extremely worthwhile: to what extent do you feel the things
you do in your life are worthwhile?
8.2 8.1 7.6
Gross National Happiness Domain results
The results from multiple series of questions (detailed below) are collapsed into the GNH domain categories.
Happiness Domains (Mean) VT
Un-weighted
VT
Weighted
U.S.
Un-
weighted
Psychological Wellbeing 4.1 4.1 3.8
Physical Health 3.8 3.9 3.5
Time Balance 3.3 3.1 3.0
Community Vitality 3.6 3.5 3.1
Social Connection 4.4 4.3 3.8
Education & Cultural Access 3.9 3.9 3.7
Environmental Quality 4.2 4.2 3.8
Governance 3.2 3.0 2.9
Material Wellbeing 3.8 3.5 3.4
Work Experience 3.9 3.8 3.5
Results from individual questions comprising composite domain
categories (VT weighted results)
I lead a purposeful and meaningful life. Frequency Percent
Strongly Disagree 1 .2
Disagree 11 2.7
Neither Agree nor Disagree 24 5.9
Agree 231 57.7
Strongly Agree 134 33.5
Total 400 100.0
I am engaged and interested in my daily activities. Frequency Percent
Strongly Disagree 1 .3
Disagree 11 2.7
Neither Agree nor Disagree 19 4.9

6
Agree 242 60.5
Strongly Agree 127 31.7
Total 400 100.0
I am optimistic about my future. Frequency Percent
Strongly Disagree 2 .4
Disagree 17 4.3
Neither Agree nor Disagree 25 6.3
Agree 217 54.3
Strongly Agree 139 34.7
Total 400 100.0
Most days I feel a sense of accomplishment from what I do. Frequency Percent
Strongly Disagree 0 .1
Disagree 33 8.3
Neither Agree nor Disagree 45 11.2
Agree 229 57.3
Strongly Agree 92 23.1
Total 399 100.0
In general, I feel very positive about myself. Frequency Percent
Strongly Disagree 1 .2
Disagree 31 7.9
Neither Agree nor Disagree 39 9.7
Agree 230 57.8
Strongly Agree 97 24.5
Total 398 100.0
Would you say your overall health is poor, fair, good, very good or excellent? Frequency Percent
Poor 18 4.6
Fair 39 9.8
Good 131 32.6
Very Good 141 35.3
Excellent 71 17.7
Total 400 100.0
During the past week, how much of the time did you have a lot of energy? Frequency Percent
Very rarely or never 13 3.3
Rarely 24 5.9
Sometimes 89 22.1
Often 141 35.1
Very often or always 135 33.6
Total 401 100.0
During the past week, how much of the time did you feel you could not get going? Frequency Percent
Very rarely or never 164 41.0
Rarely 112 28.1
Sometimes 80 19.9
Often 38 9.5
Very often or always 6 1.5
Total 401 100.0
During the past week, how much of the time did you experience physical pain that
prevented you from doing what you needed to do?
Frequency Percent
Very rarely or never 232 58.6
Rarely 55 13.9
Sometimes 59 14.9

7
Often 28 7.0
Very often or always 23 5.7
Total 397 100.0
How satisfied are you with your ability to perform your daily living activities? Frequency Percent
Very Dissatisfied 5 1.3
Dissatisfied 23 5.8
Neither Satisfied or Dissatisfied 15 3.8
Satisfied 191 47.6
Very Satisfied 166 41.5
Total 401 100.0
How satisfied are you with the quality of your exercise? Frequency Percent
Very Dissatisfied 26 6.5
Dissatisfied 89 22.4
Neither Satisfied or Dissatisfied 51 12.8
Satisfied 152 38.2
Very Satisfied 80 20.2
Total 398 100.0
In a typical week, would you say that you spend...none of your time, not much of
your time, some of your time, most of your time, or all of your time...doing the
kinds of things that you enjoy?
Frequency Percent
None of my time 9 2.1
Not much of my time 25 6.2
Some of my time 168 42.1
Most of my time 182 45.5
All of my time 16 4.0
Total 399 100.0
Do you: strongly disagree, disagree, neither agree nor disagree, agree or strongly
agree with the following statements: In my daily life I seldom have time to do the
things I really enjoy.
Frequency Percent
Strongly Disagree 41 10.2
Disagree 199 49.7
Neither Agree nor Disagree 40 9.9
Agree 102 25.5
Strongly Agree 19 4.7
Total 400 100.0
Please tell me your level of agreement for the following statements. Please think specifically about how things were
for you over the past week.
My life has been too rushed. Frequency Percent
Strongly Disagree 35 8.8
Disagree 153 38.1
Neither Agree nor Disagree 73 18.2
Agree 111 27.6
Strongly Agree 29 7.3
Total 401 100.0
I have been able to take life at a leisurely pace. Frequency Percent
Strongly Disagree 43 10.7
Disagree 130 32.5
Neither Agree nor Disagree 51 12.7
Agree 148 36.9
Strongly Agree 29 7.3
Total 400 100.0

8
I have had enough time to do what I needed to do. Frequency Percent
Strongly Disagree 18 4.6
Disagree 113 28.2
Neither Agree nor Disagree 32 8.1
Agree 208 52.0
Strongly Agree 28 7.1
Total 400 100.0
I have had plenty of spare time. Frequency Percent
Strongly Disagree 56 14.0
Disagree 178 44.5
Neither Agree nor Disagree 25 6.3
Agree 119 29.7
Strongly Agree 22 5.5
Total 400 100.0
When you think about your neighbors, would you say you: Frequency Percent
Trust none of them 11 2.7
Trust a few of them 53 13.6
Trust some of them 57 14.8
Trust most of them 186 48.0
Trust all of them 82 21.0
Total 388 100.0
When you think about strangers that you encounter, would you say you: Frequency Percent
Trust none of them 60 15.3
Trust a few of them 56 14.3
Trust some of them 123 31.1
Trust most of them 142 36.0
Trust all of them 13 3.4
Total 394 100.0
When you think about businesses in your community, would you say you: Frequency Percent
Trust none of them 9 2.3
Trust a few of them 34 8.4
Trust some of them 74 18.7
Trust most of them 238 59.8
Trust all of them 43 10.8
Total 398 100.0
How likely do you think it would be to have all of your money returned to you if it
was found by someone who lives close by? Frequency Percent
Not at all likely 36 8.9
Somewhat likely 72 18.2
Fairly likely 82 20.5
Very likely 151 37.8
Extremely likely 59 14.7
Total 399 100.0
How satisfied are you with your personal safety in your city or town? Frequency Percent
Very Dissatisfied 5 1.1
Dissatisfied 18 4.6
Neither Dissatisfied nor Satisfied 29 7.2
Satisfied 188 46.9
Very Satisfied 161 40.1
Total 401 100.0

9
In the past 12 months would you say you donated money to a charity: Frequency Percent
Never 48 12.1
Once in the last year 55 13.8
At least once every six months 70 17.5
At least once every three months 84 21.1
At least once a month 141 35.5
Total 398 100.0
In the past 12 months would you say you volunteered your time to an organization: Frequency Percent
Never 95 23.8
Once in the last year 46 11.5
At least once every six months 42 10.5
At least once every three months 47 11.8
At least once a month 169 42.3
Total 400 100.0
How satisfied are you with the support you get from your friends? Frequency Percent
Very Dissatisfied 8 2.2
Dissatisfied 11 2.8
Neither Satisfied or Dissatisfied 26 6.7
Satisfied 160 41.0
Very Satisfied 185 47.4
Total 391 100.0
How satisfied are you with your personal relationships? Frequency Percent
Very Dissatisfied 5 1.4
Dissatisfied 31 8.0
Neither Satisfied or Dissatisfied 28 7.3
Satisfied 120 30.8
Very Satisfied 204 52.4
Total 388 100.0
To what extent do you agree with the following statement: People in my life care
about me. Frequency Percent
Strongly Disagree 1 .2
Disagree 6 1.5
Neither Agree nor Disagree 10 2.5
Agree 146 36.5
Strongly Agree 237 59.3
Total 399 100.0
Over the past week have you felt lonely: Frequency Percent
Very rarely or never 229 57.4
Rarely 47 11.7
Sometimes 72 17.9
Often 42 10.5
Very often or always 10 2.5
Total 400 100.0
Over the past week have you felt loved: Frequency Percent
Very rarely or never 13 3.4
Rarely 9 2.1
Sometimes 55 13.7
Often 69 17.4
Very often or always 253 63.4
Total 399 100.0
10
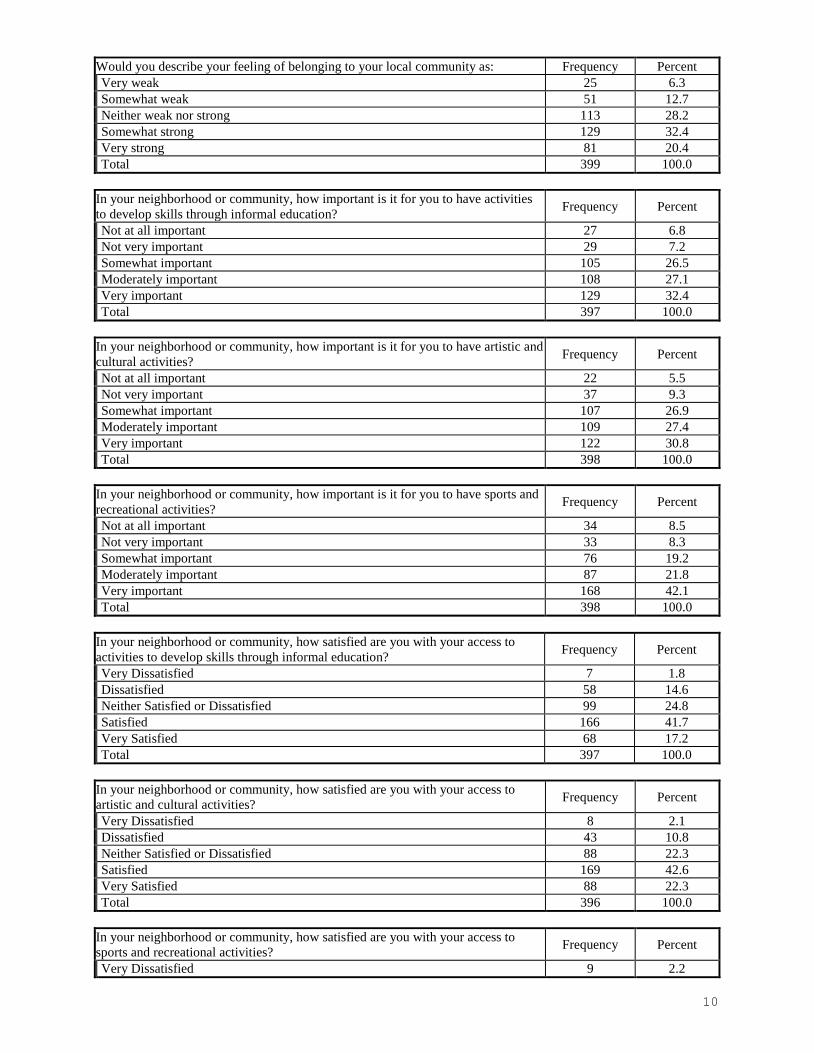
Would you describe your feeling of belonging to your local community as: Frequency Percent
Very weak 25 6.3
Somewhat weak 51 12.7
Neither weak nor strong 113 28.2
Somewhat strong 129 32.4
Very strong 81 20.4
Total 399 100.0
In your neighborhood or community, how important is it for you to have activities
to develop skills through informal education? Frequency Percent
Not at all important 27 6.8
Not very important 29 7.2
Somewhat important 105 26.5
Moderately important 108 27.1
Very important 129 32.4
Total 397 100.0
In your neighborhood or community, how important is it for you to have artistic and
cultural activities? Frequency Percent
Not at all important 22 5.5
Not very important 37 9.3
Somewhat important 107 26.9
Moderately important 109 27.4
Very important 122 30.8
Total 398 100.0
In your neighborhood or community, how important is it for you to have sports and
recreational activities? Frequency Percent
Not at all important 34 8.5
Not very important 33 8.3
Somewhat important 76 19.2
Moderately important 87 21.8
Very important 168 42.1
Total 398 100.0
In your neighborhood or community, how satisfied are you with your access to
activities to develop skills through informal education? Frequency Percent
Very Dissatisfied 7 1.8
Dissatisfied 58 14.6
Neither Satisfied or Dissatisfied 99 24.8
Satisfied 166 41.7
Very Satisfied 68 17.2
Total 397 100.0
In your neighborhood or community, how satisfied are you with your access to
artistic and cultural activities? Frequency Percent
Very Dissatisfied 8 2.1
Dissatisfied 43 10.8
Neither Satisfied or Dissatisfied 88 22.3
Satisfied 169 42.6
Very Satisfied 88 22.3
Total 396 100.0
In your neighborhood or community, how satisfied are you with your access to
sports and recreational activities? Frequency Percent
Very Dissatisfied 9 2.2

11
Dissatisfied 23 5.7
Neither Satisfied or Dissatisfied 86 21.6
Satisfied 168 42.2
Very Satisfied 112 28.3
Total 397 100.0
How often do you feel uncomfortable or out of place in your neighborhood because
of your ethnicity, culture, race, skin color, language, accent, gender, sexual
orientation, or religion?
Frequency Percent
Never 323 80.8
Rarely 34 8.4
Some of The Time 31 7.7
Most of The Time 11 2.7
All of The Time 1 .4
Total 399 100.0
Generally-speaking, would you say your neighborhood is: Frequency Percent
Not at all healthy 5 1.2
A little healthy 10 2.4
Somewhat healthy 145 36.2
Very healthy 196 49.1
Extremely healthy 44 11.1
Total 399 100.0
How satisfied are you with efforts to preserve the natural environment in your
neighborhood? Frequency Percent
Very Dissatisfied 5 1.2
Dissatisfied 25 6.2
Neither Satisfied or Dissatisfied 75 18.9
Satisfied 188 47.0
Very Satisfied 107 26.8
Total 400 100.0
How satisfied are you with the options you have to enjoy nature in your
neighborhood? Frequency Percent
Very Dissatisfied 5 1.1
Dissatisfied 4 .9
Neither Satisfied or Dissatisfied 10 2.5
Satisfied 128 32.0
Very Satisfied 254 63.5
Total 400 100.0
How satisfied are you with the air quality in your neighborhood? Frequency Percent
Very Dissatisfied 2 .6
Dissatisfied 7 1.7
Neither Satisfied or Dissatisfied 6 1.6
Satisfied 151 37.7
Very Satisfied 234 58.4
Total 400 100.0
How satisfied are you with the quality of the natural environment in your
neighborhood? Frequency Percent
Very Dissatisfied 2 .6
Dissatisfied 15 3.8
Neither Satisfied or Dissatisfied 17 4.3
Satisfied 140 35.1
Very Satisfied 225 56.3

12
Total 400 100.0
How satisfied are you with the job being done by local government officials in your
city or town? Frequency Percent
Very Dissatisfied 39 9.7
Dissatisfied 76 19.1
Neither Satisfied or Dissatisfied 94 23.7
Satisfied 158 39.7
Very Satisfied 31 7.7
Total 398 100.0
Please tell me your level of agreement with the following statements:
Corruption is widespread throughout government in my city or town. Frequency Percent
Strongly Disagree 67 16.9
Disagree 143 36.1
Neither agree nor disagree 103 26.0
Agree 69 17.3
Strongly Agree 15 3.7
Total 397 100.0
Public officials in my city or town pay attention to what people think. Frequency Percent
Strongly Disagree 17 4.2
Disagree 66 16.6
Neither agree nor disagree 88 22.2
Agree 174 43.7
Strongly Agree 53 13.3
Total 398 100.0
People in my city or town can influence their public officials. Frequency Percent
Strongly Disagree 7 1.7
Disagree 36 9.1
Neither agree nor disagree 60 15.0
Agree 244 61.5
Strongly Agree 50 12.6
Total 397 100.0
How much confidence do you have in your Local government? Frequency Percent
No confidence 27 6.8
Not very much confidence 106 26.6
A fair amount of confidence 178 44.7
Quite a lot of confidence 71 17.9
A great deal of confidence 16 3.9
Total 398 100.0
How much confidence do you have in your Federal /National government? Frequency Percent
No confidence 118 29.7
Not very much confidence 140 35.2
A fair amount of confidence 113 28.3
Quite a lot of confidence 20 4.9
A great deal of confidence 8 1.9
Total 398 100.0
In general, how stressed do you feel about your personal finances? Frequency Percent
Overwhelming Stress 39 9.8
High Stress 52 13.0
Moderate Stress 158 39.4
Low Stress 96 23.9

13
No Stress at all 55 13.8
Total 401 100.0
How frequently do you find yourself just getting by financially and living paycheck
to paycheck?
Frequency Percent
All the time 81 20.3
Most of the time 65 16.1
Sometimes 96 24.0
Rarely 69 17.4
Never 89 22.2
Total 399 100.0
In the past 12 months how frequently could you not pay bills (water or phone bill,
credit card, etc.) on time?
Frequency Percent
At least once a month 45 11.3
At least once every three months 49 12.3
At least once every six months 19 4.7
Once in the last year 30 7.5
Never 256 64.1
Total 399 100.0
In the past 12 months how frequently did you eat less because there wasn’t enough
food or money for food.
Frequency Percent
At least once a month 40 10.0
At least once every three months 16 3.9
At least once every six months 21 5.4
Once in the last year 11 2.8
Never 311 77.9
Total 399 100.0
Please tell me your level of agreement with the following: I have enough money to
buy the things I want.
Frequency Percent
Strongly Disagree 43 10.7
Disagree 99 24.9
Neither Agree nor Disagree 71 17.7
Agree 135 33.8
Strongly Agree 52 12.9
Total 399 100.0
I'm now going to read you a series of work-life options. Please tell me which
option best describes your current status.
Frequency Percent
A full time employee 159 39.6
A part time employee 40 10.1
Working independently- self employed 62 15.4
Work two or more jobs 16 4.0
A volunteer at an organization 6 1.6
Unemployed looking for work 16 4.0
Retired 75 18.6
Homemaker 6 1.4
Other 21 5.3
Total 400 100.0
All things considered, how satisfied are you with your current work life? Frequency Percent
Very Dissatisfied 6 2.1
Dissatisfied 19 6.6
Neither Satisfied or Dissatisfied 37 12.9

14
Satisfied 104 37.0
Very Satisfied 117 41.4
Total 283 100.0
How satisfied are you with the balance between the time you spend on your job and
the time you spend on other aspects of your life?
Frequency Percent
Very Dissatisfied 15 5.3
Dissatisfied 65 23.0
Neither Satisfied or Dissatisfied 32 11.3
Satisfied 109 38.6
Very Satisfied 61 21.8
Total 282 100.0
How much of the time do you find your current work life Interesting? Frequency Percent
Very rarely or never 7 2.4
Rarely 19 6.9
Sometimes 51 18.0
Often 86 30.8
Very often or always 117 41.9
Total 280 100.0
Please state your level of agreement with each of these statements:
The conditions of my job allow me to be about as productive as I could be. Frequency Percent
Strongly Disagree 6 2.2
Disagree 32 11.7
Neither agree nor disagree 16 6.0
Agree 136 49.7
Strongly Agree 83 30.4
Total 274 100.0
Considering all my efforts and achievements in my job I feel I get paid
appropriately.
Frequency Percent
Strongly Disagree 26 9.4
Disagree 61 21.7
Neither agree nor disagree 26 9.1
Agree 134 47.7
Strongly Agree 34 12.0
Total 281 100.0
I am allowed to decide how to go about getting my job done. Frequency Percent
Strongly Disagree 7 2.6
Disagree 30 10.8
Neither agree nor disagree 14 5.1
Agree 155 55.2
Strongly Agree 74 26.4
Total 281 100.0

15
County Comparisons (No guarantee of statistical differences between Counties)
On a scale of 0 to 10
where 0 is "not at all
satisfied" and 10 is
"extremely satisfied",
how satisfied are you
with your life
nowadays?
On a scale of 0 to
10, where 0 is not at
all happy and 10 is
extremely happy,
how happy did you
feel yesterday?
On a scale of 0 to
10, where 0 is not at
all anxious and 10 is
extremely anxious,
how anxious did you
feel yesterday?
On a 0 to 10 scale, where 0
is not at all worthwhile and
10 is extremely
worthwhile: to what extent
do you feel the things you
do in your life are
worthwhile?
Addison 7.9 7.3 2.3 8.5
Bennington 7.9 8.0 3.3 6.9
Caledonia 5.7 6.3 1.9 5.7
Chittenden 7.3 7.3 3.6 8.3
Essex 8.0 5.8 5.0 8.7
Franklin 8.3 8.2 3.3 8.9
Grand Isle 7.9 9.7 0.4 9.7
Lamoille 7.5 7.6 2.7 8.3
Orange 7.6 7.8 3.0 8.1
Orleans 7.3 7.1 3.8 8.0
Rutland 7.7 7.7 4.3 8.5
Washington 7.7 7.0 3.2 8.1
Windham 7.0 6.9 2.9 8.0
Windsor 7.7 8.3 4.3 8.8
Now, please imagine a ladder with the steps numbered from zero at the bottom to ten at the top. Suppose we say that
the top of the ladder represents the best possible life for you and the bottom of the ladder represents the worst
possible. If the top step is 10 and the bottom step is 0, on which step of the ladder do you feel you personally stand
at the present time?
Addison 7.8
Bennington 6.8
Caledonia 4.2
Chittenden 6.8
Essex 7.3
Franklin 8.1
Grand Isle 7.9
Lamoille 7.7
Orange 7.2
Orleans 6.8
Rutland 7.4
Washington 7.3
Windham 6.4
Windsor 6.7

16
Physica
l
Wellbei
ng
Physic
al
Health
Time
Balan
ce
Comm
unity
Vitalit
y
Social
Conne
ction
Education
and
Cultural
Access
Environ
mental
Quality
Gover
nance
Material
Wellbein
g
Work
Experie
nce
Addison 4.2 4.0 3.1 3.7 4.4 4.0 4.2 3.1 3.7 3.9
Benning
ton 4.0 4.2 3.3 3.9 4.6 4.2 4.4 3.5 3.6 3.7
Caledon
ia 3.6 3.7 3.5 3.6 3.6 3.6 4.2 2.5 3.5 3.9
Chitten
den 4.2 3.9 3.2 3.7 4.3 3.9 4.2 3.1 3.6 3.8
Essex 4.0 3.5 2.4 2.8 3.7 3.7 4.2 2.6 3.6 3.0
Franklin 4.3 4.2 3.5 3.4 4.7 4.2 4.2 3.1 4.1 4.1
Grand
Isle 4.7 4.2 3.4 3.4 4.8 3.5 4.8 2.5 3.5 4.5
Lamoill
e 4.2 3.5 3.3 3.5 4.3 3.7 4.4 3.2 4.0 4.1
Orange 4.1 3.8 2.9 3.6 4.4 3.8 4.3 3.1 3.3 3.7
Orleans 4.0 3.9 3.1 3.8 4.7 3.9 4.5 2.8 3.5 4.1
Rutland 4.2 3.9 3.1 3.5 4.1 3.7 4.0 2.9 3.6 3.8
Washin
gton 4.1 3.6 3.2 3.3 4.1 3.9 4.3 2.9 3.1 3.8
Windha
m 4.1 3.9 3.0 3.3 4.1 3.8 3.9 2.9 3.2 3.5
Windso
r 4.0 3.7 2.8 3.5 4.6 3.6 4.3 2.8 3.7 3.7