Embed Size (px)
Citation preview
The Value of Energy Benchmarking for
Commercial Buildings
Israeli Green Building Council 8th Annual Conference
September 10, 2019

2

3
4
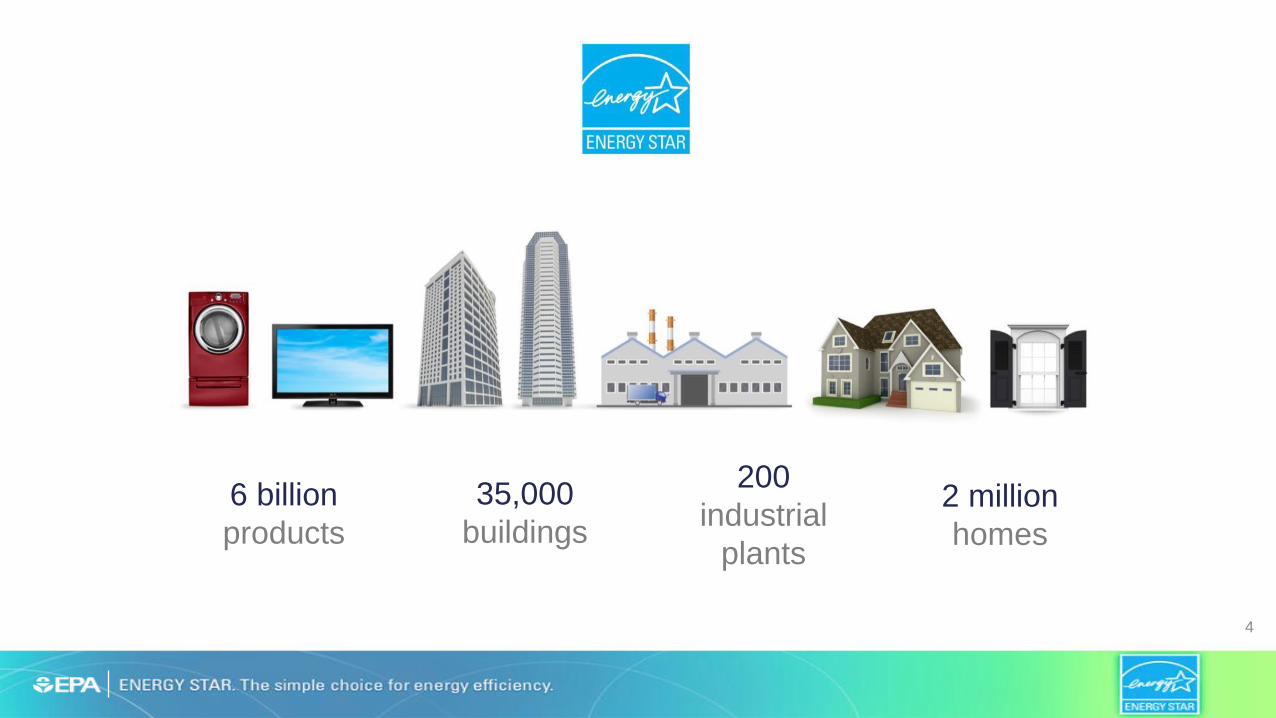
6 billion
products2 million
homes
35,000
buildings
200
industrial
plants

5
Recognized by
more than 90%
of Americans
0%
10%
20%
30%
40%
50%
60%
70%
80%
90%
100%
19
99
20
00
20
01
20
02
20
03
20
04
20
05
20
06
20
07
20
08
20
09
20
10
20
11
20
12
20
13
20
14
20
15
20
16

In the beginning . . .
6
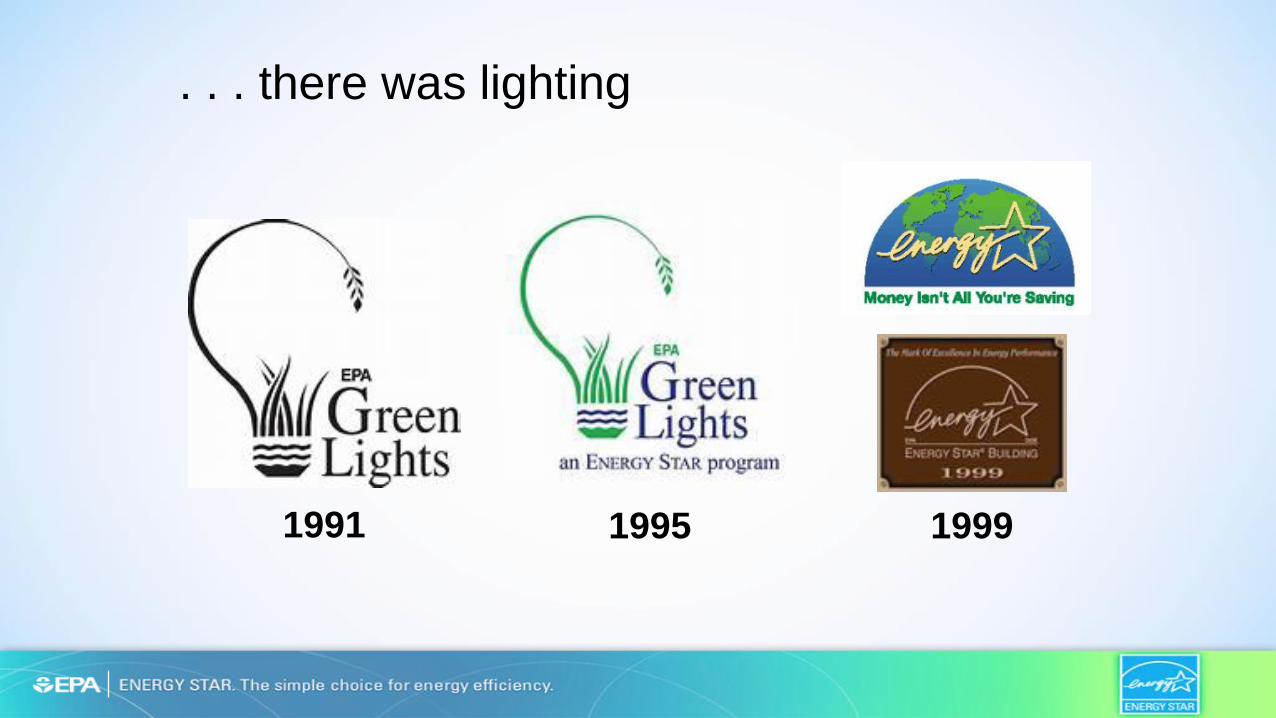
. . . there was lighting
1991 19991995
Myth #1: Age Matters
My building is new, so I know it’s energy efficient.

9
Num
ber
of
Build
ings
• Based on survey of
4,000 office buildings.
• Top performing
buildings use 3 to 4
times less energy per
ft2 than the worst
performers.
39% of
buildings in
top quartile
are less than
25 years old
35% of
buildings in
bottom
quartile are
less than 25
years old
Worst PerformersBest Performers
121.1 165.786.0 339.4
Energy Use Intensity(kBtu/ft2/year)
New Doesn’t Equal Efficient

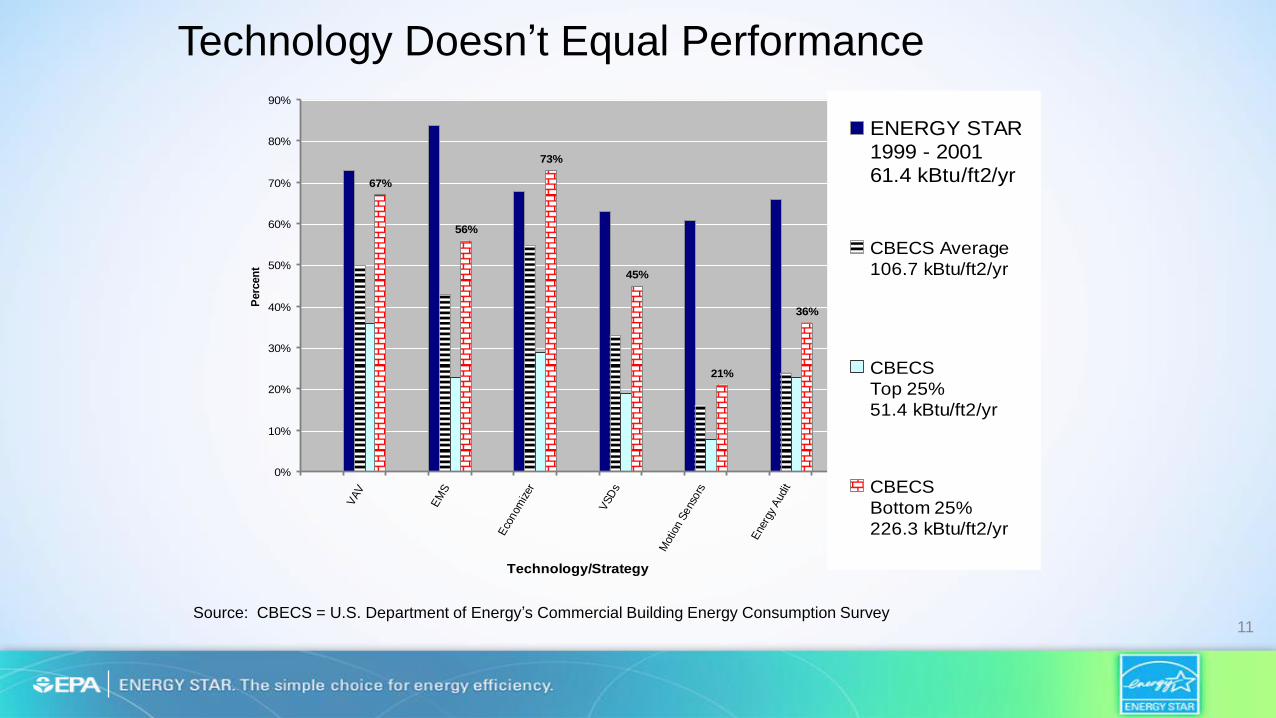
Myth #2: Technology Matters
I installed energy efficient technologies, so I know my building is energy efficient.
11
Technology Doesn’t Equal Performance
67%
56%
73%
45%
21%
36%
0%
10%
20%
30%
40%
50%
60%
70%
80%
90%
VAV
EM
S
Eco
nom
izer
VSD
s
Mot
ion
Sens
ors
Ene
rgy
Aud
it
Technology/Strategy
Perc
en
t
ENERGY STAR1999 - 200161.4 kBtu/ft2/yr
CBECS Average
106.7 kBtu/ft2/yr
CBECS
Top 25%
51.4 kBtu/ft2/yr
CBECS
Bottom 25%
226.3 kBtu/ft2/yr
Source: CBECS = U.S. Department of Energy’s Commercial Building Energy Consumption Survey

“We designed the best, most energy efficient building you could possibly want, but then we ran into one big problem . . .
. . . the people moved in.”
-- Anonymous Architect

13

0
50
100
150
200
250
FireStation 8
FireStation 1
FireStation 2
FireStation 3
FireStation
10
FireStation 4
FireStation 6
FireStation 5
FireStation 7
FireStation
11
FireStation 9
FireStation
12
Site E
nerg
y I
nte
nsity (
KB
tu/F
t2)
What Gets Measured Gets Managed
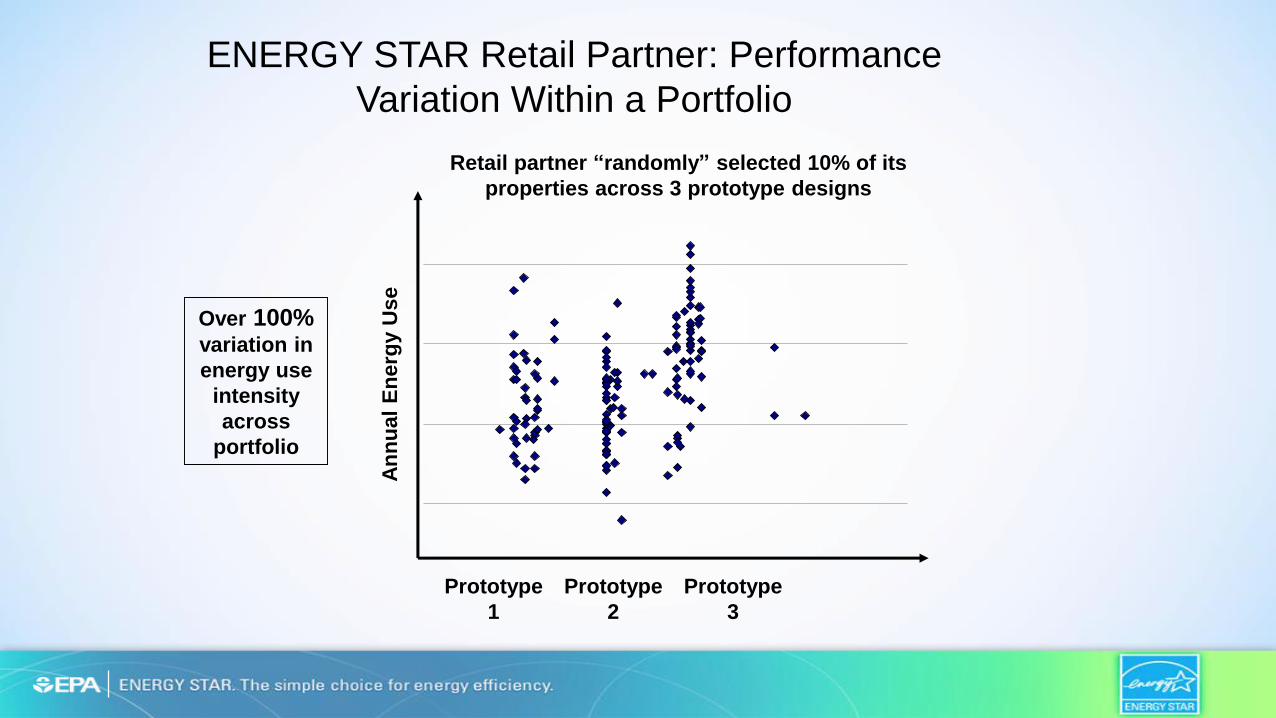
ENERGY STAR Retail Partner: Performance
Variation Within a Portfolio
An
nu
al
En
erg
y U
se
Prototype
1
Prototype
2
Prototype
3
Retail partner “randomly” selected 10% of its
properties across 3 prototype designs
Over 100%variation in
energy use
intensity
across
portfolio
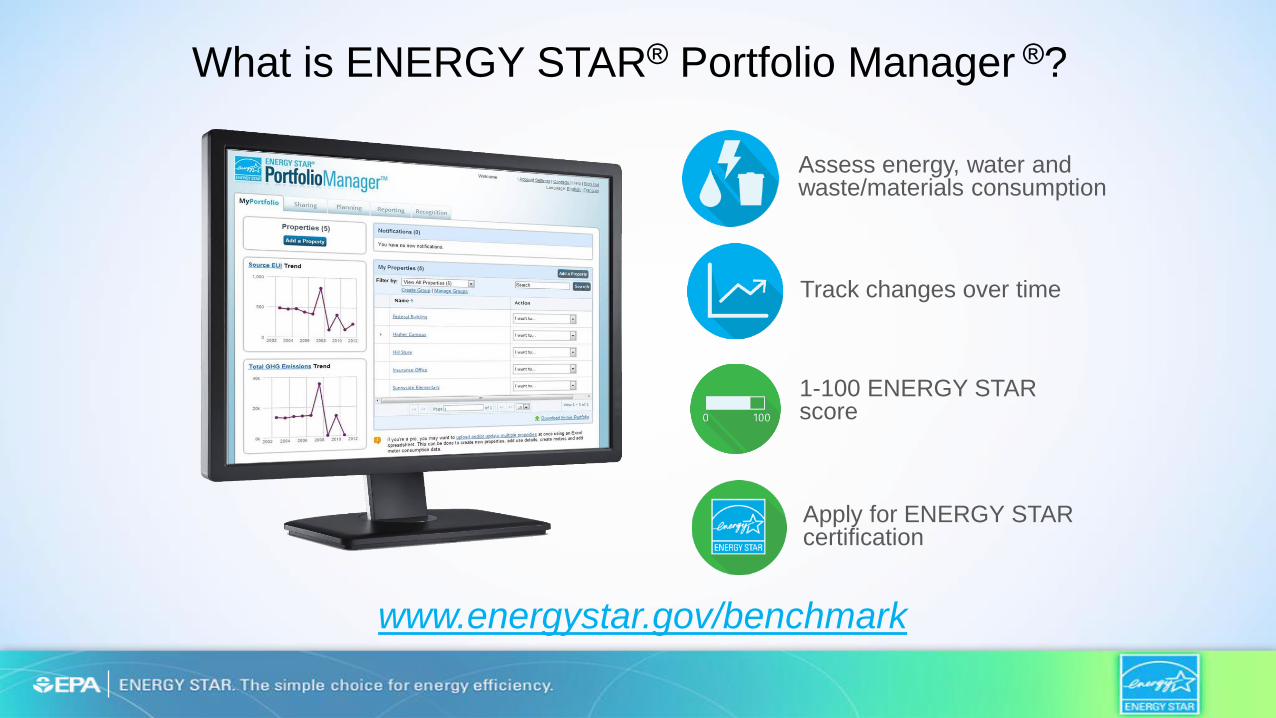
What is ENERGY STAR® Portfolio Manager ®?
www.energystar.gov/benchmark
Assess energy, water and waste/materials consumption
1-100 ENERGY STAR score
Track changes over time
Apply for ENERGY STAR certification

17
0
50,000
100,000
150,000
200,000
250,000
300,000
0
5000
10000
15000
20000
25000
30000
'99 '00 '01 '02 '03 '04 '05 '06 '07 '08 '09 '10 '11 '12 '13 '14 '15 '16 '17 18
Build
ings B
enchm
ark
ed
Flo
or
Space
Year
Annual buildings benchmarked Annual Floor space (millions)
Portfolio Manager Annual Benchmarking
• Represents all building types
“actively” benchmarking
• Scores added for new building
types at various times
• Office only in 1999
• 7 Building types in 2002
• Retail added in 2007
• Multifamily added in 2014
• 20 Building types currently
• Largest growth in benchmarking
is for buildings that can’t get a
score.

The 1-100 ENERGY STAR Score
One simple number
understood by ALL stakeholders.
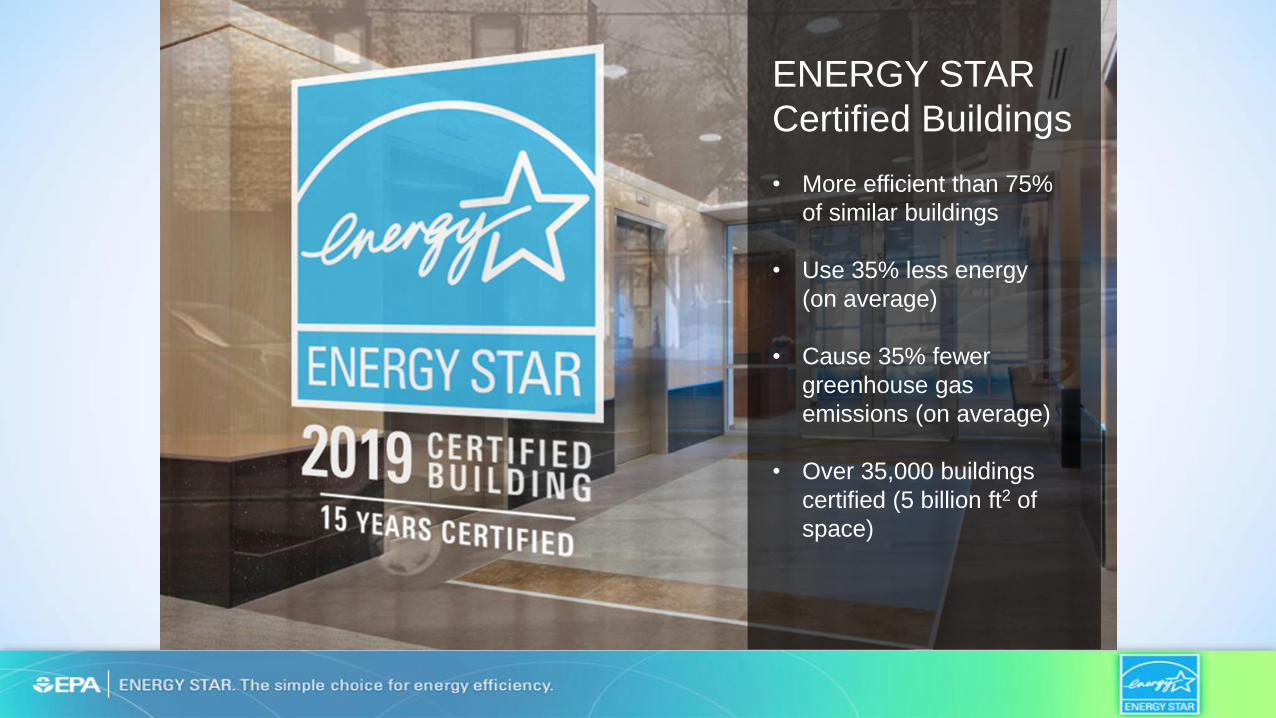
ENERGY STAR
Certified Buildings
• More efficient than 75%
of similar buildings
• Use 35% less energy
(on average)
• Cause 35% fewer
greenhouse gas
emissions (on average)
• Over 35,000 buildings
certified (5 billion ft2 of
space)

Benchmarking Leads to Savings
20
Consistent
benchmarking results
in energy savings and
improved performance
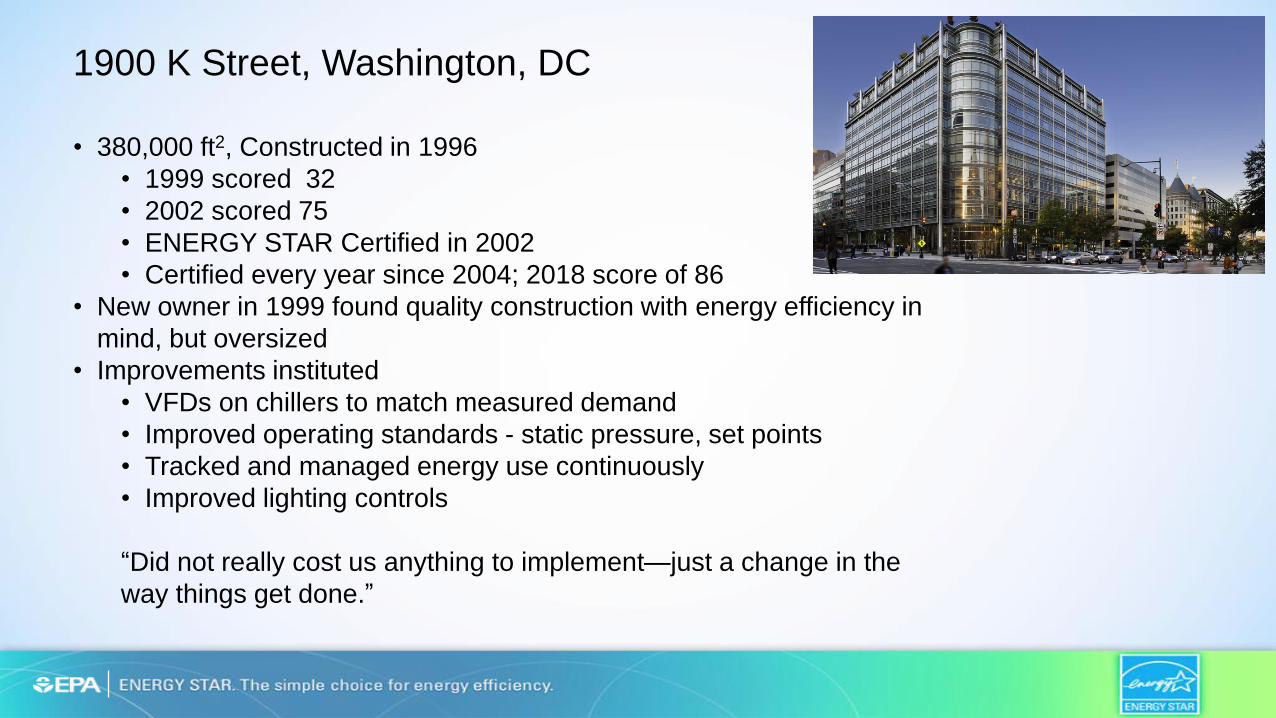
• 380,000 ft2, Constructed in 1996
• 1999 scored 32
• 2002 scored 75
• ENERGY STAR Certified in 2002
• Certified every year since 2004; 2018 score of 86
• New owner in 1999 found quality construction with energy efficiency in
mind, but oversized
• Improvements instituted
• VFDs on chillers to match measured demand
• Improved operating standards - static pressure, set points
• Tracked and managed energy use continuously
• Improved lighting controls
“Did not really cost us anything to implement—just a change in the
way things get done.”
1900 K Street, Washington, DC
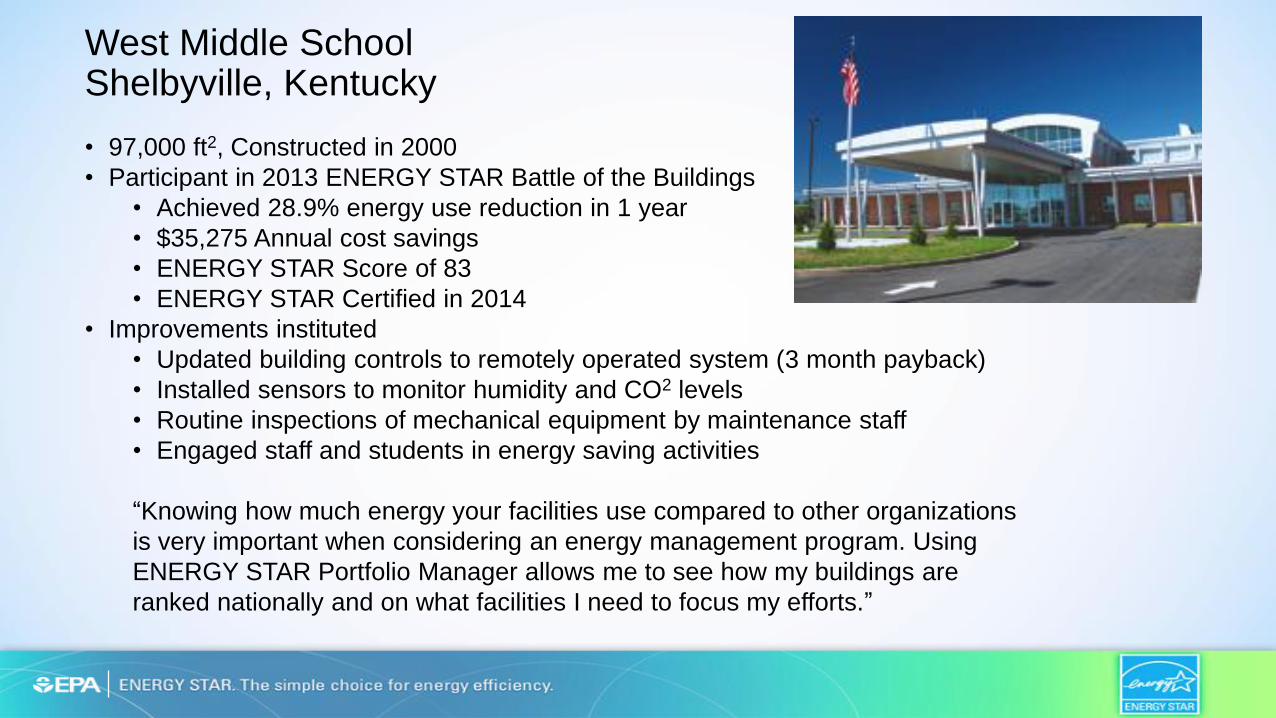
• 97,000 ft2, Constructed in 2000
• Participant in 2013 ENERGY STAR Battle of the Buildings
• Achieved 28.9% energy use reduction in 1 year
• $35,275 Annual cost savings
• ENERGY STAR Score of 83
• ENERGY STAR Certified in 2014
• Improvements instituted
• Updated building controls to remotely operated system (3 month payback)
• Installed sensors to monitor humidity and CO2 levels
• Routine inspections of mechanical equipment by maintenance staff
• Engaged staff and students in energy saving activities
“Knowing how much energy your facilities use compared to other organizations
is very important when considering an energy management program. Using
ENERGY STAR Portfolio Manager allows me to see how my buildings are
ranked nationally and on what facilities I need to focus my efforts.”
West Middle SchoolShelbyville, Kentucky
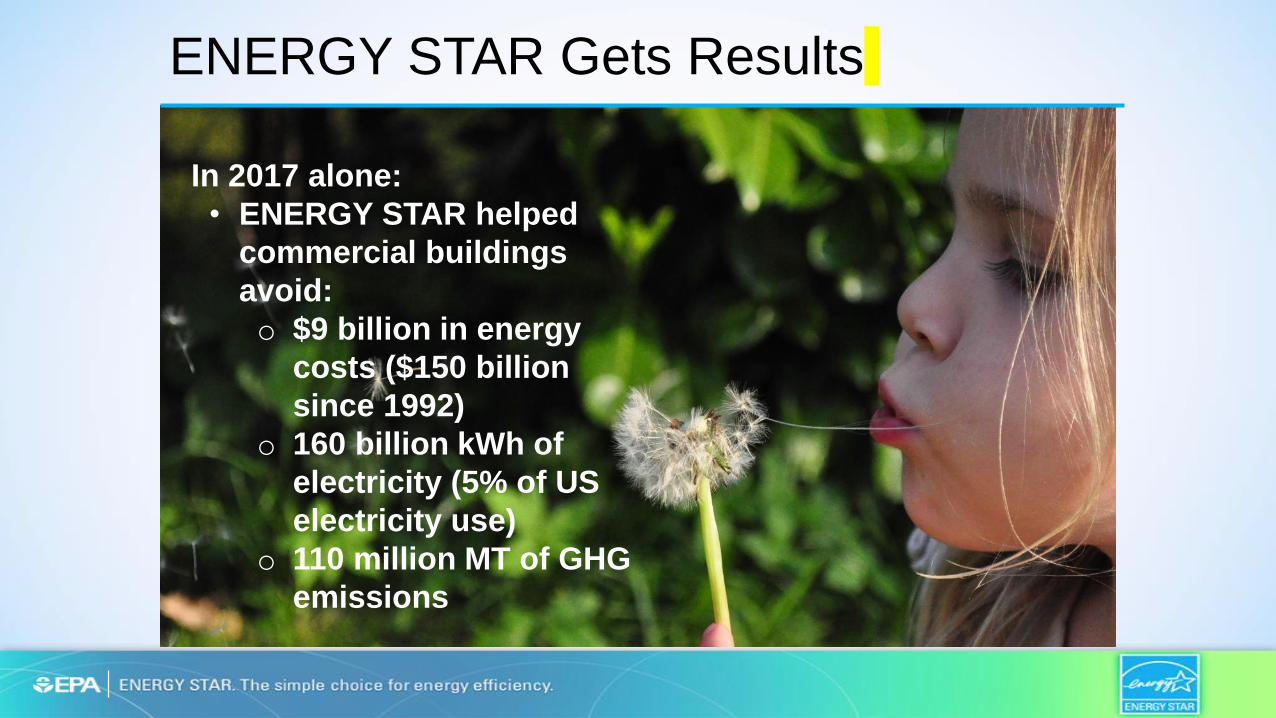
ENERGY STAR Gets Results
In 2017 alone:
• ENERGY STAR helped
commercial buildings
avoid:
o $9 billion in energy
costs ($150 billion
since 1992)
o 160 billion kWh of
electricity (5% of US
electricity use)
o 110 million MT of GHG
emissions
ENERGY STAR and Green Building Rating Systems

25
26
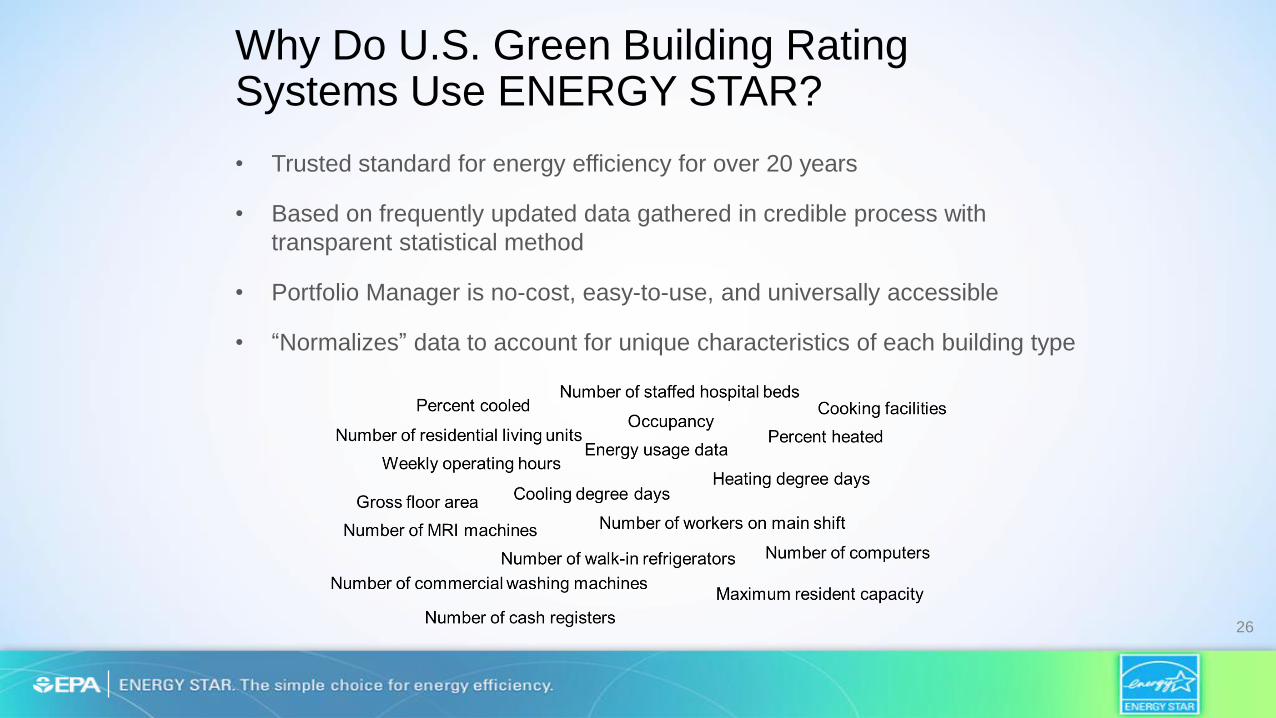
Why Do U.S. Green Building Rating Systems Use ENERGY STAR?
• Trusted standard for energy efficiency for over 20 years
• Based on frequently updated data gathered in credible process with
transparent statistical method
• Portfolio Manager is no-cost, easy-to-use, and universally accessible
• “Normalizes” data to account for unique characteristics of each building type

Benchmarking in the Commercial Market
27
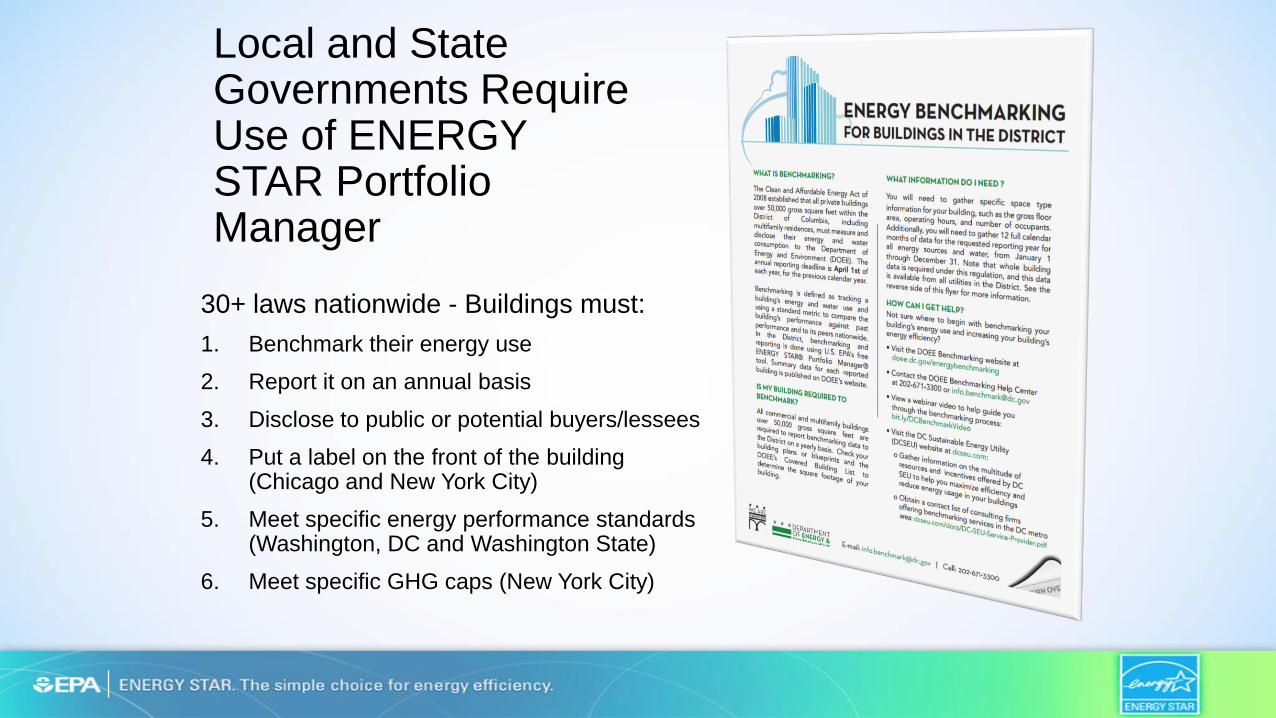
Local and State Governments Require Use of ENERGY STAR Portfolio Manager
30+ laws nationwide - Buildings must:
1. Benchmark their energy use
2. Report it on an annual basis
3. Disclose to public or potential buyers/lessees
4. Put a label on the front of the building (Chicago and New York City)
5. Meet specific energy performance standards (Washington, DC and Washington State)
6. Meet specific GHG caps (New York City)
29
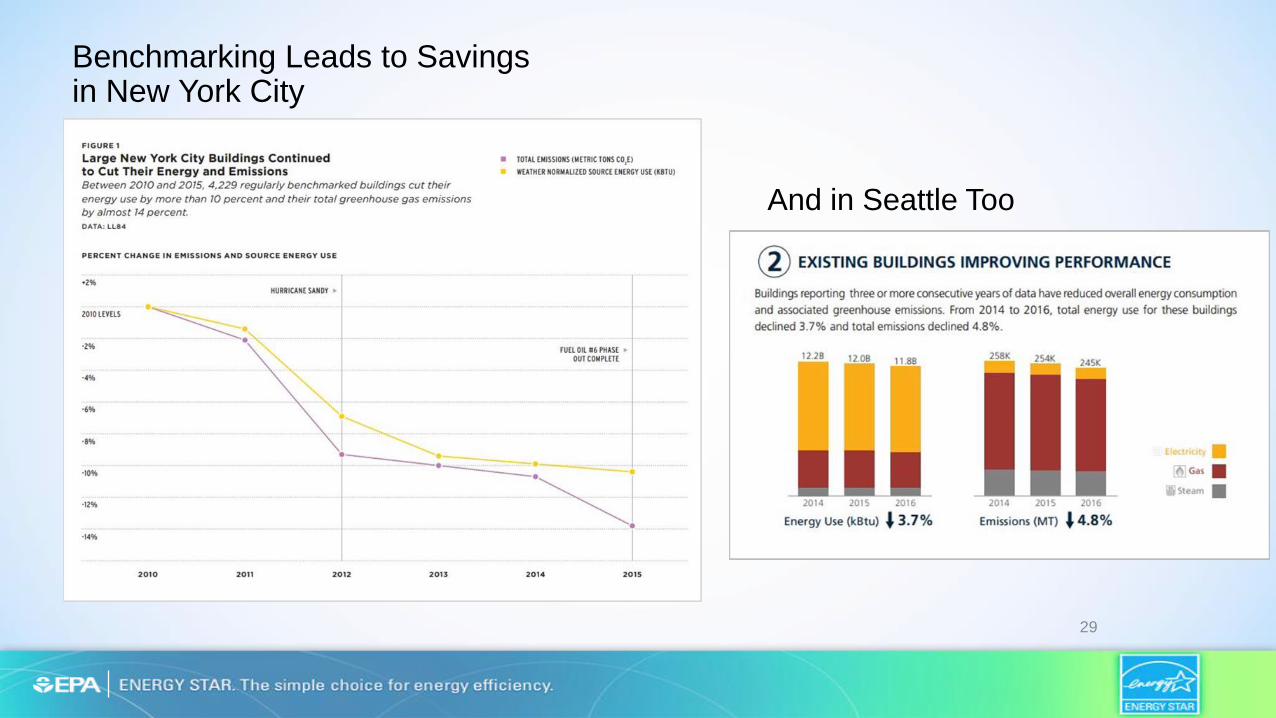
Benchmarking Leads to Savings in New York City
And in Seattle Too

Cities Sharing Benchmarking Results

31

Homepage - www.energystar.gov/buildings
Portfolio Manager - www.energystar.gov/benchmark
Training - www.energystar.gov/buildingstraining
Help - www.energystar.gov/buildingshelp
Mike Zatz
U.S. EPA ENERGY STAR
+1-202-343-9152