Embed Size (px)
Citation preview

The Value of Designated Subjects in Terms of Likely Student Success in
Higher Education


The Value of Designated Subjects in Terms of Likely Student Success
in Higher Education
A Report
Dr Ronél Blom
Higher Education South Africa (HESA)
April 2014

4
ContentsPage
Acronyms 7
Executive Summary 9
1 Introduction and Background 11
2 Terms of Reference 123 Methodology 133.1 Analysis 14
3.2 A Note about the Data 14
3.3 Limitations 14
4 Part 1: Desktop Review – Australia, Brazil and Kenya 154.1 Australia 15
4.2 Brazil 18
4.3 Kenya 20
4.4 Some Comments 21
5 Part 2.1: Analysis – National Senior Certificate Data 235.1 Higher Certificate Passes 23
5.2 National Diploma Passes 25
5.3 Bachelor’s Degree Passes 28
5.4 Some Comments 37
6 Part 2.2: Analysis – Department of Higher Education and Training (HEMIS) Data
38
6.1 Under-Graduate Diploma or Certificate (3 Years) 39
6.2 General Academic First Bachelor’s Degree 40
6.3 Professional First Bachelor’s Degree (4 Years) 41
6.4 Under-Graduate Diploma or Certificate ( 1 or 2 Years) 43
6.5 National Diploma 43
6.6 Professional First Bachelor’s Degree (3 Years) 45
6.7 Completion Rates across the System 46
7 Conclusion and Recommendations 47References 50Annexures 1 52Annexures 2 56
TablesTable 1 South African Designated Subject List, Compared to Other Countries 11
Table 2 Minimum Requirements --- Certificates, Diplomas, Bachelor’s Degrees 13
Table 3 The South African Designated Subject List and the Australian Key Learning Areas 17
Table 4 The South African Designated Subject List and the Brazilian Higher Education Entrance Curriculum 19
Table 5 The South African Designated Subject List and the Kenyan University Entrance Subjects 21
Table 6 Requirements for a Higher Certificate Pass 23
Table 7 Requirements for a National Diploma Pass 25
Table 8 Requirements for a Bachelor’s Degree Pass 29
Table 9 Enrolment per Designated Subject across All Cohorts in Descending Order 36
Table 10 Count per HEMIS Qualification Category 38

5
FiguresFigure 1 Non-Designated Subjects --- Higher Certificate Candidates 23
Figure 2 The ‘Narrow’ Designated Subjects --- Higher Certificate Candidates 24
Figure 3 The Extended Designated Subject List --- Higher Certificate Candidates 25
Figure 4 Non-Designated Subjects --- National Diploma Candidates 26
Figure 5 The ‘Narrow’ Designated Subjects --- National Diploma Passes 27
Figure 6 The Extended Designated Subject List --- National Diploma Candidates 28
Figure 7 Non-Designated Subjects --- Bachelor’s Degree Candidates 29
Figure 8 The ‘Narrow’ Designated Subject List --- Bachelor’s Degree Candidates 30
Figure 9 The Extended Designated Subject List --- Bachelor’s Degree Candidates 31
Figure 10 The ‘Narrow’ Designated Subject List as Offered by Higher Certificate, National Diploma and Bachelor’s Degree Candidates
32
Figure 11 Percentage of Candidates Offering the ‘Narrow’ List across All Cohorts 33
Figure 12 The Extended Designated Subject List as Offered by Higher Certificate, National Diploma and Bachelor’s Degree Candidates
34
Figure 13 Percentage of Candidates Offering the Extended Designated Subjects List across All Cohorts 35
Figure 14 Designated Subject Enrolments in Descending Order 36
Figure 15 Enrolments and Drop-Outs --- Under-Graduate Diploma or Certificate, 3 Years 39
Figure 16 Enrolments and Drop-Outs --- General Academic First Bachelor’s Degree, 3 Years 40
Figure 17 Attrition Rate, 2009-2012 --- General Academic First Bachelor’s Degree 41
Figure 18 Enrolments and Drop-Outs --- Professional First Bachelor’s Degree, 4 Years 41
Figure 19 Attrition Rate, 2009-2012 --- Professional First Bachelor’s Degree, 4 Years 42
Figure 20 Enrolments and Drop-Outs --- Under-Graduate Diploma or Certificate, 1 to 2 Years 43
Figure 21 Enrolments and Drop-Outs --- National Diploma, 3 Years 44
Figure 22 Attrition Rate, 2009-2012 --- National Diploma, 3 Years 45
Figure 23 Enrolments and Drop-Outs --- Professional First Bachelor’s Degree, 3 Years 45
Figure 24 Attrition Rates across All Three Qualifications, 2009-2012 46
Figure 25 Completion Rates across All Three Qualifications, 2011 and 2012 47

6
About HESA
HESA represents 23 public higher education institutions in South Africa. Led by the Vice-Chancellors of these universities, HESA acts to support the higher education sector by advancing and promoting the interests of South African universities, and developing policy positions on matters of higher education.
Higher Education Enrolment Services
As one of HESA’s four key programmes, HE Enrolment Services (among other functions) provides secretariat services to the Admissions Committee, an important governance structure of HESA, and the Matriculation Board which is responsible for ensuring that the statutory responsibility in relation to access to higher education studies is well-managed. It advises the Minister of Higher Education and Training, through the HESA Board, on the minimum admission requirements for university studies.
The Admissions Committee is also responsible for:
• developing and maintaining optimal strategies of admissions for the National Senior Certificate (NSC); • monitoring and reporting on projects commissioned by the Committee, and on system readiness, enrolment trends and
policies, “best practice” benchmarking, and equivalence-setting activities; • drafting the budget and annual financial statements of the Admissions Service and Enrolment Programme; and
• recommending exemption certification application fees to the HESA Board for approval.
In January 2010, and again in October 2013, Dr Ronél Blom was commissioned by the HE Enrolment Services to undertake the studies which culminated in this report. The rationale for this report was to make a number of recommendations that could lead to informed decisions on the current designated subject list --- such as whether to reduce this list, or to keep it intact.
About the Author
Ronél Blom is a researcher at the Researching Education and Labour (REAL) Centre in the University of the Witwatersrand’s School of Education. The REAL Centre conducts research into areas of major theoretical and policy concern, focused on the complex interrelationships between education, knowledge-creation, the economy, and society. Dr Blom obtained her PhD at the University of Pretoria under the guidance of Prof Jonathan Jansen with a focus on the extent to which the National Qualifications Framework (NQF) reflects the ideal of an integrated framework in principle, in perception, and in practice. Her research interests are wide-ranging, stemming from having worked in diverse settings --- from undertaking systemic policy investigations at the South African Qualifications Authority (SAQA), to developing theoretical frameworks for quality assurance of general and further education at Umalusi, to investigating post-school institutions, college lecturer capacity-building, and the education and training regulatory framework. Other related interests include education policy development, evaluation and critique; post-school education and training; articulation in the education and training system; work integrated learning (WIL); and vocational educator development. Forthcoming publications include, Articulation in the South African Education and Training System, a conceptual framework for a system that will allow seamless progression within and across the education and training system (this paper will be published as part of the proceedings of the National Qualifications Framework Conference hosted in 2013), and All Parents Pay their Taxes --- The Contribution of Private Vocational Education to Access to Post-School Education and Training in South Africa.

7
Acronyms
ACACA Australasian Curriculum, Assessment and Certification Authorities
ACER Australian Council for Educational Research
ACT Australian Capital Territory
ATAR Australian Tertiary Admission Rank
CAPS Curriculum and Assessment Policy Statements
CHE Council on Higher Education
CTP Committee of Technikon Principals
CUT Central University of Technology
DBE Department of Basic Education
DHET Department of Higher Education and Training
DoE Department of Education
ENEM Exame Nacional do Ensino Médio
FP Field Position
HEMIS Higher Education Management Information System
HESA Higher Education South Africa
HSC Higher School Certificate
INEP Instituto Nacional de Estudos e Pesquisas Educacionais Anísion Teixeira
KCSE Kenya Certificate of Secondary Education
KCPE Kenya Certificate of Primary Education
KMEST Kenyan Ministry of Education, Science and Technology
KNEC Kenya National Examinations Council
LoLT Language of Learning and Teaching
NARIC National Academic Recognition Information Centre (UK)
NSC National Senior Certificate
NSW New South Wales
NTCET Northern Territory Certificate of Education and Training
OECD Organisation for Economic Co-operation and Development
OP Overall Position
PAS Programa de Avaliação Seriada
QCE Queensland Certificate of Education
RTO Recognised Training Organisation
SACE South Australian Certificate of Education
SAUVCA South African Vice-Chancellors’ Association
TCE Tasmanian Certificate of Education
UAI Universities Admission Index
UJ University of Johannesburg
VCE Victorian Certificate of Education
VCAL Victorian Certificate of Applied Learning
VET Vocational Education and Training
VTAC Victorian Tertiary Admission Centre

8

9
A STUDY FOR HIGHER EDUCATION SOUTH AFRICA (HESA) ON THE VALUE OF DESIGNATED SUBJECTS IN TERMS OF LIKELY STUDENT SUCCESS IN HIGHER EDUCATION
ExECUTIVE SUMMARY
Introduction
1. This study is a further investigation into the claim that a certain set of subjects offered at high school (the ‘designated’ or ‘gateway’ subjects) are the best predictors for student success at higher education levels.
2. In 2011, when the first study was commissioned, it was still too early to make any kind of assessment in this regard, as the class of 2008 needed between 1 and 4 years to conclude their under-graduate programmes.
3. The National Senior Certificate (NSC) is in its sixth year of implementation. It is, therefore, now possible to investigate the 2008 cohort who entered higher education for the first time in 2009.
4. The purpose of the study is to assist Higher Education South Africa (HESA) in making a decision either (a) to reduce the current designated subject list to the original ‘narrow’ list proposed by the South African Universities Vice-Chancellors’ Association-Committee of Technikon Principals (SAUVCA-CTP), or (b) to broaden the list to include vocational subjects with higher pass requirements across the board, or (c) to abandon the list and introduce a compulsory national/regional entry examination as the sole determinant for entry into higher education studies, or (d) to abandon the list and introduce a compulsory national/regional entry examination combined with school aggregates, or (e) to maintain the status quo.
Terms of Reference
5. Two changes were made to the original terms of reference, namely (i) only one cohort was to be investigated --- the cohort that entered higher education for the first time in 2009; and (ii) instead of looking only at those students who achieved a Bachelor’s Degree pass, all students entering higher education were examined (including those with Higher Certificate and National Diploma passes).
Methodology
6. The study was conceived to consist of two parts: first, an in-depth desktop review of the systems in three countries in respect of screening for higher education (Australia, Brazil, and Kenya); and second, an analysis of the Department of Basic Education’s 2008 National Senior Certificate data, compared to the Department of Higher Education and Training’s HEMIS (Higher Education Management Information System) data on entry and throughput of students in the higher education sector.
7. In terms of the latter, the achievements of students were tracked across four years (2009-2012); this was to allow for the completion of the 4-year Bachelor’s Degree.
8. There were some discrepancies in the data: the Department of Education’s1 official figures in their publication, National Senior Certificate Report, 2008, differed from the data received from HESA by some 9 808 candidates. This is explained by the fact that the data received from HESA contained supplementary examination results. Likewise, the data received from the Department of Higher Education’s HEMIS contained much duplication. In the Free State alone, 238 duplications were noted. The reasons for the latter discrepancy should be investigated.
Limitations
9. The most important limitation relates to the fact that no other factors which may have had an impact on success in higher education were considered. Such factors include issues such as socio-economic background, family circumstances, and language barriers.
1 This was the name of the Department before it was split into two distinct departments, namely the Department of Basic Education (DBE) and the Department of Higher Education and Training (DHET).

10
Desktop Review
10. A key characteristic of the Australian system is the inclusion of vocational subjects and programmes in school-leaving certificates. These may contribute to the Australian Tertiary Admission Rank (ATAR), but also serves the dual purpose of providing “alternatives and opportunities for people who might otherwise not remain at school to complete Year 12” (ACER 2008, 4).
11. In Brazil, the widespread use of the long-standing vestibular as the most important screening mechanism is of interest. While the vestibular is no longer mandatory, the new initiatives introduced still make use of screening examinations to determine eligibility for entry into higher education studies.
12. The early filtering out of non-performing students is the most important characteristic of the Kenyan system. As early as at the end of primary school, low achievers are redirected. Unlike the South African NSC that performs a more generalist role, the Kenya Certificate of Secondary Education (KCSE) is geared towards university entrance only (Umalusi 2013, 21).
13. Australia, Brazil, and Kenya represent three possible models that the South African system may want to consider.
Part 2.1: Analysis of the Department of Basic Education’s Data
14. A notable finding is that the bulk of matriculants offer a combination of designated subjects, with low to very low enrolments in non-designated subjects. Highest enrolments are in the following subjects (in descending order): Mathematics, Life Sciences, Mathematical Literacy, Business Studies, Geography, Physical Science, Accounting, Economics, and History. Home Language, First Additional Language, and Life-Orientation have been excluded as these are compulsory subjects.
15. The highest enrolments in non-designated subjects are for Computer Applications Technology, and for Tourism.16. Looking purely at enrolment patterns, it is evident that the current designated subject list encompasses the most popular
subjects, while also serving the purpose of being used as a screening mechanism for eligibility for entry into higher education.
Part 2.2: Analysis of the Department of Higher Education and Training’s HEMIS Data
17. Of the more than 300 000 students who were eligible to enter a Higher Certificate, National Diploma or Bachelor’s Degree course in 2009, 72 729 appeared on the database in their first year of studies.
18. The most sought-after qualifications are those for the General Academic First Bachelor’s Degree, followed by the National Diploma, and the Professional First Bachelor’s Degree (4 years).
19. Completion rates in terms of these three qualifications within the minimum time frame (3 years; 4 years) are low: only 22% of the Bachelor’s Degree cohort finished within 3 years. Likewise, only 15% of the National Diploma cohort finished within the minimum time frame. While the Professional Bachelor’s Degree (4 years) cohort seems to be more successful than their counterparts, the completion rate within 4 years is still only 31%.
Conclusion and Recommendations
20. The study proceeded from the assumption that there would be a clear relationship between designated subjects and success in higher education, particularly success in a Bachelor’s Degree. This assumption turned out to be contestable.
21. None of the cohorts (National Diploma, Bachelor’s Degree, and Professional Bachelor’s Degree candidates) fared particularly well, with only 15% of Diploma candidates, 22% of Academic Bachelor’s Degree candidates, and 31% of Professional Bachelor’s Degree candidates completing their studies within the minimum time frame.
22. It seems likely that other forms of ‘under-preparedness’ contribute as much, if not more than academic under-preparedness, to failures in higher education studies (that is, the “twin challenge of academic language and languages of instruction … as one of the most significant barriers to success [in higher education]” (CHE 2010, 182).
23. The main recommendation in terms of the focus of this study is to maintain the status quo for now. Most matriculants offer at least three subjects from the designated subject list (Home Language, First Additional Language, and Mathematics/Mathematical Literacy). The remainder of their subject choices is from the ‘narrow’ or extended designated subject list. Adding additional subjects to this list may flood an already over-subscribed public higher education system with more under-prepared students.

11
1. Introduction and Background
In 2011, Higher Education South Africa (HESA) requested a desk-top study to investigate the claim that a certain set of subjects offered at school level (termed ‘designated subjects’ or ‘gateway subjects’) are the best predictors for student success at higher education levels, specifically in terms of Bachelor’s degrees. The investigation was prompted by the directive of Government Gazette (Vol 751, No 31231) of 11 July 2008, namely to undertake a review of the designated subject list three years after the introduction of the new National Senior Certificate (NSC). This document indicated that the NSC designated subject list (Government Gazette 2008, 7):
… will remain in place for three years [from 2008], during which time Umalusi and the Higher Education Quality Committee of the Council on Higher Education, working together with the Department of Education and higher education institutions, will be requested to undertake an evaluation of its suitability and influence. The matter will then be reviewed in the light of the evidence.
While the Government Gazette indicated the need for a review, understanding likely student success in higher education in relation to the designated subjects would not have been possible after only three years, as the cohort that entered higher education in most cases would not have concluded their studies. So, it would have been impossible to assess the relationship between the designated subjects and success in higher education. Even in 2011, it would have been too soon to undertake such a review as many students would most likely still have been in the pipeline.
The NSC is now in its sixth year of implementation. This study will now be able to investigate the cohort that entered higher education in 2009 for the first time, exiting the system in either 2009 (for a one-year Higher Certificate), 2010 (for a two-year Higher Certificate or similar qualification), 2011 (for a three-year National Diploma or Bachelor’s Degree), and 2012 (for a four-year Bachelor’s Degree). This is, therefore, the first opportunity to look at the student cohort entering higher education in 2009, the year after the introduction of the new National Senior Certificate in 2008.
While some commentators (see, for example, Fraser and Killen 2003; Lolwana 2005) are sceptical about the direct link between designated subjects and student success in degree studies, these subjects seem to have considerable traction in the South African system.
Furthermore, in the 2011/2012 desktop study it became evident that internationally there is a strong reliance on a set of subjects used as a screening mechanism for students wishing to enter degree studies, some of which are in agreement with the South African designated subject list, for example:
Table 1: South African Designated Subject List, Compared to Other Countries
South African Designated Subjects
Other Countries (Australia, Canada, Austria, Switzerland, Germany, Brazil, India, Kenya, Nigeria)
Agricultural Sciences Nigeria
Dramatic Arts Australia, Canada, Austria, Switzerland, Germany, Brazil
Music
Visual Arts
Accounting None --- only South Africa
Business Studies None --- only South Africa
Economics Austria
Home Language All Countries (except India --- only English required), Home and Additional Languages (up to three languages)
One of the Official Languages or the Language of Instruction
All Countries (except India --- only English required), Home and Additional Languages (up to three languages)

12
South African Designated Subjects
Other Countries (Australia, Canada, Austria, Switzerland, Germany, Brazil, India, Kenya, Nigeria)
It is not clear whether the countries mentioned above use these subjects as good predictors of success, or whether their use “stems from tradition and disciplinary prominence [rather than] from any kind of empirical evidence” (Blom 2012,1). It is therefore unclear whether offering such subjects is thought to enhance performance in higher education, or not.
In the absence of such empirical evidence, the 2011/2012 Report provided some options in respect of the designated subjects list, namely (Blom 2012, 27):
A. Reduce the designated list to the original ‘narrow’ list proposed by the SAUVCA-CTP2 to mirror the core curricula evident across all the systems investigated [see Table 1], namely to include English or Home Language, an Additional Language, Mathematics, Science, and Social Studies; [or]
B. Broaden the list to include vocational subjects with higher pass requirements across the board and, consequently, a higher overall aggregate; [or]
C. Abandon the list altogether and introduce a compulsory national/regional entry examination which could be the sole determinant of entry to degree studies; [or]
D. Abandon the list altogether and introduce a compulsory national/regional entry examination combined with school aggregates.
Instead, HESA decided to commission a further study which would attempt to determine the relationship between a particular set of subjects and likely success in higher education (see Blom 2012).
2. Terms of Reference
The original terms of reference for the study required that the research focus on data in respect of those students who sat for the National Senior Certificate in 2008 only, entering the higher education system for the first time in 2009, and then followed by those who entered in 2010, 2011 and 2012. However, while data were available from the Department of Basic Education (DBE) and the Department of Higher Education and Training (DHET’s) HEMIS for all the relevant cohorts, analysis had to allow for a 3 to 4-year time frame for completion of higher education studies from first entry in 2009. This would accommodate 4-year professional degrees, and also completion rates that extended beyond a 3-year degree or diploma. This also meant that first-time entrants in 2010, 2011 and 2012 could only become the subject of study when at least four years had elapsed between first entry and expected completion. Four years was the minimum time frame required, because “the proportion of the intake … that is well-enough prepared to complete under-graduate curricula within the intended time [frame] is [rather] small --- only 27%, or roughly only one in every four” (CHE 2013, 43). Consequently, the first-time entrants to higher education of the 2009 cohort were tracked for a period of four years (2009-2012).
However, tracking only one cohort means that it is not yet possible to ascertain whether a trend is emerging, following only those students offering designated subjects for the NSC who started their higher education studies in 2009. This will only be possible if and when the same study is applied to the 2010, 2011 and 2012 first-time entrants.
2 The South African Universities Vice-Chancellors’ Association (SAUVCA) and the Committee of Technikon Principals (CTP) were the bodies representing universities and technikons, respectively, prior to the establishment of Higher Education South Africa (HESA). Their recommendation was for the following designated subjects: all Official Languages at Home or First Additional Level, and all Non-Official Languages; also Music, Geography, History, Life Sciences, Mathematical Literacy, Mathematics, and Physical Science.
3 See Terms of Reference attached as Annexure 1.
3
Engineering Graphics and Design None --- only South Africa
Geography All Countries (except India, and Kenya), require Humanities and Social Studies SubjectsHistory
Religion Studies Austria, and Germany
Life Sciences All Countries (except India, and Kenya), require Science (inclusive of Natural and Physical Science)
Mathematical Literacy None --- only South Africa
Mathematics All Countries
Physical Science All Countries (except India, and Kenya), require Science (inclusive of Natural and Physical Science)
Consumer Studies None --- only South Africa
Hospitality Studies None --- only South Africa
Information Technology None --- only South Africa
Table 1: Continued from page 11

13
Furthermore, since the 2009 cohort was not exposed to the Curriculum and Assessment Policy Statements (CAPS), introduced in 2012, the current study will not be able to make a judgement regarding possible changes in performance as a result of the CAPS. This will only be possible to judge from the performance of the 2013 cohort and onwards.
Finally, since the current study cannot compare success rates in degree studies across a number of years for the reasons noted above, it was decided to include in the analysis the performance of students who entered Higher Certificate and National Diploma studies in 2009, where such students also offered designated subjects as part of their NSC. This is reflected in Table 2 below:
Table 2: Minimum Requirements --- Certificates, Diplomas, Bachelor’s Degrees
Higher Certificate National Diploma Bachelor’s Degree30% in LoLT4 30% in LoLT 30% in LoLT
Programme Specific Subjects and/or Subject Combinations from the Recognised NSC List
Programme Specific Subjects and/or Subject Combinations from the Recognised NSC List
Designated Subjects from the Recognised NSC List (see Table 1), as well as Programme Specific Subjects for Particular Programmes, e.g. Medicine
Moderate Achievement (3) (between 40-49%) in Four 20-Credit Subjects
Adequate Achievement (4) (between 50-59%) in Four 20-Credit Subjects
Institutional Levels of Achievement Institutional Levels of Achievement Institutional Levels of Achievement
For entry into Higher Certificate and National Diploma studies, at least the Home Language, the First Additional Language, and Mathematical Literacy would have to be from the designated subject list. Therefore, it made sense to investigate all first-time entrants into public higher education. Doing so would also accommodate Universities of Technology and other universities that offer Higher Certificates and National Diplomas.
This was in keeping with the other policy intentions of the Minimum Admission Requirements for Higher Certificate, Diploma and Bachelor’s Degree Programmes Requiring a National Senior Certificate (NSC), namely to provide for (DoE 2008, 6):
… the statutory minimum or threshold norms for admission to the under-graduate Higher Certificate, Diploma and Bachelor’s Degree programmes. Such norms will apply to all public and private higher education institutions.
3. Methodology
The current study was conceptualised to consist of two distinct parts. First, the desktop investigation into other systems done for the 2011/2012 study5 was deepened by focusing on three countries only: Australia, Brazil, and Kenya. These countries were chosen for their specific characteristics: Australia includes both academic and vocational subjects in their school-leaving certificates, and such subjects contribute to eligibility for entry into post-school education; Brazil makes use of a national entry examination, the vestibular, as a minimum requirement for entry into degree studies; and Kenya was chosen for its strong roots in the Anglophone education system and the reported good reputation of its school-leaving certificate.
The Australian and Brazilian systems, therefore, display two of the recommendations made in the 2011/2012 study, namely to include vocational subjects, or to make use of a national entrance examination to determine eligibility for entry into degree studies (see Recommendations B and C noted in Section 1).
Second, disaggregated data from the DBE, in respect of NSC results for 2008, was requested. This data was sorted into Higher Certificate, National Diploma, and Bachelor’s Degree passes. The reduced dataset was then sorted to reflect passes in the designated subjects.
The full dataset was given to the DHET to track those eligible candidates that entered the higher education system. The resultant DHET dataset was sorted according to the possible under-graduate qualifications6 eligible students could register for, and the Department was requested to provide data from 2009 through 2012.
Most importantly, the underlying assumption of this study was that the subject enrolment patterns in high school in relation to the designated subject list would point to the predictive value of those subjects in terms of likely success in higher education.
4 The Language of Learning and Teaching (LoLT) of the relevant higher education institution.5 The countries were Australia, Canada, Austria, Switzerland, Germany, Brazil, India, Kenya, and Nigeria.6 See Annexure 2.

14
3.1 Analysis
An analysis was undertaken using MS Excel, as this was the format in which the datasets were provided.
The DBE data were sorted according to all subjects, not only designated subjects. Enrolment for non-designated subjects was counted and analysed. The same was done for the ‘narrow’ designated subject list and the extended designated subject list. The ‘narrow’ and extended lists were then compared across all cohorts, namely those candidates that had Higher Certificate, National Diploma, or Bachelor’s passes.
Using the HEMIS data, the achievements of students were tracked across a 4-year time frame (2009-2012). At the end of each academic year, the success or failure of students (or their disappearance from the dataset) was checked to see how many in that cohort proceeded to the next year. Then an assessment was made of the number of students who had completed their programmes in the expected time frame --- that is, for a Higher Certificate, it is expected that the student will exit the system after one or two years, for a National Diploma after three years, and for a Bachelor’s Degree after three to four years, and so on. Drop-outs were noted across all four years, but re-entries (after a year or two of absence from the system) were not analysed; this would have required tracking individual students rather than working with overall figures.
3.2 A Note about the Data
The quality of the two datasets from the DBE and the DHET’s HEMIS was taken for granted. However, it was found that there were discrepancies, first, in the numbers between the dataset provided by HESA and those provided in the official National Senior Certificate Report (DoE, 2008). The data on Higher Certificate passes received from HESA, for example, added up to 111 938 candidates, while those from the Department came to 102 130 --- a difference of 9 808 candidates. The HESA data included the supplementary examination results, whilst the DBE data reflected the figures at the time of the release of results in December 2008. It was decided that for this report the official figures should be used, but this meant that the numbers did not necessarily tally.
Second, the HEMIS datasets furthermore appeared to contain duplicate student entries. One student, for example, was registered in the same year at both the Central University of Technology (CUT) and the University of Johannesburg (UJ) and results for both sets of qualifications were shown. In the case of the Free State dataset, as much as 238 duplications were noted. Duplications could not be removed as it was not evident which entry was the correct one, or why duplicate identity numbers appeared on the data lists.
The reasons for these discrepancies were not explored as data-cleaning and verification was outside the scope of this study. While this may have skewed the findings somewhat, it was felt that the data could be used as presented, with a caveat that results are indicative rather than actual.
3.3 Limitations
There was no attempt to compare the three countries investigated with each other or with South Africa --- the systems are simply too different. Rather, the strengths and weaknesses of each system’s approach were investigated as it related to the South African case.
No other factors that may have had an impact on success in higher education were considered: for example, socio-economic factors, family background, language barriers, and so forth. The main focus was on the relationship between designated subjects offered in high school and success (or failure) in higher education. This does not mean that such factors were not important but, again, these possible factors fell outside the scope of the current study. It, nevertheless, seems important to conceive of studies which would take into consideration all the variables related to success or failure in higher education. In this regard, Scott (2007, 42-3 in CHE 2010, 6) notes that:
Students entering university do so from positions of extreme inequality, most obviously in schooling, but also in terms of financial and other resources. A lack of academic ‘preparedness’, in terms of both social class and the high school curriculum, is cited as one of the reasons why students fail … or take longer to master degree requirements.
Lastly, working only with overall figures, it was not possible to disaggregate results to the level of specific qualifications; this may have provided more nuanced findings, for example, in terms of the specific fields of learning where students are more (or less) successful. However, this can best be done through smaller, targeted studies by possibly comparing retention and completion rates for high-enrolment General Bachelor’s Degrees and Professional Degrees, such as for Engineering and Medicine.

15
4. Part 1: Desktop Review --- Australia, Brazil, and Kenya
4.1 Australia
As noted earlier in the report, Australia was chosen for in-depth investigation for three reasons. First, it is an example of an alternative system because of the practice of awarding credits for vocational subjects in relation to eligibility for higher education entry. These vocational programmes are offered by a college, a Recognised Training Organisation (RTO), or some other institution outside of the school environment but parallel to the school curriculum. Since 1998, “Vocational Education and Training (VET) in Schools” was introduced (ACACA 2012, 5). All Territories and States in Australia, except Western Australia, recognise the VET achievements of students in terms of the Australian Tertiary Admission Rank (ATAR). VET units/credits are counted in addition to general academic subjects, including English, Languages, Mathematics, Science, Social Studies, Art, Technology, and Personal Development (see Blom 2012).
The second reason for its selection is the use of ATAR, which (ACT Government 2013, 12):
… is a percentile ranking used by universities to assist in the selection of school-leavers for entry into under-graduate courses. It is used as an indication of a student’s suitability for study at university level, and to allow universities to select appropriate numbers of students for each course.
The third reason is the highly differentiated way in which States and Territories determine eligibility for higher education studies: a tertiary entrance examination, tertiary entrance score, tertiary entrance rank, tertiary entrance statement, overall position, and the Universities Admission Index (UAI) are all mechanisms to screen and select students for higher education study (see Blom 2012). However, the main mechanism is the ATAR.
Nevertheless, the Australasian Curriculum, Assessment and Certification Authorities (ACACA) make a strong case for the inclusion of VET as an option and pathway for students. It notes that (2012, 8):
Australian and State/Territory governments are committed to the on-going development and implementation of programmes and initiatives to improve the transitions of all young people through and from school and post-school settings …. research shows that those young people who do not complete 12 years of schooling experience higher rates of ‘poor transitions’ and are less likely to successfully engage with further education, training, or employment.
There are advantages to this approach. First, VET in the senior secondary phase of schooling “can act as a strong engagement catalyst for students” and also provide them with the skills and career awareness “to make more informed choices about their post-school pathways” (ACACA 2012, 9). Second, students gain an industry-recognised qualification, while also working towards the school-leaving certificate. Seven examining bodies take responsibility for the school-leaving certificate, namely the Australian Capital Territory Board of Senior Secondary Studies, the New South Wales Board of Studies, the Queensland Studies Authority, the Senior Secondary Assessment Board of South Australia, the Tasmanian Qualifications Authority, the Victorian Curriculum and Assessment Authority, and the Curriculum Council of Western Australia. These bodies all belong to the national body responsible for the certification of senior secondary education, the Australasian Curriculum, Assessment and Certification Authorities (ACACA).
While all Australian States and Territories recognise VET credits, they weigh VET credits accepted for the ATAR very differently. In the Australian Capital Territory (ACT), for example, for the ACT Year 12 Certificate, a maximum of eight standard VET units from five accredited vocational programmes with a T-classification7 may be included for the ATAR.
In New South Wales (NSW) each unit of competence in a VET course is given a credit weighting which is meant to reflect the “relative level of complexity and volume of learning” equivalent to other subject areas in the Higher School Certificate (HSC). However, two further requirements are added: the recognised VET courses must be accompanied by a mandatory work placement of an appropriate length (the only State where work placement is mandatory); and, for VET credits to count towards the ATAR, the student must sit for an optional examination in addition to the competency-based assessment for the VET course. The examination has no impact on the results of the VET qualification and is used primarily as a screening mechanism for university entry.
7 T-courses are courses approved for preparing students for higher education studies. Results can contribute to a student’s ATAR (see ACACA 2012).
16
The Northern Territory has included VET in the name of their school-leaving certificate, namely the Northern Territory Certificate of Education and Training (NTCET), with the explicit intention “to encourage more students to complete the NTCET” (ACACA 2012, 24). Unlike NSW, work placement is not mandatory. Twenty (20) credits from a VET Certificate Level 111 or above is considered equivalent to a ‘Tertiary Admissions Subject’, which can contribute to the ATAR. South Australia issues the South Australian Certificate of Education (SACE), but this State uses the same criteria for entry into higher education as the Northern Territory.
In Queensland, an additional ranking is used (that is, additional to the ATAR). Eligible students receive a Tertiary Entrance Statement which “reports the student’s Overall Position (OP) and Field Position (FP)” (ACACA 2012, 29). Work placement is strongly recommended, but not mandatory; there is no credit towards the Queensland Certificate of Education (QCE) for work placement. However, the Queensland Studies Authority makes it clear that the QCE and Tertiary Entrance Statement are “separate processes …. A student may receive the QCE and not an Overall Position (OP) and Field Position (FP), and vice versa. Non-OP eligible students may be eligible for tertiary entrance using Selection Ranks” (ACACA 2012, 31).
In Tasmania, the Tasmanian Certificate of Education (TCE) is issued. The Tasmanian Qualifications Authority works with the University of Tasmania to determine tertiary entrance requirements. Equivalent tertiary entrance ranks are developed for students who do not have a direct determination for an ATAR, by assigning “a notional score that is used to determine an equivalent entrance rank (currently capped at 65)” for VET programmes.
In Victoria, the Victorian Curriculum and Assessment Authority issues two types of school-leaving certificates: the Victorian Certificate of Education (VCE) and the Victorian Certificate of Applied Learning (VCAL). The latter has a focus on “literacy and numeracy skills, industry-specific skills, work-related skills, and personal development skills” (ACACA 2012, 43). While the VCE allows for VET units to be included, VET units are mandatory for the VCAL. Work placement is not compulsory, but it “is strongly recommended”. Fourteen (14) specific VET programmes assessed internally and through an external examination may make a direct contribution to the ATAR. Up to three (3) VET programmes may be included for the ATAR. For VET programmes that are not assessed through these means, the Victorian Tertiary Admission Centre (VTAC) determines the indirect score that may contribute to the ATAR.
Western Australia is the only State where students cannot use their VET achievements to contribute directly to their ATAR. However, the Western Australian Certificate of Education (WACE) does incorporate VET programmes, but students offering VET industry-specific WACE courses are not eligible to sit a WACE examination for tertiary entrance. “These students must rely on the remaining WACE courses within their senior secondary programme to gain an ATAR” (ACACA 2012, 53).
However, it is when high school graduates are traced into post-school education, higher education, or their work environment where the results of this approach become noticeable. The Australian Capital Territory (ACT) government undertook a survey of 2012 high school graduates to determine what their post-school pathways were. Some of their key findings were (ACT Government 2013, 1):
• Ninety-three [93] per cent of 2012 year-12 graduates were employed and/or studying.• Sixty [60] per cent of 2012 year-12 graduates were studying in 2013, with 51 per cent studying full-time and nine [9] per
cent studying part-time.• Sixty-seven [67] per cent of the 2012 year-12 graduates studying in 2013 reported that they were studying at a Bachelor’s
Degree level or higher.• Six [6] per cent of graduates were undertaking an apprenticeship in 2013, and three [3] per cent were doing a traineeship.• Sixteen [16] per cent of graduates studying in 2013 were studying at Certificate III level [Australian Qualifications
Framework Level for Vocational Programmes].• Of the graduates who were studying full-time, 65 per cent were employed, with the majority employed part-time.
Unfortunately, this kind of survey is not available for the whole of Australia, but it seems the participation in VET programmes (up to 74% of students participated in a VET programme, up from 16% in 1997) has not adversely affected the eligibility and preparedness of students for higher education studies in the ACT. At the same time, it provides for meaningful alternatives to degree studies, with many students following the vocational route. The high employment rate and post-school education participation rate is also noticeable.
Nevertheless, while most States and Territories now recognise some VET courses for the ATAR, there are two caveats: first, generally VET subjects seem to be placed in a lower hierarchical position in relation to the traditional subjects required for entry into degree studies; and second, students who opt for VET subjects in school are still most often the lower achievers and the early school-leavers. In this regard, introducing VET as a part of the school curriculum has achieved what the initiative set out to do, namely to provide “alternatives and opportunities for people who might otherwise not remain at school to complete Year 12” (ACER 2008, 4):

17
VET in schools is successfully providing a pathway either into a recognised form of post-secondary vocational education and training, including apprenticeships and traineeships, or into work without further training.
Returning to the original focus of this study, namely the relationship between a certain set of subjects and likely success in degree studies, the Australian Council for Educational Research (ACER 2005, 1) notes that “students who study advanced mathematics and physical sciences are more likely to continue study[ing] after they complete school”. At the same time, however, since the 1990s participation in traditional ‘designated subjects’, such as the Humanities, Biology, Physics, Chemistry, Economics, and Accounting, has shifted to greater participation in Business and Secretarial Studies, the Creative and Performing Arts, and Computer Studies (see ACER 2005).
However, it is not individual subjects that seem to relate to the desire to proceed to university, but a combination of subjects. The three subject combinations taken at Years 11 and 12, which lead to university entrance, include Advanced Mathematics-Physical Sciences; a Mixed Subject Choice, including Mathematics and Physical Sciences; and the Humanities and Social Sciences. More than half of the students offering these combinations have proceeded to university (see ACER 2005).
Australian university entrants, therefore, offer groups of related subjects, which include (ACER 2005, 5):
… [Eight] 8 Key Learning areas: English, mathematics, studies of society and [the] environment (including humanitiesand business studies), science (including physical and biological sciences), [the] arts, languages other than English,technology (including computer studies, technical studies, home science, and agriculture), and health and physicaleducation.
When we compare these subjects with the South African designated subject list, we see a high level of agreement with thegroups of subjects currently required for entry into South African universities:
Table 3: The South African Designated Subject List and the Australian Key Learning Areas
South African Designated Subjects
Australian Key Learning Areas
Agricultural Sciences Agriculture
Dramatic Arts Arts
Music Arts
Visual Arts Arts
Accounting
Business Studies Business Studies
Economics
Home Language English
One of the Official Languages or the Language of Instruction
Language other than English
Engineering Graphics and Design
Geography Studies of Society and [the] Environment, including [the] Humanities
History Studies of Society and [the] Environment, including [the] Humanities
Religion Studies
Life Sciences Science, including Physical and Biological Sciences
Mathematical Literacy
Mathematics Mathematics
Physical Science Science, including Physical and Biological Sciences
Consumer Studies Home Science
Hospitality Studies
Information Technology
South African Designated Subjects
Australian Key Learning Areas

18
4.2 Brazil
As in Australia, Brazil’s education system is federal, with a high degree of autonomy at the State and municipal level, both for schools and higher education institutions. The post-school system consists of a mix of Federal, State, municipal and private universities, as well as a range of non-university post-school institutions (including public and private ‘multiple faculty’, ‘single faculty’, and ‘centres for technology education’ institutions), each of which uses its own entrance tests for higher education studies (see World Bank 2002).
The main reason for the inclusion of a discussion of the Brazilian system in this desktop study is the widespread use of the long-standing vestibular as a screening tool for entry into higher education studies. In addition to the school-leaving certificate (the Certificado de Ensino Médio), which is either set and administered by the individual school or the State government, the vestibular takes the form of a set of examinations taken after school which cover the typical ‘designated’ subjects, namely Portuguese, Brazilian Literature, foreign languages such as English, Spanish or French, History, Geography, Mathematics, Physics, Chemistry, Biology, and Art (Drama, Visual Arts, and Music). These tests are seen to be quite rigorous but tend to “assess mastery of a set curriculum, rather than academic potential” (World Bank 2002, 15).
However, while the vestibular is the oldest screening mechanism (until the 1990s), it has been severely criticised. In particular, it has been blamed for the difficulty that poor students in Brazil experience in gaining admission to higher education (see World Bank 2002).
The main criticism of the vestibular centres around three biases (World Bank 2002, 15):
First, and most importantly, many students enrol in expensive, private preparation courses that are designed specifically to increase scores on the vestibular exams. Fees for these courses vary according to quality, and can easily top two or three minimum wage-income equivalents. The students who can afford these quality preparation courses are usually the ones who have already had the advantage of high-quality, private secondary education.
This means that wealthy students are often those who gain the places in free universities, while poor students “are more likely to be in the private system, where they must pay tuition” (World Bank 2002, x).
Second, as noted above, the tests do not assess potential or ability to succeed in higher education, but tests a curriculum for which the preparation often takes up to a year to complete, almost like an additional school year focusing on “teaching to the test” (World Bank 2002, 15):
Not only is this biased against those with poorer secondary instruction, but it also allows for more students to succeed through short-term preparation rather than on the basis of their innate skills or academic accomplishments. When judgement is based on academic performance all throughout secondary school, it gives a better indication of overall preparedness to succeed in university.
Third, the geographic location of poorer students counts against them (World Bank 2002, 15):
… the tests tend to be located in metropolitan centres which may be hard … [for] the rural poor to reach. The simple logistics and the expense involved in travelling to the exam site and paying lodging and subsistence for the [preparation period, and the] multi-day exams can be beyond the means of poor families.
Against this background, the Brazilian government has introduced alternatives to the vestibular (Guimarães de Castro 2012, 3):
From 1998 onwards, a national university entrance examination was gradually introduced across the country. The federal assessment institute, Instituto Nacional de Estudos e Pesquisas Educacionais Anísion Teixeira (INEP), was put in charge of its governance, design and implementation. The Exame Nacional do Ensino Médio (ENEM) was created with the dual purpose of selecting students into tertiary education and certifying the completion of secondary school.
This is not unlike the annual National Senior Certificate (NSC) examination in South Africa, except that it is not compulsory to sit for the examination and universities are not obliged to use the results of the tests (NARIC 2011, 6):

19
[The ENEM] … does not give the individual student a qualification, but each student does get a performance result. The examinations are not compulsory and the individual State decides whether a student should sit them. The examinations can be taken when the student is in the third and final year of ensino médio or just after completion.
While a large number of private universities quickly adopted it, public universities “only really started using [the] ENEM from 2009 onwards” (Guimarães de Castro 2012, 3). It is still, however, more often than not used as a complementary mechanism rather than the primary selection tool. For example, in 2012 the Universidade de Brasília still made use primarily of the vestibular for entry into higher education (see http://alunoestrangeiro.unb.br):
The college entrance examination (vestibular) is the most traditional form of enrolment into the University of Brasilia. It is an exam that evaluates the knowledge acquired in three years of high school.
Nevertheless, some universities (including the University of Brasilia) have been experimenting with yet another tool, the Programa de Avaliação Seriada (PAS). Examinations are undertaken once a year during the 9th, 10th and 11th (the final school year) of ensino médio: “… the total gained over three years is used to give a score for university entrance” (NARIC 2011, 7). It is thought that these tests may replace the vestibular over time.
However, these are relatively new innovations and attempts to change the vestibular system have been fiercely resisted by those who might have a vested interest in its continuation. The Brazilian government has tried to counter that by declaring the vestibular no longer mandatory for admission into higher education, but access to degree studies still seems to be the preserve of the wealthier sections of society: in 2002, “66 per cent of all students came from the top income quintile, and about 33 per cent of all students came from the bottom income quintile” (World Bank 2002, 10).
Unlike in Australia, VET does not seem to feature at all in terms of eligibility for entry into degree studies: “… vocational education is independent from academic education. However, the two systems are designed to complement each other” (NARIC 2011, 7). VET is, nevertheless, considered to be a strong system, and “there are viable alternatives to high school, as well as vocational options within the high school from the second year” (Umalusi 2013, 21). But this situation is also criticised: it is felt that all the entrance or contributing examinations (PAS, ENEM, and the vestibular) consolidate the high school system “into one academic track, and [that it removes or downgrades] the options for technical tracks”. This is confirmed by the fact that entry into any higher education courses8 is gained through the examination of ‘designated subjects’. Furthermore, in most cases, under-graduate programmes consist of two parts (NARIC 2011, 11):
During the first year, students undertake a basic cycle in humanities or sciences. This is followed by the second cycle, which is in the area of specialised or professional study consisting of a core programme and related electives.
When we compare these subjects with the South African ‘designated’ subject list, the following emerges (see Table 4):
Table 4: The South African Designated Subject List and the Brazilian Higher Education Entrance Curriculum
South African Designated Subjects
Brazilian Higher Education Entrance Curriculum
Agricultural Sciences
Dramatic Arts
Music
Visual Arts Drama, Visual Arts, and Music
Accounting
Business Studies
Economics
Home Language Portuguese, Brazilian Literature
One of the Official Languages or the Language of Instruction
English, Spanish or French
Engineering Graphics and Design
Geography Geography
8 The Bacharel (Bachelor’s) is the most popular degree and the time frame is normally 4 to 6 years; the Licenciado/Licenciatura is of a similar nature, but it is not considered to be as academically strong --- 4 to 5 years in duration; and the Título Profissional, which has a usual time frame of 5 years.
South African Designated Subjects
Brazillian Higher Education Entrance Curriculum

20
University entrance for all types of qualifications offered at higher education level (the Bacharel, the Licenciado, and the Titulo Profissional) is, therefore, accessed through a ‘narrow’9 designated list.
4.3 Kenya
Kenya was included in this review because of its strong relationship with the British system, and because it is also an African country like South Africa. Furthermore, the Kenya Certificate of Secondary Education (KCSE) is considered a highly reputable qualification. The British model is still largely followed by the private schooling system that uses A-levels and O-levels (see Umalusi 2013). However, in general, Kenya has moved away somewhat from the British system, now employing an 8+4+4 formula (8 years Primary School, 4 years High School, and 4 years University).
The Kenya National Examinations Council (KNEC) was established on 1 August 1980 under an Act of Parliament, following the collapse of the East African Examinations Council, and is now responsible for all examinations at the different levels of school education. A notable characteristic of the Kenyan system is that formal examinations are conducted at intervals of four years: at the end of ‘Class Four’, at the end of Junior Secondary School (Form Two), and at the end of High School (Form Four) when students sit for the KCSE. The examinations for the KCSE are national, not unlike the South African NSC(see http://www.knec.ac.ke/main/index).
Another notable characteristic is the sifting of non-performing students at an early stage --- that is, before they reach high school (Umalusi 2013, 21):
… there is significant filtering of students out of the system at the end of primary school, with high stakes examinations determining the type of post-primary [education] one can enter. The KCSE is, therefore, primarily geared towards university entrance and does not perform the generalist role that the NSC has to [fulfil].
In 2005, for example, there were more than 600 000 primary level graduates, but only 350 000 proceeded to secondary schools “with the rest (about 300 000) either join[ing] the youth polytechnics or the informal sector, with the majority left without opportunities for further education[al] advancement” (KMEST 2005, 213).
This attrition rate resulted in a skewed cohort that proceeds to university (KMEST 2005, 213):
At the end of the secondary education cycle, about 20 000 [students] join universities while the rest, estimated at 200 000, are catered for by the middle-level colleges. The existing capacity and capability in the middle-level colleges (both private and public) and youth polytechnics are inadequate to absorb the remaining KCPE [Kenya Certificate of Primary Education] and KCSE graduates estimated at 300 000 and 200 000, respectively.
A third notable characteristic is that entry into higher education studies is based on an average of the 7 or 8 best subject performances achieved in the KCSE, subject to the qualifying requirements of the course for which the student is applying to register. These subjects are divided into five clusters. The first cluster is compulsory and consists of English, Kiswahili, and Mathematics. Two subjects must be chosen from the second cluster, including Biology, Physics, and Chemistry; one subject
9 The Brazilian set of subjects closely resembles the original SAUVCA-designated subject list (see Blom 2012).
History History
Religion Studies
Life Sciences
Mathematical Literacy
Mathematics Mathematics
Physical Science Physics, Chemistry, Biology
Consumer Studies
Hospitality Studies
Information Technology
South African Designated Subjects
Brazillian Higher Education Entrance Curriculum
Table 4: Continued from page 21

21
must be chosen from cluster three, consisting of History, Geography, or Religion Studies; and at least one additional subject must be chosen from any cluster, including cluster four which consists of vocational subjects and cluster five which includes French, Music, German, Business Studies, and Arabic (see NARIC 2011).
Bachelor’s degree entry is achieved when the student passes the KCSE with an average of C+. However, due to limited space the requirement at public universities can be pushed up to B and B-, in which case students with a C or C+ will only be eligible for diploma studies (see Umalusi 2013).
Nevertheless, university education in Kenya has grown phenomenally over the last few decades. From one university at independence (1963), the system now has 7 public universities and 23 private universities due to the increasing demand for higher education (see http://kenyapage.net/varsity.html).
However, despite the funnelling of students in the Kenyan system, the subjects offered for the KCSE overlap significantly with the South African designated subject list (see Table 5).
Table 5: The South African Designated Subject List and the Kenyan University Entrance Subjects
South African Designated Subjects Kenyan KCSE University Entrance SubjectsAgricultural Sciences Agriculture
Dramatic Arts
Music Music
Visual Arts Art and Design
Accounting
Business Studies Business Studies
Economics
Home Language Kiswahili, and English
One of the Official Languages or the Language of Instruction
French, German, Arabic
Engineering Graphics and Design Drawing and Design
Geography Geography
History History
Religion Studies Religion Studies
Life Sciences Biology
Mathematical Literacy
Mathematics Mathematics
Physical Science Physics, Chemistry
Consumer Studies Home Science
Hospitality Studies
Information Technology
In addition, a number of vocational subjects can also be offered, including Power Mechanics, Electricity, Woodwork, Aviation Technology, Metalwork, Computer Studies, and Building Construction.
4.4 Some Comments
The three countries (Australia, Brazil, and Kenya) represent three models of screening for higher education: one where the overall ranking of an individual student is the determining factor, one where performance in an entrance examination is the main criterion, and one where early sifting is the main characteristic, resulting in retaining only the best students for entry into higher education.

22
In Australia, the inclusion of vocational programmes has an explicit purpose, namely to encourage more students to remain at school. This is supported by a diverse and strong post-school system and post-school participation is high. The ATAR is the most important screening mechanism regardless of the subjects offered. Certain subjects, nevertheless, make it more likely that students will enter higher education and that success rates will be high: “… the expected completion rate is estimated to be around 81 per cent”, with high prestige courses (for example, Medicine, and Law) having “the highest levels of expected completions, at around 97 per cent” (ACER 2008, 3). More importantly, the Australian Council for Educational Research (ACER) has found that (2008: 4):
… higher [overall] tertiary entrance scores were associated with higher levels of course completions.
Brazil is a system in transition: it still relies on the heavily criticised traditional vestibular, but is experimenting with new and fairer ways in which to determine who will enter into higher education. These include the introduction of a national university entrance examination and, more recently, a series of examinations taken in the last three years of high school, with the overall average grade achieved for these examinations being the determinant. However, there is no doubt that entry into higher education is squarely associated with a set of ‘designated’ subjects.
Nevertheless, Brazil’s higher education attainment rate has been improving, but according to the Organisation for Economic Co-operation and Development (OECD), “Brazil’s tertiary educational attainment rate for 25-64-year olds remains below the average of 32% for OECD countries and 26% for G20 [countries]” (OECD 2013, 1).
Despite experiencing phenomenal growth rates in higher education in Kenya, higher education participation rates still remain rather low (KMEST 2005, 230):
… challenges to access and equity remain. These include: inadequate capacity to cater for the growing demand for more places; [a] mismatch between skills acquired by university graduates and the demands for industry; an imbalance between the number of students studying science and arts-based courses; rigid admission criteria that exclude the possibilities for credit transfers amongst universities and for graduates from other post-secondary institutions; and gender and regional disparities in regard to admissions, and courses and subjects taken.
This is reflected in the practice to raise the bar from a minimum of a C+ average across the best 7 or 8 subjects to a B or B- average when spaces are limited in higher education institutions. Unless viable and high status alternatives to university education are established, this practice is not likely to find traction in South Africa.

23
5. Part 2.1: Analysis --- National Senior Certificate (NSC) DataIn keeping with the adjusted terms of reference, namely to investigate all passes that allow entry into higher education, the discussion that follows will start with the analysis of students with Higher Certificate passes, followed by those with National Diploma and Bachelor’s Degree passes.
5.1 Higher Certificate Passes
In 2008, 533 561 candidates sat for the National Senior Certificate examination; of these, 334 239 candidates passed, of which 102 130 (19%) passed with a Higher Certificate pass (see DoE 2008). The requirements for entry into a Higher Certificate are as follows:
Table 6: Requirements for a Higher Certificate Pass
Higher Certificate30% in Language of Learning and Teaching
Programme Specific Subjects and/or Subject Combinations from the Recognised NSC List
Institutional Levels of Achievement
In general, for non-designated subjects, the enrolment numbers vary between low and very low, with the notable exception of Tourism, Afrikaans Second Additional Language, and Computer Applications Technology, with 12 799, 7 470 and 6 175 candidates, respectively. Life-Orientation has been excluded as it is compulsory for all candidates (see Figure 1).
Figure 1: Non-Designated Subjects --- Higher Certificate Candidates
Key
AM – Agricultural Management ME – Maritime Economics NT – Nautical Science
AT – Agricultural Technology FL – Foreign Languages, e.g. Chinese CA – Computer Applications Tech
ES – Equine Studies SAL – Second Additional Languages T – Tourism
DS – Dance Studies CT – Civil Technology
D – Design ET – Electrical Technology
PM – Practical Music MT – Mechanical Technology
The low enrolment rates in certain subjects may suggest that these subjects should be dropped from the recognised NSC list. However, these low numbers may simply suggest that not many schools have the resources to offer these subjects, or did not offer them in 2008. The high enrolment rates in others, on the other hand, may suggest that these should be included in the designated subject list (Second Additional Language, Computer Applications Technology, and Tourism --- in keeping with adding vocational subjects, as in the Australian system).
213 37 0 29 112 0 8 1
7 616
1 262 1 224 1 1470
6 175
12 799
0
2000
4000
6000
8000
10000
12000
14000
AM AT ES DS D PM ME FL SAL CT ET MT NT CA T
Numbers of Candidates Offering Non-Designated Subjects (n=102 130)

24
In relation to the ‘narrow’ designated list proposed by the South African Universities Vice-Chancellors’ Association (SAUVCA) and the Committee of Technikon Principals (CTP) prior to the establishment of HESA, Higher Certificate candidates offered the following subjects (see Figure 2):
Figure 2: The ‘Narrow’ Designated Subjects --- Higher Certificate Candidates
KeyOL – Official Languages (Home Languages)
Afrikaans, English, isiNdebele, isiXhosa, isiZulu, Sepedi, Sesotho, Setswana, siSwati, Tshivenda, Xitsonga
FAL – First Additional Language Afrikaans, English, isiNdebele, isiXhosa, isiZulu, Sepedi, Sesotho, Setswana, siSwati, Tshivenda, Xitsonga
NOL – Non-Official Languages German, Gujarati, Hindi, Portuguese, Tamil, Telegu, Urdu
GEO – Geography
HIS – History
LS – Life Sciences
ML – Mathematical Literacy
MA – Mathematics
PS – Physical Sciences
M - Music
Languages (OL, FAL, NOL) were counted together; and these numbers were higher than the official 102 130 candidates, presumably because some candidates offered two home languages, or two first additional languages. Almost all candidates offered English as their FAL (101 965 out of 102 130). The second highest FAL was Afrikaans with 9 043, followed by isiZulu with 899.
More than half of the candidates offered Mathematical Literacy (58 793 or 58%), followed by Life Sciences (57 624 or 56%), and Mathematics (52 835 or 52%). Many candidates also offered Geography and Physical Sciences, counting 46 424 (45%) and 36 061 (35%), respectively. A noticeable trend emerging from this cohort was that large numbers of candidates offered subjects from the ‘narrow’ designated subject list.
When we look at the extended designated subject list, Business Studies (41 314 or 40% of candidates), Economics (35 479 or 35%), and Accounting (35 324 or 35%) had high enrolment numbers, followed by Agricultural Science (19 771 or 19%),
112 100 112 112
2
46 424
21 174
57 624 58 79352 835
36 061
1230
20000
40000
60000
80000
100000
120000
OL FAL NOL GEO HIS LS ML MA PS M
Number of Candidates Offering the 'Narrow' Designated Subjects --- Higher Certificate Passes

25
Consumer Studies (5 676), and Engineering Graphics and Design (3 160). The enrolment for other subjects on the extended list was relatively low, which again begs the question whether they should be on the designated subject list at all (see Figure 3):
Figure 3: The Extended Designated Subject List --- Higher Certificate Candidates
KeyAgriSc – Agricultural Science
DrArts – Dramatic Arts
VisArts – Visual Arts
EngG&D – Engineering Graphics and Design
Religion – Religion Studies
MAProb – Mathematics: Probability10
Consumer – Consumer Studies
Hospitality – Hospitality Studies
Acc – Accounting
BS – Business Studies
Eco – Economics
IT – Information Technology
5.2 National Diploma Passes
Of the 334 239 candidates who passed the National Senior Certificate, 124 395 (23%) obtained a National Diploma pass (see DoE 2008), 22 265 more than for the Higher Certificate passes. This was the largest cohort of the three: there were 102 130 Higher Certificate passes, 124 395 National Diploma passes, and 107 462 Bachelor’s Degree passes.
The requirements for a National Diploma pass are as follows (see Table 7):
Table 7: Requirements for a National Diploma Pass
National Diploma30% in LoLT
Programme Specific Subjects and/or Subject Combinations from the Recognised NSC List
Moderate Achievement (3) (between 40-49%) in Four 20-Credit Subjects
Institutional Levels of Achievement
10 Mathematics Probability is a non-designated subject, but is included in the extended list due to the assumption that good performance in Mathematics can be related to success in higher education.
19 771
455 4363 160
274 1 262
5 676
1 499
35 324
41 314
35 479
4970
50001000015000200002500030000350004000045000
Subjects Included in the Extended Designated Subject List

26
For the non-designated subjects in terms of National Diploma passes, the following emerged (see Figure 4):
Figure 4: Non-Designated Subjects --- National Diploma Candidates
KeyAM – Agricultural Management ME – Maritime Economics NT – Nautical Science
AT – Agricultural Technology FL – Foreign Languages, e.g. Chinese CA – Computer Applications Tech
ES – Equine Studies SAL – Second Additional Languages T – Tourism
DS – Dance Studies CT – Civil Technology
D – Design ET – Electrical Technology
PM – Practical Music MT – Mechanical Technology
As in the case of the Higher Certificate candidates, many subjects had very low enrolments. Again, Tourism (22 784 or 18%), and Computer Applications Technology (17 491 or 14%) had high enrolments, followed by Second Additional Languages (7 516), and Civil Technology (3 746). Consideration should perhaps be given to assigning designated subject status to Second Additional Languages; in other systems, up to three languages offered at school are considered important for entry into higher education.
426 266 0 144 7659 17 4
7 516
3 7462 382 2 848
7
17 491
22 784
0
5000
10000
15000
20000
25000
AM AT ES DS D PM ME FL SAL CT ET MT NT CA T
Non-Designated Subjects Offered by National Diploma Candidates (n=124 395)

27
In terms of the ‘narrow’ designated list, National Diploma candidates offered the following subjects (see Figure 5):
Figure 5: The ‘Narrow’ Designated Subjects --- National Diploma Passes
KeyOL – Official Languages (Home Languages)
Afrikaans, English, isiNdebele, isiXhosa, isiZulu, Sepedi, Sesotho, Setswana, siSwati, Tshivenda, Xitsonga
FAL – First Additional Language Afrikaans, English, isiNdebele, isiXhosa, isiZulu, Sepedi, Sesotho, Setswana, siSwati, Tshivenda, Xitsonga
NOL – Non-Official Languages German, Gujarati, Hindi, Portuguese, Tamil, Telegu, Urdu
GEO – Geography
HIS – History
LS – Life Sciences
ML – Mathematical Literacy
MA – Mathematics
PS – Physical Sciences
M – Music
The Home Language (OL) and the First Additional Language (FAL) aside, the highest enrolment was for Mathematical Literacy (69 832 or 56%), Life Sciences (59 302 or 48%), and Mathematics (56 308 or 45%), followed by Geography (46 633 or 37%), Physical Sciences (41 483 or 33%), and History (19 617, only 16%).
Again, as for the Higher Certificate, English First Additional Language were offered by more than two-thirds of candidates (97 521 or 78%), followed by Afrikaans as an FAL (24 954 or 20%).
126 835 126 150
3
46 633
19 617
59 30269 832
56 308
41 483
2460
20000
40000
60000
80000
100000
120000
140000
OL FAL NOL GEO HIS LS ML MA PS M
Number of Candidates Offering the 'Narrow' Designated Subjects --- National Diploma Passes

28
For National Diploma candidates, the following emerged in terms of the extended designated subject list (see Figure 6):
Figure 6: The Extended Designated Subject List --- National Diploma Candidates
KeyAgriSc – Agricultural Science
DrArts – Dramatic Arts
VisArts – Visual Arts
EngG&D – Engineering Graphics and Design
Religion – Religion Studies
MAProb – Mathematics: Probability11
Consumer – Consumer Studies
Hospitality – Hospitality Studies
Acc – Accounting
BS – Business Studies
Eco – Economics
IT – Information Technology
Again, as for the Higher Certificate, the highest enrolments in terms of the extended designated subject list for National Diploma candidates were for Business Studies (47 981 or 39%), Accounting (36 632 or 29%), and Economics (32 087 or 26%), followed by Agricultural Science (12 394 or 10%), Consumer Studies (8 716), and Engineering Graphics and Design (7 630).
5.3 Bachelor’s Degree Passes
In 2008, of the 334 239 candidates who passed the National Senior Certificate, 107 462 achieved Bachelor’s Degree passes (20.19% of the whole cohort); this was up from the 16% of Bachelor’s Degree passes in 2007, when 85 000 passed.
The Department of Education proudly announced that (DoE 2008, 24):
… it must also be noted [that] the NSC is a more demanding examination in that candidates are required to offer seven subjects with mathematics or mathematical literacy being one of the compulsory subjects, which was not the case in previous examinations where mathematics was optional.
11 Mathematics Probability is a non-designated subject, but is included in the extended list due to the assumption that good performance in Mathematics can be related to success in higher education.
12 394
1 297 1 416
7 630
367 2 061
8 7164 839
36 632
47 981
32 087
1 183
Subjects Included in the Extended Designated Subject List ---National Diploma Candidates
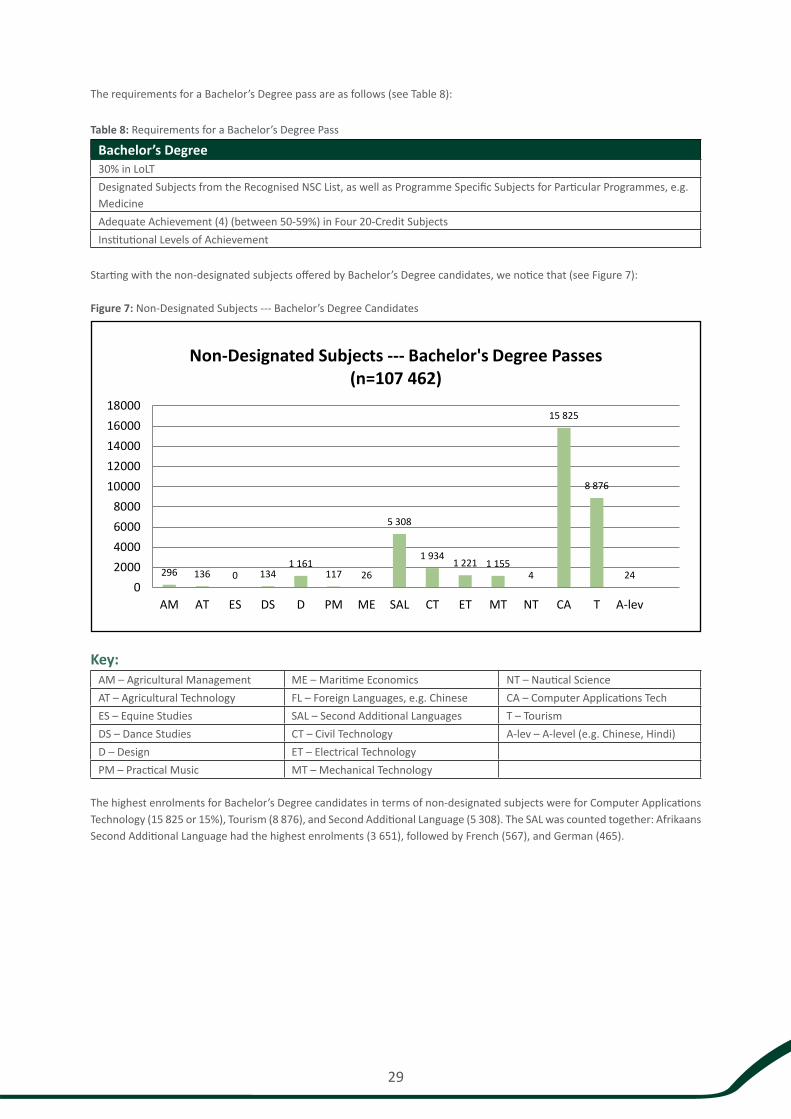
29
The requirements for a Bachelor’s Degree pass are as follows (see Table 8):
Table 8: Requirements for a Bachelor’s Degree Pass
Bachelor’s Degree30% in LoLT
Designated Subjects from the Recognised NSC List, as well as Programme Specific Subjects for Particular Programmes, e.g. Medicine
Adequate Achievement (4) (between 50-59%) in Four 20-Credit Subjects
Institutional Levels of Achievement
Starting with the non-designated subjects offered by Bachelor’s Degree candidates, we notice that (see Figure 7):
Figure 7: Non-Designated Subjects --- Bachelor’s Degree Candidates
Key:AM – Agricultural Management ME – Maritime Economics NT – Nautical Science
AT – Agricultural Technology FL – Foreign Languages, e.g. Chinese CA – Computer Applications Tech
ES – Equine Studies SAL – Second Additional Languages T – Tourism
DS – Dance Studies CT – Civil Technology A-lev – A-level (e.g. Chinese, Hindi)
D – Design ET – Electrical Technology
PM – Practical Music MT – Mechanical Technology
The highest enrolments for Bachelor’s Degree candidates in terms of non-designated subjects were for Computer Applications Technology (15 825 or 15%), Tourism (8 876), and Second Additional Language (5 308). The SAL was counted together: Afrikaans Second Additional Language had the highest enrolments (3 651), followed by French (567), and German (465).
296 136 0 1341 161
117 26
5 308
1 9341 221 1 155
4
15 825
8 876
240
2000
4000
6000
8000
10000
12000
14000
16000
18000
AM AT ES DS D PM ME SAL CT ET MT NT CA T A-lev
Non-Designated Subjects --- Bachelor's Degree Passes (n=107 462)

30
Looking at the SAUVCA ‘narrow’ list, the following emerges (see Figure 8):
Figure 8: The ‘Narrow’ Designated Subject List --- Bachelor’s Degree Candidates
Key:
OL – Official Languages (Home Languages)
Afrikaans, English, isiNdebele, isiXhosa, isiZulu, Sepedi, Sesotho, Setswana, siSwati; Tshivenda, Xitsonga
FAL – First Additional Language Afrikaans, English, isiNdebele, isiXhosa, isiZulu, Sepedi, Sesotho, Setswana, siSwati, Tshivenda, Xitsonga
NOL – Non-Official Languages German, Gujarati, Hindi, Portuguese, Tamil, Telegu, Urdu
GEO – Geography
HIS – History
LS – Life Sciences
ML – Mathematical Literacy
MA – Mathematics
PS – Physical Sciences
M – Music
Leaving the OL and FAL aside as they are compulsory subjects, we see that Mathematics has the highest number of enrolments (67 955 or 63%), followed by Life Sciences (59 254 or 55%), Physical Sciences (46 923 or 44%), Mathematical Literacy (40 617 or 38%), Geography (33 282 or 31%), and History (12 986, only 12%). The most popular FAL was English (64 991 or 60%), followed by Afrikaans (36 271 or 34%). Almost two-thirds of Bachelor’s Degree candidates offered Mathematics (67 955 out of a total of 107 462), and more than half offered Life Sciences (59 254 out of a total of 107 462).
111 379106 132
52
33 282
12 986
59 254
40 617
67 955
46 923
7500
20000
40000
60000
80000
100000
120000
OL FAL NOL GEO HIS LS ML MA PS M
The 'Narrow' List --- Bachelor's Degree Passes

31
The extended designated subjects offered by Bachelor’s Degree candidates were as follows (see Figure 9):
Figure 9: The Extended Designated Subject List --- Bachelor’s Degree Candidates
Key:AgriSc – Agricultural Science
DrArts – Dramatic Arts
VisArts – Visual Arts
EngG&D – Engineering Graphics and Design
Religion – Religion Studies
MAProb – Mathematics: Probability12
Consumer – Consumer Studies
Hospitality – Hospitality Studies
Acc – Accounting
BS – Business Studies
Eco – Economics
IT – Information Technology
As for Higher Certificate and National Diploma candidates, the highest enrolment in terms of the extended designated
subject list were for Accounting (39 894 or 37%), Business Studies (39 388 or 37%), Economics (21 322 or 20%),
followed by Mathematics: Probability (8 755), Engineering Graphics and Design (8 020), and Consumer Studies (7 527).
However, in order to determine whether there is a relationship between designated subjects and likely success in higher
education, all three cohorts have to be compared. Non-designated subjects are, therefore, excluded for the moment. Since
the Home Language (OL) and First Additional Language (FAL) are compulsory subjects, and the Non-Official Languages (NOL)
numbers are so small, they are also excluded. The following figures are a comparative representation of the ‘narrow’ list and
the extended list across all three cohorts (see Figures 10 and 12):
12 Mathematics Probability is a non-designated subject, but is included in the extended list due to the assumption that good performance in Mathematics can be related to success in higher education.
5 5482 680 3 869
8 020
235
8 755 7 527
2 465
39 894 39 388
21 322
4 530
05000
1000015000200002500030000350004000045000
The Extended Designated Subject List --- Bachelor's Degree Passes

32
Figure 10: The ‘Narrow’ Designated Subject List as Offered by Higher Certificate, National Diploma and Bachelor’s Degree Candidates
Key:HC Higher Certificate Passes GEO Geography
Dip National Diploma Passes HIS History
Bach Bachelor’s Degree Passes LS Life Sciences
ML Mathematical Literacy
MA Mathematics
PS Physical Science
M Music
Almost an equal number of Higher Certificate and National Diploma candidates offered Geography, while fewer Bachelor’s
Degree candidates offered the same subject (46 424 or 45% and 46 633 or 37% of those cohorts, respectively, versus 33 282 or
31% of Bachelor’s Degree candidates). This pattern was repeated for History: 21 174 (21%) of the Higher Certificate cohort and
19 617 (16%) of the National Diploma candidates offered the subject, while 12 986 (12%) of Bachelor’s Degree candidates sat
for this examination. Life Sciences were offered in almost equal numbers by all three cohorts (57 624 or 56%, 59 302 or 48%, and
59 254 or 55%, respectively). However, many more National Diploma and Higher Certificate candidates offered Mathematical
Literacy (69 832 or 56% and 58 793 or 58%, respectively) as opposed to 40 617 (or 38%) for Bachelor’s Degree candidates.
Mathematics, on the other hand, was offered by many more Bachelor’s Degree (67 955 or 63%) than National Diploma and
Higher Certificate candidates (56 308 or 45% and 52 835 or 52%, respectively). This same pattern emerged for Physical Science:
46 923 (or 44%) Bachelor’s Degree candidates offered the subject, while 41 483 (33%) National Diploma and 36 061 (35%)
Higher Certificate candidates offered it. Music had such a low enrolment that the figures for this subject were excluded.
46 424
21 174
57 62458 793
52 835
36 061
123
46 633
19 617
59 302
69 832
56 308
41 483
246
33 282
12 986
59 254
40 617
67 955
46 923
750
0
10000
20000
30000
40000
50000
60000
70000
80000
GEO HIS LS ML MA PS M
The 'Narrow' List Compared across Cohorts (n=334 239)
HC
Dip
Bach

33
When we express these figures in percentages of candidates in relation to the ‘narrow’ list, we notice the following (see Figure 11):
Figure 11: Percentage of Candidates Offering the ‘Narrow’ List across All Cohorts
Key:GEO Geography
HIS History
LS Life Sciences
ML Mathematical Literacy
MA Mathematics
PS Physical Science
Apart from the preference for the social sciences (Geography and History) by Higher Certificate and National Diploma candidates, the only two subjects that stand out in relation to Bachelor’s Degree passes are Mathematics and Physical Science.
Nevertheless, while the greatest percentage of Bachelor’s Degree candidates offered these two subjects, the numbers in respect of the other two cohorts were also high. Looking at these subjects alone is, therefore, not yet enough to suggest a relationship between a specific set of subjects and likely success in higher education.
An almost equal percentage of Higher Certificate and Bachelor’s Degree candidates offered Life Sciences, while a significant percentage of National Diploma candidates also offered the subject.
It is clear, though, that Higher Certificate and National Diploma candidates are more likely to offer Mathematical Literacy than Bachelor’s Degree candidates.
45
21
56 58
52
3537
16
48
56
45
3331
12
55
38
63
44
0
10
20
30
40
50
60
70
GEO HIS LS ML MA PS
Percentage (%) of Candidates Offering the 'Narrow' List across All Cohorts (n=334 239)
HC
Dip
Bach

34
When we undertake the same comparison for the extended designated subject list, the following emerges (see Figure 12). The subjects with low or very low enrolments will not be discussed, e.g. Dramatic Arts, Visual Arts, and Religion.
Figure 12: The Extended Designated Subject List as Offered by Higher Certificate, National Diploma and Bachelor’s Degree Candidates
Key:HC Higher Certificate Passes AgriSc Agricultural Science
Dip National Diploma Passes DrArts Dramatic Arts
Bach Bachelor’s Degree Passes VisArts Visual Arts
EngG&D Engineering Graphics and Design
Religion Religion Studies
MAProb Mathematics: Probability
Consumer Consumer Studies
Hospitality Hospitality Studies
Acc Accounting
BS Business Studies
Eco Economics
IT Information Technology
Across all three cohorts, large numbers of candidates offered Accounting, Business Studies, and Economics. Almost an equal number of candidates from the Higher Certificate and National Diploma cohorts offered Accounting (35 324 or 34% and 36 632 or 29%, respectively), while slightly more Bachelor’s Degree candidates offered the subject (39 894 or 37%). There were 47 981 (or 39%) National Diploma candidates offering Business Studies, the highest number compared to Higher Certificate candidates (41 314 or 40%) and Bachelor’s Degree candidates (39 388 or 37%). Many more Higher Certificate candidates (35 479 or 35%) offered Economics than was the case with National Diploma (32 087 or 26%) and Bachelor’s Degree candidates (21 322 or 20%). Compared to the other two cohorts, more Higher Certificate candidates offered Agricultural Science (19 771 or 19%) than National Diploma (12 394 or 10%) and Bachelor’s Degree candidates (5 548, only 5%). Very few Higher Certificate (1 262 or 1%) and National Diploma candidates (2 061 or 2%) offered Mathematics: Probability, while 8 755 (8%) of Bachelor’s Degree candidates offered the subject. Almost an equal number of National Diploma and Bachelor’s Degree candidates offered Engineering Graphics and Design (7 630 or 6% and 8 020 or 7% of their cohorts, respectively) with 3 160 (or 3%) of Higher Certificate candidates offering the same subject. Consumer Studies and Hospitality Studies both had low enrolments. Only 5 676 (or 6% of the cohort) of Higher Certificate candidates offered Consumer Studies, with slightly more National Diploma
12 394
1 2971 416
7 630
367
2 061 8 7164 839
36 632
47 981
32 087
1 183
0
10000
20000
30000
40000
50000
60000
The Extended Designated Subject List across All Cohorts(n=334 239)
HC
Dip
Bach

35
candidates (8 716 or 7%) and 7 527 (or 7%) of Bachelor’s Degree candidates offering the subject. For Hospitality Studies, the enrolments were even lower across the board: 1 499 (1%) of Higher Certificate, 4 839 (4%) of National Diploma, and 2 465 (2%) of Bachelor’s Degree candidates offered the subject.
Again, when we look at these numbers in percentages, the following emerges (the subjects with very low enrolments were excluded, for example, Dramatic Arts, Visual Arts, and Religion):
Figure 13: Percentage of Candidates Offering the Extended Designated Subject List across All Cohorts
Key:AgriSc Agricultural Science
EngG&D Engineering Graphics and Design
MAProb Mathematics: Probability13
Consumer Consumer Studies
Hospitality Hospitality Studies
Acc Accounting
BS Business Studies
Eco Economics
IT Information Technology
The extended subject list includes subjects that are more ‘vocational’ in nature, except for Mathematics: Probability. Other than Accounting, greater percentages of Higher Certificate than National Diploma and Bachelor’s Degree candidates offered Business Studies and Economics. Nevertheless, across all three cohorts Business Studies was offered by significant numbers. Bachelor’s Degree candidates were slightly more likely to include Accounting in their package than Higher Certificate and National Diploma candidates. On the other hand, Higher Certificate candidates were more likely to offer Economics than National Diploma and Bachelor’s Degree candidates. Higher Certificate candidates were also more likely to offer Agricultural Science than National Diploma and Bachelor’s Degree candidates.
These results suggest that Accounting, Business Studies, and Economics are entrenched as designated subjects. Subjects such as Engineering Graphics and Design, Consumer Studies, and Hospitality Studies have surprisingly low enrolments. Again, this could simply be because teaching resources in respect of these subjects are not as readily available. This situation may have changed in subsequent years, but any change will only be possible to determine when the next cohort is investigated.
19
31
6
1
34
40
35
0
10
6
2
74
29
39
26
0
57 8 7
2
37 37
20
1
0
5
10
15
20
25
30
35
40
45
Percentage of Candidates Offering the Extended List across All Cohorts (n=334 239)
HC
Dip
Bach
13 Mathematics Probability is a non-designated subject, but is included in the extended list due to the assumption that good performance in Mathematics can be related to success in higher education.

36
The information below (see Table 9) indicates enrolment figures per subject across all cohorts in descending order (excluding Home Language, First Additional Language, and Life-Orientation):
Table 9: Enrolment per Designated Subject across All Cohorts in Descending Order
Name of Subject Number of Enrolments
Narrow List
Extended List %, All Cohorts
Mathematics 177 098 Yes - 53%
Life Sciences 176 180 Yes - 53%
Mathematical Literacy 169 242 Yes - 51%
Business Studies 128 683 - Yes 39%
Geography 126 339 Yes - 38%
Physical Science 124 467 Yes - 37%
Accounting 111 850 - Yes 33%
Economics 88 888 - Yes 27%
History 53 777 Yes - 16%
Agricultural Science 37 713 - Yes 11%
Consumer Studies 21 919 - Yes 7%
Engineering Graphics and Design 18 810 - Yes 6%
Mathematics: Probability 12 078 - Yes 4%
Hospitality Studies 8 803 - Yes 3%
Information Technology 6 210 - Yes 2%
Visual Arts 5 721 - Yes 2%
Dramatic Arts 4 432 - Yes 1%
Music 1 119 Yes - < 1%
Religion 876 - Yes < 1%
Graphically, this data looks as follows:
Figure 14: Designated Subject Enrolments in Descending Order
8761 119
4 4325 7216 210
8 80312 078
18 81021 919
37 71353 777
88 888111 850
124 467126 339
128 683169 242
176 180177 098
0 20000 40000 60000 80000 100000 120000 140000 160000 180000 200000
Religion
DrArts
IT
MAProb
CS
HIS
ACC
GEO
ML
MA
Number of Enrolments per Subject in Descending Order

37
With the exception of Business Studies, Economics, Accounting, and Agricultural Science, the highest enrolments across all
cohorts are all from the ‘narrow’ designated subject list. Music, which is on the ‘narrow’ list, has very few enrolments (1 119).
Therefore, it follows that if there is a relationship between offering a particular set of subjects at school and likely success in
higher education, it means that those students who sat for subjects from the ‘narrow’ list are more likely to complete their
higher education studies successfully.
5.4 Some Comments
When looking at these results, three possible scenarios emerge:
(1) In keeping with the Australian model, include more subjects (also vocational subjects) in the designated subject list. Apart
from Accounting, Business Studies, Economics, Hospitality, and Engineering Graphics and Design as vocational subjects that
are already on the extended list, add Second Additional Languages, Computer Applications Technology, and Tourism as these
subjects have high enrolment figures across all three cohorts.
(2) Reduce the designated subject list to reflect the same subjects as those for entry into higher education in Brazil, namely
academic subjects. These subjects have the highest enrolment figures across all cohorts (in descending order): Languages,
Mathematics, Life Sciences, Mathematical Literacy, Geography, Physical Science, and History (excluding Business Studies,
Accounting, and Economics).
(3) Keep the current designated subject list, but raise the requirements for entry into higher education as is the case in the
Kenyan system.
A decision in respect of any of these options will be informed by an analysis of HEMIS data.

38
6. Part 2.2: Analysis --- Department of Higher Education and Training (HEMIS) Data
In terms of eligibility to enter into higher education, extracting this information from the DBE dataset was straightforward, as the results of each individual indicated whether he/she would be able to seek a place at a higher education institution according to the requirements indicated in the gazetted policy.14 However, each autonomous higher education institution has the right to set additional requirements per programme, either in terms of minimum achievement in particular subjects, or in terms of subject combinations.
Furthermore, the nomenclature of higher education institutions in respect of their programmes15 does not neatly match the three types of qualifications indicated in the policy, namely the Higher Certificate, the National Diploma, and the Bachelor’s Degree. It was, therefore, necessary to make some assumptions in terms of their duration (in years) and how long it would be reasonable to expect a student to complete his/her qualification, except in cases where the number of years were explicitly stated. Even then, it was not always possible to determine whether a student passed, failed or dropped out at the end of a particular academic year. While (02) General Academic First Bachelor’s Degree could easily be assumed to be three years in length, the (11) Under-Graduate Diploma or Certificate (1 or 2 years), for example, were lumped together. To overcome this problem, each qualification was counted and analysed separately to be combined later in relation to the three categories, if necessary.
Nevertheless, according to the Department of Education’s figures (2008, 24), 333 987 candidates were eligible for entry into one of the three qualification types indicated in the policy (252 of the total number achieved an NSC without endorsement for any of the qualifications in higher education). Of this number, 72 729 appeared on the public higher education database in 2009 in their first year of study, some of whom were likely to have been repeaters from 2008 or earlier, if the trend from 2009 onwards was anything to go by. The count per qualification in 2009 was as follows (see Table 10):
Table 10: Count per HEMIS Qualification Category
HEMIS Code Qualification Category Number of Enrolments
01 Under-Graduate Diploma or Certificate (3 years) 478
02 General Academic First Bachelor’s Degree 27 846
03 Professional First Bachelor’s Degree (4 years) 16 244
11 Under-Graduate Diploma or Certificate ( 1 or 2 years) 566
21 National Certificate 0
22 National Higher Certificate 0
23 National Diploma 24 475
25 National Higher Diploma 0
33 Professional First Bachelor’s Degree (3 years) 2 867
41 Higher Certificate 0
43 Diploma 0
45 Bachelor’s Degree (360) 0
46 Bachelor’s Degree (480) 0
Total 72 729
The most popular qualification was the General Academic First Bachelor’s Degree (3 years) with 27 846 enrolments, followed by the National Diploma with 24 475 and the Professional First Bachelor’s Degree (4 years) with 16 244 entries each. The Professional First Bachelor’s Degree (3 years) was the least popular of the Bachelor’s degrees with only 2 867 entries. The other qualifications with very low enrolments were the Under-Graduate Diploma or Certificate (1 or 2 years) with 566 enrolments, followed by the Under-Graduate Diploma or Certificate (3 years).
Excluding the unused categories, only six types remain. Each of these will be treated separately.
14 Minimum Admission Requirements for Higher Certificate, Diploma and Bachelor’s Degree Programmes Requiring a National Senior Certificate (NSC).15 See Annexure 2 for the list of qualifications used for analysis.
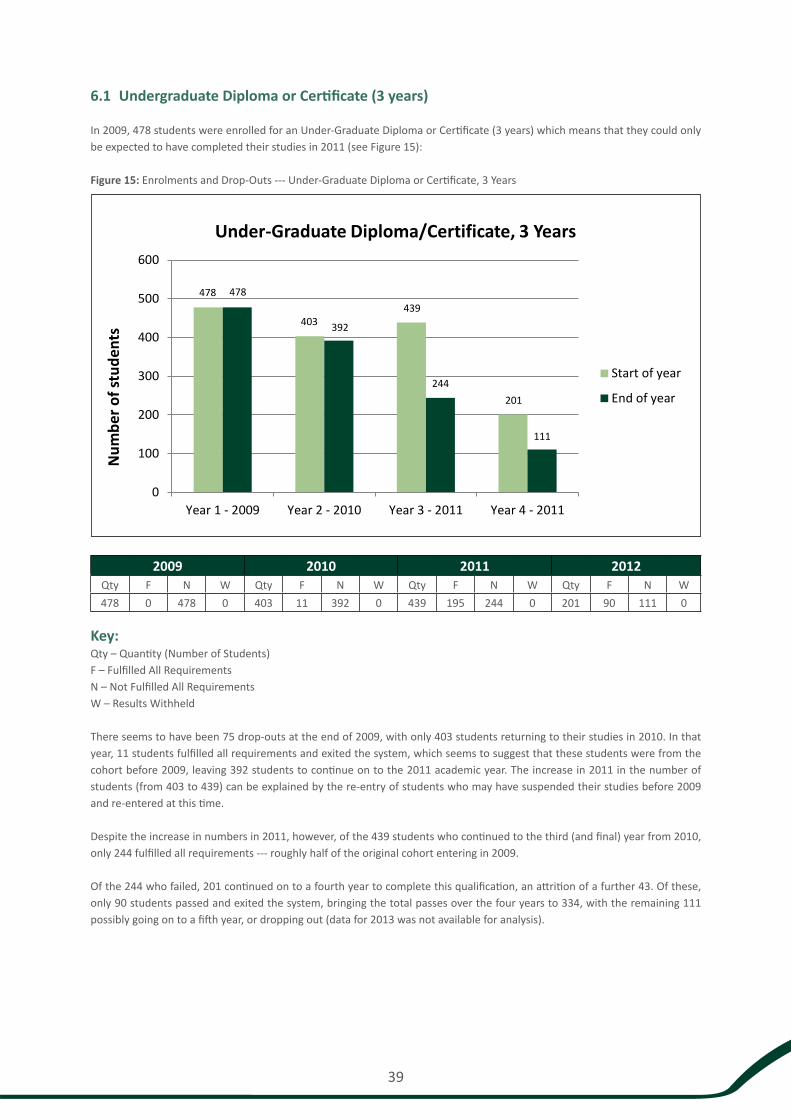
39
6.1 Undergraduate Diploma or Certificate (3 years)
In 2009, 478 students were enrolled for an Under-Graduate Diploma or Certificate (3 years) which means that they could only be expected to have completed their studies in 2011 (see Figure 15):
Figure 15: Enrolments and Drop-Outs --- Under-Graduate Diploma or Certificate, 3 Years
2009 2010 2011 2012Qty F N W Qty F N W Qty F N W Qty F N W
478 0 478 0 403 11 392 0 439 195 244 0 201 90 111 0
Key:Qty – Quantity (Number of Students)F – Fulfilled All RequirementsN – Not Fulfilled All RequirementsW – Results Withheld
There seems to have been 75 drop-outs at the end of 2009, with only 403 students returning to their studies in 2010. In that year, 11 students fulfilled all requirements and exited the system, which seems to suggest that these students were from the cohort before 2009, leaving 392 students to continue on to the 2011 academic year. The increase in 2011 in the number of students (from 403 to 439) can be explained by the re-entry of students who may have suspended their studies before 2009 and re-entered at this time.
Despite the increase in numbers in 2011, however, of the 439 students who continued to the third (and final) year from 2010, only 244 fulfilled all requirements --- roughly half of the original cohort entering in 2009.
Of the 244 who failed, 201 continued on to a fourth year to complete this qualification, an attrition of a further 43. Of these, only 90 students passed and exited the system, bringing the total passes over the four years to 334, with the remaining 111 possibly going on to a fifth year, or dropping out (data for 2013 was not available for analysis).
478
403439
201
478
392
244
111
0
100
200
300
400
500
600
Year 1 - 2009 Year 2 - 2010 Year 3 - 2011 Year 4 - 2011
Num
ber
of s
tude
nts
Under-Graduate Diploma/Certificate, 3 Years
Start of year
End of year

40
6.2 General Academic First Bachelor’s Degree
As noted above, the General Academic First Bachelor’s Degree (3 years) was the most popular, with 27 846 enrolments. These
students can, therefore, also be expected to have completed their degrees by the end of 2011:
Figure 16: Enrolments and Drop-Outs --- General Academic First Bachelor’s Degree, 3 years
2009 2010 2011 2012Qty F N W Qty F N W Qty F N W Qty F N W
27 846 0 27 846 0 22 529 0 22 529 0 21 519 6 046 15 469 4 14 477 5 848 8 622 7
Key:Qty – Quantity (Number of Students)
F – Fulfilled All Requirements
N – Not Fulfilled All Requirements
W – Results Withheld
In 2009, 27 846 students entered study for the General Academic First Bachelor’s Degree. While this whole cohort continued
through to the end of the year, 5 317 students did not return for the second year in 2010. Another 1 010 students did not return
for the third (and final) year. Only 6 046 (22%) of students fulfilled all requirements for qualification at the end of the third year,
with 15 469 students continuing on to a fourth year for this three-year course. Of these, another 922 students dropped out
during the course of the fourth year, leaving 14 477 students still in the system. Another 5 848 (a further 21%) completed their
qualifications successfully by the end of the fourth year, with 8 622 (31%) of students not yet successful by this time. A total
of 11 894 students successfully completed their degree by the end of 2012 --- less than half of the original cohort of 27 846.
27 846
22 52921 519
14 47727 846
22 529
15 469
8 622
0
5000
10000
15000
20000
25000
30000
Year 1 Year 2 Year 3 Year 4
Num
ber
of s
tude
nts
General Academic First Bachelor's Degree
Start of the year
End of the year

41
This attrition rate is quite substantial. Starting with 27 846 students in 2009, 13 369 (virtually half) dropped out between 2009 and 2012. The highest attrition was after the first year, while the attrition rate was lowest between the second and third year, with only 1 010 students dropping out during this time:
Figure 17: Attrition Rate, 2009-2012 --- General Academic First Bachelor’s Degree
6.3 Professional First Bachelor’s Degree (4 years)
The Professional First Bachelor’s Degree was not as popular as the previous qualification, but enrolment figures were still substantial at 16 244 students. Since HEMIS data from the DHET only covered the four years between 2009 and 2012, it will not be possible to see how many students have proceeded beyond the minimum of four years (see Figure 18):
Figure 18: Enrolments and Drop-Outs --- Professional First Bachelor’s Degree, 4 Years
2009 2010 2011 2012Qty F N W Qty F N W Qty F N W Qty F N W
16 244 0 16 244 0 14 275 0 14 275 0 13 855 32 13 823 0 13 777 5 067 8 709 1
Key:Qty – Quantity (Number of Students)F – Fulfilled All RequirementsN – Not Fulfilled All RequirementsW – Results Withheld
27 846
22 52921 519
14 477
0
5000
10000
15000
20000
25000
30000
Year 1 Year 2 Year 3 Year 4
Num
ber
of s
tude
nts
Attrition Rate --- General Academic First Bachelor's Degree, 2009-2012
Figures at the startof the year
16 244
14 275 13 855 13 777
16 24414 275
13 823
8 709
0
2000
4000
6000
8000
10000
12000
14000
16000
18000
Year 1 Year 2 Year 3 Year 4
Num
ber
of s
tude
nts
Professional First Bachelor's Degree, 4 Years
Start of the year
End of the year

42
In 2009, 16 244 students entered study for the Professional First Bachelor’s Degree (4 years). While the whole cohort completed the
first year in 2009, in 2010 only 14 275 students returned for the second year, with 1 969 students dropping out. Again, in the third year,
only 13 855 students returned, with another 420 students dropping out; a similar pattern as for the previous qualification above, with
larger attrition rates between the first and second years, and smaller rates between the second and third years. This pattern continued
into the fourth year; a small number of students dropped out after the third year (only 46). However, of those continuing on to the
fourth year, only 5 067 students passed (31% of the cohort), with the remainder (8 709) most likely continuing on to a fifth year. This
qualification reflects the highest completion rates during the minimum time frame (4 years).
Overall, 2 467 students dropped out between 2009 and 2012 --- 15% of the original entrants.
The attrition rates were as follows (see Figure 19):
Figure 19: Attrition Rate, 2009-2012 --- Professional First Bachelor’s Degree, 4 Years
6.4 Under-Graduate Diploma or Certificate (1 or 2 years)
The Under-Graduate Diploma or Certificate (1 or 2 years) had surprisingly few enrolments in 2009, as this type of qualification
is often the first access point into higher education for students who are under-prepared. Nevertheless, 566 students enrolled
for the programmes categorised as a 1 or 2-year Diploma or Certificate. However, even though the numbers were small, the
trend was similar to those for the other qualifications (see Figure 20):
16 244
14 275
13 855
13 777
12500
13000
13500
14000
14500
15000
15500
16000
16500
Year 1 Year 2 Year 3 Year 4
Stud
ent n
umbe
rs
Attrition Rates --- Professional First Bachelor's Degree, 4 years
Start of year figures

43
Figure 20: Enrolments and Drop-Outs --- Under-Graduate Diploma or Certificate, 1 to 2 Years
2009 2010 2011 2012
Qty F N W Qty F N W Qty F N W Qty F N W
566 10 556 0 452 58 394 0 202 53 149 0 0 0 0 0
Key:Qty – Quantity (Number of Students)
F – Fulfilled All Requirements
N – Not Fulfilled All Requirements
W – Results Withheld
In 2009, 566 students entered the Under-Graduate Diploma or Certificate (1 to 2 years). It was, therefore, expected that these
students would have successfully completed their qualification by the end of 2010. However, only 58 students completed their
qualification in the expected time frame (10% of the cohort).
Again, we see attrition at the end of the first year, with 452 students proceeding to the second year, and 202 students proceeding
to a third year --- of which only 53 students successfully completed the qualification. Out of the original 566, only 111 students
completed their qualification (only 19,6% of the cohort). No students continued into a fourth year.
6.5 National Diploma
National Diploma was the qualification with the second highest enrolment rates, with 24 475 students entering the course in
2009. In terms of the DBE data, candidates with Diploma passes surpassed the number of those who could enter for the Higher
Certificate and the Bachelor’s Degree. Diploma candidates numbered 124 395, 22 265 more than for the Higher Certificate and
16 933 more than for the Bachelor’s Degree.
566
452
202
0
566
394
149
00
100
200
300
400
500
600
Year 1 - 2009 Year 2 - 2010 Year 3 - 2011 Year 4 - 2012
Num
ber
of s
tudn
ets
Under-Graduate Diploma or Certificate, 1 or 2 Years
Start of the year
End of the year

44
Nevertheless, the same pattern as for the General Academic First Bachelor’s Degree emerged (see Figure 21):
Figure 21: Enrolments and Drop-Outs --- National Diploma, 3 Years
2009 2010 2011 2012Qty F N W Qty F N W Qty F N W Qty F N W
24 475 0 24 475 0 19 064 0 19 064 0 17 900 3 659 14 241 0 12 837 4 075 8 762 0
Key:Qty – Quantity (Number of Students)
F – Fulfilled All Requirements
N – Not Fulfilled All Requirements
W – Results Withheld
In 2009, 24 475 students enrolled for National Diploma studies. This cohort remained stable throughout the first academic
year, but 5 411 students dropped out at the end of that year. Another 1 164 dropped out after the second year. In the third
(and final) year, only 3 659 students fulfilled all requirements and were able to exit the system (only 15% of the original cohort),
leaving 14 241 students to proceed to a fourth year. Of those, another 1 404 students dropped out, and of the remaining
12 837 only 4 075 were successful (17% of the original cohort), with another 8 762 possibly proceeding into a fifth year.
The attrition rate, therefore, follows the same pattern as for the other qualifications (see Figure 22):
24 475
19 06417 900
12 837
24 475
19 064
14 241
8 762
0
5000
10000
15000
20000
25000
30000
Year 1 - 2009 Year 2 - 2010 Year 3 - 2011 Year 4 - 2012
Num
ber
of s
tude
nts
National Diploma, 3 Years
Start of year
End of year

45
Figure 22: Attrition Rate, 2009-2012 --- National Diploma, 3 Years
6.6 Professional First Bachelor’s Degree (3 Years)
The final qualification to be investigated is the Professional First Bachelor’s Degree (3 years). Enrolment numbers were also low, though not as low as for the Under-Graduate Diploma or Certificate (3 years, and 1 to 2 years).
Figure 23: Enrolments and Drop-Outs --- Professional First Bachelor’s Degree, 3 Years
2009 2010 2011 2012Qty F N W Qty F N W Qty F N W Qty F N W
2 867 0 2 867 0 2 638 0 2 638 0 2 694 670 2 026 0 1 742 458 1 284 0
Key:Qty – Quantity (Number of Students)F – Fulfilled All RequirementsN – Not Fulfilled All RequirementsW – Results Withheld
24 475
19 06417 900
12 837
0
5000
10000
15000
20000
25000
30000
Year 1 - 2009 Year 2 - 2010 Year 3 - 2011 Year 4 - 2012
Num
ber o
f stu
dent
sAttrition Rate --- National Diploma, 3 Years
Start of yearfigures
2 8672 638 2 694
1 742
2 8672 638
2 026
1 284
0
500
1000
1500
2000
2500
3000
3500
Year 1 - 2009 Year 2 - 2010 Year 3 - 2011 Year 4 - 2012
Num
ber o
f stu
dent
s
Professional First Bachelor's Degree, 3 Years
Start of year
End of year

46
The drop-out rate in terms of this qualification followed the same pattern as for the General Academic Bachelor’s Degree, the
4-year Professional Bachelor’s Degree and the National Diploma, with 229 students dropping out after the first year (8% of the
initial cohort). The increase in numbers in the third year could be explained by returning students. However, as in the case of
the other qualifications, successful completion was also low: only 670 students completed the degree in 3 years (about 23%
of the original cohort). Almost the same number of students who dropped out after the first year, dropped out at the end of
the third year, with 1 742 proceeding to a fourth year where, eventually, only 458 were successful (16% of the original cohort).
6.7 Completion Rates across the System
For the next part of the analysis, only the three qualifications with high or very high enrolments will be used, namely the General Academic First Bachelor’s Degree (27 846), the Professional First Bachelor’s Degree (4 years; with 16 244 entries), and the National Diploma (24 475 students).
First, let us look at the attrition rates across all three these qualifications:
Figure 24: Attrition Rates across All Three Qualifications, 2009-2012
For the General Academic First Bachelor’s Degree and National Diploma, the attrition rates were almost identical. After the
first year of study for this qualification, about 19% of the initial cohort exited the course. This was less pronounced in the
Professional First Bachelor’s Degree, with 12% of students exiting after the first year.
Between the second and third year attrition rates were lower, but for the two 3-year qualification courses it increased again
sharply after the third year, with an additional 25% of the original cohort for the General Academic First Bachelor’s Degree
and another 17% of the National Diploma cohort exiting the system. The Professional First Bachelor’s Degree showed very low
attrition rates between the third and the fourth year. Nevertheless, since the data for 2013 was unavailable, attrition rates for
the Professional First Bachelor’s Degree after the fourth year was not known.
Since most students who entered higher education study had offered some, if not most of the subjects on the ‘narrow’ and
extended list of designated subjects (see Section 5 above), the foregoing does not suggest that offering these subjects are
enhancing the retention rates in terms of the General Academic First Bachelor’s Degree and National Diploma, except perhaps
in very specific courses where Mathematics and Science are important building blocks.
27 846
22 52921 519
14 47716 244
14 275 13 85513 777
24 475
19 06417 900
12 837
0
5000
10000
15000
20000
25000
30000
Year 1 Year 2 Year 3 Year 4
Num
ber
of s
tude
nts
Three Attrition Rates Compared
Genl Aca
Prof
Dip

47
22
15
21
31
17
0
5
10
15
20
25
30
35
Genl Aca Prof Dip
Perc
enta
ge
Completion Rates (in Percentages)
Year 3
Year 4
When we express the successful completion of qualifications in percentages, then the following emerges:
Figure 25: Completion Rates across All Three Qualifications, 2011 and 2012
We see that of the 27 846 students registered for General Academic First Bachelor’s Degree, only 22% completed their 3-year qualification within the normal time frame. Another 21% completed the degree in the fourth year. The 2013 data will tell us whether the 8 622 students who still have not met the requirements for the degree in 2012 had left the system, or have made another attempt to complete their studies in a fifth year.
Only 15% of the National Diploma cohort finished their studies within the allotted time frame, with another 17% finishing in the fourth year.
The Professional First Bachelor’s Degree had the highest completion rate within the 4-year programme, with 31% completing at their first attempt at the end of the fourth year.
Again, given that most students in higher education had offered subjects either on the ‘narrow’ or extended designated subject list, there does not seem to be a strong correlation between offering those subjects and the successful completion of higher education studies.
7. Conclusion and Recommendations
This study was initiated to test the assumption that a particular set of subjects offered at school level enhances the cognitive development and, therefore, the likely success of prospective candidates in higher education study. It was thought that there would be a clear relationship between these subjects and success in higher education, particularly success in a Bachelor’s degree. This assumption turned out to be contestable for the following reasons:
1. All candidates across the three cohorts (Higher Certificate, National Diploma, and Bachelor’s Degree passes) offered at least three designated subjects, namely Home Language, First Additional Language, and Mathematics or Mathematical Literacy. In addition, almost all students also offered subjects which are either on the ‘narrow’ or extended list of subjects. The only two subjects that stood out in relation to Bachelor’s Degree passes were Mathematics and Physical Sciences. Enrolment in terms of non-designated subjects was low or very low (with the exception of Computer Applications Technology and Tourism). Thus, success in higher education seems much more likely to be associated with better results at school level in all subjects, rather than with certain (particular) subjects offered.
2. Higher marks in the NSC examination seem to have contributed to better completion rates, but not by much. The completion rate of National Diploma candidates within the minimum time frame is only 15%, while Bachelor’s Degree candidates fared slightly better with a 21% completion rate within three years. Even for the Professional Bachelor’s Degree (4 years),
Prof

48
which presumably include Engineering and Medicine (or other high status) programmes, only 31% of students were able to complete their studies within the minimum time frame. These findings paint a pretty bleak picture of higher education performance across the board. However, this is by no means only a South African problem (Davidson 2013, 85):
For the United States to maintain national and global economic stability, colleges must graduate more students. Four-year completion rates have declined and less than one-third of full-time, degree-seeking students graduate in 4 years …. Policy and practice should consider the impact of pre-college factors … to most efficiently increase degree completion rates.
3. It is, therefore, more likely that other forms of ‘under-preparedness’ of candidates contribute to the very poor performance evident in this study. The CHE (2010, 45) study suggests that “… factors leading to success or failure in academic study include (i) student under-preparedness, (ii) curriculum relevance or responsiveness, and (iii) integrated institutional environments”. Specific ‘student-related’ factors include the following (CHE 2010, 30):
… students [are not] academically ‘strong enough’; issues of students’ prior learning and language skills; students’ approach to learning, and their attitudes and expectations; a diminished learning culture, or students taking less responsibility for their learning; and issues of the students’ life and other pressures, such as personal, social, financial, or family matters.
Therefore, while academic under-preparedness is undoubtedly important, and needs to be addressed, there is no compelling evidence at this stage that points to a direct relationship between designated subjects and success in higher education. The reliance on a certain set of subjects ‘to filter out’ students may even be reconsidered (or done away with). There are many other factors that impact on success in higher education that need to be considered together with poor school preparation, for example (Umalusi 2013, 2 & 28):
Research on student success at university suggests that achievement in the LoLT is a good indicator of success in higher education programmes …. One of the central problems is the language competence of … students. While students are required [for degree purposes] to achieve at least 50% in four designated subjects, … [they] only have to achieve 30% in the language of learning and teaching.
The CHE (2010, 182) agrees and maintains that “… the twin challenge of academic language and language of instruction (English) remains one of the most significant barriers to success and one which universities must address in a systematic and sustained manner”.
There is, therefore, still much more work to be done before a decision can be made.
4. In terms of the focus of this study, namely to review the use of designated subjects as a screening mechanism, particularly in relation to the Bachelor’s Degree, the main recommendation is to maintain the status quo for now.
However, this does not mean that other (future) possibilities should not be considered:
• The NSC has a generalist role, fulfilling two distinct purposes: first, certifying students as having achieved a school-leaving certificate; and second, endorsing (some) students for entry into higher education. At the moment, the focus is on the latter; but as our system improves, the former could become more important, especially when more and more diverse, post-school options become available. Then, as in the Australian system, it will make sense to add vocational programmes to the curriculum which will encourage young people to stay at school and work towards a school-leaving certificate that prepares them for work, or for further study. However, careful consideration should be given as to which subjects should be added. First, such subjects should be of an equivalent cognitive level than academic subjects; and second, extending the list further may flood the already over-subscribed higher education system (Umalusi 2013, 16):
It is the numbers endorsed that explain some of the crisis the higher education system went through in [2009,] when almost 30 000 more young people qualified for university entrance than was predicted based on the patterns of the previous four years.

49
• Linked to the above, as more post-school opportunities open up, screening for higher education studies should become more stringent (CHE 2010, 181):
It is impossible to improve throughput in under-graduate education without greater selectivity being applied in the decisions about which students to admit to higher education in the first place. This does not mean crude exclusionary policies, but it does mean greater precision in choosing those more likely to succeed in higher education, and may include rigorous preparation at pre-university colleges.
5. The most striking, if not explicit, finding of this study is that both aspiring students and the university sector as a whole
experienced huge pressure in 2009. How much the huge influx of a large number of additional under-prepared students has contributed to poor student performance was not part of this discussion, but it seems to have greatly exacerbated the problem.
6. A final recommendation relates to further studies:
Working with large datasets and overall figures is indicative, but this results in rather crude findings. It is, therefore, recommended that the next study carefully samples a representative part of the student population, focusing on high enrolment qualifications for analysis. Furthermore, as shown in this report, the choice of subjects and the relatively poor preparation in respect of those subjects is only one of a myriad of factors that impact performance in higher education study. A smaller sample will enable such a study to delve into some other factors that may need targeted interventions.
Further, smaller, separate studies in respect of the lower end of higher education access, namely Higher Certificate entries, need more in-depth investigation. If the system is serious about access to higher education, the weakest of the cohort needs serious attention.

50
References
• Australian Council for Assessment and Curriculum Authorities (ACACA). 2012. ACACA Report: VET in Senior Certificates of Education. Sydney: NSW Board of Studies.
• ACT (Australian Capital Territory) Government. 2013. 2012 ACT Year-12 Graduates: Where Are They Now? A Summary of a Survey of Graduates from Public and Non-Government Schools Awarded an ACT Year-12 Certificate in 2012. Canberra: ACT Government, Education and Training.
• ACER (Australian Council for Educational Research). 2005. “Year-12 Subjects and Further Study”. LSAY Briefing Reports (LSAY Briefing, no 11) --- see http://research.acer.edu.au/lsay_briefs/11.
• ACER (Australian Council for Educational Research). 2008. “University Study in Australia: Persistence, Completion and Beyond”. LSAY Briefing Reports (LSAY Briefing, No 16) --- http://research.acer.edu.au/lsay_briefs/16.
• Blom, R. 2012. The Gateway to Higher Education Studies: The Rationale for Designated Subjects (Unpublished discussion paper developed for Higher Education South Africa).
• CHEPS (Center for Higher Education Policy Studies). 2007. Higher Education in Australia. Enschede: Universiteit Twente.
• CHE (Council on Higher Education). 2010. Higher Education Monitor --- Access and Throughput in South African Higher Education: Three Case Studies. Pretoria: CHE.
• CHE (Council on Higher Education). 2013. A Proposal for Under-Graduate Curriculum Reform in South Africa: The Case for a Flexible Curriculum Structure (Report of the Task Team on Under-Graduate Curriculum Structure: Discussion Document, August). Pretoria: CHE.
• Davidson, J C. 2013. “Leading Indicators: Increasing State-Wide Bachelor’s Degree Completion Rates at 4-Year Public Institutions”. Higher Education Policy 27, 2014: 85-109 (available online on 9 July 2013).
• DoE (Department of Education). 2008. Minimum Admission Requirements for Higher Certificate, Diploma and Bachelor’s Degree Programmes Requiring a National Senior Certificate (NSC). Pretoria: Department of Education.
• DoE (Department of Education). 2008. National Senior Certificate, 2008: Technical Report on the National Examination Results. Pretoria: Department of Education.
• Fraser, W and R Killen. 2003. “Factors Influencing Academic Success or Failure of First-Year and Senior University Students: Do Education Students and Lecturers Perceive Things Differently?” South African Journal of Education 23 (4): 254-260.
• Government Gazette. 2008. Volume 751, Number 31231, 11 July. Pretoria: Government Printer.
• Guimarães de Castro, M H. 2012. Developing the Enabling Context for Student Assessment in Brazil. Washington, DC: International Bank for Reconstruction and Development/World Bank.
• KMEST (Kenyan Ministry of Education, Science and Technology). 2005. Kenya Education Sector Support Programme, 2005-2010: Delivering Quality Equitable Education and Training to All Kenyans. Nairobi: Ministry of Education, Science and Technology.
• Lolwana, P. 2005. Matric: What Is to be Done? (Seminar papers and presentations). Pretoria: Umalusi.
• NARIC (National Academic Recognition Information Centre). 2011. London, United Kingdom. Accessed in November 2011 --- http://ecctis.co.uk/naric/.
• OECD (Organisation for Economic Co-operation and Development). 2013. Australia Country Note: Education at a Glance. Accessed in January 2014 --- www.oecd.org/edu/eag.htm.
• OECD (Organisation for Economic Co-operation and Development). 2013. Brazil Country Note. Education at a Glance. Accessed in January 2014 --- www.oecd.org/edu/eag.htm.
• Umalusi. 2013. NSC Pass Requirements: A Discussion Document for Umalusi on the NSC Pass Mark. Pretoria: Umalusi.
• Websites: Accessed in November 2013 --- http://www.alunoestrangeiro.unb.br. Accessed in January 2014 --- http://www.knec.ac.ke/main/index. Accessed in January 2014 --- http://kenyapage.net/varsity.html.
• World Bank. 2002. Higher Education in Brazil: Challenges and Options. Washington, DC: International Bank for Reconstruction and Development.

51

52
ANNExURE 1: ORIGINAL TERMS OF REFERENCE
TERMS OF REFERENCE FOR RESEARCH ON THE VALUE OF DESIGNATED SUBJECTS
1. BACKGROUND
The National Senior Certificate (NSC) came into being as a culmination of the steady curriculum overhaul of the South African schooling system. The curriculum changes were introduced incrementally from lower grades until it reached Grade 12 in 2008. The NSC have several design features that makes it unique and stand out as a qualification: one of the key features of this school exit qualifications is the notion of designated subjects. These subjects are pivotal as they are the keystone for access to university studies.
This assertion was also captured in the Government Gazette (Volume 517, Number 31231) of 11 July 2008 titled: Minimum Admission Requirements for Higher Certificate, Diploma and Bachelor’s Degree Programmes Requiring a National Senior Certificate (NSC). According to the gazette, the designated subjects list needed to be reviewed three years after the first issue of the qualification. The review process was duly initiated and a preliminary paper was fully consulted with various HESA committees, as well as the Department of Basic Education (DBE) during 2011 and 2012. The view of the Admissions Committee was that a decision on whether to amend the designated subject list or not could not be taken without conducting research that
includes the analysis of the throughput data of the cohorts that gained access to university studies through designated subjects.
2. CONTRACT OBJECTIVES
2.1. Overall Objectives
The overall objective of this consultancy contract is to conduct research which includes the analysis of the cohort of Grade 12 learners who gained access to university studies through the designated subjects.
2.2. Specific Objectives
The consultant will be required to produce a document highlighting:
a) An in-depth analysis of the designated subjects drawing from country-specific practices in respect of the subjects that are pivotal for access to university studies.
b) Analyse the throughput data of this cohort of Grade 12 learners obtained from the Department of Higher Education and Training.
c) Make recommendations with regards to the value of the designated subjects, and whether the designated subject list
requires amendments.
3. SCOPE OF WORK
3.1. Main Tasks to be performed:
This consultancy can be divided into two phases: a) Desktop Research and Literature Review
i) The systems from the following countries should be deeply interrogated: Australia (because of its practice to include both academic and vocational subjects into its school-leaving certificates); Brazil (due to its use of the vestibular as the main entrance exam); and Kenya (due to its roots in an Anglophone educational system). This part of the study will build on the first paper, but focus strongly on understanding the rationale for retaining the ‘core subjects’ for entry into higher education studies.

53
ii) Review the Curriculum Assessment Policy Statements (CAPS), introduced in 2011, to assess whether there are any significant changes with regard to designated subjects.
iii) Analyse the data from the DBE in respect of examinations concluded in 2008, 2009, 2010, 2011 and 2012. The data will be disaggregated to reflect those candidates who had offered designated subjects, and those who did not --- and their achievements in these subjects.
iv) Request data from the Higher Education Management Information System (HEMIS) in respect of learners who had entered degree studies in public higher education institutions --- whether they have graduated or not. Disaggregate those learners who have completed university studies, and compare the findings with the DBE enrolment data.
v) Timelines for this task are from 7 October 2013 to 26 January 2014.b) Report writing i) Draft a report on the designated subjects, highlighting the recommendations for the HESA Board.
ii) Timelines for this task is 27 January 2014 to 7 February 2014.
4. ExPECTED OUTCOMES
The consultant is expected to deliver the following outputs:
a) Draft the research report to be presented to the Admissions Committee in April 2014;b) Incorporation of comments from the Admissions Committee into the draft research report; and c) Final research report.
5. LOGISTICS AND SCHEDULE OF ASSIGNMENT
5.1. Contract Period and Level of Effort
The level of effort required for this contract is 40 working days [between 1 October 2013 and 7 February 2014], as indicated
under 4 above.
5.2. Geographical Area
The work of the Consultant will require a close working relationship with HESA and the Head: Higher Education Enrolment Programme. Unless specified otherwise for a specific assignment, the contracted Consultant will be working off-base and will
occasionally come to the HESA Offices in Pretoria for progress update meetings.
6. ASSUMPTIONS AND RISKS
6.1. Assumptions
It is assumed that:
a) All required data, information, reports and any other documents required for the execution of the services are made available to the Consultant;
b) The Consultant will secure the requisite documents from government departments within the timelines specified;c) The research report developed will form the basis of whether to amend the designated subject list or not.
6.2. Risks
a) The critical documents required might not be readily available for the Consultant to begin her work in earnest;b) The views expressed in the research report might be contested by the Admissions Committee;c) The timelines for this contract are very tight, and will require careful management from both HESA and the
Consultant’s side.

54
7. CONTRACTING, REPORTING AND EVALUATION
7.1. Contracting
The following contract management arrangements will apply:
a) The Contracting Authority will be HESA.b) Under this assignment the Consultant will be accountable to the CEO.c) On the specific work packages elucidated in the Terms of Reference, the Consultant will report to the Head: Higher
Education Enrolment Programme.d) All reports from the Consultant will be reviewed by the Head: Higher Education Enrolment Programme before being
submitted to the CEO for approval.
7.2. Reporting
The Consultant will report directly to the Head: Higher Education Enrolment Programme.
7.3. Evaluation
The evaluation will include consideration of the outputs delivered.
8. REPORTS
The following reports will be submitted by the Consultant in the pre-agreed formats as proof of delivery of services:a) Research Report as proposed under point 4, andb) Invoice and time sheet indicating work done, deliverables submitted, and time allocated to the achievement thereof
to enable the HESA payment.
9. CONTRACTING AUTHORITY
Contract Management The Contracting Authority will be HESA. Under this assignment the Consultant is accountable to the CEO.Accountable PersonDr Jeffrey Mabelebele, CEO of HESAUNISA Sunnyside CampusBuilding 3, Level 1cnr Rissik & Steve Biko StreetSunnyside, PretoriaTel: 012 481 2842Fax: 012 481 2843

55
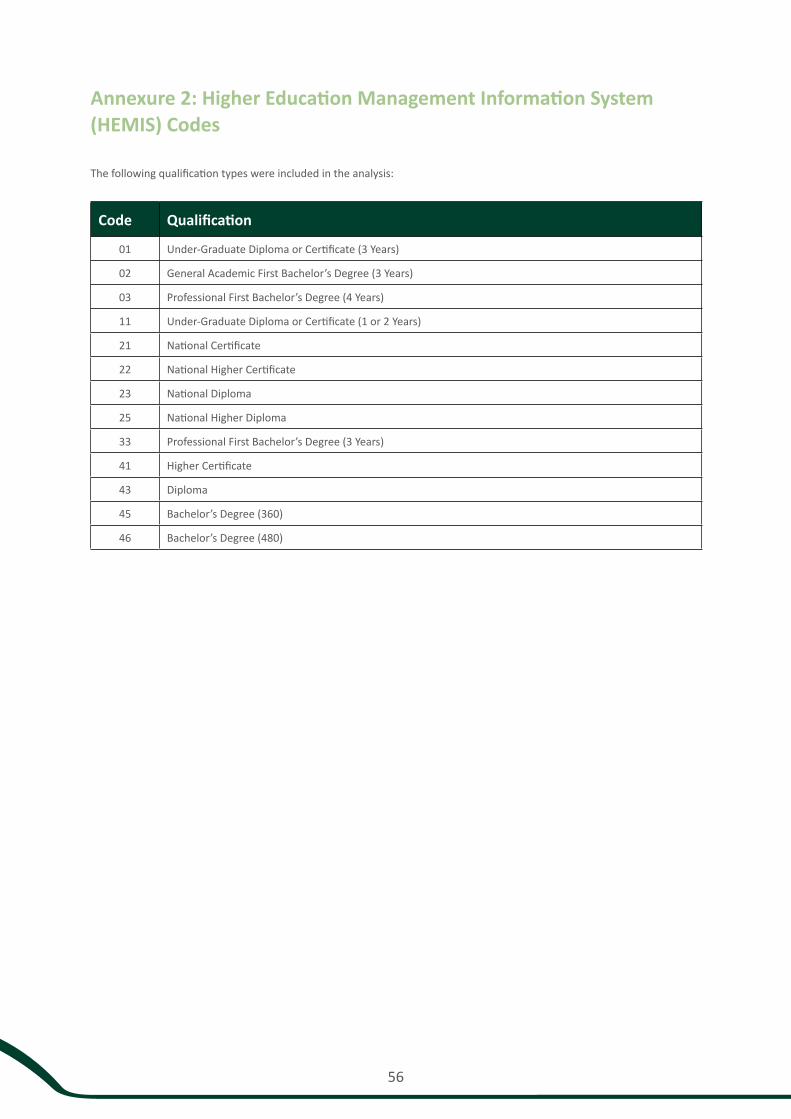
56
Annexure 2: Higher Education Management Information System (HEMIS) Codes
The following qualification types were included in the analysis:
Code Qualification
01 Under-Graduate Diploma or Certificate (3 Years)
02 General Academic First Bachelor’s Degree (3 Years)
03 Professional First Bachelor’s Degree (4 Years)
11 Under-Graduate Diploma or Certificate (1 or 2 Years)
21 National Certificate
22 National Higher Certificate
23 National Diploma
25 National Higher Diploma
33 Professional First Bachelor’s Degree (3 Years)
41 Higher Certificate
43 Diploma
45 Bachelor’s Degree (360)
46 Bachelor’s Degree (480)

57
NOTES

58
NOTES

59
NOTES

60
Contact Us
HESA Executive OfficeHigher Education South Africa
UNISA,Sunnyside CampusBuilding , Level 1
cnr Rissik and Steve Biko Street, SunnysidePretoria, South Africa
PO Box 27392, Sunnyside, Pretoria, 0132
Tel: 012 481 2821Fax: 012 481 2843/50
Email: [email protected]