Embed Size (px)
Citation preview
The UtilityThe Utility’’s Role in s Role in Implementing Clean Implementing Clean
TechnologyTechnologyFong WanFong Wan
Senior Vice President, Energy Procurement Senior Vice President, Energy Procurement Pacific Gas and Electric CompanyPacific Gas and Electric Company
March 17, 2009March 17, 2009
This presentation is not complete without the accompanying oral statements made on March 17, 2009. A replay is available at www.pgecorp.com. For more information about PG&E Corporation and its subsidiary, Pacific Gas and Electric Company, and a discussion of risks and uncertainties facing the companies, see the reports filed or furnished by the companies to the Securities and Exchange Commission, including the Annual Report on Form 10-K for the year ended December 31, 2008. These reports are available at www.pgecorp.com and www.pge.com.

1
AgendaAgenda
• California’s Clean Energy History
• The Importance of Demand-Side Emerging Technologies
• Renewable Energy Requirements
• Benefits and Challenges of Utility-scale vs. Distributed Solar
• PG&E's Portfolio Approach
• Comparison of PV vs. Concentrating Solar Thermal
• PG&E’s Proposed New Photovoltaic Program
• Integration of Intermittent Renewables
• Enabling TechnologiesEnergy Storage
SmartGrid

2
What Makes California Different? What Makes California Different?
• Long-standing State policies lower carbon footprint.
• 30+ years of energy efficiency programs facilitated by “decoupling” of rates.
• California Energy Action Plan preferred loading order:• Customer Energy Efficiency
• Demand Response/Dynamic Pricing
• Renewables
• Distributed Generation
• Clean gas-fired plants

3
Over the past 30 years, California per capita electricity use has remained relatively flat compared to the 50% increase in U.S. per capita electricity use.
Source: California Energy Commission
History of Energy Efficiency Key to California SuccessHistory of Energy Efficiency Key to California Success
-
2,000
4,000
6,000
8,000
10,000
12,000
14,000
1960 1965 1970 1975 1980 1985 1990 1995 2000
kWh
US CA Western Europe
2005

4
Savings from Efficiency Programs and Standards
0
2,000
4,000
6,000
8,000
10,000
12,000
14,000
1975
1976
1977
1978
1979
1980
1981
1982
1983
1984
1985
1986
1987
1988
1989
1990
1991
1992
1993
1994
1995
1996
1997
1998
1999
2000
2001
2002
2003
MW
/yea
r
Appliance Standards
Building Standards
Utility Efficiency Programs at a cost of
~1% of electric bill
Utility Programs and State StandardsUtility Programs and State Standards
Utility tests technologies that deliver above-code
savings
California Energy Commission raises
building and appliance codes and standards
Utility Rebate Programs provide
incentives for tested technologies leading
to mass-market adoption
Source: California Energy Commission

5
Demand Response: Demand Response: SmartACSmartAC ExampleExample
• Remote activation of SmartAC switch lowers peak energy demand
• Goal: 305 MW by Summer 2011 (~400k devices)
• Pilot: 100 MW
• Offsets need for two average-sized peaker power plants
• 93% of customers surveyed didn’t notice the system had been activated

6
California Has the Most Aggressive California Has the Most Aggressive Renewable Portfolio StandardRenewable Portfolio Standard
State Goal
☼ PA: 18%** by 2020
☼ NJ: 22.5% by 2021
CT: 23% by 2020
WI: requirement varies by utility; 10% by 2015 goal
IA: 105 MW
MN: 25% by 2025(Xcel: 30% by 2020)
TX: 5,880 MW by 2015
☼ AZ: 15% by 2025
CA: 20% by 2010
☼ *NV: 20% by 2015
ME: 30% by 200010% by 2017 - new RE
State RPSSolar hot water eligible
☼ Minimum solar or customer-sited RE requirement* Increased credit for solar or customer-sited RE** Includes separate tier of non-renewable “alternative” energy resources
HI: 20% by 2020
RI: 16% by 2020
☼ CO: 20% by 2020 (IOUs)*10% by 2020 (co-ops & large munis)
☼ DC: 20% by 2020
DSIRE: www.dsireusa.org March 2009
☼ NY: 24% by 2013
MT: 15% by 2015
IL: 25% by 2025
VT: (1) RE meets any increase in retail sales by 2012;
(2) 20% RE & CHP by 2017
☼ MD: 20% by 2022
☼ NH: 23.8% in 2025
OR: 25% by 2025 (large utilities)5% - 10% by 2025 (smaller utilities)
*VA: 12% by 2022
☼ *DE: 20% by 2019
☼ NM: 20% by 2020 (IOUs)10% by 2020 (co-ops)
☼ NC: 12.5% by 2021 (IOUs)10% by 2018 (co-ops & munis)
ND: 10% by 2015
SD: 10% by 2015
*UT: 20% by 2025☼ OH: 25%** by 2025
*MI: 10% + 1,100 MW by 2015
☼ MA: 15% by 2020+ 1% annual increase(Class I Renewables)
☼ MO: 15% by 2021
*WA: 15% by 2020
28 states have an RPS;
5 states have an RE goal
proposed:33% by 2020

7
0
500
1000
1500
2000
2500
3000
3500
4000
2002 2003 2004 2005 2006 2007 2008
MW
Annual Cumulative
33 2 4
13
3 6 8
12
25
# of Contracts
30
40
510
Aggressive Contracting for Aggressive Contracting for Diverse Renewable ResourcesDiverse Renewable Resources
MWGeothermal 493Wind 778Bioenergy 129
Solar Thermal 1,230
3,515Solar PV 777
%MW14224
35
22
%MWh
25187
30
14Solar/Biomass 107 35 30
Small Hydro 1 <1 <1

8
Advancing Renewable Energy TechnologiesAdvancing Renewable Energy Technologies
Biomass WindGeothermal
BioGas
Small Hydro
Wave PowerConcentrating Solar Thermal
Traditional
Emerging
Concentrating Photovoltaic

9
Distributed vs. Utility Scale SolarDistributed vs. Utility Scale Solar
Pros:• Speed to market• Not transmission dependent• Not dependent on water
Cons:• Higher deployment costs• Slower scale penetration
Utility Scale
Pros:• Economies of scale• Efficiencies• Compatible with emerging
storage technologies
Cons:• Transmission dependent• Land & water requirements• Not for all locations
Distributed
PG&E Takes a Diversified Portfolio ApproachPG&E Takes a Diversified Portfolio Approach

10
Annual PG&E Solar InterconnectionsAnnual PG&E Solar Interconnections
28,500 PG&E customer solar installations ( >290 MW)
0
50,000
100,000
150,000
200,000
250,000
300,000
1996 1997 1998 1999 2000 2001 2002 2003 2004 2005 2006 2007 2008
kW
0
5,000
10,000
15,000
20,000
25,000
30,000
Cus
tom
ers
Cumulative kW Cumulative Customers

11
A Portfolio of Diverse CentralA Portfolio of Diverse Central--Station and Station and Dispersed UtilityDispersed Utility--Scale Solar TechnologiesScale Solar Technologies
500-MW Power Tower 550-MW Cd Te PV
210-MW c-Si Tracking PV250-MW Dispersed PV(1-20 MW ea) (PPA)
Illustrative
553-MW Parabolic Trough
250-MW Dispersed PV(1-20 MW ea) (owned)
Illustrative

12
Why Utility Ownership?Why Utility Ownership?
• Credit-related cancellations or delays of independent contractors’ projects
• Balance sheet strength produces lower cost of money
• Utilities can utilize the PTC and ITC
• Reduces development risk
13
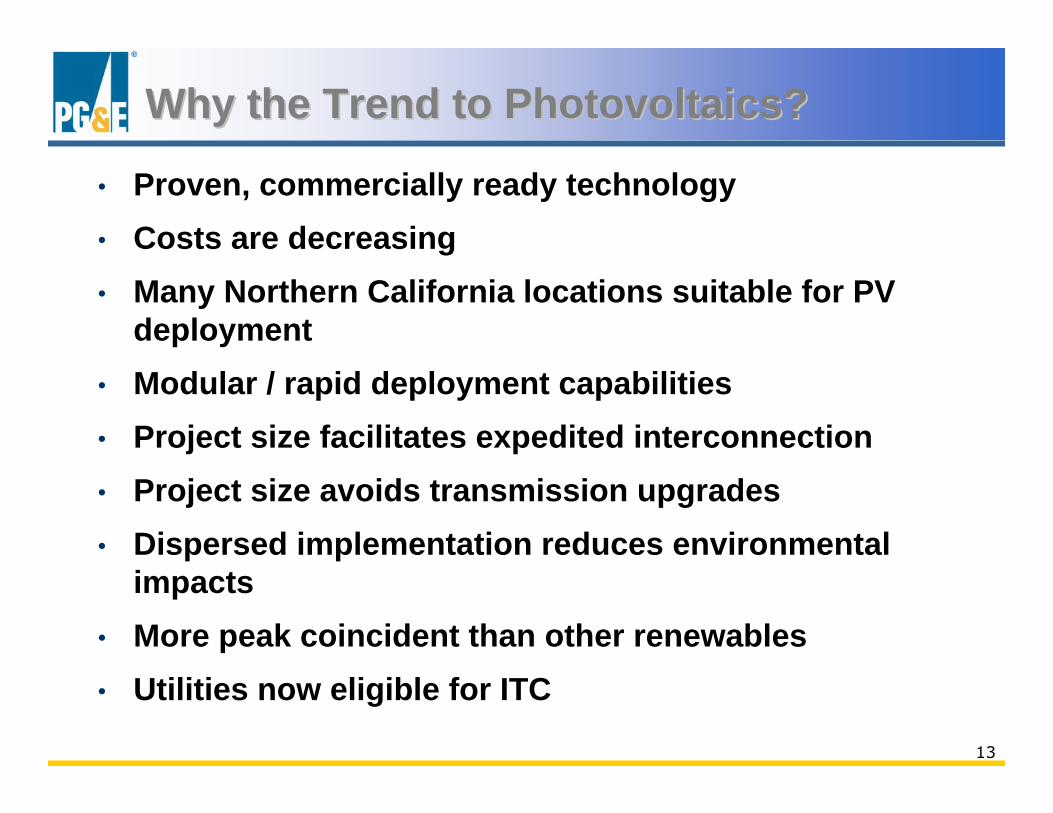
Why the Trend to Photovoltaics?Why the Trend to Photovoltaics?
• Proven, commercially ready technology• Costs are decreasing• Many Northern California locations suitable for PV
deployment• Modular / rapid deployment capabilities• Project size facilitates expedited interconnection• Project size avoids transmission upgrades • Dispersed implementation reduces environmental
impacts• More peak coincident than other renewables• Utilities now eligible for ITC

14
Levelized Cost of Energy1 Has Decreased
Solar Energy Cost TrendsSolar Energy Cost Trends
Source: NREL Energy Analysis Office (www.nrel.gov/analysis/docs/cost_curves_2005.ppt)1These graphs are reflections of historical cost trends NOT precise annual historical data.
??
125 -
100 -
75 -
50 -
25 -
Concentrating Solar PowerConcentrating Solar Power PhotovoltaicsPhotovoltaics

15
PG&EPG&E’’s Proposed New s Proposed New ““HybridHybrid”” PV ProgramPV Program
• Requested California Public Utilities Commission (CPUC) approval in February 2009
• 5-Year Program targeted to begin in January 2010• 500 MW(AC): 1 to 20 MW installations composed of
• 250 MW (305 MW(DC)) utility-owned generation (UOG) at an estimated capital cost of $1.45 billion (~$4.25 per Watt(DC))
• 250 MW of PPAs
• PG&E-owned projects projected to be primarily ground-mounted
• Targeting utility-owned land with grid connection capability
16
PG&EPG&E’’s Proposed New s Proposed New ““HybridHybrid”” PV ProgramPV Program
• PG&E would seek to finance projects as any rate-base investment
• The terms and pricing of the PPAs would be subject to pre-approval by the CPUC
• Proposed 2 MW pilot UOG PV project targeted to start in 2009, to speed deployment of the larger PV Program if approved by the CPUC

17
Integrating Intermittent Renewables Integrating Intermittent Renewables
• Solar and wind are both intermittent resources
• Very few renewable resources are dispatchable
• Today, integrating renewable resources requires more fast-response natural gas power plants
• New technologies will provide other options in the future

18
Wind Generation Varies WidelyWind Generation Varies WidelyThe average is smooth, but day-to-day variability is great
0
100
200
300
400
500
600
700
1 2 3 4 5 6 7 8 9 10 11 12 13 14 15 16 17 18 19 20 21 22 23 24
Hour
MW
Average
Each Day is a different color.
−Day 29
−Day 5−Day 26
−Day 9
Source: CAISO

19
CCGT Power Plant
Ren
ewab
le R
esou
rce
Gen
erat
ion
Renewable Resource IntegrationRenewable Resource Integration
Today:Today:• Clean, flexible, natural gas-fueled resources are currently necessary to
back up intermittent resources• Significantly improved air emissions profile compared to retiring plants,
but still fossil-fueled

20
Ren
ewab
le R
esou
rce
Gen
erat
ion
Renewable Resource IntegrationRenewable Resource Integration
Local Storage
Rooftop PVCentralized Storage
Tomorrow:Tomorrow:• Utility scale distributed storage to back up intermittent resources and
timeshift resource availability to be coincident with demand • Distributed generation and distributed storage to apply similar principles
at the customer premise• Demand response programs used to integrate intermittent renewables
21
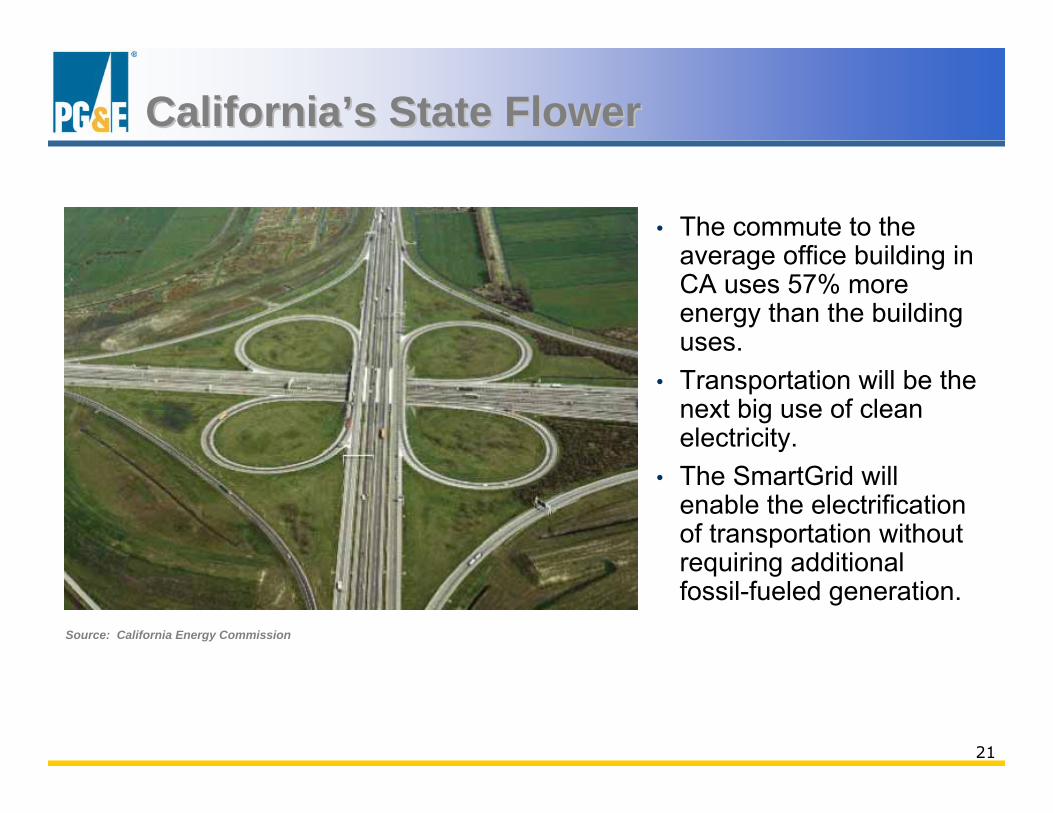
CaliforniaCalifornia’’s State Flowers State Flower
• The commute to the average office building in CA uses 57% more energy than the building uses.
• Transportation will be the next big use of clean electricity.
• The SmartGrid will enable the electrification of transportation without requiring additional fossil-fueled generation.
Source: California Energy Commission

22
Electric Vehicles and the Home Area NetworkElectric Vehicles and the Home Area Network
Home Area Network
AMI/SmartGrid
Time-shifting Electricity

23
Enabling Technology Enabling Technology -- SmartGridSmartGrid
Sensor Advanced ComputingSmart Switching DeviceCommunications
TransmissionOperator
DistributionOperator
Load ServingEntity
Substation
OtherSubstations
ResidentialCustomer
Multi-Unit Dwelling
IndustrialCustomer
CommercialCustomer
DistributedResources
Microgrid / sustainable communities
EnergyStorage
Advanced applications
4
Comprehensivecommunications
capability
2
Distributed computing
3
Increased capacity and flexibility (e.g.
bidirectional flow) of energy infrastructure
components
1
Plug-InHybrids
DistributedGeneration & Storage
AdvancedMetering
Solar