Embed Size (px)
Citation preview
1
THE USE OF MANAGEMENT ACCOUNTING PRACTICES IN
MALAYSIAN SMES
Submitted by
Kamilah Ahmad
to the
University of Exeter
as a thesis for the degree of
Doctor of Philosophy in Accountancy
May 2012

2
Declaration
This thesis is available for Library use on the understanding that it is copyright material
and that no quotation from the thesis may be published without proper
acknowledgement.
I certify that all material in this thesis which is not my own work has been identified and
that no material has previously been submitted and approved for the award of a degree
by this or any other University.
(signature).........................................................................................
3
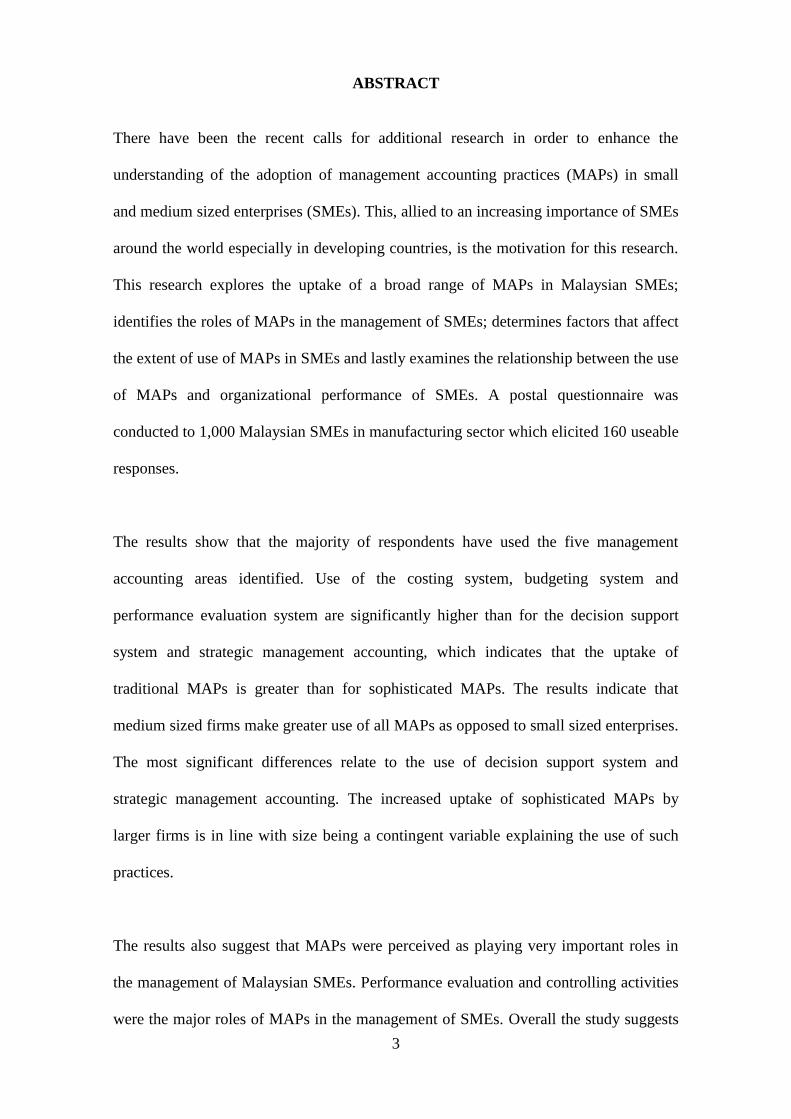
ABSTRACT
There have been the recent calls for additional research in order to enhance the
understanding of the adoption of management accounting practices (MAPs) in small
and medium sized enterprises (SMEs). This, allied to an increasing importance of SMEs
around the world especially in developing countries, is the motivation for this research.
This research explores the uptake of a broad range of MAPs in Malaysian SMEs;
identifies the roles of MAPs in the management of SMEs; determines factors that affect
the extent of use of MAPs in SMEs and lastly examines the relationship between the use
of MAPs and organizational performance of SMEs. A postal questionnaire was
conducted to 1,000 Malaysian SMEs in manufacturing sector which elicited 160 useable
responses.
The results show that the majority of respondents have used the five management
accounting areas identified. Use of the costing system, budgeting system and
performance evaluation system are significantly higher than for the decision support
system and strategic management accounting, which indicates that the uptake of
traditional MAPs is greater than for sophisticated MAPs. The results indicate that
medium sized firms make greater use of all MAPs as opposed to small sized enterprises.
The most significant differences relate to the use of decision support system and
strategic management accounting. The increased uptake of sophisticated MAPs by
larger firms is in line with size being a contingent variable explaining the use of such
practices.
The results also suggest that MAPs were perceived as playing very important roles in
the management of Malaysian SMEs. Performance evaluation and controlling activities
were the major roles of MAPs in the management of SMEs. Overall the study suggests
4
that MAPs are perceived by SMEs as relevant and useful in their management
processes.
Further, the study found that four out of five contingent factors; size of the firm,
intensity of market competition; participation of the owner/manager in the development
of MAPs in firm and advanced manufacturing technology have a positive and
statistically significant relationship with the use of certain MAPs. The research
however found weak support for the positive relationship between the use of MAPs and
organizational performance of SMEs.
This study enriches the existing body of knowledge of management accounting by
providing information as to the use of MAPs in SMEs in Malaysia. The findings can be
specifically informative for policy makers intent on developing management accounting
skills among Malaysian SMEs. This research will provide valuable insights into the
nature of MAPs in SMEs in a developing country and will promote interest among
Malaysian researchers as well as researchers of other countries to make the SME sector
a focus of interest in management accounting research.
5
LIST OF CONTENTS
Declaration 2
Abstract 3
List of Contents 5
List of Tables 9
List of Figures 12
List of Abbreviations 13
Acknowledgment 15
Chapter 1: Introduction
1.1 Introduction
1.2 Background
1.3 Problem statement
1.4 Research objectives
1.5 Research questions
1.6 Hypotheses
1.7 Importance of the study
1.8 Research methodology
1.8.1 Research process
1.9 Organisation of the thesis
1.10 Summary
16
16
18
21
22
22
22
23
24
25
28
Chapter 2: Management accounting overview
2.1 Introduction
2.2 History and development of management accounting
2.2.1 The changing focus and innovation of management accounting
2.2.2 The changing roles of the management accountant
2.2.3 Definition of management accounting
2.2.3.1 Institute of Management Accountant (IMA)
2.2.3.2 Chartered Institute of Management Accounting (CIMA)
2.2.3.3 International Federation of Accountants (IFACs)
2.2.3.4 Summary
2.3 Drivers of change in management accounting
2.4 Summary
29
29
33
37
38
38
39
40
41
41
43
Chapter 3: Small and medium-sized enterprises (SMEs) in Malaysia
3.1 Introduction
3.2 The importance of SMEs
3.2.1 The contribution of Malaysian SMEs
3.3 The development of SMEs
3.3.1 The Malaysian economy
3.3.2 The role of the Malaysian government
3.3.3 Opportunities and challenges for SMEs
3.4 Definition of SMEs
3.5 An overview of SMEs and their key sectors
3.5.1 Number of establishments
3.5.2 SMEs by sector
3.5.3 Size of SMEs
3.5.4 Size and sectors of SMEs
44
44
45
47
47
49
51
54
55
55
56
56
57
6
3.5.5 SMEs activities
3.5.5.1 Activities of the service sector
3.5.5.2 Activities of the agriculture sector
3.5.5.3 Activities of the manufacturing sector
3.5.6 Contribution of SMEs to the Malaysian SMEs
3.5.6.1 Performance of the SMEs sector in term of total output, value
added and employment
3.6 Research relating to Malaysian SMEs
3.7 Summary
58
58
59
59
60
61
64
68
Chapter 4: Literature review, key research areas and development of hypotheses
4.1 Introduction
4.2 Research into management accounting practices
4.2.1 Management accounting practices in developed countries
4.2.1.1 European research
4.2.1.2 US research
4.2.1.3 Asia-Pacific research
4.2.2 Management accounting practices in developing countries
4.2.2.1 China
4.2.2.2 Middle East
4.2.2.3 South East Asia
4.2.2.4 Other developing countries
4.2.3 Research into specific area of management accounting practices
4.2.3.1 Costing
4.2.3.2 Budgeting
4.2.3.3 Performance evaluation
4.2.3.4 Decision support system
4.2.3.5 Strategic management accounting
4.2.4 Management accounting in SMEs
4.2.5 Summary
4.3 The role of management accounting in the management of an organization
4.3.1 Summary
4.4 Management accounting within a contingency framework
4.4.1 Early contingency studies
4.4.2 An organizational framework for contingency-based management control
system (MCS) research
4.4.2.1 Evidence from SMEs
4.4.3 An organizational framework for contingency-based management
accounting practices (MAPs) research
4.4.3.1 Evidence from SMEs
4.4.4 Summary
4.5 Management accounting practices and organizational performance
4.5.1 Positive results
4.5.2 Negative results
4.5.3 Types of performance measures used in the literature
4.5.4 Summary
4.6 Overall summary
69
70
71
72
73
75
75
76
76
78
78
79
81
84
87
88
90
90
95
99
100
101
104
111
112
116
117
125
126
131
132
133
135
Chapter 5: Research design and methodology
5.1 Introduction
5.2 Research design
5.3 Sample selection method
5.3.1 Target population
5.3.2 Sampling method
5.3.3 Sample size
5.4 The method of data collection
138
139
140
140
142
145
149
7
5.5 Measurement and scaling
5.5.1 Questionnaire design
5.5.2 Reliability and validity
5.6 Method of data analysis
5.7 Summary
150
152
160
161
162
Chapter 6: Management accounting practices in Malaysian SMEs: Descriptive results
6.1 Introduction
6.2 Response rate
6.2.1 Non-response bias
6.2.1.1 Comparisons between the sample frame and the responding
companies based on number of employees and type of manufacturing
activities
6.2.1.2 Comparison of the characteristics of the profiles of ‗early‘ and
‗late‘ respondents
6.3 Profile of respondents
6.4 Extent of the use of management accounting practices
6.4.1 The use of management accounting practices
6.4.2 The extent of the use of management accounting practices
6.4.2.1 Part A: Costing system
6.4.2.2 Part B: Budgeting system
6.4.2.3 Part C: Performance evaluation system
6.4.2.4 Part D: Decision support system
6.4.2.5 Part E: Strategic management accounting
6.5 Factors which affect of the extent of the use of MAPS
6.5.1 Part A: Intensity of market competition
6.5.2 Part B: Accounting staff employment
6.5.3 Part C: Participation of owner/manager of firms
6.5.4 Part D: Use of advanced manufacturing technology
6.6 Performance of the firm
6.7 The roles of management accounting
6.8 Summary
163
163
165
166
168
169
171
171
174
174
178
182
186
189
192
192
193
194
195
196
197
198
Chapter 7: Bivariate analysis
7.1 Introduction
7.2 Bivariate association analysis
7.3 Tests for an association between management accounting practices and selected
contingent factors
7.3.1 Size of the firm (Annual sales turnover)
7.3.2 Intensity of market competition
7.3.3 Participation of owner/manager
7.3.4 Advanced manufacturing technology (AMT)
7.3.5 The level of qualification of accounting staff
7.3.6 Tests for an association between the use of management accounting
practices and industry type
7.4 Additional analysis: Tests for an association between the selected contingent
factors and frequency of use of management accounting techniques
7.4.1 Contingent variables and costing techniques
7.4.2 Contingent variables and budgeting techniques
7.4.3 Contingent variables and performance evaluation techniques
7.4.4 Contingent variables and decision support techniques
7.4.5 Contingent variables and strategic management accounting techniques
7.5 Association analysis of management accounting practices and perceptions of
firm performance
7.5.1 Costing system and perceptions of firm performance
7.5.2 Budgeting system and perceptions of firm performance
205
206
206
209
211
213
214
217
219
222
223
224
225
226
227
231
233
234
8
7.5.3 Performance evaluation system and perceptions of firm performance
7.5.4 Decision support system and perceptions of firm performance
7.5.5 Strategic management accounting and perceptions of firm performance
7.5.6 Association analysis of industry type and perceptions of firm performance
7.6 Additional analysis: Test for an association of the frequency of use of
management accounting techniques and perceptions of firm performance
7.6.1 Costing techniques and perceptions of firm performance
7.6.2 Budgeting techniques and perceptions of firm performance
7.6.3 Performance evaluation techniques and perceptions of firm performance
7.6.4 Decision support techniques and perceptions of firm performance
7.6.5 Strategic management accounting techniques and perceptions of firm
performance
7.7 Summary
236
238
239
241
243
244
246
247
248
250
252
Chapter 8: The multivariate analysis
8.1 Introduction
8.2 Logistic regression analysis
8.2.1 Logit regression: Model and underlying assumption
8.2.2 Multicollinearity between independent variables
8.3 Important statistics in the logit regression analysis
8.4 Binary logistic regression analysis testing for a relationship between the use of
management accounting practices and a range of contingent factors which affect
the extent of the use of MAPS
8.4.1 Binary logit regression model
8.4.2 Factors that affect the use of a costing system
8.4.3 Factors that affect the use of a budgeting system
8.4.4 Factors that affect the use of a performance evaluation system
8.4.5 Factors that affect the use of a decision support system
8.4.6 Factors that affect the use of strategic management accounting
8.4.7 Additional analysis: Binary logistic regression analysis in factors related
to the use of management accounting practices (with level of qualification of
accounting staff)
8.5 Ordinal logistic regression analysis testing for a relationship between the use of
management accounting practices and perceptions on the level of firm performance.
8.5.1 Background of ordinal logistic regression
8.5.2 The ordinal regression model (Cumulative odds (CO) logit models)
8.6 The ordinal regression between the use of management accounting practices and
perception of firm performance.
8.6.1 Management accounting techniques and perceptions of performance in
the level of productivity
8.6.2 Management accounting techniques and perceptions of performance in
product quality
8.6.3 Management accounting techniques and perceptions of performance in
the number of deliveries on time
8.6.4 Management accounting techniques and perceptions of performance in
sales growth rate
8.6.5 Management accounting techniques and perceptions of performance in
operating profit growth rate
8.6.6 Management accounting techniques and perceptions of performance in
cash flow growth rate
8.7 Summary
8.7.1 Possible relationship between the use of management accounting
practices and contingent factors
8.7.2 Comparison of results with previous research.
8.7.3 Possible relationship between perceptions of firm performance and the
use of management accounting practices
259
259
261
267
270
272
273
274
275
276
277
278
279
282
282
283
285
289
290
292
293
294
296
297
297
300
303
9
8.7.4 Comparison of results with previous research.
304
Chapter 9: Conclusions, limitations and suggestions for further research
9.1 Introduction
9.2 The research problems and conclusions
9.3 Limitations of the study
9.4 Suggestions for future research
9.5 Summary
306
306
312
314
316
References 320
Glossary 345
Appendices 349
LIST OF TABLES
Chapter 3:
Table 3.1: Summary of the SME definition
Table 3.2: Number of SME establishments, 2003
Table 3.3: SMEs by sector, 2003
Table 3.4: SMEs by size, 2003
Table 3.5: Proportion of sizes within the sectors of SMEs
Table 3.6: SMEs by service sub-sector, 2003
Table 3.7: SMEs by agriculture sub-sectors, 2003
Table 3.8: Selected manufacturing sub-sectors of SMEs, 2003
Table 3.9: Total output, value added and employment per establishment, 2003
Table 3.10: Total output, value added and employment of SMEs by size, 2003
Table 3.11: Value of assets in the manufacturing sector by size, 2003
Chapter 4:
Table 4.1: List of contingency variables and the types of literature where they have appeared
Table 4.2: Organizational performance indicators used by a study by Jusoh et al. (2008).
Chapter 5:
Table 5.1: The proportion of establishments in the small and medium category based on number
of establishments.
Table 5.2: The proportion of establishments in the small and medium category based on
contribution in economic value-added, output and employment and salaries.
Table 5.3: Response rate from selected studies in Malaysian companies
Table 5.4: Sample size for each subgroup and the target number of responses
Chapter 6:
Table 6.1: Summary of survey response
Table 6.2: Analysis of the population and usable responses by number of employees
Table 6.3: Pearson chi-square based on number of employees and manufacturing activities
Table 6.4: Test of representativeness of response rate for small and medium firms (based on
number of employees)
Table 6.5: Profile of the responding firms
Table 6.6: The results relating to the use of management accounting practices and the ranking of
practices
Table 6.7: Descriptive statistics for the use of costing systems and the ranking of techniques
10
Table 6.8: Descriptive statistics for the use of budgeting systems and the ranking of techniques
Table 6.9: Pair usage of type of budget and their timing
Table 6.10: Descriptive statistics for the use of performance evaluation systems and the ranking
of techniques
Table 6.11: Descriptive statistics for the use of decision support systems and the ranking of
techniques
Table 6.12: Descriptive statistics for the use of strategic management accounting and the ranking
of techniques
Table 6.13: Assessment of market competition by percentage of respondents
Table 6.14: Accounting staff employment by percentage of respondents
Table 6.15: Qualification of accounting staff by percentage of respondents
Table 6.16: Participation of owner/manager by percentage of respondents
Table 6.17: Use of advanced technology by percentage of respondents
Table 6.18: Performance of the firm: summary statistics shown by percentage of respondents
Table 6.19: Perceptions of the role management accounting by percentage of respondents
Chapter 7:
Table 7.1: A summary of the type of data of independent and dependent variables under the first
hypothesis.
Table 7.2: Kendall‘s tau correlation coefficient test results for the relationship between annual
sales turnover and the use of specific management accounting practices.
Table 7.3: Kendall‘s tau correlation coefficient test results for the relationship between intensity
of market competition and the use of management accounting practices.
Table 7.4: Kendall‘s tau correlation coefficient test results for the relationship between
participation of owner/manager and the use of management accounting practices.
Table 7.5: Kendall‘s tau correlation coefficient test results for the relationship between reported
use of AMT and the use of management accounting practices.
Table 7.6: Kendall‘s tau correlation coefficient test results for the relationship between
individual AMT measures and the use of management accounting practices.
Table 7.7: Kendall‘s tau correlation coefficient test results for the relationship between the level
of qualification of accounting staff and the use of management accounting practices.
Table 7.8: Pearson chi-square and Cramer‘s V correlation coefficient test results for a
relationship between industry type and the use of management accounting practices.
Table 7.9: A summary of the type of data for the new dependent variables under the first
hypothesis.
Table 7.10: Kendall‘s tau correlation coefficient test results for a relationship between
contingent variables and the frequency of use of costing techniques
Table 7.11: Kendall‘s tau correlation coefficient test results for a relationship between
contingent variables and the frequency of use of budgeting techniques
Table 7.12: Kendall‘s tau correlation coefficient test results for a relationship between
contingent variables and the frequency of use of performance evaluation techniques.
Table 7.13: Kendall‘s tau correlation coefficient test results for a relationship between
contingent variables and the frequency of use of decision support techniques.
Table 7.14: Kendall‘s tau correlation coefficient test results for a relationship between
contingent variables and the frequency of use of strategic management accounting techniques
Table 7.15: A summary of the type of data of independent and dependent variables under the
second hypothesis
Table 7.16: Kendall‘s tau correlation coefficient test results for the relationship between the use
of costing system and the perceptions of firm performance.
Table 7.17: Kendall‘s tau correlation coefficient test results for the relationship between the use
of budgeting system and the perceptions of firm performance.
Table 7.18: Kendall‘s tau correlation coefficient test results for the relationship between the use
of performance evaluation system and the perceptions of firm performance.
Table 7.19: Kendall‘s tau correlation coefficient test results for the relationship between the use
of decision support system and the perceptions of firm performance.

11
Table 7.20: Kendall‘s tau correlation coefficient test results for the relationship between the use
of strategic management accounting and the perceptions of firm performance.
Table 7.21: Pearson chi-square and Cramer‘s V correlation coefficient test results for a
relationship between the type of manufacturing activities and the perceptions of firm
performance.
Table 7.22: A summary of the type of data for the new independent variables
Table 7.23: Kendall‘s tau correlation coefficient test results for a relationship between the
frequency of use of costing techniques and the perceptions of firm performance measured in
seven ways.
Table 7.24: Kendall‘s tau correlation coefficient test results for a relationship between the
frequency of use of budgeting techniques and the perceptions of firm performance measured in
seven ways.
Table 7.25: Kendall‘s tau correlation coefficient test results for a relationship between the
frequency of use of performance evaluation techniques and the perceptions of firm performance
measured in seven ways.
Table 7.26: Kendall‘s tau correlation coefficient test results for a relationship between the
frequency of use of decision support techniques and the perceptions of firm performance
measured in seven ways.
Table 7.27: Kendall‘s tau correlation coefficient test results for a relationship between the
frequency of use of strategic management accounting techniques and the perceptions of firm
performance measured in seven ways.
Table 7.28: Positive results of a test for a statistically significant relationship between contingent
variables and the use of management accounting practices
Table 7.29: Positive results of a test for a statistically significant relationship between the use of
management accounting practices and the perceptions of firm performance.
Chapter 8:
Table 8.1: Correlation matrix between five contingent variables.
Table 8.2: Correlation matrix between five main areas of management accounting practices.
Table 8.3 Collinearity statistics
Table 8.4: A summary of the type of data of independent and dependent variables for testing the
first hypothesis
Table 8.5: Logistic regression analysis relating to the factors that affect the use of a costing
system
Table 8.6: Logistic regression analysis relating to the factors that affect the use of a budgeting
system
Table 8.7: Logistic regression analysis relating to the factors that affect the use of a performance
evaluation system
Table 8.8: Logistic regression analysis relating to the factors that affect the use of a decision
support system
Table 8.9: Logistic regression analysis relating to the factors that affect the use of strategic
management accounting
Table 8.10: Comparisons of models fitting and R squares with and without qualified accounting
staff
Table 8.11: Comparisons of significance value of predictors with and without qualified
accounting staff
Table 8.12 Results summary of ordinal regression analysis between the use management
accounting practices and perceptions of firm performance.
Table 8.13: Details of independent variables developed from specific management accounting
techniques.
Table 8.14 Ordinal logistic regression analysis relating to the level of use of management
accounting techniques within nine categories and perceptions of performance measured by the
level of productivity
Table 8.15: Ordinal logistic regression analysis relating to the level of use of management
accounting techniques and the perceptions of performance measured by product quality

12
Table 8.16: Ordinal logistic regression analysis relating to the level of use of management
accounting techniques and the perceptions of performance measured by the number of deliveries
on time
Table 8.17: Ordinal logistic regression analysis relating to the level of use of management
accounting techniques and the perceptions of performance measured by sales growth rate
Table 8.18: Ordinal logistic regression analysis relating to the level of use of management
accounting techniques and the perceptions of performance measured by operating profit growth
rate
Table 8.19: Ordinal logistic regression analysis relating to the level of use of management
accounting techniques and the perceptions of performance measured by cash flow growth rate
Table: 8.20: Summary of statistically significant results from binary logistic regression tests
Table: 8.21: Summary of statistically significant results from ordinal regression tests for an
association between nine accounting techniques and perceptions of firm performance
Chapter 9:
Table 9.1: Summary of the results of bivariate and multivariate analyses regarding factors
affecting the use of MAPs
LIST OF FIGURES
Chapter 1:
Figure 1.1 Overview of research process
Chapter 2:
Figure 2.1: Evolution of Management Accounting.
Chapter 3:
Figure: 3.1: SME contribution to GDP in selected countries (% share)
LIST OF APPENDICES
Appendix 1: List of literature in management accounting
Table A1: Major studies in management accounting practices
Table A2: Costing
Table A3: Budgeting
Table A4: Performance evaluation system
Table A5: Decision support system
Table A6: Strategic management accounting
Appendix 2: List of performance measures in management accounting
Table A7: Performance measures used by previous research
Appendix 3: Non-response bias test
Table A8: Pearson chi-square result of early and late responses test
Table A9: Mann-Whitney U test result of early and late responses test

13
Appendix 4: Ordinal regression analysis
Table A10: Results summary of ordinal regression analysis between the use of management
accounting practices and perceptions of firm performance using complementary log-log link
Appendix 5: Questionnaire
Appendix 6: Covering letter to target respondent
Appendix 7: Covering letter: 1st Follow-up
Appendix 8: Covering letter: 2nd
Follow-up
ABBREVIATIONS
ABC Activity-based Costing
ABCMA Activity-based Costing and Management
ABMA Activity-based Management Accounting
AIS Accounting Information System
AMT Advanced Manufacturing Technology
ARR Accounting Rate of Return
BBRT Beyond Budgeting Round Table
BSC Balanced Scorecard
CAM-I Consortium for Advanced Manufacturing International
CBM Central Bank of Malaysia
CIMA The Chartered Institute of Management Accountants
CSFs Critical Success Factors
CVP Cost-Volume-Profit
DOS The Department of Statistics
DSS Decision Support System
FDI Foreign Direct Investment
FMAC Financial Management and Management Accounting Committee
GDP Gross Domestic Product
IRR Internal Rate of Return
IFAC International Federation of Accountants
IMA Institute of Management Accountants
IMP Industrial Master Plan
IT Information Technology
JIT Just-In-Time
KM Knowledge Management
KPIs Key Performance Indicators
MA Management Accounting
MAP Management Accounting Practice
MAS Management Accounting Systems
MAT Management Accounting Technique
MCS Management Control System
MOA Ministry of Agriculture and Agro-based Industries
MP Malaysia Plan
NPC National Productivity Corporation (Malaysia)
NPV Net Present Value
NSDC Malaysian National SMEs Development Council
NZ New Zealand
OC Organizational Controls
PMS Performance Measurement System
ROI Return on Investment
ROE Return on Equity

14
ROA Return on Asset
ROS Return on Sales
SMEs Small and Medium sized Enterprises
SMIDEC Small and Medium Industries Development Corporation
SMA Strategic Management Accounting
TQC Total Quality Control
TPM Total Productive Maintenance
TQM Total Quality Management
UNDP The United Nations Development Program
UK United Kingdom
US United Stated
VBM Value-based Management
VE Value Engineering
ZBB Zero-Based Budgeting

15
Acknowledgement
This thesis would not have been possible without the support and guidance of my
supervisors, Professors Paul Collier and David Gwilliam of University of Exeter. To
them goes my greatest thanks. I would also like to acknowledge my examiners
Professor John Burns and Professor Robert Luther for their constructive feedback and
opinion.
I am also grateful to all the many other members of staff at Exeter Business School who
have helped me in various ways over the past three years. Special thanks to Helen Bell,
the postgraduate administrator of University of Exeter Business School for her
professional advice towards completing my study. Finally, I wish to thank my beloved
husband, Shafie, my children Irshad and Safia Zarin, the rest of the family and friends
for their continued love, support and companionship.

16
Chapter 1
Introduction
1.1 Introduction
This chapter is organized into five sections. The first section describes briefly the
background to small and medium sized enterprises (SMEs) and the role of management
accounting practices (MAPs) in the management of all organizations. Section two
discusses the problem statement followed by the identification of research objectives,
research questions, and hypotheses. Next the rationale and importance of this study is
explained. The section ends with the development of a methodology and the
specification of the organisation of the thesis.
1.2 Background
Small and medium-sized enterprises (SMEs) make up the vast majority of the business
population in most countries in the world therefore they constitute a vital force in
modern information-based economies (Mitchell and Reid, 2000). In Malaysia the SMEs
population comprises approximately 99 per cent of all Malaysian businesses (The
Department of Statistics, 2005). Therefore this sector plays a crucial role in the
economy as an engine to generate economic growth in Malaysia. SMEs also contribute
to the economy in other ways. Cook (2001) highlighted some of those which includes;
the encouragement of entrepreneurship;
the greater likelihood that SMEs will utilize labor intensive technologies and thus
have immediate impact on employment generation;
the fact that they can usually be established rapidly and put into operation to produce
quick returns;
17
the ability of SME development to encourage the process of both inter-and intra-
regional decentralization; and
the notion that they may become a countervailing force against the economic power
of larger enterprises. More generally, the development of SMEs is seen as
accelerating the achievement of wider economic and socio-objectives, including
poverty alleviation.
In addition to the advantages stated above, Mitchell and Reid (2000) argued that part of
the reason for stressing the importance of small firms or SMEs is that their flexibility
makes them well suited to the niche opportunities which are so characteristic of the
‘new‘ economy. Thus SMEs play a key role in stimulating economic expansion. In light
of both their significant contributions and potentials, there is a growing focus on this
sector by policy makers in most countries. In Malaysia, the role of SMEs became more
important after the 1990s especially after the Asian Crisis in 1997-1998. The country
learnt not to be overly dependent on foreign direct investment (FDI) in stimulating its
economy and used SMEs as a new mechanism for generating the growth of its economy
(Aris, 2007). The government has been called upon to put up clear policies, strategies
and implementation matrixes to develop this sector through an integrated approach
(Aris, 2007). For example in the 9th Malaysia Plan (2006 – 2010), the principal SMEs
policy strives for the development of a competitive, innovative and technologically
strong SME sector, capable of meeting the increasing demands of globalization and
intensifying competition (NSDC, 2007). In consequence various initiatives have been
set in motion to build the capacity and capability of SMEs. For example, there have
been efforts to improve the management and business methods in production, quality
improvement, marketing and accounting skill (SME Annual Report, 2007). However
there is concern about a lack of exposure to management accounting among Malaysian
SMEs since there is no specific reference to the use of MAPs. Previous research has
18
suggested that MAPs are an important tool through which management can promote
efficiency, and potentially have an important influence on performance (see Ghosh and
Chan, 1997; Lybaert, 1998; and Mitchell and Reid, 2000). In particular, within small
firms, MAPs act as the key information system that plays a vital role as an efficient
information-processing (Reid and Smith, 2002). Apart from that, the availability of
financial and non-financial information provided by MAPs permits firms to effectively
face competition in the market, coping with change, surviving and thereby improves
performance (Mia and Clarke 1999 and Reid and Smith, 2002). Although good MAPs
may not by themselves guarantee success, an absence of them or poorly implemented
practices may significantly reduce the firm's competitive advantages (Folk et al., 2002).
Therefore, given these advantages from MAP use, it is important to promote knowledge
and awareness of MAPs among small business in Malaysia so that the firms may benefit
advantages that have been highlighted above.
1.3 Problem statement
Much has been written about small business and in particular about small business
failure rates (Watson and Everett, 1996). Richard (2000) stated that there are many
reasons for the failure rate of start-up businesses, including lack of adequate working
capital, poor market selection, and rapidly changing external market conditions.
However, the most significant reason for this high failure rate is the inability of SMEs
to make adequate use of essential business and management practices. Many small
firms fail to develop an initial plan, and those that do establish a plan fail to continually
adjust and use it as a benchmarking tool. Similarly, Wichmann (1983) argued that one
of the reasons for business failure is poor management ability which includes
accounting problem-solving. Further, Hopper et al. (1999) using data based on the
results from Japanese companies‘ concluded that a failure to adopt MAPs (i.e. cost
19
management systems) in a similar way to their larger counterparts and, at the margins,
to experiment with new forms of control that are more profit oriented may be a factor in
the currently high failure rate of SMEs. Based on these argument it can be suggested
that MAPs are important for SMEs if they are to avoid failing.
Another driver of this thesis is the paucity of research into the use of MAPs among
SMEs. Despite the increasing amount of research in management accounting in the past
decade, little is known of its form and effectiveness within SMEs (McChlery et al.,
2004). This lack of research based knowledge may have been based on a belief that the
discipline in management accounting is best served by studying the most innovative and
successful examples of practice that can be found in the leading western and Japanese
firms (Mitchell et al., 1998).Consequently larger enterprises have been preferred for
empirical management accounting research as expertise and a capacity to innovate and
develop management accounting is more likely to exist in such enterprises (Mitchell
and Reid, 2000). This situation creates a challenge into the study of MAPs in SMEs.
However, Mitchell et al. (1998) contended that research into management accounting in
SMEs provides possibilities of a different type which are nonetheless of great
importance to the fundamental explanation and understanding of the discipline. Indeed,
many of the research opportunities inherent in SMEs derive directly from the contrasts
which they provide with large organisations. Mitchell et al. (1998) added that in the
SME research setting all of the following advantages accrue.
1. The small size of the SME provides a less complex research setting than that
provided by a large scale organisation. In the SME the nature, role and development
of management accounting are more visible to the researcher and due to their
smaller scale, more accessible. This enhanced visibility, combined with the
20
susceptibility of the SME to key contingencies such as phase of the business cycle
and extreme financial and competitive pressures, provides an environment in which
the effects of fundamental forces are marked and can therefore be studied more
easily.
2. Prior research, e.g. Holmes and Nicholls (1989) in an Australian context, indicates
that management accounting information (and its absence) is associated with
success (and failure) in SMEs and is therefore potentially an important influence on
performance within this economic sector. This, in combination with the relative
importance of SMEs as generators of economic well-being reinforces the
significance of this area of research.
3. In new and young SMEs the birth and early years of management accounting
systems are observable. The existing research focusing on these formative stages
concentrates mostly on the development of management control systems (MCS) in
which only a few control systems are associated with management accounting (see
for example Sweeting, 1991; Davila, 2005; Davila and Foster, 2007; Wisbaden and
Sandino, 2007; and Hutzschenreuter, 2009). Hence there is a dearth of research
material that specifically focuses on management accounting at these stages have
been undertaken.
4. The absence, in many instances, of professional accounting support in the SMEs
results in information provision which is derived purely from managerial demand.
The 'producer' driven influence of the accountant is absent from the subject of study
and consequently the SME setting provides a unique and pure insight into
managerial information needs.
For these reasons SMEs offer a potentially rewarding location for investigating MAPs
and exploring the factors underlying their development. At present in Malaysia there is
a dearth of information on the extent of use of MAPs among SMEs. Given their small

21
size especially in the context of developing country, there is a possibility that SMEs do
not use MAPs and fail to take full advantage of the opportunities that better accounting
information might create. Also despite the claims of an association by many researchers,
there is little information on whether or not there is any association between the use or
extent of use of MAPs and the performance of firms, especially for Malaysian SMEs.
The absence of data on MAPs in SMEs has perhaps prevented the Malaysian
regulators/policy makers from taking actions that might improve the functioning of
Malaysian SMEs. Consequently, there are significant gaps in the knowledge base
relating to MAP usage in SMEs in Malaysia, which should be filled on the grounds that
the information provided may underpin government policy towards the sector.
Therefore given the significant economic importance of SMEs and the gap in the
literature, this research aims to obtain a broad overview of the use of MAPs within
Malaysian SMEs, their roles in the management of SMEs, and to examine both the
factors that lead to their use as well as their impact on performance. Following are the
research objectives, research questions and research hypotheses developed for this
study.
1.4 Research objectives
Based on the issues and problems discussed above, this study identifies four main
objectives
1. To investigate the extent to which MAPs are employed by Malaysian SMEs.
2. To identify the roles played by MAPs in Malaysian SMEs‘ management.
3. To determine the factors that affect the extent of use of MAPs among Malaysian
SMEs.
22
4. To seek to demonstrate a positive relationship between MAP use and the
performance of SMEs.
1.5 Research questions
These objectives can be expressed in the following research questions:
1. What is the extent of the use of MAPs by Malaysian SMEs?
2. What are the roles of management accounting in Malaysian SMEs‘ management?
3. What factors affect the extent of the use of MAPs by Malaysian SMEs?
4. Is there a positive relationship between the use of MAPs and the performance of
Malaysian SMEs?
1.6 Hypotheses
Research questions 3 and 4 can be expressed in terms of the following two general
hypotheses for empirical testing:
H1: There are significant and positive relationships between selected contingent
factors and the use of MAPs.
H2: There is a significant and positive relationship between the use of MAPs and
organizational performance.
1.7 Importance of the study
This study will have useful implications for theory and practice. Regarding the potential
implications for theory, the study will expand the existing management accounting
literature in two main ways. First the study will provide new empirical evidence on the
use of MAPs. Second, the study will contribute an additional study in the new context
of Malaysian SMEs regarding what contingent factors affect the extent of MAP use.
23
Finally, the research will test for a relationship between the use of MAPs and the
performance in the context of Malaysian SMEs. The focus on Malaysia is especially
important because research on MAPs and SMEs is very limited in this country and
developing countries more generally. Benefits for practice will include the following:
the creation of an awareness among SME managers of the importance of
management accounting as a means of improving performance and maintaining
competitiveness in the marketplace.
the provision of results that may assist policymakers, such as the level of use of
MAPs among SMEs and factors that affect the use of MAPs, that may ensure that
future policy decisions made by the Malaysian government, financial institutions,
and other groups with an interest in SMEs are evidence based.
1.8 Research methodology
The quantitative data for descriptive purposes and empirical testing will be collected by
a postal questionnaire. The questionnaire will examine and explore the state of MAPs
within Malaysian SMEs in the manufacturing sector. The research concentrates only on
one sector in order to avoid inappropriate distractions arising out of variations between
sectors. Besides that the manufacturing sector in Malaysia plays a significant role in the
Malaysian economy and therefore it is worthwhile to focus on this sector as a target
population for this study. In addition the questionnaire will also explore the roles of
MAPs as well as the factors that influence their use among SMEs. Lastly questions on
the level of performance of SMEs and details of the profile of the firms will also be
included. A postal questionnaire approach has been widely used in management
accounting research (see for example, Drury et al., 1993; Firth, 1996; Chenhall and
Langfield-Smith, 1998; Haldma and Laats, 2002; and Al-Omiri, 2003).
24
The information on the membership of the population will be derived from the directory
of the Federation of Malaysian Manufacturers (FMM). This source, although not
comprehensive, provides detailed information about SMEs in the manufacturing sector.
This directory consists of comprehensive profiles of over 2,200 manufacturers from
SMEs to large enterprises. For the sampling purposes, this research will focus on the
small and medium category as the sampling unit. Thus in order to ensure every sub-
sample gets an appropriate representation, a stratified random sampling procedure is
used. This research will expect to receive between 120 to 150 responses from the 1,000
sample. This is based on past response rates in Malaysian studies. A detailed
specification of the methodology is provided in Chapter 5.
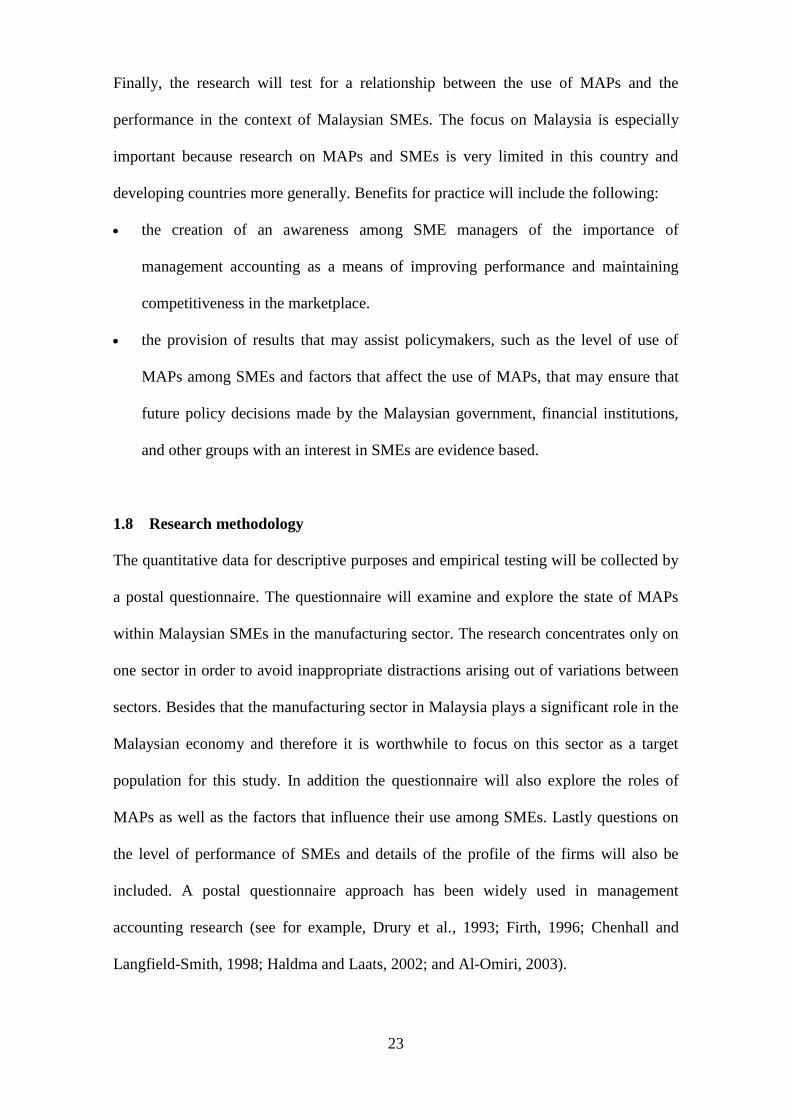
1.8.1 Research process
Figure 1.1 shows the steps that will be employed in addressing the research problems.
Figure 1.1 Overview of research process
STEP 1 Literature review
STEP 2 Identification of possible variables
Development of survey questionnaire
STEP 3 Pilot testing - Postal questionnaire
Approximately 2 months
STEP 4 Actual survey- postal questionnaire
Approximately 4 months
STEP 5 Data analysis
The first step in the research process will be a literature search to ascertain the current
state of knowledge in the field and ultimately to identify the relevant research design
25
and methodology to help address the research questions as well as to identify relevant
factors to be considered in this study. In the second step, a list of possible variables for
identifying MAPs, possible contingent factors and indicators of performance will be
drawn up based on the literature review. Next, a pilot test will be conducted to acquire
feedback from the respondents on the questionnaire as well as to test the response rate
assumption and the timing of responses. On the basis of this information, the
questionnaire form will be reviewed and enhanced and a specific approach for follow-
up procedures will be determined. In the fourth step, the postal survey will be conducted
in order to collect descriptive data needed to answer the four research questions posed.
Finally the data collected from the survey will be analysed using the descriptive
statistics, bivariate association analysis and logit regression analysis.
1.9 Organisation of the thesis
This thesis is organized into nine chapters.
Chapter 1: Introduction
This chapter establishes the importance of SMEs in today‘s modern economy and the
importance of management accounting in the management of all organizations. The
problem statement for this research discusses the failure of the SMEs and the
importance of adopting proper MAPs to reduce the failure rate. The existence of a
research gap in the MAP literature especially in the SME context is also outlined. The
chapter also states the research objectives, research questions and hypotheses for this
study followed by a statement of the contribution generated by the study both in theory
and in practice. This chapter specifies the intended research methodology which briefly
explains how the data will be collected and the sampling method. The chapter ends with
a description of the structure of the thesis.
26
Chapter 2: Management accounting development
This chapter discusses the development of management accounting in terms of its role
and techniques. Challenges that have been faced by management accounting in today‘s
environment are also considered.
Chapter 3: SMEs in Malaysia
This chapter explains the development of SMEs in Malaysia and outlines the role of this
sector in the Malaysian economy. The chapter also establishes a definition of SMEs
based on a Malaysian context, three main sizes of SMEs and their sectors. Finally this
chapter emphasizes the significance of the SME manufacturing sector which is selected
as the target population for this research.
Chapter 4: Literature review and key research areas
The chapter reviews and examines the current state of knowledge in the field under
examination. First research into MAPs that cover MAPs in both developed and
developing countries and in SMEs will be explored. Second the roles of management
accounting in management will be reviewed. Next the literature on contingency theory
in management accounting will be considered both in terms of the organizational
framework for contingency-based management control (MCS) and contingency-based
MAPs. Lastly the research information on the relationship between MAPs and
organizational performance is considered.
Chapter 5: Research design and methodology
This chapter explains the research design chosen to answer the research questions set.
This chapter also discusses the target population, sample selection method and the
reasons behind the use of a stratified random sampling procedure. The method of data
27
collection; postal survey and measurement of variables is also explained in detail. This
chapter concludes with a discussion on the method of analysis.
Chapter 6: Descriptive analysis
The chapter analyses and discusses findings from the data collected. The non-response
bias test is also presented. The main aim of this chapter is to provide a descriptive
analysis that helps to answer the first two research questions: the extent of the use of
MAPs in SMEs; and the roles of MAPs in the management of SMEs. Additionally the
chapter also provides descriptive data of contingent variables and the performance of
firms that will be used for bivariate association analysis and multiple regression
analyses.
Chapter 7: Bivariate analysis
This chapter answers the last two research questions through the testing of the two
hypotheses developed in this study. The statistically significant contingent factors which
affected the extent of the use of MAPs and whether or not there is a positive
relationship between the use of MAPs and the performance of the firm will be examined
through the use of bivariate association analysis.
Chapter 8: Multivariate analysis
This chapter continues the analysis by focusing on the interactive effect of particular
independent variables on the dependent variable. Specifically, the logistic (logit)
regression analysis will be used to investigate the influence of selected contingent
variables on the use of MAPs if the interactive effect between explanatory variables is
taken into account, and the influence of the use of MAPs on firm performance if the
interactive effect between explanatory variables is taken into account.

28
Chapter 9: Conclusions, limitations and suggestions for further research
This chapter provides reflections on the main findings of the study and a discussion of
the findings contribution to the extant literature. The implications of these findings for
management accounting research will be considered taking into account any limitations
that may be of relevance to future research. In light of these implications, suggestions
for future research and recommendations are formulated.
1.10 Summary
This chapter commences with a brief background on the importance of SMEs and the
roles of MAPs in business organizations before the research problem was specified.
This is followed by the development of research objectives, research questions,
hypotheses and an explanation of the rationale of the study. This chapter is continued by
describing the methodology and research process before briefly detailing the content of
the chapters in the thesis.

29
Chapter 2
Management accounting overview
2.1 Introduction
The thesis seeks to investigate the extent to which MAPs are employed by SMEs in
Malaysia. Therefore the thesis starts with an overview of management accounting, in
order to provide an outline of its development and to highlight its importance for
management and small businesses. The chapter first reviews the history of management
accounting before examining the role that MAPs play in the modern business
environment and developments in definitions of management accounting. The chapter
ends with a discussion focusing on the factors that are catalysts for change in MAPs.
2.2 History and development of management accounting
Management accounting was first known as cost accounting. This origin was reflected
in the earlier title for practitioners of cost or works accountants (Wilson and Chua,
1988). Accounting historians have long endorsed the view that cost accounting is a
product of the industrial revolution (Johnson, 1981). For example (Wilson and Chua,
1993) claimed that cost accounting was practiced by the mechanized, multi process,
cotton textile factories that appeared in England and United States around 1800. This
point of view was consistent with Garner (1947) who pointed out that cost accounting
had emerged only after eighteenth century as a result of the rise of the factory system in
the industrial revolution. The traditional view contends that cost accounting arose due to
the increased use of fixed capital prompted accountants during the industrial revolution
to graft cost accounting onto the double-entry system (Johnson, 1981). This widely held
belief however was rejected by Johnson (1981) who argued that changes in the way
textile mills and giant manufacturing firms organized economic activity, not just
30
changes in the temporal structure of their costs, prompted the industrial organizations to
develop internal cost accounting procedures. Cost accounting is defined as the
equivalent of ‗direct costing‘ designed to provide financial information for management
decision-making and control (Johnson, 1981). Garner (1947) argued that the practices
and theories of cost accounting origins can be traced to the fourteenth century. During
this period there was a rapid growth of Italian, English, Flemish, and German
commerce, and various industrial enterprises were engaged in the manufacture of
woollen cloth, books, coins, and other products (Garner, 1947). Cost accounting at this
time was concerned with those specialized aspects of general accounting which have to
do with recording and analysis of factory expenditure (Garner, 1947).
The first evidence of cost accounting found was ―job order‖ costing of the carding of
wool in Italy (Abs et al., 1954). Parker (1969) also cites the accounts of Francesco di
Marco Datini, merchant of Prato, who in 1390 kept double entry; records which show
evidence of job cost accounting, accrual accounting and depreciation. In 1531, another
example of cost accounting appeared in the accounts of Raffello di Francesco de‘
Medici, cloth manufacturers of Florence (Parker, 1969).
According to Garner (1947) the first definite instance of cost accounting development in
the UK occurred during the reign of Henry VII of England (1485-1509). At this time a
large number of small woollen manufacturers, who resented guild restrictions in cities,
moved to the country villages, and established industrial communities, hoping to be able
to sell their finished products through channels other than the organized guilds (Garner,
1947). Costing became a prerequisite for success when the small factory owners found
themselves competing not only against the guilds, but also among themselves. Later in
the sixteenth century, the Plantin accounts (Flemish printer and publisher) contain many
31
elements of a modern job-order cost system. A separate account was established by
Plantin for each book which he undertook to publish (Garner, 1947). The first book on
cost accounting was published in 1887 by the electrical engineer Emile Garcke and
accountant John Manger Fell and titled Factory Accounts in 1887 (Parker, 1969). H.L
Arnold, the American Engineer, in 1903 published a book in which he set forth a
number of examples of the latest American practice and his own views of the true object
of cost accounting (Parker, 1969).
Cost accounting continued to develop further in the nineteenth century and through the
middle of twentieth century as a result of greater industrialisation and the increasing
size of corporations (Garner, 1947). Caplan (2006) observed that in the early decades of
the twentieth century, the fields of industrial engineering and management accounting
developed in tandem. During this period, industrial engineers developed methods to
control production that included a ―scientific‖ determination of standards for inputs of
materials, labor and machine time, against which actual results could be compared. In
consequent this development led to the use of standard costing systems, which are still
widely used for planning and control by manufacturing companies (Caplan, 2006).
Later in the twentieth century, the term of cost accounting started to change into
management accounting. Johnson and Kaplan (1987) argued that by 1925 virtually all
MAPs used today had been developed. On the other hand, Wilson and Chua (1988)
claimed that the term ‗management‘ or ‗managerial‘ accounting only came into
widespread use at the beginning of the 1960s. A useful distinction between the era of
cost accounting and the era of management accounting was made by Horngren (1975).
In an exaggerated sense, the cost accountant‘s main mission might have been depicted
as the pursuit of absolute truth, where truth was defined in terms of getting as accurate
32
or precise costs as possible….. (While in management accounting) the theme of
‗different costs for different purposes‘ was stressed- a preoccupation with finding
conditional truth.‖ (Horngren, 1975, pp. 9-10).
The factor that led from a costing to a managerial emphasis was the development of
new corporate structures such as multidivisional organization, the conglomerate and the
multinational enterprise (Wilson and Chua, 1988). These new structural forms placed
fresh demands on an organization‘s accounting function. For instance, a means of
evaluating divisional performance had to be devised. Similarly, prices had to be
established for goods that were sold by one division to another within the same
organization. These extra informational requirements led to a development of the
subject beyond a narrow costing emphasis (Wilson and Chua, 1988).
Additionally in the middle and later parts of the twentieth century, the growth of service
industries like financial institutions and an expansion in the number of government, and
quasi government organisations further supported the development of management
accounting (Wilson and Chua, 1988). The traditional cost concepts and costing
techniques that were appropriate for a manufacturing process had to be modified to
cater for a variety of organizations. With these changes in focus, the term ‗cost‘
accounting no longer adequately described the accounting function within an
organization. Hence, the terms of ‗management‘ or ‗managerial‘ accounting was
gradually adopted.
The first known textbook in management accounting emerged in 1950, written by
Vatter, and titled Managerial Accounting (Kelly and Pratt, 1994). Vatter argued that
33
management accounting has the purpose of supporting managers, not of reporting to
owners (Kelly and Pratt, 1994).
The changes from cost accounting to management accounting was also manifested
when The Institute of Cost and Works Accountants changed the name of its journal
from Cost Accounting to Management Accounting in 1965 and its own name to the
Institute of Cost and Management Accounting in 1972. In 1986 it received its royal
charter and became The Chartered Institute of Management Accountants (CIMA)
(Allot, 2000). In the United States the National Association of Cost Accountants
changed its name to the National Association of Accountants in 1958 (Scapens, 1991, p.
9). This organization became the Institute of Management Accountants (IMA) in 1991.
Overall it can be seen that after nineteenth century the focus changed from cost
accounting to an emphasis on the provision of information that was appropriate to the
needs of managers.
2.2.1 The changing focus and innovation of management accounting
According to IFAC (1998, p.84), the evolution of management accounting has consisted
of four main stages. The trends of management accounting from prior 1950 to by 1995
are grouped as follows:
1. Stage 1: Prior to 1950
The focus was on cost determination and financial control, through the use of
budgeting and cost accounting technologies;

34
2. Stage 2: By 1965
The focus had shifted to the provision of information for management planning
and control, through the use of such technologies as decision analysis and
responsibility accounting;
3. Stage 3: By 1985
Attention was focused on the reduction of waste in resources used in business
processes, through the use of process analysis and cost management technologies;
4. Stage 4 : By 1995
Attention had shifted to the generation or creation of value through the effective
use of resources, through the use of technologies which examine the drivers of
customer value, shareholder value, and organizational innovation.
The change in every stage represents adaptation to a new environment faced by
organizations in which the organization has had to reshape and reformulate its strategies
in order to remain competitive in the market. Figure 2.1 below shows the transformation
stages diagrammatically.
Figure 2.1: Evolution of Management Accounting.
Source (IFAC 1998) p. 85
35
Overall management accounting has been changing from a narrow to a broader
function. An additional catalyst for this evolution has been criticism of the role of
management accounting and MAPs by academics (Hutaibat, 2005). According to
Kaplan (1994) the seeds of the revolution of management accounting theory and
practice can be seen in many publications which have identified the obsolescence or fall
in usefulness of a number of MAPs including costing and performance measurement.
The primary contention of these critiques was that management accounting fails to
respond to developments in the technological and competitive environment, with the
result that internal accounting information is frequently inaccurate and misleading
(Drury et al., 1993). For example, Johnson and Kaplan (1987) in their book ‗Relevance
Lost: The Rise and Fall of Management Accounting‘ claimed that as management
accounting had not changed since the early part of the twentieth century, it had lost
relevance by failing to provide relevant information for managerial needs. Later, Drury
(1996, p.2) provided the following comprehensive summary of the main criticisms of
current conventional MAPs:
1. Conventional management accounting does not meet the needs of today's
manufacturing and competitive environment;
2. Traditional product costing systems provide misleading information for decision-
making purposes;
3. MAPs follow, and have become subservient to, financial accounting requirements;
4. Management accounting focuses almost entirely on internal activities and relatively
little attention is given to the external environment in which the business operates.
Since the emergence of those criticisms, innovations in management accounting have
been made and there has been considerable change in MAPs (Abdel-Kader and Luther,
36
2006 and Ittner and Larcker, 2001). According to Preda and Watts (2004) recent
innovations in management accounting have extended the descriptive objects, the causal
variability factors, and the time periods of analysis, while, at the same time, influencing
organizational applications. The innovations provide more relevant, accurate and
appropriate information within a proper time period to reconcile the inherent
deficiencies contained in traditional management accounting techniques (Preda and
Watts, 2004). The examples of contemporary accounting innovations include:
- Value-based Management (VBM)
- Non-financial performance measurement systems
- Total Quality Management (TQM)
- Balanced Scorecard (BSC)
- Activity-based Costing (ABC)
- Activity-based Management (ABM)
- Strategic Management Accounting (SMA)
These innovations have led to management accounting gradually developing away from
the conventional concepts of formal, internal and financial information to the use of
broader scope of information such as informal, external and non-financial information
(Chenhall, 2003) that are now applied to a greater or lesser degree in many different
organizations. Not only that, the new innovations in MAPs have also changed the
narrow view of accountants from ‗bean-counters‘ to more active participants in
formulating and implementing business strategy, and have been accompanied by a shift
in the collection, reporting and analysis of routine financial information from
accountants to non-financial line managers (Preda and Watts, 2004).

37
2.2.2 The changing roles of the management accountant
Research has highlighted these significant changes in roles of management accountants.
For example Siegel and Sorensen (1999) suggested the rate of change in the
management accountant role had been more rapid between 1995 and 1999 than over the
preceding five year period, and the respondents believed that the rate of change would
continue to increase over the next three years. Similarly Burns et al. (1999) concluded
that in some businesses, accountants are changing their job titles, becoming ‗business
analysts‘ instead of ‗corporate controllers‘. The changing roles of management
accountants are also confirmed by some studies for example Russel et al. (1999); and
Zarowin (1997). Lobo et al. (2004) summarise the roles or functions of a management
accountant as follows.
Business analyst
Strategy formulator
Internal consultant or advisor (or business partner)
Change agent or supporter of change
Information provider (or knowledge worker the hub for data)
Leader of and/or participator in cross-functional teams
Designer and manager of information systems
Designer and controller of performance measurement systems
Teacher, guide or educator
Interpreter and manager of complexity.
The following section discusses the evolution in definitions of management accounting
based on selected professional bodies.
38
2.2.3 Definition of management accounting
Scapens (1991) stated that there is no generally agreed definition of management
accounting. Various definition are available; but some are too general to provide a
suitable structure, while others simply emphasis a particular research approach
(Scapens, 1991). The evolution of management accounting will now be explored in
terms of the changing definitions from three major accounting bodies: The Institute of
Management Accountants (IMA); the Chartered Institute of Management Accounting
(CIMA); and the International Federation of Accountants (IFAC).
2.2.3.1 Institute of Management Accountant (IMA)
The Institute of Management Accountants (IMA) has provided definitions of
management accounting that reflect changing demands by businesses for accounting
information. The initial definition of management accounting by IMA (IMA, 1981, p.
1), defined management accounting as “…the process of identification, measurement,
accumulation, analysis, preparation, interpretation, and communication of financial
information used by management to plan, evaluate, and control an organization and to
assure appropriate use of and accountability for its resources. Management accounting
also comprises the preparation of financial reports for non-management groups such as
shareholders, creditors, regulatory agencies, and tax authorities.” But more recently,
the definition (IMA, 2008, p. 1) was “a profession that involves partnering in
management decision making, devising planning and performance management
systems, and providing expertise in financial reporting and control to assist
management in the formulation and implementation of an organization’s strategy”. The
change in definitions show the role of management accountants evolving from a
transaction and compliance orientation (as reflected in the 1981 definition) to one of a
strategic business partner that helps the organisations in corporate performance
39
management, planning and budgeting; corporate governance processes, risk
management, internal control, and financial reporting at a time of great change; and
experts in cost management methods (IMA, 2008).
2.2.3.2 Chartered Institute of Management Accounting (CIMA)
The Chartered Institute of Management Accounting (CIMA) is an international
professional body based in the UK. The definition of management accounting by CIMA
(CIMA, 1987, p. 10), defined management accounting as the provision of information
required by management for such purposes as: the formulation of policies; planning and
controlling activities of the enterprise; decision taking on alternative courses of action;
disclosure to those external to the entity (shareholders and others); disclosure to
employees; and safeguarding assets. This information provision ensures that there is
effective:
(a) Formulation of plans to meet objectives (long term planning)
(b) Formulation of short term operation plans (budgeting/profit planning)
(c) Recording of actual transactions (financial accounting and cost accounting)
(d) Corrective action to bring future actual transactions into line (financial control)
(e) Obtaining and controlling finance (treasureship)
(f) Reviewing and reporting on systems and operations (internal audit, management
audit).
CIMA‘s revised version of management accounting terminology (CIMA, 2005 p. 18)
showed that management accounting had moved forward to a broader role. Management
accounting is defined as the application of the principles of accounting and financial
management to create, protect, preserve and increase value for the stakeholders of for-
profit and non-profit enterprises in the public and private sectors.
40
CIMA (2005) further elaborated the definition of management accounting to emphasise
that management accounting is an integral part of management, which requires the
identification, generation, presentation, interpretation and use of relevant information to:
1. Inform strategic decisions and formulate business strategy
2. Plan long, medium and short term operations
3. Determine capital structure and fund that structure
4. Design reward strategies for executives and shareholders
5. Inform operational decisions
6. Control operations and ensure the efficient use of resources
7. Measure and report financial and non-financial performance to management and
other stakeholders
8. Safeguard tangible and intangible assets
9. Implement corporate governance procedures, risk management and internal
controls.
CIMA‘s changed definitions show that management accounting has moved closer to
senior management concerns with a focus on efficiency, strategic planning and value
creation.
2.2.3.3 International Federation of Accountants (IFACs)
IFAC (1989,) in IFAC (1998, p.99) defined management accounting as “the process of
identification, measurement, accumulation, analysis, preparation, interpretation, and
communication of information (both financial and operating) used by management to
plan, evaluate, and control within an organization and to assure use of and
accountability for its resources” IFAC (1989) - A definition which is grounded in
traditional ideas of the subject. However, only nine years later the scope had widened
41
considerably and Revised International Management Accounting Practise 1 (IFAC,
1998, p. 86) issued by the Financial Management and Management Accounting
Committee (FMAC) of the International Federation of Accountants (IFAC) viewed
management accounting as an activity that is interwoven in the management processes
of all organizations. Management accounting refers to that part of the management
process which is focused on adding value to organizations by attaining the effective use
of resources by people, in dynamic and competitive contexts. This practice is also
viewed as the outcome of the four stages of evolution as discussed in section 2.2.1.
2.2.3.4 Summary
Overall all the definitions discussed have over time moved away from a narrow
traditional managerial perspective to an emphasis on assisting the senior management
activities including value creation. The following section discusses the factors that drive
change in MAPs.
2.3 Drivers of change in management accounting
The previous sections identified considerable changes in MAPs over the past few
decades. The changes reflect in part emerge from criticisms of management accounting
but the fundamental drivers of change can probably be ascribed to environmental
factors. Burns and Scapens (2000) argued that probably the most frequently cited of
driver change of management accounting was the competitive economic situation of the
1990s, and especially global competition. When organizations face considerable
environmental change, the traditional management accounting role, comprising formal
controls and reporting procedures is simply not adequate to meet these new demands
hence managerial accounting systems need to be updated and modified accordingly to
accommodate the new, different informational needs (Allot, 2000).
42
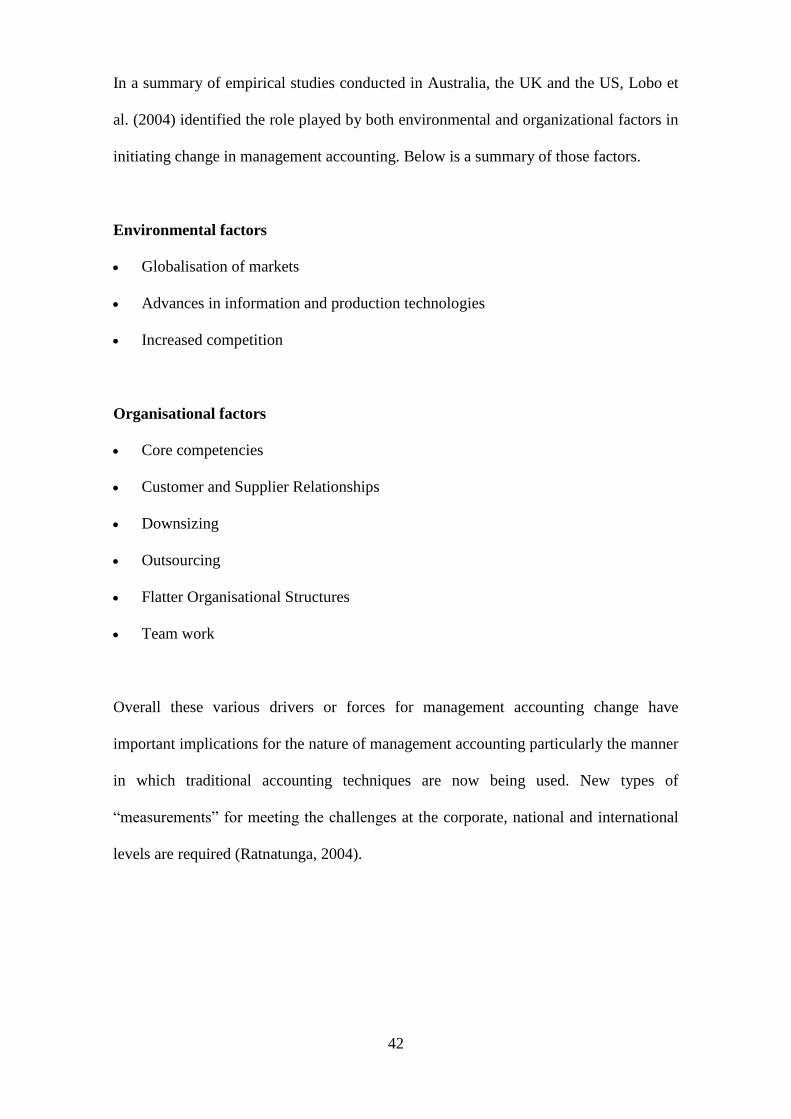
In a summary of empirical studies conducted in Australia, the UK and the US, Lobo et
al. (2004) identified the role played by both environmental and organizational factors in
initiating change in management accounting. Below is a summary of those factors.
Environmental factors
Globalisation of markets
Advances in information and production technologies
Increased competition
Organisational factors
Core competencies
Customer and Supplier Relationships
Downsizing
Outsourcing
Flatter Organisational Structures
Team work
Overall these various drivers or forces for management accounting change have
important implications for the nature of management accounting particularly the manner
in which traditional accounting techniques are now being used. New types of
―measurements‖ for meeting the challenges at the corporate, national and international
levels are required (Ratnatunga, 2004).
43
2.4 Summary
In general the discipline of management accounting has seen changes in focus,
techniques, functions and roles, in response to criticisms that the profession had failed
to adapt to changes in business and economic environment. This discipline has also
evolved due to the change in the requirements in competitive markets and economic
conditions. A constant theme in management accounting is that its role is to provide
what managers need and want (Allot et al., 2000). This business centred approach has
meant that management accounting has been willing to adopt techniques and
approaches developed by other disciplines and move into any area that offers a means of
satisfying management priorities (Allot et al., 2000). As such it has moved beyond its
traditional concern with a narrow range of numbers to incorporate wider issues in
management. Management accounting in the future will be expected to adapt and
employ more innovative techniques in order to keep pace with the hyper competitive
environment. Management accountants must face up to the demands and challenges of
more directly contributing to the decision process as a value adding business partner,
hence the reinvented management accountant needs a more broadly developed
knowledge base including areas such as operations, product and process technology,
systems, marketing and strategic management (Parker, 2002).
This chapter contributes to the thesis by providing an understanding of the history and
development of management accounting and its changing roles and practices. The
significant changes in management accounting discussed reflect the drive for change
from criticisms of traditional management accounting, the current environment within
which the firm competes and various organisational factors.
44
Chapter 3
Small and medium-sized enterprises (SMEs) in Malaysia
3.1 Introduction
The thesis is focused on MAPs in Malaysian SMEs. Therefore this chapter aims to
demonstrate the importance of SMEs to Malaysia as a means of justifying the
importance of researching them. The chapter seeks to establish a definition of
Malaysian SMEs which will be detailed in subsection 3.4 of this chapter, discusses the
importance of SMEs to the Malaysian economy and in particular emphasizes the
significance of the SME manufacturing sector. The chapter also discusses the increasing
interest shown by Malaysian researchers in Malaysian SMEs and considers whether
there is a research gap with respect to knowledge of the use of MAPs by Malaysian
SMEs.
3.2 The importance of SMEs
SMEs constitute a large number of establishments in most developed and developing
economies around the world. On average, this sector comprises more than 90 per cent of
the total number of businesses either in developed countries or in developing countries.
For example, in developed countries such as the U.K. and the U.S., SMEs represent
more than 95 per cent of all businesses in each country (see Wichmann, 1983; Mitchell
et. al, 1998). Similarly, in developing countries such as Malaysia and Indonesia, SMEs
account for more than 90 per cent of all businesses (see DOS,1 2005; Tambunan, 2008).
Given the large numbers of SMEs in various countries, it might be anticipated that
SMEs will contribute various advantages for these countries. Fan (2003) highlighted the
advantages of SMEs that are generally accepted worldwide as including;
1 The Department of Statistics
45
Engine of growth: SMEs contribute to the growth by being the largest provider of
employment and as a source of technological innovation and new products.
Essential for a competitive and efficient market: A large number of SMEs creates
competitive market pressure. This sector also plays a major role in removing
regional and sector imbalances in the economy and as subcontractors in the
downsizing, privatization and restructuring of large companies.
Critical for poverty reduction: SMEs play a particularly important role in
developing countries where poverty is most severe. SMEs are sometimes the only
source of employment in poor regions and rural areas and this sector is the only
source of income for many poor.
Therefore given the above various advantages, the SME sector has attracted interest
from policy makers/in the governments of countries who seek to develop and strengthen
this sector in order to help national growth. The following sub section details the
contribution of SMEs in Malaysia.
3.2.1 The contribution of Malaysian SMEs
In Malaysia, SMEs account for 99 per cent of all businesses (DOS, 2005). These firms
have historically been the main players in domestic economic activities and their impact
has been progressively developing from year to year (NSDC,2 2006). As such this sector
has significantly contributed to the growth of the economy in many ways.
First, this sector is a key agent for industrial development through its role in promoting
domestic-led growth in new and existing industries (Aris, 2006). This can be seen for
example, from its role as a key supplier and service provider to large corporations,
2 Malaysian National SMEs Development Council
46
including multinational and transnational corporations (UNDP,3 2007). Besides, it plays
a central role between industries through inter-firm backward and forward linkages
(CBM, 20054 ).
Secondly, Malaysian SMEs account for more than half of the total employment in
Malaysia (DOS, 2005). Hence it has generated sources of primary and secondary
income for many Malaysian households. SMEs have also alleviated poverty and
decreased income inequality within Malaysian households. This is indicated by the
decrease in the poverty rate in Malaysia from 49 per cent in the 1970s to less than 5 per
cent in 2007 (UNDP, 2007).
Thirdly Malaysian SMEs have substantially contributed to the Malaysian gross
domestic product (GDP) and total exports. According to the DOS (2005), SMEs
contributed 32 per cent of the total GDP and 19 per cent of the total exports. The
involvement of SMEs in export activities indicates that SMEs are not only participating
in the domestic market but can also compete effectively in the international
marketplace. In consequence, a strong SME sector is also a factor in attracting foreign
direct investment (FDI) (CBM, 2005).
Fourthly, the SMEs sector has made the economy more resilient. Aris (2006) observed
that the potential of Malaysian SMEs to strengthen the resilience of the economy in a
competitive and challenging environment is inarguable. The nature of SMEs is that they
are heavy users of domestic resources, both natural and human, and also act as providers
of broad-based growth that are able to be resilient in the face of economic downturns
and consequently play a major role in a well-balanced economy. For example, during
3 The United Nations Development Program, 2007
4 Central Bank of Malaysia

47
the unstable times from 1996 to 2005 when the Malaysian economy faced several
events such as the Asian financial crisis, the bombing of the World Trade Center in the
U.S. and the SARS outbreak, the SME manufacturing sector proved its resilience in the
recovery that followed these events (DOS, 2005).
Lastly, SMEs contribute to the encouragement of entrepreneurship in the country. The
majority of SMEs are scattered widely throughout rural areas and play an important role
in increasing the number of entrepreneurs, especially women. The NSDC (2006)
claimed that SMEs can stimulate private ownership and entrepreneurial skills and can
also act as incubators for developing domestic enterprises into larger corporations.
Realizing this potential, the government of Malaysia provides various programmes to
nurture entrepreneurship in the country, such as the setting up of technology incubators
and ongoing entrepreneurship programmes (NSDC, 2006).
Overall, it has been demonstrated that the SME sector has significantly contributed to
economic development for Malaysia. In the future, domestic SMEs are expected to be
an important driver of growth as Malaysia goes forward to achieve developed nation
status. The next section describes the general development of SMEs in Malaysia.
3.3 The development of SMEs
3.3.1 The Malaysian economy
The Malaysian economy started developing before the fourteenth century when it was
known as the Malay Peninsula or Malaya and was a centre for the trading of several
commodities, especially porcelain and spices. In the seventeenth century, the economy
of Malaya was strengthened by producing three of the world‘s widely demanded
commodities: tin, rubber and palm oil. The Malaysian economy continued to be
48
commodity-based after independence in 1957 until the 1970s. During that time, the
activities of SMEs were concentrated in agriculture and small services such as
wholesaling, retailing and restaurants (Economic Planning Unit, 2009). After the 1970s,
Malaysia experienced strong economic growth as the country committed itself to a
transition from a reliance on mining and agriculture towards developing manufacturing
with the ultimate objective of transforming itself from a commodity-based economy to a
manufacturing-based economy (Aris, 2007). The manufacturing sector was responsible
for an increase in Malaysian exports particularly of electrical and electronic products
and it has been the key factor in sustained rapid economic growth.5 This transformation
has also led to a growth in the number of SMEs in the manufacturing sector. However
during this time, the development strategy for SMEs still strongly emphasized the
development of domestic market-oriented, small-scale industries and in particular, the
creation of the bumiputra commercial and industrial community (NSDC, 2005).
After the mid 1990s, the role of SMEs in Malaysian economy became more significant.
After the Asian financial crisis in 1997–1998, and the impact of globalization, SMEs
were targeted as a mechanism for generating domestic-led investment, stimulating
economic expansion and increasing the job market in the country (Aris, 2007). This
strategy arose because, during the crisis, many foreign investors withdrew their
investments and relocated to new destinations that were more profitable, often because
they offered lower labour costs, and Malaysia consequently learned not to be overly
dependent on foreign direct investment (FDI) to stimulate economic development (Aris,
2007). Since this time, SMEs have been transformed and strengthened as a means to
encourage domestic investment and also to provide a critical linkage in the development
of a broad-based globally competitive industrial sector.
5 The United Nations Development Program 2007
49
With the support of the Malaysian government, the number of SMEs has grown
increasingly across various activities. Malaysian SMEs are now not only focused on
manufacturing and agriculture activities but are also widely involved in service
activities. The Malaysian economy faced a continuous global economic downturn in
2008 to 2010 but fared better than expected due to swift and aggressive policy to ensure
the stabilisation of the economy and a quick economy recovery (NSDC, 2010). The
SMEs sector also proved to be resilient in the changing business environment aided by
massive support from the Malaysian government. The following section discusses the
role of Malaysian government in ensuring the success of the SME sector.
3.3.2 The role of the Malaysian government
The role of the Malaysian Government is believed to be one of the main reasons for the
growth of SMEs in Malaysia. The Government believes that the development of SMEs
forms an integral component of initiatives for Malaysia to achieve sustainable economic
growth and developed country status by 2020. The remarkable involvement of the
Malaysian government in SMEs can be witnessed since mid 1990s. The first agency
that was initiated by the government to support SMEs was the Small and Medium
Industries Development Corporation (SMIDEC) which was established in 1996 to serve
as a national focal point for the overall development programmes for SMEs in Malaysia
(SMIDEC, 2009). Its responsibilities included handling, supervising and streamlining
loans, incubator premises, vendor development programmes, entrepreneurship training
and assistance with the use of technology. The SMIDEC programmes helped to reduce
bureaucratic delays for entrepreneurs and to increase their participation in the
programmes (NPC6, 2008). The commitment of the Malaysian Government to the SME
sector is also reflected in the national development agenda. The Government has
6 National Productivity Corporation (Malaysia)
50
formulated policies and launched programmes under the Malaysia Plan (MP) and
Industrial Master Plan (IMP), which are developed every 5 years and 10 years,
respectively. Prior to the Seventh Malaysia Plan (1996–2000) (7MP) period, the
development strategy for SMEs emphasized the development of domestic market-
oriented, small-scale industries. During the 7MP, the approach switched to promoting
those SMEs that exhibit strong growth potential and enhancing the capacity of SMEs to
be competitive and export-oriented (SMIDEC, 2005). During 8MP (2000-2006) and
9MP (2006-2010) SMEs have been trained to adopt Information and Communication
Technology (ICT), have greater market access and linkages with large firms, and to be
more innovative and technologically strong. One major development during 8MP, was
the establishments of the Malaysian National SMEs Development Council (NSDC) in
June 2004 in order to develop and deliver a strategy for the future of SMEs. This NSDC
was chaired by the Prime Minister of Malaysia making a clear statement of the
government‘s systematic approach to building up a strong SME sector.7 The Council
was to coordinate inter-Ministry and Agency efforts on SME development, as well as
provide a policy strategic framework for the industry going forward. Among the
initiatives planned for SMEs under NSDC were: the formulation of targeted strategies
for the development of SMEs across all sectors; the adoption of a specific and standard
definition of an SME according to economic activity; the establishment and
maintenance of a comprehensive national SME database; and the expansion of
development support programmes and facilities to enhance access by SMEs to financing
and markets for export (CBM, 2006). Financial support programmes provided by the
government led SMEs to enjoy a high level of financing from the financial system. For
example, in 2006, banking institutions approved loans of RM39.6 billion to more than
84,000 SME accounts, an increase of 10.7% from the previous year. Meanwhile,
7 smibusinessdirectory.com.my, 1 September 2009
51
outstanding loans to SMEs expanded by 4.2% on an annual basis to RM104.6 billion at
the end of 2006, accounting for 45% of total outstanding business loans (Abdul Ghani,
2007). The strategic plan for SMEs is still continues, with the Ninth Malaysia Plan
2006–2010 (9MP) and the Third Industrial Master Plan 2006–2015 (IMP3). Both the
9MP and IMP3 outline key strategies and initiatives to help SMEs move up the value
chain, with a special focus on information and communications technology (ICT),
capacity building and enhanced productivity (NSDC, 2007).
In 2008, the Government announced the official handover of the NSDC to the Small
and Medium Industries Development Corporation (SMIDEC). SMIDEC, which had
been rebranded as the SME Central Coordinating Agency or SME Corp., aims to
develop a competitive and resilient SME sector to overcome the economic crisis
(NSDC, 2010).
3.3.3 Opportunities and challenges for SMEs
To compete successfully in the domestic and global markets, SMEs are encouraged to
capitalize on outward investment opportunities, adopt best business practices and be
more resilient in the face of greater competition. SMEs have ventured into newly
identified sources of economic wealth. Among some of the new areas are halal products
and services, franchising and ICT (NSDC, 2007).
Since human capital development is expected to spur the development of business start-
ups further and increase the supply of skilled and knowledge workers, SMEs need to
improve on capacity and capability by investing in appropriate technologies and
intensifying the ongoing training of human resources (NSDC, 2007).
52
In 2007, 135 programmes were planned to build the capacity and capability of SMEs,
with a total financial commitment of RM945 million. Highlights of key expected
outcomes include: the provision of entrepreneur development in terms of training about
2,000 entrepreneurs including 200 technopreneurs; the organization of 10 international
conferences; 15 mentoring programmes; 20 workshops; and training 200 entrepreneurs
in financial management skills through the Accounting Training Programme run by the
Ministry of Agriculture and Agro-based Industries (MOA).
The Asian Productivity Organization (APO) Best Practices Network developed a set of
key performance indicators (KPIs) for SMEs to generate, share and transfer knowledge
on best practices that will assist organizations in enhancing productivity and
competitiveness. The survey compared and integrated the performance of SMEs based
on selected KPIs, which included:
• Organizational productivity;
• Manufacturing productivity;
• Human capital performance;
• Business performance; and
• Financial performance.
Another area of importance is financial management knowledge. SMEs need to be
better equipped to understand their finances and be aware of the array of financing
options available (NSDC, 2007) In response, selected financial institutions offer basic
finance training programmes for SMEs, which aim to enhance their financial
management capabilities so they can manage their finances better. Likewise, new tailor-
made training programmes like MOA‘s RM2 million Program Latihan Perakaunan

53
(Accounting Training Programme) will be run in collaboration with banks to offer 200
agro entrepreneurs advice on basic accounting methods.8
In recognizing and promoting the use of best practices in management accounting
amongst organizations in Malaysia, the National Awards for Management Accounting
(NAfMA) are organized by the Malaysia Institute of Accountants and the Chartered
Institute of Management Accountants Malaysia. The award is open to large companies
as well as to Malaysian SMEs. This event highlights the importance of MAPs to
business enterprises.
SMEs face many economic challenges that can affect their survival. Among the
challenge for SMEs in Malaysia is the global financial crisis. In 2009, the global
economy experienced financial crisis that led to a significant drop in private sector
demand. The Asian economies, particularly those with a higher degree of trade
openness were badly affected. The manufacturing sector was among the worst affected
(NSDC, 2010). The global financial crisis had also a severe impact on SMEs where the
tightening of credit resulting the SMEs to struggle with insufficient working capital. In
response, the Malaysian government introduced financial stimuli to help protect SMEs
from the full brunt of the global financial crisis and place them on the track to recovery.
Other issues faced by Malaysian SMEs are increase in raw material costs, overhead cost
and cash flow problems particularly in the manufacturing sector (NSDC, 2010). Despite
these challenges, SMEs are still keen to invest and expand their operations in the
country. The gradual removal of market distortions and proper functioning of markets
would incentivise SMEs to move up the value chain and be better prepared to face
globalisation and liberalisation and become more competitive.
8 www.smeinfo.com, 2007
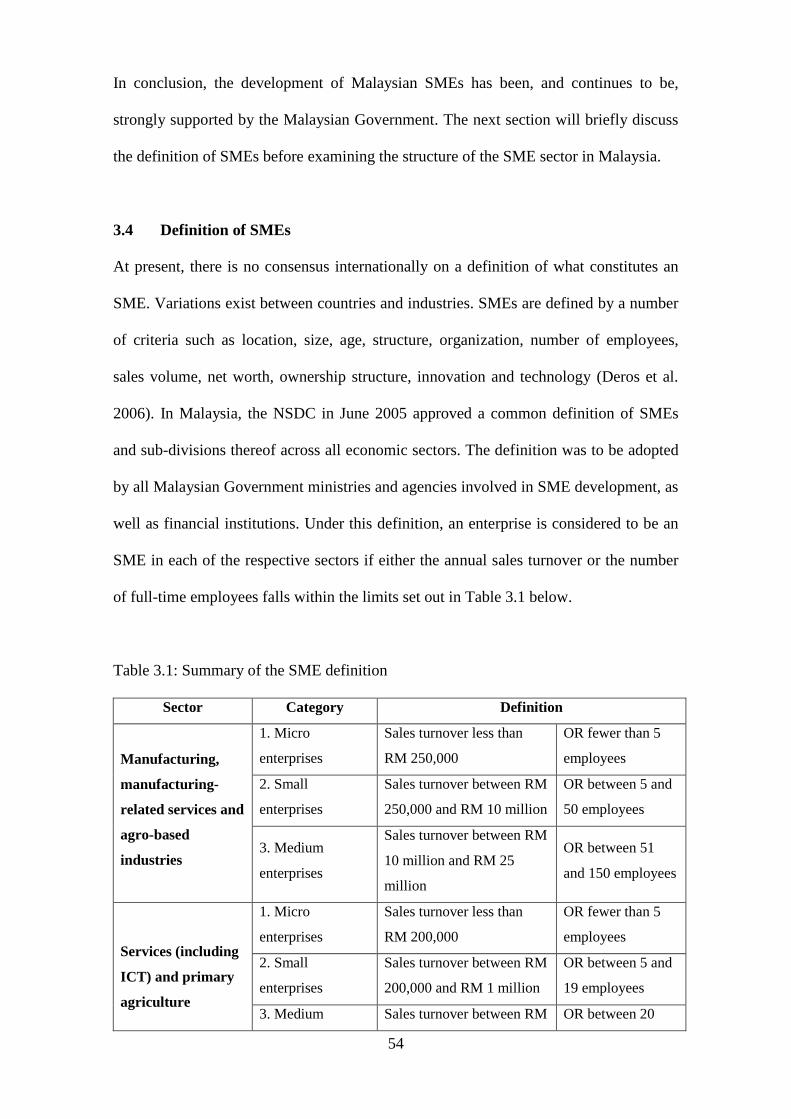
54
In conclusion, the development of Malaysian SMEs has been, and continues to be,
strongly supported by the Malaysian Government. The next section will briefly discuss
the definition of SMEs before examining the structure of the SME sector in Malaysia.
3.4 Definition of SMEs
At present, there is no consensus internationally on a definition of what constitutes an
SME. Variations exist between countries and industries. SMEs are defined by a number
of criteria such as location, size, age, structure, organization, number of employees,
sales volume, net worth, ownership structure, innovation and technology (Deros et al.
2006). In Malaysia, the NSDC in June 2005 approved a common definition of SMEs
and sub-divisions thereof across all economic sectors. The definition was to be adopted
by all Malaysian Government ministries and agencies involved in SME development, as
well as financial institutions. Under this definition, an enterprise is considered to be an
SME in each of the respective sectors if either the annual sales turnover or the number
of full-time employees falls within the limits set out in Table 3.1 below.
Table 3.1: Summary of the SME definition
Sector Category Definition
Manufacturing,
manufacturing-
related services and
agro-based
industries
1. Micro
enterprises
Sales turnover less than
RM 250,000
OR fewer than 5
employees
2. Small
enterprises
Sales turnover between RM
250,000 and RM 10 million
OR between 5 and
50 employees
3. Medium
enterprises
Sales turnover between RM
10 million and RM 25
million
OR between 51
and 150 employees
Services (including
ICT) and primary
agriculture
1. Micro
enterprises
Sales turnover less than
RM 200,000
OR fewer than 5
employees
2. Small
enterprises
Sales turnover between RM
200,000 and RM 1 million
OR between 5 and
19 employees
3. Medium Sales turnover between RM OR between 20

55
enterprises 1 million and RM 5 million and 50 employees
Source: SMIDEC http://www.smidec.gov.my . For details of the SME definition, please refer to glossary.
Table 3.1 not only provides separate definitions for SMEs but also recognizes that some
small enterprises are very small and therefore separately identifies the category of micro
enterprises. Micro enterprises through this recognition have access to the same business
facilities provided by the government for slightly larger businesses. According to the
NSDC (2005), these definitions will facilitate the identification of SMEs in the various
sectors and sub-sectors, which will enable more effective targeting of SMEs with
respect to the design of future development policies and support programmes and the
provision of technical and financial assistance. The next section discusses the
characteristics of SMEs in Malaysia.
3.5 An overview of SMEs and their key sectors
This section compares the three main sectors in which Malaysian SMEs operate. The
data used in this section arises mainly from the census conducted by Department of
Statistics in Malaysia in 2003, which was reported in 2005. This survey was a
pioneering nationwide census of establishments and enterprises in Malaysia, which
aimed to obtain information on the status and performance of SMEs. The following
section describes some of the important data on SMEs.
3.5.1 Number of establishments
The results of the census as set out in Table 3.2 show that the overwhelming majority of
business establishments in Malaysia are SMEs with large companies constituting less
than 1 per cent of business establishments. This preponderance indicates that SMEs
occupy an important place in Malaysian business activities.
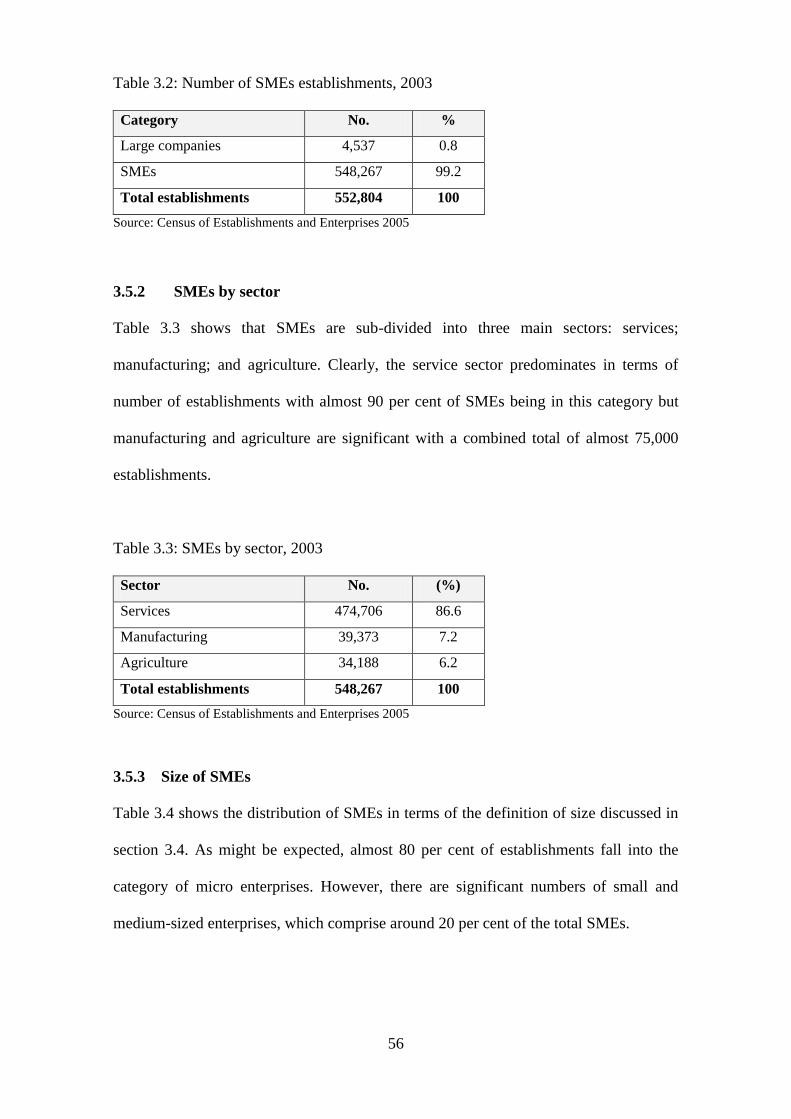
56
Table 3.2: Number of SMEs establishments, 2003
Category No. %
Large companies 4,537 0.8
SMEs 548,267 99.2
Total establishments 552,804 100
Source: Census of Establishments and Enterprises 2005
3.5.2 SMEs by sector
Table 3.3 shows that SMEs are sub-divided into three main sectors: services;
manufacturing; and agriculture. Clearly, the service sector predominates in terms of
number of establishments with almost 90 per cent of SMEs being in this category but
manufacturing and agriculture are significant with a combined total of almost 75,000
establishments.
Table 3.3: SMEs by sector, 2003
Sector No. (%)
Services 474,706 86.6
Manufacturing 39,373 7.2
Agriculture 34,188 6.2
Total establishments 548,267 100
Source: Census of Establishments and Enterprises 2005
3.5.3 Size of SMEs
Table 3.4 shows the distribution of SMEs in terms of the definition of size discussed in
section 3.4. As might be expected, almost 80 per cent of establishments fall into the
category of micro enterprises. However, there are significant numbers of small and
medium-sized enterprises, which comprise around 20 per cent of the total SMEs.
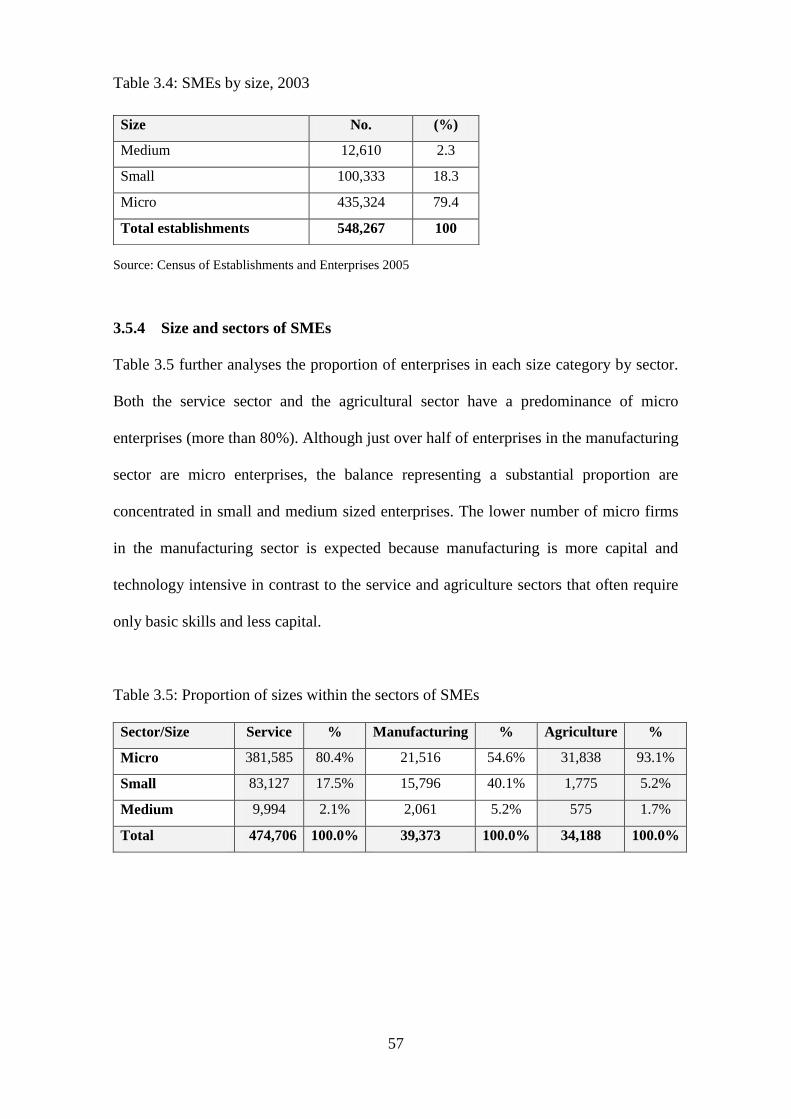
57
Table 3.4: SMEs by size, 2003
Source: Census of Establishments and Enterprises 2005
3.5.4 Size and sectors of SMEs
Table 3.5 further analyses the proportion of enterprises in each size category by sector.
Both the service sector and the agricultural sector have a predominance of micro
enterprises (more than 80%). Although just over half of enterprises in the manufacturing
sector are micro enterprises, the balance representing a substantial proportion are
concentrated in small and medium sized enterprises. The lower number of micro firms
in the manufacturing sector is expected because manufacturing is more capital and
technology intensive in contrast to the service and agriculture sectors that often require
only basic skills and less capital.
Table 3.5: Proportion of sizes within the sectors of SMEs
Sector/Size Service % Manufacturing % Agriculture %
Micro 381,585 80.4% 21,516 54.6% 31,838 93.1%
Small 83,127 17.5% 15,796 40.1% 1,775 5.2%
Medium 9,994 2.1% 2,061 5.2% 575 1.7%
Total 474,706 100.0% 39,373 100.0% 34,188 100.0%
Size No. (%)
Medium 12,610 2.3
Small 100,333 18.3
Micro 435,324 79.4
Total establishments 548,267 100

58
3.5.5 SMEs activities
This section briefly highlights the activities of SMEs in three main sectors. The section
starts with the data in the service sector.
3.5.5.1 Activities of the service sector
Table 3.6 indicates that SMEs in the service sector are involved in a wide range of
activities, from wholesale and retail trades, hotels, restaurants, transport and
communication to finance. Retailers dominate this sector, accounting for nearly half of
the total establishments.
Table 3.6: SMEs by service sub-sector, 2003
Sub-sector No. %
Hotels 2,563 0.5
Education 7,855 1.7
Health9 7,964 1.7
Professional 13,857 2.9
Transport and communications 30,766 6.5
Computer services 1,096 0.2
Telecommunication services 71 0.01
Real estate activities 9,318 2
Business/management consultancy 8,967 1.9
Finance 19,590 4.1
Wholesale 43,012 9.1
Retail 220,147 46.4
Restaurants 67,558 14.2
Other services10 41,942 8.8
Total 474,706 100
9 Including hospital, medical, dental and veterinary services, homeopathy and foot reflexology.
10 Including rental services, advertising, research and development, business activities (such as labour recruitment,
cleaning of buildings, packaging services and duplication services), recreation, cultural and sporting activities
(such as motion picture projection and creation clubs) and other service activities (such as hairdressing, beauty and
funeral services).

59
The predominance of retail and restaurant businesses is consistent with the high
proportion of micro enterprises.
3.5.5.2 Activities of the agriculture sector
Agriculture is the smallest sector of SMEs, accounting for less than 7 per cent of all
SMEs. Table 3.7 indicates that the majority of the SMEs in the agriculture sector are
largely involved in the growing of crops, market gardening and horticulture sub-sectors
with the fishing sub-sector coming second. Such enterprises will typically be family or
individual businesses, which again accounts for the preponderance of micro enterprises.
Table 3.7: SMEs by agriculture sub-sectors, 2003
Sub-sector No. %
Growing of crops, market gardening and horticulture 22,440 65.6
Fishing and service activities incidental to fishing 7,130 20.9
Livestock farming 2,388 7.0
Others 2,230 6.5
Total establishments 34,188 100.0
Source: Census of Establishments and Enterprises 2005
3.5.5.3 Activities of the manufacturing sector
Table 3.8 shows the main sub-sectors in the manufacturing sector. The largest sub-
sector in the SME manufacturing sector is textiles with 23 per cent of the total
establishments. Metal and non-metallic mineral products and food products and
beverages both account for over 15 per cent of the total establishments. In total these
sub-sectors account for 56% of establishments. The diversity of the sector is revealed by
the ‗Others‘ category, which accounts for 29 per cent of the manufacturing SMEs.
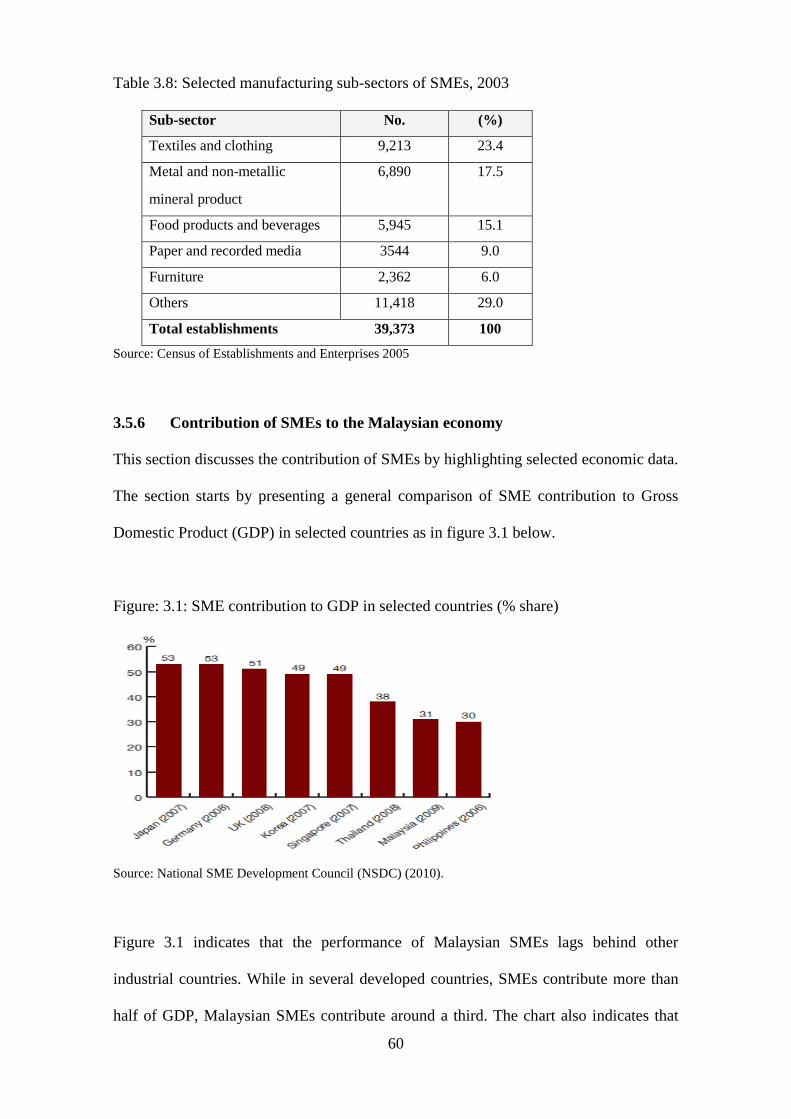
60
Table 3.8: Selected manufacturing sub-sectors of SMEs, 2003
Sub-sector No. (%)
Textiles and clothing 9,213 23.4
Metal and non-metallic 6,890 17.5
mineral product
Food products and beverages 5,945 15.1
Paper and recorded media 3544 9.0
Furniture 2,362 6.0
Others 11,418 29.0
Total establishments 39,373 100
Source: Census of Establishments and Enterprises 2005
3.5.6 Contribution of SMEs to the Malaysian economy
This section discusses the contribution of SMEs by highlighting selected economic data.
The section starts by presenting a general comparison of SME contribution to Gross
Domestic Product (GDP) in selected countries as in figure 3.1 below.
Figure: 3.1: SME contribution to GDP in selected countries (% share)
Source: National SME Development Council (NSDC) (2010).
Figure 3.1 indicates that the performance of Malaysian SMEs lags behind other
industrial countries. While in several developed countries, SMEs contribute more than
half of GDP, Malaysian SMEs contribute around a third. The chart also indicates that
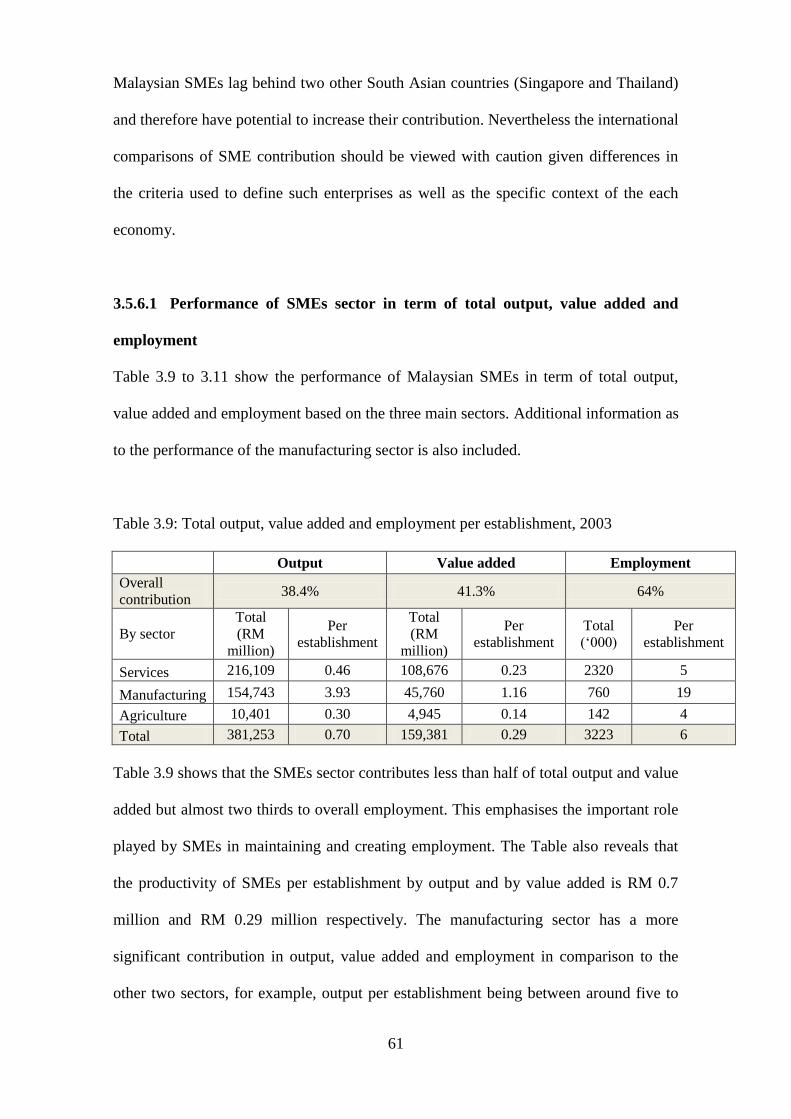
61
Malaysian SMEs lag behind two other South Asian countries (Singapore and Thailand)
and therefore have potential to increase their contribution. Nevertheless the international
comparisons of SME contribution should be viewed with caution given differences in
the criteria used to define such enterprises as well as the specific context of the each
economy.
3.5.6.1 Performance of SMEs sector in term of total output, value added and
employment
Table 3.9 to 3.11 show the performance of Malaysian SMEs in term of total output,
value added and employment based on the three main sectors. Additional information as
to the performance of the manufacturing sector is also included.
Table 3.9: Total output, value added and employment per establishment, 2003
Output Value added Employment
Overall
contribution 38.4% 41.3% 64%
By sector Total (RM
million)
Per
establishment
Total (RM
million)
Per
establishment Total (‗000)
Per
establishment
Services 216,109 0.46 108,676 0.23 2320 5
Manufacturing 154,743 3.93 45,760 1.16 760 19
Agriculture 10,401 0.30 4,945 0.14 142 4
Total 381,253 0.70 159,381 0.29 3223 6
Table 3.9 shows that the SMEs sector contributes less than half of total output and value
added but almost two thirds to overall employment. This emphasises the important role
played by SMEs in maintaining and creating employment. The Table also reveals that
the productivity of SMEs per establishment by output and by value added is RM 0.7
million and RM 0.29 million respectively. The manufacturing sector has a more
significant contribution in output, value added and employment in comparison to the
other two sectors, for example, output per establishment being between around five to
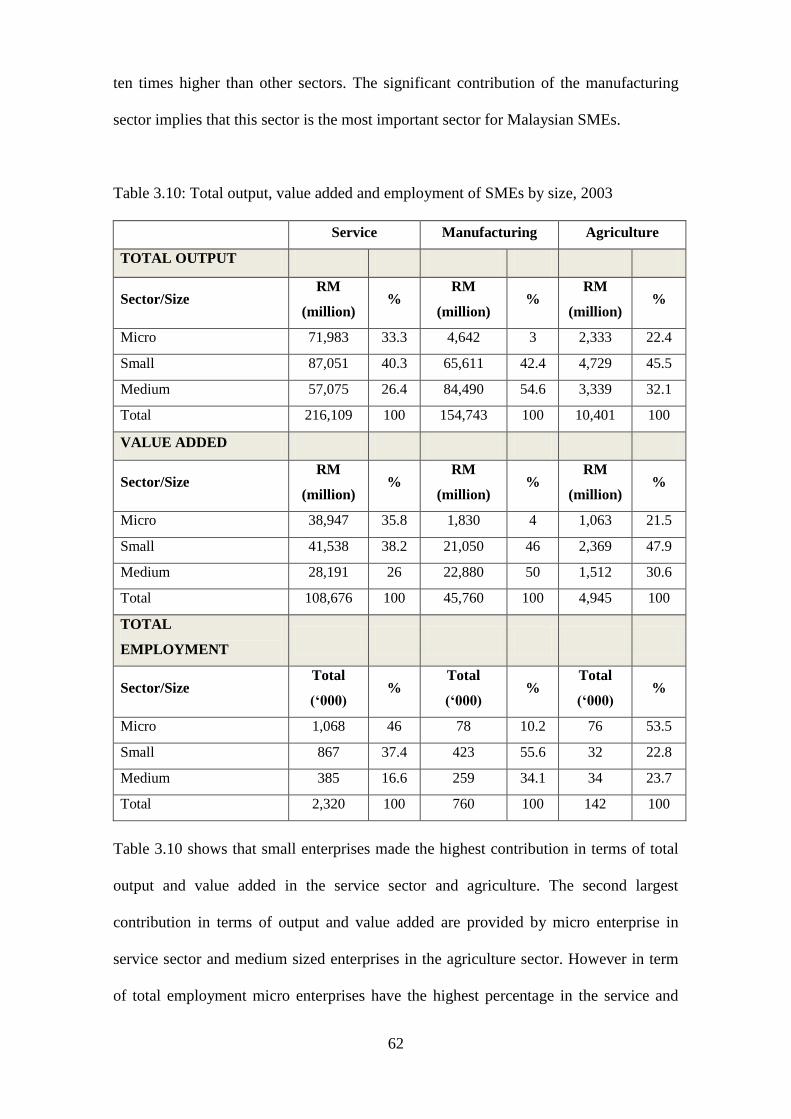
62
ten times higher than other sectors. The significant contribution of the manufacturing
sector implies that this sector is the most important sector for Malaysian SMEs.
Table 3.10: Total output, value added and employment of SMEs by size, 2003
Service Manufacturing Agriculture
TOTAL OUTPUT
Sector/Size RM
(million) %
RM
(million) %
RM
(million) %
Micro 71,983 33.3 4,642 3 2,333 22.4
Small 87,051 40.3 65,611 42.4 4,729 45.5
Medium 57,075 26.4 84,490 54.6 3,339 32.1
Total 216,109 100 154,743 100 10,401 100
VALUE ADDED
Sector/Size RM
(million) %
RM
(million) %
RM
(million) %
Micro 38,947 35.8 1,830 4 1,063 21.5
Small 41,538 38.2 21,050 46 2,369 47.9
Medium 28,191 26 22,880 50 1,512 30.6
Total 108,676 100 45,760 100 4,945 100
TOTAL
EMPLOYMENT
Sector/Size Total
(‘000) %
Total
(‘000) %
Total
(‘000) %
Micro 1,068 46 78 10.2 76 53.5
Small 867 37.4 423 55.6 32 22.8
Medium 385 16.6 259 34.1 34 23.7
Total 2,320 100 760 100 142 100
Table 3.10 shows that small enterprises made the highest contribution in terms of total
output and value added in the service sector and agriculture. The second largest
contribution in terms of output and value added are provided by micro enterprise in
service sector and medium sized enterprises in the agriculture sector. However in term
of total employment micro enterprises have the highest percentage in the service and

63
agriculture sector. In the agriculture sector, although micro enterprises create the largest
share of employment, productivity is largely generated by small and medium sized
enterprises.
Meanwhile in the manufacturing sector, medium sized enterprise activities have the
largest share of total output and value added. Micro enterprises made a much lower
contributions at no more than five per cent to total output and value added. In terms of
employment, small enterprises provide the biggest share for total employment in the
manufacturing sector followed by the medium category. Therefore it can be concluded
that small and medium sized enterprises make the major economic contribution in the
manufacturing sector.
Table 3.11 adds more information on the manufacturing sector in terms of the value of
assets employed.
Table 3.11: Value of assets in the manufacturing sector by size, 2003
SMEs Value of assets Per establishment
RM million % RM million
Micro 1,856 3.7 0.1
Small 20,320 40.0 1.3
Medium 28,623 56.3 13.9
Total 50,799 100 1.3
Source: Census of Establishments and Enterprises 2005
Table 3.11 shows the value of assets per establishment in the manufacturing sectors.
According to the census in 2003, the total value of assets owned by SMEs in the
manufacturing sector is more than RM50,000 million. Although the medium-sized
enterprises contribute the lowest number of total establishments, the value of assets is
64
the highest with almost RM30,000 million or RM 14 million per establishment which is
more than ten times that of other categories.
Overall the above data indicate that SMEs in three main sectors play a significant role in
the Malaysian economy. The manufacturing sector is the most significant sector in
Malaysian SMEs since it generates the highest average productivity, value added and
employment per establishment. The sector also has 45% of enterprises in the small and
medium sized enterprise categories as against below 20% in the two other sectors. The
above information indicates that the manufacturing sector particularly in small and
medium sized category is suitable as a population in which to study the use of MAPs in
SMEs by virtue of the concentration of small and medium sized enterprises, who might
reasonably be expected to rely on such systems, and its economic significance. The next
section reviews research related to Malaysian SMEs.
3.6 Research relating to Malaysian SMEs
This section discusses the research that has been undertaken into Malaysian SMEs and
examines whether or not research on MAPs in Malaysian SMEs has been done before.
The Malaysian Government‘s interest in SMEs has generated research in the sector
since 2000. The areas of SME that have captured the interest of researchers include
business practices among SMEs, the barriers faced by SMEs, critical success factors for
SMEs, information technology (IT), financing issues, and the development of
Malaysian SMEs. The following section discusses extant literature on Malaysian SMEs.
An initial area of study was on business practices. Sulaiman et al. (2000) reported that
owners/managers of SMEs in the Malaysian manufacturing sector do practice some

65
form of strategic management in running their businesses. Osman and Hashim (2003),
who evaluated the business practices in Malaysian SMEs, reported the majority of the
respondents had moderate adoption rates for business practices that focused on
technology, marketing, human resource management, finance and strategy. However
this result is contrast with that of Hamid et al. (2004), who concluded in a study of
Malaysian SMEs in the manufacturing sector, that SMEs appear to have a very limited
knowledge of managerial practices such as financial management, human resource
management and marketing.
SME research has also investigated barriers to growth and challenges to survival faced
by SMEs. Hashim (2000) analysed the nature of the business problems faced by SMEs
in the manufacturing sector. This study revealed six problems that are commonly faced
by Malaysian SMEs. The problems are human resource management, marketing,
production, financial management, strategic management and general management. A
study conducted by the Central Bank of Malaysia (2003) assessed the current situation
of Malaysian SMEs and factors that impede their development. The result indicated that
SMEs do not have problems obtaining financing with about half of the SMEs obtaining
bank loans and the rest being self-financed. Factors that are perceived to impede the
growth of their business are low technological capability and a lack of business and
financial advisory services. SMEs require advice especially on accounting, finance,
auditing and marketing. Another study by Saleh et al. (2008) identified the government
policy and infrastructure availability as the major business barriers for Malaysian
SMEs.
Another issue for SMEs highlighted by research in Malaysia is the nature of the critical
success factors (CSFs) in this sector. Hashim et al. (2003) who studied the
66
organizational factors that stimulate innovation, found that SMEs emphasized three
factors that inspired innovation. Those factors are: organizational structure, human
resource practices and organizational culture. On the other hand, Wong and Aspinwall
(2005), who investigated the critical success factors for adopting knowledge
management in SMEs reported that management leadership and support and culture are
the two most critical factors for adopting knowledge management.
The use of information technology by SMEs has also been researched in Malaysia. For
example Zakaria and Hashim (2004) studied the perceptions of Malaysian SMEs on the
opportunities provided by e-business. The findings indicated a positive attitude from
SME owners and managers towards e-business. Similarly Alam and Ahsan (2007)
investigated the extent to which SMEs in the southern region of Malaysia are prepared
for ICT adoption. The outcomes of this study revealed that investment in ICT in
Malaysian SMEs is relatively low. Ismail and King (2007), who examined a sample of
SMEs for different levels of alignment or fit between information technology (IT) and
business strategy and factors that influence alignment, found that accounting
information system (AIS) alignment was related to the firm‘s level of IT maturity; level
of owner/manager‘s accounting and IT knowledge; use of expertise from government
agencies and accounting firms; and existence of internal IT staff.
Financing issues have also received attention in Malaysian SME literature. For example,
Boocock and Shariff (2005) studied the effectiveness of financing schemes provided by
credit guarantee schemes (CGC), and found that the financing scheme provided by CGC
in Malaysia has failed to meet all the objectives sought by the corporations. In the
following year, Rozali et al. (2006) examined the financing practices of small firms in
Malaysia. The result showed that SMEs prefer self-financing during the start-up stage,
67
medium-term bank financing during the next stage and long-term bank financing during
the mature stage. A more recent study conducted by Wahab and Buyong (2008)
examined current financing practices and problems among technology-based SMEs in
Malaysia. The results indicated that in addition to entrepreneurs‘ personal saving and
profit retained in the firms, most Malaysian SMEs approached external sources to
finance their business.
The development of Malaysian SMEs and their contributions to the country have been
examined. Aris (2006) reported on the importance of SMEs using profiles based on the
census conducted by the Department of Statistic of Malaysia in 2003. Further, Saleh and
Ndubisi (2006) and Isa (2008) who evaluated the development of SME in Malaysia,
noted the contribution from SMEs as well as highlighted the challenges and barriers
faced by Malaysian SMEs. Samudhram and Sivalingam (2009) examined the
effectiveness of government policy on SMEs. This study investigated the differences in
labour productivity amongst micro, small and medium-scale industries in the
manufacturing sectors, and found that larger firms are not always more productive than
their smaller counterparts, and suggests that policies that simply drive growth may not
be suitable for all sectors.
The literature review shows that existing literature on Malaysian SMEs has focused on
management practices and general issues related to SMEs and not into MAPs in
Malaysian SMEs. Therefore the lack of knowledge and supporting literature suggests
that there is a knowledge gap as regards MAPs in Malaysian SMEs.

68
3.7 Summary
The chapter has reviewed the SME sector in Malaysia and found that over recent years
SMEs have assumed an increasingly important role in the economy of the country. This
development reflects active support from the Malaysian Government through a number
of programmes. In particular, these programmes and related incentives have encouraged
SMEs in the development of innovative products to help them keep pace with the global
demand for high quality products and services. This chapter has also outlined the
significant contribution of manufacturing SMEs to the Malaysian economy. This sector
has a high production level and generates substantial revenue for the Malaysian
economy especially from the small and medium-sized enterprises. Given these attributes
the SME manufacturing sector is an appropriate population for research into the use of
MAPs in small and medium sized enterprises.
This chapter also highlights the dearth of research into MAPs among SMEs in Malaysia
and concludes that despite a number of studies since 2000 into management practices
and other general issues, there is no research on MAPs in Malaysian SMEs. This
absence supports the need for this research to close the knowledge gap, especially
because, as was discussed before, management accounting is essential for SMEs to
strengthen their business strategies in a competitive environment and help SMEs avoid
failure in the market.
In conclusion, the importance of Malaysian SMEs in the manufacturing sector and the
absence of research into MAPs among these enterprises justify them as a population for
this study.
69
Chapter 4
Literature review and key research areas and development of hypotheses
4.1 Introduction
This chapter presents a review of the literature surrounding the objectives of the
research and the research questions posed. In particular, the literature review looks at
current state of knowledge related to the following four research questions.
1. To what extent are MAPs used by Malaysian SMEs?
The literature review relating to the first research question examines the uptake of
MAPs in general in both developed and developing countries, before narrowing the
scope down to the uptake of specific MAPs in costing, budgeting, performance
evaluation systems, decision support systems and strategic management accounting.
The literature review ends by considering research into MAPs in SMEs.
2. What are the roles played by management accounting in Malaysian SMEs’
management?
The literature review relating to the roles of management accounting has partly been
addressed in Chapter 2 section 2.2. This section will present further literature related to
the roles of management accounting and explain the decision to use IFAC (1989) as the
reference point for the questions in the questionnaire.
3. What factors affect the use of MAPs in Malaysian SMEs?
This study uses contingency theory as an approach to identify factors which explain
variations in the use and development of MAPs. Therefore the literature review will
identify the range of contingent variables that have been employed by researchers in

70
management accounting. The review will examine contingency theory generally before
narrowing the scope to contingency-based MCS and MAPs research in both large
companies and SMEs. The results will be used to select contingent variables for testing
hypothesis one.
4. Is there a positive relationship between the use of MAPs and the performance of
Malaysian SMEs?
This section reviews past literature that has tested for possible relationships between
MAPs and firm performance. The review distinguishes between positive and negative
findings about the relationship in both large companies and SMEs. The results will be
used to select variables for testing hypothesis two.
4.2 Research into management accounting practices
A substantial body of research emerged, especially after 1990s, investigating current
MAPs in organizations. These studies were driven mainly by assertions about the
irrelevance of management accounting to current managerial needs, especially in
modern manufacturing, and claims that there is a gap between management accounting
theory as portrayed in textbooks, and management accounting in practice (Drury et al.,
1993). An additional driver was uncertainty over the level of use of newly developed
MAPs. The research is reviewed by distinguishing between findings in developed and
developing countries.
4.2.1 Management accounting practices in developed countries
Research in developed countries has been carried out in Europe, the US and the Asia
Pacific region. Examples of literature in each country are reviewed in the following
subsections:

71
4.2.1.1 European research
In the UK, Drury et al. (1993) reported on MAPs in 303 UK manufacturing
organizations and found out that a variety of different practices were used. Although
many appeared to correspond closely with theory, there was also evidence of
considerable gulf between some aspects of theory and practice for some respondents.
Abdel-Kader and Luther, (2006) conducted a survey on MAPs in the UK food and
drinks industry. They concluded that traditional management accounting is ―alive and
well‖ but there are indications of an increased use of: information concerning the cost of
quality; non-financial measures relating to employees; and analyses of competitors‘
strengths and weaknesses. Again, there was also evidence of a gap between current
textbook practices and actual practices.
In other European companies, studies in management accounting were conducted by
various researchers. For example, Anderson and Rohde (1994); Laitinen, (1995);
Israelsen et al. (1996), Bruggeman et al. (1996); Pierce and O‘Dea, (1998); Szychta,
(2004); and Hyvonen, (2005).These studies covered a variety of different MAPs such as
costing, planning and control, performance measurement and evaluation and decision
support system. For example, Bruggeman et al. (1996) examined the use of MAPs
within Belgian companies. They found that traditional approaches were still in use
although companies had started to adopt new techniques such as ABC. Pierce and
O‘Dea (1998) investigated MAPs among Irish management accountants and reported
that traditional techniques continued to dominate management accounting systems
(financial measures of control and performance evaluation); and that the update of more
modern techniques low (ABC and target costing) was generally. This suggests that the
main contribution of newer techniques may be in supplementing, as opposed to
replacing, traditional techniques. In another recent study, Hyvo¨ nen (2005) provided
72
empirical evidence on MAPs in Finnish manufacturing companies. The study recorded
the extent of adoption of the MAPs, the perceived benefits from their use and
ascertained intentions for future developments in these practices. The results indicated
that financial measures like product profitability analysis and budgeting for controlling
costs will continue to be important in the future, but noted that greater emphasis will be
placed on newer non-financial practices like customer satisfaction surveys and
employee attitude surveys in the future.
4.2.1.2 U.S research
In the U.S, Chow et al. (1988) reviewed previous studies on MAPs. The survey covered
the following topics: cost accounting system design, decision making, planning, control,
and the use of quantitative methods. The researchers concluded that while many
common approaches were identified, there are areas where practices diverge. Shields et
al. (1991), who summarized the MAPs literature in U.S and Japan, discovered that there
are many similarities as well as differences in the use of management accounting
between Japanese and U.S companies. For example, they found that: there is about the
same use of direct (variable) costing and full (absorption) costing in both countries
though the Japanese firms report more frequent use of process costing to accumulate
product costs and a higher percentage of U.S. firms do not use any form of CVP
modeling. One of the biggest reported differences between Japanese and U.S. firms is in
the use of capital budgeting decision models. Discounted cash flow models such as net
present value and internal rate of return were commonly used by U.S. firms. In contrast,
Japanese firms more frequently used pay back as the primary model.

73
4.2.1.3 Asia-Pacific research
In Japan, Scarbrough et al. (1991) identified several important Japanese MAPs used in
advanced Factory Automation (FA) manufacturing environments. The survey revealed
that Japanese management accounting systems for product costing and inventory
valuation did not employ newer or more innovative methods than Western
manufacturers used. Instead, the firms appear to have put their innovating effort into
cost analysis for decision-making and cost control through unique management
'accounting' techniques such as target costing and engineering performance
enhancement methods (for example, total quality control (TQC), total productive
maintenance (TPM), just-in-time (JIT), value engineering (VE) and return on sales
(ROS)). The developments in these areas seem to be carefully integrated with and
supportive of a wider array of strategic actions or systems (e.g investment in plant and
equipment). The researchers found that the focus of management effort becomes
describing and communicating the organization's goals and strategies and not designing
complex systems that reflect the idiosyncrasies of markets and production processes.
Later, Yoshikawa (1994) highlighted a number of important aspects of Japanese MAPs
that differ from those found in the West. The differences tend to reflect the traditional
Japanese culture. In Japan, where possible, management accounting is used in a way
which fosters staff involvement through consultation. Management accounting is to
improve employees ‗visibility‘, to educate and remind employees of the strategic aims
and the intended direction of their company so that they can contribute as much as
possible to the company. Next, McMann and Nanni (1995) reviewed the literature on
Japanese management accounting. They discussed the extant literature by reference to
the following five themes: examining work using the ‗eyes‘ of the market; focusing on
the quality of work; employing ‗waste‘ as the measure of cost; continually improving
the way work is done and sharing knowledge through vertical and horizontal
74
communication. Most evidence shows that Japanese and Western management
accounting techniques and methodology are quite similar. What does vary between the
two countries are the way these techniques are applied and the context in which they are
used. The five recurring research themes (as mentioned before) provide a framework for
Japanese firms to use management accounting techniques in order to create competitive
advantage.
In Australia, Smyth (1960) compared management accounting techniques in Australia
with those in the U.S and Canada. He found that Australian management made less use
of the management accounting techniques than managers do in the U.S and Canada. For
example; Australian companies were less likely to employ long-range sales plans, long-
range plans for capital expenditure, cash, and profits, and budgeting techniques than
companies in the US and Canada. A more recent study by Chenhall and Langfield-
Smith (1998) found that Australian companies have a relatively high level of adoption
of management accounting techniques compared to other countries. On average, the
rates of adoption of traditional MAPs were higher than the adoption of current
techniques. There were higher adoption levels on budgeting, planning and performance
evaluation; and somewhat lower adoption levels for target costing, value chain analysis
and ABC. Wijewardena and De Zoysa (1999) looked at MAPs in large manufacturing
firms in Australia and Japan. The results of the survey found a number of important
differences between the two countries. The most striking difference was that while
MAPs in Australian companies placed an emphasis on cost control tools such as
budgeting, standard costing and variance analysis at the manufacturing stage, those of
Japanese companies devoted much greater attention to cost planning and cost reduction
tools based on target costing at the product planning and design stage. Further, the

75
Japanese companies seem to have introduced more frequent changes to MAPs than their
Australian counterparts.
4.2.2 Management accounting practices in developing countries
Research in developing countries has been carried out in China, India, the Middle East
and South East Asia. The examples of literature in each country are reviewed in the
following subsections:
4.2.2.1 China
Firth (1996); Islam and Kantor (2005); and Wu et al. (2007) focused on MAPs in
Chinese companies. Firth (1996) conducted a MAPs survey in local public companies
(PRCs) and foreign partnered joint ventures. Survey results show that those Chinese
enterprises who participated in foreign partnered joint ventures made more changes to
their management accounting system when compared to similar PRCs who had no
collaborative venture operations with foreign firms. Islam and Kantor (2005), who
evaluated the development of quality MAPs, found that national culture and values
practised for centuries by Chinese businesses influenced the outcomes of efforts for
greater information dissemination and the development of MAPs. They argued that a
lack understanding of Western MAPs had slowed the pace of development of Chinese
MAPs. Wu et al. (2007) found that the level of adoption MAPs was most influenced by
ownership type of the enterprise, joint venture (JV) or state owned enterprise (SOE),
rather than the nature of the management accounting techniques to be adopted.
Techniques such as budgeting and target costing are perceived to be more beneficial for
SOEs than JVs. However, responsibility accounting and accounting for decision making
is perceived to be less beneficial to SOEs than JVs.
76
4.2.2.2 Middle East
Alnamri (1993) who conducted a comparative analysis of Saudi and western approaches
found that the western joint venture companies have a more sophisticated management
accounting system and their accountants have a greater role to play in decision making
and control. In addition the managers of the joint venture companies rely more on
accounting information in decision making and control compared to their Saudi
counterparts.
El-Ebaishi et al. (2003) found that, traditional management accounting techniques are
perceived by Saudi manufacturing firms to be important and heavily used by responding
firms. On the other hand, new management accounting techniques such as ABC and JIT
are used by only a limited number of respondents. El-Ebaishi et al. (2003) concluded
that this result was in line with outcomes from studies in developed countries.
Hutaibat (2005) investigated the state of MAPs within Jordan‘s industrial companies.
The study found that the Jordan firms are still using traditional MAPs rather than
newly-developed MAPs. In a more recent study Leftesi (2008) explored the state of
traditional and advanced MAPs in Libyan medium and large manufacturing firms. The
study reported that the adoption rates of MAPs in Libyan firms are noticeably lower
than the adoption rates of MAPs currently described in the management accounting
literature. However, the results are consistent with findings from the previous studies
regarding the relatively high use of traditional MAPs as opposed to modern MAPs.
4.2.2.3 South East Asia
Ghosh and Kai Chan (1997) examined MAPs in Singaporean large companies operating
in the manufacturing and services sectors. The results revealed a high level of adoption
77
of budgeting and capital budgeting (more than 80 per cent), moderate use, ranging from
56 per cent to 80 per cent of long-range planning, breakeven point analysis, return on
investment and standard costing; and a very low uptake (11 per cent) of ABC.
Phadoongsitthi (2003) found similar results in Thailand to those established in
Singapore and India (see Joshi, 2001). The study reported that for Thai companies in the
manufacturing and services sectors the adoption of budgeting, planning and
performance evaluation practices was high but the adoption of contemporary
approaches such as target costing, product life cycle analysis and zero-based budgeting
(ZBB) was low.
Sulaiman et al. (2004) summarized the previous findings on MAPs in developing
countries. These findings were that while the use of contemporary management
accounting tools is lacking in the four countries under examination (China, Singapore,
India and Malaysia), the use of traditional management accounting techniques remains
strong. The probable reasons for this were suggested to be: a lack of awareness of new
techniques; a lack of expertise; and perhaps more importantly a lack of top management
support.
In a more recent study, Nimtrakoon (2009) conducted a study of MAPs in Thailand.
The findings confirm the popularity of the use of, and high perceived benefit from,
traditional MAPs and reveal disappointing adoption rates of, and relatively low
perceived benefit from, contemporary MAPs.
78
4.2.2.4 Other developing countries
In India, Joshi (2001) explored MAPs in the Indian manufacturing and services sectors.
The study indicated that the uptake of traditional MAPs, such as budgeting and
performance evaluation, was higher than for contemporary techniques. Waweru et al.
(2004) analyzed management accounting change over time within four African retail
companies and found considerable changes in management accounting systems within
the four cases. Such changes include increased use of contemporary MAPs notably
activity-based cost allocation systems and the balanced scorecard (BSC) for
performance measurement. Lastly Frezatti (2007) surveyed MAPs in Brazilian medium
and large companies operating in manufacturing and non-manufacturing sectors. The
results showed that adoption was lower for recent management-accounting practices
(e.g. ABC, BSC, in full and EVA) than for more traditional practices such as budgeting.
Overall based on research in developed and developing countries, it may be concluded
that, traditional MAPs are widely employed but new more sophisticated practices are
not yet widely adopted despite their claimed relevancy.
4.2.3 Research into specific areas of management accounting practices
The studies discussed above only cover MAPs at an overview level. This section
reviews research into specific MAPs and techniques. The majority of studies have
concerned costing systems; budgeting and performance evaluation. Decision support
systems and strategic management accounting are less commonly studied.

79
4.2.3.1 Costing
Research indicates that the information on product costs generated by costing systems
has a wide number of uses. These uses include, for example, pricing decisions; cost
control, (Yoshikawa et al., 1989; Bright et al., 1992; Lukka and Granlund, 1996;
Cinquini et al. 1999; Van Triest and Elshahat, 2007); an evaluation of production
processes; and transfer pricing (Bjornenak, 1997). However research has focused on
which costing systems are used by firms. The following discussion reviews evidence on
the level of uptake of costing systems from previous studies.
The two main costing methods adopted were absorption costing and direct (variable)
costing. Absorption costing system is general preferred globally. For example Drury et
al. (1993) observed that 58 per cent of U.K firms often or always used absorption
costing and Scherrer (1996) found that around half of German firms applied this
technique. Meanwhile, Shields et al. (1991), who made a comparison between Japan
and the U.S reported that Japanese companies indicated about 59 to 67 per cent usage
against a slightly higher uptake at 65 to 75 per cent by U.S companies. More recently,
Szychta (2002) found that 90 per cent of Polish firms adopted this technique. In
developing countries uptake rates are similar. For example in India, Joshi (2001)
reported half of Indian firms adopted this technique and Firth (1996) revealed 66 per
cent of Chinese foreign-based companies applied this technique.
The use of direct (variable) costing is also widespread. Lukka and Granlund (1995)
showed that 42 per cent of Finnish firms applied variable costing. Similarly, Abdel-
Kader and Luther (2006) indicated just over 50 per cent of British firms implemented
this technique. In contrast in developing countries, Firth (1996) reported an adoption
rate of 76 per cent by locally based Chinese companies in China. Joshi (2001) and

80
Phadoongsitthi (2003) in India and Thailand respectively reported a similar rate of use
to developed countries which is in excess of half of the surveyed firms.
A considerable amount of research has focused on activity-based costing (ABC) despite
the survey evidence generally indicating that with the exception of the U.S and
Australia, it is only used in a small minority of companies surveyed. In the UK uptake
has been consistently poor (see for example, Drury and Tayles, 2000; or Abdel-Kader
and Luther 2006); and in other European countries the position is similar at just below
or just over 10 per cent (see for example, Israelsen et al., 1996; Cinquini et al., 1999 or
Szychta, 2002). In New Zealand Lamminmaki and Drury (2001) found that NZ
manufacturers appear to be more advanced in terms of ABC adoption than UK
companies as a greater proportion of manufacturers had held discussions on ABC and a
greater proportion indicated an intention to use ABC. A similar but slightly stronger
uptake of ABC is shown by research in developing countries. For example, Ghosh and
Chan, (1997) found a 13 per cent uptake in Singapore and Joshi (2001) reported a 20
per cent uptake in India. Interestingly, Van Triest and Elshahat (2007) found none of a
sample of Egyptian companies adopted this method.
Contrary to the results in European countries and developing countries, U.S and
Australia, results reveal a much higher uptake of ABC systems. Hrisak (1996) and
Krumwiede (1998) indicated that ABC was adopted by just over half over U.S firms
although later study by Ittner et al. (2002) reported uptake at just over a quarter of
companies. Similarly, Chenhall and Langfield-Smith (1998) found that 56 per cent of
Australian firms adopted ABC.
81
The extent of use of other costing techniques such as process costing and job costing
has also been widely researched. For example, Shields et al. (1991) noted that Japanese
firms report more a frequent use of process costing (55 per cent to 61 per cent)
compared to U.S companies (24 per cent to 36 per cent). Meanwhile in Sweden, Lukka
and Granlund (1995) indicated that 41 per cent of Swedish companies implement
process costing compared to 38 per cent using job order costing. Lastly Wijewardena
and De Zoysa (1999) discovered that more than half of the Australian companies used
process costing (52 percent) or job-order costing (30 percent) as the main product
costing method - which is a not dissimilar to the findings of Lukka and Grandlund
(1995). The results probably reflect the mix of industries in the samples as the choice
between job costing and process costing will probably depend on the suitability of the
method to production processes behind products and services.
4.2.3.2 Budgeting
Budgeting is perceived as an important control system in almost all organizations
(Hansen and Van der Stede, 2004). The main focus on budgeting has been on uptake
rates and the purposes underlying its use.
Previous research indicates that the main purposes of budgeting are planning future
performance; planning the future financial position; planning future cash flows;
planning future day to day operations; and controlling costs (see for example, Lyne,
1988; Amstrong et al., 1996; Chenhall and Langfield-Smith, 1998; Sulaiman et al.,
2004; Fruitticher et al., 2005; Abdel-Kader and Luther, 2006). Budgeting is also used
for performance evaluation, communication of goals and strategy formation (Briers and
Hirst 1990; Guilding et al., 1998; Hansen and Van der Stede, 2004; Sulaiman et al.,
2004; Fruitticher et al., 2005), to coordinate activities across business units (Chenhall
82
and Langfield-Smith, 1998); and for timely recognition of problems and to improve the
next period‘s budget (Joshi et al., 2003).
The use of specific types budgeting technique such as flexible budgets, rolling budgets,
ZBB and operational budgets has been researched. Nik Ahmad et al. (2003) found that
the uptake of flexible budgets in Malaysia is higher compared to those in UK and New
Zealand. The relatively low results also were by few studies (see Pierce and O‘Dea,
1998; Szychta, 2002; and Abdel-Kader and Luther, 2006). Szychta (2002) suggested
that the reasons of low adoption include: ‗generally no major change in activity within a
year‘; volumes do not move that significantly‘ and ‗too difficult to report to non-
financial departments‘. The adoption rate of ZBB is on average less than 20 per cent.
For example, Abdel-Kader and Luther (2006) reported a 16 per cent uptake in the UK;
Szychta (2002) found 17 per cent in Poland and a study by Joshi (2001) showed only 5
per cent adoption in India. Evidence on rolling budgeting is limited to Hansen and Van
der Stede (2004) who found that 23 per cent of U.S companies were using rolling
budgets.
With respect to control aspects of budgeting, Puxty and Lyall (1989) found that
majority of UK industrial companies were using both standard costing and budgeting
system in their firms. Similarly Guilding et al. (1998) found that standard costing
systems continue to be popular and that the majority of accountants surveyed did not
envisage abandoning standard costing and variance analysis in advanced manufacturing
technology environments. Their comparisons between budgeting and standard costing
practices used in NZ and the UK revealed a high degree of consistency. De Zoysa and
Kanthi Herath (2007) who conducted a study in Japan found that standard costing is still
being used by a large number of firms both in developing and developed countries
83
which is consistent with Guilding et al. (1998). The research suggests that the
importance of standard costing has not significantly declined despite technological
changes. Sulaiman et al. (2005) found that standard costing is still being used by a large
majority of firms in Malaysia. Thus, Malaysian companies (both Japanese and local)
held that the basic principles of standard costing remain sound.
Dugdale and Lyne (2004) investigated the current use of budgets in forty UK medium
and large companies. This research found that all respondents confirmed that their
companies set budgets, typically starting the process four to six months before the start
of the financial year. Some 80 per cent agreed that there were frequent revisions to the
budget during the budgeting process. Szychta (2002) who conducted a study in Polish
firms, found that annual operating financial budgets are prepared by a significant
proportion of the companies studied, mainly large manufacturing and service enterprises
(80% of the respondents). However, a complete or nearly complete master budget is
prepared by a much smaller proportion of enterprises (17%). The remaining enterprises
prepare varying numbers of component budgets, mainly sales, production and cost
budgets. Joshi et al. (2003) revealed that most of the Bahrain companies surveyed
prepared long-range plans and operating budgets.
Despite its widespread use, budgeting has over the years, been criticised on a number of
grounds. Hansen et al. (2003) stated that the practitioners argue that budgets impede the
allocation of organizational resources to their best uses and encourage myopic decision
making and other dysfunctional budget games. They attributed these problems, in part,
to traditional budgeting‘s financial, top-down, command and control orientation as
embedded in annual budget planning and performance evaluation processes. Bourne
(2004) undertook a worldwide review of budgeting. The study results showed a
84
widespread dissatisfaction with the budgeting process. The catalogue of complaints was
consistent with previous research: the process was too time consuming, too costly, too
distorted by gaming, too focused on cost control and so on. Most significantly,
budgeting often seemed to be almost totally divorced from the company‘s overall
strategic direction.
A new approach aimed at solving problems associated with traditional budgeting; the
beyond budgeting round table (BBRT) aims to manage the company without a
traditional budget. This approach was established to research the problems of budgeting
and why it has become such a major barrier to improving organizational performance
and to change (CAM-I11
, 2002). Cassel (2003) reported evidence that private sector
organizations that have adopted BBRT have performed better than their conventionally
budgeting peers.
However as noted above, despite all the weaknesses in traditional budgeting, the
majority of researches have found that the use of traditional budgeting is still prevalent.
For example Hansen et al. (2003) claimed that the vast majority of U.S. firms retain a
formal budgeting process despite long list of problems and many calls for improvement
in budgeting. Similarly Dugdale and Lyne (2004) found that budgeting is alive and well.
They concluded that while traditional budgeting is now more likely to be combined with
increased use of non-financial indicators, its demise seems unlikely.
4.2.3.3 Performance evaluation
Emmanuel et al. (1990) noted that performance evaluation was an important function of
management accounting. Performance evaluation provides information for managers to
11
Consortium for Advanced Manufacturing- International, Inc
85
support the achievement of their organization‘s strategic objectives (Jusoh and Parnell,
2008). Hall (2008) argued that in recent years organizations have sought to develop
more comprehensive performance measurement systems (PMS) to provide managers
and employees with information to assist in managing their operations. He added that
comprehensive PMS include a more diverse set of performance measures, and
performance measures that are linked to the strategy of the firm. Hall (2008) also stated
the examples of the popular techniques for delivering a wider set of performance
measures are the balanced scorecard (Kaplan and Norton, 1996), tableau de bord
(Epstein and Manzoni, 1998) and performance hierarchies (Lynch and Cross, 1992).
However the choice of measures to guide and evaluate the performance of business
units is one of the most critical challenges facing organizations (Ittner and Larcker,
1998a). CIMA (2002) highlighted the frameworks for performance measurement and
management which are the value-based management (VBM); ABC and activity-based
management; balanced scorecard; European Foundation for Quality Management
(EFQM) excellence model; benchmarking; strategic enterprise management (SEM); and
six sigma. However the literature indicates that in general both financial and non-
financial measures are used to measure performance (Gomes et al. 2004 and Demirbag
et al., 2006).
Financial measures such as return on investment (ROI) and profit measures were
extensively used in most countries: Research demonstrating this includes in the U.K
Abdel-Kader and Luther (2006); in Japan Abdel-Maksoud et al. (2008); in Portugal
Gomes et al. (2004); in Singapore Ghosh and Kai-Chan (1997); in India Joshi, (2001);
in Egypt Ismail (2007) and in Malaysia Jusoh and Parnell (2008). For example, Gomes
et al. (2004) argued that the high acceptance of financial measures may be attributed to
the fact that information on these measures is the more readily available. Jusoh and

86
Parnell (2008) stated that relatively new financial measures, such as economic value-
added (EVA), have been applied to some studies. However, earlier studies suggested
that the use of EVA was not that popular because it is too complex for managers to
understand and use (Ittner and Larcker, 1998a).
Newer performance measures based on non-financial measures, have been more widely
applied by organizations over time (Drury and Tayles, 1993; Gomes et al., 2004; Ismail,
2007). Banker et al. (2000) argued that the primary reasons suggested for the use of
nonfinancial performance measures are that these measures are better indicators of
future financial performance than accounting measures, and they are valuable in
evaluating and motivating managerial performance. This development is in response to
the considerable criticisms of excessive emphasis and concern on the targeting of
financial indicators. For example critics argued that stressing financial indicators may
lead to short-term thinking (Gomes et al., 2004).
Within the family of non-financial performance measures, those related to customers
have a higher adoption rate compared to the other non-financial measures. Drury and
Tayles (1993) surveyed MAPs in 260 UK SMEs and the results supported the
importance of non-financial measures, especially measures of customer satisfaction,
product quality, delivery and supplier reliability. Abdel-Maksoud et al. (2008) found
that customer related measures are widely reported and are perceived to be crucial- a
number of other measures related to quality, timeliness and efficiency and utilisation are
also widely monitored and considered very important. Other studies have focused on the
BSC. Speckbacher (2003) showed that only a minority of German firms in his sample
(26%) used BSCs and most of these appeared to use only a limited or incomplete
version. Ismail (2007) reported that the BSC has wide spread use in the Egyptian
87
companies surveyed, but the extent of use of multi-dimensional indicators is low. The
survey provided a number of insights into obstacles inhibiting the adoption of the BSC
in a developing country - the most significant obstacle being the inadequacy of existing
information systems.
4.2.3.4 Decision support system
Wu et al. (2007), hold that effective decision making is the most important key factor in
today‘s rapid and changing competitive environment. The decision support analysis can
be divided into short term and long term analysis. Abdel-Kader and Luther (2006)
argued that for regular or short-term decisions management accountants can use cost-
volume-profit (CVP) analysis, product profitability analysis, customer profitability
analysis, and stock control models. For longer-term capital investment decisions
management accountants can produce and review accounting rates of return and
payback periods as well as complex signals based on discounted cash flow. Capital
budgeting techniques capture both non-discounted and discounted approaches.
Klammer et al. (1991) argued that the superiority of internal rate of return (IRR) and net
present value (NPV) analysis has been repeatedly demonstrated under conditions of
certainty. Under uncertainty, the techniques used are sensitivity analysis, increased
required rates of return, game theory, and Monte Carlo computer based simulation.
The payback period method for investment evaluation is popular in most countries (see
for example, Shields et al., 1991; Yoshikawa, 1994; Lazaridis, 2004; Abdel-Kader and
Luther, 2006; and Hermes et al. 2007). A 41 per cent adoption rate was reported in the
U.K by Abdel-Kader and Luther (2006) which is much lower than the 84 per cent in
Japan (Shields et al., 1991) and 84 per cent in China (Hermes et al., 2007). This
acceptance may be because of the simplicity of this method makes it easier to evaluate
88
projects. In contrast, techniques such as NPV and IRR/ROR have been adopted at
relatively low rates; for example 19 per cent in the UK (Abdel-Kader and Luther, 2006)
and around 15 per cent in Japan (Shields et al., 1991). However Hermes et al. (2007)
found that NPV method is the most popular method (89 per cent) in the Dutch
companies they surveyed.
Techniques for dealing with uncertainty have also been researched (see for example
Shields et al., 1991; Lazaridis, 2004; Abdel-Kader and Luther, 2006). Abdel-Kader and
Luther indicated that the U.K companies used computer simulation (6 per cent); and
‗what if‘ analysis (22 per cent). Shields et al. (1991) found that only 19 per cent of
Japanese firms were explicitly considering risk. In contrast, higher rates ranging from
48 per cent to 93 per cent were reported in the U.S. Another decision support technique;
breakeven analysis had a relatively moderate adoption rate. For example, in the U.K the
adoption rate was 38 per cent (Abdel-Kader and Luther 2006); and in Poland 47 per
cent (Szychta, 2002). In contrast, Chenhall and Langfield-Smith (1998) found an 86 per
cent adoption of breakeven analysis in Australia.
Product profitability analysis has been adopted to a significant extent in both developed
and developing countries. For example, in U.K 69 per cent of respondents reported its
use (Abdel-Kader and Luther, 2006); in Australia 89 per cent (Chenhall and Langfield-
Smith, 1998); and in India 82 per cent (Joshi, 2001).
4.2.3.5 Strategic management accounting
A final set of MAPs is encompassed by strategic management accounting (SMA).
Bromwich (1990) defined SMA as the provision and analysis of financial information
on the firm‘s product markets and competitors‘ costs and cost structures and the
89
monitoring of the enterprise‘s strategies and those of its competitors in these markets
over a number of periods. Drury (1994) argued that conventional management
accounting does not provide the financial information required to monitor existing
strategies or support strategy formulation. SMA seeks to remedy this situation by
providing the financial analysis to support the formulation of successful competitive
advantages (Drury, 1994 p. 454). Lord (1996) summarized the main themes from the
previous literature in SMA and suggested three important elements: collection of
competitor information, exploitation of cost reduction opportunities and matching of the
accounting emphasis with strategic position. On the other hand, Guilding et al. (2000)
highlighted 12 strategic management accounting techniques under three categories:
strategic costing and pricing attribute costing; competitor accounting; and brand value
accounting. More recently, Cadez and Guilding (2008) applied five dimensions of SMA
usage: (1) costing, (2) planning, control, and performance measurement, (3) strategic-
decision making, (4) competitor accounting, and (5) customer accounting.
Although there is strong academic support for the concept of SMA, Guilding et al.
(2000) argued that, there appears to be negligible use of the term ‗strategic management
accounting‘ in organizations and practising accountants have a limited appreciation of
what the term means. Smith (2007) who reviewed previous studies in Australia
concluded that SMA techniques has not been adopted widely, nor is the term SMA
widely understood or used. However, SMA has influenced the thinking and language of
business, and the way in which companies undertake various business processes.
The majority of the studies report low to moderate adoption rates for SMA practices.
For example, one of most well established techniques within the SMA umbrella, target
costing, was only used by 24 per cent of U.K companies (Abdel-Kader and Luther,
90
2006); while the results from Australia and India show 38 per cent and 35 per cent
uptake respectively (Chenhall and Langfield-Smith, 1998 and Joshi, 2001). More
generally, Abdel-Kader and Luther (2006) revealed that although customer profitability
analysis and competitive position analysis were employed by up to 51 per cent of
respondents, other SMA techniques such as shareholder value analysis, industry
analysis, and value chain analysis, were used by less than 20 per cent of respondents.
Results from Australia and India support the low adoption of value chain analysis
(Chenhall and Langfield-Smith, 1998; and Joshi, 2001). Guilding et al. (2000), who
examined use of SMA techniques in the UK, U.S, and New Zealand similarly found that
competitor accounting and strategic pricing are the most widely-used SMA techniques
and that others have a low usage. Outside the Anglo-Saxon business world, Cadez and
Guilding (2008) found that SMA techniques are adopted by 62 per cent of Slovenian
companies.
4.2.4 Management accounting in SMEs
This section reviews the extent to which MAPs have been undertaken in SMEs which
are the intended population for this thesis. Despite the economic and social importance
of SMEs, there is a lack of research initiatives studying the provision for management
accounting information and use of management accounting techniques by SMEs
(Nandan, 2010). Kaplan (1994) suggests that this may be because research into MAPs
is predicated in the belief that the discipline of management accounting is best served by
studying (and so eventually facilitating the emulation of) the most innovative and
successful practitioners. This position inevitably skews research towards larger entities.
As Mitchell and Reid (2000) observed, this belief has led to empirical management
accounting research designed to investigate technical innovation and development being
concentrated on larger enterprises to the exclusion of smaller firms where the expertise

91
and capacity to innovate in management accounting is less likely to exist. Therefore this
situation leaves a significant gap into the study of MAPs in SMEs. However, limited
examples of research into MAPs in SMEs in developed countries exist. For example,
Drury et al. (1993) found that small businesses generally reported using more simplistic
techniques, and the use of techniques such as ABC, sensitivity analysis, market research
and advanced quantitative techniques tended to be limited to the larger business units.
This suggests that the gap between management accounting theory and practice may be
particularly wide for small businesses. Similarly, Gunasekaran et al. (1999) in the U.K
found that ABC has received little attention from SMEs in spite of the fact that it may
have an important role to play in improving the competitiveness of SMEs. Later, Reid
and Smith (2002) in a study of UK SMEs found that only a minority of small firms,
typically around a third, set budgets; that payback was the most frequently applied
investment appraisal technique and that the management accounting system (MAS) in a
small firm has a significant effect on the operation and performance of the business. The
impact of the MAS was greatest in those firms which are struggling to survive, where it
can be used to monitor finances daily and can help to identify trends in key variables.
Firms where financial performance is satisfactory, but static, tend to place less
importance on the provision of management accounting information. Jarvis et al. (2000)
stated that research has shown that small firms in the UK pursue a range of goals. It
was, therefore, not surprising to find that owner-managers of small firms used a variety
of measures and indicators to assess business performance. While cash flow indicators
were considered to be critical, profit measures were found to be less important than
conventional views suggest.
McChlery et al. (2004) investigated the scope of the financial management systems
(including MAPs) operating within small firms. They found that management

92
accounting systems did not have the same level of use as financial accounting overall
with the former having a reduced uptake compared to the latter. They also found that
smaller businesses were most likely to be dissatisfied with their management accounting
systems. In a later study, Sousa et al. (2006) determined the current state of knowledge
related to performance measures and their degree of implementation in SMEs in the
U.K. Overall, financial measures were the most widely used, while innovation and
learning measures were rated less important and were less used. The most important
performance measures were not consistent with criteria to win new orders. However, the
low response rate of the survey precludes generalisation of the findings.
In Europe, Kraus et al. (2006), who examined strategic planning and performance in
Austrian smaller enterprises, found that planning formalization has a positive and highly
significant impact on the probability of belonging to a group of growth firms, whereas
other aspects of strategic planning (time horizon, strategic instruments, and control) did
not contribute to performance.
In U.S Demong and Croll (1981) concluded that although most U.S small businesses
started without a cost accounting system, its usefulness became quickly apparent to the
owner/managers. A well-designed cost accounting system with its budgets, standard
costs and break-even analyses will enable managers to make better decisions. Demong
and Croll (1981) suggested that all firms within the same industry will not require the
same things from a cost accounting system. The larger firms will need a more
sophisticated system to enable them to make frequent decisions on the prices and costs
of their products. A smaller firm may only need a basic budget and some standard cost
figures for their more infrequent pricing and cost decisions. In any case, all firms should
have basic cost accounting systems with budgets and standard costs which can be used
93
for planning and control. This or any system should be easy to use, understand, and
maintain. In addition, it should be flexible and cost effective. Mcintyre and Icerman
(1985) studied the use of the accounting rate of return (ARR) by U.S small businesses
and provided evidence of the nature and magnitude of errors that result from using the
ARR for investment decisions. The results show that the ARR often produces
substantial errors, and its use may be misleading. Small businesses are encouraged to
take advantage of recent advances in technology which place IRR calculations within
reach of any business involved in investment analysis.
In Japan a survey of cost accounting in SMEs was undertaken by Hopper et al. (1999).
The results indicate that costing systems in Japanese SMEs were similar to those of
larger Japanese firms. Costing systems and cost management practices though not
uniform, emphasized simple routine accounting. They were not used extensively for
decision-making or performance evaluation. However, sophisticated detailed processes
of cost management, which often centered on engineering and quality control, were the
norm.
In developing countries research into MAPs in SMEs is still lacking. In Malaysia for
example, as discussed in Chapter 3 section 3.6, studies of MAPs in SMEs are non-
existent. This situation may be due to several factors. Sulaiman and Hashim (1999)
observed that research into Malaysian SME is limited and not integrated in nature and
an earlier study by Boocock and Wahad (1997) indicated that information on SMEs in
Malaysia is inadequate, inconsistent and not easily available. Thus it can be concluded
that research into MAPs in SMEs is limited and primarily relates to developed
countries.
94
4.2.5 Summary
This section has explored research into the use of MAPs in developed and developing
countries. It also looked at a research into specific areas of MAPs such as costing,
budgeting, performance evaluation system, decision support system and SMA. The
literature review revealed the following main points.
Firstly, the main body of research in broad area of MAPs initially commenced in
developed countries in the 1990s. In developing countries, the majority of extant
empirical evidence on this subject has been obtained in the twenty first century.
Secondly, there is a substantially body of research that focuses on specific MAPs and
techniques: costing systems; budgeting and performance evaluation systems have been
the most popular areas for study. Decision support systems and SMA have been less
commonly studied.
Thirdly, the literature suggests that the uptake of traditional MAPs and techniques was
perhaps not surprisingly higher for traditional management accounting techniques than
for contemporary MAPs and techniques in both developed and developing countries.
However, there are indications in recent studies, of an increasing use of more
contemporary practices.
Fourthly, the literature indicates there is very little evidence on the uptake of MAPs
among SMEs. Extant literature on this subject is very largely confined to developed
countries.
95
The review has therefore identified a significant gap in research about MAPs among
SMEs as there are very few studies related to developing countries. Addressing the first
research question of the thesis will endeavour to close this gap and add to existing
knowledge about the adoption of MAPs by providing information on the use of MAPs
by SMEs in a developing county, Malaysia. The next section will review literature on
the roles of management accounting.
4.3 The role of management accounting in the management of an organization
Management accounting plays an important role in the management of today‘s
organisations. Chapter 2 examined definitions of this role as, for example, that provided
by IFAC in 1989. This statement saw management accounting as an integral part of the
management processes whose role was to provide information essential for; controlling
the current activities of an organization; planning its future strategies, tactics and
operations; optimizing the use of its resources; measuring and evaluating performance;
reducing subjectivity in the decision making process; and improving internal and
external communication (IFAC, 1998, p. 99).
The roles of management accounting have been examined by many researchers.
Hiromoto (1988) stated that the primary objective of management accounting is to
provide decision makers with timely, accurate, and relevant information, reflecting the
financial performance of an organization. Similarly Garrison and Noreen (2000) agreed
that management accounting information is used to help managers carry out their
responsibilities of planning, directing, motivating, and controlling. Additionally
Bhimani (2002) claimed that the main objective of management accounting has been to
help organizations plan their future and then to monitor their performance. The
emphasis has been on the internal processes, to analyze, investigate, and predict
96
information to assist managerial activities. Chenhall and Langfield-Smith (2007) agreed
with this position arguing that management accounting has had a primary function in
developing performance measures to assist managers in planning and controlling their
organizations. Hutaibat (2005), who conducted a study into MAPs in a developing
country; Jordan, concluded that the most literature is management accounting suggested
planning, controlling, evaluating performance, improving and developing competitive
strategies and making decisions, are the main functions of management accounting in
attaining company goals.
Other scholars have suggested that, the roles of management accounting have shifted to
broader area. Kaplan (1995) indicated that management accounting must move to a
wider role in the management process. He argued that management accountants should:
Become part of their organization's value-added team;
Participate in the formulation and implementation of strategy;
Translate strategic intent and capabilities into operational and managerial measures;
and
Move away from being scorekeepers of the past to become the designers of the
organization's critical management information systems.
Freedman (1996) provided evidence that supported Kaplan‘s view in a survey which
showed that most respondents believe that today‘s management accounting must
provide an information resource that contributes to overall strategy implementation.
McNair (1997) observed that the role of management accounting in the new millennium
would be oriented towards analysis and value added activities. Management accounting
should be a participant and leader in decision-making. In addition, it should be
strategically oriented and focused on performance improvement. Further, Bhimani

97
(2002) noted that management accounting in modern organizations has a wide and
diverse role stretching from focusing on internal processes towards becoming externally
oriented. New management accountants should benefit from the information revolution.
They have to measure the non-financial metrics, provide operation managers with
quantified non-financial information as well as control cost and produce current reports
about cost behaviour for top management. IFAC (1998) has also recognized the
evolution of management accounting through four main stages which has been
previously portrayed in Figure 2.1 (see section 2.1.1 Chapter 2).
In a more recent study, Valančienė and Gimžauskienė (2007) studied the changing role
of management accounting in Lithuania. They concluded that the role of modern
management accounting has extended from data accumulation to providing information
as to the progress of strategy implementation. Thus the role of management accounting
has changed focus from being just directed toward shareholders to delivering customer-
employee-shareholder integrated solutions. Those solutions are focused on permanent
monitoring, measurement and management of strategic advantages and future outcomes
(translation of strategy into appropriate set of goals and measures, strategy mapping).
The results of the research suggest that modern management accounting concepts might
be a precondition for a change in the role of management accounting but this in turn
will depend on the organization‘s ability to implement and manage the capabilities of
these concepts.
The role of management accounting in specific processes in firms has also been
investigated. For example, May (1995) studied the role of management accounting in
performance improvement. She argued that the role of the management accountant as
leaders of business process re-engineering (BPR) and activity-based cost management
98
(ABCM) performance-improvement initiatives, can contribute significantly by building
trust and breaking down functional barriers, acting as a catalyst, researching and
providing analysis, assessing improvement proposals, facilitating workshops, improving
communication by bringing together service providers and service receivers (internal
customers and suppliers) in order to effect improvements. She added that by using
Activity-based management accounting (ABMA), the management accountant can help
everyone to understand what resources are consumed and outputs produced by each
activity and process within the organisation, enabling better decision-making. Similarly,
Perez et al. (2008) investigated the role of management accounting in a continuous
improvement environment. Their survey findings indicate that management accounting
plays a crucial role as provider of information for the continuous improvement in the
quality of both product and business processes through the internal benchmarking
practices. Ciaran and John (1995) examined the the role managers expect management
accountants to play in the decision support process. They found that the main types of
information supplied within the organisations consist of information relating to costs,
volumes, inventories and sales analysis. One of the main ways by which the accounting
group adds value is by the accumulation and consolidation of information from different
departments and the delivery of this to the appropriate decision makers. The findings
also suggest that management accountants are providing little external information to
decision-makers. The current gap between top management‘s need for external
information and what is being provided by the management accounting function is seen
as an area of concern. Management accountants need to put greater effort into
monitoring the external environment. Otherwise the challenge to provide external
information to support the more important decisions will be taken up by other
departments and will in time provide them with ever-increasing spheres of influence
within top management.
99
Further Ramos (2004) explored the importance of management accounting information
in supply chain relationships. He claimed that management accounting information is a
primary informational source for decision making and control. Effective management
accounting techniques can create considerable value for inter-organizational supply
chains by: providing timely and accurate information about the activities required for
their success (i.e to support and facilitate decisions throughout the organization);
collecting and collating information about the efficiency and quality of task
performance; and providing about the performance of managers and operating units.
Lastly, Heidmann et al. (2008) explored the role of management accounting in strategic
sense making. Their research provides evidence that managers do not primarily use
management accounting to generate information relevant to strategic issues. Instead,
this research suggests that managers use management accounting to find specific
information that helps them to substantiate information about strategic issues from
informal sources. Moreover, effective management accounting focuses organizational
attention, helps middle managers to develop interpretations of strategic issues and
provides information that enables top managers to identify and discuss these issues.
4.3.1 Summary
The literature review suggests that the roles of management accounting can be seen
from various aspects of firm‘s activities. Management accounting continues to play a
traditional role as information provider for planning, controlling, performance
evaluation and decision making. However, in the modern business environment,
management accounting has evolved to assist firms‘ management with information
relevant to value creation, and formulating and implementing strategy.
100
Regarding to the choice of variables that measure the roles of management accounting
in small firms, the research employs the list of roles provided by IFAC (1989, p.99) will
be used as a template. This approach better reflects the small firm context of the
population where it is reasonable to expect that the roles of management accounting
concentrate on decision-making, planning and control. Therefore the six selected
variables reflect the following roles of MAPs:
planning the firm‘s future strategies, tactics and operations
controlling the current activities of an organization
optimizing the use of the firm‘s resources
measuring and evaluating performance
reducing subjectivity in the decision-making process
improving internal and external communication
4.4 Management accounting within a contingency framework
Contingency-based research has a long tradition in the study of management accounting
(Chapman, 1997; Chenhall, 2003; Gerdin and Greve, 2004). The contingency approach
to management accounting is based on the premise that there is no universally
appropriate accounting system which applies equally to all organisations in all
circumstances (Otley, 1980). Rather, this theory suggests that particular features of an
appropriate accounting system will depend upon the specific circumstances in which an
organisation finds itself (Otley, 1980). Contingency theory must therefore identify
specific aspects of an accounting system which are associated with certain defined
circumstances and demonstrate an appropriate match. Researchers to date have
attempted to explain the development or change of MAPs by examining designs that
best suit contingent variables including the nature of the environment, technology, size,
structure, and strategy. For example Halma and Laats (2002) view contingent variables
101
as external and internal factors. While internal contingencies are determined as
technology, organizational aspects, and strategy; external factors indicate the features of
external environment at the level of business and accounting that shape internal
systems. The literature regarding these variables will be reviewed in the subsequent
sections.
This section starts by elucidating the findings of contingency-based management
control system (MCS) research before narrowing the focus to research into contingency-
based management accounting practices (MAPs). According to Chenhall (2003) the
terms management accounting (MA), management accounting systems (MAS), MCS,
and organizational controls (OC) are sometimes used interchangeably. MA refers to a
collection of practices such as budgeting or product costing, while MAS refers to the
systematic use of MA to achieve some goal. MCS is a broader term that encompasses
MAS and also includes other controls such as personal or clan controls. OC is
sometimes used to refer to controls built into activities and processes such as statistical
quality control, just-in-time management (Chenhall, 2003). Therefore the section starts
with a review of MCS contingency theory and MAS contingency based research. This
review is intended to identify contingent variables that are relevant to the extent of
adoption of MAPs.
4.4.1 Early contingency studies
The identification of contextual variables potentially implicated in the design of
effective MCS and MAPs can be traced to the original contingency frameworks
developed within organizational theory. During the 1960s, organizational theory
underwent a major upheaval, which led to the construction of a thorough-going
contingency theory (Otley, 1980). This stemmed, initially, from the pioneering work of
102
Burns and Stalker (1961) and was reinforced by the works of Woodward (1965) and
Lawrence and Lorsch (1967). Burns and Stalker (1961) examined the Scottish defence
electronics industry and considered the effect of environmental uncertainty on an
organization‘s structure. They outlined two types of organizational structure and
associated them with being effective responses to conditions of either high or low
uncertainty. The ―mechanistic‖ organization was seen as a suitable response to a stable
environment. In an unstable setting, environmental volatility meant that pre-planning
was virtually impossible and the suitable response was the ―organic‖ structure. This
study also suggested that there were differences in styles of communication underlying
the structural features of organizations, and directly addressed the issue of how control
information is mobilized. Woodward (1965) extended this study by examining the
effect of uncertainty and production technology on organizational structure. She
identified five distinct categories of production technology: unit production, small
batch, large batch, mass production, and process production. The findings showed that,
in a relatively uncertain environment, small-batch, and custom-design technologies
were suited to flat organizational structures with relatively few personnel. For the firms
that faced a relatively certain environment mass-production technologies in tall
organizational structures were most effective.
In subsequent literature Thompson (1967), considered the issue of interdependency
between sub-units, and Perrow (1967) highlighted the issues relating to the routine or
nature of technology. Thompson (1967) argued that organizations reduce uncertainty by
forming boundary spanning units to reduce the uncertainty that production systems must
confront. Consequently, he identified three types of interdependency among sub-units
that are widespread in modern organizations (pooled, sequential and reciprocal) and
examined how this interdependency related to the level of interaction among sub-units
103
or departments. The issue of routineness, discussed by Perrow (1967), suggested two
dimensional formulations. Routine technologies present few exceptional cases or
problems, and the analysis required to solve these problems tends to be well structured
or programmed. Non-routine technologies present more exceptions which are not
solvable in a structured, analytic manner (Ginzberg, 1980). Implicitly, both studies
simultaneously raised the issues of complexity in an organization. This concern led
Lawrence and Lorsch (1967) and Galbraith (1973), to examine how an organization
should organize its sub-tasks and activities in complex environments. Lawrence and
Lorsch (1967) considered that each organizational sub-section has its own unique
environment and responds to this environment by developing unique attributes. Their
study highlighted the need for an organization to arrange sub-tasks in a suitable manner,
and suggested the establishment of different departments for different, specific tasks.
The researchers related the difficulty of integrating these departments to two factors: the
level of differentiation between the sub-tasks and the rate at which new products were to
be introduced. On the other hand, Galbraith (1973) synthesized previous findings into a
coherent framework in his book Designing Complex Organizations. He argued that, if
the task is well understood prior to it being performed, much of the activity can be pre-
planned. If it is not understood, more knowledge and information processing is required
during task performance. Galbraith (1973) also outlined various sources of complexity.
He commented that the greater the diversity of outputs, number of resources, and level
of performance, the greater the number of factors and interactions between factors that
must be considered simultaneously when making decisions.
Overall, the above studies have demonstrated that internal factors of technology,
complexity of operations and interdependence among sub-unit are important variables
in understanding the structure and activity of complex organizations, as is the external
104
factor of environment uncertainty. These studies have established the relevance of the
contingency theory framework in studies of the determinants of the characteristics of
MCS and MAPs. The next section provides a literature review of contingency-based
MCS research.
4.4.2 An organizational framework for contingency-based management control
system (MCS) research
Commentators have suggested that contingency frameworks have over time become the
dominant logic underpinning hypothesis developed for research on control systems
design (Dent, 1990). Two notable studies (Waterhouse and Tiessen, 1978; and Otley,
1980) provided a framework of contingency theory which permitted future studies to
identify possible control requirements of various organizational types and to address a
number of design issues related to management control systems. A review of the
typological literature concerned with control system design also suggests that certain
attributes of control systems are amenable to design choice. Anthony (1965), Ansari
(1977), Gordon and Miller (1976), Mintzberg (1975), Bruns and Waterhouse (1975),
and Simons (1987), Merchant (1981, 1984), Macintosh (1981), address the structural
attributes of planning and control systems and suggest possible design modifications
contingent upon the context of their use. Example of MCS attributes include: tightness
of budget goals, use of cost control, frequency of reporting, and intensity of monitoring
performance results (Simons, 1987). The next discussion explains the contingency
variables that may be directly related to the degree of use of MCS attributes.
The external environment has been a key variable in contingency-based MCS research,
with the majority of previous studies supporting the notion that environmental
uncertainty does affect MCS. For example, Otley (1978), who studied the effect of

105
differences in the environment faced by unit managers within a single firm, found that,
by distinguishing between a tough operating environment, in which it was difficult for a
unit manager to show accounting profits, and a liberal operating environment, in which
it was relatively easy to maintain profitable operations, senior managers used budgetary
information to evaluate managerial performance in different ways in the two situations.
Similarly, Gordon and Narayanan (1984), in research concerning the relationships
among an organization's environment, structure and information systems, reported that
the characteristics of information perceived to be important by decision-makers are
related to perceived environmental uncertainty. They suggested that, when decision-
makers perceive greater environmental uncertainty, they tend to seek external, non-
financial and ex ante information, in addition to other types of information, and move
increasingly toward an organic form of organization. Chenhall and Morris (1986) also
suggested that where environmental uncertainty levels are relatively high, organizations
tend to use non-financial (broad scope) MAS information to a greater extent in order to
cope with external environmental uncertainty more effectively. Subsequently Gul and
Chia (1994), and Fisher (1996) examined the impact of perceived environmental
uncertainty (PEU) on the characteristics of MAS, and consistently supported the view
that perceived environmental uncertainty was associated with certain MAS information
characteristics.
Environmental uncertainty also includes the uncertainty caused by government policy,
deregulation and globalization, as well as the political environment. For example,
Waweru et al. (2004) found that, consistent with contingency theory, environmental
change in South Africa arising from government reform/deregulation policy and global
competitive environments contributed to management accounting and control system
change processes. Kattan et al. (2007), who studied the effect of external factors on the
106
design and implementation of management accounting systems in Palestinian
companies, concluded that management accounting and control systems are more
mechanistic in times of environmental and political stability and more organic in
periods of greater uncertainty.
Apart from the above contingent variables, a popular component of environmental
uncertainty is market competition. Khandwalla (1972) argued that competition is likely
to accentuate the use of controls, and hypothesized that the greater the competition, the
greater the need to control costs, and to evaluate whether business functions are
operating according to expectations. Thus the sophistication of accounting and control
systems was influenced by the intensity of the competition. Similarly Libby and
Waterhouse (1996) argued that companies operating in a competitive environment are
expected to have a high rate of change in their management accounting systems as in
such an environment appropriate costing systems and performance measurements are
key to survival. They found moderate support for the proposition that more intensely
competitive environments would lead to the use of a wider variety of management
accounting systems. The rational explanation is that complex and different types of
information are needed before making any crucial decisions in such an
environment.These results were supported by Mia and Clarke (1999), who explained the
relationship between intensity of market competition and business unit performance by
incorporating into the model a variable related to managers‘ use of information provided
by the MAS. The results showed that the intensity of market competition was a
determinant of the use of the information, which, in turn, was a determinant of business
unit performance.
107
However, Merchant (1984) found that the market factor as a proxy for an element of
environmental uncertainty is not systematically related to a firm‘s budgeting system.
Merchant (1984) added that these negative results may be particular to the industry
(electronics) or function (manufacturing) sampled, methodological limitations
(especially measurement) or the hypotheses may simply have been incorrect, and
concluded that further research on these questions was necessary. Williams and Seaman
(2001) also found a significant and negative relationship between management
accounting systems in Singapore and the intensity of competition. They reasoned that
the firms were in a good position in terms of resources and had no pressure to innovate.
Another general factor that has long been recognized as influencing the design of
control systems is technology. Merchant, 1984 argued that:
If production processes are relatively routine and repetitive, task uncertainty is
relatively low and organizational coordination is easily accomplished with
programmed interactions (Hage & Aiken, 1967). This means it becomes easier
to use budgeting, itself a programming process, and accounting performance
measures as central parts of the organizational control system (Hirst, 1981;
Bruns & Waterhouse, 1975; Khandwalla, 1974; Reeves & Woodward, 1970).
Consequently Merchant (1984) tested whether or not differences in approaches to
budgeting at the departmental level were systematically related to differences in
production technologies. The results showed that automation of processes and
standardization of output, both indicators of the repetitiveness of technology, had a
positive relationship with the reliance placed on budgeting, and custom technologies
were associated with a de-emphasis on budgetary control and an increased reliance on
other methods of control, such as direct supervision. More recent research has
108
established that other aspects of technology, such as information technology, have an
effect on the MCS. For example, Waweru et al. (2004), in a field study of management
accounting and control systems in South Africa, found that one of the main motivators
of change in management accounting and control systems to be changes in technology,
in particular information systems.
A further contingent variable is the departmental interdependence, that is, the extent to
which departments depend upon each other for resources to accomplish their tasks
(Gerdin, 2005). Hayes (1977), who extended the ideas of Lawrence and Lorsch (1967),
developed a model of organizational performance for internal sub-units. He concluded
that within a contingency context, the relevant assessment methods were determined by
subunit type, subunit interrelationships and the extent of environmental influence on
subunit functioning.
In a subsequent study, Macintosh and Daft (1987) found that the level of departmental
interdependence impacted on the design and use of management controls. They
investigated three elements of management controls: the operating budget; periodic
statistical reports; standard operating policies and procedures, and reported that:
standard operating procedures were an important control device when
interdependence was low;
budget and statistical reports were used more extensively when interdependence was
moderate; and
when interdependence among departments was high, the role of all three control
systems diminished.
109
Extending this study, Gerdin (2005) examined the combined effect of departmental
interdependencies and organizational structures on MAS design as one of the
mechanisms of MCS. The results support the notion of a combined effect from
departmental interdependence and organizational structure on MAS design. The
findings also suggest that it may not be important to assume automatically that there is a
one-to-one relationship between context and MCS design. Rather, different control
mechanisms available in the control package may well combine in different ways in a
particular context.
The size of a firm has also been shown to affect the way in which control systems are
utilized. Blau (1970), for instance, argued that the expanding size of organizations gives
rise to the increasing subdivision of responsibilities, facilitates supervision, widens the
span of control of supervisors, and, simultaneously, creates structural differentiation and
problems of coordination that require supervisory attention. Merchant (1981) added that
contingency theory suggests that the larger the business, the more likely it is that
management will want formal, rather than informal, information systems. Larger firms
tend to make greater use of more formal administrative controls, as opposed to informal
procedures. Merchant (1984) also reported that size was positively related to the degree
of formality in the use of budgeting system. Similarly Puxty and Lyall (1989) indicated
that larger companies were employing both standard costing and budgeting systems
more frequently than smaller firms.
Increased size has, in turn, been associated with structural characteristics. Blau (1970)
stated that a firm‘s size has affected the organizational structure of the firm, which as a
consequence, has led to functional differentiation. Khandwalla (1972) found that large
firms were more diversified in product lines, as well as more divisionalized, and
110
employed mass-production techniques and more sophisticated controls. Gordon and
Miller (1976) argued, furthermore, that, as the administrative task becomes more
complex, sub-tasks and responsibilities must be delegated to lower levels of
management to ease the burden of decision-making. Thus, increased environmental
dynamism, heterogeneity and hostility must often be accompanied by decentralization
of power and responsibilities. Such decentralization might take the form of
divisionalization and/or departmentalization. Flamholtz (1983) considered that several
structural dimensions contribute to the process of control including the degree of
centralization or decentralization, functional specialization, degree of vertical or
horizontal integration and the span of control. Some dimensions of organizational
structure (i.e. functional specialization or rules) facilitate control by reducing the
variability of behavior and, in turn, increasing its predictability. Other dimensions (i.e.
centralization) facilitate control by direct influence over the decision making process for
non-programmable events. Merchant (1981) found that a greater diversity and degree of
decentralization generated a need for more administrative control. Chenhall and Morris
(1986) also found that decentralization was associated with a preference for aggregated
and integrated information in MAS design. Gerdin (2005) argued that based on Bruns
and Waterhouse (1975), and Merchant (1981, 1984), four design elements were
identified, which have the potential to influence MAS design, namely degree of
behavior formalization (i.e., the extent to which work processes are standardized), unit
size, complexity (degree of differentiation), and degree of decentralization. These
elements have also been found to be relevant in more recent contingency-style
accounting-control research. Strategy has been identified as a possible contingent factor
in MCS design. For example, Simons (1987) investigated the relationship between
business strategy and accounting-based control systems. Simons‘ sample of 76 firms
111
was split into ‗defenders‘ and ‗prospectors‘12
, and he reported that significant
differences were found between prospectors‘ and defenders‘ control systems. Simons
concluded, furthermore, that effective prospectors used their financial control systems
more intensively than defenders, with tighter budget goals and more frequent reporting,
and placed more emphasis on forecasts and outputs than cost controls. Cunningham
(1992), who examined management control and accounting systems under competition
and competitive strategy, indicated that management control and accounting systems are
not only adequate competitive strategies, but also are able to enhance the effectiveness
of the strategies.
4.4.2.1 Evidence from SMEs
The role of MCS in small to medium-sized enterprises (SMEs) has received little
attention in the contingency-based literature. The main studies in this area are Amat et
al. (1994), and Reid and Smith (2000), who both conclude that various factors in the
external environment impact on choice of MCS by SMEs. Amat et al. (1994)
highlighted how the external environment affected MCS design by using a case-study-
based approach on one company, DERESA. DERESA was a Spanish company and the
research covered a period over which it developed from a family-run small business
with an informal control style to a professionally managed medium-sized firm having a
formal, MAS based control system. The research reported a direct link between
DERESA‘s development and changes in the Spanish economic and political systems,
and observed that the legitimation of professional management had influenced changes
in the MCS. They also concluded that a double-level focus on control, at both
organizational and national levels, provided a better understanding of why certain
control changes came about and why they took the form they did. Reid and Smith
12
a ‗Defender‘ tries to hold market position and seeks stability, while a ‗Prospector‘ pioneers in new
products and services (Collins et al. 1997)
112
(2000) in a wider population studied the impact of contingencies on MAS development
in Scottish micro-firms. This study found that the timings of cash flow crises, funding
shortages and innovation corresponded with significant stages in information system
development, especially in the cases of cost management and computer applications.
They also discovered that, except for technological aspect; production systems, strategy
and the market environment determined the organizational form of the small firm. They
also found that the complexity of the MAS adopted was determined significantly by
sub-unit interdependence.
4.4.3 An organizational framework for contingency-based MAP research
The contemporary contingency theory of management accounting has the limited aim of
explaining how particular circumstances (contingencies) shape the use of MAPs.
Contingency-based MAP research applies and expands the contingent variables used in
research into organizational structure and MCS, and attempts to use contingent
variables to explain the MAPs in an organization.
As with organizational structures and MCS, major studies have stressed the importance
of external factors, which are often characterized as environmental uncertainty or
market forces, as explanatory variables when examining the development of MAPs.
Bruns and Kaplan (1991) identified competition as the most important external factor
for stimulating managers to begin to work on a new cost system. Anderson and Larnen
(1999) explored the evolution of a broad range of MAPs in 14 Indian firms and found
that changes in the external environment prompted changes in MAPs. Luther and
Longden (2001) confirmed that contingent factors such as the intensity of competition
and volatility of environment caused management accounting change in South Africa.
Similarly, Haldma and Laats (2002), who examined the MAPs of Estonian
113
manufacturing companies, argued that environmental uncertainty had an impact on
organizational structure, performance evaluation, budgeting and budgetary control, and
is associated with more open and externally focused financial accounting systems. They
also found that changes in MAPs are associated with shifts in the external business and
accounting environment. Szychta (2002), who investigated the application of
management accounting concepts and methods in Polish firms, concluded that one of
driving forces behind the use of management accounting is shifts in business
environment.
In contrast, Hoque and James (2000) found no support for their hypothesis of a positive
association between a strong market position (market factor) and a greater reliance on
the use of a newly developed MAP: the BSC. Similarly O‘Connor et al. (2004) did not
find support for the hypothesis that Chinese enterprises faced with increased market
competition would make greater use of Western MAPs. This result is consistent with
the findings of Merchant (1984), discussed above who concluded that there seemed to
be little or no relationship between market factors and a firm‘s budgeting system.
Apart from external factors, the contingency variable of production technology has also
been employed in examining the employment of MAPs. Tayles and Drury (1994)
studied the impact of advanced manufacturing technologies (AMTs) on management
accounting systems. This study reported three main results: (i). the methods used to
evaluate investment in modern manufacturing made little distinction between an
investment of an AMT or non-AMT nature; (ii). in general only a minority of
accountants with experience of Just in Time (JIT) systems considered that JIT adoption
caused change to occur in their company‘s accounting system for generating product
costs. However, on balance, those with experience of flexible manufacturing system
(FMS) (these were predominantly in motor vehicles and electrical industries) suggested
114
that a significant or very significant change did occur; and (iii). accountants with
experience of the development of AMTs stated that these technologies had a significant
or very significant effect on changing their company‘s management accounting system
for performance measurement and control. Abdel-Maksoud et al. (2005) found that
relatively sophisticated MAPs exist in firms that have made significant investment in
AMT, Total Quality Management (TQM) and (JIT). Their findings were supported by
Al-Omiri and Drury (2007), who reported that higher levels of cost system
sophistication are positively associated with the extent of the use of JIT and lean
production techniques. Similarly, Abdel-Kader and Luther (2008) concluded that
differences in management accounting sophistication are explained by the adoption of
AMT, TQM and JIT systems. Szychta (2002) also agreed that technology is one of
driving forces behind the shift in use of MAPs in Poland.
As with other contingency studies, the size of firm has been shown to affect the design
and scope of MAPs see for example, Holmes and Nicholls (1999), Lamminmaki and
Drury (2001), Brown et al. (2004), Cadez and Guilding (2008), Abdel-Kader and Luther
(2008). Research has also shown that larger firms have more sophisticated MAPs. For
example, Hoque and James (2000) in a survey of 66 Australian manufacturing
companies noted that larger firms make more use of a BSC. Joshi (2001) reported that
the organisational size was found to be an important factor in the adoption of advanced
MAPs in India. Similarly, Cadez and Guilding (2008) found that SMA usage is
positively associated with company size. A possible reason is that larger organizations
have greater resources than their smaller counterparts and can, therefore, afford to adopt
more sophisticated MAPs (Haldma and Laats, 2002; Al-Omiri and Drury, 2007; and
Abdel-Kader and Luther, 2008). Bjoernak (1997) argued that large organizations have
large information fields and the necessary infrastructure which would facilitate the
115
adoption of sophisticated MAPs. Apart from that, as organizational size increases,
formal management control, and sophisticated MAPs, may be expected to become more
important.
As with MCS, another internal contingent variable is organizational structure. Abdel-
Kader and Luther (2008) indicated that sophisticated MAPs are more widely applied in
firms that have a decentralised structure.
The next internal factor, which is commonly advanced as a possible explanation for
variations in MAPs, is firm strategy. Collins et al. (1997) investigated the relationship
between business strategy and budgetary usage in the context of a perceived crisis in
Latin America. Using the Miles and Snow (1978) typology, it was hypothesized that a
‗Defender‘ and ‗Reactor‘ strategy usage would be positively associated with crisis,
while a ‗Prospector‘ and ‗Analyser‘ strategy usage would be negatively associated with
crisis. However, the results indicated that the only significant relationship was between
a Prospector strategy and budgetary usage. Gosselin (1997) showed that strategy
influenced the extent to which strategic business units (SBUs) adopted ABC. Hoque
(2004), meanwhile, discovered a significant and positive association between strategy
and management‘s use of non-financial measures for performance evaluation. Cadez
and Guilding (2008) examined the effect of strategic choices on SMA, finding that
SMA usage is positively associated with adopting a prospector strategy, deliberate
strategy formulation, and accountants‘ strategic decision making participation.
However, Abdel-Kader and Luther (2008) found no evidence of a relationship between
management accounting sophistication and competitive strategy.
116
A study by Brown et al. (2004) added a new organizational factor in the literature. They
found that top management support influenced the transition from not having
considered ABC to initiating interest in ABC. They argued that organizational factors
may be more important in explaining the adoption of innovative MAPs than other
factors.
4.4.3.1 Evidence from SMEs
Contingency factor research in smaller firms is very limited. However, the few studies
that exist have identified several variables that may affect the development of MAPs in
these firms. The possibility of a relationship between the external environment and
strategic planning was hypothesized by O‘Regan et al. (2008). The results found a
positive association between the extent of awareness of the external environment with
the uptake of strategic-planning processes in smaller firms.
In organizations such as SMEs, one important issue that might limit the adoption of
MAPs is the abilities and competencies of the available human resources. Studies of
SMEs have highlighted the importance of qualified accounting staff and owner/manager
attitude as factors that may be associated with the adoption and development of MAPs.
Collis and Jarvis (2002) examined the association between the use of financial
information and the management of small, private companies. MAPs were identified in
as a source of financial information, and the research concluded that qualified
accountants, together with the generally high level of education and training of the
accountant, may aid the generation and analysis of financial information. Collis and
Jarvis (2002) also found a positive relationship between company turnover and the
receipt of advice or recommendations from their external accountant at the time the
statutory accounts are produced and the regular production of periodic management
117
accounts. The regular generation of budgeted information and use of sophisticated tools
for financial planning and control were found to be dependent upon the availability of
professional financial expertise within the company. McChlery et al. (2004), who
analysed barriers and catalysts to sound financial management systems in SMEs, also
argued that proactive external accountants or qualified staff/accountants play important
roles in the development of management accounting in SMEs. Sousa et al. (2006), who
examined performance measurement in English SMEs, found that poor training of
employees was the major obstacle to the adoption of new performance measures. This
situation may reflect a lack of skills by employees and a difficulty in understanding the
performance measurement process.
Apart from the roles played by qualified staff, owner/managers also have part in the
development of MAPs. Holmes and Nicholls (1989) reported that the education level of
a business‘s owner/manager has a significant influence upon the acquisition or
preparation of accounting information. Lybaert (1998), who analysed the influences on
the information use in SMEs among Belgian SME owner/managers, found that a greater
use of information in managing the firm was present when SME owner/managers had a
greater strategic awareness, less experience of working in other firms prior to the
present position and a greater desire for growth.
4.4.4 Summary
Section 4.4 has reviewed the extensive literature on the association between contingent
factors and organizational structures with special reference to contingent factors that
affect the application of MCS and MAPs. A significant portion of the studies are based
on work in larger companies as research into contingent variables. However in SMEs is
the research into this area is very limited especially in developing countries. The
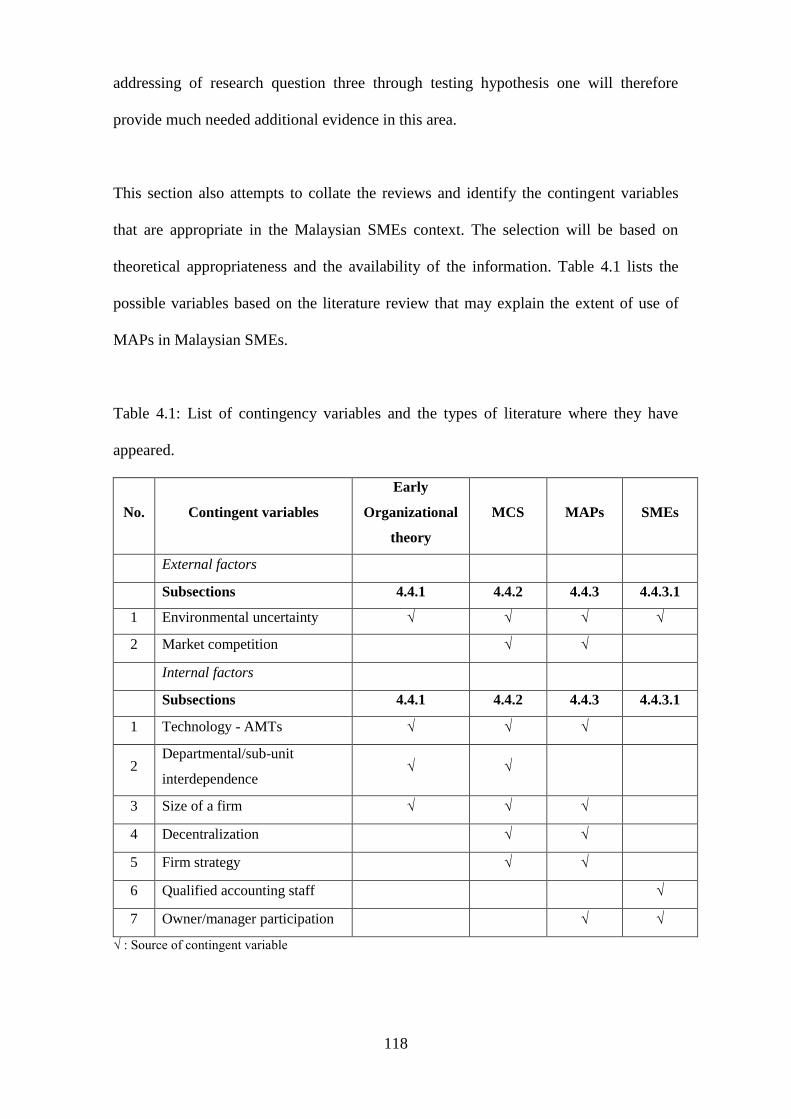
118
addressing of research question three through testing hypothesis one will therefore
provide much needed additional evidence in this area.
This section also attempts to collate the reviews and identify the contingent variables
that are appropriate in the Malaysian SMEs context. The selection will be based on
theoretical appropriateness and the availability of the information. Table 4.1 lists the
possible variables based on the literature review that may explain the extent of use of
MAPs in Malaysian SMEs.
Table 4.1: List of contingency variables and the types of literature where they have
appeared.
No. Contingent variables
Early
Organizational
theory
MCS MAPs SMEs
External factors
Subsections 4.4.1 4.4.2 4.4.3 4.4.3.1
1 Environmental uncertainty √ √ √ √
2 Market competition √ √
Internal factors
Subsections 4.4.1 4.4.2 4.4.3 4.4.3.1
1 Technology - AMTs √ √ √
2 Departmental/sub-unit
interdependence √ √
3 Size of a firm √ √ √
4 Decentralization √ √
5 Firm strategy √ √
6 Qualified accounting staff √
7 Owner/manager participation √ √
√ : Source of contingent variable

119
Table 4.1 analyses contingent variables between those based on external factors and
those from internal factors that arise from within the firm. External factors that proxy
for environmental uncertainty have been widely used in contingency studies including
those into the adoption of MAPs and those testing the application of contingency theory
in SMEs. External factors have also been represented by the narrower measure of
market competition and this measure has been used widely in contingency studies
focusing on MCS and MAPs but has not yet been tested in SMEs. Internal variables
reflecting technology and size of a firm have been extensively tested except in SMEs.
Other internal variables related to departmental interdependency, decentralization and
strategy have also received attention in studies of organizational theory, MCS and
MAPs but not in a SME context. The only two internal variables that have been found
in studies of SMEs are qualified accounting staff and owner/managers‘ participation.
For the purpose of this research, five contingent variables are selected, based on their
relevance. Thus, four remaining variables are excluded because they are not suitable
with nature of SMEs. The justifications for the exclusion of these variables will be
addressed after the choice of variables has been explained.
The section first starts with the explanation for the choice of the five variables for
testing the first hypothesis; that there is a positive relationship between selected
contingent variables and the extent of use of MAPs. The five selected contingent
variables are as follows:
1. External factors
The intensity of market competition.
Market competition possibly has a greater overall impact on SMEs because the
population of SMEs, which represents the largest share of the business population in

120
Malaysia, creates significant elements of competition in the market. It has been argued
that the intensity of market competition can play a major role in encouraging
management to enhance management accounting systems and adopt sophisticated
MAPs (Khandwalla, 1972; Libby and Waterhouse, 1996; Bjornenak, 1997; O‘Connor et
al., 2004; and Al-Omiry and Drury, 2007). As competition increases, a more reliable
management accounting information is likely to be needed by the firms to compete
effectively and avoid planning based on erroneous information when making decisions
(Cooper, 1988). Therefore market competition appears to be a more relevant for the
purpose of this study and will be used in testing whether or not external factors
positively affect the extent of use of MAPs in Malaysian SMEs.
2. Internal factors
Advanced manufacturing technology
The use of modern technology in production activities has been shown to impact on the
extent of use of MAPs in many populations but not for SMEs. Even though advanced
production techniques may be limited to smaller firms, it is believed that manufacturing
firms employ technology of some form in assisting their production activities.
Moreover, in today‘s modern business, technology has been evolving very quickly and
has been widely disseminated. For this reason, it is essential to test this variable as one
of the potential contingent factors that explain the extent of use of MAPs in SMEs.
Size of a firm
Previous studies (e.g., Merchant, 1984; Haldma and Laats, 2002; Al-Omiri and Drury,
2007; Abdel-Kader and Luther, 2008) have demonstrated consistently that a firm‘s size
has impacted the use of MAPs in business organizations. A larger firm has greater total
resources, and better internal communication systems that facilitate the diffusion of

121
MAPs. In addition larger firms are more complex and face more difficult problems. In
consequent they require more control of, and information on, their business activities
and, therefore, need more comprehensive and sophisticated MAPs. Thus it is essential
to test whether the size of the SMEs will be associated with a greater use of MAPs. This
study will examine two categories of SMEs - small-sized and medium-sized firms and
will investigate whether there is a difference in the extent of use of MAPs between the
two categories caused by their relative size.
Participation of owner/manager of firm
An owner/manager by definition will be involved in the management of the firm, the
participation of the owner/manager of the firm - but the level of this participation might
vary and this might be a factor which influences the extent of use of MAPs. Previous
research in management accounting supports this contention (see for example Shields,
1995; Lybaert, 1998; or Brown et al., 2004), therefore this variable will be a contingent
variable for testing the first hypothesis that there is a positive relationship between the
participation of the owner/manager and the extent of use of MAPs in SMEs.
The level of qualification of accounting staff
In small firms, the existence of qualified internal accounting staff can be a significant
factor underlying the adoption of MAPs. Most large firms have specific accounting and
finance departments and prefer, therefore, to hire qualified internal staff to do
professional reporting and consultation. However, in the case of SMEs, it is doubtful as
to whether qualified internal accountants will have been hired in all firms and even if
hired whether these staff have recognized qualifications. The differences between firms
in the availability of staff to operate MAPs may explain differences in the use of MAPs
122
between SMEs. Therefore this variable is important and will be included for the
purposes of testing the first hypothesis.
However, there are concerns as to whether qualified accounting staff should be treated
as an exogenous variable or endogenous variable. This distinction depends on whether
the presence of qualified accounting staff causes the adoption of MAPs or if their
adoption leads to qualified accounting staff being employed. The former argument
suggests that qualified accounting staff should be treated as an exogenous variable and
the latter indicates the endogenous character of the variable. Previous literature provides
some support for the exogenous nature of this variable. For example Halma and Laats
(2002); Al-Omiri (2003) and Ismail and King (2007) suggest that the presence of
competent accounting staff is associated with a high level of uptake of MAPs; while in a
SME context, both Collis and Jarvis (2002) and McChlery et al. (2004) suggested that
qualified accountants help the development of MAPs in SMEs. Haldma and Laats
(2002) claimed that a shortage of qualified accountants may serve as a barrier to the
wider application of modern management accounting techniques. Given these views, the
level of qualification of accounting staff will be included as one of the exogenous
factors that might affect the uptake of MAPs, but the use of this variable will be treated
more cautiously in the multivariate analysis. The justifications for excluding the four
other variables set out in Table 4.1 are as follows:
1 Environmental uncertainty
Small firms usually exist in a limited operating environment, as opposed to large
companies, which have a larger market, either domestic or international. However, it
cannot be denied that small firms are also exposed to environmental uncertainty, such as
government regulations, the general economic environment, and political instability.

123
The impact of environmental uncertainty should be significant if the SMEs operate in
the international market. However, generally, the overall impact of environmental
uncertainty on SMEs that operate in a limited operating environment will be small and
indirect. Therefore this variable is excluded.
2 and 3 Departmental/sub-unit interdependence and decentralization
As had been stated by Blau (1970), a firm‘s size has affected organizational structure of
the firm. Large firms were more diversified in product lines, as well as accompanied by
high interdependency and decentralization of power and responsibilities (see
Khandwalla, 1972; and Gordon and Miller, 1976). It seems the small firms are not big
enough to have both a departmental interdependence and decentralized structure. In
general, small firms have less complex business activities and, therefore, require fewer
departments in comparison to larger firms. As a result, the level of interdependency
among these departments is lower, compared with large firms, and the need to
decentralize the control authority is not as important as in large companies. Smaller
firms are, rather, using more interpersonal control through centralized structures to gain
full control of authority. For these reasons, therefore, both variables will not be taken
into account in this study.
4 Firm strategy
Previous research into strategy as a contingent factor has employed models, such as the
Miles and Snow (1978) strategy typology or the Porter (1980) model of generic
strategies, in testing this variable. There are no studies examining the possibility of a
relationship between a strategy variable and the extent of use of MAPs in an SME
context. This situation may be due to the difficulties in obtaining information about
strategies in SMEs probably because many SMEs will not have formalized strategic

124
planning processes. Given this lack of an available data source, this variable will be
disregarded in this study.
Other potentially relevant factors such as profitability, age/maturity of firm, ownership
of firm are not addressed due to limited evidence in the previous literature regarding the
positive relationship between these variables and the use of MAPs particularly in the
SMEs context. Therefore these factors are disregarded in this study and the research
focuses only on selected contingent factors.
Additional factor: Industry sub-sector
It is likely that the industry sub-sector that the respondent firms are in may have certain
relationship on the use of MAPs. This is premised on the belief that certain industries
because of their nature would be likely to have certain management accounting systems.
Therefore the data on the sort of manufacturing subsectors will be utilised in
investigating whether the different subsectors have a relationship with the use of MAPs
in Malaysian SMEs. This section has justified the selection of five contingent variables
for this study (size of the firm, market competition, advanced manufacturing technology
(AMT), participation of owner/manager and qualified accounting staff). The literature
review of each of the factors asserts that these factors affect the extent of use of MAPs
in an organisation. The literature review therefore supports the intended first hypothesis
associated with the third research question as follows:
H1: There are significant and positive relationships between selected contingent
factors and the use of MAPs.
The next section continues the review of prior literature by discussing the last topic the
link between the use of MAPs and organizational performance.
125
4.5 Management accounting practices and organizational performance
Mia and Clarke, (1999) stated that the performance of an organization/division may be
viewed as the extent to which the organization/division has been successful in attaining
its planned targets. Examples of performance measures include: productivity, cost,
quality, delivery schedule, market share, sales growth rate, operating profit, cash flow
from operation, return on investment, new product development, R&D activity, and
personnel development. Although many researchers have advanced the view that
improved management accounting systems would lead to a better performance by firms
(Mia and Clarke, 1999; Mitchell and Reid, 2000; and Reid and Smith, 2002), there is
only limited research supporting this position. Recently, a number of studies have
attempted to remedy this situation. These will now be considered. The studies in this
area have either examined a hypothesized direct relationship between the use of MAPs
and organizational performance or tested this association with MAPs as just one of a
number of explanatory variables. These studies have found mixed results in terms of the
impact of MAPs on organizational performance. The following review analyses studies
between those yielding positive and negative results.
4.5.1 Positive results
Some positive results have been found on studies related to budgeting, performance
measurement, ABC and other MAPs. These are documented below.
Positive evidence for an association between the use of budgeting and performance
Merchant (1981) was an early study which sought to establish a relationship between
the use of budgeting and performance by testing for an association between
organizational performance and the approach of the firm to budgeting. Two distinct
approaches were defined and termed the formal administrative approach and the

126
interpersonal approach. The findings indicated that the formal administrative approach
to budgeting was more strongly related to good performance in larger firms than in
smaller firms, which tended towards a more interpersonal approach to budgeting.
Tangentially, Hansen and Van Der Stede (2004) who investigated the reasons for
budgeting in organizations and their link with performance found that three reasons-to-
budget (operational planning, performance evaluation, and strategy formation) were
positively associated with organizational unit performance.
Positive evidence on performance measurement and performance
Traditionally, performance measures have been internal, aggregate metrics of financial
performance (Chenhall and Langfield-Smith, 2007). However the relevance of this
measure has been challenged in the current business environment. Competition has
compelled firms to implement management strategies and systems to overcome
dissatisfaction with traditional short-term perspective financial measurement systems
(Said et al., 2003). Hence, in recent years organizations have sought to develop more
comprehensive PMS to provide managers and employees with information to assist in
managing their firm‘s operations (Hall, 2008). The BSC approach to management
(Kaplan and Norton 1992; 1993; 1996) has gained prominence in management
accounting research as a way of integrating financial and nonfinancial performance
measures (Hoque and James, 2000). The implementation of BSC and its impact on
performance was investigated by Hoque and James (2000), and Jusoh et al. (2008).
Maiga and Jacobs (2003), who tested for complementary effects between BSC and
ABC, found that ABC, when combined with BSC, had a significant positive impact on
organizational performance. Jusoh et al. (2008), who investigated the extent of multiple
performance measures usage and effects on the performance of Malaysian
manufacturers, suggested that the use of non-financial measures particularly, internal
127
business process and innovation and learning perspectives of the BSC, enhanced firm
performance.
Positive evidence on non-financial performance measurement and performance
There has been an increased organizational use of non-financial measures for
performance evaluations in recent years (Hoque, 2004). Studies reporting a positive
association between this measure and its performance include those of Anderson et al.
(1994); Abernethy and Lilis (1995); Ittner and Larcker (1998b); Banker et al. (2000);
Said et al. (2003); and Bryant et al. (2004). Anderson et al. (1994) supported the
hypothesis that, on average, customer satisfaction was positively related to
contemporaneous accounting return on investment, Ittner and Larcker (1998b) provided
evidence that customer satisfaction measures are leading indicators relating non-
financial performance to accounting performance. In a subsequent study Banker et al.
(2000) revealed a positive relationship between customer satisfaction measures and
future accounting performance. Using a wider range of non-financial measures, Said et
al. (2003) examined the current and future performance consequences of incorporating
non-financial measures by reference to a set of performance metrics among U.S
companies. Based on performance measured as accounting-based measures (ROA) and
market-based measures, they reported that the use of non-financial measures in
evaluating performance had positively affected market performance. In a later study
Bryant et al. (2004) suggested that when firms implement a PMS that contains both
financial and non-financial measures, they will benefit more than the firms that rely
solely on financial measures. In particular, they found that there is a positive relation
between financial outcomes and both customer satisfaction and new product
introductions which holds only for firms that use both financial and non-financial
measures in their performance.

128
Positive evidence on ABC and performance
Shields (1995) found a positive association between the implementation of ABC and the
success of the firm reporting that 75 percent of their sample had received a financial
benefit from implementing ABC. Kennedy and Affleck-Graves (2001) adopted an
event-study approach by matching 37 firms that adopted ABC between 1988 and 1996
with an equivalent number of non-adopting firms listed on the London Stock Exchange.
They suggested that firms in the UK adopting ABC techniques outperformed matched
non-ABC firms. Further analysis suggested that ABC added to firm value through better
cost controls and asset utilization, coupled with greater use of financial leverage. Ittner
et al. (2002) examined the association between ABC and manufacturing performance.
Results using a cross-sectional sample of U.S, manufacturing plants indicated that
extensive ABC use is associated with higher quality levels and greater improvements in
cycle time and quality, and is indirectly associated with manufacturing cost reductions
through quality and cycle time improvements.
Positive evidence on the combined effect of MAPs and other factors on performance
A number of studies have investigated the use of MAPs in conjunction with other
variables as determinants of performance. Abernethy and Lilis (1995) found that a
greater reliance on efficiency-based performance measures had a greater positive effect
on perceived performance in flexible firms than in non-flexible firms. Similarly, Hoque
(2004) revealed the existence of a significant and positive association between
management‘s strategic choice and performance which was related to management‘s
high use of non-financial measures for performance evaluation. Hall (2008) integrated
the effect of PMS on managerial performance through the mediating variables of role
clarity and psychological empowerment. The results indicated that comprehensive PMS
influenced managers‘ cognition and motivation, which, in turn, influenced managerial
129
performance. Another study by Hyvonen (2007) investigated the relationships between
organizational performance and customer-focused strategies, performance measures and
information technology. The results indicated that when a firm does not follow a
customer-focused strategy, contemporary MAS in combination with advanced
information technology are related to high customer performance. Finally, the results
show that a fit between the customer-focused strategy and financial performance
measures improves customer performance.
Beyond performance measurement, a number of studies have explored other mediating
variables in understanding the relationship between MAPs and performance. For
example, Choe (2004) integrated organizational learning in investigating the effects of
management accounting information required by AMT for attaining improved
production performance. The empirical results demonstrated that facilitators of
organizational learning have a moderating impact on the relationship between provision
of information and performance improvement. Therefore, it was concluded that when
learning facilitators are well arranged and highly utilized, the provision of information
is more likely to be linked to effective learning and, consequently, improved
performance. Tayles et al. (2007) examined whether the level of intellectual capital (IC)
influences MAPs and performance. Their research suggests that the level of investment
in IC is associated with use of MAPs, business performance, and the ability to respond
to future events. In a subsequent study, O‘Regan et al. (2008) attempted to assess the
link between strategic-planning, aspects of the external environment and overall
corporate performance in U.K manufacturing SMEs. The results show that strategic-
planning in manufacturing SMEs is positively linked to overall corporate performance.
130
Other related studies and positive results
Other studies that are closely related to MAPs also provide additional evidence as to the
impact of MAPs on performance. For example, Gul (1991) examined the interaction
effects of MAS and perceived environmental uncertainty on Australian small business
managers' perceptions of their performance. The results confirmed the hypothesis that
the effects of MAS on performance were dependent on environmental uncertainty.
Under high levels of uncertainty, sophisticated MAS had a positive effect on
performance but under low levels it had a negative effect. Mia and Chenhall (1994)
examined the role of broad scope of MAS information in enhancing managerial
performance. The proposition was that differentiation of activities into areas such as
marketing and production is an organizational response to manage uncertainty. The
results indicated that the association between the extent of use of broad scope MAS
information and performance was stronger for managers of marketing than production
activities. In a later study, Mia and Clarke (1999) investigated the relationship between
the intensity of market competition and business unit performance by reference to
managerial information provided by the MAS. Using perceptual measures, they found
the intensity of market competition to be a determinant of the use of the information
which, in turn, is a determinant of business unit performance. Similarly, Williams and
Seaman (2002) explored the indirect effect of management accounting and control
system (MACSs) change on departmental performance within 232 medium-sized
Singaporean firms. The results showed that MACSs change affected performance but
not directly. Instead, this relationship was mediated by managerial-relevant information
(MRI) that is itself impacted by MACSs change, and which, in turn, enhances
performance. Sim and Killough (1998) investigated whether manufacturing practices
and MAS interactively affect performance among U.S manufacturing companies. The
findings support the notion that production systems (TQM and JIT) and MAS (such as
131
performance contingent rewards) can have complementarities, or synergistic effects on
performance Later, Maiga and Jacob (2006) assessed whether firms involved in quality
benchmarking projects achieved greater actual quality improvements. The results
indicated a strong positive relationship between benchmarking antecedents and quality
improvement and the significant impact of quality improvement on relative costs
improvement, which in turn is significantly associated with profitability. The next
section discusses studies that report negative results.
4.5.2 Negative results
As well as studies supporting a positive association between the use MAPs and
performance, other studies found either no relationship or a negative one. For example,
Klammer (1973) examined the relationship between the sophistication of capital
budgeting techniques used by the firm and performance. No consistent significant
association between performance and capital budgeting techniques was found. Klammer
(1973) argued that the mere adoption of various analytical tools would not deliver
superior performance, and that other factors, such as marketing, product development,
executive recruitment and training and labour relations, are likely to have a greater
impact on profitability. The finding re-affirms the message that sophisticated capital
budgeting methods do not guarantee better performance. Perera et al. (1997) found that
there is no association between the use of non-financial measures and perceived
performance in plants that follow a customer-focused manufacturing strategy. Ittner and
Larcker (1998b) found modest support for claims that customer satisfaction measures
are leading indicators of customer purchase behavior, growth in the number of
customers, and accounting performance. They also found some evidence that firm-level
customer satisfaction measures can be economically relevant to the stock market but are
not completely reflected in contemporaneous accounting book values. Young and Selto

132
(1993) found little evidence that the use of non-financial measures in JIT facilities was
associated with differences in manufacturing performance. In the U.S, Gordon and
Silvester (1999) used an event-study approach to investigate the impact on firm value of
an announcement that firms were using ABC. They found that the announcement of
ABC use did not affect firm stock values. This result is further supported by Ittner et al.,
(2002) who found extensive ABC use has no significant association with return on
assets.
4.5.3 Types performance measures used in the literature
The majority of the studies can be categorized into those reliant upon available
published data and those employing measures of the manager‘s perception of
performance. The greater proportion of studies use secondary data such as stock price
performance and data from the financial statements of public listed companies (see for
example, Ittner and Larcker, 1998a; Kennedy and Graves, 2001; Choe, 2004; Maiga and
Jacob, 2006) - but a significant number have relied on perceptual measures, for example
Merchant (1981); Gul (1991); Lybaert (1996); Hoque (2004); Hall (2008); and Jusoh et
al. (2008).
The use of perceptual measures reflects problems with the availability and reliability of
objective performance data. For example, Garg et al. (2003) pointed to the reluctance of
MDs/CEOs of manufacturing firms to provide detailed accounting data on their firm‘s
performance. The problem is more acute in the case of privately owned SMEs where, as
Lybaert (1996) argued, many SME owner/managers, as well as desiring secrecy, are
unfamiliar with the precise internal ‗hard‘ figures. For these reasons, a self-rating
measure or subjective evaluation may be effectively used when objective performance
data are unavailable (see for example Dess and Robinson, 1984; Gul, 1991) – and this is

133
commonly done. Hall (2008) noted that the Mahoney et al. (1965) scale is frequently
used to measure managerial performance in accounting studies (see for example, Chong
and Chong, 2002; or Parker and Kyj, 2006).
As can be seen both financial and non-financial measures have been used in measuring
the performance of firm. Financial measure such as sales, ROI/ROA, profit and cash
flow are the most frequently used (see Perera et al., 1997; Hoque and James, 2000;
Hyvonen, 2007; and Jusoh et al., 2008). The use of measures in the non-financial
category is more varied and covers measures based on internal processes, customers and
employees. A summary of performance measures used in the number of the studies
reviewed in this chapter is shown in Table A7 in the appendix.
4.5.4 Summary
Prior empirical studies provide inconsistent evidence on possible relationships between
the extent of the use of MAPs, either individually or collectively, and performance.
However on balance evidence of a positive relationship exceeds negative or equivocal
results. Given this balance of evidence and since the objective of MAPs is to assist the
managerial activities in firms, firms will expect a positive outcome from the
implementation of MAPs. A hypothesis based on a positive and significant association
between MAPs and performance appears sustainable. The literature review therefore
supports the intended second hypothesis associated with the fourth research question as
follows:
H2: There is a significant and positive relationship between the use of MAPs and
organizational performance.
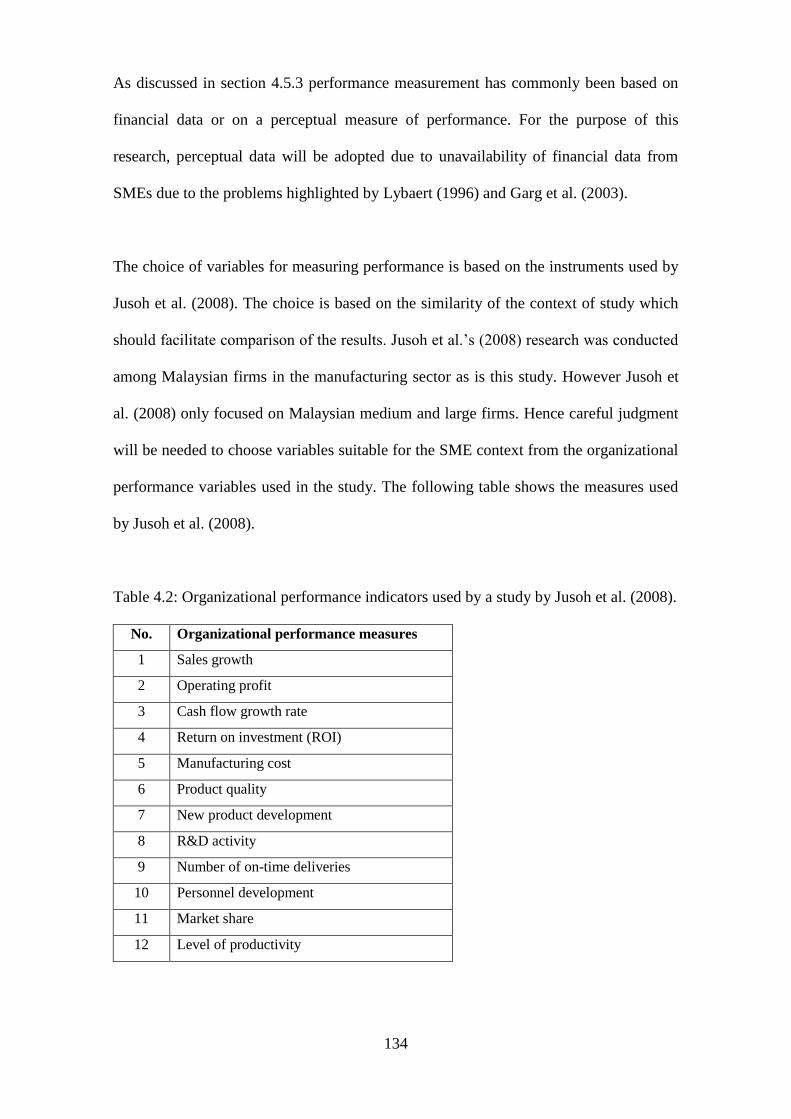
134
As discussed in section 4.5.3 performance measurement has commonly been based on
financial data or on a perceptual measure of performance. For the purpose of this
research, perceptual data will be adopted due to unavailability of financial data from
SMEs due to the problems highlighted by Lybaert (1996) and Garg et al. (2003).
The choice of variables for measuring performance is based on the instruments used by
Jusoh et al. (2008). The choice is based on the similarity of the context of study which
should facilitate comparison of the results. Jusoh et al.‘s (2008) research was conducted
among Malaysian firms in the manufacturing sector as is this study. However Jusoh et
al. (2008) only focused on Malaysian medium and large firms. Hence careful judgment
will be needed to choose variables suitable for the SME context from the organizational
performance variables used in the study. The following table shows the measures used
by Jusoh et al. (2008).
Table 4.2: Organizational performance indicators used by a study by Jusoh et al. (2008).
No. Organizational performance measures
1 Sales growth
2 Operating profit
3 Cash flow growth rate
4 Return on investment (ROI)
5 Manufacturing cost
6 Product quality
7 New product development
8 R&D activity
9 Number of on-time deliveries
10 Personnel development
11 Market share
12 Level of productivity
135
The following subset of six variables is selected for this study due to their relevance in
the context of small business organizations.
Business level
Sales growth
Operating profit
Cash flow growth rate
Operational level
Product quality
Number of on-time deliveries
Level of productivity
The choice of six variables provides three variables that represent performance at a
business level and another three variables that represent performance at an operational
level. These six performance measures should provide a broad insight into areas of
performance in SMEs. The reduction to six variables also reflects a desire not to
overwhelm potential respondents with detail in order to improve the response rate.
4.6 Overall summary
Overall chapter four has reviewed the literature related to the four research questions.
The literature review for the first research question; ―To what extent are MAPs used by
Malaysian SMEs?” (see section 4.2); indicated that studies into MAPs have
investigated their deployment in developed countries and in developing countries. The
literature review also found that traditional MAPs are widely used by organization
despite the criticisms of their lack of relevance and that the use of newly-developed
MAPs is growing but the uptake is still slow in most of developed and developing
countries. The review also identified a significant gap in the literature related to the use
of MAPs within SMEs especially in developing countries. In Malaysia, there is no
136
previous example of research in this area. Therefore addressing the first research
question of the thesis will add to existing knowledge about the uptake of MAPs in
Malaysian SMEs.
The literature review for the second research question; ―What are the roles played by
management accounting in Malaysian SMEs management?”; confirmed that
management accounting plays important roles in the management process in
organizations. Planning, controlling, evaluating performance and decisions making,
have been identified as key roles for management accounting. Additionally management
accounting is perceived to be involved in formulation and implementation of a firm‘s
strategy and value creation. The review also indicates that there is very little research
into the role of management accounting in the management of SMEs in either
developed or developing countries. This literature gap indicates that addressing research
question two of the thesis will add to existing knowledge about the role of management
accounting in SMEs. For the purpose of this research, the list of roles provided by IFAC
(1989) will be utilized.
The literature review for the third research question; ―What factors affect the use of
MAPs in Malaysian SMEs?” highlighted the type of contingent factors used in
contingency studies in the organizational theory context of MCS, MAPs and SMEs.
The literature shows that the use of MAPs can be influenced by internal and external
contingent factors. The majority of the previous research suggested a positive
relationship between these factors and the use of MAPs. The review identified a
significant gap in the literature related to contingency factors that affect the level of use
of MAPs within SMEs. Addressing research question three of the thesis will add to
existing knowledge about factors that influenced the use of MAPs in developing
137
countries within the SMEs environment. For this purpose five potential contingent
variables for determining factors that might affect the level of use of MAPs within
SMEs environment were identified.
The review of the current state of knowledge relating to the fourth research question; ―Is
there a positive relationship between the use of MAPs and the performance of
Malaysian SMEs?” suggested that there is a positive relationship between the use of
MAPs and firm performance, although it was acknowledged that there are a minority of
studies that provide negative or inconclusive results. The review also found that
although the majority of studies had used objective financial measures of performance,
there were examples of research relying on perceptual measures of performance in
samples where objective measures were not available - as is the case for the population
of Malaysian SMEs. The review also identified a significant gap in the literature related
to the evidence on the relationship between the use of MAPs and firm performance
among SMEs especially in developing countries.
Seeking to address research question four of the thesis will add to existing knowledge
about the possible relationship between the use of MAPs and the performance of SMEs.
The literature suggests that perceptual measures of performance would be most
appropriate to the SME context and six organizational performance indicators were
selected from those used by Jusoh et al. (2008) as variables on which to base hypothesis
testing.
The next chapter will discuss the methodology applied in the endeavour to answer the
four research questions.

138
Chapter 5
Research design and methodology
5.1 Introduction
This chapter describes the research design and methodology used to collect and analyse
the data required to address the research questions posed in this study. As discussed in
Chapter 1, the research aims to gather empirical evidence capable of providing an
overview of current MAPs in Malaysian manufacturing SMEs. The research also seeks
to understand how MAPs assist the management of SMEs, what factors contribute to
the extent of the use of MAPs in SMEs, and attempts to establish if MAPs help to
improve firm performance. In Chapter 1 (section 1.5), these areas of inquiry were
distilled into four specific research questions:
1. What is the extent of the use of MAPs by Malaysian SMEs?
2. What are the roles of management accounting in Malaysian SMEs‘ management?
3. What factors affect the extent of the use of MAPs by Malaysian SMEs?
4. Is there a positive relationship between the use of MAPs and the performance of
Malaysian SMEs?
The above research questions led to the emergence of the following two hypotheses
specifically aimed at answering the third and fourth research questions listed above.
H1: There are significant and positive relationships between selected contingent
factors and the use of MAPs.
H2: There is a significant and positive relationship between the use of MAPs and
organizational performance.
139
This chapter is organized into five sections. First, the choice of research design is
explained. The second section discusses the population from which data will be
collected and the approach to sample selection. The third section covers the data
collection method, which focuses primarily on a postal survey. In the fourth section,
data measurements and scaling are discussed. Finally, the choice of methods of data
analysis is considered in terms of the research objectives and hypotheses.
5.2 Research design
A research design provides the basic directions for carrying out the project. In
particular, a research design should provide relevant information that will most
efficiently and effectively address the research questions or hypotheses (Hair et al.,
2007). Hair suggested that there are three distinct research designs: exploratory;
descriptive; and causal. Of these three, descriptive and causal research designs match
the need to provide the relevant information for the above research questions and
hypotheses. Descriptive data are needed to answer the first two research questions
concerning the extent of the use of MAPs in Malaysian SMEs and the roles fulfilled by
MAPs in the management of SMEs. Descriptive data will also provide information on
contingent factors that affect the extent of the use of MAPs and the relationship between
the extent of use of MAPs and firm performance for the causal research stage. Causal
research which can also be termed as explanatory research (Saunders et al., 2009) will
test whether one variable (the independent variable) is responsible for changes in
another variable (the dependent variable) (Emory and Cooper, 1991). The need for this
research design reflects the two hypotheses developed in this study where both
independent and dependent variables are involved in order to form the required
relationships. Specifically, the first hypothesis will test the relationship between
selected contingency variables (independent variables) with the extent of the use of
140
MAPs (dependent variables). The second hypothesis will test whether there is the
positive relationship between the extent of the use of MAPs (independent variable) and
the performance of the firm (dependent variable). Thus, given the needs for descriptive
data and hypotheses testing, this research calls for a descriptive and causal research
design to facilitate meeting these needs. The exploratory research design, which
attempts to discover a new relationships, patterns, themes or ideas and does not aim to
test specific research hypotheses (Hair et al., 2007), does not conform to the study
objectives and hence is not suitable for this study.
The above research design will use a quantitative approach because data collection will
involve a large scale survey rather than interviews. Having reviewed the research
design, the next section discusses the sample selection method.
5.3 Sample selection method
According to Hair et al. (2007) representative samples are generally obtained by
following a set of well-defined procedures, which are: defining the target population;
selecting a sampling method; and determining a sample size. Therefore as been
recommended by Hair et al. (2007), this section will briefly explain the study‘s
approach to these three main procedures for selecting the representative sample.
5.3.1 Target population
The research questions in this study concern the use of MAPs among Malaysian SMEs.
The target population identified for gathering information regarding this concern is
Malaysian SMEs from among the firms in the various industries that comprise the
manufacturing sector. The research concentrates only on manufacturing sector in order
to avoid irrelevant distractions arising from variations between sectors. As discussed in
141
Chapter 3 section 3.5.6, the SME manufacturing sector in Malaysia is responsible for an
increase in Malaysian exports, contributes substantially to the economy in terms of
employment and has been a key factor in sustained rapid economic growth. In
recognition of this contribution, the Malaysian government is aggressively supporting
this sector in various ways such as offering finance and business advice to boost its
performance. Besides its importance to the Malaysian economy, this sector is suitable
for research into MAPs as manufacturing SMEs have a higher proportion of medium
sized firms who are most likely to use MAPs.
The target population can be divided into three possible sampling units. This is based on
the three different sizes of enterprises that comprise Malaysian SMEs (micro, small and
medium). The definition of these enterprises has been described earlier in Chapter 3. In
deciding whether or not to include all SMEs in the sector as sampling units, the matter
of suitability will be the root of selection. Management accounting is only likely to be
found in larger enterprises and therefore it was decided to exclude micro-sized firms as
they have either a turnover of less than RM 250,000 or fewer than five employees and
are therefore likely to be too small to have management systems that rely on MAPs. For
example, Hoque (2004) argued that a very small enterprise is less likely to have a real
need for complex management systems, and Nayak and Greenfield (1994) stated that
companies in the micro category will almost certainly have no qualified internal
accounting capability and will also lack the resources to employ these systems. The
research therefore will only focus on the small and medium enterprises within the
Malaysian SME definition.
Members of the population will be derived from the directory of the Federation of
Malaysian Manufacturers (FMM). This source, although not comprehensive, provides
142
detailed information about SMEs in the manufacturing sector. The FMM directory
consists of comprehensive profiles of over 2,200 manufacturers from SMEs to large
enterprises. This database, which is available on CD-ROM and as a hardcopy, is
frequently used in survey research, which involves the manufacturing sector (see for
example; Ahmed et al., 2004; Ismail and King, 2006; Jusoh and Parnell, 2008; and
Jusoh et al., 2008). One main advantage of this directory is that it specifies the number
of employees and average annual turnover, which allows users to classify the size of the
firms. This source therefore provides sufficient information for categorizing each
member of the population into a sampling unit (subgroup). The directory is not always
up-to-date in terms of email addresses, telephone numbers and postal addresses. In
order to reduce the effect of this shortcoming, the data in this directory was cross-
checked with official websites or by making an initial call to the firms to confirm that
the details, such as address and email address are correct.
5.3.2 Sampling method
The target sample of this study comprises of two subgroups: medium sized enterprises
and small enterprises as defined in Chapter 3 section 3.4. Given the preponderance of
small enterprises as discussed in Chapter 3 section 3.5.3, it is important to ensure that
cases from each group are adequately represented in the full sample. To control the
relative size of each subsample, a stratified random sampling procedure will be used. In
this procedure, a simple random sample is taken from each stratum and the subsamples
are then joined to form the total sample (Judd et al., 1991). The idea of stratified random
sampling is to ensure that every stratum gets an appropriate representation (Ghauri et
al., 1995) through the stratification process. This method can also allow the results from
subgroups to be compared to ascertain whether or not size difference affects the use of
MAPs.
143
In order to determine the due proportion between the two subgroups, the stratification
process can be done either by using proportionate or disproportionate stratified
sampling. According to Hair et al. (2007), in a proportionate stratified sampling, the
number of elements chosen from each stratum is proportionate to the size of particular
strata, relative to the overall population size. On the other hand, disproportionate
stratified sampling independently determines the sample size from each stratum without
considering the size of the stratum relative to the overall sample size. In this procedure,
the sample elements are chosen either according to another factor, such as their relative
economic importance, or the variability of the data within each stratum (Hair et al.,
2007). The variability among small and medium enterprises here relates to how the use
of MAPs varies between small and medium-sized enterprises. However the information
on this variability is unknown since no research has been done in this topic on these
particular groups.
To determine the appropriate procedure, a comparison of sample sizes between a
proportionate and a disproportionate stratified sampling approach is made. For
disproportionate sampling, it will be based on economic importance of the subgroups
since the information of the variability of the use of MAPs in both subgroups is
unknown. Accordingly, Table 5.1 shows the effect of proportionate stratified sampling
based on the number of establishments and Table 5.2 shows the effect of
disproportionate stratified sampling based on economic contribution. The economic
contribution uses contribution in economic value-added, output and employment and
salaries as the bases for the economic contribution. These bases are used because they
are the only current and available data revealed in the SMEs‘ annual report.

144
Table 5.1: The proportion of establishments in the small and medium category based on
number of establishments.
Subgroup % of number of
establishments
Small 88.5
Medium 11.5
Total 100
Table 5.2: The proportion of establishments in the small and medium category based on
contribution in economic value-added, output and employment and salaries.
Subgroup
% of contribution
in employment and
salaries
% of contribution
in economic value-
added
% of contribution
in output
Small 62 48 44
Medium 38 52 56
Total 100 100 100
Data in Table 5.1 shows that any sample based on number of establishments would be
heavily skewed towards the small category. Unless the sample size is almost the whole
population, this imbalance will cause the sample size for the medium category to be
insufficient to provide meaningful information for answering the research questions.
This is an unsatisfactory position because a very large sample would be prohibitively
expensive and would provide an excessive number of small SMEs for analysis. Further,
it is important to have a significant sample from the medium SMEs because it is
probable that this group will make greater use of MAPs than small enterprises. So on
this ground, a proportionate approach was disregarded.
In contrast, disproportionate stratified sampling on each of the three bases gives a more
equal proportion of sample size between the two subgroups. Data in Table 5.2 above,
shows that almost equal numbers of the small and medium group will be sampled, if it
145
is based on percentage of contribution in economic value-added as both categories make
an almost equal contribution to the total economic value-added. The basis of percentage
of contribution in employment and salaries is skewed to the small category whereas the
proportion, based on contribution in output is slightly skewed towards medium
enterprises. Overall, the most reasonable basis for a disproportionate stratification
process is based on using the percentage of contribution in economic value-added as
this base allows a sufficient representativeness of both medium and small SMEs.
5.3.3 Sample size
The determination of sample size is influenced by many factors that need to be taken
into account simultaneously. The factors include the cost and time constraints,
variability of elements in the target population, required estimation precision and
whether the findings are to be generalized and, if so, to what degree of confidence (Hair
et al., 2007). In deciding the sample size, there is often a trade-off between the cost and
time and large sample size. A larger sample size obviously requires more expenditure
on collecting and analysing data (Henry, 1990). Thus this research must balance the
trade-offs of obtaining a sufficient sample size within budget and time constraints. To
know whether the sample size can work within these constraints, it is essential to
discuss aspects in determining the sample size. There are number of statistical formulas
available to calculate an appropriate sample size but these manually require data on
variability (standard deviation), estimation precision and degree of confidence.
However, information on variability is unavailable since the variability of the use of
MAPs between small and medium SMEs has not yet been assessed in any of the
previous research.
146
Other guides include references to consistent rules of thumb provided by statisticians to
help in determining sample size. Roscoe (1975) proposed that sample sizes larger than
30 and less than 500 are appropriate for most research. This is supported by Stutely
(2003) who advises a minimum number of 30 for statistical analyses. The minimum
sample size arises because statisticians have proved that a sample size of 30 or more
will usually result in a sampling distribution for the mean that is very close to a normal
distribution; a position which is important to ensure that spurious results do not occur
(Saunders et al., 2009). Thus with the larger absolute size of a sample, the more closely
its distribution will be to the normal distribution and thus the more robust it will be
(Saunders et al., 2009). From another point of view, Kent (2001) suggested that for any
kind of quantitative analysis, a minimum of 100 cases is needed. This would help to get
a more sensible statistical analysis and more meaningful result. On the other hand,
Sekaran (2004) noted that for multivariate research (including multiple regression
analyses), the sample size should be several times (preferably 10 times or more) larger
than the number of variables in the study. In addition to the above guidelines,
Oppenheim (1997) and Sekaran (2004) advise a minimum sample size for research that
has a number of subsamples. According to Oppenheim (1992), the more subgroups, the
larger the sample needed. As this study involves multivariate regression analysis with
up to eight variables, it would be sensible to aim to have at least 100 cases to ensure
successful quantitative analysis.
Past response rates are a basis for determining how large a sample must be to provide a
response rate of at least 100 cases. Table 5.3 summarizes seven selected studies
investigating Malaysian SMEs and their response rates.
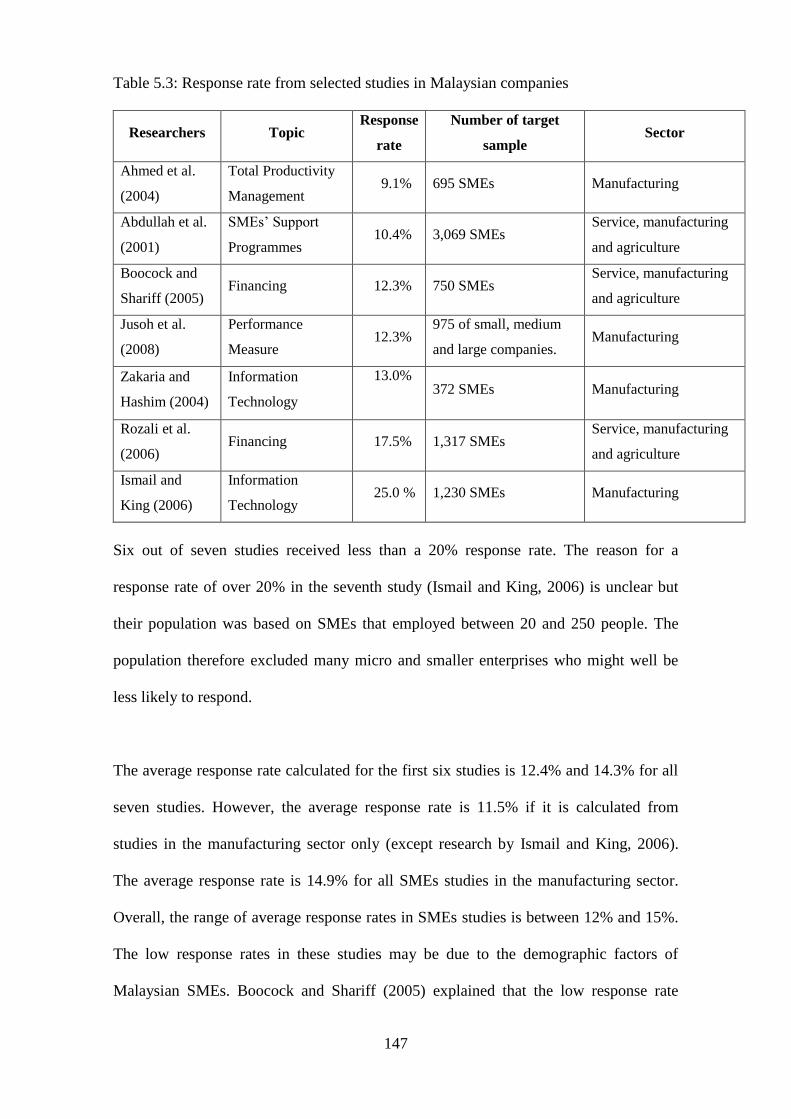
147
Table 5.3: Response rate from selected studies in Malaysian companies
Researchers Topic Response
rate
Number of target
sample Sector
Ahmed et al.
(2004)
Total Productivity
Management 9.1% 695 SMEs Manufacturing
Abdullah et al.
(2001)
SMEs‘ Support
Programmes 10.4% 3,069 SMEs
Service, manufacturing
and agriculture
Boocock and
Shariff (2005) Financing 12.3% 750 SMEs
Service, manufacturing
and agriculture
Jusoh et al.
(2008)
Performance
Measure 12.3%
975 of small, medium
and large companies. Manufacturing
Zakaria and
Hashim (2004)
Information
Technology
13.0%
372 SMEs Manufacturing
Rozali et al.
(2006) Financing 17.5% 1,317 SMEs
Service, manufacturing
and agriculture
Ismail and
King (2006)
Information
Technology 25.0 % 1,230 SMEs Manufacturing
Six out of seven studies received less than a 20% response rate. The reason for a
response rate of over 20% in the seventh study (Ismail and King, 2006) is unclear but
their population was based on SMEs that employed between 20 and 250 people. The
population therefore excluded many micro and smaller enterprises who might well be
less likely to respond.
The average response rate calculated for the first six studies is 12.4% and 14.3% for all
seven studies. However, the average response rate is 11.5% if it is calculated from
studies in the manufacturing sector only (except research by Ismail and King, 2006).
The average response rate is 14.9% for all SMEs studies in the manufacturing sector.
Overall, the range of average response rates in SMEs studies is between 12% and 15%.
The low response rates in these studies may be due to the demographic factors of
Malaysian SMEs. Boocock and Shariff (2005) explained that the low response rate
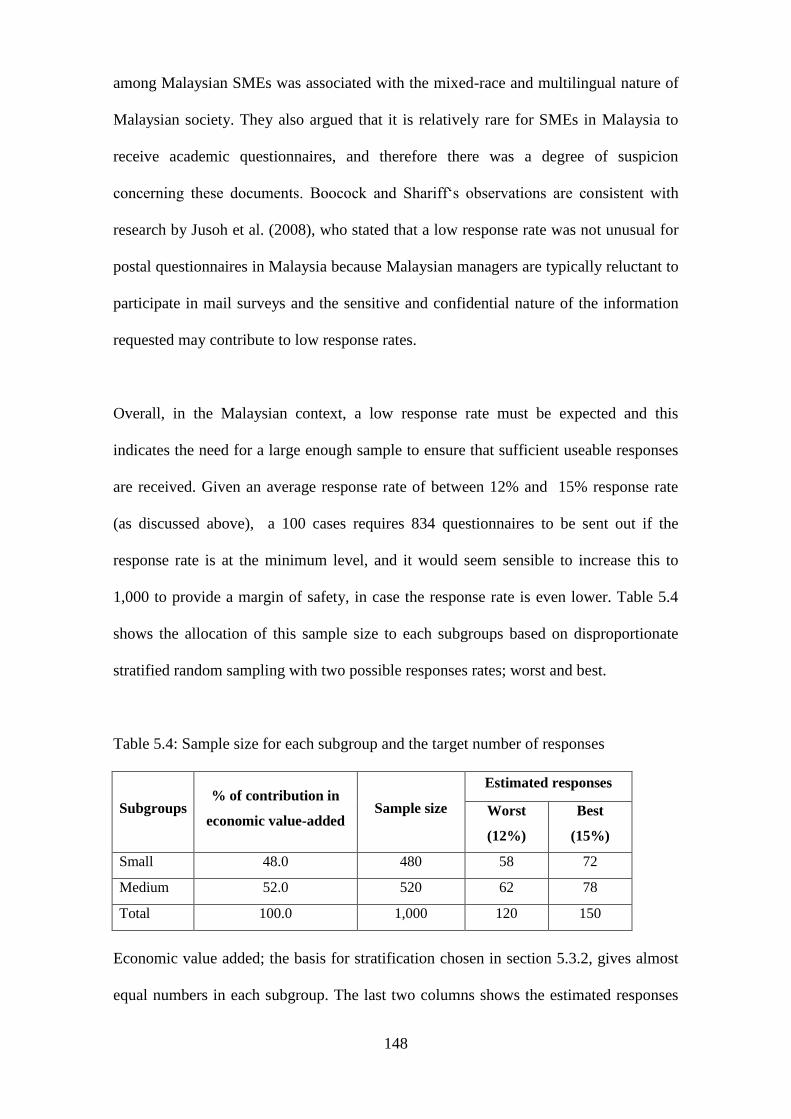
148
among Malaysian SMEs was associated with the mixed-race and multilingual nature of
Malaysian society. They also argued that it is relatively rare for SMEs in Malaysia to
receive academic questionnaires, and therefore there was a degree of suspicion
concerning these documents. Boocock and Shariff‗s observations are consistent with
research by Jusoh et al. (2008), who stated that a low response rate was not unusual for
postal questionnaires in Malaysia because Malaysian managers are typically reluctant to
participate in mail surveys and the sensitive and confidential nature of the information
requested may contribute to low response rates.
Overall, in the Malaysian context, a low response rate must be expected and this
indicates the need for a large enough sample to ensure that sufficient useable responses
are received. Given an average response rate of between 12% and 15% response rate
(as discussed above), a 100 cases requires 834 questionnaires to be sent out if the
response rate is at the minimum level, and it would seem sensible to increase this to
1,000 to provide a margin of safety, in case the response rate is even lower. Table 5.4
shows the allocation of this sample size to each subgroups based on disproportionate
stratified random sampling with two possible responses rates; worst and best.
Table 5.4: Sample size for each subgroup and the target number of responses
Subgroups % of contribution in
economic value-added Sample size
Estimated responses
Worst
(12%)
Best
(15%)
Small 48.0 480 58 72
Medium 52.0 520 62 78
Total 100.0 1,000 120 150
Economic value added; the basis for stratification chosen in section 5.3.2, gives almost
equal numbers in each subgroup. The last two columns shows the estimated responses

149
for each subgroup based on worst and best average response rates from past studies. The
expectation is for between 120 to 150 responses from the 1,000 sample.
5.4 The method of data collection
This research employs a postal survey to collect data. The postal questionnaire is
chosen because it is a popular instrument for eliciting opinions in empirical accounting
research (Collier and Wallace, 1992). This approach permits data to be collected from a
representative sample across many industries and geographical regions where
companies have activities. In addition, this method is generally the least expensive
means of collecting survey data (Groebner et al., 2008). If the questionnaires are
posted, the major costs are limited to postage to and from the respondents and also
printing costs.
Pilot testing is important to collect feedback about the questionnaire, the response rate
and the timing of responses. Moreover, a pilot test will allow an examination of
patterns of respondents‘ answers and thus their understanding of the questionnaire
(Dillman, 1978). Accordingly, the questionnaire developed in this study was
administered after pre-testing among fellow academics at the University of Exeter
Business School. The pretesting aimed to clarify the wording of both the questionnaire
instructions and questions. No significant issues were raised. After this pre-testing, a
pilot test was run on 100 SMEs. A response rate of 13% was achieved, which was in
line with expectations. It was also noted that completion of the questionnaire did not
appear to present problems for the target audience. Therefore it was decided to proceed
with the main mailing.
150
The postal survey package included a covering letter explaining the purpose of the
survey, a copy of the questionnaire, and a prepaid envelope for returning the
questionnaire (these documents are in the Appendix). The letter is addressed to the
member of the accounting personnel in the firm who is the most eligible person to
complete the questionnaire. In order to increase the response rate follow-ups were
planned at three intervals:
i. Two weeks after the initial mailing, a follow-up email;
ii. Four weeks after the initial mailing, a new covering letter and questionnaire; and
iii. Eight weeks after the initial mailing, a follow-up call, follow-up email and a third
covering letter and questionnaire.
This lengthy process was designed to maximise the response rate.
5.5 Measurement and scaling
The questionnaire was split into five sections: profile of the firm; extent of the use of
MAPs; factors which affect the extent of the use of MAPs; performance of the firm; and
the roles of MAPs. Responses to questions in these sections will be measured through
the use of scales. A scale is a measurement tool that can be used to measure a question
with a predetermined number of outcomes (Hair et al., 2007). There are five scales
available: nominal, binary, ordinal, interval and ratio. Of these scales, three of them will
be utilized in designing the questionnaire. These scales are the binary, nominal scale
and the ordinal scale. Nominal scales help to identify and classify some characteristics
of the respondents (Hair et al., 2007) and allow the researcher to qualitatively
distinguish groups by categorizing them into mutually exclusive and collectively
exhaustive sets (Sekaran, 2004). This scale will be mainly used to measure the profile of
the firms and also for the sort of industry. The data analysis for this scale is restricted
mostly to counts of the number of responses in each category, calculation of the mode
151
or percentage for a particular question, and the use of the Chi-square statistic (Hair et
al., 2007). Binary scale is scale that has two categories, one for cases that posse a
characteristic and one for those that do not (Kent, 2001). Examples of this scale are
poverty/ not in poverty; employed and unemployed; married/not married; and
responding ‗yes‘ or ‗no‘ to a question. Binary scales (which sometimes called
‗dichotomies‘) have interesting statistical properties not possessed by scales which have
three or more categories (Kent, 2001). This scale will be utilized for the general ‗yes/no‘
questions about whether the firm uses each particular MAP or not. On the other hand,
the ordinal scale is used to measure concepts such as attitudes, perception, feelings,
opinions and values through the use of rating scales (Hair et al., 2007) and will help to
the order of the magnitude of the differences in each variable (Sekaran, 2004). The
ordinal scale can be facilitated with the use of a summated rating scale or Likert scale.
Summated scales often use a five-point or seven-point scale to assess the strength of
agreement about a group of statements. When the scales for all the statements are
summed it is referred to as a summated rating scale. When the scale is used individually
it is referred to as a Likert scale (Hair et al., 2007). For the purpose of this research the
five-point Likert scale will be used to measure the extent of the use of MAPs, factors
which affect the extent of the use of MAPs, the perceived performance of the firm and
the roles of MAPs. The use of a five-point scale is aligned with previous studies in the
management accounting area for example those by Drury et al. (1993); Guilding et al.
(1998); Hoque and James (2000); Hoque (2004); and Abdel-Kader and Luther (2006).
The use of a five-point Likert scale is not only consistent with the previous studies, but
also provides a shorter scale to help respondents to complete the questionnaire.
According to Hair et al. (2007), the desire for a higher level of precision must be
balanced with the demands placed on the respondents. Respondents must be reasonably
152
well educated to process the information associated with a larger number of categories.
They added that respondents exposed to scaling questions less often, can more easily
respond to scales with fewer categories. Since survey research among SMEs is still new
in Malaysia, especially in the management accounting, the fewer categories in Likert
scales will probably help respondents understand the information required and thereby
increase the response rate.
5.5.1 Questionnaire design
The most important aspect in drafting a questionnaire is how to select the variables
that will be the subject of questions. The questionnaire design was informed by
previous research into MAPs. These questionnaires, which largely focused on large
companies, have been modified by choosing only variables that suit to the
environment of SMEs and also those that can be easily understood by the target
respondents. The objective is for the questionnaire to seek information only on
mainstream practices of management accounting that are relevant to the Malaysian
SME context. The final version of the questionnaire comprised 24 main questions
covering 75 specific items. Questions were put into five sections so as to gather data
on the key topics in an organized way. The details of the topics are as follows:
First Section: Profile of the firm
This section used nominal and ordinal measures in identifying the profiles of the
firm. All questions were in a close-ended form and asked:
(a) years of operations/business;
(b) manufacturing activity (sector);
(c) annual sales turnover;
(d) number of employees.
153
Second Section: Extent of the use of management accounting practices
This section applied both binary (dichotomous) and ordinal measures in identifying the
extent of use of MAPs among SMEs. MAPs were grouped into five major parts; costing
system; budgeting system; performance evaluation system; decision support system;
and strategic management accounting. Each part under this section (parts A to E) begins
with questions to identify if the respondents have employed the respective set of MAPs.
For example, Part A on costing system started with the first question, ―Do you use a
costing system in your firm?‖ The response option is given in a ‗yes‘ or ‗no‘ box. The
subsequent statement directs where the respondents should next proceed in answering
the questionnaire. For example, in Part A, the statement appears as follows, ‘If yes,
please continue to question number 6 and onwards. If no, please proceed to part B
(question 8).‘ This format is similar in each part (A to E) under section 2.
If the respondents say ‗yes‘ the subsequent questions in the section probe into the
details on the extent of the use of MAPs in their firm. As discussed in section 5.5, a
five-point Likert scale is used to indicate the extent of use of MAPs. The scale is 1 =
never, 2 = rarely, 3 = occasionally, 4 = frequently and 5 = very frequently. This format
of this scale is the same in each part under section 2. The detailed items which need to
be answered by each respondent are as follows:
Part A: Costing system
The questions under this part are divided into 2 main categories, the cost collection
method and the costing technique. These categories were based on a synthesis of
those used in previous research studies by Shields et al. (1991); Drury et al (1993);
Innes and Mitchell (1995); Wijewardena and De Zoysa (1999); Lamminmaki and
154
Drury (2001); and Abdel-Kader and Luther (2006). The items under each category
are:
(a) Cost collection method:
(i) Job costing
(ii) Batch costing
(iii) Contract costing
(iv) Process costing
(b) Costing technique:
(i) Absorption costing
(ii) Variable costing
(iii) Activity-based costing
Part B: Budgeting system
The extent of use of budgeting practices is collected under three headings: type of
budget; timings of budget; and type of budget method. The items under each heading
are consistent with previous research by Shields et al. (1990); Szychta (2002); Joshi et
al. (2003); Nik Ahmad et al. (2003); Hansen and Van der Stede (2004); and Abdel-
Kader and Luther (2006). The followings are the details of the categories.
(a) Type of budget:
(i) Sales budget
(ii) Purchasing budget
(iii) Production budget
(iv) Cash flow budget
(v) Financial position budget
155
(b) Timings of budget:
(i) Monthly budgeting
(ii) Annual budgeting
(iii) Continuous/rolling budget
(c) Type of budget method:
(i) Flexible budget
(ii) Incremental budgeting
(iii) Zero-based budgeting
Part C: Performance evaluation system
The questions on the extent of use of performance evaluation systems are grouped under
two headings: performance evaluation based on financial measures; and performance
evaluation based on non-financial measures. The latter distinguishes between measures
based on internal processes, customer and employees. The categories reflect a synthesis
of previous work by Drury and Tayles (1993); Chenhall and Langfield-Smith (1998);
Joshi (2001); Gomes et al. (2004); Abdel-Kader and Luther (2006); and Abdel-
Maksoud et al. (2008). The information sought are as follows;
(a) Performance evaluation based on financial measure(s):
(i) Operating income
(ii) Return on investment
(iii) Variance analysis
(iv) Sales growth
(v) Cash flows
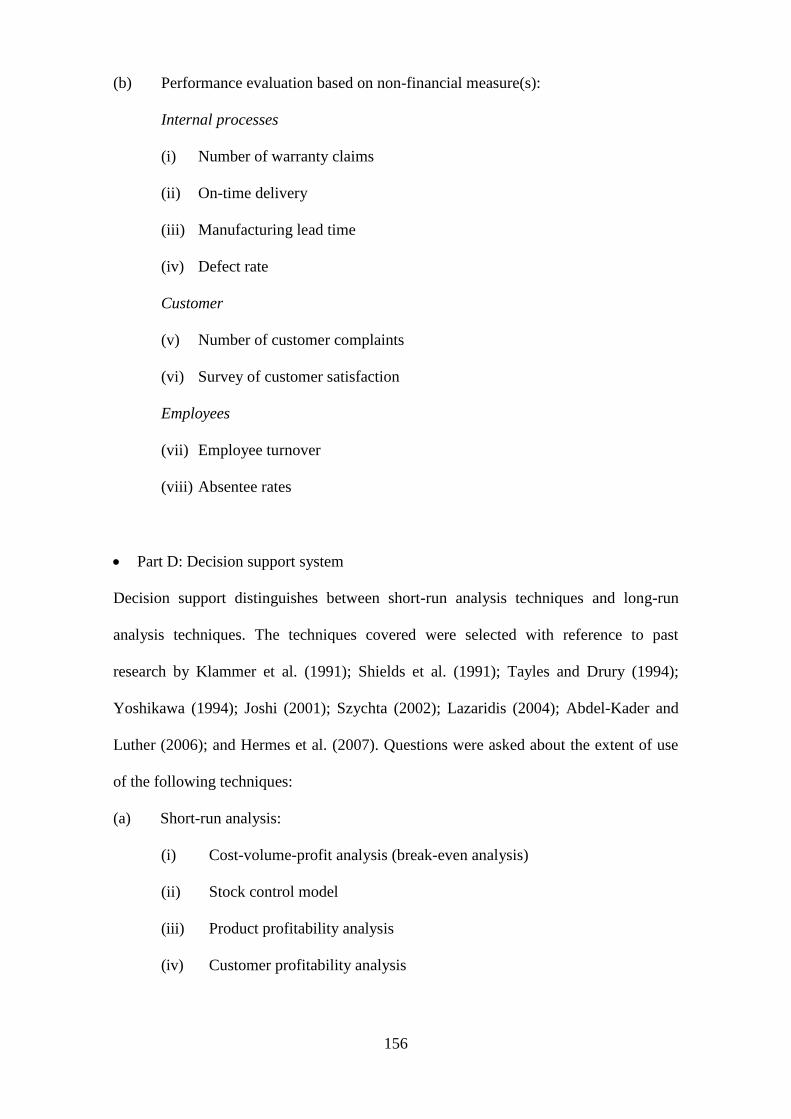
156
(b) Performance evaluation based on non-financial measure(s):
Internal processes
(i) Number of warranty claims
(ii) On-time delivery
(iii) Manufacturing lead time
(iv) Defect rate
Customer
(v) Number of customer complaints
(vi) Survey of customer satisfaction
Employees
(vii) Employee turnover
(viii) Absentee rates
Part D: Decision support system
Decision support distinguishes between short-run analysis techniques and long-run
analysis techniques. The techniques covered were selected with reference to past
research by Klammer et al. (1991); Shields et al. (1991); Tayles and Drury (1994);
Yoshikawa (1994); Joshi (2001); Szychta (2002); Lazaridis (2004); Abdel-Kader and
Luther (2006); and Hermes et al. (2007). Questions were asked about the extent of use
of the following techniques:
(a) Short-run analysis:
(i) Cost-volume-profit analysis (break-even analysis)
(ii) Stock control model
(iii) Product profitability analysis
(iv) Customer profitability analysis

157
(b) Long-run analysis (Investment appraisal):
(i) Payback
(ii) Accounting rate of return
(iii) Net present value
(iv) Internal rate of return
Part E: Strategic management accounting
Part E collects data on strategic management accounting (SMA). The questions were
asked under two headings: strategic costing and pricing attribute costing; and
competitor accounting. The items used in this study are based on the study by Guilding
et al. (2000), who set up 12 indicators of SMA in their studies. However, only six
indicators of SMA will be used in this research. This is because the other six indicators
were not deemed relevant for SMEs. The techniques omitted were quality costing,
attribute costing; brand value budgeting; monitoring brand value; competitor cost
assessment, and competitor appraisal based on published financial statements. The six
selected indicators of SMA that will be used in this study are as follows.
(a) Strategic costing and pricing attribute costing:
(i) Target costing
(ii) Strategic costing
(iii) Value chain costing
(iv) Strategic pricing
(v) Product life-cycle analysis
(b) Competitor accounting:
(i) Competitive position monitoring
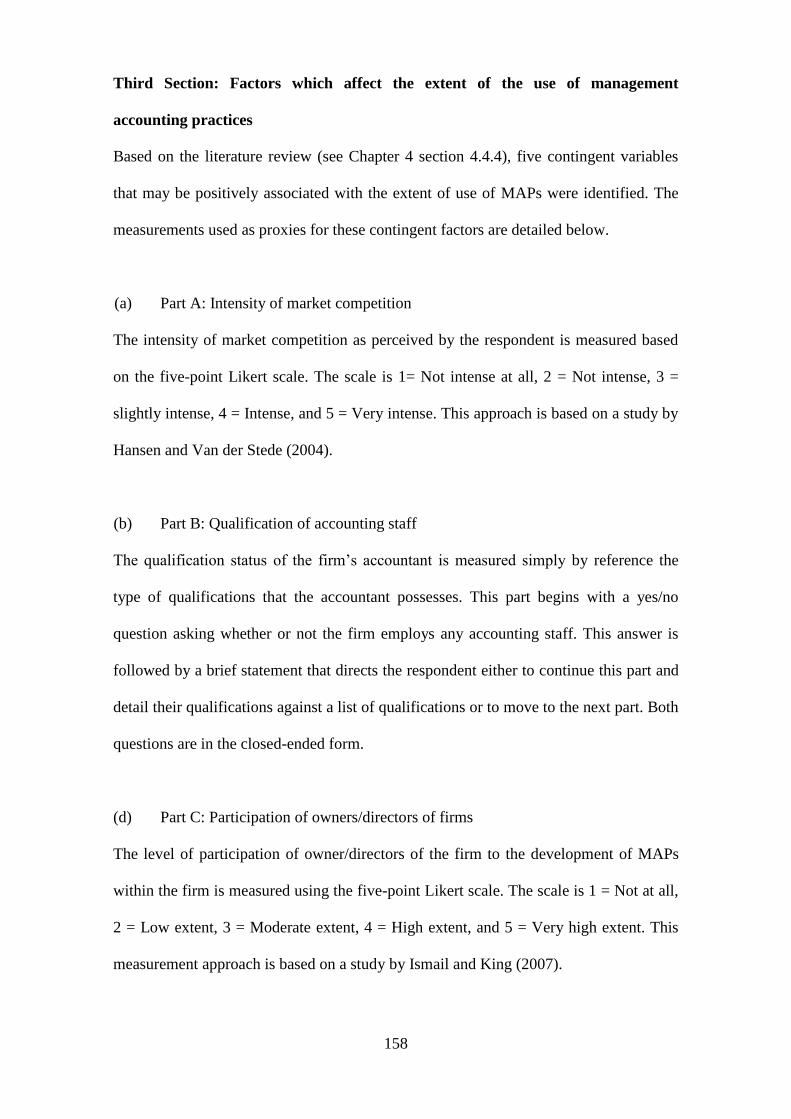
158
Third Section: Factors which affect the extent of the use of management
accounting practices
Based on the literature review (see Chapter 4 section 4.4.4), five contingent variables
that may be positively associated with the extent of use of MAPs were identified. The
measurements used as proxies for these contingent factors are detailed below.
(a) Part A: Intensity of market competition
The intensity of market competition as perceived by the respondent is measured based
on the five-point Likert scale. The scale is 1= Not intense at all, 2 = Not intense, 3 =
slightly intense, 4 = Intense, and 5 = Very intense. This approach is based on a study by
Hansen and Van der Stede (2004).
(b) Part B: Qualification of accounting staff
The qualification status of the firm‘s accountant is measured simply by reference the
type of qualifications that the accountant possesses. This part begins with a yes/no
question asking whether or not the firm employs any accounting staff. This answer is
followed by a brief statement that directs the respondent either to continue this part and
detail their qualifications against a list of qualifications or to move to the next part. Both
questions are in the closed-ended form.
(d) Part C: Participation of owners/directors of firms
The level of participation of owner/directors of the firm to the development of MAPs
within the firm is measured using the five-point Likert scale. The scale is 1 = Not at all,
2 = Low extent, 3 = Moderate extent, 4 = High extent, and 5 = Very high extent. This
measurement approach is based on a study by Ismail and King (2007).

159
(a) Part D: Advanced manufacturing technology
A five-point Likert scale is used to measure the extent of the use of advanced
manufacturing technology (AMT) by the firm. Respondents are required to indicate the
extent of the AMT usage using a Likert scale from 1 = Not used to 5 = Widely used.
This measurement is identical to that used by Tayles and Drury (1994).
Fourth Section: Performance of the firm
As discussed in the literature review (see Chapter 4 section 4.5.3), the unavailability of
objective data on performance from SMEs forced the questionnaire to request
subjective, self-reported measures of performance to gauge the level of performance of
firms. Respondents were asked to indicate the changes in the performance in the last
three years using a self-rating scale. The data collected in this section will act as a proxy
for recent improvements in actual firm performance and will give information for
empirical testing of the research hypothesis 2. The constructs used are based on studies
by Hoque (2004) and Jusoh and Parnell (2008). The performance of the firm based on
various measures is determined using a five-point Likert scale. The scale is indicated by
1 = Decreased significantly, 2 = Decreased, 3 = No change, 4 = Increased, and 5 =
Increased significantly. The following are six variables were used.
(a) Level of productivity
(b) Product quality
(c) Number of on-time deliveries
(d) Sales growth rate
(e) Operating profit growth rate
(f) Cash flow growth rate
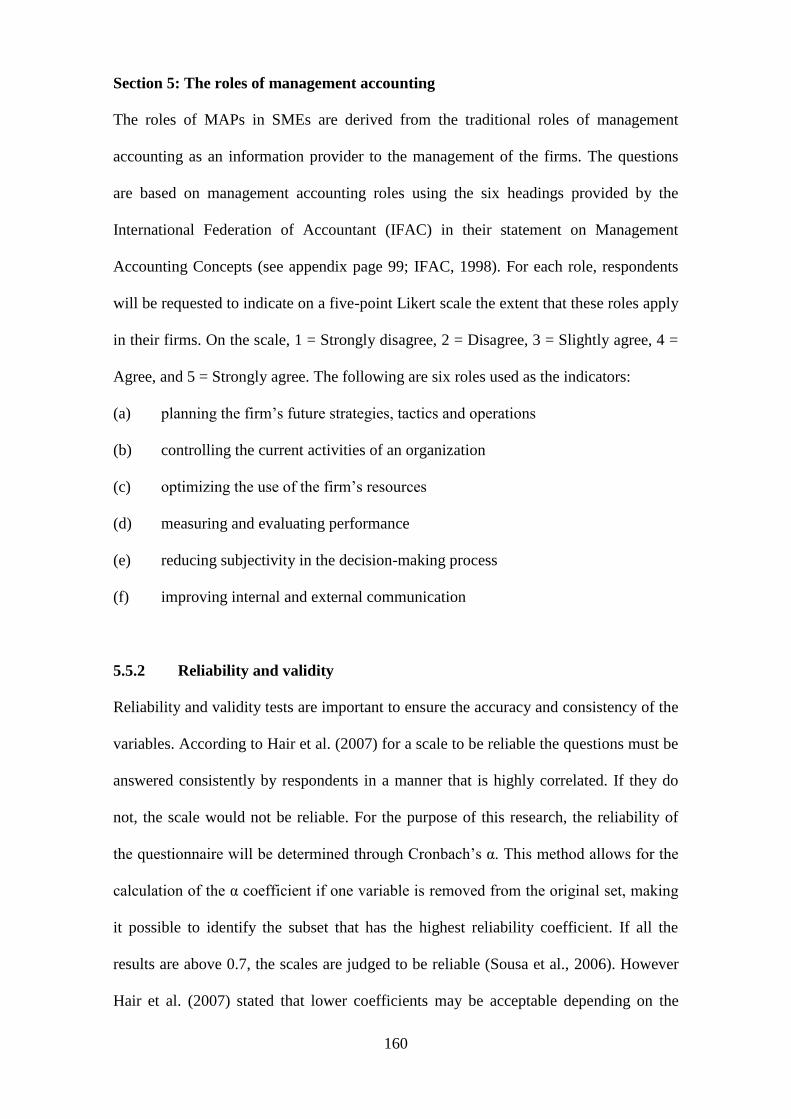
160
Section 5: The roles of management accounting
The roles of MAPs in SMEs are derived from the traditional roles of management
accounting as an information provider to the management of the firms. The questions
are based on management accounting roles using the six headings provided by the
International Federation of Accountant (IFAC) in their statement on Management
Accounting Concepts (see appendix page 99; IFAC, 1998). For each role, respondents
will be requested to indicate on a five-point Likert scale the extent that these roles apply
in their firms. On the scale, 1 = Strongly disagree, 2 = Disagree, 3 = Slightly agree, 4 =
Agree, and 5 = Strongly agree. The following are six roles used as the indicators:
(a) planning the firm‘s future strategies, tactics and operations
(b) controlling the current activities of an organization
(c) optimizing the use of the firm‘s resources
(d) measuring and evaluating performance
(e) reducing subjectivity in the decision-making process
(f) improving internal and external communication
5.5.2 Reliability and validity
Reliability and validity tests are important to ensure the accuracy and consistency of the
variables. According to Hair et al. (2007) for a scale to be reliable the questions must be
answered consistently by respondents in a manner that is highly correlated. If they do
not, the scale would not be reliable. For the purpose of this research, the reliability of
the questionnaire will be determined through Cronbach‘s α. This method allows for the
calculation of the α coefficient if one variable is removed from the original set, making
it possible to identify the subset that has the highest reliability coefficient. If all the
results are above 0.7, the scales are judged to be reliable (Sousa et al., 2006). However
Hair et al. (2007) stated that lower coefficients may be acceptable depending on the
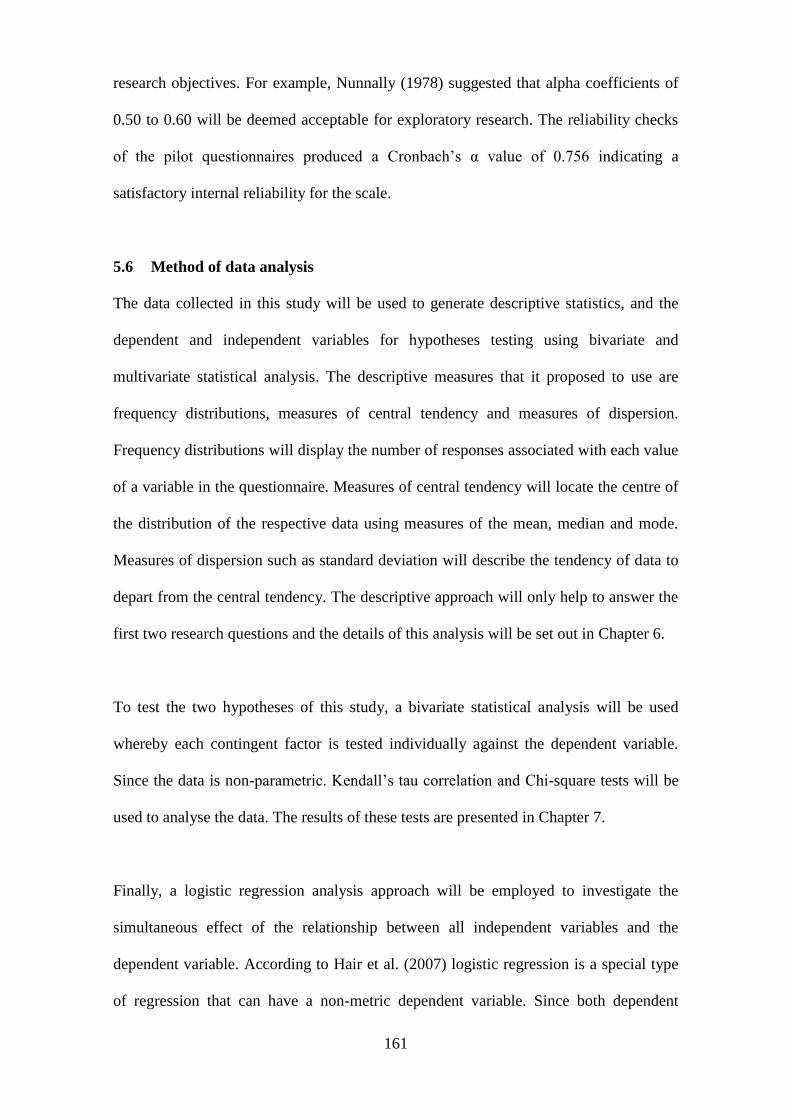
161
research objectives. For example, Nunnally (1978) suggested that alpha coefficients of
0.50 to 0.60 will be deemed acceptable for exploratory research. The reliability checks
of the pilot questionnaires produced a Cronbach‘s α value of 0.756 indicating a
satisfactory internal reliability for the scale.
5.6 Method of data analysis
The data collected in this study will be used to generate descriptive statistics, and the
dependent and independent variables for hypotheses testing using bivariate and
multivariate statistical analysis. The descriptive measures that it proposed to use are
frequency distributions, measures of central tendency and measures of dispersion.
Frequency distributions will display the number of responses associated with each value
of a variable in the questionnaire. Measures of central tendency will locate the centre of
the distribution of the respective data using measures of the mean, median and mode.
Measures of dispersion such as standard deviation will describe the tendency of data to
depart from the central tendency. The descriptive approach will only help to answer the
first two research questions and the details of this analysis will be set out in Chapter 6.
To test the two hypotheses of this study, a bivariate statistical analysis will be used
whereby each contingent factor is tested individually against the dependent variable.
Since the data is non-parametric. Kendall‘s tau correlation and Chi-square tests will be
used to analyse the data. The results of these tests are presented in Chapter 7.
Finally, a logistic regression analysis approach will be employed to investigate the
simultaneous effect of the relationship between all independent variables and the
dependent variable. According to Hair et al. (2007) logistic regression is a special type
of regression that can have a non-metric dependent variable. Since both dependent

162
variable and independent variables tested in hypothesis 1 and 2 are in non-metric form,
a logistic regression is the most suitable method for multivariate analysis. The specific
equation models for each hypothesis and the results from the analyses will be discussed
in Chapter 8.
5.7 Summary
This chapter outlines the research design and methodology that will help to answer the
four research questions posed in this study. In specific the chapter confirms that the
objectives of the research will be approach quantitatively using a descriptive and causal
research design. The target population comprises SMEs in the Malaysian manufacturing
sector and the target sample is stratified into two subgroups, based on the sizes of the
enterprises (small and medium). After detailed deliberations, the sample size was set at
1,000 establishments with a target of between 120 to 150 useable responses. Further a
postal survey will be utilized in order to collect the data from the target sample. The
structure of the questionnaire and the derivation of the questions asked were also
discussed and explained and the pilot testing results referred to. Finally, it was
determined that data analysis will involve descriptive statistics for the first two research
objectives and bivariate analysis and logistic regression analysis for the hypothesis
testing associated with the third and fourth research objectives. The results of the
analyses will be discussed separately in the following next three chapters.
163
Chapter 6
Management accounting practices in Malaysian SMEs: Descriptive results
6.1 Introduction
The main purposes of this chapter are to provide a general description of the
questionnaire responses and to present the findings relating to the first two research
objectives listed in Chapter 1 section 1.4. These are (i) to investigate the extent to which
MAPs are employed by Malaysian SMEs; and (ii) to identify the roles played by MAPs
in Malaysian SMEs activities. After a discussion of the response rate and the possibility
of non-response bias, the findings are presented systematically in the order of the
questionnaire from section 1 to section 5.
Thus, section 6.2 discusses the response rate of the survey. Section 6.3 presents relevant
information relating to the respondents and their organisations. The comprehensive
results of descriptive data on the extent of use of MAPs are outlined in section 6.4.
Section 6.5 clarifies the descriptive data related to contingent factors that might affect
the extent of the use of MAPs. Section 6.6 presents the information on the respondents‘
perceptions of performance of the firms in certain areas and section 6.7 reveals the
respondents‘ views of the roles of management accounting within the responding firms.
The final section provides a summary of this chapter.
6.2 Response rate
In the previous chapter, details were provided as to the identification and potential size
of the target sample required to achieve the desired number of respondents. The 1,000
target sample was composed of two subsets; small and medium firms. This has been
determined in the Chapter 5 section 5.3.3. The sample was mailed with the first survey
164
package in April 2010 comprising a cover letter, questionnaire and a reply paid
envelope. To encourage completion of the questionnaire, participants were promised a
summary of the results and informed that their responses were anonymous. A month
after the first mailing, 87 replies were received. These replies were split about 30% from
small firms and 70% from medium firms. In order to enhance the number of responses,
a number of follow-up processes were undertaken. First, a reminder together with a
second copy of the questionnaire was sent out to all non-respondents four weeks after
the initial mailing. Within this time contact by an-email and phone call was carried out
on a randomly selected 20% of non-respondents reminding them to participate in the
survey. The second distribution of the questionnaire boosted the number of responses to
more than 150 replies. With the time and cost constraint, a month later, the last
reminder as well as a copy of questionnaire and post-paid reply envelope was sent to
200 of the non-respondents. Those selected were the first 200 non-respondents from the
listings of small and medium firms. At the end of the process a total of 176
questionnaires were received giving a response rate of 17.6% (176/1000). Of these 16
were unusable for the following reasons:
the firm was too small, had ceased operation, or was from another sector;
the questionnaire had not been completed; and
the firm did not want to participate in the survey.
Hence, 160 usable questionnaires were received. According to Neuman (2005), non-
responses due to persons being unreachable or ineligible should be excluded from the
total number in the sample. The seven respondents who were too small had fallen into
this category. Therefore the net usable response rate is 16.1% (160/993)13
. Table 6.1
13
The usable response rate is calculated as follows: response rate = (number of completed and returned
questionnaires) divided by (Number of respondents in sample – (non-eligible and non-reachable
respondents))

165
summarizes the result of response rate of the survey. The usable response rate received
in this survey is marginally better than the expected response rate of between 12% and
15%. - an expectation based on past response rates achieved by academic surveys of this
type of population (discussed earlier in Chapter 5 section 5.2.3). Hence, it can be
concluded that the usable response rate gained in this study is acceptable and
sufficiently large for analysis.
Table 6.1: Summary of survey response
No (%)
Total number of target respondents 1000 100.0
Total responses received 176 17.6
Ineligible, firms had ceased operation -7 -
Uncompleted questionnaires -3 -
Refusals to participate in the survey -6 -
Usable responses received 160 16.1
6.2.1 Non-response bias
Armstrong and Overton (1977) noted that the mail survey has been criticized for non-
response bias. If persons who respond differ substantially from those who do not, the
results do not directly allow the researcher to say how the entire sample would have
responded - certainly an important step before the sample is generalized to the
population. Bose (2001) argued that non-response bias is associated with both low
response rates and strong differences in the estimates between respondents and non-
respondents. Due to the relatively low response rate gained in this study, non-response
bias is a major concern. An analysis of the usable responses by number of employees as
shown in Table 6.2 indicates that responses are not uniformly spread throughout the
sample. The response rate of medium firms is twice as high as for small firms indicating
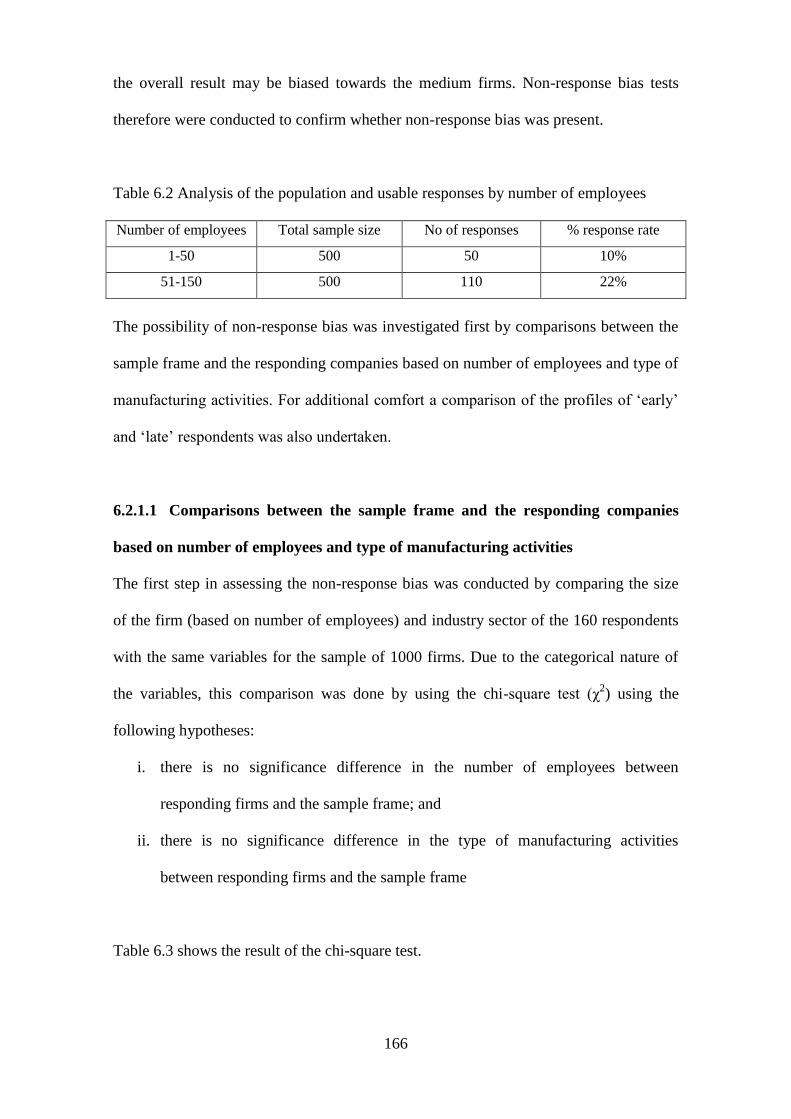
166
the overall result may be biased towards the medium firms. Non-response bias tests
therefore were conducted to confirm whether non-response bias was present.
Table 6.2 Analysis of the population and usable responses by number of employees
Number of employees Total sample size No of responses % response rate
1-50 500 50 10%
51-150 500 110 22%
The possibility of non-response bias was investigated first by comparisons between the
sample frame and the responding companies based on number of employees and type of
manufacturing activities. For additional comfort a comparison of the profiles of ‗early‘
and ‗late‘ respondents was also undertaken.
6.2.1.1 Comparisons between the sample frame and the responding companies
based on number of employees and type of manufacturing activities
The first step in assessing the non-response bias was conducted by comparing the size
of the firm (based on number of employees) and industry sector of the 160 respondents
with the same variables for the sample of 1000 firms. Due to the categorical nature of
the variables, this comparison was done by using the chi-square test (χ2) using the
following hypotheses:
i. there is no significance difference in the number of employees between
responding firms and the sample frame; and
ii. there is no significance difference in the type of manufacturing activities
between responding firms and the sample frame
Table 6.3 shows the result of the chi-square test.
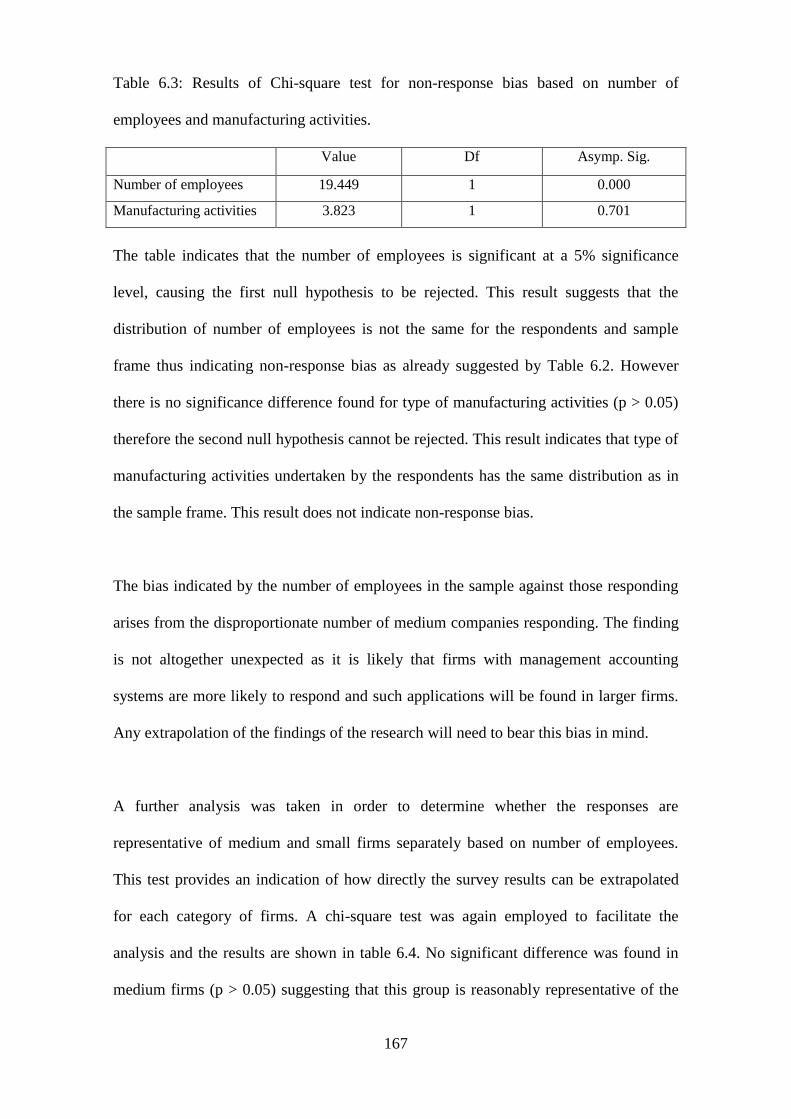
167
Table 6.3: Results of Chi-square test for non-response bias based on number of
employees and manufacturing activities.
Value Df Asymp. Sig.
Number of employees 19.449 1 0.000
Manufacturing activities 3.823 1 0.701
The table indicates that the number of employees is significant at a 5% significance
level, causing the first null hypothesis to be rejected. This result suggests that the
distribution of number of employees is not the same for the respondents and sample
frame thus indicating non-response bias as already suggested by Table 6.2. However
there is no significance difference found for type of manufacturing activities (p > 0.05)
therefore the second null hypothesis cannot be rejected. This result indicates that type of
manufacturing activities undertaken by the respondents has the same distribution as in
the sample frame. This result does not indicate non-response bias.
The bias indicated by the number of employees in the sample against those responding
arises from the disproportionate number of medium companies responding. The finding
is not altogether unexpected as it is likely that firms with management accounting
systems are more likely to respond and such applications will be found in larger firms.
Any extrapolation of the findings of the research will need to bear this bias in mind.
A further analysis was taken in order to determine whether the responses are
representative of medium and small firms separately based on number of employees.
This test provides an indication of how directly the survey results can be extrapolated
for each category of firms. A chi-square test was again employed to facilitate the
analysis and the results are shown in table 6.4. No significant difference was found in
medium firms (p > 0.05) suggesting that this group is reasonably representative of the
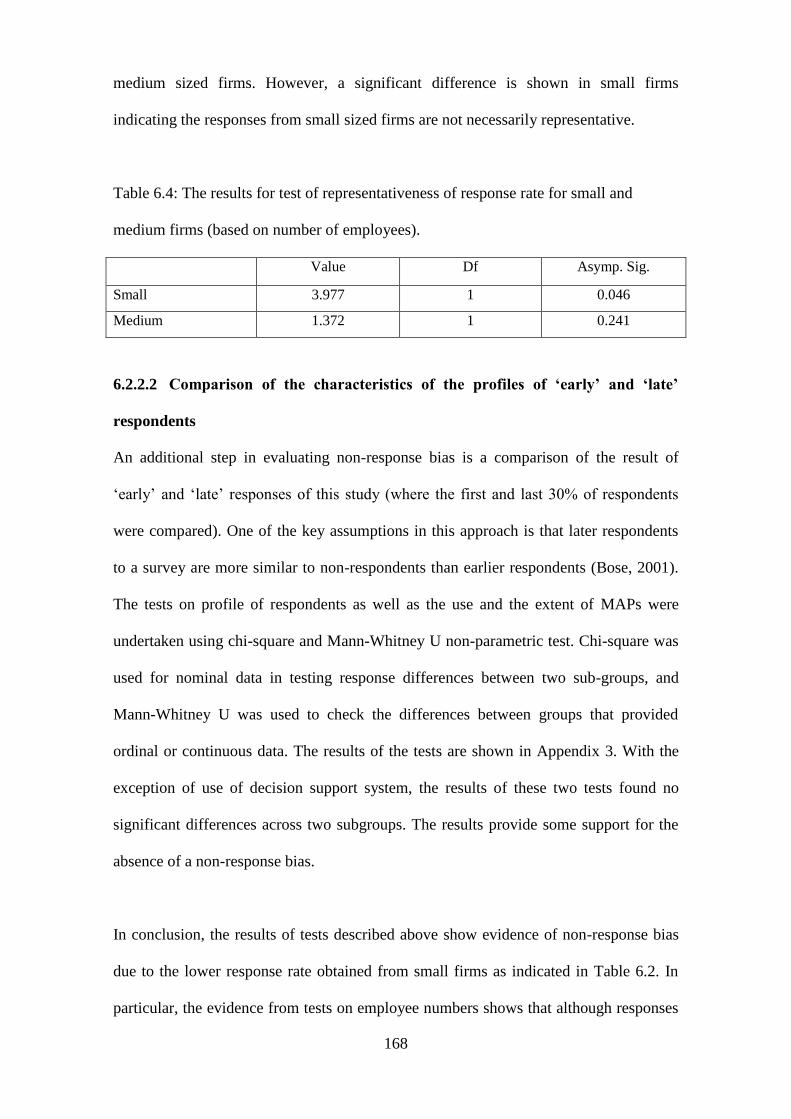
168
medium sized firms. However, a significant difference is shown in small firms
indicating the responses from small sized firms are not necessarily representative.
Table 6.4: The results for test of representativeness of response rate for small and
medium firms (based on number of employees).
Value Df Asymp. Sig.
Small 3.977 1 0.046
Medium 1.372 1 0.241
6.2.2.2 Comparison of the characteristics of the profiles of ‘early’ and ‘late’
respondents
An additional step in evaluating non-response bias is a comparison of the result of
‗early‘ and ‗late‘ responses of this study (where the first and last 30% of respondents
were compared). One of the key assumptions in this approach is that later respondents
to a survey are more similar to non-respondents than earlier respondents (Bose, 2001).
The tests on profile of respondents as well as the use and the extent of MAPs were
undertaken using chi-square and Mann-Whitney U non-parametric test. Chi-square was
used for nominal data in testing response differences between two sub-groups, and
Mann-Whitney U was used to check the differences between groups that provided
ordinal or continuous data. The results of the tests are shown in Appendix 3. With the
exception of use of decision support system, the results of these two tests found no
significant differences across two subgroups. The results provide some support for the
absence of a non-response bias.
In conclusion, the results of tests described above show evidence of non-response bias
due to the lower response rate obtained from small firms as indicated in Table 6.2. In
particular, the evidence from tests on employee numbers shows that although responses
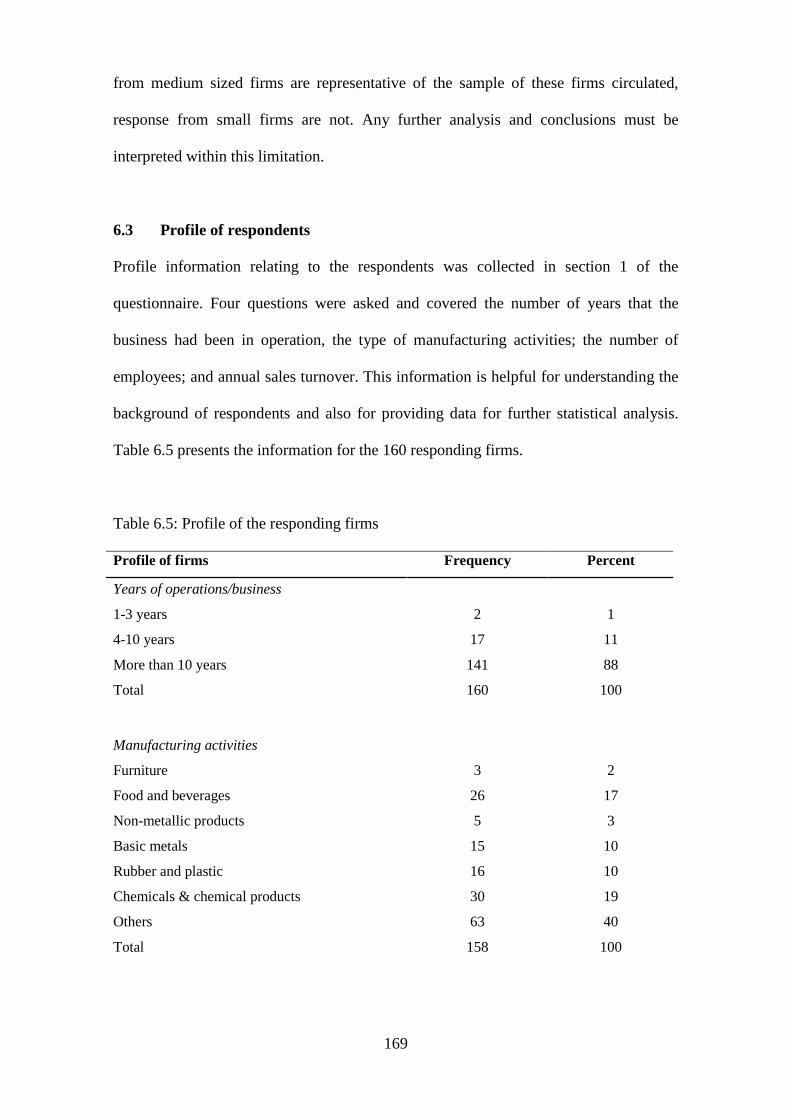
169
from medium sized firms are representative of the sample of these firms circulated,
response from small firms are not. Any further analysis and conclusions must be
interpreted within this limitation.
6.3 Profile of respondents
Profile information relating to the respondents was collected in section 1 of the
questionnaire. Four questions were asked and covered the number of years that the
business had been in operation, the type of manufacturing activities; the number of
employees; and annual sales turnover. This information is helpful for understanding the
background of respondents and also for providing data for further statistical analysis.
Table 6.5 presents the information for the 160 responding firms.
Table 6.5: Profile of the responding firms
Profile of firms Frequency Percent
Years of operations/business
1-3 years 2 1
4-10 years 17 11
More than 10 years 141 88
Total 160 100
Manufacturing activities
Furniture 3 2
Food and beverages 26 17
Non-metallic products 5 3
Basic metals 15 10
Rubber and plastic 16 10
Chemicals & chemical products 30 19
Others 63 40
Total 158 100
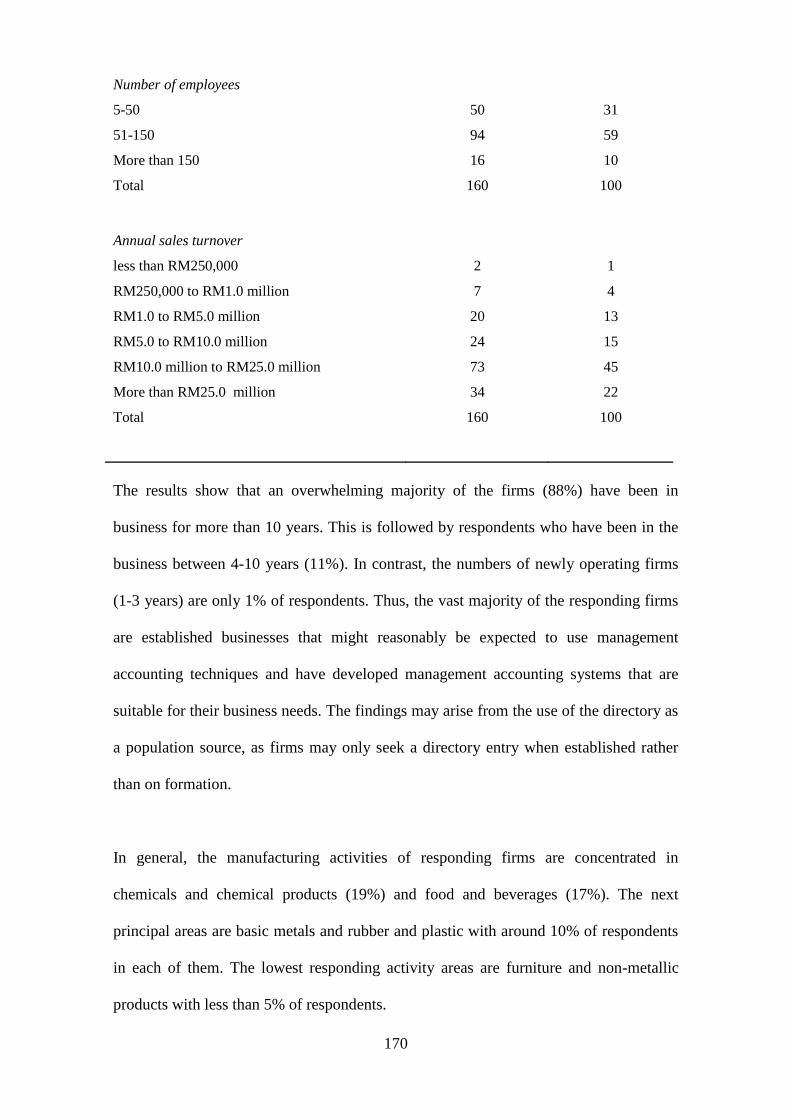
170
Number of employees
5-50 50 31
51-150 94 59
More than 150 16 10
Total 160 100
Annual sales turnover
less than RM250,000 2 1
RM250,000 to RM1.0 million 7 4
RM1.0 to RM5.0 million 20 13
RM5.0 to RM10.0 million 24 15
RM10.0 million to RM25.0 million 73 45
More than RM25.0 million 34 22
Total 160 100
The results show that an overwhelming majority of the firms (88%) have been in
business for more than 10 years. This is followed by respondents who have been in the
business between 4-10 years (11%). In contrast, the numbers of newly operating firms
(1-3 years) are only 1% of respondents. Thus, the vast majority of the responding firms
are established businesses that might reasonably be expected to use management
accounting techniques and have developed management accounting systems that are
suitable for their business needs. The findings may arise from the use of the directory as
a population source, as firms may only seek a directory entry when established rather
than on formation.
In general, the manufacturing activities of responding firms are concentrated in
chemicals and chemical products (19%) and food and beverages (17%). The next
principal areas are basic metals and rubber and plastic with around 10% of respondents
in each of them. The lowest responding activity areas are furniture and non-metallic
products with less than 5% of respondents.

171
As mentioned in section 6.2.1, the response rate among medium firms is
disproportionally higher than for small firms. The result indicates that the population is
heavily biased towards firms with over 50 employees (69%) with only 31% of
responding firms having 50 or less employees. This concentration of respondents in
larger firms is also indicated by the information gathered on the annual sales turnover of
the respondents Almost half of the responding firms reported annual sales from RM10
to RM25 million. This is followed by annual sales below RM10 million (33%). The
smallest group with less a quarter of total respondents is indicated by firms with annual
sales turnover more than RM25 million.
6.4 Extent of the use of management accounting practices
Section 2 in the questionnaire enquired into the extent of use of five major MAPs. Part
A discusses the use of costing systems; part B the types of budgeting systems
employed; part C examines the range of performance evaluation systems; part D
considers decision support techniques used; and part E explores the range of strategic
management accounting techniques used. The questionnaire first ascertained whether or
not the respondents used each particular practice in their firms. If yes, further enquiry
was then made into the extent of the use based on a five-point Likert scale. The
following subsections (6.4.1) and (6.4.2) summarize the results.
6.4.1 The use of management accounting practices
Table 6.6 details the extent to which there was any use of the designated MAPs. The
table splits the data into three main columns; two based on category of the firm (small
or medium) and the third the total result. The rank of MAPs by adoption is included at
the end of each column to provide an overview of the results.
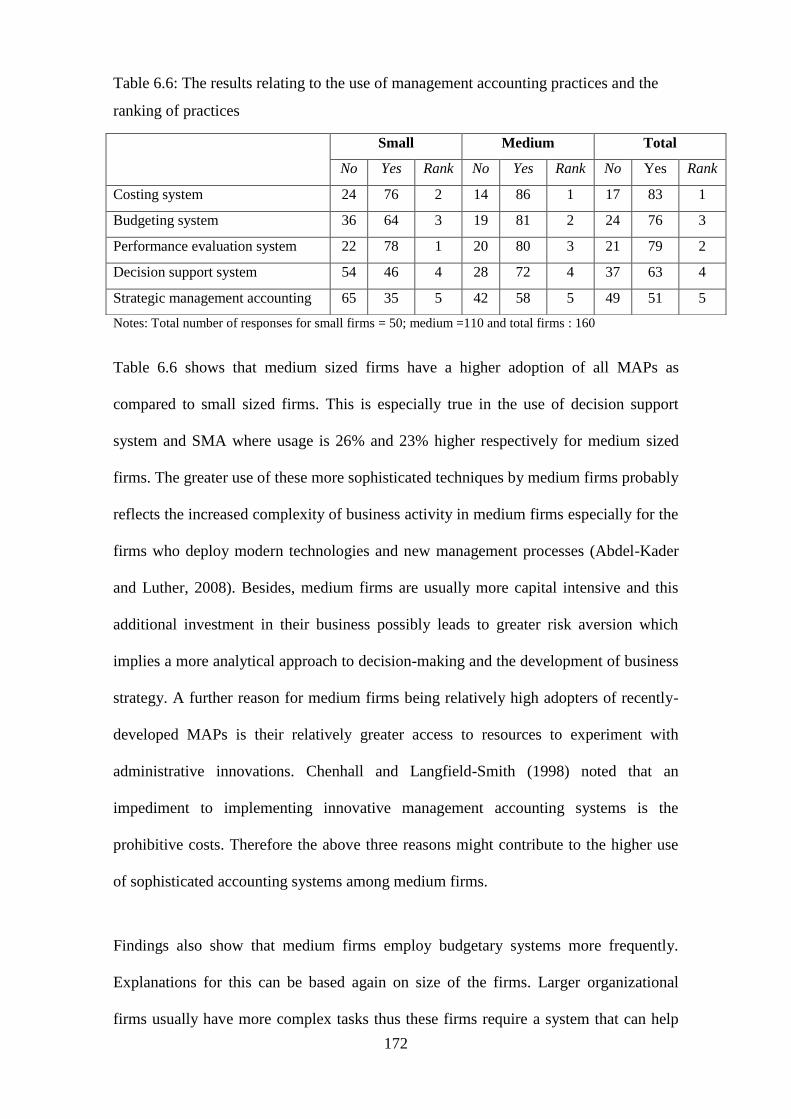
172
Table 6.6: The results relating to the use of management accounting practices and the
ranking of practices
Notes: Total number of responses for small firms = 50; medium =110 and total firms : 160
Table 6.6 shows that medium sized firms have a higher adoption of all MAPs as
compared to small sized firms. This is especially true in the use of decision support
system and SMA where usage is 26% and 23% higher respectively for medium sized
firms. The greater use of these more sophisticated techniques by medium firms probably
reflects the increased complexity of business activity in medium firms especially for the
firms who deploy modern technologies and new management processes (Abdel-Kader
and Luther, 2008). Besides, medium firms are usually more capital intensive and this
additional investment in their business possibly leads to greater risk aversion which
implies a more analytical approach to decision-making and the development of business
strategy. A further reason for medium firms being relatively high adopters of recently-
developed MAPs is their relatively greater access to resources to experiment with
administrative innovations. Chenhall and Langfield-Smith (1998) noted that an
impediment to implementing innovative management accounting systems is the
prohibitive costs. Therefore the above three reasons might contribute to the higher use
of sophisticated accounting systems among medium firms.
Findings also show that medium firms employ budgetary systems more frequently.
Explanations for this can be based again on size of the firms. Larger organizational
firms usually have more complex tasks thus these firms require a system that can help
Small Medium Total
No Yes Rank No Yes Rank No Yes Rank
Costing system 24 76 2 14 86 1 17 83 1
Budgeting system 36 64 3 19 81 2 24 76 3
Performance evaluation system 22 78 1 20 80 3 21 79 2
Decision support system 54 46 4 28 72 4 37 63 4
Strategic management accounting 65 35 5 42 58 5 49 51 5
173
them to achieve the common purpose and coordinate activities. Budgeting is one of
such systems, thus this may explain why medium firms have a higher rate of adoption
of budgeting system than small firms. In contrast, there is a little variation in the usage
of the other two MAPs; performance evaluation system (2%) and costing system (10%).
This finding suggests that monitoring business performance and the availability of cost
information are equally important to both categories of firms.
In terms of ranking, the most popular practice is performance evaluation within the
small firms and costing system in medium firms. However for all respondents, costing
system is the most widely used practice. In contrast, the least favoured practice is SMA
for both groups with only half of total respondents making any use of this practice
suggesting that this technique is not yet practical for many small and medium firms in
Malaysia.
In summary, the above discussion shows that the majority of respondents have used the
five management accounting areas identified. Use of the costing system, budgeting
system and performance evaluation system are significantly higher than for the decision
support system and SMA, which indicates that the uptake of traditional MAPs is greater
than for sophisticated MAPs. The results for all practices also indicate a higher usage by
medium firms as opposed to small firms. The most significant differences relate to the
use of decision support systems and SMA. It is argued that the discrepancies are
attributable to the relevance of those practices to the different size of the firms.
However, the impact of size on the variations on the use MAPs will be formally
investigated through statistical analysis in Chapter 7. The last finding is that within the
different size of firms, there is little difference in the ranking of adoption rates of MAPs
between small and medium companies.

174
6.4.2 The extent of the use of management accounting practices
This section will further investigate the frequency of use of 46 specific MAPs under the
broad headings discussed in section 6.4.1. The extent of the use of management
accounting was examined by requiring the respondents, who responded yes to using
broadly classified MAPs, to indicate the frequency of use of a range of detailed
management accounting techniques using a five-point scale (where S1 indicates ‗never‘
and S5 is ‗very frequently‘).The results of uptake of each management accounting
techniques are also included. The non-uptake refers to the number of respondents who
responded with ‗1‘ = never and ‗not applicable‘= Non-use (those who answered ‗No‘ in
the general ‗Yes/No‘ questions on the use of five areas of management accounting
practices). The following five subsections discuss further details.
6.4.2.1 Part A : Costing system
As discussed in Chapter 5, this part covers two aspects of the costing system; cost
collection method and specific costing technique. Table 6.7 shows the descriptive
results for the extent of use of costing system at this detailed level. In this table, the
ranking of techniques is based on mean value, which shows the average score of each
individual technique based on five-point Likert scale (S1 to S5). The standard
deviations are also provided to show the extent of diversity of responses.
Table 6.7 Descriptive statistics for costing systems and the ranking of techniques
Total uptake (%) Frequency of use
(S4 & S5) within.. Other descriptive statistics
S M Total Adopters Total
respondents Mean
Standard
deviation Rank
Cost collection method
Job costing 60 58 59 53 31 3.21 1.22 2
Batch costing 50 53 52 45 23 2.90 1.36 3
Contract costing 52 49 50 34 17 2.75 1.32 4
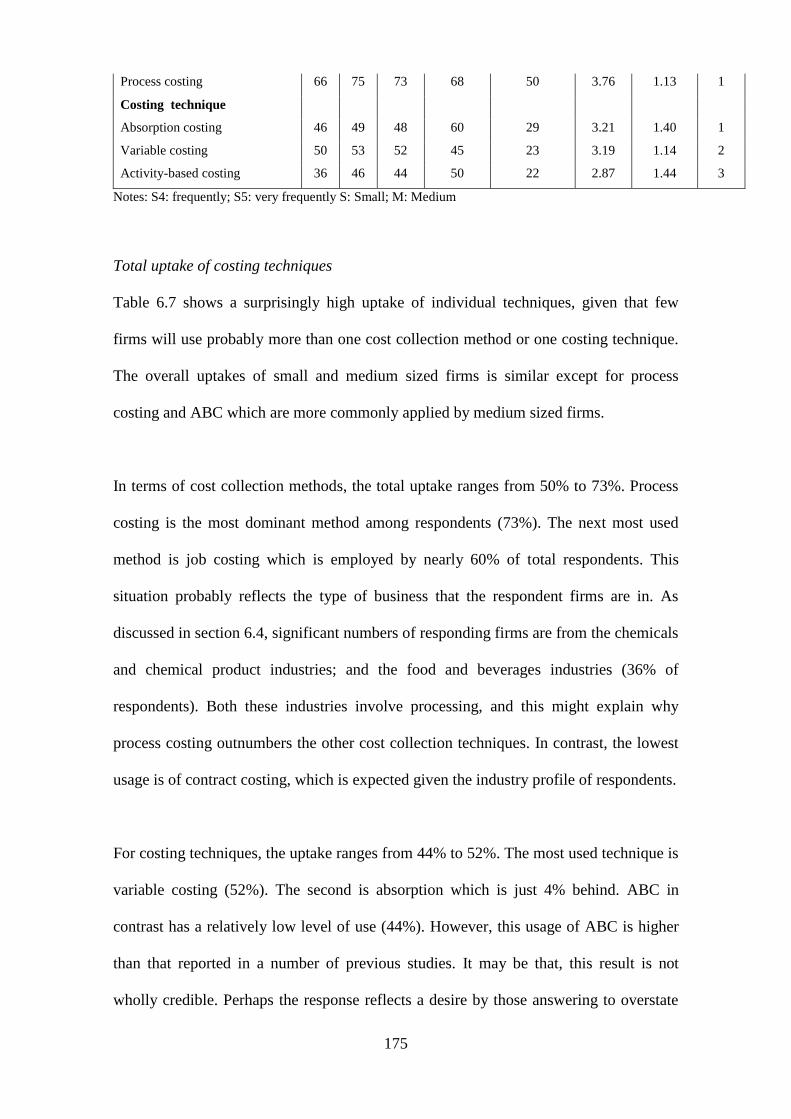
175
Process costing 66 75 73 68 50 3.76 1.13 1
Costing technique
Absorption costing 46 49 48 60 29 3.21 1.40 1
Variable costing 50 53 52 45 23 3.19 1.14 2
Activity-based costing 36 46 44 50 22 2.87 1.44 3
Notes: S4: frequently; S5: very frequently S: Small; M: Medium
Total uptake of costing techniques
Table 6.7 shows a surprisingly high uptake of individual techniques, given that few
firms will use probably more than one cost collection method or one costing technique.
The overall uptakes of small and medium sized firms is similar except for process
costing and ABC which are more commonly applied by medium sized firms.
In terms of cost collection methods, the total uptake ranges from 50% to 73%. Process
costing is the most dominant method among respondents (73%). The next most used
method is job costing which is employed by nearly 60% of total respondents. This
situation probably reflects the type of business that the respondent firms are in. As
discussed in section 6.4, significant numbers of responding firms are from the chemicals
and chemical product industries; and the food and beverages industries (36% of
respondents). Both these industries involve processing, and this might explain why
process costing outnumbers the other cost collection techniques. In contrast, the lowest
usage is of contract costing, which is expected given the industry profile of respondents.
For costing techniques, the uptake ranges from 44% to 52%. The most used technique is
variable costing (52%). The second is absorption which is just 4% behind. ABC in
contrast has a relatively low level of use (44%). However, this usage of ABC is higher
than that reported in a number of previous studies. It may be that, this result is not
wholly credible. Perhaps the response reflects a desire by those answering to overstate
176
their use of management accounting techniques to show a positive response for the
survey. Another possible contributory reason is that some of the respondents might not
understand the term and this led them to answer yes in case they did use it.
Total % of uptake of total adopters and total respondents who use costing systems
frequently or very frequently
An indicator that might overcome this possible underlying overstatement is the
proportion of respondents who answered that they made frequent (S4) or very frequent
use (S5) of the method or technique. Process costing is frequently and very frequently
used by almost two third of its users followed by job costing with 53% respondents.
Contract costing was lowest with just 34%. When this uptake is compared to all
respondents irrespective of whether or not they used a costing system (% of respondents
using a costing system x % using a method or technique frequently or very frequently),
the data shows that only 50% frequently or very frequently use process costing
compared with just over 30% for job costing. Meanwhile only a small minority of all
respondents (17%) frequently or very frequently apply contract costing.
Using the same measure for costing techniques, Table 6.7 shows that absorption costing
predominates over other techniques. This technique is frequently and very frequently
used by 60% of firms employing a costing system. Meanwhile only 45% indicate
frequent or very frequent use of variable costing and 50% indicate frequent use of ABC.
For all respondents, the results show that 29% firms frequently or very frequently used
absorption costing against just less than a quarter for both variable costing and ABC.
The uptake of 22% for ABC looks more realistic at this level.

177
Comparison of the results with those of previous studies
The result obtained for costing systems is at variance with previous studies. The
dissimilarities are probably explained by differences in size of the firms, type of
industries and country setting between these respondents and the respondents in prior
studies.
The use of process costing among respondents in the present study is higher than for
previous studies. For example Shields et al. (1991) and Wijewardena and De Zoysa
(1999) who studied among Japanese and Australian firms respectively discovered that
only just over 50% of respondents employed this technique and Lukka and Granlund
(1995) found a slightly lower rate with just over 40% of Swedish companies having
implemented process costing. The different results are possibly explained by the mix of
industries surveyed in Malaysia, which include a significant portion that are identifiable
as processing industries (36%).
Regarding the type of costing system, the findings show that absorption costing and
variable costing dominate among respondents to the present study. Previous studies also
noting the dominant use of absorption costing include Shields et al. (1990), Ask and Ax
(1992) and Drury et al. (1993). Similarly the significant use of variable costing was also
reported by Firth (1996), who indicated that more than 70% of Chinese firms were
using this technique. Meanwhile both in India and Thailand the use of variable costing
was found in more than 50% of firms (Joshi, 2001; Phadoongsitthi, 2003).
The lower use of ABC is consistent with most of the previous studies. For example,
both studies by Armitage and Nicholson (1993) and Innes and Mitchell (1995) found
that the uptake of ABC only up to 20% among respondents to their studies. A higher
adoption of ABC is reported by a few U.S based studies. Studies by Green and
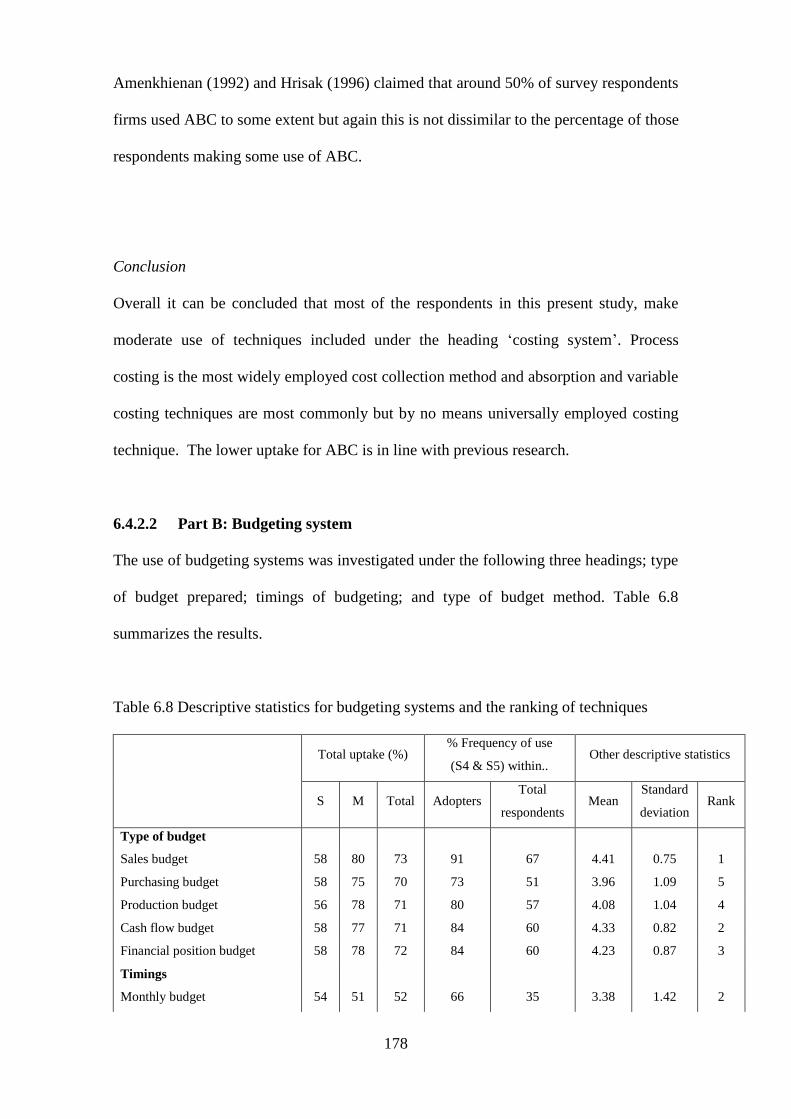
178
Amenkhienan (1992) and Hrisak (1996) claimed that around 50% of survey respondents
firms used ABC to some extent but again this is not dissimilar to the percentage of those
respondents making some use of ABC.
Conclusion
Overall it can be concluded that most of the respondents in this present study, make
moderate use of techniques included under the heading ‗costing system‘. Process
costing is the most widely employed cost collection method and absorption and variable
costing techniques are most commonly but by no means universally employed costing
technique. The lower uptake for ABC is in line with previous research.
6.4.2.2 Part B: Budgeting system
The use of budgeting systems was investigated under the following three headings; type
of budget prepared; timings of budgeting; and type of budget method. Table 6.8
summarizes the results.
Table 6.8 Descriptive statistics for budgeting systems and the ranking of techniques
Total uptake (%) % Frequency of use
(S4 & S5) within.. Other descriptive statistics
S M Total Adopters Total
respondents Mean
Standard
deviation Rank
Type of budget
Sales budget 58 80 73 91 67 4.41 0.75 1
Purchasing budget 58 75 70 73 51 3.96 1.09 5
Production budget 56 78 71 80 57 4.08 1.04 4
Cash flow budget 58 77 71 84 60 4.33 0.82 2
Financial position budget 58 78 72 84 60 4.23 0.87 3
Timings
Monthly budget 54 51 52 66 35 3.38 1.42 2
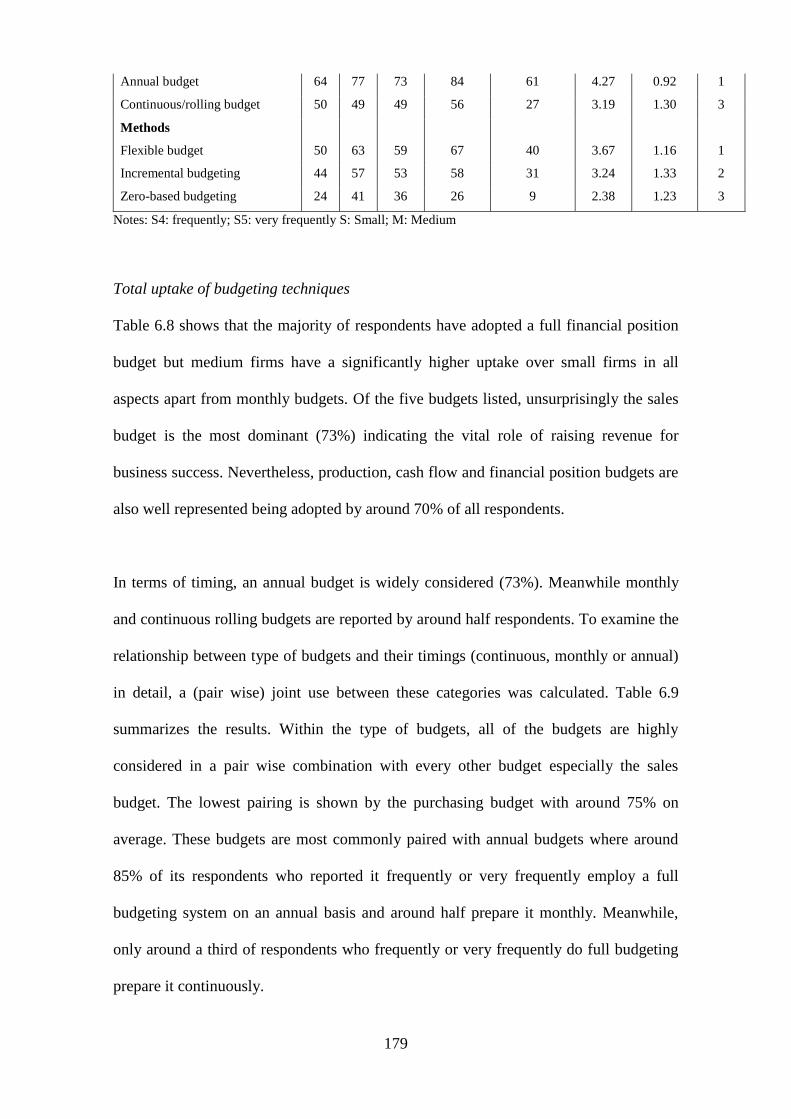
179
Annual budget 64 77 73 84 61 4.27 0.92 1
Continuous/rolling budget 50 49 49 56 27 3.19 1.30 3
Methods
Flexible budget 50 63 59 67 40 3.67 1.16 1
Incremental budgeting 44 57 53 58 31 3.24 1.33 2
Zero-based budgeting 24 41 36 26 9 2.38 1.23 3
Notes: S4: frequently; S5: very frequently S: Small; M: Medium
Total uptake of budgeting techniques
Table 6.8 shows that the majority of respondents have adopted a full financial position
budget but medium firms have a significantly higher uptake over small firms in all
aspects apart from monthly budgets. Of the five budgets listed, unsurprisingly the sales
budget is the most dominant (73%) indicating the vital role of raising revenue for
business success. Nevertheless, production, cash flow and financial position budgets are
also well represented being adopted by around 70% of all respondents.
In terms of timing, an annual budget is widely considered (73%). Meanwhile monthly
and continuous rolling budgets are reported by around half respondents. To examine the
relationship between type of budgets and their timings (continuous, monthly or annual)
in detail, a (pair wise) joint use between these categories was calculated. Table 6.9
summarizes the results. Within the type of budgets, all of the budgets are highly
considered in a pair wise combination with every other budget especially the sales
budget. The lowest pairing is shown by the purchasing budget with around 75% on
average. These budgets are most commonly paired with annual budgets where around
85% of its respondents who reported it frequently or very frequently employ a full
budgeting system on an annual basis and around half prepare it monthly. Meanwhile,
only around a third of respondents who frequently or very frequently do full budgeting
prepare it continuously.
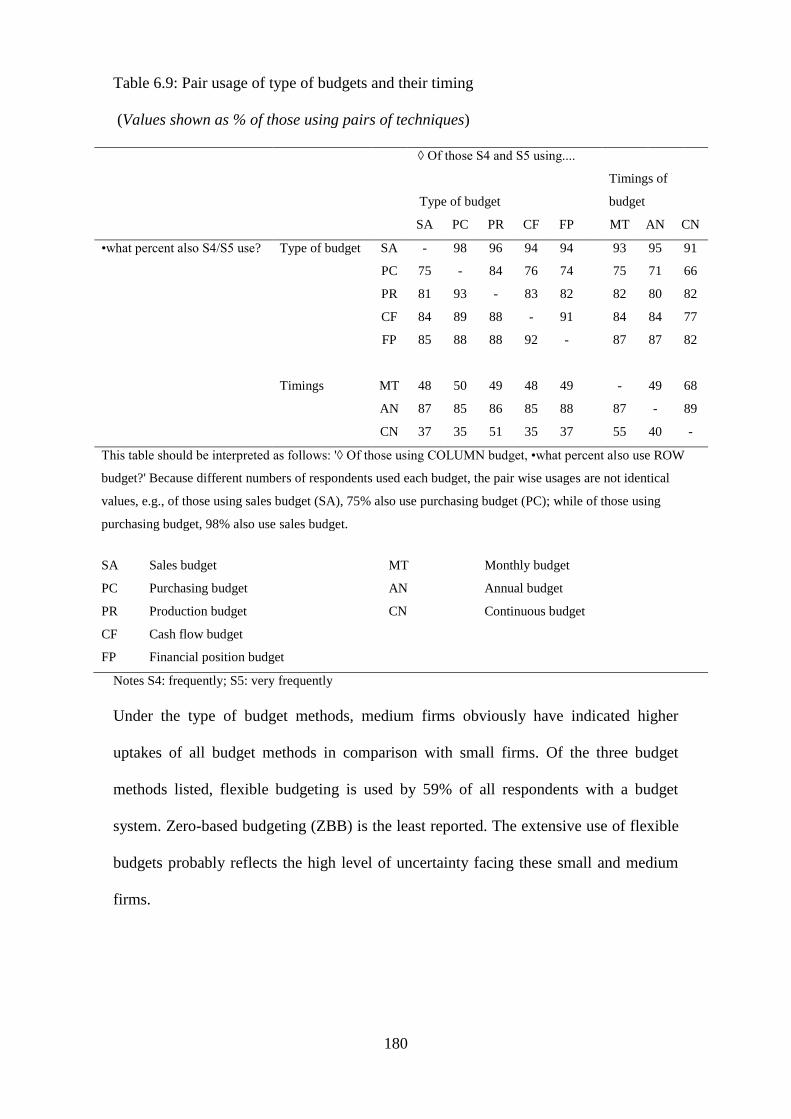
180
Table 6.9: Pair usage of type of budgets and their timing
(Values shown as % of those using pairs of techniques)
◊ Of those S4 and S5 using....
Type of budget
Timings of
budget
SA PC PR CF FP MT AN CN
•what percent also S4/S5 use? Type of budget SA - 98 96 94 94 93 95 91
PC 75 - 84 76 74 75 71 66
PR 81 93 - 83 82 82 80 82
CF 84 89 88 - 91 84 84 77
FP 85 88 88 92 - 87 87 82
Timings MT 48 50 49 48 49 - 49 68
AN 87 85 86 85 88 87 - 89
CN 37 35 51 35 37 55 40 -
This table should be interpreted as follows: '◊ Of those using COLUMN budget, •what percent also use ROW
budget?' Because different numbers of respondents used each budget, the pair wise usages are not identical
values, e.g., of those using sales budget (SA), 75% also use purchasing budget (PC); while of those using
purchasing budget, 98% also use sales budget.
SA Sales budget MT Monthly budget
PC Purchasing budget AN Annual budget
PR Production budget CN Continuous budget
CF Cash flow budget
FP Financial position budget
Notes S4: frequently; S5: very frequently
Under the type of budget methods, medium firms obviously have indicated higher
uptakes of all budget methods in comparison with small firms. Of the three budget
methods listed, flexible budgeting is used by 59% of all respondents with a budget
system. Zero-based budgeting (ZBB) is the least reported. The extensive use of flexible
budgets probably reflects the high level of uncertainty facing these small and medium
firms.

181
Total % of uptake of total adopters and total respondents who use budgeting system
frequently or very frequently
The sales budget is the budget with the highest percentage of frequent or very frequent
users (91% of adopters and 67% of total respondents). The other budgets are also
regularly applied by most of the respondents with a budget system (between 70% and
84%). Under the timings category, the annual budget is the most frequently used by the
respondents with a budget system (84%), which translates into frequent or very frequent
use by 61% of all respondents. In contrast, 40% or less of total respondents make
frequent or very frequent use of monthly and continuous budget.
When frequency of use is considered, ZBB is little used as of the 36% reporting use and
only 26% frequently or very frequently use which equates to only 9% of all
respondents. In comparison flexible budget is frequently used by 40% of total
respondents.
Comparison with previous research
The extensive use of full financial budgeting is consistent with Shields et al. (1990);
Yoshikawa (1994) and Chenhall and Langfield-Smith (1998) who all concluded that in
general budgeting systems are widely employed. Meanwhile the significant use of
flexible budgeting is consistent with Ahmad et al. (2003), who conducted a study
among Malaysian firms, and found that flexible budgeting has been widely
implemented among those firms in Malaysia that use budgeting. This result is also
similar to Drury et al. (1993) who found that 42% of UK firms adopted flexible
budgeting which is in line with the 40% reported by total respondents of this study. A
similarly result was reported by Pierce and O‘Dea (1998); and Szychta (2002).
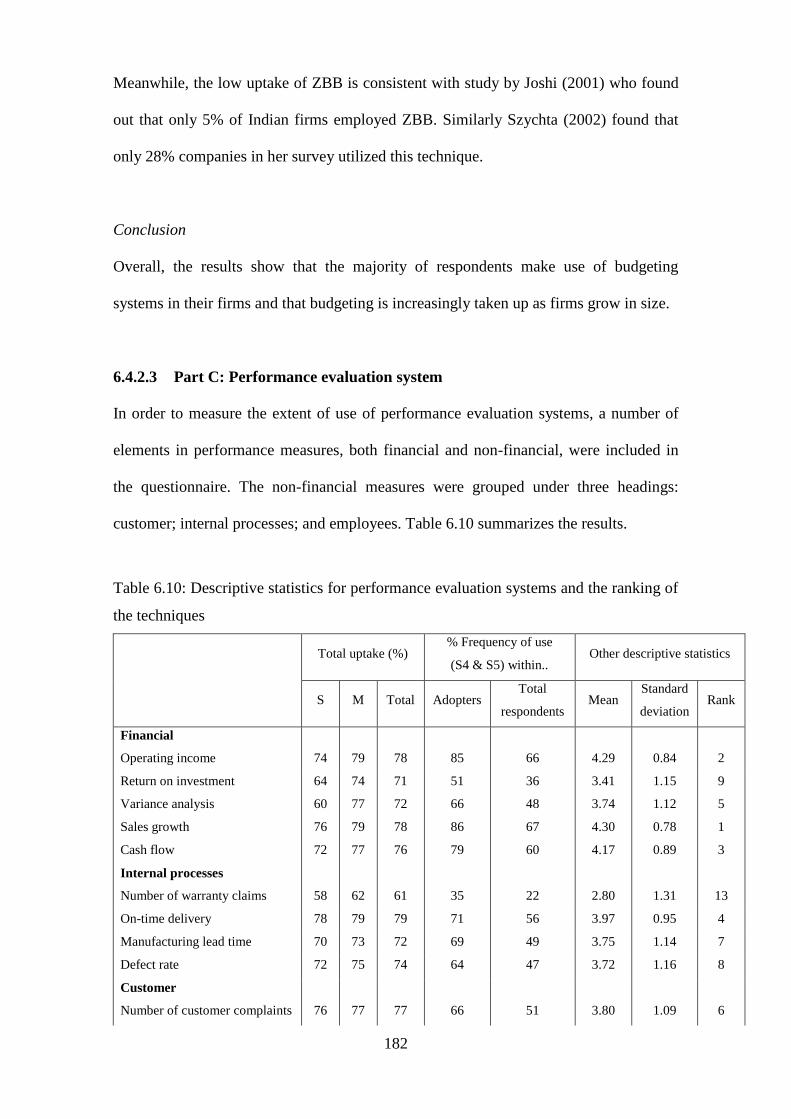
182
Meanwhile, the low uptake of ZBB is consistent with study by Joshi (2001) who found
out that only 5% of Indian firms employed ZBB. Similarly Szychta (2002) found that
only 28% companies in her survey utilized this technique.
Conclusion
Overall, the results show that the majority of respondents make use of budgeting
systems in their firms and that budgeting is increasingly taken up as firms grow in size.
6.4.2.3 Part C: Performance evaluation system
In order to measure the extent of use of performance evaluation systems, a number of
elements in performance measures, both financial and non-financial, were included in
the questionnaire. The non-financial measures were grouped under three headings:
customer; internal processes; and employees. Table 6.10 summarizes the results.
Table 6.10: Descriptive statistics for performance evaluation systems and the ranking of
the techniques
Total uptake (%) % Frequency of use
(S4 & S5) within.. Other descriptive statistics
S M Total Adopters Total
respondents Mean
Standard
deviation Rank
Financial
Operating income 74 79 78 85 66 4.29 0.84
2
Return on investment 64 74 71 51 36 3.41 1.15 9
Variance analysis 60 77 72 66 48 3.74 1.12 5
Sales growth 76 79 78 86 67 4.30 0.78 1
Cash flow 72 77 76 79 60 4.17 0.89 3
Internal processes
Number of warranty claims 58 62 61 35 22 2.80 1.31 13
On-time delivery 78 79 79 71 56 3.97 0.95 4
Manufacturing lead time 70 73 72 69 49 3.75 1.14 7
Defect rate 72 75 74 64 47 3.72 1.16 8
Customer
Number of customer complaints 76 77 77 66 51 3.80 1.09 6
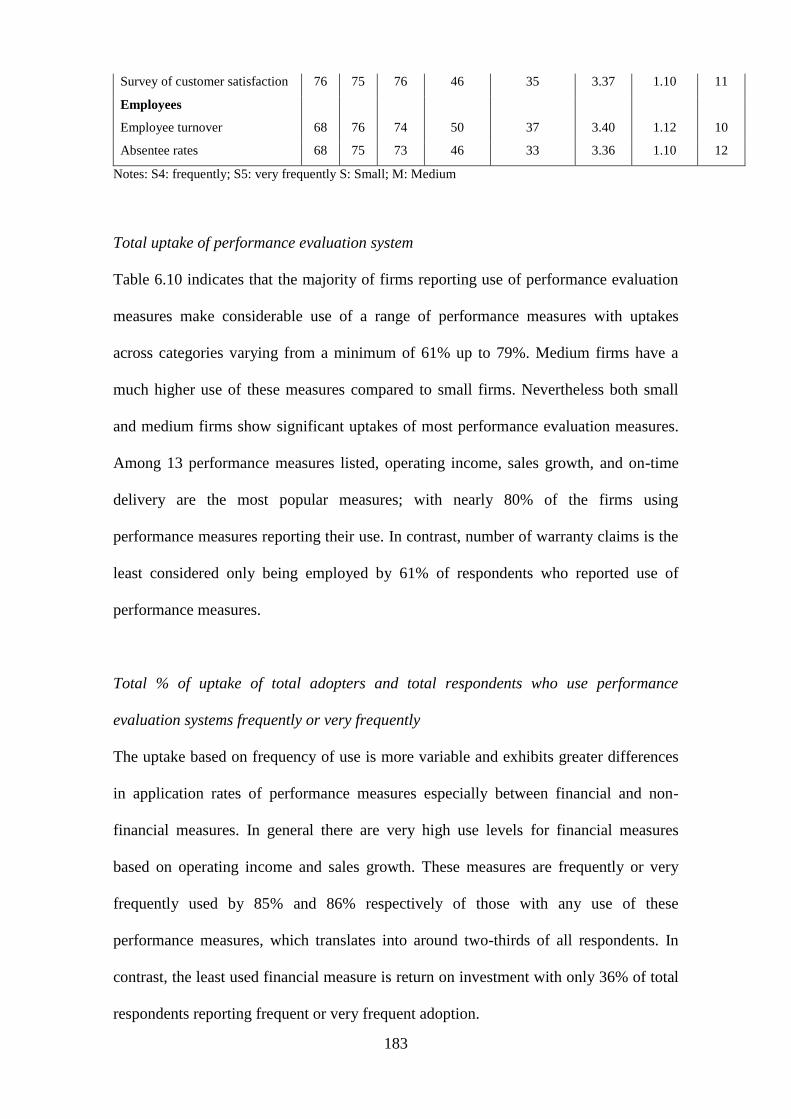
183
Survey of customer satisfaction 76 75 76 46 35 3.37 1.10 11
Employees
Employee turnover 68 76 74 50 37 3.40 1.12 10
Absentee rates 68 75 73 46 33 3.36 1.10 12
Notes: S4: frequently; S5: very frequently S: Small; M: Medium
Total uptake of performance evaluation system
Table 6.10 indicates that the majority of firms reporting use of performance evaluation
measures make considerable use of a range of performance measures with uptakes
across categories varying from a minimum of 61% up to 79%. Medium firms have a
much higher use of these measures compared to small firms. Nevertheless both small
and medium firms show significant uptakes of most performance evaluation measures.
Among 13 performance measures listed, operating income, sales growth, and on-time
delivery are the most popular measures; with nearly 80% of the firms using
performance measures reporting their use. In contrast, number of warranty claims is the
least considered only being employed by 61% of respondents who reported use of
performance measures.
Total % of uptake of total adopters and total respondents who use performance
evaluation systems frequently or very frequently
The uptake based on frequency of use is more variable and exhibits greater differences
in application rates of performance measures especially between financial and non-
financial measures. In general there are very high use levels for financial measures
based on operating income and sales growth. These measures are frequently or very
frequently used by 85% and 86% respectively of those with any use of these
performance measures, which translates into around two-thirds of all respondents. In
contrast, the least used financial measure is return on investment with only 36% of total
respondents reporting frequent or very frequent adoption.

184
Among non-financial measures, relating to internal processes, on-time delivery is the
most frequently used measure with 71% using it frequently or very frequently. This
uptake translates into 56% of all respondents using it frequently or very frequently. The
measure least reported frequently or very frequently is the number of warranty claims at
35% or only 22% of total respondents. Perhaps this low figure arises because many
respondents do not offer warranties. Meanwhile, both manufacturing lead time and
defect rate are moderately used with around half of total respondents claiming frequent
or very frequent adoption.
Measures relating to customers and employees respectively have a lower frequency of
use. The most used measure in this category is the number of customer complaints
where 66% of those indicating its adoption report frequent or very frequent use, which
ranks it sixth among all performance measures. Customer satisfaction is little used
perhaps because the respondents have already focused on number of customer
complaints as a primary tool for evaluating their customer-based performance. Lastly
both employee-based measures; employees‘ turnover and employees‘ absentee rates are
frequently and very frequently used around half of those who reported use of those
measures.
Comparison with previous research
The extensive use of financial measures of performance is consistent with other studies
(see for example, Joshi (2001); Phadoongsitthi (2003); Abdel-Kader and Luther (2006);
and Jusoh and Parnell (2008). Phadoongsitthi (2003) reported that most Thai firms still
focus on financial performance measures such as budget variance analysis, return on
investment, cash flow return on investment, and divisional profit Similarly Jusoh and
Parnell (2008) revealed that many Malaysian manufacturing firms placed a greater

185
emphasis on financial rather than non-financial measures. These studies however
reported that return on investment was extensively employed which is inconsistent with
the present study. As elsewhere, this difference probably reflects the size of the sample
firms compared to those in these studies as smaller firms either have less involvement in
investment activities or approach it less formally than larger firms.
With regard to non-financial performance measures, measures related to internal
processes and customers are found have a high adoption rate among the majority of
respondents in previous studies (see for example, Chenhall and Langfield-Smith (1998);
Phadoongsitthi (2003); Abdel-Kader and Luther (2006); and Abdel-Maksoud et al.
(2008). Phadoongsitthi (2003) indicated that Thai firms increase their focus on customer
satisfaction and on-time delivery when considering performance. Likewise Abdel-
Maksoud et al. (2005) indicated that the overwhelming majority of UK manufacturing
companies measure performance in terms of delivery timeliness, number of complaints
from customers and customer satisfaction.
Conclusion
The results show that a significant number of respondents have adopted one or more
measures both financial and non-financial but that reliance on financial measures is
greater than for non-financial measures. The main non-financial measures frequently
used by respondents are on-time delivery, number of customer complaints and
manufacturing lead time. These findings suggest that respondents, who use non-
financial performance measures, are more internal-process and customer focused rather
than employee focused. The lower use of non-financial measures is consistent with prior
research but may also be attributed to the size of the firms as it is difficult for smaller
firms to employ as many performance measures as larger firms because of cost and

186
other limitations. Besides as non-financial measures are more recently-developed
measures, their adoption may not be as widespread as opposed to the traditional
measures which have long been used by many firms. Thus these reasons might explain
the low adoption of non-financial measures found in this study.
6.4.2.4 Part D: Decision support system
The extent of use of decision support systems was approached through dividing the area
between short-run and long run decisions as indicated in Table 6.11, which summarises
the responses.
Table 6.11: Descriptive statistics for the use of decision support systems and the ranking
of techniques.
Total uptake (%) % Frequency of use
(S4 & S5) within.. Other descriptive statistics
S M Total Adopters Total
respondents Mean
Standard
deviation Rank
Short-run
Break-even analysis 40 63 56 55 31 3.60 1.08 2
Stock control model 44 65 58 55 32 3.55 1.00 3
Product profitability analysis 40 70 61 82 51 4.04 0.77 1
Customer profitability analysis 38 65 56 48 27 3.39 1.04 6
Long-run
Payback 38 63 55 51 28 3.37 1.17 4
Accounting rate of return 36 56 50 46 24 3.17 1.23 7
Net present value 32 57 49 47 23 3.12 1.23 5
Internal rate of return 30 58 49 46 23 3.04 1.22 8
Notes: S4: frequently; S5: very frequently S: Small; M: Medium
Total uptake of decision support system
The overall uptake of decision support system is moderate. The short-run category has
an adoption rate around 60% of respondents, who employed a decision support system,
against around 50% for the long-run category. Medium firms have far greater uptake of
187
all techniques than small firms. For medium firms the uptake ranges from 56% to 70%
which is significantly more than small firms (from 32% to 44%). This finding clearly
suggests that larger firms are more likely to use a more sophisticated approach to
management accounting. Under short-run analysis, the most used technique is product
profitability analysis (61%). The other three techniques (stock control model, break-
even analysis and customer profitability analysis) are adopted by a slightly lower
percentage of those respondents who made some use of decisions support systems.
Meanwhile under the long-run category, the overall uptakes are rather lower than the
first category. Under this category, payback technique is the leader as 55% of
respondents who made some use of decision support systems, adopted this technique.
Meanwhile all the three discounted techniques are adopted by around 50% respondents
of those who made some use of decision support systems.
Total % of uptake of total adopters and total respondents who use decision support
system frequently or very frequently
In terms of frequency of use, among the four techniques listed under short-run category,
product profitability analysis has the highest frequency of use. The table shows that
82% of product profitability analysis adopters use it frequently or very frequently,
which equates to 51% of the overall respondents. Other short run techniques were
employed less with between 48% and 55% of adopters using those techniques
frequently or very frequently, which equates to between 27% and 32% of total
respondents.
Unsurprisingly given the likely lack of repeated major investment decisions in firms of
this size, the level of frequency shown under long run analysis is low. Out of the four
long run analysis techniques, payback is frequently or very frequently use by 51% of

188
adopters. However when this uptake is compared to the total respondents only 28%
respondents frequently or very frequently use this technique. Others long run techniques
are only frequently or very frequently applied by around 45% of their adopters and not
by more than a quarter of total respondents. Overall this result suggests that the capital
investment techniques are infrequently used by respondents to this study.
Comparison with previous research
The percentage uptake of product profitability analysis overall is at the low end that
reported in previous research findings. For example, Chenhall and Langfield-Smith
(1998); Joshi (2001); and Drury and Tayles (2006) reported that product profitability
technique was used by more than 80% of firms in their studies This is reasonable as the
sample is taken from relatively small-size firms, whereas previous findings mostly
included large companies. The other short-term analysis tool that was frequently
reported on in previous studies is break-even analysis. These studies consistently
reported infrequent use of this technique which is in line with the result of this study.
For example in Poland, Szychta (2002) found that this technique was used by just under
50% respondents. Meanwhile Abdel-Kader and Luther (2006) found that just under
40% of U.K firms often or very often utilized this technique.
Capital investment analysis techniques have been widely investigated. The present
study indicates a low use of all types of long-run analysis tools especially discounted
cash flow based analyses and this is consistent with previous studies. For example,
Shields et al. (1991); Lazaridis (2004); and Abdel-Kader and Luther (2006) reported use
of NPV and IRR at between 9% and 19%. Payback is the most popular technique but
the rates of uptake for Malaysian SMEs are lower than those reported in either Shields
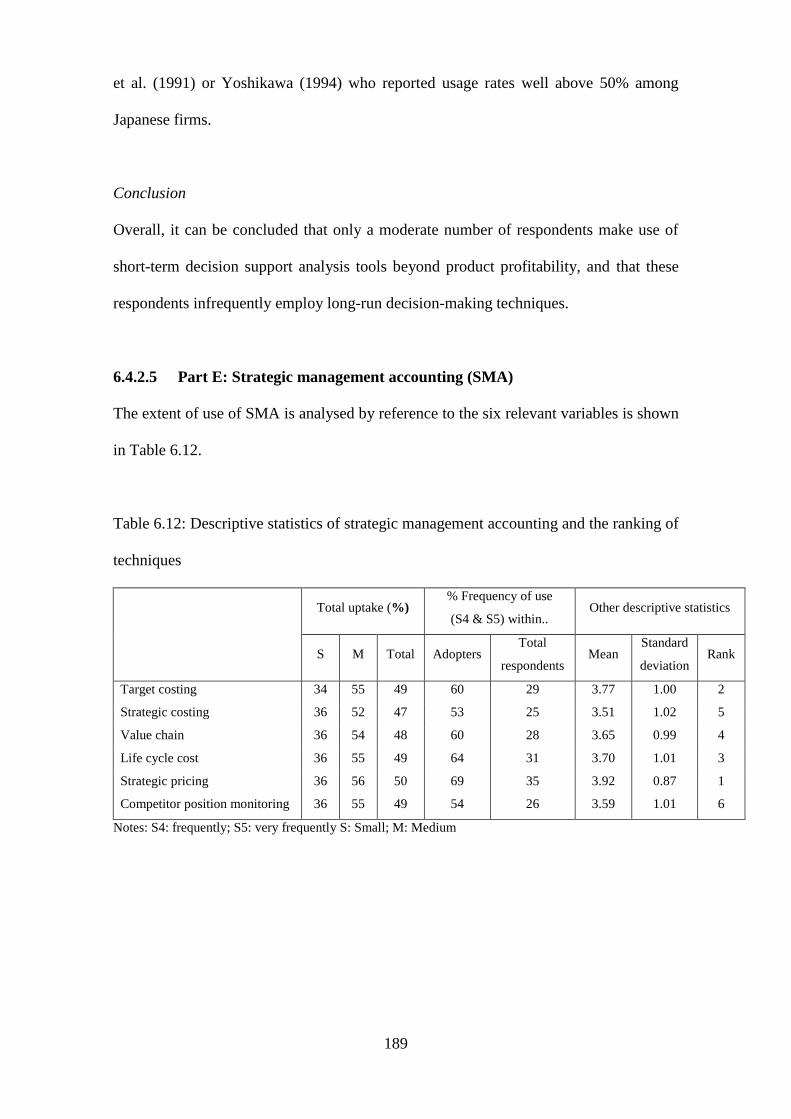
189
et al. (1991) or Yoshikawa (1994) who reported usage rates well above 50% among
Japanese firms.
Conclusion
Overall, it can be concluded that only a moderate number of respondents make use of
short-term decision support analysis tools beyond product profitability, and that these
respondents infrequently employ long-run decision-making techniques.
6.4.2.5 Part E: Strategic management accounting (SMA)
The extent of use of SMA is analysed by reference to the six relevant variables is shown
in Table 6.12.
Table 6.12: Descriptive statistics of strategic management accounting and the ranking of
techniques
Total uptake (%) % Frequency of use
(S4 & S5) within.. Other descriptive statistics
S M Total Adopters Total
respondents Mean
Standard
deviation Rank
Target costing 34 55 49 60 29 3.77 1.00 2
Strategic costing 36 52 47 53 25 3.51 1.02 5
Value chain 36 54 48 60 28 3.65 0.99 4
Life cycle cost 36 55 49 64 31 3.70 1.01 3
Strategic pricing 36 56 50 69 35 3.92 0.87 1
Competitor position monitoring 36 55 49 54 26 3.59 1.01 6
Notes: S4: frequently; S5: very frequently S: Small; M: Medium
190
Total uptake of strategic management accounting
Table 6.12 indicates that the overall uptake of individual strategic MAPs is low among
respondents who reported use of SMA techniques. Small firms have a considerably
lower adoption rate than medium sized firms who report between 52% and 56% uptake
of each listed technique. In term of total respondents, none of the techniques are adopted
by more than half of total respondents. The result is in line with expectation to the size
of the responding firms. As has been discussed in the previous section 6.4.1, given the
SMA is an advanced management accounting practice and is therefore more likely to be
employed by larger firms who will have a more sophisticated approach to strategic
planning.
Total % of uptake of total adopters and total respondents who use strategic
management accounting frequently or very frequently
The number of respondents using SMA techniques, frequently or very frequently,
ranges from 53% to 69% among adopters which means that this level of use is
undertaken by not more than 35% of total respondents. These results clearly confirm
that SMA is only implemented frequently or very frequently by a minority of total
respondents. Of the six techniques, strategic pricing is most frequently used either
within adopters or overall respondents (69% and 35% respectively). The rest of the
techniques are highly used by only between 25% and 31% of all respondents.
Comparison with previous research
Table 6.12 suggests that strategic pricing, target costing and life cycle costing are the
top three techniques used by respondents. Nevertheless it is noted that the overall
uptake and the frequency of use is low. The top position of strategic pricing is
consistent with Guilding et al. (2000) who found that strategic pricing is the most
191
widely-used among large companies in New Zealand, the United Kingdom and the
United States. In term of life cycle costing, the present result is consistent with studies
by Chenhall and Langfield-Smith (1998) and Joshi (2001). However Abdel-Kader and
Luther (2006) reported that only 5% UK firms often or very often employed this
analysis.
The use of target costing by around 50% of total sample parallels results in prior
studies. For example, Chenhall and Langfield-Smith (1998) reported that target costing
was used by less than half of Australian firms and Cinquini et al. (1999) indicated a
very low use of target costing in Italy where only 15% firms utilized this technique.
Similarly Joshi (2001) reported that just over a third of Indian firms used this technique,
and Abdel-Kader and Luther (2006) found that just under a quarter of British firms
often and very often employed target costing.
The low use of value chain analysis and competitive monitoring position is also
consistent with previous research. For example both Chenhall and Langfield-Smith
(1998) and Joshi (2001) reported a relatively low use of value chain analysis in their
studies. Further, Abdel-Kader and Luther (2006) revealed that competitive position
analysis and value chain analysis is frequently used by 33% and 19% respectively of
British firms which is not very different from the result in this study which is 26% and
28% respectively, although obviously the sample of SMEs represents small enterprises
that examined by Abdel-Kader and Luther.
Conclusion
Overall, the usage of SMA practices is low. The reasons for this are probably similar to
those accounting for the low use of decision in support system as discussed above. The

192
result of this study is consistent with that of Guilding et al. (2000), who in a multi-
country study reported low usage rates for SMA techniques.
6.5 Factors which affect of the extent of the use of MAPs
Section 3 of the questionnaire survey examined the external and internal factors that
might influence the extent of use of MAPs. Four variables were investigated: intensity
of market competition (part A); qualifications possessed by accounting staff (part B);
the participation of owner/manager (part C); and the use of advanced technology (part
D). The selection of these variables and reasons for using such variables was discussed
in detail in Chapter 4 section 4.4.4. The following sections present the findings relating
to these issues.
6.5.1 Part A: Intensity of market competition
Respondents were asked to indicate the degree of intensity of competition for their
product in the market on a five-point Likert scale where 1;‘ not intense at all‘ to 5; ‗very
intense‘. Of the 156 respondents to this question, Table 6.13 shows that 76% reported
‗intense‘ or ‗very intense‘ competition. The mean value of 3.98 and the most frequent
response of S4 (46%), show that the average and median competition in their market is
perceived as intense.
Table 6.13: Assessment of market competition by percentage of respondents
n Mean
Standard
% S1 S2 S3 S4 S5 deviation
How intense is competition? 98 2 3 19 46 30 3.98 0.901
Notes:n: number of respondents; S1: not intense at all;S2: not intense; S3: slightly intense; S4: intense; S5: very
intense
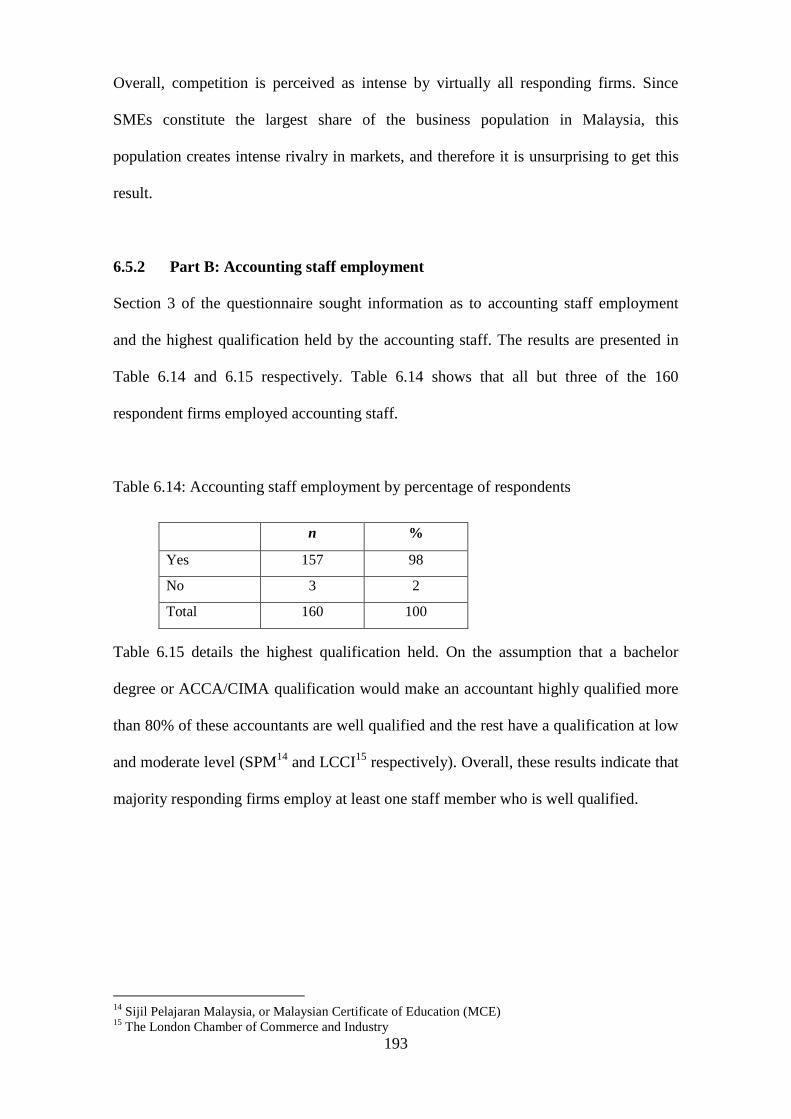
193
Overall, competition is perceived as intense by virtually all responding firms. Since
SMEs constitute the largest share of the business population in Malaysia, this
population creates intense rivalry in markets, and therefore it is unsurprising to get this
result.
6.5.2 Part B: Accounting staff employment
Section 3 of the questionnaire sought information as to accounting staff employment
and the highest qualification held by the accounting staff. The results are presented in
Table 6.14 and 6.15 respectively. Table 6.14 shows that all but three of the 160
respondent firms employed accounting staff.
Table 6.14: Accounting staff employment by percentage of respondents
Table 6.15 details the highest qualification held. On the assumption that a bachelor
degree or ACCA/CIMA qualification would make an accountant highly qualified more
than 80% of these accountants are well qualified and the rest have a qualification at low
and moderate level (SPM14
and LCCI15
respectively). Overall, these results indicate that
majority responding firms employ at least one staff member who is well qualified.
14
Sijil Pelajaran Malaysia, or Malaysian Certificate of Education (MCE) 15
The London Chamber of Commerce and Industry
n %
Yes 157 98
No 3 2
Total 160 100
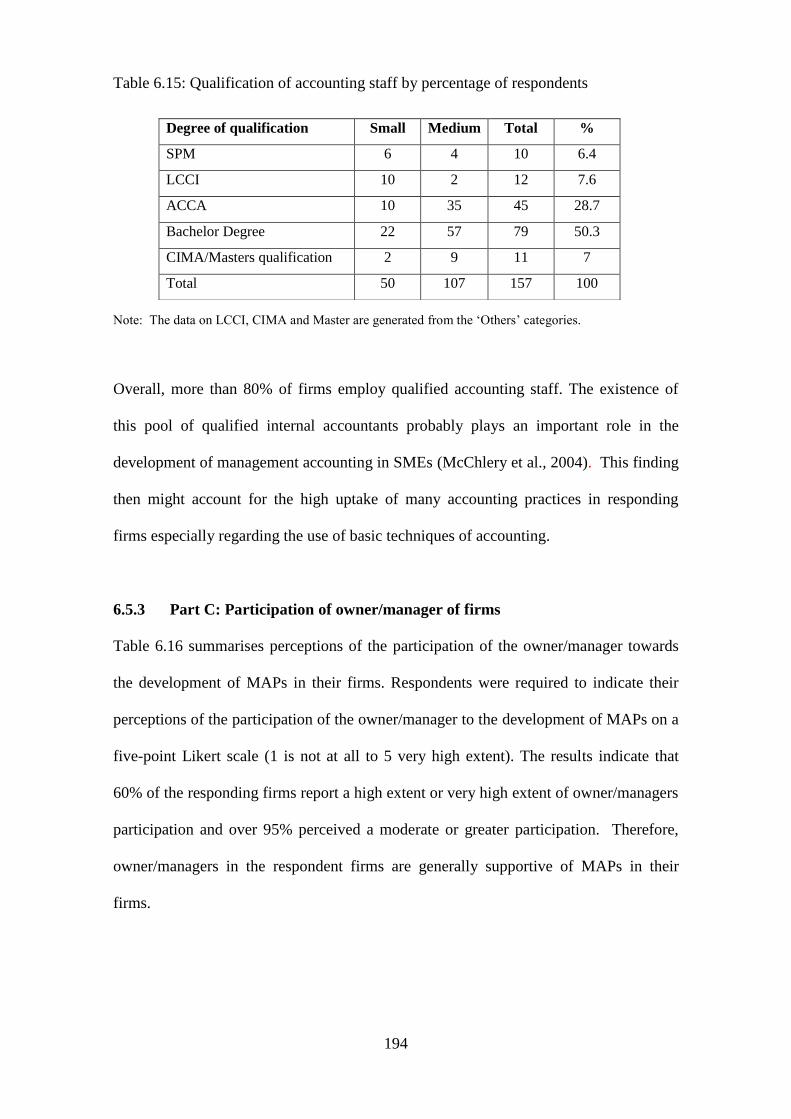
194
Table 6.15: Qualification of accounting staff by percentage of respondents
Note: The data on LCCI, CIMA and Master are generated from the ‗Others‘ categories.
Overall, more than 80% of firms employ qualified accounting staff. The existence of
this pool of qualified internal accountants probably plays an important role in the
development of management accounting in SMEs (McChlery et al., 2004). This finding
then might account for the high uptake of many accounting practices in responding
firms especially regarding the use of basic techniques of accounting.
6.5.3 Part C: Participation of owner/manager of firms
Table 6.16 summarises perceptions of the participation of the owner/manager towards
the development of MAPs in their firms. Respondents were required to indicate their
perceptions of the participation of the owner/manager to the development of MAPs on a
five-point Likert scale (1 is not at all to 5 very high extent). The results indicate that
60% of the responding firms report a high extent or very high extent of owner/managers
participation and over 95% perceived a moderate or greater participation. Therefore,
owner/managers in the respondent firms are generally supportive of MAPs in their
firms.
Degree of qualification Small Medium Total %
SPM 6 4 10 6.4
LCCI 10 2 12 7.6
ACCA 10 35 45 28.7
Bachelor Degree 22 57 79 50.3
CIMA/Masters qualification 2 9 11 7
Total 50 107 157 100
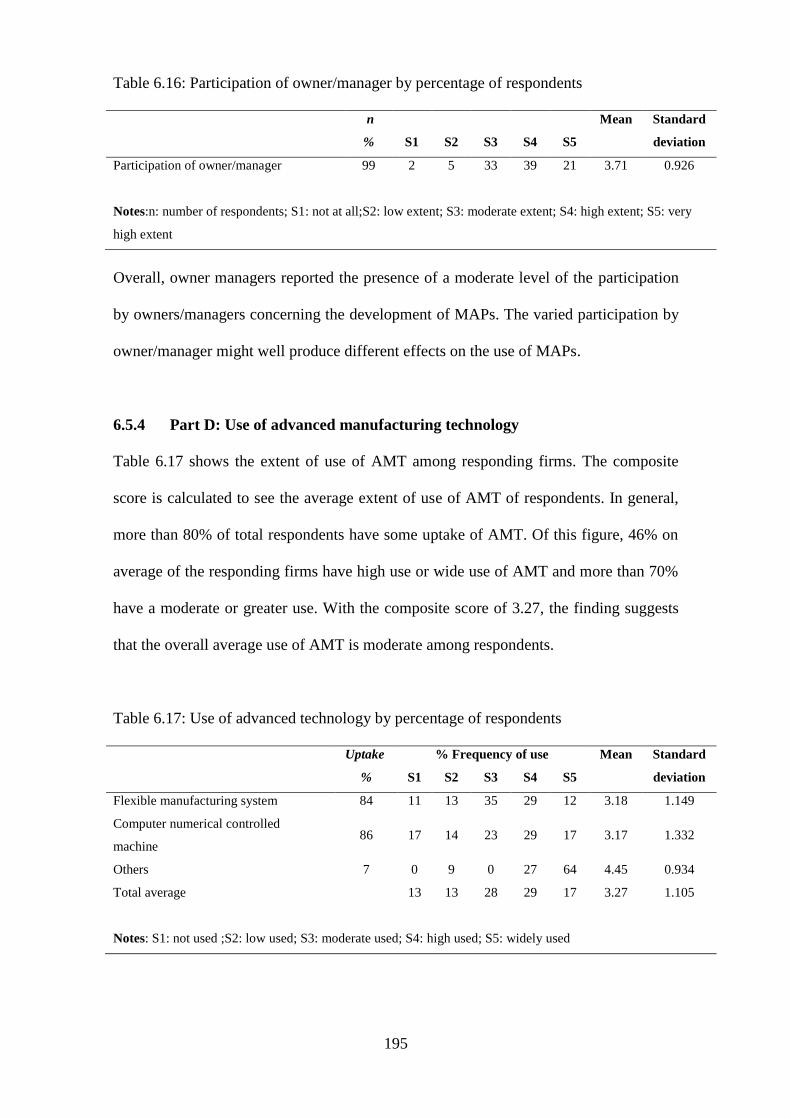
195
Table 6.16: Participation of owner/manager by percentage of respondents
n Mean
Standard
% S1 S2 S3 S4 S5 deviation
Participation of owner/manager 99 2 5 33 39 21 3.71 0.926
Notes:n: number of respondents; S1: not at all;S2: low extent; S3: moderate extent; S4: high extent; S5: very
high extent
Overall, owner managers reported the presence of a moderate level of the participation
by owners/managers concerning the development of MAPs. The varied participation by
owner/manager might well produce different effects on the use of MAPs.
6.5.4 Part D: Use of advanced manufacturing technology
Table 6.17 shows the extent of use of AMT among responding firms. The composite
score is calculated to see the average extent of use of AMT of respondents. In general,
more than 80% of total respondents have some uptake of AMT. Of this figure, 46% on
average of the responding firms have high use or wide use of AMT and more than 70%
have a moderate or greater use. With the composite score of 3.27, the finding suggests
that the overall average use of AMT is moderate among respondents.
Table 6.17: Use of advanced technology by percentage of respondents
Uptake % Frequency of use Mean
Standard
% S1 S2 S3 S4 S5 deviation
Flexible manufacturing system 84 11 13 35 29 12 3.18 1.149
Computer numerical controlled
machine 86 17 14 23 29 17 3.17 1.332
Others 7 0 9 0 27 64 4.45 0.934
Total average 13 13 28 29 17 3.27 1.105
Notes: S1: not used ;S2: low used; S3: moderate used; S4: high used; S5: widely used
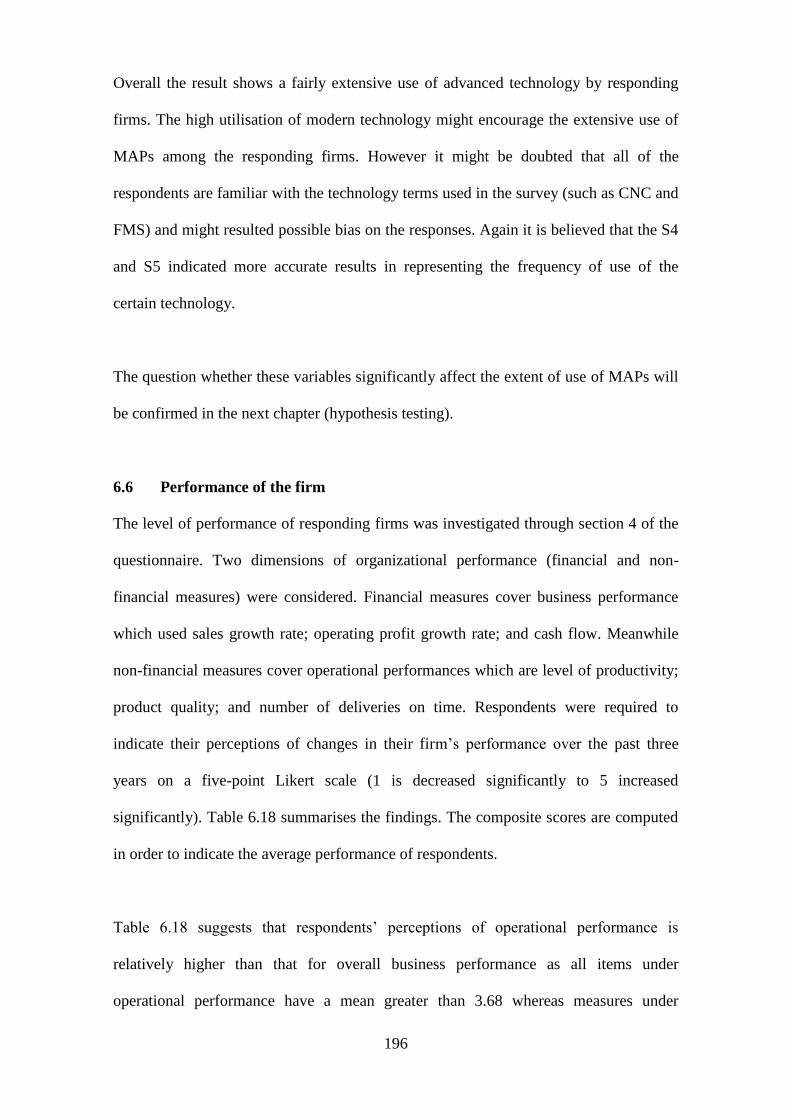
196
Overall the result shows a fairly extensive use of advanced technology by responding
firms. The high utilisation of modern technology might encourage the extensive use of
MAPs among the responding firms. However it might be doubted that all of the
respondents are familiar with the technology terms used in the survey (such as CNC and
FMS) and might resulted possible bias on the responses. Again it is believed that the S4
and S5 indicated more accurate results in representing the frequency of use of the
certain technology.
The question whether these variables significantly affect the extent of use of MAPs will
be confirmed in the next chapter (hypothesis testing).
6.6 Performance of the firm
The level of performance of responding firms was investigated through section 4 of the
questionnaire. Two dimensions of organizational performance (financial and non-
financial measures) were considered. Financial measures cover business performance
which used sales growth rate; operating profit growth rate; and cash flow. Meanwhile
non-financial measures cover operational performances which are level of productivity;
product quality; and number of deliveries on time. Respondents were required to
indicate their perceptions of changes in their firm‘s performance over the past three
years on a five-point Likert scale (1 is decreased significantly to 5 increased
significantly). Table 6.18 summarises the findings. The composite scores are computed
in order to indicate the average performance of respondents.
Table 6.18 suggests that respondents‘ perceptions of operational performance is
relatively higher than that for overall business performance as all items under
operational performance have a mean greater than 3.68 whereas measures under
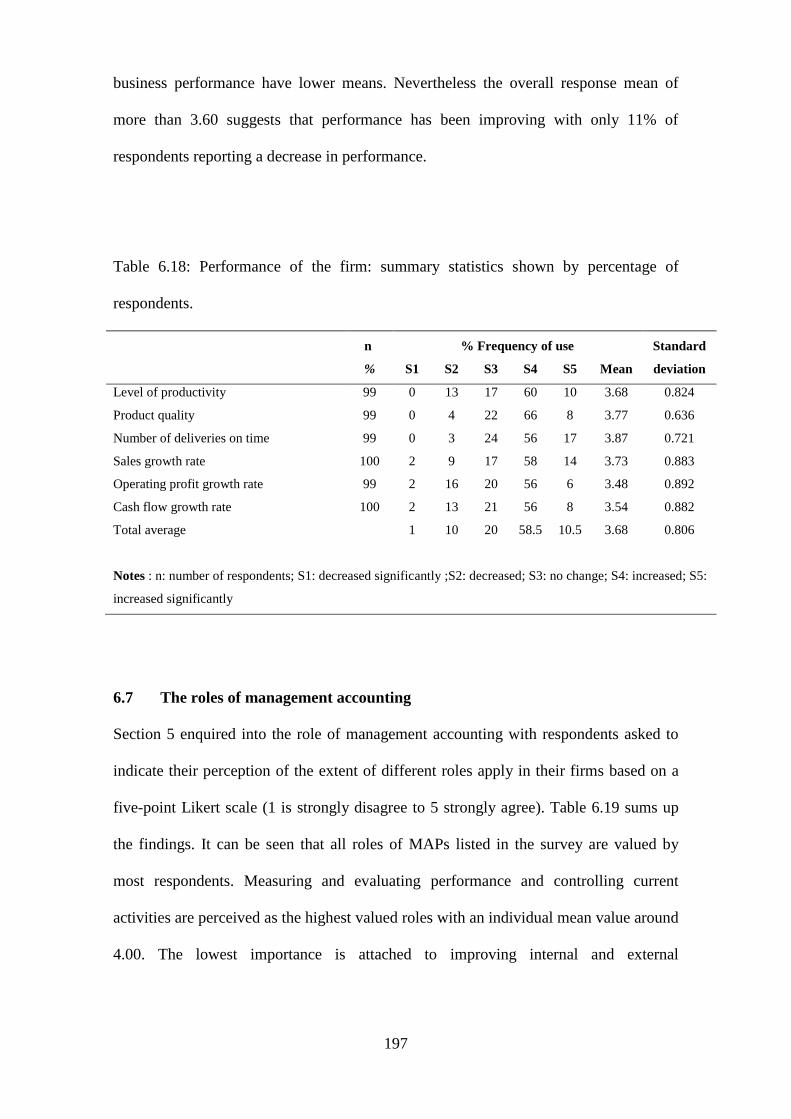
197
business performance have lower means. Nevertheless the overall response mean of
more than 3.60 suggests that performance has been improving with only 11% of
respondents reporting a decrease in performance.
Table 6.18: Performance of the firm: summary statistics shown by percentage of
respondents.
n % Frequency of use Standard
% S1 S2 S3 S4 S5 Mean deviation
Level of productivity 99 0 13 17 60 10 3.68 0.824
Product quality 99 0 4 22 66 8 3.77 0.636
Number of deliveries on time 99 0 3 24 56 17 3.87 0.721
Sales growth rate 100 2 9 17 58 14 3.73 0.883
Operating profit growth rate 99 2 16 20 56 6 3.48 0.892
Cash flow growth rate 100 2 13 21 56 8 3.54 0.882
Total average 1 10 20 58.5 10.5 3.68 0.806
Notes : n: number of respondents; S1: decreased significantly ;S2: decreased; S3: no change; S4: increased; S5:
increased significantly
6.7 The roles of management accounting
Section 5 enquired into the role of management accounting with respondents asked to
indicate their perception of the extent of different roles apply in their firms based on a
five-point Likert scale (1 is strongly disagree to 5 strongly agree). Table 6.19 sums up
the findings. It can be seen that all roles of MAPs listed in the survey are valued by
most respondents. Measuring and evaluating performance and controlling current
activities are perceived as the highest valued roles with an individual mean value around
4.00. The lowest importance is attached to improving internal and external
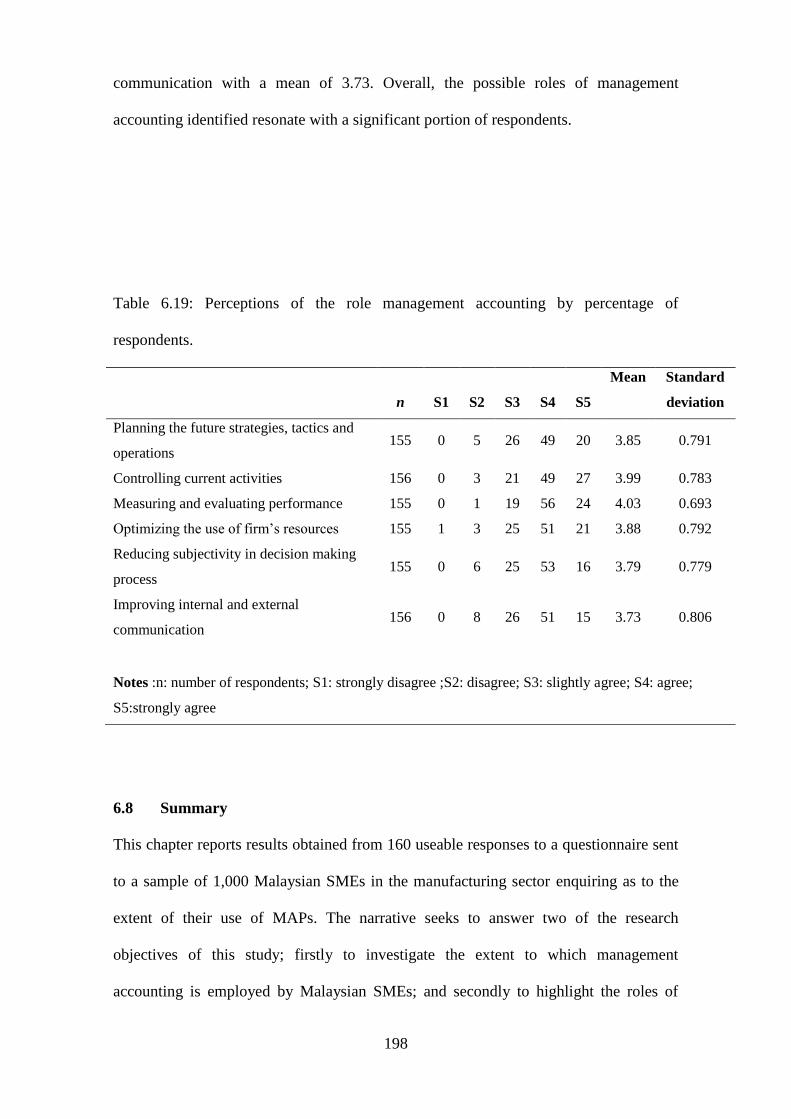
198
communication with a mean of 3.73. Overall, the possible roles of management
accounting identified resonate with a significant portion of respondents.
Table 6.19: Perceptions of the role management accounting by percentage of
respondents.
Mean
Standard
n S1 S2 S3 S4 S5 deviation
Planning the future strategies, tactics and
operations 155 0 5 26 49 20 3.85 0.791
Controlling current activities 156 0 3 21 49 27 3.99 0.783
Measuring and evaluating performance 155 0 1 19 56 24 4.03 0.693
Optimizing the use of firm‘s resources 155 1 3 25 51 21 3.88 0.792
Reducing subjectivity in decision making
process 155 0 6 25 53 16 3.79 0.779
Improving internal and external
communication 156 0 8 26 51 15 3.73 0.806
Notes :n: number of respondents; S1: strongly disagree ;S2: disagree; S3: slightly agree; S4: agree;
S5:strongly agree
6.8 Summary
This chapter reports results obtained from 160 useable responses to a questionnaire sent
to a sample of 1,000 Malaysian SMEs in the manufacturing sector enquiring as to the
extent of their use of MAPs. The narrative seeks to answer two of the research
objectives of this study; firstly to investigate the extent to which management
accounting is employed by Malaysian SMEs; and secondly to highlight the roles of
199
management accounting in the activities of SMEs. Additional information was also
obtained regarding selected contingent factors and the respondents‘ perception of the
performance level of their organisation over the past three years.
Before analysing the data obtained tests were carried out for non-response bias. The
tests using the variable related to number of employees as a measure of size showed that
the respondents are not representative of the sample largely because the response rate
for medium-sized firms is approximately twice than for small firms. However, further
tests on the sub-samples of small and medium-sized firms revealed that while medium-
sized firm respondents are representative within their sub-sample, small firm
respondents are not (see section 6.2.1.1), and thus the results for small category of firm
cannot be generalised. Due to this bias, further statistical analysis excludes the small
category of firms, thus requiring the hypotheses developed in Chapter 1 to be revised
and limited to medium sized firms. However, for descriptive purposes, the whole
sample is examined but with information that distinguishes between medium and small
company results. Nevertheless, the unrepresentativeness of the sample of small
enterprises must be borne in mind when considering the following results.
The extent of use of MAPs was investigated using a five point Likert scale; S1 (never)
to S5 (very frequently). In order to provide an additional measure of usage, and because
it is possible that responses on S2 and S3 scale (rarely and occasionally) are recording
awareness rather than real use, statistics based on S4 and S5 (frequently and very
frequently) responses were prepared. These figures will probably give a more accurate
indication of the actual use of management accounting techniques as respondents who
really employ the respective techniques will undoubtedly choose S4 and S5. The
percentage of uptake on S4 and S5 was calculated based on both a total user and a total
200
population basis. The figures derived based on whole population appear more realistic
and consistent with the results from previous studies than those based on users. This can
be seen, for example, in the percentage use of modern techniques such as ABC, decision
support system and SMA which look more likely to be representative of actuality when
the uptake at S4 or S5 is related to whole population.
The following discusses findings regarding the first two research questions.
First research question:
To what extent are MAPs used by Malaysian SMEs?
Across the sample, all five categories of MAPs surveyed (costing, budgeting
performance evaluation, decision support system and SMA) are adopted by the majority
of responding Malaysian manufacturing firms. However if small firms are considered
separately, only a minority utilised decision support systems and SMA. The results also
show that the adoption rate for traditional management accounting techniques is higher
for established practices (budgeting, performance evaluation and costing) than for more
recently developed practices (decision support system and SMA). Results for all MAPs
also indicate that a higher usage by medium sized firms as opposed to small firms. The
most significant differences relate to the use of decision support system and SMA.
The study also investigated the extent of use by Malaysian SMEs of a range of specific
management accounting techniques. Responses detailed the extent of use of 45
management accounting techniques grouped under the five broad headings for MAPs
stated earlier. The results shows that process costing is the most widely used cost
collection method, and absorption and variable costing are the most frequently applied
201
costing techniques. The high use of process costing is consistent with the sectors that
respondents were in. The majority of the respondents also indicated high use of full
financial budgeting and annual budgeting. The results also showed that there was
consistent use of flexible budgeting among the respondents. In evaluating firm
performance, most of the respondents indicated a high use of financial performance
measures as opposed to non-financial measures. The most used among non-financial
measures related to internal processes and customers, while those connected to
employees are the least used. Techniques, listed under decision support system and
SMA have a limited and lower frequency of use. Under the decision support system, the
results show that product profitability analysis is used the most. SMA uptake was the
lowest among all five areas of MAPs. Small and medium sized firms have similar
uptakes on costing and performance evaluation systems. However medium sized firms
had a higher uptake than small firms in the use of full financial budgeting, decision
support systems and SMA.
The findings generate some new results on the use of MAPs by Malaysian SMEs. They
suggest that in general, Malaysian SMEs and especially medium sized enterprises have
adopted basic techniques of management accounting quite widely, for example, costing
systems, full budgeting systems and financial performance measures. This prioritisation
of basic techniques of accounting and management accounting is perhaps expected in a
smaller business context. Furthermore since the respondents are based in a developing
country, the employment of new management accounting skills, such as ABC, SMA
and other modern techniques, might be expected to be lower than in developed
countries. This view is in line with Chun et al. (1994) who claimed that Malaysian firms
prefer to employ traditional management accounting systems to meet their needs for
external and internal reporting purposes. Other research in developing countries such as
202
that of Joshi (2001) in India; El-Ebaishi et al. (2003) in Saudi Arabia; and
Phadoongsitthi (2003) in Thailand also support this position. Joshi (2001) argued that
the reasons for a low adoption of newly developed MAPs in Indian firms are the
conservative attitude of Indian management, autocratic leadership, and long term
orientation. They also suggest that many Indian companies believe that it is quite
expensive to adopt the new management accounting techniques particularly, for
benchmarking. Lack of training and expertise in these areas are other possible reasons.
Phadoongsitthi (2003) in Thailand this perspective stating that the reasons for similar
low adoption of newly developed MAPs in Thailand and India is because both countries
have cultural similarities - large power distance and low individualism group and both
countries face similar problems - the lack of training and expertise. Research in
developed countries (see for example, Chenhall and Langfield-Smith, 1998; Pierce and
O‘Dea, 1998; and Abdel-Kader and Luther, 2006), although reporting an increasing
usage of modern MAPs, agreed that basic or traditional MAPs are still dominant in most
firms. It is argued that high acceptance of traditional techniques may be attributed to the
fact that information and expertise relating to these measures is the most readily
available as opposed to that relating to modern management accounting techniques.
Consequently sophisticated systems are not widely adopted in practice possibly due to
the uncertainties, practicalities and costs involved in obtaining the information.
The results also indicate some striking differences between the adoption level for newer
techniques between small and medium sized firms. They suggest that the frequency of
use of certain MAPs, especially sophisticated MAPs is significantly lower in small sized
firms than in medium sized firms. The increased uptake of sophisticated MAPs by
larger firms is in line with previous study results suggestion that size is a contingent
variable associated with the use of such techniques (see for example Holmes and

203
Nicholls, 1999; Hoque and James, 2000; Lamminmaki and Drury, 2001; Collis and
Jarvis, 2002; Al-Omiri and Drury, 2007; Ismail and King 2007; Cadez and Guilding,
2008; and Abdel-Kader and Luther, 2008) even though the population from which the
target sample is drawn is perhaps different on the basis of the survey results in terms of
country size and the developing country context.
It is concluded that within Malaysian small and medium sized firms, there is extensive
use of basic MAPs. Medium sized enterprises make greater use of MAPs as compared
to small enterprises - thus supporting the contingency theory of the impact of size on the
use of MAPs. This difference in uptake is greater for modern MAPs, which are
employed reasonably extensively by medium sized firms but markedly less so by small
sized firms. Overall, the uptake among the respondents shows that management
accounting is well embedded in responding Malaysian SMEs - as might be anticipated
given the high level of employment of well qualified accounting staff.
Second research question:
What are the roles of management accounting in SMEs’ management?
The results suggest that respondents believe that MAPs have an important role in
helping the SMEs to plan, control, evaluate performance, optimize the use of resources,
assist in decision making, and improve communication. Out of six roles, performance
evaluation and controlling activities were perceived by respondents to be the key roles
but most of the Malaysian SMEs in the manufacturing sector also perceived MAPs as
useful in their management processes especially in providing the most appropriate
information in their manufacturing environment.

204
The perceived roles of MAPs to evaluate performance are consistent with the
descriptive findings reported in section 6.4.2.3, i.e. that respondent firms made
extensive use of performance evaluation systems especially in terms of the use of
financial performance measures. Based on these results, it is also likely that the
evaluation is gradually widened to the other areas particularly internal processes and
customer-based measures. Therefore these will provide greater information for
performance evaluation in the firms.
The high perceived role for MAPs in controlling activities is again consistent with the
extensive use of budgeting by respondent firms as has been reported in section 6.4.2.2,
and as an adjunct to budget preparation and the use of costing systems. This suggests
that Malaysian small and medium sized firms use traditional MAPs particularly
financial-based measures to control the activities of manufacturing operations. The
extensive use of budgeting systems should also indicate MAPs help the firm not only in
controlling but also for planning. This is supported by the responses which show that
the perceived role for MAPs as planning the future strategies, tactics and operations is
high.
Overall it can be concluded that the results suggest that MAPs play a significant role in
SMEs, and possibly suggests difference from past assertions from some commentators
about a lack of relevance of management accounting to managerial needs especially in
modern manufacturing (see, for example, Cooper, 1990 and Johnson and Kaplan, 1987).
205
Chapter 7
Bivariate analysis
7.1 Introduction
The chapter seeks to identify, for a sample of Malaysian medium sized firms
statistically significant associations between selected contingent variables and the use of
various MAPs, and statistically significant associations between the use of MAPs and
perceptions of the performance of the firm. The restriction of the sample for testing
from all respondents to medium enterprises arises from the result of a non-response bias
test, which demonstrated concern about the representativeness of the small firm section
of the original sample (see Chapter 6, section 6.2.1). Therefore the first and second
hypotheses have been revised to include only medium sized firms. The hypotheses are
now as follows:
H1: There are significant and positive relationships for medium sized firms between
selected contingent factors and the use of MAPs.
H2: There is a significant and positive relationship for medium sized firms between
the use of MAPs and perceptions of organizational performance.
The first hypothesis has 25 sub-hypotheses representing 25 relationships between five
independent contingent variables and five dependent variables relating to the use of
MAPs. Similarly, in the second hypothesis, 35 sub-hypotheses are developed
representing 35 relationships between five independent variables (use of MAPs) and
seven indicators of how performance is perceived (including one composite index of
performance). These sub-hypotheses will be specified in the next two sections.
206
7.2 Bivariate association analysis
In this chapter, the hypothesis testing will be underpinned by bivariate association
analysis (correlation). Correlation is an associative technique that determines if there is
a consistent and systematic relationship between two or more variables (Hair et al.,
2007). The existence of a correlation or association is a necessary precondition toward
demonstration of the existence of a relationship between variables (Kent, 2001).
Bivariate analysis provides a single figure for the strength of the relationship between
variables. The value of correlation is measured within a range of -1 to +1. A value of +1
represents a perfect positive correlation. This means that the two variables are precisely
related so that as values of one variable increases, values of the other variable will also
increase by the same degree. In contrast, a value of -1 represents a perfect negative
correlation which means that as the value of one variable increases those of the other
decreases to a similar degree. A value of 0 means there is no relationship between the
variables and they are perfectly independent (Saunders et. al, 2009). As regards
intermediate values, Miles and Shevlin (2005), reference Cohen (1988) who defined a
small correlation as having an absolute value of approximately 0.1, a medium
correlation starting at 0.3 and a large correlation as 0.5 or greater. The following two
sections provide the separate analyses for hypotheses one and two.
7.3 Tests for an association between the use of management accounting
practices and selected contingent factors
In this section, the tests for an association analysis seek to answer the third research
objective of this study; to determine the factors that affect the use of management
accounting among medium sized firms. The objective is translated into a general
hypothesis which is ‗there are significant and positive relationships for medium sized
firms between selected contingent factors and the use of MAPs.
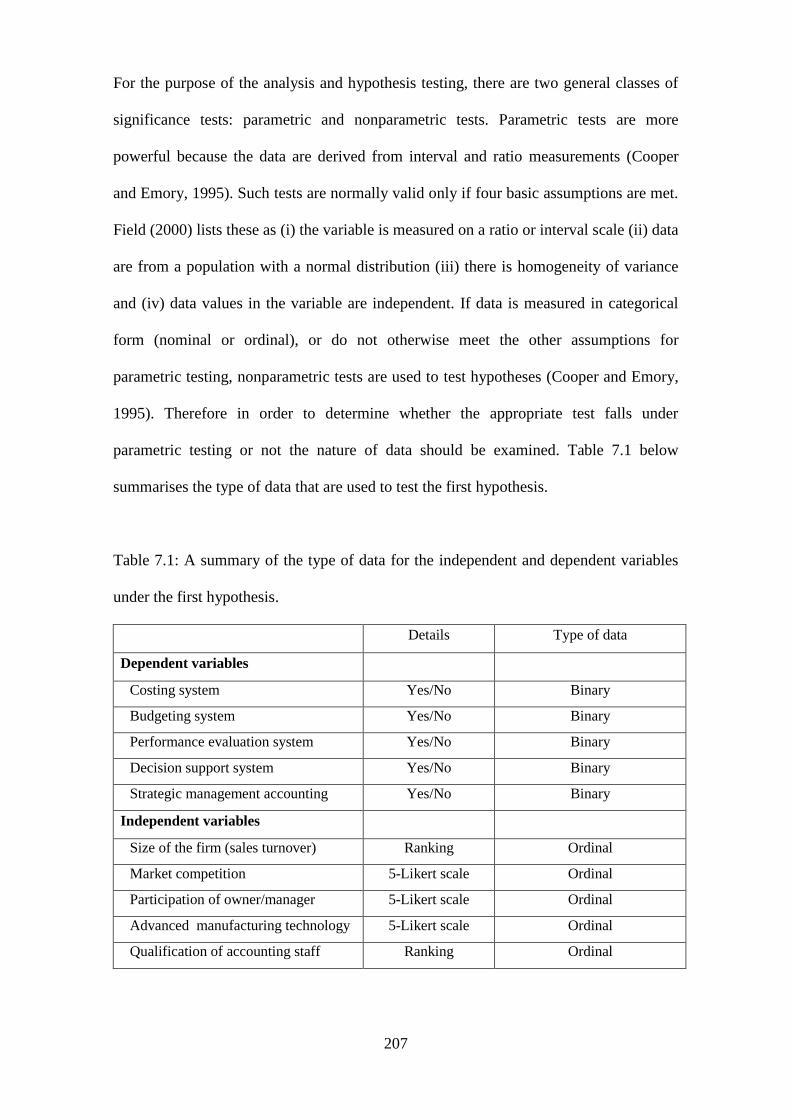
207
For the purpose of the analysis and hypothesis testing, there are two general classes of
significance tests: parametric and nonparametric tests. Parametric tests are more
powerful because the data are derived from interval and ratio measurements (Cooper
and Emory, 1995). Such tests are normally valid only if four basic assumptions are met.
Field (2000) lists these as (i) the variable is measured on a ratio or interval scale (ii) data
are from a population with a normal distribution (iii) there is homogeneity of variance
and (iv) data values in the variable are independent. If data is measured in categorical
form (nominal or ordinal), or do not otherwise meet the other assumptions for
parametric testing, nonparametric tests are used to test hypotheses (Cooper and Emory,
1995). Therefore in order to determine whether the appropriate test falls under
parametric testing or not the nature of data should be examined. Table 7.1 below
summarises the type of data that are used to test the first hypothesis.
Table 7.1: A summary of the type of data for the independent and dependent variables
under the first hypothesis.
Details Type of data
Dependent variables
Costing system Yes/No Binary
Budgeting system Yes/No Binary
Performance evaluation system Yes/No Binary
Decision support system Yes/No Binary
Strategic management accounting Yes/No Binary
Independent variables
Size of the firm (sales turnover) Ranking Ordinal
Market competition 5-Likert scale Ordinal
Participation of owner/manager 5-Likert scale Ordinal
Advanced manufacturing technology 5-Likert scale Ordinal
Qualification of accounting staff Ranking Ordinal

208
Table 7.1 shows that all the dependent variables relating to the use of MAPs comprise
binary (dichotomous) data where Yes=1 and No=0; while the independent variables
relating to contingent factors are ordinal data. Given the mix of binary and ordinal data,
one of four basic assumptions for parametric testing is not met as data must be on a ratio
or interval scale. Non-parametric tests will therefore be employed. The two most widely
used non-parametric correlation analysis tests in business and management research are
Spearman‘s rank correlation coefficient (Spearman‘s Rho) and Kendall‘s rank
correlation coefficient (Kendall‘s tau). The tests can be used in a wide variety of
contexts since they make few assumptions relating to the distribution of the variables
and the nature of the relationship between variables (Bryman and Cramer, 2001).With
regards to which of these non-parametric correlation measures should be reported,
Bryman and Cramer (2001) argue that Spearman's rho is more commonly used. On the
other hand, tau deals with tied ranks (i. e. two or more respondents are at the same rank)
better than rho. In almost all situations the values of Spearman's rank correlation and
Kendall's tau are very close and would invariably lead to the same conclusions
(Crichton, 2001). Drawing on this discussion, since there is existence of tied ranks in
data of this study, Kendall‘s tau is chosen to be the statistical method for hypothesis
testing. Besides that this method has been commonly used in previous studies (see for
example Scapens and Sale, 1985; Fry et al., 1998; Abdel-Maksoud et al., 2005; and
Hutaibat, 2005). In term of the value of a measure of association, Botsch (2011)
provides a guideline specifically for Kendall‘s tau is as follows:
Less than + or – 0.10 : very small/weak
+ or – 0.10 to 0.19 : small/weak
+ or -0.20 to 0.29 : moderate
+ or -0.40 or larger : strong
Given that within business research it is extremely unusual to obtain perfect correlation
(Saunders et. al., 2009), this guidance will be used in this study to describe the strength
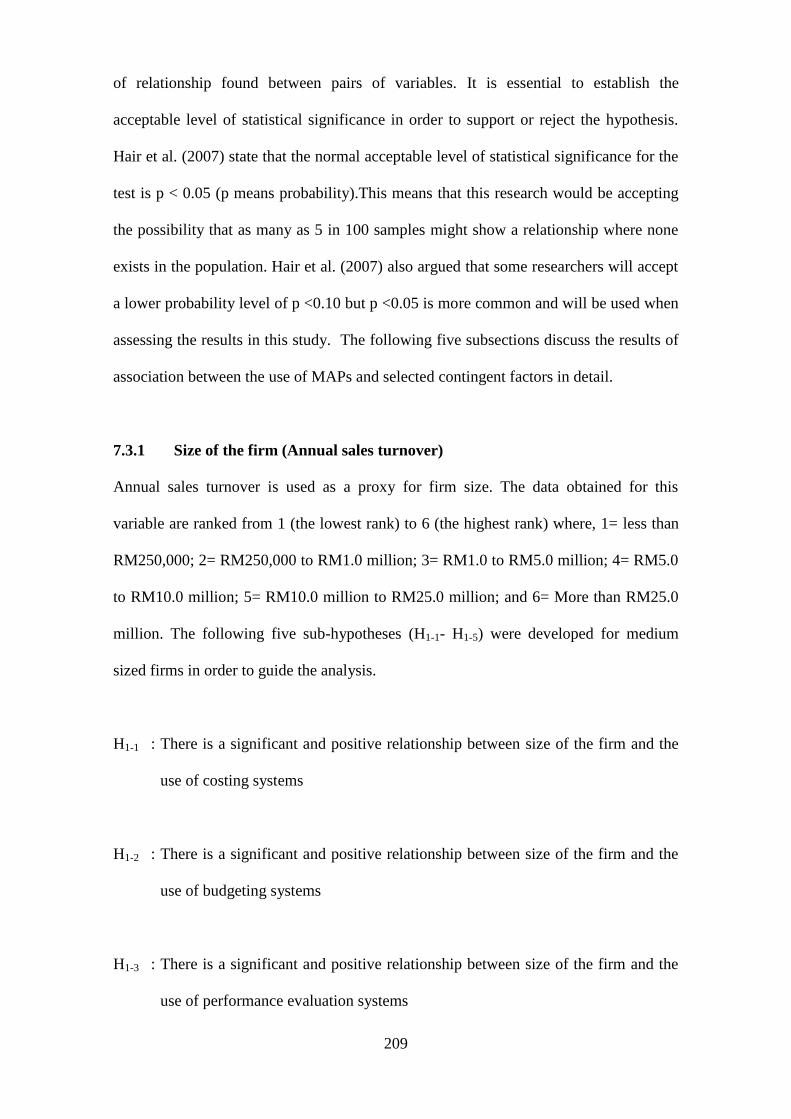
209
of relationship found between pairs of variables. It is essential to establish the
acceptable level of statistical significance in order to support or reject the hypothesis.
Hair et al. (2007) state that the normal acceptable level of statistical significance for the
test is p < 0.05 (p means probability).This means that this research would be accepting
the possibility that as many as 5 in 100 samples might show a relationship where none
exists in the population. Hair et al. (2007) also argued that some researchers will accept
a lower probability level of p <0.10 but p <0.05 is more common and will be used when
assessing the results in this study. The following five subsections discuss the results of
association between the use of MAPs and selected contingent factors in detail.
7.3.1 Size of the firm (Annual sales turnover)
Annual sales turnover is used as a proxy for firm size. The data obtained for this
variable are ranked from 1 (the lowest rank) to 6 (the highest rank) where, 1= less than
RM250,000; 2= RM250,000 to RM1.0 million; 3= RM1.0 to RM5.0 million; 4= RM5.0
to RM10.0 million; 5= RM10.0 million to RM25.0 million; and 6= More than RM25.0
million. The following five sub-hypotheses (H1-1- H1-5) were developed for medium
sized firms in order to guide the analysis.
H1-1 : There is a significant and positive relationship between size of the firm and the
use of costing systems
H1-2 : There is a significant and positive relationship between size of the firm and the
use of budgeting systems
H1-3 : There is a significant and positive relationship between size of the firm and the
use of performance evaluation systems
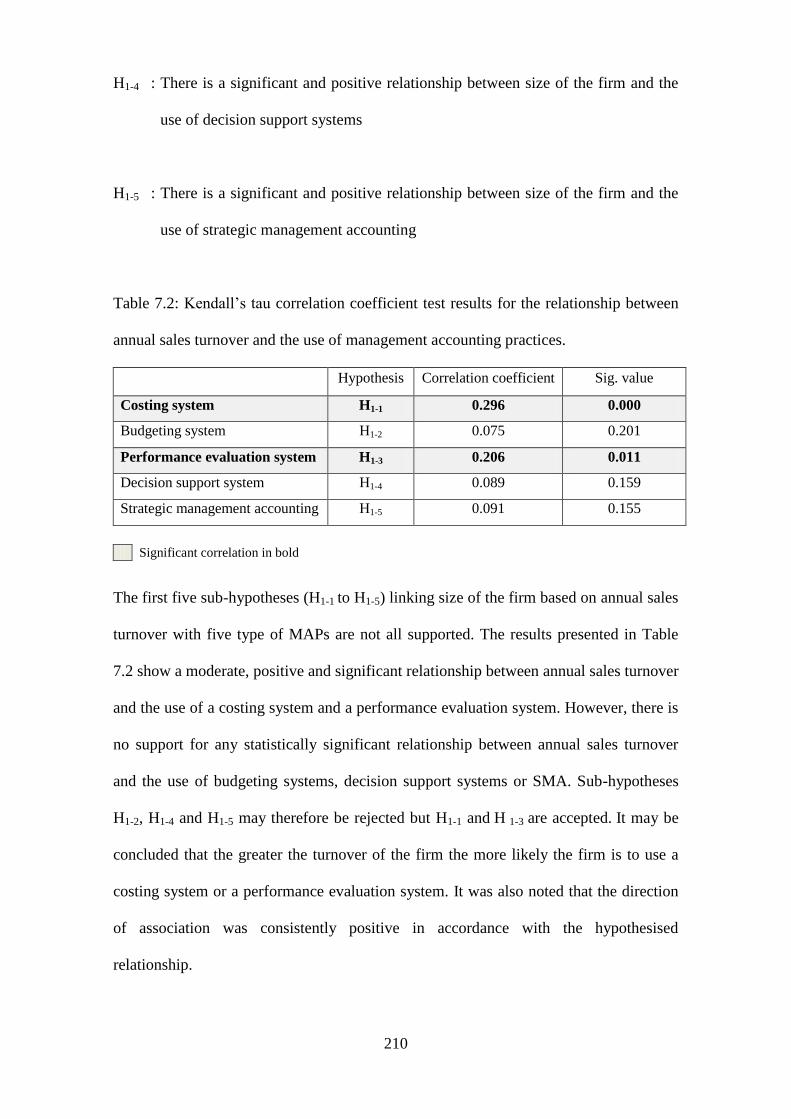
210
H1-4 : There is a significant and positive relationship between size of the firm and the
use of decision support systems
H1-5 : There is a significant and positive relationship between size of the firm and the
use of strategic management accounting
Table 7.2: Kendall‘s tau correlation coefficient test results for the relationship between
annual sales turnover and the use of management accounting practices.
Hypothesis Correlation coefficient Sig. value
Costing system H1-1 0.296 0.000
Budgeting system H1-2 0.075 0.201
Performance evaluation system H1-3 0.206 0.011
Decision support system H1-4 0.089 0.159
Strategic management accounting H1-5 0.091 0.155
Significant correlation in bold
The first five sub-hypotheses (H1-1 to H1-5) linking size of the firm based on annual sales
turnover with five type of MAPs are not all supported. The results presented in Table
7.2 show a moderate, positive and significant relationship between annual sales turnover
and the use of a costing system and a performance evaluation system. However, there is
no support for any statistically significant relationship between annual sales turnover
and the use of budgeting systems, decision support systems or SMA. Sub-hypotheses
H1-2, H1-4 and H1-5 may therefore be rejected but H1-1 and H 1-3 are accepted. It may be
concluded that the greater the turnover of the firm the more likely the firm is to use a
costing system or a performance evaluation system. It was also noted that the direction
of association was consistently positive in accordance with the hypothesised
relationship.
211
7.3.2 Intensity of market competition
Respondent‘s perceptions of market competition were measured by using a five-point
Likert scale ranging from 1; ‗not intense at all‘ to 5; ‗very intense‘. The following five
sub-hypotheses (H1-6 to H1-10) were developed for medium sized firms in order to guide
the analysis.
H1-6 : There is a significant and positive relationship between intensity of market
competition and the use of costing systems
H1-7 : There is a significant and positive relationship between intensity of market
competition and the use of budgeting systems
H1-8 : There is a significant and positive relationship between intensity of market
competition and the use of performance evaluation systems
H1-9 : There is a significant and positive relationship between intensity of market
competition and the use of decision support systems
H1-10 : There is a significant and positive relationship between intensity of market
competition and the use of strategic management accounting
Table 7.3: Kendall‘s tau correlation coefficient test results for the relationship between
intensity of market competition and the use of MAPs.
Hypothesis Correlation coefficient Sig. value
Costing system H1-6 0.186 0.023
Budgeting system H1-7 0.180 0.027
Performance evaluation system H1-8 0.180 0.027
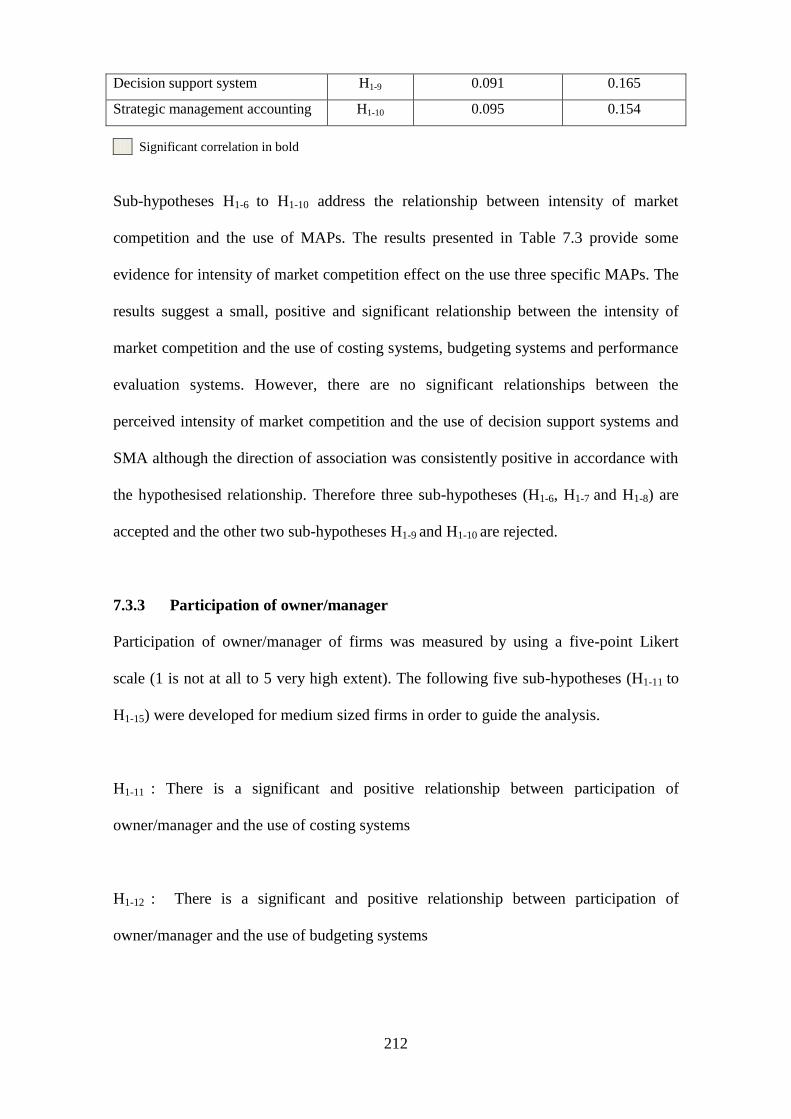
212
Decision support system H1-9 0.091 0.165
Strategic management accounting H1-10 0.095 0.154
Significant correlation in bold
Sub-hypotheses H1-6 to H1-10 address the relationship between intensity of market
competition and the use of MAPs. The results presented in Table 7.3 provide some
evidence for intensity of market competition effect on the use three specific MAPs. The
results suggest a small, positive and significant relationship between the intensity of
market competition and the use of costing systems, budgeting systems and performance
evaluation systems. However, there are no significant relationships between the
perceived intensity of market competition and the use of decision support systems and
SMA although the direction of association was consistently positive in accordance with
the hypothesised relationship. Therefore three sub-hypotheses (H1-6, H1-7 and H1-8) are
accepted and the other two sub-hypotheses H1-9 and H1-10 are rejected.
7.3.3 Participation of owner/manager
Participation of owner/manager of firms was measured by using a five-point Likert
scale (1 is not at all to 5 very high extent). The following five sub-hypotheses (H1-11 to
H1-15) were developed for medium sized firms in order to guide the analysis.
H1-11 : There is a significant and positive relationship between participation of
owner/manager and the use of costing systems
H1-12 : There is a significant and positive relationship between participation of
owner/manager and the use of budgeting systems
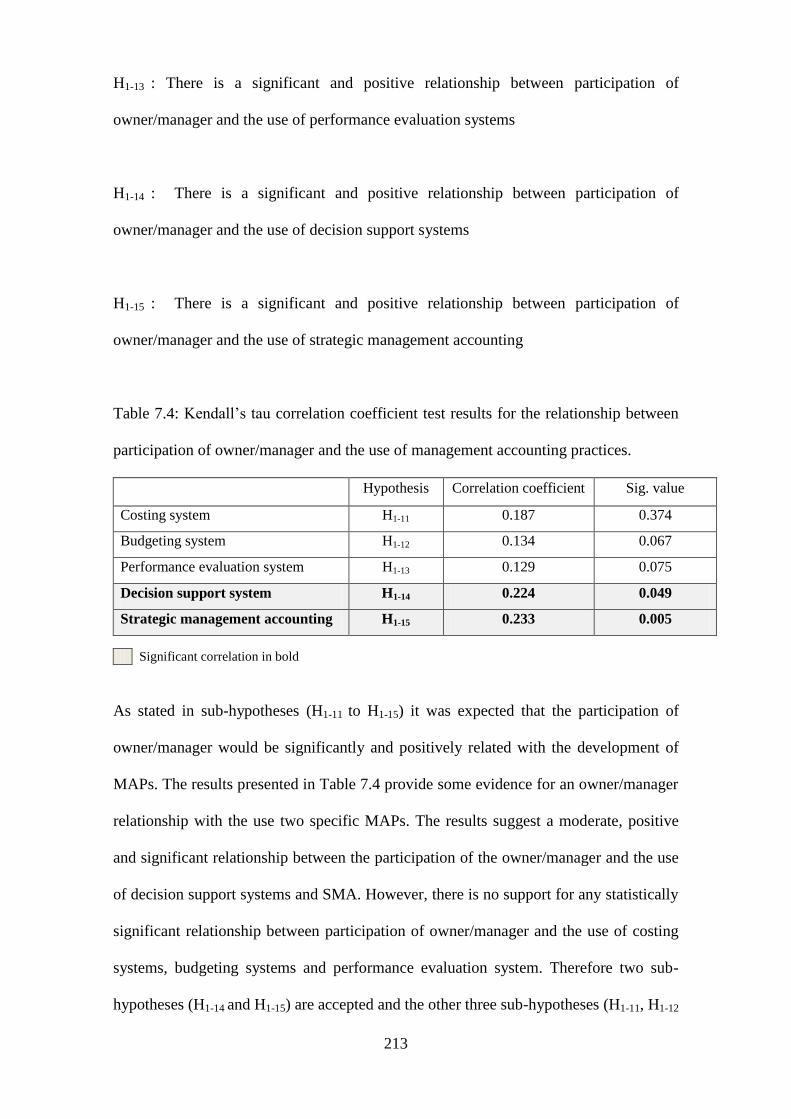
213
H1-13 : There is a significant and positive relationship between participation of
owner/manager and the use of performance evaluation systems
H1-14 : There is a significant and positive relationship between participation of
owner/manager and the use of decision support systems
H1-15 : There is a significant and positive relationship between participation of
owner/manager and the use of strategic management accounting
Table 7.4: Kendall‘s tau correlation coefficient test results for the relationship between
participation of owner/manager and the use of management accounting practices.
Hypothesis Correlation coefficient Sig. value
Costing system H1-11 0.187 0.374
Budgeting system H1-12 0.134 0.067
Performance evaluation system H1-13 0.129 0.075
Decision support system H1-14 0.224 0.049
Strategic management accounting H1-15 0.233 0.005
Significant correlation in bold
As stated in sub-hypotheses (H1-11 to H1-15) it was expected that the participation of
owner/manager would be significantly and positively related with the development of
MAPs. The results presented in Table 7.4 provide some evidence for an owner/manager
relationship with the use two specific MAPs. The results suggest a moderate, positive
and significant relationship between the participation of the owner/manager and the use
of decision support systems and SMA. However, there is no support for any statistically
significant relationship between participation of owner/manager and the use of costing
systems, budgeting systems and performance evaluation system. Therefore two sub-
hypotheses (H1-14 and H1-15) are accepted and the other three sub-hypotheses (H1-11, H1-12
214
and H1-13) are rejected. It was also noted that the direction of association was
consistently positive in line with the hypotheses.
7.3.4 Advanced manufacturing technology (AMT)
The use of AMT was based on the use of three broad classes of technological devices (i)
flexible manufacturing system (FMS); (ii) computer numerical control machines (CNC)
and (iii) ‗others‘. Respondents were asked to evaluate the level of use of these devices
by using a five-point Likert scale from 1; ‗not used‘ to 5; ‗widely used‘. The responses
were aggregated using the composite score for testing the hypotheses. The composite
score was calculated using the above three individual items scores where they were
summated together and aggregated. The use of a composite score to measure the
variable has some advantages. According to Foster and Swenson (1997) a composite
score has the advantage over an individual question in the circumstances when either (1)
the concept being measured is multidimensional and when the questions in that
composite capture those multi-dimensions, or (2) there is measurement error in an
individual question that is diversified away in aggregating individual questions into a
composite. Meanwhile Judd et al. (1991) claimed that creating a single score to
summarize several observed variables in a meaningful way can simplify the analysis
and can improve reliability and validity of measurement. In addition to the use of a
composite score as the main measure for hypothesis testing, individual analyses of each
measure of AMT with MAPs were also conducted to provide additional information.
The following five sub-hypotheses (H1-16 to H1-20) were developed for medium sized
firms in order to guide the analysis.
H1-16 : There is a significant and positive relationship between use of advanced
manufacturing technology and the use of costing systems
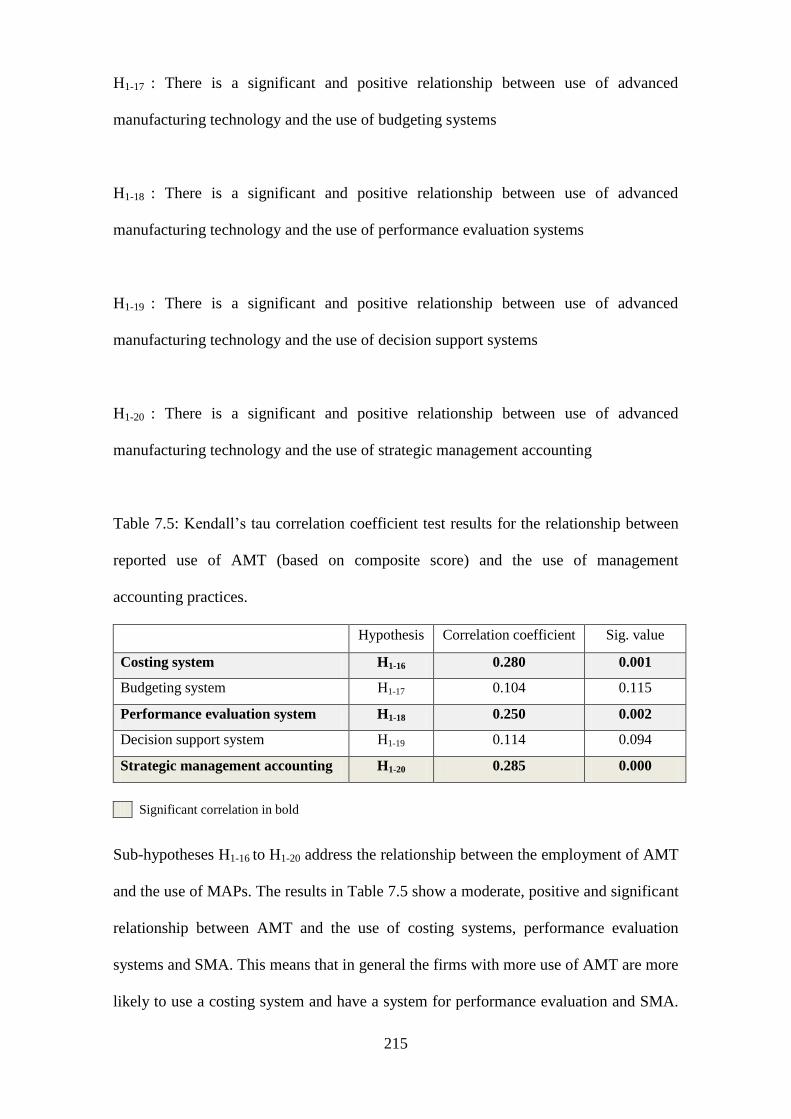
215
H1-17 : There is a significant and positive relationship between use of advanced
manufacturing technology and the use of budgeting systems
H1-18 : There is a significant and positive relationship between use of advanced
manufacturing technology and the use of performance evaluation systems
H1-19 : There is a significant and positive relationship between use of advanced
manufacturing technology and the use of decision support systems
H1-20 : There is a significant and positive relationship between use of advanced
manufacturing technology and the use of strategic management accounting
Table 7.5: Kendall‘s tau correlation coefficient test results for the relationship between
reported use of AMT (based on composite score) and the use of management
accounting practices.
Hypothesis Correlation coefficient Sig. value
Costing system H1-16 0.280 0.001
Budgeting system H1-17 0.104 0.115
Performance evaluation system H1-18 0.250 0.002
Decision support system H1-19 0.114 0.094
Strategic management accounting H1-20 0.285 0.000
Significant correlation in bold
Sub-hypotheses H1-16 to H1-20 address the relationship between the employment of AMT
and the use of MAPs. The results in Table 7.5 show a moderate, positive and significant
relationship between AMT and the use of costing systems, performance evaluation
systems and SMA. This means that in general the firms with more use of AMT are more
likely to use a costing system and have a system for performance evaluation and SMA.
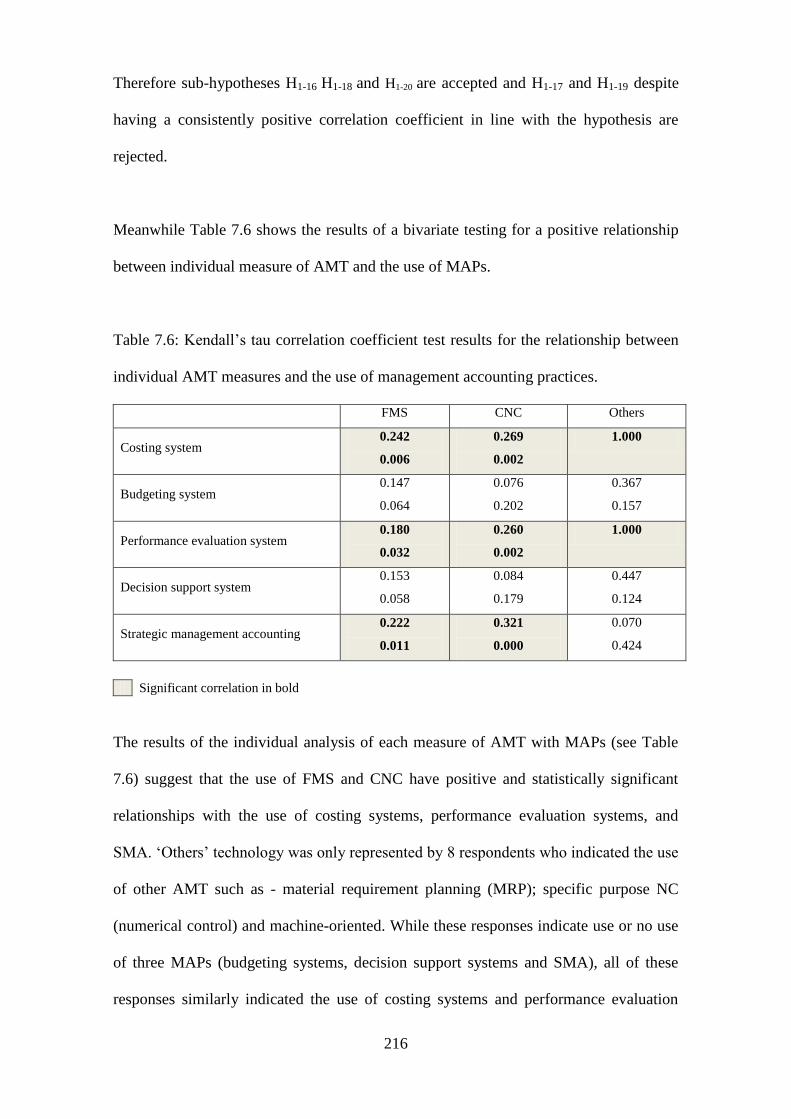
216
Therefore sub-hypotheses H1-16 H1-18 and H1-20 are accepted and H1-17 and H1-19 despite
having a consistently positive correlation coefficient in line with the hypothesis are
rejected.
Meanwhile Table 7.6 shows the results of a bivariate testing for a positive relationship
between individual measure of AMT and the use of MAPs.
Table 7.6: Kendall‘s tau correlation coefficient test results for the relationship between
individual AMT measures and the use of management accounting practices.
FMS CNC Others
Costing system 0.242
0.006
0.269
0.002
1.000
Budgeting system 0.147
0.064
0.076
0.202
0.367
0.157
Performance evaluation system 0.180
0.032
0.260
0.002
1.000
Decision support system 0.153
0.058
0.084
0.179
0.447
0.124
Strategic management accounting 0.222
0.011
0.321
0.000
0.070
0.424
Significant correlation in bold
The results of the individual analysis of each measure of AMT with MAPs (see Table
7.6) suggest that the use of FMS and CNC have positive and statistically significant
relationships with the use of costing systems, performance evaluation systems, and
SMA. ‗Others‘ technology was only represented by 8 respondents who indicated the use
of other AMT such as - material requirement planning (MRP); specific purpose NC
(numerical control) and machine-oriented. While these responses indicate use or no use
of three MAPs (budgeting systems, decision support systems and SMA), all of these
responses similarly indicated the use of costing systems and performance evaluation
217
systems in the firms. Therefore it can be suggested the use of ‗others‘ technology have
positive association with the use of costing systems and performance evaluation
systems. Meanwhile the rest of results under ‗others‘ AMT show that there is no
significant association with the use of budgeting systems, decision support systems and
SMA. Based on the analysis, overall the results suggested that the greater uses of all
individual devices are significantly associated with the use of costing systems and
performance evaluation systems. Additionally the higher use of FMS and CNC also
leads to the greater use of SMA. These results have driven the composite results (Table
7.5) to reflect significant association with these three MAPs.
7.3.5 The level of qualification of accounting staff
The qualification status of the firm‘s accountant was measured by reference to the type
of qualifications that the accountant possesses. The data for this variable are ranked
from 1 (the lowest rank) to 4 (the highest rank). To be specific, 1= No accountant; 2=
SPM (Sijil Pelajaran Malaysia, or Malaysian Certificate of Education (MCE)); 3= LCCI
(The London Chamber of Commerce and Industry); 4= Bachelor accounting; and 5=
ACCA/CIMA/Masters in accounting. The following five sub-hypotheses (H1-21 to H1-25)
were developed for medium sized firms in order to guide the analysis.
H1-21 : There is a significant and positive relationship between the level of qualification
of accounting staff and the use of costing systems
H1-22 : There is a significant and positive relationship between the level of qualification
of accounting staff and the use of budgeting systems

218
H1-23 : There is a significant and positive relationship between the level of qualification
of accounting staff and the use of performance evaluation systems
H1-24 : There is a significant and positive relationship between the level of qualification
of accounting staff and the use of decision support systems
H1-25 : There is a significant and positive relationship between the level of qualification
of accounting staff and the use of strategic management accounting
Table 7.7: Kendall‘s tau correlation coefficient test results for the relationship between
the level of qualification of accounting staff and the use of management accounting
practices.
Hypothesis Correlation coefficient Sig. value
Costing system H1-21 0.147 0.055
Budgeting system H1-22 -0.021 0.408
Performance evaluation system H1-23 0.112 0.111
Decision support system H1-24 0.055 0.273
Strategic management accounting H1-25 0.048 0.301
Significant correlation in bold
Sub-hypotheses H1-21 to H1-25 addresses the relationship between the level of
qualification of accounting staff and the use of five types of MAPs. The results show
that there are no significant relationships between the level of qualification of
accounting staff and the use of MAPs. Therefore sub-hypotheses H1-21 to H1-25 are
rejected.
219
7.3.6 Tests for an association between the use of management accounting
practices and industry type
In testing for a relationship between the use of accounting practices and contingent
variables, it is possible that the industry that the respondent firms are in may have an
impact on outcomes. This is premised on the belief that certain industries because of
their nature would be likely to have certain management accounting systems. The data
for this variable are based on nominal category where types of manufacturing activities
(furniture; food and beverages; non-metallic products; basic metals; rubber and plastic;
chemicals & chemical product and ‗others‘ are simplified to three main groups 1 =
High-tech industry; 2 = Light industry and 3= Heavy industry. High-tech means an
industry that makes high-value products using modern technology and usually involves
significant capital investment in R&D. While ‗light industry‘ typically is a consumer
industry that makes small products most are companies relatively in small scale. ‗Heavy
industry‘ typically is a large scale business that is capital intensive and is likely to make
large products often bought by other manufacturing companies. Given the nominal
nature of the data, a Pearson chi-square (χ2) test will be used to test the significance of
the relationships and a Cramer‘s V test will be used to establish the strength of
relationships between variables. Below are the details of Pearson chi-square test and
Cramer‘s V test. The chi-square test of association, also called Pearson's chi-square test,
is used to discover if there is a relationship between two categorical variables.
According to Smith (2003) this test is the most common test of statistical significance
for use with nominal data. This test is applied to a contingency table16
to establish with
what level of confidence it can be asserted that there is a relationship between the two
variables in the population (Bryman, 2008). While Cramer‘s V measures association
between two nominal variables (Saunders et al. 2009) Cramer‘s V is also a fairly robust
16
Contingency tables are generated so that patterns of association can be searched for (Bryman, 2008).
220
measure in that it can be applied in a wide range of circumstances and hardly produces
nonsensical results even under differing sets of conditions. It also makes no assumptions
about the shape of the population distribution of the variables from which it is computed
and requires only categorical measurement (Kent, 2001). Therefore Cramer‘s V is a
good statistic for measuring relationships between nominal and ordinal variables as
employed in this study. The following additional five sub-hypotheses (H1-26 to H1-30)
were developed for medium sized firms in order to guide the analysis.
H1-26 : There is a significant relationship between the industry type and the use of
costing systems
H1-27 : There is a significant relationship between industry type and the use of
budgeting systems
H1-28 : There is a significant relationship between industry type and the use of
performance evaluation systems
H1-29 : There is a significant relationship between industry type and the use of decision
support systems
H1-30 : There is a significant relationship between industry type and the use of strategic
management accounting
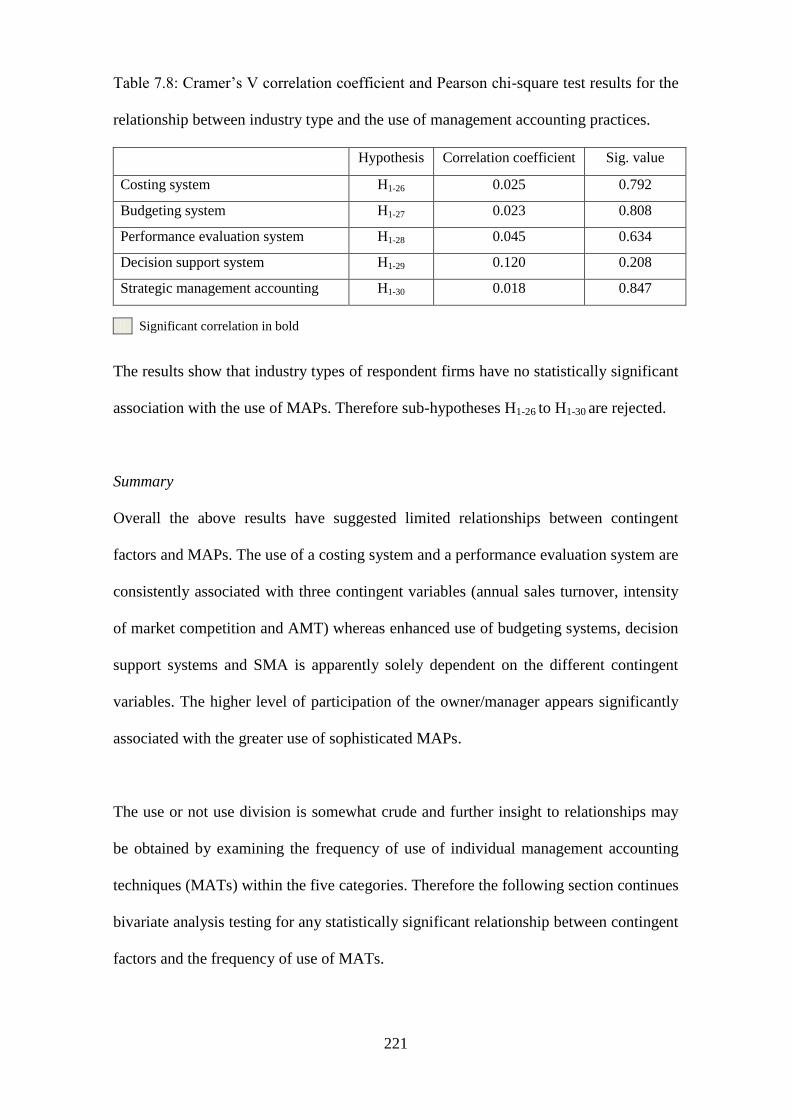
221
Table 7.8: Cramer‘s V correlation coefficient and Pearson chi-square test results for the
relationship between industry type and the use of management accounting practices.
Hypothesis Correlation coefficient Sig. value
Costing system H1-26 0.025 0.792
Budgeting system H1-27 0.023 0.808
Performance evaluation system H1-28 0.045 0.634
Decision support system H1-29 0.120 0.208
Strategic management accounting H1-30 0.018 0.847
Significant correlation in bold
The results show that industry types of respondent firms have no statistically significant
association with the use of MAPs. Therefore sub-hypotheses H1-26 to H1-30 are rejected.
Summary
Overall the above results have suggested limited relationships between contingent
factors and MAPs. The use of a costing system and a performance evaluation system are
consistently associated with three contingent variables (annual sales turnover, intensity
of market competition and AMT) whereas enhanced use of budgeting systems, decision
support systems and SMA is apparently solely dependent on the different contingent
variables. The higher level of participation of the owner/manager appears significantly
associated with the greater use of sophisticated MAPs.
The use or not use division is somewhat crude and further insight to relationships may
be obtained by examining the frequency of use of individual management accounting
techniques (MATs) within the five categories. Therefore the following section continues
bivariate analysis testing for any statistically significant relationship between contingent
factors and the frequency of use of MATs.

222
7.4 Additional analysis: Tests for an association between the selected contingent
factors and frequency of use of management accounting techniques
The previous section tests the relationships between the use of MAPs and selected
contingent factors. In these tests, MAPs are measured by using the binary scale
(Yes=1/No=0). This section extends the analysis by employing 45 specific management
accounting techniques (MATs) (measured in ordinal scale). This analysis is hoped to
give additional insight, and as to the relationship between MATs and factors that affect
the adoption of these techniques. Table 7.9 below, summarises the type of data that will
be used in testing.
Table 7.9: A summary of the type of data for the new dependent variables under the first
hypothesis.
Details Type of data
Dependent variables
Costing system (7 techniques) 5-Likert scale Ordinal
Budgeting system (11 techniques) 5-Likert scale Ordinal
Performance evaluation system (13 techniques) 5-Likert scale Ordinal
Decision support system (8 techniques) 5-Likert scale Ordinal
Strategic management accounting (6 techniques) 5-Likert scale Ordinal
Table above shows that all the dependent variables relating to the frequency of use of
MATs are measured based on a five-point Likert scale where 1= never, 2= rarely, 3=
occasionally, 4= frequently and 5= very frequently. Again non-parametric tests will be
employed since the parametric approach needs the data to be interval based or on a ratio
scale. The results of the tests are shown and discussed in the following sub sections.

223
7.4.1 Contingent variables and costing techniques
The results of Kendall‘s tau analysis between contingent variables and the frequency of
use of costing techniques are presented in Table 7.10 below.
Table 7.10: Kendall‘s tau correlation coefficient test results for a relationship between
contingent variables and the frequency of use of costing techniques.
1; Firm‘s size; 2: Market competition; 3: Participation of owner/manager; 4: AMT; 5: Qualification; 6:
Manufacturing activities
The results indicate two significant relationships between contingent variables and
costing techniques. First there are small, positive and significant relationships between
the intensity of market competition and the frequency of use of job costing and variable
costing and second there are small, positive and significant relationships between AMT
and the frequency of use of four out of seven costing techniques.
No Variables 1 2 3 4 5 6
1 Process costing 0.043
0.323
0.091
0.172
0.078
0.199
0.175*
0.024
0.096
0.155
0.005
0.481
2 Job costing -0.155
0.060
0.188*
0.033
-0.056
0.289
0.117
0.108
-0.070
0.247
0.083
0.214
3 Batch costing 0.018
0.429
0.149
0.069
0.006
0.477
0.068
0.235
-0.065
0.408
-0.114
0.122
4 Contract costing -0.153
0.063
0.153
0.068
-0.055
0.293
0.013
0.477
-0.074
0.160
0.009
0.366
5 Absorption costing 0.047
0.327
0.085
0.217
-0.001
0.496
0.276**
0.001
0.003
0.489
-0.115
0.361
6 Variable costing 0.000
0.500
0.209*
0.027
0.030
0.391
0.177*
0.041
0.123
0.133
0.163
0.229
7 ABC costing -0.047
0.325
-0.010
0.463
-0.001
0.495
0.165*
0.050
0.015
0.444
-0.127
0.433
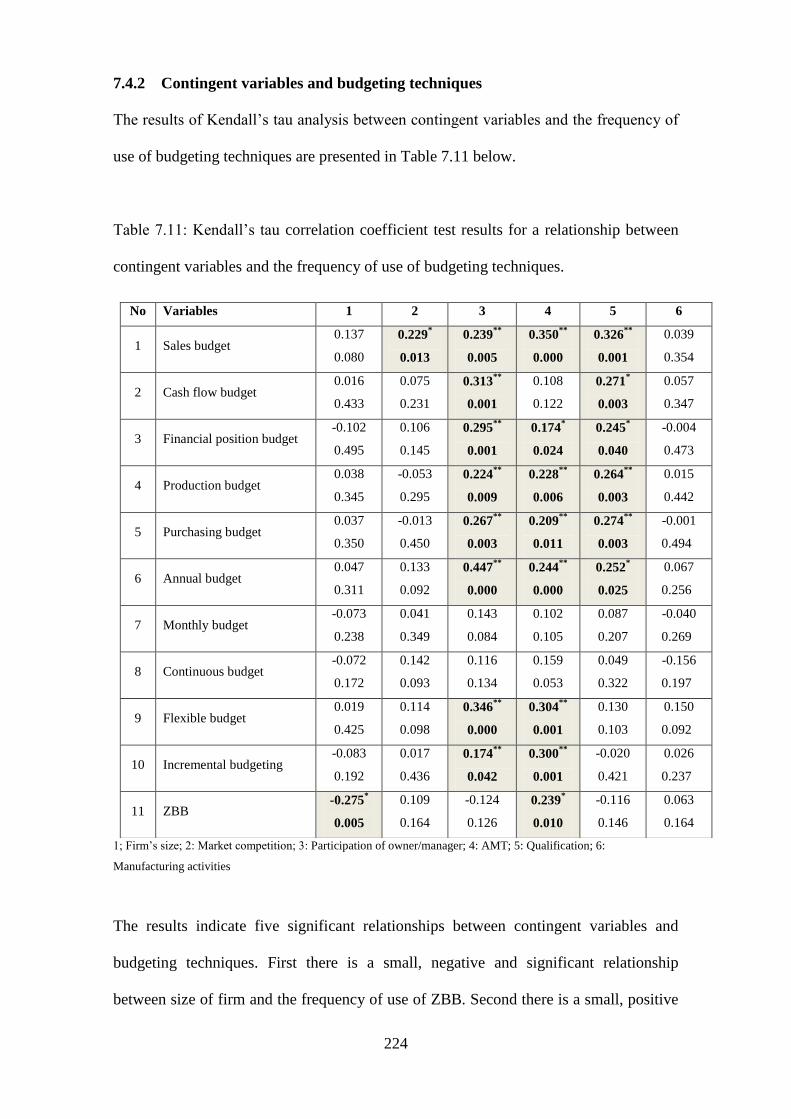
224
7.4.2 Contingent variables and budgeting techniques
The results of Kendall‘s tau analysis between contingent variables and the frequency of
use of budgeting techniques are presented in Table 7.11 below.
Table 7.11: Kendall‘s tau correlation coefficient test results for a relationship between
contingent variables and the frequency of use of budgeting techniques.
1; Firm‘s size; 2: Market competition; 3: Participation of owner/manager; 4: AMT; 5: Qualification; 6:
Manufacturing activities
The results indicate five significant relationships between contingent variables and
budgeting techniques. First there is a small, negative and significant relationship
between size of firm and the frequency of use of ZBB. Second there is a small, positive
No Variables 1 2 3 4 5 6
1 Sales budget 0.137
0.080
0.229*
0.013
0.239**
0.005
0.350**
0.000
0.326**
0.001
0.039
0.354
2 Cash flow budget 0.016
0.433
0.075
0.231
0.313**
0.001
0.108
0.122
0.271*
0.003
0.057
0.347
3 Financial position budget -0.102
0.495
0.106
0.145
0.295**
0.001
0.174*
0.024
0.245*
0.040
-0.004
0.473
4 Production budget 0.038
0.345
-0.053
0.295
0.224**
0.009
0.228**
0.006
0.264**
0.003
0.015
0.442
5 Purchasing budget 0.037
0.350
-0.013
0.450
0.267**
0.003
0.209**
0.011
0.274**
0.003
-0.001
0.494
6 Annual budget 0.047
0.311
0.133
0.092
0.447**
0.000
0.244**
0.000
0.252*
0.025
0.067
0.256
7 Monthly budget -0.073
0.238
0.041
0.349
0.143
0.084
0.102
0.105
0.087
0.207
-0.040
0.269
8 Continuous budget -0.072
0.172
0.142
0.093
0.116
0.134
0.159
0.053
0.049
0.322
-0.156
0.197
9 Flexible budget 0.019
0.425
0.114
0.098
0.346**
0.000
0.304**
0.001
0.130
0.103
0.150
0.092
10 Incremental budgeting -0.083
0.192
0.017
0.436
0.174**
0.042
0.300**
0.001
-0.020
0.421
0.026
0.237
11 ZBB -0.275
*
0.005
0.109
0.164
-0.124
0.126
0.239*
0.010
-0.116
0.146
0.063
0.164
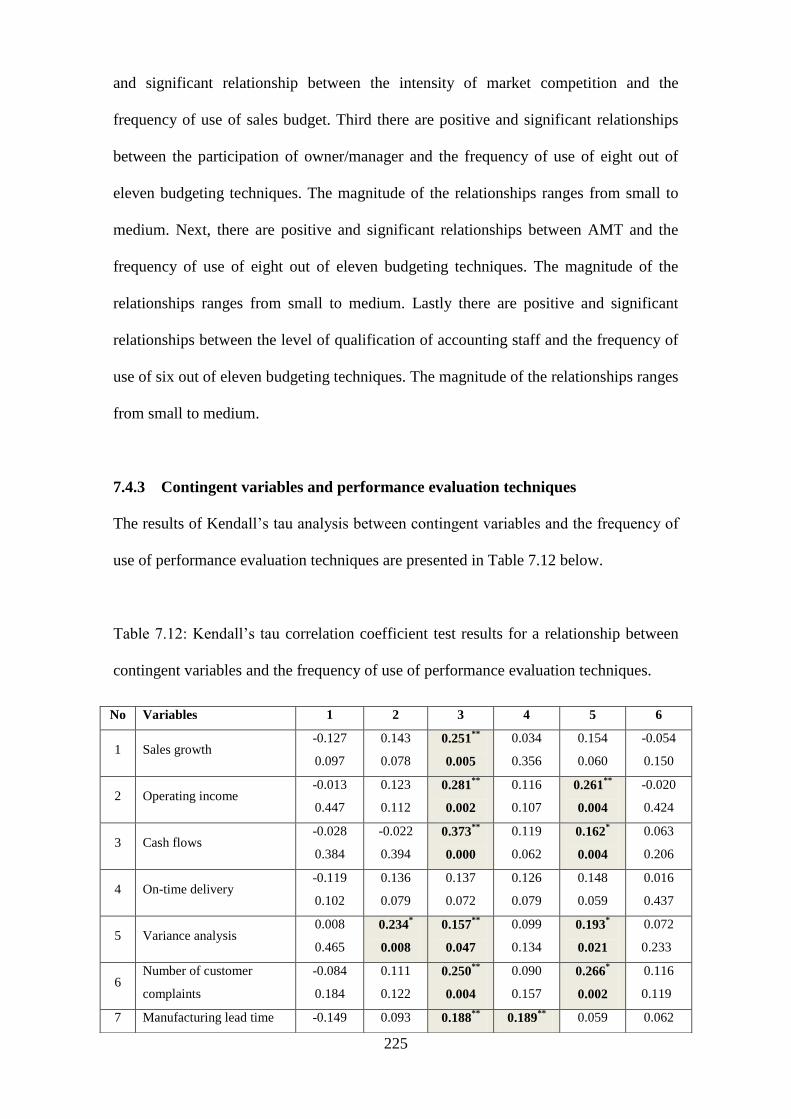
225
and significant relationship between the intensity of market competition and the
frequency of use of sales budget. Third there are positive and significant relationships
between the participation of owner/manager and the frequency of use of eight out of
eleven budgeting techniques. The magnitude of the relationships ranges from small to
medium. Next, there are positive and significant relationships between AMT and the
frequency of use of eight out of eleven budgeting techniques. The magnitude of the
relationships ranges from small to medium. Lastly there are positive and significant
relationships between the level of qualification of accounting staff and the frequency of
use of six out of eleven budgeting techniques. The magnitude of the relationships ranges
from small to medium.
7.4.3 Contingent variables and performance evaluation techniques
The results of Kendall‘s tau analysis between contingent variables and the frequency of
use of performance evaluation techniques are presented in Table 7.12 below.
Table 7.12: Kendall‘s tau correlation coefficient test results for a relationship between
contingent variables and the frequency of use of performance evaluation techniques.
No Variables 1 2 3 4 5 6
1 Sales growth -0.127
0.097
0.143
0.078
0.251**
0.005
0.034
0.356
0.154
0.060
-0.054
0.150
2 Operating income -0.013
0.447
0.123
0.112
0.281**
0.002
0.116
0.107
0.261**
0.004
-0.020
0.424
3 Cash flows -0.028
0.384
-0.022
0.394
0.373**
0.000
0.119
0.062
0.162*
0.004
0.063
0.206
4 On-time delivery -0.119
0.102
0.136
0.079
0.137
0.072
0.126
0.079
0.148
0.059
0.016
0.437
5 Variance analysis 0.008
0.465
0.234*
0.008
0.157**
0.047
0.099
0.134
0.193*
0.021
0.072
0.233
6 Number of customer
complaints
-0.084
0.184
0.111
0.122
0.250**
0.004
0.090
0.157
0.266*
0.002
0.116
0.119
7 Manufacturing lead time -0.149 0.093 0.188**
0.189** 0.059 0.062
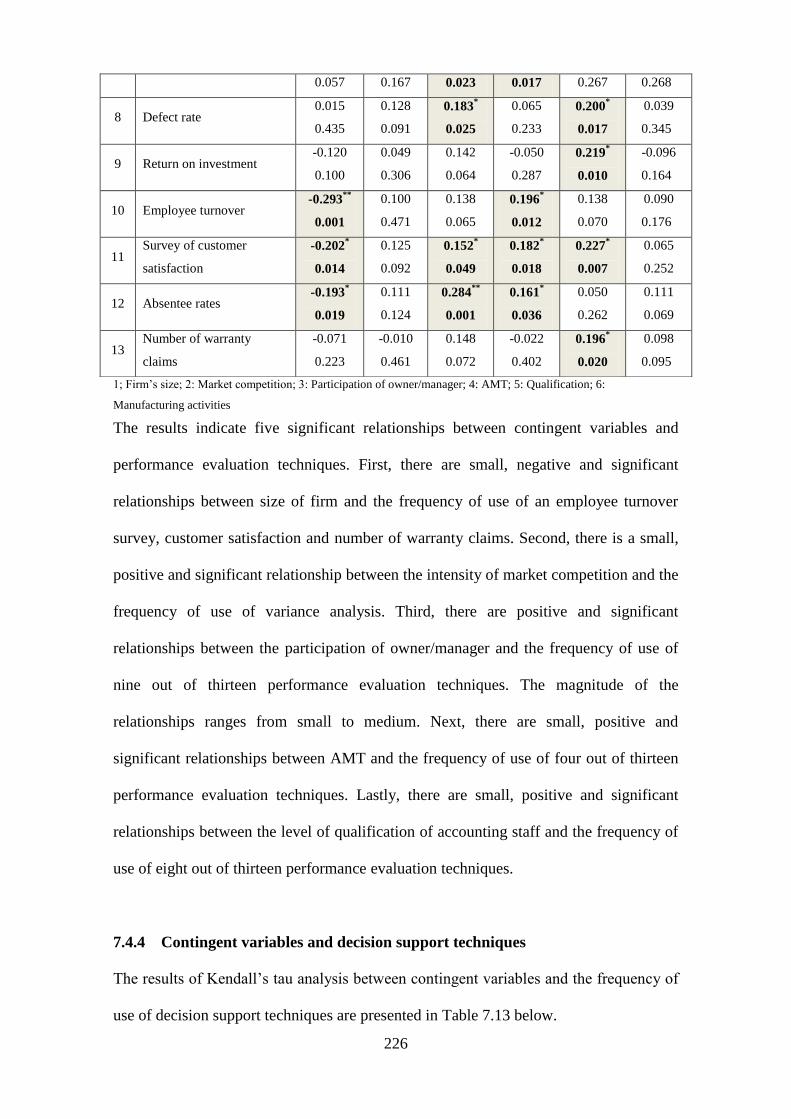
226
1; Firm‘s size; 2: Market competition; 3: Participation of owner/manager; 4: AMT; 5: Qualification; 6:
Manufacturing activities
The results indicate five significant relationships between contingent variables and
performance evaluation techniques. First, there are small, negative and significant
relationships between size of firm and the frequency of use of an employee turnover
survey, customer satisfaction and number of warranty claims. Second, there is a small,
positive and significant relationship between the intensity of market competition and the
frequency of use of variance analysis. Third, there are positive and significant
relationships between the participation of owner/manager and the frequency of use of
nine out of thirteen performance evaluation techniques. The magnitude of the
relationships ranges from small to medium. Next, there are small, positive and
significant relationships between AMT and the frequency of use of four out of thirteen
performance evaluation techniques. Lastly, there are small, positive and significant
relationships between the level of qualification of accounting staff and the frequency of
use of eight out of thirteen performance evaluation techniques.
7.4.4 Contingent variables and decision support techniques
The results of Kendall‘s tau analysis between contingent variables and the frequency of
use of decision support techniques are presented in Table 7.13 below.
0.057 0.167 0.023 0.017 0.267 0.268
8 Defect rate 0.015
0.435
0.128
0.091
0.183*
0.025
0.065
0.233
0.200*
0.017
0.039
0.345
9 Return on investment -0.120
0.100
0.049
0.306
0.142
0.064
-0.050
0.287
0.219*
0.010
-0.096
0.164
10 Employee turnover -0.293
**
0.001
0.100
0.471
0.138
0.065
0.196*
0.012
0.138
0.070
0.090
0.176
11 Survey of customer
satisfaction
-0.202*
0.014
0.125
0.092
0.152*
0.049
0.182*
0.018
0.227*
0.007
0.065
0.252
12 Absentee rates -0.193
*
0.019
0.111
0.124
0.284**
0.001
0.161*
0.036
0.050
0.262
0.111
0.069
13 Number of warranty
claims
-0.071
0.223
-0.010
0.461
0.148
0.072
-0.022
0.402
0.196*
0.020
0.098
0.095

227
Table 7.13: Kendall‘s tau correlation coefficient test results for a relationship between
contingent variables and the frequency of use of decision support techniques.
1; Firm‘s size; 2: Market competition; 3: Participation of owner/manager; 4: AMT; 5: Qualification; 6:
Manufacturing activities
The results indicate six significant relationships between contingent variables and
decision support techniques. First, there is a small, negative and significant relationship
between size of firm and the frequency of use of accounting rate of return. Second there
are small, positive and significant relationships between the intensity of market
competition and the frequency of use of product profitability analysis and customer
profitability analysis. Next, there are small, positive and significant relationships
between the participation of owner/manager and the frequency of use of three out of
eight decision support techniques. Fourth, there are small, positive and significant
relationships between AMT and the frequency of use of two out of eight decision
support techniques. Fifth, there are positive and significant relationships between the
level of qualification of accounting staff and the frequency of use of four out of eight
No Variables 1 2 3 4 5 6
1 Product profitability
analysis
-0.044
0.334
0.205*
0.025
0.245**
0.008
0.049
0.308
0.059
0.285
-0.056
0.302
2 Break-even analysis -0.039
0.353
0.160
0.063
0.172**
0.046
0.155
0.056
0.265**
0.005
0.310**
0.002
3 Stock control model 0.023
0.411
-0.021
0.419
0.110
0.140
0.069
0.239
0.008
0.471
0.016
0.440
4 Payback -0.105
0.148
0.077
0.226
0.176*
0.039
0.128
0.088
0.358**
0.000
0.037
0.366
5 Net present value -0.076
0.226
-0.007
0.471
0.107
0.146
0.118
0.109
0.230*
0.013
0.099
0.068
6 Customer profitability
analysis
-0.123
0.113
0.245**
0.010
0.140
0.082
-0.028
0.388
-0.135
0.095
-0.114
0.144
7 Accounting rate of return -0.215
*
0.017
-0.030
0.388
0.124
0.111
0.190**
0.024
0.103
0.128
-0.098
0.182
8 Internal rate of return -0.033
0.372
-0.009
0.466
0.036
0.360
0.171*
0.036
0.203*
0.024
0.092
0.090
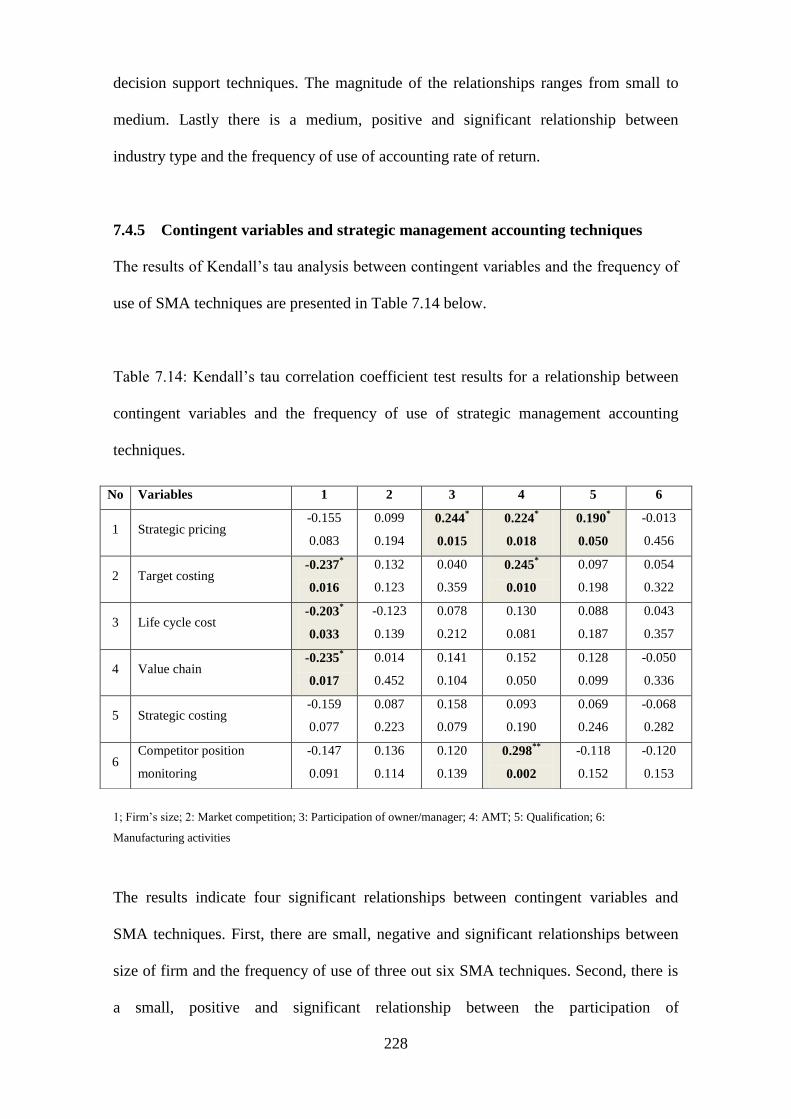
228
decision support techniques. The magnitude of the relationships ranges from small to
medium. Lastly there is a medium, positive and significant relationship between
industry type and the frequency of use of accounting rate of return.
7.4.5 Contingent variables and strategic management accounting techniques
The results of Kendall‘s tau analysis between contingent variables and the frequency of
use of SMA techniques are presented in Table 7.14 below.
Table 7.14: Kendall‘s tau correlation coefficient test results for a relationship between
contingent variables and the frequency of use of strategic management accounting
techniques.
1; Firm‘s size; 2: Market competition; 3: Participation of owner/manager; 4: AMT; 5: Qualification; 6:
Manufacturing activities
The results indicate four significant relationships between contingent variables and
SMA techniques. First, there are small, negative and significant relationships between
size of firm and the frequency of use of three out six SMA techniques. Second, there is
a small, positive and significant relationship between the participation of
No Variables 1 2 3 4 5 6
1 Strategic pricing -0.155
0.083
0.099
0.194
0.244*
0.015
0.224*
0.018
0.190*
0.050
-0.013
0.456
2 Target costing -0.237
*
0.016
0.132
0.123
0.040
0.359
0.245*
0.010
0.097
0.198
0.054
0.322
3 Life cycle cost -0.203
*
0.033
-0.123
0.139
0.078
0.212
0.130
0.081
0.088
0.187
0.043
0.357
4 Value chain -0.235
*
0.017
0.014
0.452
0.141
0.104
0.152
0.050
0.128
0.099
-0.050
0.336
5 Strategic costing -0.159
0.077
0.087
0.223
0.158
0.079
0.093
0.190
0.069
0.246
-0.068
0.282
6 Competitor position
monitoring
-0.147
0.091
0.136
0.114
0.120
0.139
0.298**
0.002
-0.118
0.152
-0.120
0.153

229
owner/manager and the frequency of use of strategic pricing. Next, there are small,
positive and significant relationships between AMT and the frequency of use of three
out of six SMA techniques. Lastly, there is a small, positive and significant relationship
between the level of qualification of accounting staff and the frequency of use of
strategic pricing.
Summary
The examination of the relationship between individual techniques and contingent
factors reveals that there were positive and significant associations between the five
main contingent variables and certain management accounting techniques under five
broad areas of MAPs. The position revealed as with the examination of the relationship
between accounting practices and contingent variables is not clear cut but a number of
points can be gleaned.
First, the results reveal that the size of the firms (which is measured by the annual sales
turnover) has a very small and negative association with the use of 18% (eight out of
45) management accounting techniques. The negative results are contrary with the
earlier findings that the direction of association for MAPs was positive. The results do
not contradict the finding that larger firms make greater use of costing and performance
evaluation systems as the size of firms were only negatively correlated with the least
used management accounting techniques that fall outside these practices such as ZBB,
employees turnover, absentee rate and value chain analysis.
Second, the result shows that the intensity of market competition has a small association
with the use of 13% (6 out of 45) techniques under all areas of MAPs except SMA.
These results provide some evidence of a relationship between market competition and

230
the use of management accounting techniques which is consistent with the earlier
analysis (Kendall‘s tau). Overall the results suggest that the intensity of market
competition has minimal impact on the adoption of management accounting techniques
within medium sized firms.
Third, the participation of owner/manager has 47% (21 out of 45) significant
associations with techniques under four out of the five areas of management accounting
practice (the exception being use of a costing system). This is consistent with the
previous analysis except that a relationship to some performance evaluation techniques
was found. This result strongly suggests that the owner/manager potentially plays a key
role in increasing the use of various management accounting techniques in medium
sized firms.
Similarly, the use of AMT was widely associated with the use of the 47% (21 out of 45)
management accounting techniques under all area of MAPs. This result is consistent
with the results for accounting practices and even includes techniques within budgeting
which was a practice for which no significant relationship was found when testing
MAPs. Therefore this result strengthens the previous results that manufacturing
technology has a strong impact on the use of MAPs in medium sized firms.
Lastly, the level of qualification of accounting staff has 42% (19 out of 45) significant
associations with techniques under four out of the five areas of management accounting
practice (the exception being costing system). These results are at variance with the
analysis for MAPs that reported no significant relationship between the use of MAPs
and qualified accounting staff. This result suggests that the higher the qualification of
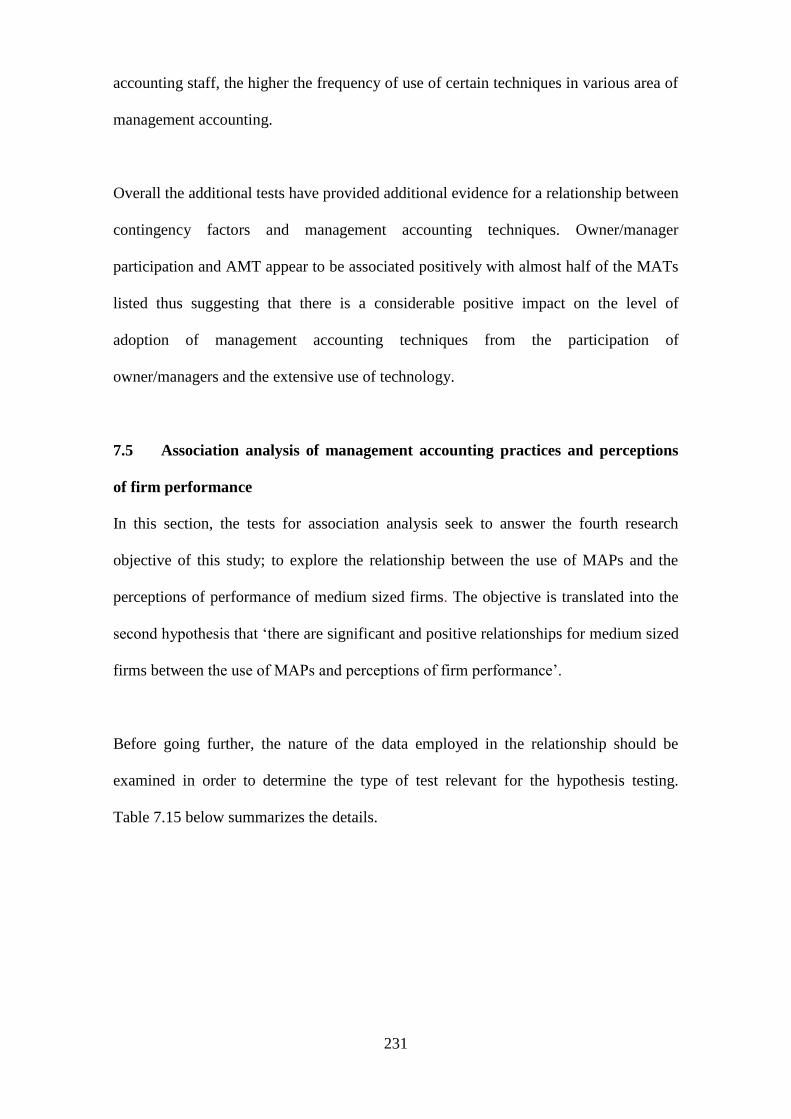
231
accounting staff, the higher the frequency of use of certain techniques in various area of
management accounting.
Overall the additional tests have provided additional evidence for a relationship between
contingency factors and management accounting techniques. Owner/manager
participation and AMT appear to be associated positively with almost half of the MATs
listed thus suggesting that there is a considerable positive impact on the level of
adoption of management accounting techniques from the participation of
owner/managers and the extensive use of technology.
7.5 Association analysis of management accounting practices and perceptions
of firm performance
In this section, the tests for association analysis seek to answer the fourth research
objective of this study; to explore the relationship between the use of MAPs and the
perceptions of performance of medium sized firms. The objective is translated into the
second hypothesis that ‗there are significant and positive relationships for medium sized
firms between the use of MAPs and perceptions of firm performance‘.
Before going further, the nature of the data employed in the relationship should be
examined in order to determine the type of test relevant for the hypothesis testing.
Table 7.15 below summarizes the details.
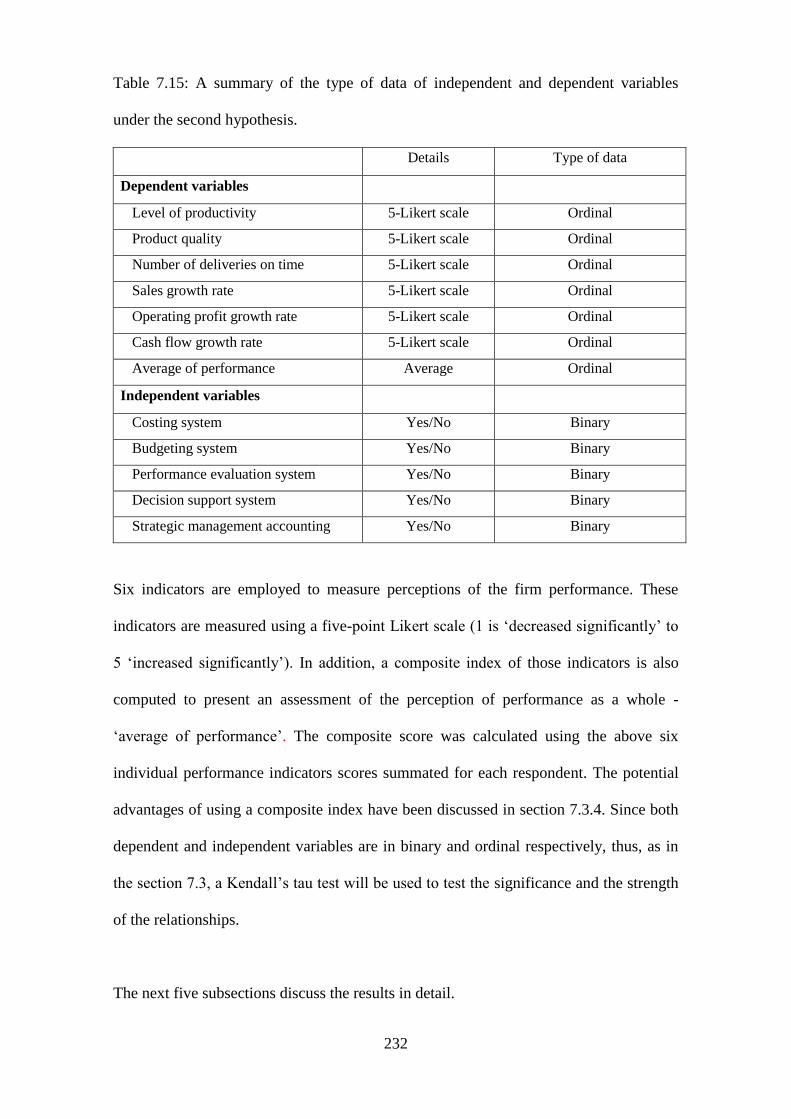
232
Table 7.15: A summary of the type of data of independent and dependent variables
under the second hypothesis.
Details Type of data
Dependent variables
Level of productivity 5-Likert scale Ordinal
Product quality 5-Likert scale Ordinal
Number of deliveries on time 5-Likert scale Ordinal
Sales growth rate 5-Likert scale Ordinal
Operating profit growth rate 5-Likert scale Ordinal
Cash flow growth rate 5-Likert scale Ordinal
Average of performance Average Ordinal
Independent variables
Costing system Yes/No Binary
Budgeting system Yes/No Binary
Performance evaluation system Yes/No Binary
Decision support system Yes/No Binary
Strategic management accounting Yes/No Binary
Six indicators are employed to measure perceptions of the firm performance. These
indicators are measured using a five-point Likert scale (1 is ‗decreased significantly‘ to
5 ‗increased significantly‘). In addition, a composite index of those indicators is also
computed to present an assessment of the perception of performance as a whole -
‗average of performance‘. The composite score was calculated using the above six
individual performance indicators scores summated for each respondent. The potential
advantages of using a composite index have been discussed in section 7.3.4. Since both
dependent and independent variables are in binary and ordinal respectively, thus, as in
the section 7.3, a Kendall‘s tau test will be used to test the significance and the strength
of the relationships.
The next five subsections discuss the results in detail.

233
7.5.1 Costing system and perceptions of firm performance
The following seven sub-hypotheses (H2-1 to H2-7) were developed for the relationship
between costing system and perceptions of firm performance within medium sized
firms.
H2-1 : There is a significant and positive relationship between the use of costing
systems and perceptions of performance in the level of productivity
H2-2 : There a significant and positive relationship between the use of costing systems
and perceptions of performance in product quality
H2-3 : There is a significant and positive relationship between the use of costing
systems and perceptions of performance in the number of deliveries on time
H2-4 : There is a significant and positive relationship between the use of costing
systems and perceptions of performance in sales growth rate
H2-5 : There is a significant and positive relationship between the use of costing
systems and perceptions of performance in operating profit growth rate
H2-6 : There is a significant and positive relationship between the use of costing
systems and perceptions of performance in cash flow growth rate
H2-7 : There is a significant and positive relationship between the use of costing
systems and perceptions of performance in average of performance

234
Table 7.16: Kendall‘s tau correlation coefficient test results for a relationship between
the use of a costing system and the perceptions of firm performance.
Hypothesis Correlation coefficient Sig. value
Level of productivity H2-1 0.219 0.008
Product quality H2-2 0.055 0.276
Number of deliveries on time H2-3 0.127 0.082
Sales growth rate H2-4 0.177 0.023
Operating profit growth rate H2-5 0.147 0.051
Cash flow growth rate H2-6 0.325 0.006
Average of performance H2-7 0.217 0.004
Significant correlation in bold
The results show a positive and significant relationship between the use of costing
system and perceptions of performance relating to level of productivity, sales growth
rate, cash flow growth rate and average of performance. However there appears to be no
support for any statistically significant relationship between the use of a costing system
and the other three performance indicators. Therefore both sub-hypotheses number H2-1,
H2-4, H2-6 and H2-7 are accepted. Sub-hypotheses H2-2, H2-3 and H2-5, although they have
positive correlation coefficients in line with the hypothesis, are rejected.
7.5.2 Budgeting system and perceptions of firm performance
The following seven sub-hypotheses (H2-8 to H2-14) were developed for the relationship
between budgeting system and perceptions of firm performance within medium sized
firms.
H2-8 : There is a significant and positive relationship between the use of budgeting
systems and perceptions of performance in the level of productivity
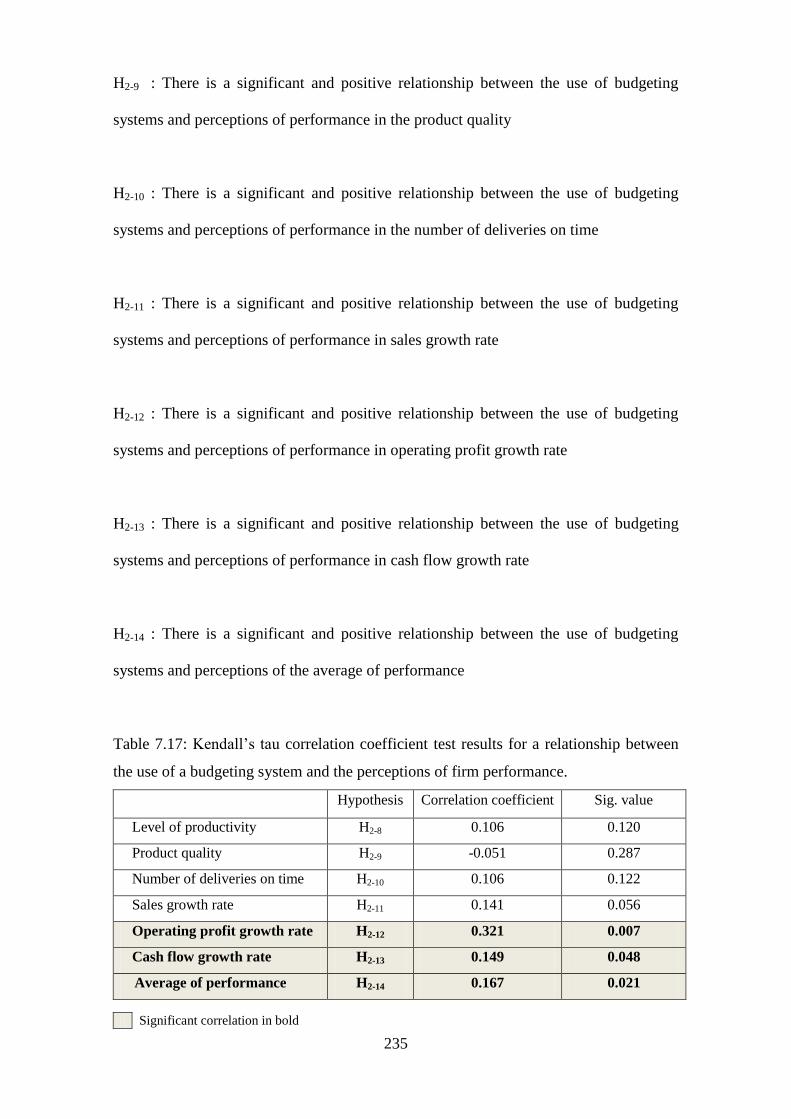
235
H2-9 : There is a significant and positive relationship between the use of budgeting
systems and perceptions of performance in the product quality
H2-10 : There is a significant and positive relationship between the use of budgeting
systems and perceptions of performance in the number of deliveries on time
H2-11 : There is a significant and positive relationship between the use of budgeting
systems and perceptions of performance in sales growth rate
H2-12 : There is a significant and positive relationship between the use of budgeting
systems and perceptions of performance in operating profit growth rate
H2-13 : There is a significant and positive relationship between the use of budgeting
systems and perceptions of performance in cash flow growth rate
H2-14 : There is a significant and positive relationship between the use of budgeting
systems and perceptions of the average of performance
Table 7.17: Kendall‘s tau correlation coefficient test results for a relationship between
the use of a budgeting system and the perceptions of firm performance.
Hypothesis Correlation coefficient Sig. value
Level of productivity H2-8 0.106 0.120
Product quality H2-9 -0.051 0.287
Number of deliveries on time H2-10 0.106 0.122
Sales growth rate H2-11 0.141 0.056
Operating profit growth rate H2-12 0.321 0.007
Cash flow growth rate H2-13 0.149 0.048
Average of performance H2-14 0.167 0.021
Significant correlation in bold
236
Table 7.17 shows a positive and significant relationship between the use of budgeting
system and perceptions of performance relating to operating growth rate, cash flow
growth rate and average of performance. However there appears to be no support for
any statistically significant relationship between the use of a budgeting system and the
other five performance indicators. Therefore both sub-hypotheses number H2-12, H2-13
and H2-14 are accepted. The rest of the sub-hypotheses except sub-hypothesis H2-9 have
positive correlation coefficients in line with the hypothesis. However all of these sub-
hypotheses are rejected.
7.5.3 Performance evaluation system and perceptions of firm performance
The following seven sub-hypotheses (H2-15 to H2-21) were developed for the relationship
between the use of a performance evaluation system and perceptions of firm
performance within medium sized firms.
H2-15 : There is a significant and positive relationship between the use of performance
evaluation systems and perceptions of performance in the level of productivity
H2-16 : There is a significant and positive relationship between the use of performance
evaluation systems and perceptions of performance in the product quality
H2-17 : There is a significant and positive relationship between the use of performance
evaluation systems and perceptions of performance in the number of deliveries on time
H2-18 : There is a significant and positive relationship between the use of performance
evaluation systems and perceptions of performance in sales growth rate
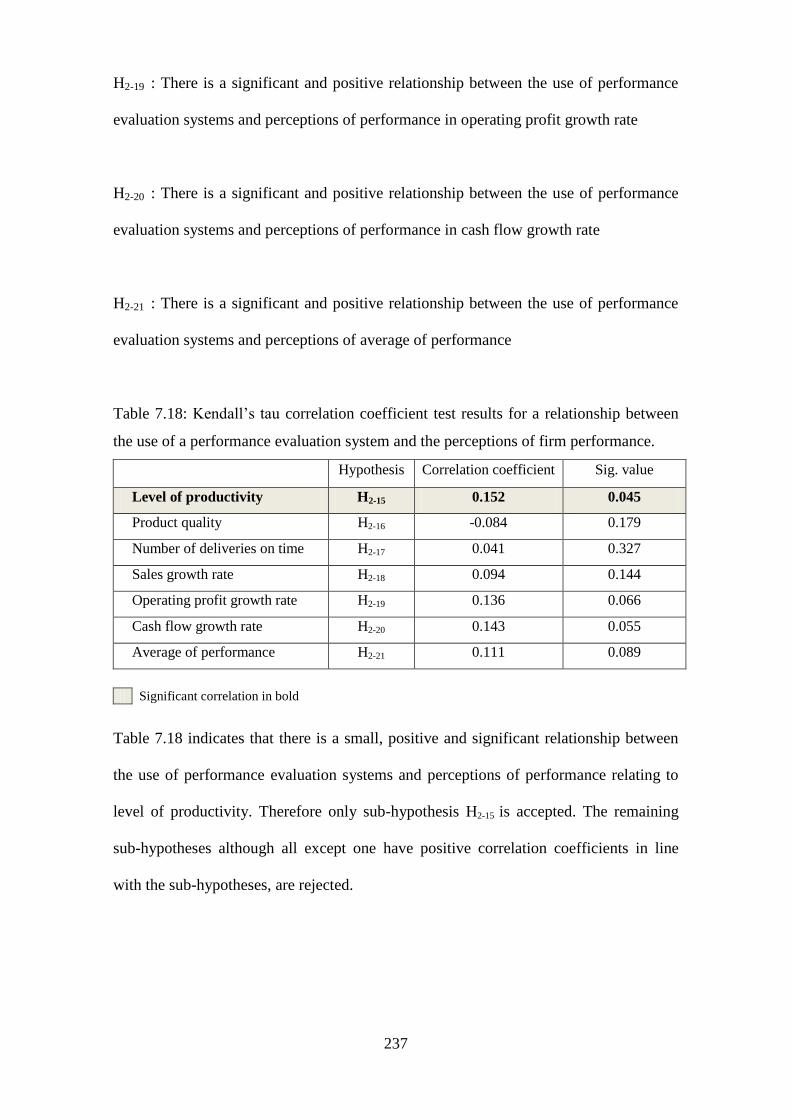
237
H2-19 : There is a significant and positive relationship between the use of performance
evaluation systems and perceptions of performance in operating profit growth rate
H2-20 : There is a significant and positive relationship between the use of performance
evaluation systems and perceptions of performance in cash flow growth rate
H2-21 : There is a significant and positive relationship between the use of performance
evaluation systems and perceptions of average of performance
Table 7.18: Kendall‘s tau correlation coefficient test results for a relationship between
the use of a performance evaluation system and the perceptions of firm performance.
Hypothesis Correlation coefficient Sig. value
Level of productivity H2-15 0.152 0.045
Product quality H2-16 -0.084 0.179
Number of deliveries on time H2-17 0.041 0.327
Sales growth rate H2-18 0.094 0.144
Operating profit growth rate H2-19 0.136 0.066
Cash flow growth rate H2-20 0.143 0.055
Average of performance H2-21 0.111 0.089
Significant correlation in bold
Table 7.18 indicates that there is a small, positive and significant relationship between
the use of performance evaluation systems and perceptions of performance relating to
level of productivity. Therefore only sub-hypothesis H2-15 is accepted. The remaining
sub-hypotheses although all except one have positive correlation coefficients in line
with the sub-hypotheses, are rejected.
238
7.5.4 Decision support system and perceptions of firm performance
The following seven sub-hypotheses (H2-22 to H2-28) were developed with respect to the
relationship between decision support system and perceptions of firm performance
within medium sized firms.
H2-22 : There is a significant and positive relationship between the use of decision
support systems and perceptions of performance in the level of productivity
H2-23 : There is a significant and positive relationship between the use of decision
support systems and perceptions of performance in the product quality
H2-24 : There is a significant and positive relationship between the use of decision
support systems and perceptions of performance in the number of deliveries on time
H2-25 : There is a significant and positive relationship between the use of decision
support systems and perceptions of performance in sales growth rate
H2-26 : There is a significant and positive relationship between the use of decision
support systems and perceptions of performance in operating profit growth rate
H2-27 : There is a significant and positive relationship between the use of decision
support systems and perceptions of performance in cash flow growth rate
H2-28 : There is a significant and positive relationship between the use of decision
support systems and perceptions of the average of performance
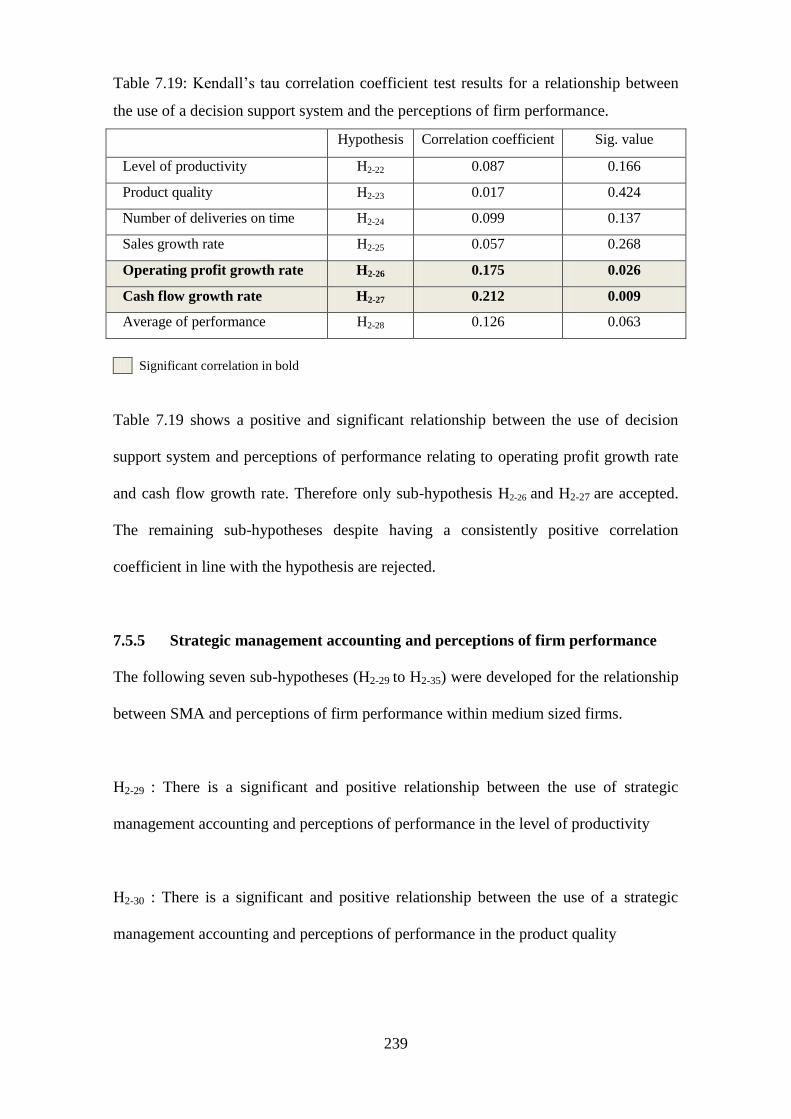
239
Table 7.19: Kendall‘s tau correlation coefficient test results for a relationship between
the use of a decision support system and the perceptions of firm performance.
Hypothesis Correlation coefficient Sig. value
Level of productivity H2-22 0.087 0.166
Product quality H2-23 0.017 0.424
Number of deliveries on time H2-24 0.099 0.137
Sales growth rate H2-25 0.057 0.268
Operating profit growth rate H2-26 0.175 0.026
Cash flow growth rate H2-27 0.212 0.009
Average of performance H2-28 0.126 0.063
Significant correlation in bold
Table 7.19 shows a positive and significant relationship between the use of decision
support system and perceptions of performance relating to operating profit growth rate
and cash flow growth rate. Therefore only sub-hypothesis H2-26 and H2-27 are accepted.
The remaining sub-hypotheses despite having a consistently positive correlation
coefficient in line with the hypothesis are rejected.
7.5.5 Strategic management accounting and perceptions of firm performance
The following seven sub-hypotheses (H2-29 to H2-35) were developed for the relationship
between SMA and perceptions of firm performance within medium sized firms.
H2-29 : There is a significant and positive relationship between the use of strategic
management accounting and perceptions of performance in the level of productivity
H2-30 : There is a significant and positive relationship between the use of a strategic
management accounting and perceptions of performance in the product quality
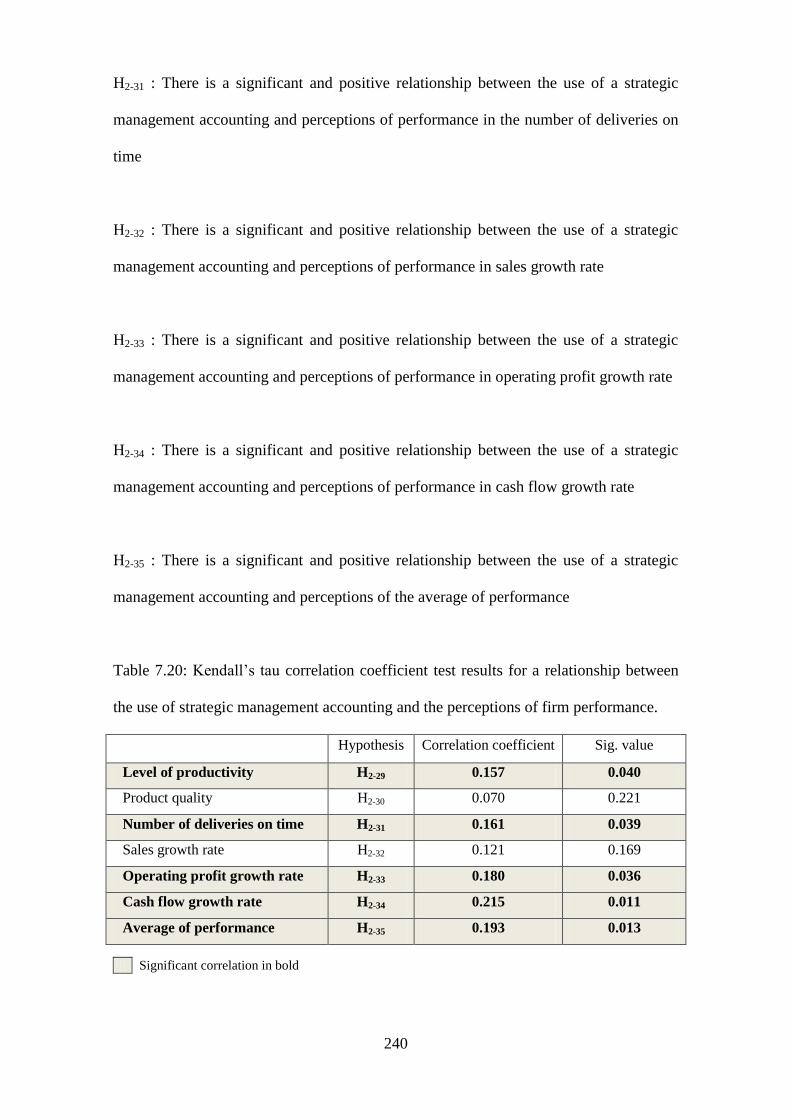
240
H2-31 : There is a significant and positive relationship between the use of a strategic
management accounting and perceptions of performance in the number of deliveries on
time
H2-32 : There is a significant and positive relationship between the use of a strategic
management accounting and perceptions of performance in sales growth rate
H2-33 : There is a significant and positive relationship between the use of a strategic
management accounting and perceptions of performance in operating profit growth rate
H2-34 : There is a significant and positive relationship between the use of a strategic
management accounting and perceptions of performance in cash flow growth rate
H2-35 : There is a significant and positive relationship between the use of a strategic
management accounting and perceptions of the average of performance
Table 7.20: Kendall‘s tau correlation coefficient test results for a relationship between
the use of strategic management accounting and the perceptions of firm performance.
Hypothesis Correlation coefficient Sig. value
Level of productivity H2-29 0.157 0.040
Product quality H2-30 0.070 0.221
Number of deliveries on time H2-31 0.161 0.039
Sales growth rate H2-32 0.121 0.169
Operating profit growth rate H2-33 0.180 0.036
Cash flow growth rate H2-34 0.215 0.011
Average of performance H2-35 0.193 0.013
Significant correlation in bold
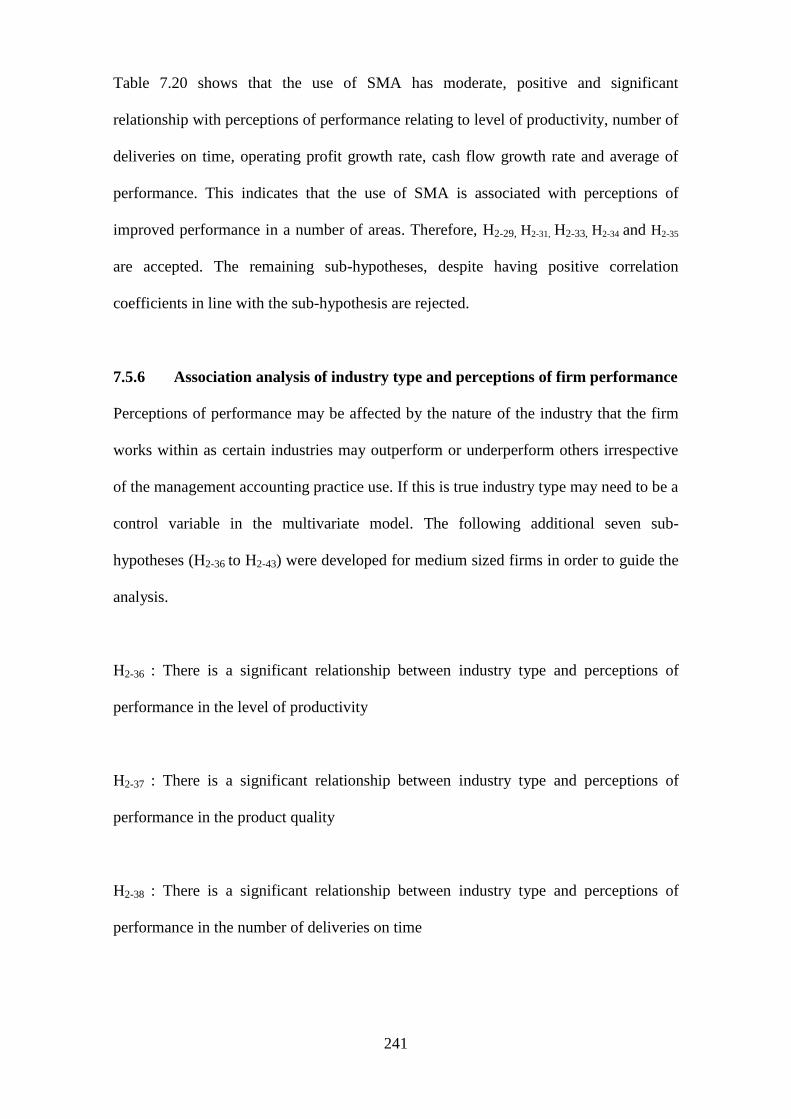
241
Table 7.20 shows that the use of SMA has moderate, positive and significant
relationship with perceptions of performance relating to level of productivity, number of
deliveries on time, operating profit growth rate, cash flow growth rate and average of
performance. This indicates that the use of SMA is associated with perceptions of
improved performance in a number of areas. Therefore, H2-29, H2-31, H2-33, H2-34 and H2-35
are accepted. The remaining sub-hypotheses, despite having positive correlation
coefficients in line with the sub-hypothesis are rejected.
7.5.6 Association analysis of industry type and perceptions of firm performance
Perceptions of performance may be affected by the nature of the industry that the firm
works within as certain industries may outperform or underperform others irrespective
of the management accounting practice use. If this is true industry type may need to be a
control variable in the multivariate model. The following additional seven sub-
hypotheses (H2-36 to H2-43) were developed for medium sized firms in order to guide the
analysis.
H2-36 : There is a significant relationship between industry type and perceptions of
performance in the level of productivity
H2-37 : There is a significant relationship between industry type and perceptions of
performance in the product quality
H2-38 : There is a significant relationship between industry type and perceptions of
performance in the number of deliveries on time
242
H2-39 : There is a significant relationship between industry type and perceptions of
performance in sales growth rate
H2-40 : There is a significant relationship between industry type and perceptions of
performance in operating profit growth rate
H2-41 : There is a significant relationship between industry type and perceptions of
performance in cash flow growth rate
H2-42 : There is a significant relationship between industry type and perceptions of the
average of performance
Table 7.21: Pearson chi-square and Cramer‘s V correlation coefficient test results for a
relationship between the type of manufacturing activities and the perceptions of firm
performance.
Hypothesis Correlation coefficient Sig. value
Level of productivity H2-36 0.198 0.232
Product quality H2-37 0.058 0.947
Number of deliveries on time H2-38 0.073 0.901
Sales growth rate H2-39 0.076 0.959
Operating profit growth rate H2-40 0.131 0.761
Cash flow growth rate H2-41 0.091 0.924
Average of performance H2-42 0.350 0.762
Significant correlation in bold
Table 7.21 suggests that there are no significant relationships between the type of
industry that the respondent is in and perceptions of firm performance. Therefore all
243
seven sub-hypotheses (H2-36 to H2-43), are all rejected. This in turn would suggest that
there is no need to control for industry in the multivariate model.
Summary
Overall above results provide some evidence as to significant relationships between the
use of MAPs and perceptions as to the level of firm performance. The greater use of
costing systems and SMA are positive and significantly associated with a higher level of
perceived performance in a number of areas especially those at business level. Similarly
the use of budgeting systems and decision support systems appear to have limited
significant relationships with performance measures at business level. Lastly the results
also indicate that the greater use of performance evaluation systems is solely associated
with one indicator of performance (level of productivity).
As in the previous section, a further insight to relationships between the use of
management accounting and performance will be undertaken. This can be done by
examining the analysis for MATs instead of MAPs. The following section continues
using bivariate analysis for testing the relationship between the frequency of use of
MATs and perceptions of firm performance.
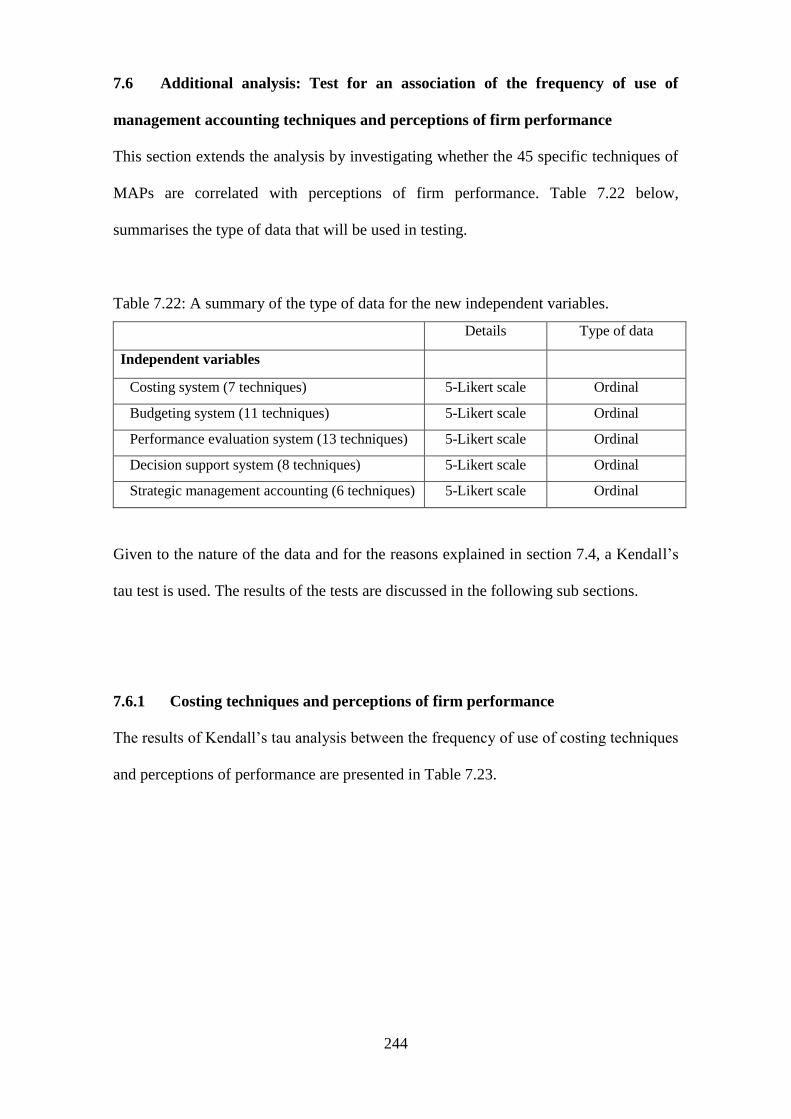
244
7.6 Additional analysis: Test for an association of the frequency of use of
management accounting techniques and perceptions of firm performance
This section extends the analysis by investigating whether the 45 specific techniques of
MAPs are correlated with perceptions of firm performance. Table 7.22 below,
summarises the type of data that will be used in testing.
Table 7.22: A summary of the type of data for the new independent variables.
Details Type of data
Independent variables
Costing system (7 techniques) 5-Likert scale Ordinal
Budgeting system (11 techniques) 5-Likert scale Ordinal
Performance evaluation system (13 techniques) 5-Likert scale Ordinal
Decision support system (8 techniques) 5-Likert scale Ordinal
Strategic management accounting (6 techniques) 5-Likert scale Ordinal
Given to the nature of the data and for the reasons explained in section 7.4, a Kendall‘s
tau test is used. The results of the tests are discussed in the following sub sections.
7.6.1 Costing techniques and perceptions of firm performance
The results of Kendall‘s tau analysis between the frequency of use of costing techniques
and perceptions of performance are presented in Table 7.23.

245
Table 7.23: Kendall‘s tau correlation coefficient test results for a relationship between
the frequency of use of costing techniques and the perceptions of firm performance
measured in seven ways.
1: Level of productivity; 2: Product quality; 3: Number of deliveries on time; 4: Sales growth rate ; 5: Operating
profit ; 6: Cash flow growth rate; 7: Average of performance
Table 7.23 finds five significant relationships between the frequency of use of costing
techniques and the perceptions of firm performance. First, there is a small, positive and
significant relationship between the frequency of use of batch costing and the perception
of product quality. Second, there are positive and significant relationships between the
frequency of use of contract costing and the perception on six out of seven indicators of
performance. The magnitude of the relationships ranges from relatively small to
moderate. Third, there is a small, positive and significant relationship between the
frequency of use of absorption costing and the perception of cash flow growth rate.
Next, there is a small, negative and significant relationship between the frequency of
use of variable costing and the perception of number of deliveries on time. Lastly, there
No Items 1 2 3 4 5 6 7
1 Process costing 0.015
0.424
-0.020
0.398
0.029
0.356
-0.003
0.485
0.004
0.482
0.064
0.205
0.024
0.368
2 Job costing -0.052
0.266
0.093
0.134
-0.030
0.359
0.018
0.415
-0.051
0.267
-0.070
0.197
-0.039
0.301
3 Batch costing 0.075
0.183
0.231*
0.010
0.013
0.447
0.082
0.160
0.045
0.291
0.106
0.098
0.062
0.204
4 Contract costing 0.268
**
0.004
0.391**
0.000
0.297**
0.002
0.181*
0.034
0.246**
0.007
0.131
0.096
0.296**
0.001
5 Absorption costing 0.075
0.240
0.035
0.350
-0.051
0.282
0.138
0.093
0.126
0.076
0.194*
0.033
0.098
0.112
6 Variable costing -0.091
0.156
-0.071
0.220
-0.258**
0.008
-0.084
0.177
-0.011
0.450
0.053
0.276
-0.070
0.196
7 ABC costing -0.155
0.057
-0.231**
0.014
-0.002
0.490
-0.125
0.078
-0.191*
0.033
-0.170
0.051
-0.176*
0.031
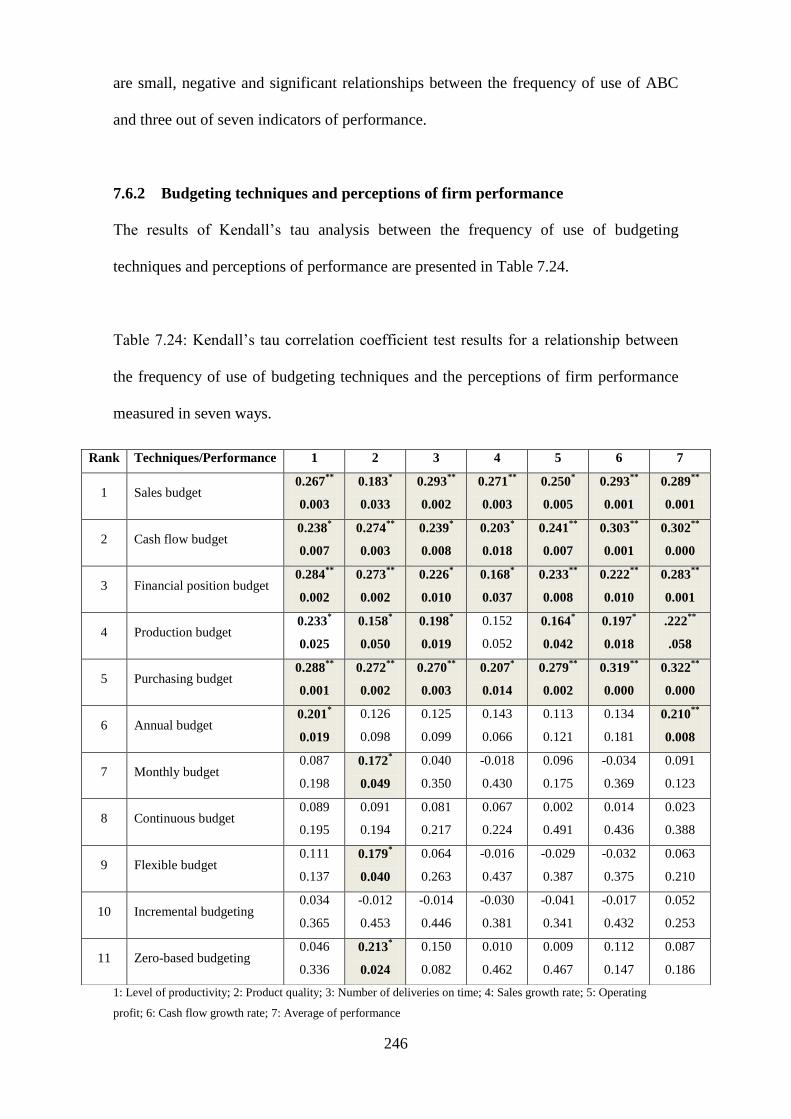
246
are small, negative and significant relationships between the frequency of use of ABC
and three out of seven indicators of performance.
7.6.2 Budgeting techniques and perceptions of firm performance
The results of Kendall‘s tau analysis between the frequency of use of budgeting
techniques and perceptions of performance are presented in Table 7.24.
Table 7.24: Kendall‘s tau correlation coefficient test results for a relationship between
the frequency of use of budgeting techniques and the perceptions of firm performance
measured in seven ways.
1: Level of productivity; 2: Product quality; 3: Number of deliveries on time; 4: Sales growth rate; 5: Operating
profit; 6: Cash flow growth rate; 7: Average of performance
Rank Techniques/Performance 1 2 3 4 5 6 7
1 Sales budget 0.267
**
0.003
0.183*
0.033
0.293**
0.002
0.271**
0.003
0.250*
0.005
0.293**
0.001
0.289**
0.001
2 Cash flow budget 0.238
*
0.007
0.274**
0.003
0.239*
0.008
0.203*
0.018
0.241**
0.007
0.303**
0.001
0.302**
0.000
3 Financial position budget 0.284
**
0.002
0.273**
0.002
0.226*
0.010
0.168*
0.037
0.233**
0.008
0.222**
0.010
0.283**
0.001
4 Production budget 0.233
*
0.025
0.158*
0.050
0.198*
0.019
0.152
0.052
0.164*
0.042
0.197*
0.018
.222**
.058
5 Purchasing budget 0.288
**
0.001
0.272**
0.002
0.270**
0.003
0.207*
0.014
0.279**
0.002
0.319**
0.000
0.322**
0.000
6 Annual budget 0.201
*
0.019
0.126
0.098
0.125
0.099
0.143
0.066
0.113
0.121
0.134
0.181
0.210**
0.008
7 Monthly budget 0.087
0.198
0.172*
0.049
0.040
0.350
-0.018
0.430
0.096
0.175
-0.034
0.369
0.091
0.123
8 Continuous budget 0.089
0.195
0.091
0.194
0.081
0.217
0.067
0.224
0.002
0.491
0.014
0.436
0.023
0.388
9 Flexible budget 0.111
0.137
0.179*
0.040
0.064
0.263
-0.016
0.437
-0.029
0.387
-0.032
0.375
0.063
0.210
10 Incremental budgeting 0.034
0.365
-0.012
0.453
-0.014
0.446
-0.030
0.381
-0.041
0.341
-0.017
0.432
0.052
0.253
11 Zero-based budgeting 0.046
0.336
0.213*
0.024
0.150
0.082
0.010
0.462
0.009
0.467
0.112
0.147
0.087
0.186
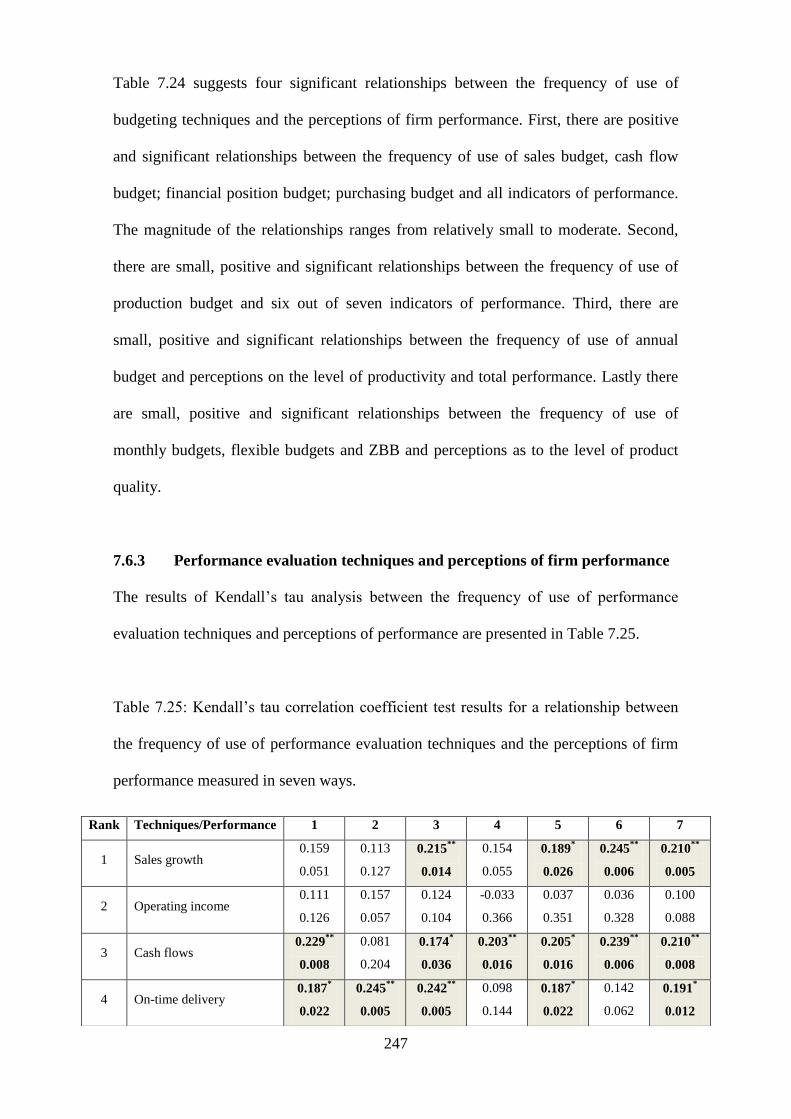
247
Table 7.24 suggests four significant relationships between the frequency of use of
budgeting techniques and the perceptions of firm performance. First, there are positive
and significant relationships between the frequency of use of sales budget, cash flow
budget; financial position budget; purchasing budget and all indicators of performance.
The magnitude of the relationships ranges from relatively small to moderate. Second,
there are small, positive and significant relationships between the frequency of use of
production budget and six out of seven indicators of performance. Third, there are
small, positive and significant relationships between the frequency of use of annual
budget and perceptions on the level of productivity and total performance. Lastly there
are small, positive and significant relationships between the frequency of use of
monthly budgets, flexible budgets and ZBB and perceptions as to the level of product
quality.
7.6.3 Performance evaluation techniques and perceptions of firm performance
The results of Kendall‘s tau analysis between the frequency of use of performance
evaluation techniques and perceptions of performance are presented in Table 7.25.
Table 7.25: Kendall‘s tau correlation coefficient test results for a relationship between
the frequency of use of performance evaluation techniques and the perceptions of firm
performance measured in seven ways.
Rank Techniques/Performance 1 2 3 4 5 6 7
1 Sales growth 0.159
0.051
0.113
0.127
0.215**
0.014
0.154
0.055
0.189*
0.026
0.245**
0.006
0.210**
0.005
2 Operating income 0.111
0.126
0.157
0.057
0.124
0.104
-0.033
0.366
0.037
0.351
0.036
0.328
0.100
0.088
3 Cash flows 0.229
**
0.008
0.081
0.204
0.174*
0.036
0.203**
0.016
0.205*
0.016
0.239**
0.006
0.210**
0.008
4 On-time delivery 0.187
*
0.022
0.245**
0.005
0.242**
0.005
0.098
0.144
0.187*
0.022
0.142
0.062
0.191*
0.012

248
1: Level of productivity; 2: Product quality; 3: Number of deliveries on time; 4: Sales growth rate; 5: Operating
profit; 6: Cash flow growth rate; 7: Average of performance
Table 7.25 suggests three significant relationships between the frequency of use of
performance evaluation techniques and the perceptions of firm performance. First, there
are small, positive and significant relationships between the frequencies of use of sales
growth; cash flows; on-time delivery; manufacturing lead time; with at least four out
seven indicators of performance. Second, there are small positive and significant
relationships between the frequency of use of return on investment and all indicators of
performance. Lastly, there are small, positive and significant relationships between the
frequency of use of measures as to employee turnover; absentee rates; number of
warranty claims and the perception on the level on number of deliveries on time.
7.6.4 Decision support techniques and perceptions of firm performance
The results of Kendall‘s tau analysis between the frequency of use of decision support
techniques and perceptions of performance are presented in Table 7.26.
5 Variance analysis 0.088
0.171
0.038
0.343
0.153
0.051
-0.025
0.391
0.105
0.130
0.070
0.224
0.091
0.143
6 Number of customer
complaints
0.020
0.413
0.078
0.206
0.163*
0.040
0.020
0.413
0.026
0.369
0.055
0.235
0.086
0.155
7 Manufacturing lead time 0.199
*
0.016
0.235**
0.007
0.254**
0.003
0.103
0.132
0.164*
0.038
0.224**
0.008
0.223**
0.004
8 Defect rate -0.017
0.428
0.012
0.449
0.098
0.148
-0.040
0.330
0.004
0.471
0.036
0.318
0.037
0.330
9 Return on investment 0.189
*
0.020
0.205*
0.015
0.269**
0.002
0.160*
0.040
0.250**
0.003
0.242**
0.003
0.245**
0.002
10 Employee turnover 0.030
0.370
0.082
0.149
0.267**
0.002
0.057
0.227
-0.024
0.379
0.023
0.383
0.125
0.067
11 Survey of customer
satisfaction
-0.038
0.493
0.028
0.359
0.111
0.074
0.003
0.484
-0.055
0.236
-0.034
0.325
-0.002
0.492
12 Absentee rates 0.018
0.422
0.103
0.097
0.267**
0.002
0.128
0.081
-0.013
0.443
0.088
0.169
0.133
0.059
13 Number of warranty
claims
0.025
0.393
0.149
0.059
0.194*
0.019
0.005
0.477
0.048
0.302
0.125
0.088
0.133
0.059
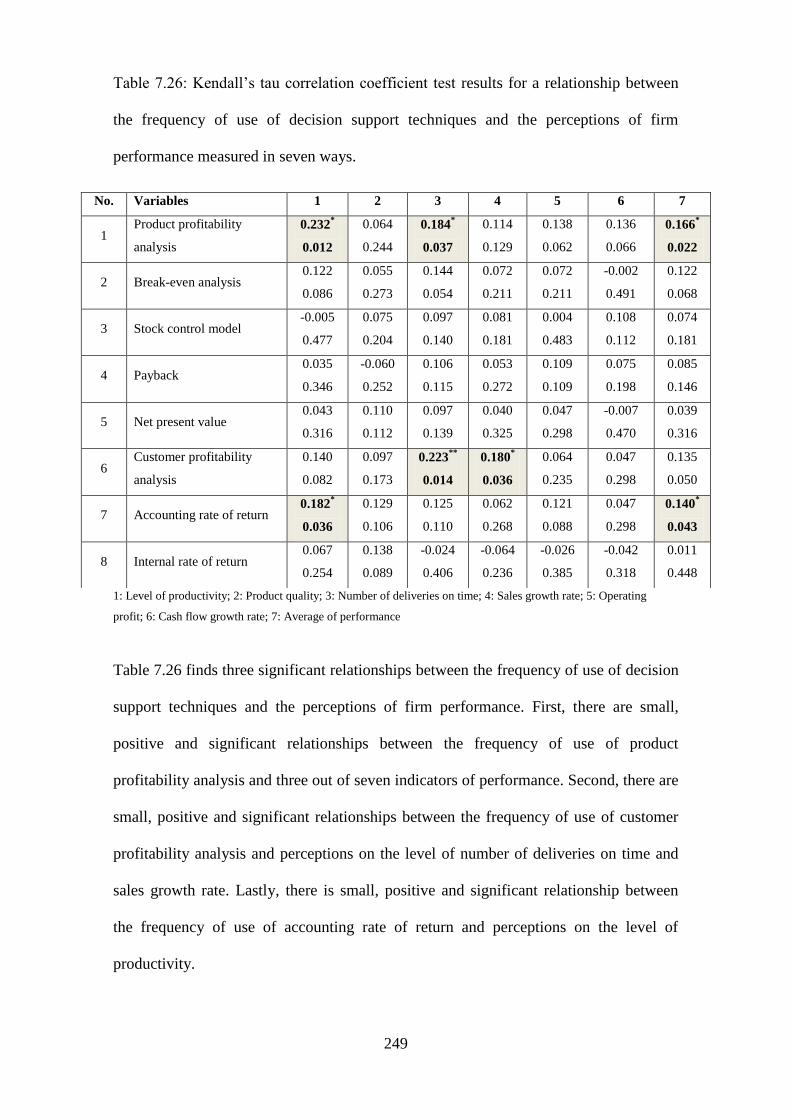
249
Table 7.26: Kendall‘s tau correlation coefficient test results for a relationship between
the frequency of use of decision support techniques and the perceptions of firm
performance measured in seven ways.
1: Level of productivity; 2: Product quality; 3: Number of deliveries on time; 4: Sales growth rate; 5: Operating
profit; 6: Cash flow growth rate; 7: Average of performance
Table 7.26 finds three significant relationships between the frequency of use of decision
support techniques and the perceptions of firm performance. First, there are small,
positive and significant relationships between the frequency of use of product
profitability analysis and three out of seven indicators of performance. Second, there are
small, positive and significant relationships between the frequency of use of customer
profitability analysis and perceptions on the level of number of deliveries on time and
sales growth rate. Lastly, there is small, positive and significant relationship between
the frequency of use of accounting rate of return and perceptions on the level of
productivity.
No. Variables 1 2 3 4 5 6 7
1 Product profitability
analysis
0.232*
0.012
0.064
0.244
0.184*
0.037
0.114
0.129
0.138
0.062
0.136
0.066
0.166*
0.022
2 Break-even analysis 0.122
0.086
0.055
0.273
0.144
0.054
0.072
0.211
0.072
0.211
-0.002
0.491
0.122
0.068
3 Stock control model -0.005
0.477
0.075
0.204
0.097
0.140
0.081
0.181
0.004
0.483
0.108
0.112
0.074
0.181
4 Payback 0.035
0.346
-0.060
0.252
0.106
0.115
0.053
0.272
0.109
0.109
0.075
0.198
0.085
0.146
5 Net present value 0.043
0.316
0.110
0.112
0.097
0.139
0.040
0.325
0.047
0.298
-0.007
0.470
0.039
0.316
6 Customer profitability
analysis
0.140
0.082
0.097
0.173
0.223**
0.014
0.180*
0.036
0.064
0.235
0.047
0.298
0.135
0.050
7 Accounting rate of return 0.182
*
0.036
0.129
0.106
0.125
0.110
0.062
0.268
0.121
0.088
0.047
0.298
0.140*
0.043
8 Internal rate of return 0.067
0.254
0.138
0.089
-0.024
0.406
-0.064
0.236
-0.026
0.385
-0.042
0.318
0.011
0.448
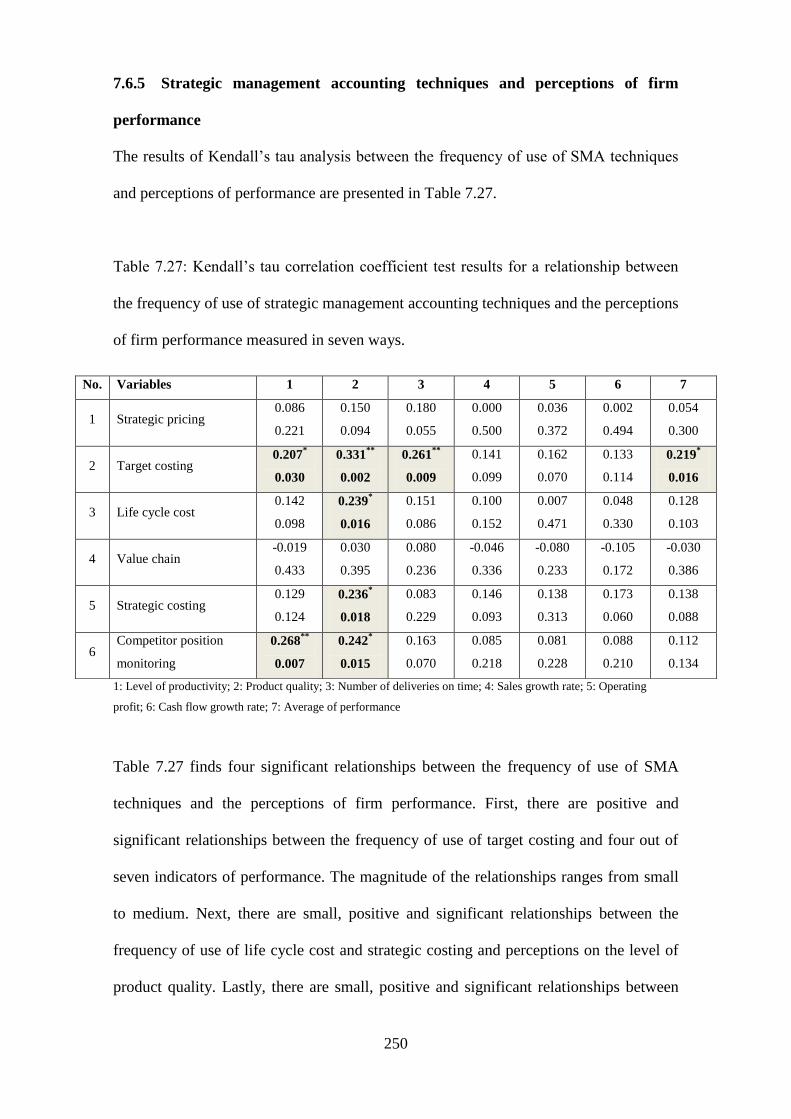
250
7.6.5 Strategic management accounting techniques and perceptions of firm
performance
The results of Kendall‘s tau analysis between the frequency of use of SMA techniques
and perceptions of performance are presented in Table 7.27.
Table 7.27: Kendall‘s tau correlation coefficient test results for a relationship between
the frequency of use of strategic management accounting techniques and the perceptions
of firm performance measured in seven ways.
1: Level of productivity; 2: Product quality; 3: Number of deliveries on time; 4: Sales growth rate; 5: Operating
profit; 6: Cash flow growth rate; 7: Average of performance
Table 7.27 finds four significant relationships between the frequency of use of SMA
techniques and the perceptions of firm performance. First, there are positive and
significant relationships between the frequency of use of target costing and four out of
seven indicators of performance. The magnitude of the relationships ranges from small
to medium. Next, there are small, positive and significant relationships between the
frequency of use of life cycle cost and strategic costing and perceptions on the level of
product quality. Lastly, there are small, positive and significant relationships between
No. Variables 1 2 3 4 5 6 7
1 Strategic pricing 0.086
0.221
0.150
0.094
0.180
0.055
0.000
0.500
0.036
0.372
0.002
0.494
0.054
0.300
2 Target costing 0.207
*
0.030
0.331**
0.002
0.261**
0.009
0.141
0.099
0.162
0.070
0.133
0.114
0.219*
0.016
3 Life cycle cost 0.142
0.098
0.239*
0.016
0.151
0.086
0.100
0.152
0.007
0.471
0.048
0.330
0.128
0.103
4 Value chain -0.019
0.433
0.030
0.395
0.080
0.236
-0.046
0.336
-0.080
0.233
-0.105
0.172
-0.030
0.386
5 Strategic costing 0.129
0.124
0.236*
0.018
0.083
0.229
0.146
0.093
0.138
0.313
0.173
0.060
0.138
0.088
6 Competitor position
monitoring
0.268**
0.007
0.242*
0.015
0.163
0.070
0.085
0.218
0.081
0.228
0.088
0.210
0.112
0.134
251
the frequency of use of competitor position monitoring and two out of seven indicators
of performance.
Summary
The analysis at the level of specific techniques provided some positive and significant
associations between the five main contingent variables and certain management
accounting techniques. The position revealed, as with the examination of the
relationship between MAPs and performance of firm, is not clear cut but a number of
points can be gleaned.
The majority of significant relationships with various measures of performance
perception arose with the frequency of use of techniques related to budgeting system
and performance evaluation system. Five out of eleven budgeting techniques which
represent full financial budgeting system have positive and significant relationships
with majority of indicators of perception of performance. The other three budgeting
techniques were significantly associated with at least half of the perception of
performance indicators. Under the performance evaluation system, five out of thirteen
performance evaluation techniques were significantly associated with at least 60%
indicators of perception of performance. The other four techniques were significantly
associated with one indicator of performance. These results suggest that the greater use
of certain budgeting and performance evaluation techniques will result in a higher level
of perceived performance in a number of areas.
There were also a few significant relationships between certain techniques under costing
systems, decision support systems and SMA and certain indicators of perceptions of
performance. Three out of six costing techniques are positively and significantly related
252
to certain indicators of perceptions of performance. Contract costing is significantly
associated with 87% of indicators of performance. Surprisingly, the use of variable
costing and ABC costing has negative and significant relationships with at least one
indicator of perceptions of performance. Three out of eight decision support techniques
are positively and significantly related with at least two indicators of perceptions of
performance. Lastly, four out of six SMA techniques are positively and significantly
related with at least one indicator of perception of performance. Target costing is the
most associated of the techniques as it has positive and significant relationships with
more than 50% of indicators of perceptions of performance.
Overall the additional tests have shown some interesting evidence for a relationship
between the use of management accounting techniques and the performance of a firm.
The use of both budgeting and performance evaluation techniques appear to be widely
associated with a large number of performance indicators thus suggesting that a careful
planning, controlling and monitoring of the firm performance can lead to the increase in
performance of firm at both operational and business level.
7.7 Summary
This chapter evaluates and reports on the results of the bivariate analysis of data
obtained from medium sized firms in the Malaysian manufacturing sector firstly to
explore for possible relationships between selected contingent variables and the use of
MAPs; and secondly to test whether there was any relationship between the use of
MAPs and perceptions of firm performance.
The methodological approach for the first area of study is based on contingency theory,
a theoretical perspective that emphasises how contingent factors such as technology and

253
environment affect the design and functioning of organisations (Abdel-Maksoud et al.,
2005). Otley, (1980) observed that the firm‘s management accounting system is a
significant element of its organisational structure and the features of an appropriate
accounting system will depend upon the specific circumstances that the company faces.
The contingency variables used in this study include those most commonly identified in
the contingency theory literature which are size of the firm, market environment
(intensity of market competition), and production technology (AMT). In addition
another two variables are added to the analysis; participation of the owner/manager of a
firm and the level of qualification of accounting staff since these are also among the
significant factors found in small business contingency theory studies related to
management or accounting. One control variable, industry type is also added as a sixth
variable because it is believed that there is possibility that the industry that the
respondent firms are in may have an impact on results.
The results of the bivariate analysis of the relationships between selected contingent
variables and the use of MAPs in terms of the five main categories show that the
direction of association of all 25 proposed sub-hypotheses was positive in line with the
hypothesised relationship. However of these hypotheses ten were accepted and the other
15 were rejected. Table 7.28 below presents the summary of accepted sub-hypotheses.
Table 7.28: Positive results of a test for a statistically significant relationship between
contingent variables and the use of management accounting practices.
Hypotheses
Size of firm (Annual sales turnover)
Costing system H1-1
Performance evaluation system H1-3
Intensity of market competition
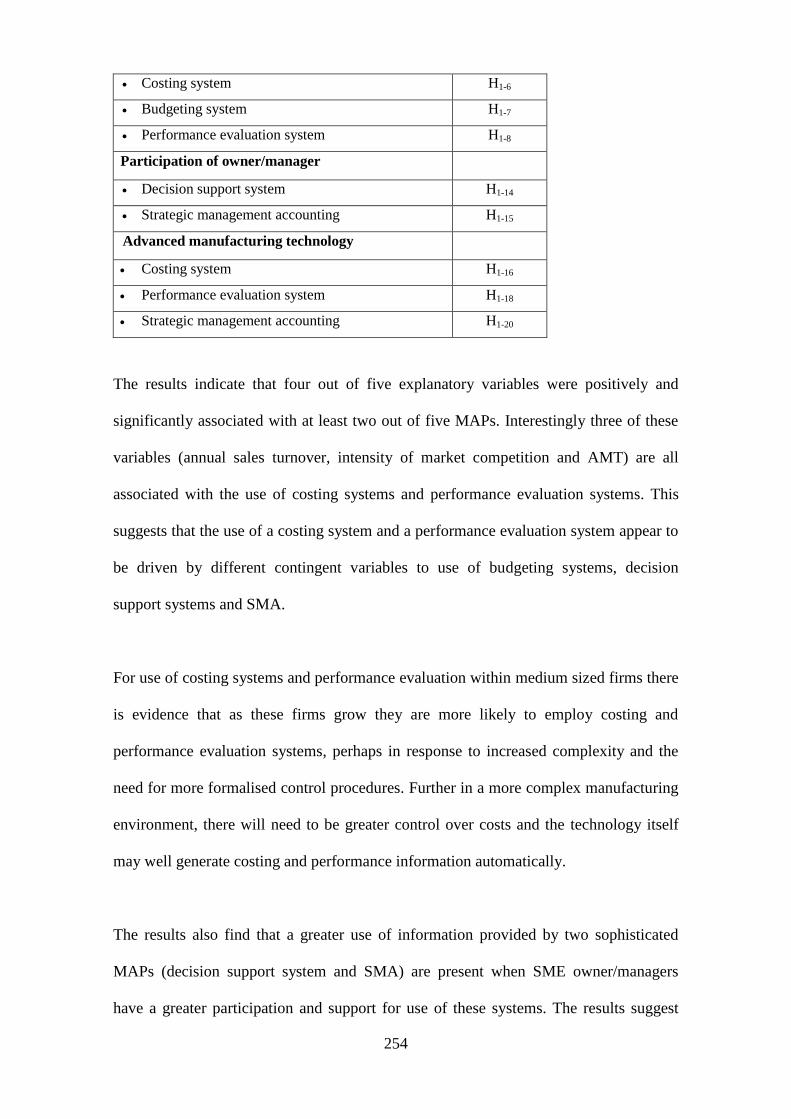
254
Costing system H1-6
Budgeting system H1-7
Performance evaluation system H1-8
Participation of owner/manager
Decision support system H1-14
Strategic management accounting H1-15
Advanced manufacturing technology
Costing system H1-16
Performance evaluation system H1-18
Strategic management accounting H1-20
The results indicate that four out of five explanatory variables were positively and
significantly associated with at least two out of five MAPs. Interestingly three of these
variables (annual sales turnover, intensity of market competition and AMT) are all
associated with the use of costing systems and performance evaluation systems. This
suggests that the use of a costing system and a performance evaluation system appear to
be driven by different contingent variables to use of budgeting systems, decision
support systems and SMA.
For use of costing systems and performance evaluation within medium sized firms there
is evidence that as these firms grow they are more likely to employ costing and
performance evaluation systems, perhaps in response to increased complexity and the
need for more formalised control procedures. Further in a more complex manufacturing
environment, there will need to be greater control over costs and the technology itself
may well generate costing and performance information automatically.
The results also find that a greater use of information provided by two sophisticated
MAPs (decision support system and SMA) are present when SME owner/managers
have a greater participation and support for use of these systems. The results suggest
255
that, in medium sized firms, the owner/manager may drive pressure for improved
information for decision support analysis and strategically information for planning and
controlling. The demand for the greater use of sophisticated MAPs might be attributed
to demands from the owner/manager of firm for information for handling more complex
decision making and also for helping them in strategic planning. Likewise, the greater
use of AMT has been positively and significantly associated with a higher level of use
of SMA which indicates that the improved information for strategic planning and
controlling is crucial in response to increased complexity in firm operations. The result
also indicates that intensity of market competition is the only variable that has a positive
and significant relationship with the use of budgeting systems. This suggests that as the
medium sized firms face more intense competition, they are more likely to utilize more
formalized planning through the use of budgeting systems. Overall the results suggest
that intensity of market competition and the use of AMT appears the most significant
contingent variables associate with the wider use of MAPs among medium sized firms
in Malaysia.
Lastly the results do not suggest any significant relationship between industry type and
the use of MAPs. This indicates that the use of the five categories of MAPs is
unaffected by the industry in which the respondents operate.
The additional analyses of a relationship between contingency factors and management
accounting techniques also confirmed that intensity of market competition;
owner/manager participation; and AMT appear to associate with nearly half of the
management accounting techniques listed, thus suggesting that these are the crucial
contingent factors that would affect the level of adoption of management accounting
techniques in medium sized firms.
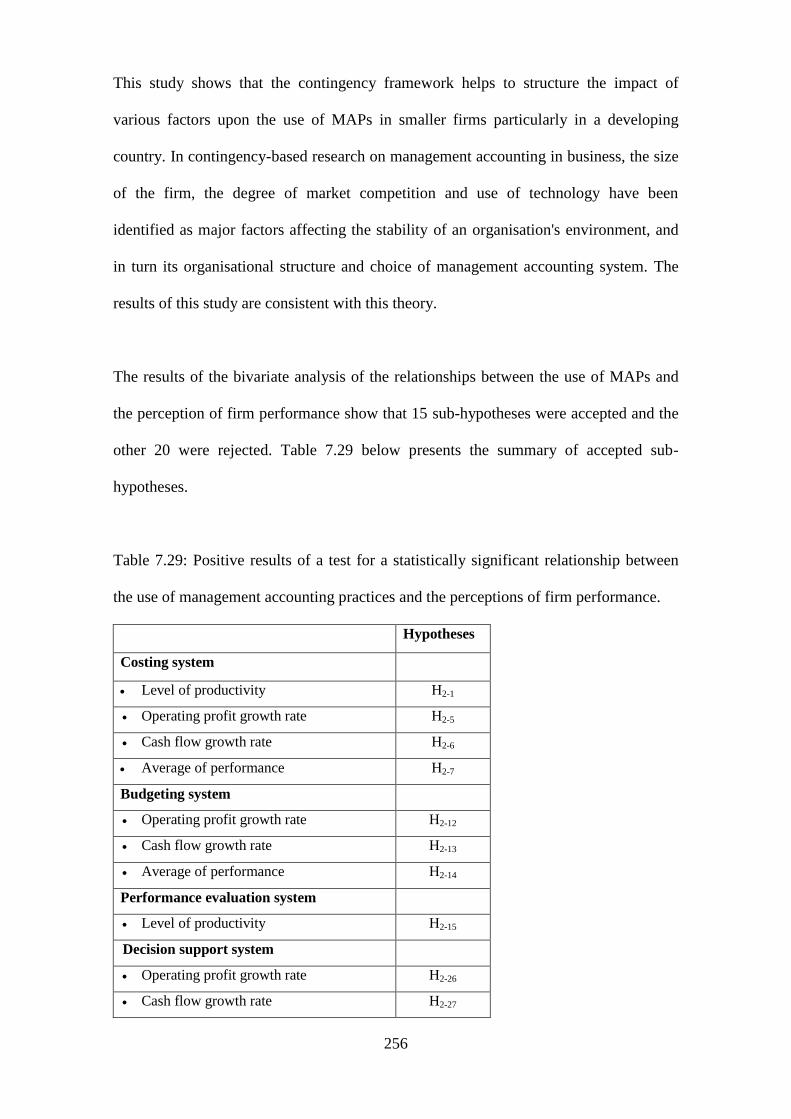
256
This study shows that the contingency framework helps to structure the impact of
various factors upon the use of MAPs in smaller firms particularly in a developing
country. In contingency-based research on management accounting in business, the size
of the firm, the degree of market competition and use of technology have been
identified as major factors affecting the stability of an organisation's environment, and
in turn its organisational structure and choice of management accounting system. The
results of this study are consistent with this theory.
The results of the bivariate analysis of the relationships between the use of MAPs and
the perception of firm performance show that 15 sub-hypotheses were accepted and the
other 20 were rejected. Table 7.29 below presents the summary of accepted sub-
hypotheses.
Table 7.29: Positive results of a test for a statistically significant relationship between
the use of management accounting practices and the perceptions of firm performance.
Hypotheses
Costing system
Level of productivity H2-1
Operating profit growth rate H2-5
Cash flow growth rate H2-6
Average of performance H2-7
Budgeting system
Operating profit growth rate H2-12
Cash flow growth rate H2-13
Average of performance H2-14
Performance evaluation system
Level of productivity H2-15
Decision support system
Operating profit growth rate H2-26
Cash flow growth rate H2-27
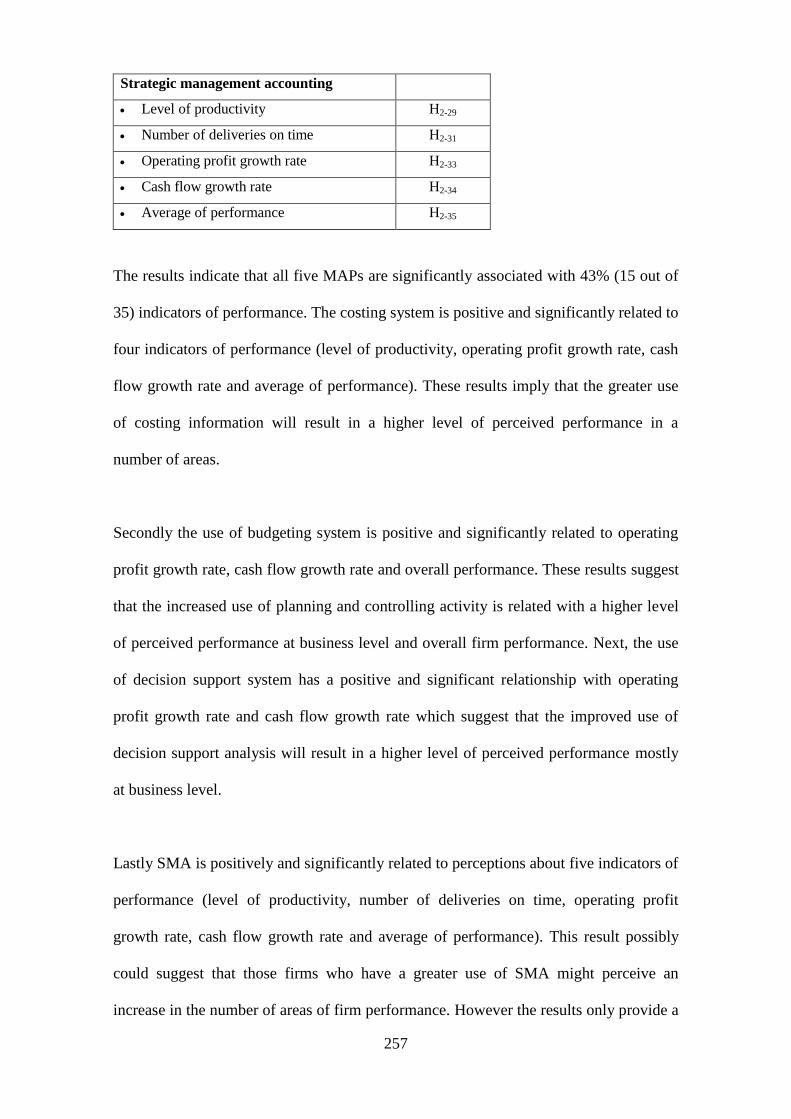
257
Strategic management accounting
Level of productivity H2-29
Number of deliveries on time H2-31
Operating profit growth rate H2-33
Cash flow growth rate H2-34
Average of performance H2-35
The results indicate that all five MAPs are significantly associated with 43% (15 out of
35) indicators of performance. The costing system is positive and significantly related to
four indicators of performance (level of productivity, operating profit growth rate, cash
flow growth rate and average of performance). These results imply that the greater use
of costing information will result in a higher level of perceived performance in a
number of areas.
Secondly the use of budgeting system is positive and significantly related to operating
profit growth rate, cash flow growth rate and overall performance. These results suggest
that the increased use of planning and controlling activity is related with a higher level
of perceived performance at business level and overall firm performance. Next, the use
of decision support system has a positive and significant relationship with operating
profit growth rate and cash flow growth rate which suggest that the improved use of
decision support analysis will result in a higher level of perceived performance mostly
at business level.
Lastly SMA is positively and significantly related to perceptions about five indicators of
performance (level of productivity, number of deliveries on time, operating profit
growth rate, cash flow growth rate and average of performance). This result possibly
could suggest that those firms who have a greater use of SMA might perceive an
increase in the number of areas of firm performance. However the results only provide a
258
limited evidence for a significant relationship between the use of performance
evaluation systems and performance.
In general there are some supports for the second hypothesized relationship to the effect
that the use of MAPs is associated with in statistically significant increases in
perceptions of performance. A higher use of SMA appears to be associated with wide
area of performance thus suggesting that this practice is one of the crucial practices that
can possibly help to increase the performance of the medium sized firms. An additional
analysis based on specific management accounting techniques also found some
evidence of significant associations between the use of management accounting
techniques and performance. Overall, there are evidences for the positive relationships
between the use of MAPs and performance although most of the strengths of the
relationships are small. Hence the results also suggest that the use of MAPs alone will
not improve the performance of firms but nevertheless there may be other
complementary or synergistic factors inside or outside of the firms that might affect
performance.
The analysis in this chapter has explored only the single relationship between each
contingent variable and the extent of the use of MAPs and also the single relationship
between the use of MAPs and perceptions of performance. The analysis did not identify
the interrelationships among variables in explaining variation in the extent of using
MAPs and different level of performance. Moreover, bivariate analyses may overstate
the apparent overall explanatory power of a set of variables (independent variables).
Therefore a more sophisticated analysis based on multivariate regression will be
employed to seek additional evidence regarding the hypothesised relationships.
259
Chapter 8
Multivariate analysis
8.1 Introduction
The previous chapter reported the results of tests aimed at establishing whether there
were any statistically significant associations between the use of MAPs and individual
explanatory variables derived from contingency theory. The chapter also examined
whether there were any relationships between the use of MAPs and perceptions of firm
performance within Malaysian medium-sized firms in the manufacturing sector. This
chapter will extend the analysis in order to seek to answer the following two questions,
namely what is the influence of selected contingent variables on the use of MAPs if the
interactive effect between explanatory variables is taken into account, and what is the
influence of the use of MAPs on firm performance if the interactive effect between
explanatory variables is taken into account. These questions will be answered by
conducting multivariate tests using logistic (logit) regression analysis on 110 Malaysian
medium sized firms in the manufacturing sector. The next section explains the
justification for using logistic regression analysis.
8.2 Logistic regression analysis
Multivariate regression analysis is a statistical technique that examines the association
between a single dependent variable and a number of independent variables (Hair et al.,
1998). Conducting multivariate regression analysis minimises the possibility of
overstating the apparent overall explanatory power of a group of independent variables
which could occur using a series of bivariate analyses (Patton and Zelenka, 1997).
260
Multiple regression analysis or the regression model is the most commonly used
statistical method in social sciences (Long, 1997). This method has become an integral
component of data analysis concerned with describing the relationship between a
response variable and one or more explanatory variables. The regression model assumes
that the dependent variable is continuous and has been measured for all cases in the
sample. Yet, many outcomes of fundamental interest to social scientists are not
continuous or are not observed for all cases (Long, 1997). In such cases, logistic
regression provides an alternative. This analysis is the natural complement of the
regression model as it is specifically designed for categorical dependent variables.
Hence it can be seen over the last decade the logistic regression model has become, in
many fields, the standard method of analysis if the outcome variable is discrete (Hosmer
and Lemeshow, 1989). Since the dependent variables of this study are in categorical
forms, logistic regression analysis is chosen for multivariate analysis purpose.
Furthermore, this approach has been widely used and reported in management
accounting research (see Holmes and Nicholls, 1989; Kaplan and Mackey, 1992;
Bjornenak, 1997; Gosselin, 1999; Ittner et al., 2002; Said et al., 2003; and Al-Omiri,
2003).
The choice of logistic regression analysis depends on the nature of the categorical
variables. Long (1997) stated that categorical or limited dependent variables can be in
several forms i.e binary, nominal, ordinal, censored and count variables. Once the form
of the dependent variable is determined, it must be matched to the model used for the
type of categorical variable. If the model does not match the measurement scale of the
dependent variable, the estimates from the model could be biased, inefficient, or simply
inappropriate (Long, 1997). Binary logit and probit models are appropriate for binary
outcomes. The ordered logit and probit models explicitly deal with the ordered nature
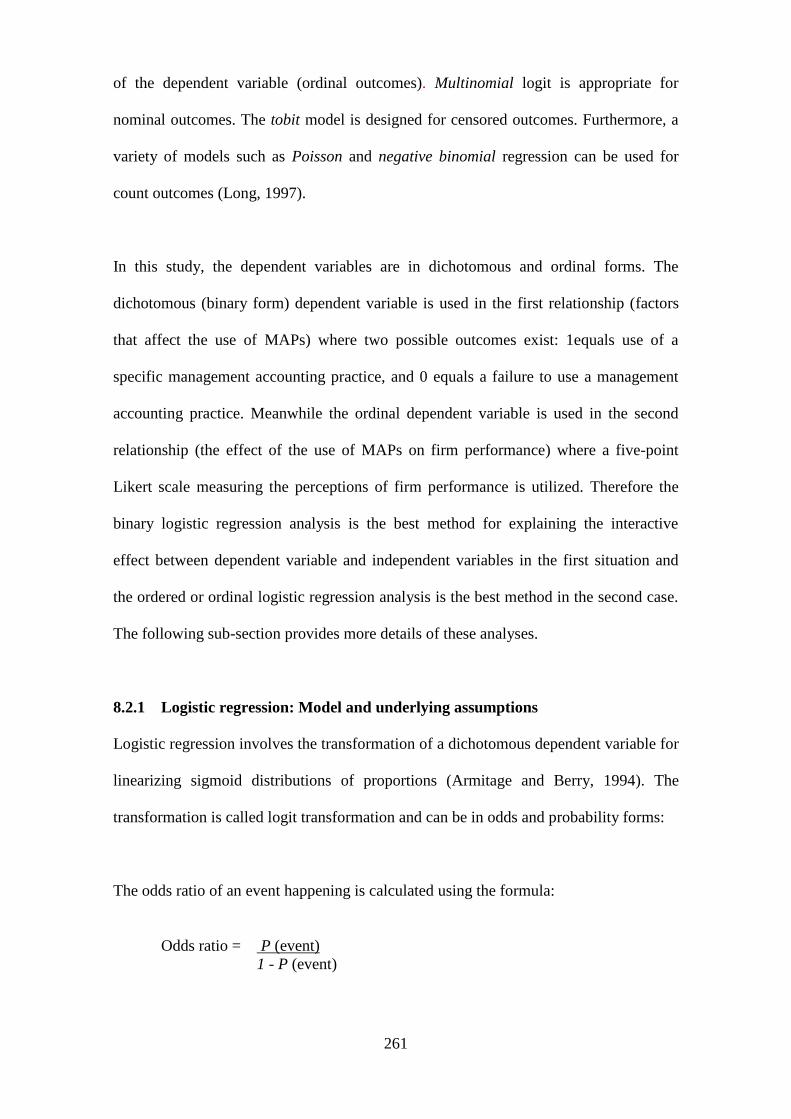
261
of the dependent variable (ordinal outcomes). Multinomial logit is appropriate for
nominal outcomes. The tobit model is designed for censored outcomes. Furthermore, a
variety of models such as Poisson and negative binomial regression can be used for
count outcomes (Long, 1997).
In this study, the dependent variables are in dichotomous and ordinal forms. The
dichotomous (binary form) dependent variable is used in the first relationship (factors
that affect the use of MAPs) where two possible outcomes exist: 1equals use of a
specific management accounting practice, and 0 equals a failure to use a management
accounting practice. Meanwhile the ordinal dependent variable is used in the second
relationship (the effect of the use of MAPs on firm performance) where a five-point
Likert scale measuring the perceptions of firm performance is utilized. Therefore the
binary logistic regression analysis is the best method for explaining the interactive
effect between dependent variable and independent variables in the first situation and
the ordered or ordinal logistic regression analysis is the best method in the second case.
The following sub-section provides more details of these analyses.
8.2.1 Logistic regression: Model and underlying assumptions
Logistic regression involves the transformation of a dichotomous dependent variable for
linearizing sigmoid distributions of proportions (Armitage and Berry, 1994). The
transformation is called logit transformation and can be in odds and probability forms:
The odds ratio of an event happening is calculated using the formula:
Odds ratio = P (event)
1 - P (event)
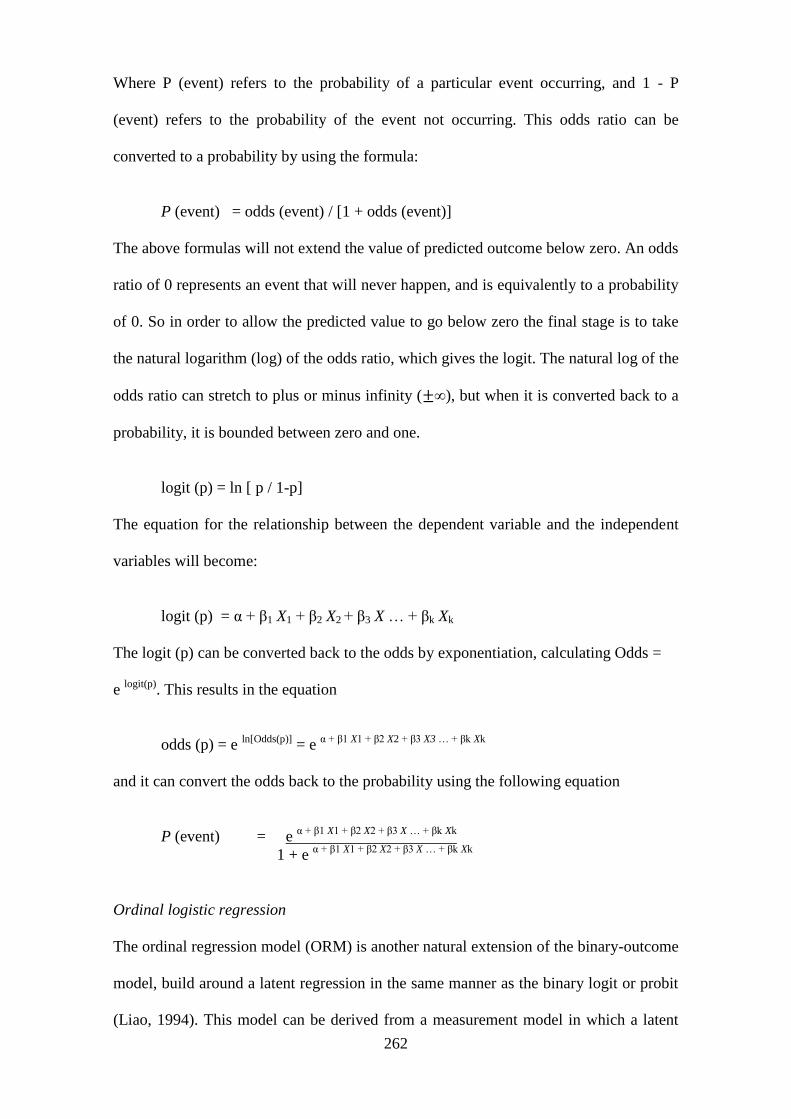
262
Where P (event) refers to the probability of a particular event occurring, and 1 - P
(event) refers to the probability of the event not occurring. This odds ratio can be
converted to a probability by using the formula:
P (event) = odds (event) / [1 + odds (event)]
The above formulas will not extend the value of predicted outcome below zero. An odds
ratio of 0 represents an event that will never happen, and is equivalently to a probability
of 0. So in order to allow the predicted value to go below zero the final stage is to take
the natural logarithm (log) of the odds ratio, which gives the logit. The natural log of the
odds ratio can stretch to plus or minus infinity (±∞), but when it is converted back to a
probability, it is bounded between zero and one.
logit (p) = ln [ p / 1-p]
The equation for the relationship between the dependent variable and the independent
variables will become:
logit (p) = α + β1 X1 + β2 X2 + β3 X … + βk Xk
The logit (p) can be converted back to the odds by exponentiation, calculating Odds =
e logit(p)
. This results in the equation
odds (p) = e ln[Odds(p)]
= e α + β1 X1 + β2 X2 + β3 X3 … + βk Xk
and it can convert the odds back to the probability using the following equation
P (event) = e α + β1 X1 + β2 X2 + β3 X … + βk Xk
1 + e α + β1 X1 + β2 X2 + β3 X … + βk Xk
Ordinal logistic regression
The ordinal regression model (ORM) is another natural extension of the binary-outcome
model, build around a latent regression in the same manner as the binary logit or probit
(Liao, 1994). This model can be derived from a measurement model in which a latent
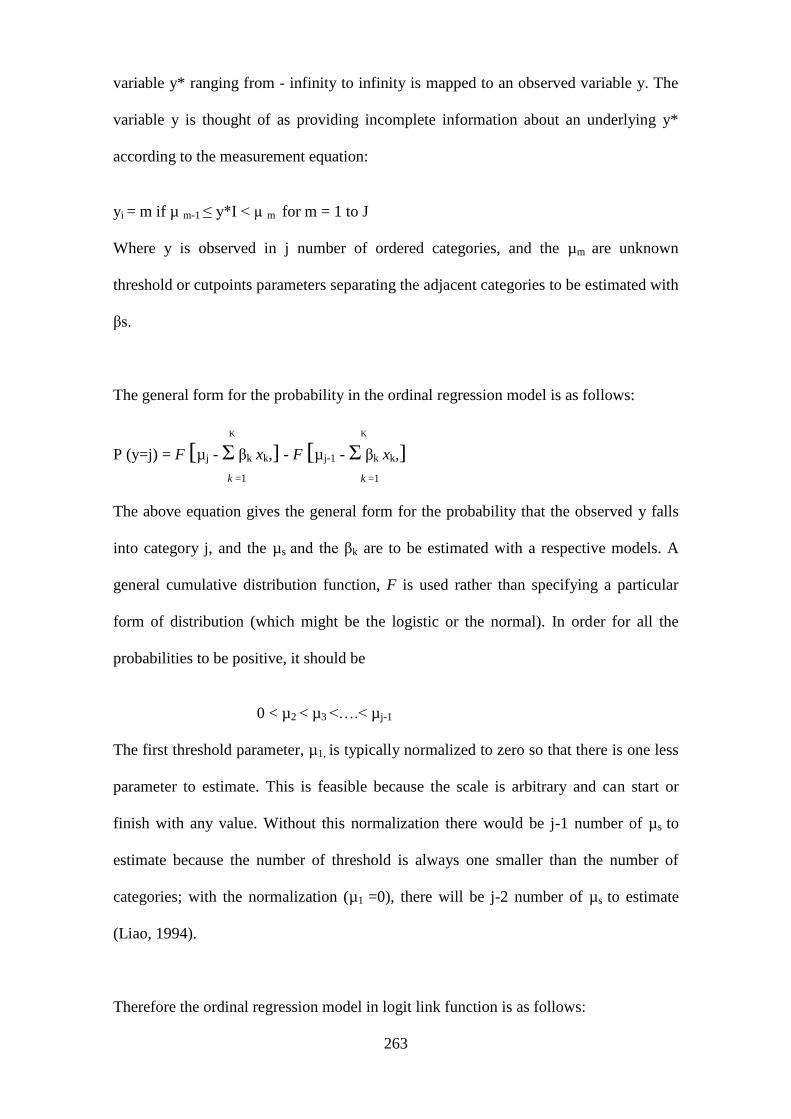
263
variable y* ranging from - infinity to infinity is mapped to an observed variable y. The
variable y is thought of as providing incomplete information about an underlying y*
according to the measurement equation:
yi = m if µ m-1 ≤ y*I < µ m for m = 1 to J
Where y is observed in j number of ordered categories, and the µm are unknown
threshold or cutpoints parameters separating the adjacent categories to be estimated with
βs.
The general form for the probability in the ordinal regression model is as follows:
K K
P (y=j) = F [µj - Σ βk xk,] - F [µj-1 - Σ βk xk,]
k =1 k =1
The above equation gives the general form for the probability that the observed y falls
into category j, and the µs and the βk are to be estimated with a respective models. A
general cumulative distribution function, F is used rather than specifying a particular
form of distribution (which might be the logistic or the normal). In order for all the
probabilities to be positive, it should be
0 < µ2 < µ3 <….< µj-1
The first threshold parameter, µ1, is typically normalized to zero so that there is one less
parameter to estimate. This is feasible because the scale is arbitrary and can start or
finish with any value. Without this normalization there would be j-1 number of µs to
estimate because the number of threshold is always one smaller than the number of
categories; with the normalization (µ1 =0), there will be j-2 number of µs to estimate
(Liao, 1994).
Therefore the ordinal regression model in logit link function is as follows:

264
The ordinal logit model
K
log [P(y ≤ j | x / 1- P (P(y ≤ j | x )] = µj – Σ βk xk, j=1,2,….j-1 k =1
The only difference between the ordinal and the binary logit model is that the ordinal
outcome model allows a sequence of log-odds or logit specified with the same βs and xs
but different µs. The left hand side of the ordinal model is also called a cumulative logit
(Agresti, 1990). The same logit relation in probability can be expressed as following:
K
P(y ≤ j) = p (y* ≤ µj) = e µj – Σ βk xk
K
1+ e µj – Σ βk xk
k =1
Assumptions in regression analysis
Most statistical tests rely upon certain assumptions about the variables used in the
analysis. When these assumptions are not met the results may not be trustworthy,
resulting in a Type I or Type II error, or over- or under-estimation of significance or
effect size (Osbournes and Waters, 2002). In regression analysis, the assumptions are
made based on ordinary least squares (OLS) algorithms. Following are the specific
assumptions that must be satisfied in OLS:
1. Measurement: All independent variables are interval, ratio, or dichotomous, and the
dependent variable is continuous, unbounded and measured on an interval or ratio
scale. All variables are measured without error.
2. Specification: (a) all relevant predictors of the dependent variable are included in
the analysis, (b) no irrelevant predictors of the dependent variable are included in
the analysis, and (c) the form of the relationship (allowing for transformations of
dependent or independent variables) is linear.
3. Expected value of error: Expected value of the error, ε is zero.

265
4. Homoscedasticity: The variance of the error term, ε is the same, or constant, for all
values of the independent variables.
5. Normality of errors: The errors are normally distributed for each set of values of the
independent variables.
6. No autocorrelation: there is no correlation among the error terms produced by
different values of the independent variables. Mathematically E (εi, εj)=0
7. No correlation between the error terms and the independent variables: The error
terms are uncorrelated with the independent variables Mathematically E (εi, Xj)=0
8. Absence of perfect multicollinearity: for multiple regression, none of the
independent variables is a perfect linear combination of the other independent
variables.
When a dichotomous dependent variable is involved, logistic regression is designed to
provide an alternative to the OLS approach. Logistic regression does not require many
of the key assumptions of linear regression that are based on OLS algorithms
particularly regarding linearity, normality, homoscedasticity, and measurement level17
.
Firstly, since proportions and probabilities are bounded by 0 and 1, the logistic
regression does not need a linear relationship between the dependent and independent
variables. It can handle all sorts of relationships, because the technique applies a non-
linear log transformation to the predicted odds ratio. Secondly, the independent
variables do not need to be normally distributed – although multivariate normality
yields a more stable solution. Also the error terms (the residuals) do not need to be
normally distributed. Thirdly, homoscedasticity is not needed. Logistic regression does
not need variances to be heteroscedastic for each level of the independent variables.
Lastly, it can handle ordinal and nominal data as independent variables. The
17
http://www.statisticssolutions.com/resources/directory-of-statistical-analyses/assumptions-of-logistic-
regression
266
independent variables do not need to be metric (interval or ratio scaled). However, the
technique does have the following underlying assumptions according to Aldrich and
Nelson (1984):
(i) The dependent random variable, Y is binary (0,1). The outcomes on the dependent
variable are assumed to be mutually exclusive and exhaustive;
(ii) The dependent variable is dependent on one or more observable exogenous
variables;
(iii) The relationship between the dependent and the independent variables is related in
the manner assumed by the transformation used in logit or probit.
(iv) Model should have little or no multicollinearity. There must be no exact linear
dependencies among the independent variables. If this exists then problems of
computational imprecision, unstable estimates and large sampling error may
occur.
As discussed previously, the first dependent variable used in the analysis is in binary
form therefore the first underlying assumption was met. The second dependent variable
will use an ordinal regression model, which is an extension of the binary logit model,
for dependent variables in an ordinal form. In terms of choice link functions, both
models (binary and ordinal) will be transformed by using a logit function. An
alternative would have been the probit model but as Long (1997) states the choice
between the logit and probit models is largely one of convenience and convention, since
the substantive results are generally indistinguishable. For some users, the simple
interpretation of logit coefficients as odds ratios is the deciding factor. Basically the
choice between these models largely depends on individual preferences (Long, 1997)
and the logit model is preferred as it is familiar to the researcher.

267
8.2.2 Multicollinearity between independent variables
Multicollinearity exists when some or all of the independent variables are highly
correlated (Field, 2001). When this condition exists, the estimated regression
coefficients can fluctuate widely from sample to sample, making it risky to use the
coefficients as an indicator of the relative importance of predictor variables (Cooper and
Emory, 1995). In order to examine whether or not multicollinearity problems exist in
multivariate analysis, most previous studies and statistical literature examined the issue
through a correlation matrix of all the independent variables in the regression model. If
the correlation analysis reports a very high association among these independent
variables, this means that a multicollinearity problem exists. Correlation coefficients
should not be considered harmful until they exceed 0.80 (Hair et al., 2007). Tables 8.1
and 8.2 show the correlation results for all independent variables used in future
hypothesis testing.
Analysis of independent variables (contingent variables) under the first hypothesis
Table 8.1: Correlation matrix between five contingent variables.
Size Competition Participation AMT Qualification
Size 1.000
Market competition 0.162 1.000
Participation 0.067 0.021 1.000
AMT 0.029 0.150 0.147 1.000
Qualification 0.045 0.066 0.057 0.061 1.000
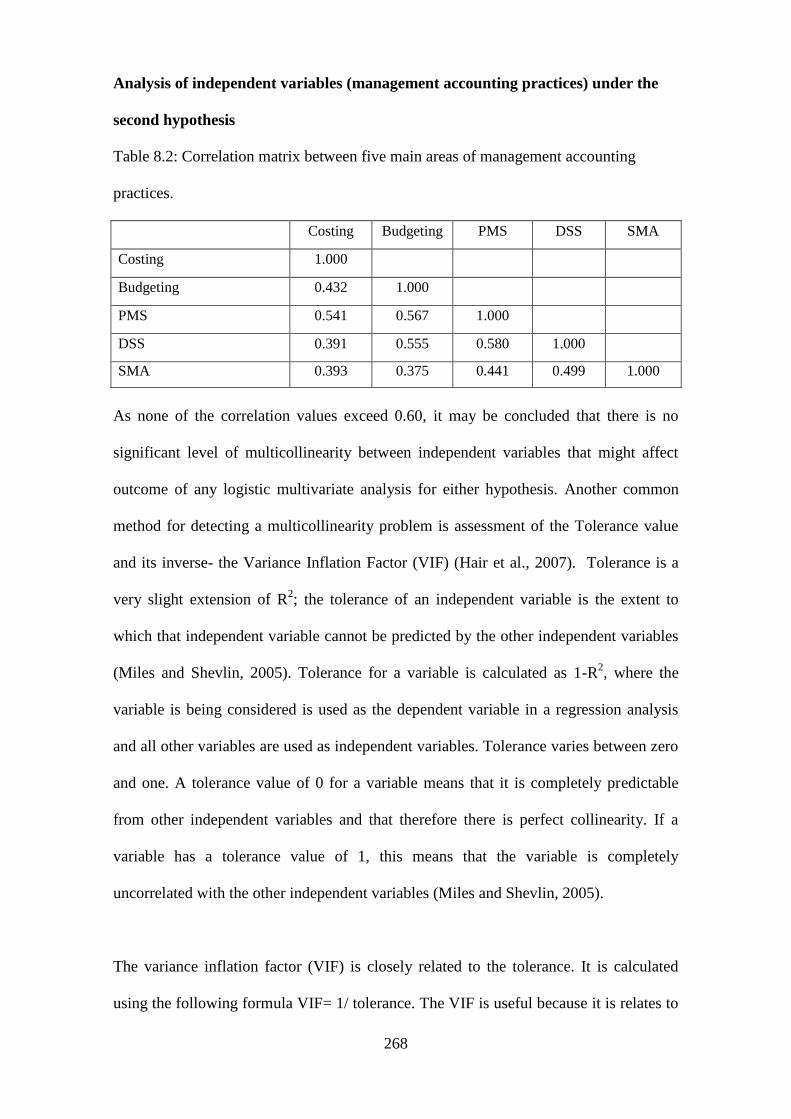
268
Analysis of independent variables (management accounting practices) under the
second hypothesis
Table 8.2: Correlation matrix between five main areas of management accounting
practices.
Costing Budgeting PMS DSS SMA
Costing 1.000
Budgeting 0.432 1.000
PMS 0.541 0.567 1.000
DSS 0.391 0.555 0.580 1.000
SMA 0.393 0.375 0.441 0.499 1.000
As none of the correlation values exceed 0.60, it may be concluded that there is no
significant level of multicollinearity between independent variables that might affect
outcome of any logistic multivariate analysis for either hypothesis. Another common
method for detecting a multicollinearity problem is assessment of the Tolerance value
and its inverse- the Variance Inflation Factor (VIF) (Hair et al., 2007). Tolerance is a
very slight extension of R2; the tolerance of an independent variable is the extent to
which that independent variable cannot be predicted by the other independent variables
(Miles and Shevlin, 2005). Tolerance for a variable is calculated as 1-R2, where the
variable is being considered is used as the dependent variable in a regression analysis
and all other variables are used as independent variables. Tolerance varies between zero
and one. A tolerance value of 0 for a variable means that it is completely predictable
from other independent variables and that therefore there is perfect collinearity. If a
variable has a tolerance value of 1, this means that the variable is completely
uncorrelated with the other independent variables (Miles and Shevlin, 2005).
The variance inflation factor (VIF) is closely related to the tolerance. It is calculated
using the following formula VIF= 1/ tolerance. The VIF is useful because it is relates to

269
the amount that the standard error of the variable has been increased because of
collinearity (Miles and Shevlin, 2005). Overall, both the Tolerance value and the VIF
value reflect the strength of the relationship among independent variables included in
the regression analysis. Hair et al. (2006) recommend that a very small tolerance value
(0.10 or below) or a large VIF value (10 or above) are regarded as an indication of the
existence of a multicollinearity problem. The tests as shown in Table 8.3 indicated that
no VIF exceeded the threshold value of 10 (the highest VIF was 2.049) and the
tolerance values indicated that collinearity does not explain more than 10% of any
independent variable's variance. Thus, no support was found for the existence of
multicollinearity. Therefore the requirement for logit analysis that there is an absence of
multicollinearity has been satisfied.
Table 8.3: Collinearity statistics
Collinearity statistics
Tolerance VIF
Annual sales turnover 0.973 1.028
Market competition 0.959 1.042
Participation 0.963 1.039
AMT 0.969 1.032
Qualification 0.968 1.033
Costing 0.646 1.548
Budgeting 0.564 1.772
PMS 0.488 2.049
DSS 0.542 1.845
SMA 0.699 1.431
These tests confirm the conclusion from Tables 8.1 and 8.2 to the effect that there is no
significant level of multicollinearity between independent variables that might affect the
outcome for either hypothesis of any logistic multivariate analysis.
270
8.3 Important statistics in the logistic regression analysis
The following sections present the results of the final models for logistic regression
analysis. These results consist of the following important statistics that determine the
robustness of the model and the significance of independent variables.
1. Model fitting analysis
There are two approaches to testing the null hypothesis that the predictor does not affect
the response, or H0 : ß = 0 namely Wald test and Likelihood ratio test. The Wald test is
analogous to the t-test, as it is designed to test one slope parameter at a time, whereas
the likelihood ratio test is analogous to the F-test as it can test several slope parameters
at one (Azen and Walker,2011). According to Silva and Abreu (2010) a "likelihood" is a
probability, specifically the probability that the observed values of the dependent
variable may be predicted from the observed values of the independent variables. The
log likelihood (LL) is its log, this varying from 0 to minus infinity. LL is calculated
through iteration, using maximum likelihood estimation. Because -2LL has
approximately a Chi-Square distribution, it can be used for assessing the significance of
logistic regression (Silva and Abreu, 2010). Therefore for the purpose of the analysis,
the Chi-Square -2 log likelihood test will be used to to determine if the overall model is
statistically significant (p<0.05) and to measure of how well the independent variables
affect the outcome or dependent variable, whereas the Wald test statistics to determine
if the individual the predictor is statistically significant (p<0.05).
2. Goodness-of-fit coefficients
While in a linear regression model the coefficient of determination R2 is the standard
measure of fit, there is no clear choice for models with categorical outcomes (Long,
1997). There have been numerous attempts to construct a counterpart to R2 but no one
271
measure is clearly superior and none has the advantages of a clear interpretation in
terms of explained variation (Long, 1997). A wide variety of pseudo-R-squares
measures (e.g. Cox and Snell's, Nagelkerke's, and McFadden's) have been proposed to
evaluate the goodness-of-fit of logistic models. The model-fitting statistic measures the
success of the model in explaining the variations in the data (Chen and Hughes, 2004).
According to Silva and Abreu (2010) the name "pseudo" is due to the fact that these
coefficients look like R-squared in the sense that they are on a similar scale, ranging
from 0 to 1 with higher values indicating better model fit. The pseudo R square is
calculated depending upon the likelihood ratio. The Cox and Snell's coefficient is an
attempt to imitate the interpretation of multiple R-Square based on the log likelihood of
the final model versus the log likelihood for the baseline model, but its maximum value
can be (and usually is) less than 1.0 making it difficult to interpret. The Nagelkerke's
coefficient is a modification of Cox and Snell undertaken to ensure that the outcome is
between 0 and 1. This is achieved because the Nagelkerke's R2 divides Cox and Snell's
by its maximum in order to achieve a measure that ranges from 0 to 1. Therefore,
Nagelkerke's R2 will normally be higher than the Cox and Snell measure. Lastly, the
McFadden's coefficient is a less common pseudo-R2 variant, based on loglikelihood
kernels for the full versus the intercept-only model (Silva and Abreu, 2010).
3. The logistic regression coefficients
The logistic regression coefficients (B) indicate the amount of change expected in the
log odds when there is a one unit change in the predictor variable with all of the other
variables in the model held constant. A coefficient close to 0 suggests that there is no
change due to the predictor variable18
. Meanwhile Exp (B) is the odds ratios for the
predictor. This value is given by default because odds ratios can be easier to interpret
18
http://www.ats.ucla.edu/stat/sas/notes2/

272
than the coefficient, which is in log-odds units. The following two sections provide the
separate analyses for relationship one and two.
8.4 Binary logistic regression analysis testing for a relationship between the use
of management accounting practices and a range of contingent factors.
In this section, the regression analysis seeks to answer the question ‗what is the
influence of selected contingent variables on the use of MAPs if the interactive effect
between explanatory variables is taken into account‘. A binary logit model or logistic
regression model is used to facilitate the analysis since the dependent variable is in
binary form with the two possible outcomes in the forms: 1= use of a specific
management accounting practice; and 0 = no use of a specific management accounting
practice. The details are shown in Table 8.4 below.
Table 8.4: A summary of the type of data of independent and dependent variables for
testing the first hypothesis
Details Type of data Code
Dependent variable
Costing system No /Yes Binary 0,1
Budgeting system No /Yes Binary 0,1
Performance evaluation system No /Yes Binary 0,1
Decision support system No /Yes Binary 0,1
Strategic management accounting No /Yes Binary 0,1
Independent variable
Size of the firm (Sales turnover) Ranking Ordinal 1,2,3,4
Market competition 5-Likert scale Ordinal 1,2,3,4,5
Participation of owner/manager 5-Likert scale Ordinal 1,2,3,4,5
Advanced manufacturing technology 5-Likert scale Ordinal Composite index*
(1,2,3,4,5)
Qualification of accounting staff Ranking Ordinal 0,1,2,3,4
* The development of the composite index can be seen earlier in section 6.5.4 of chapter 6.
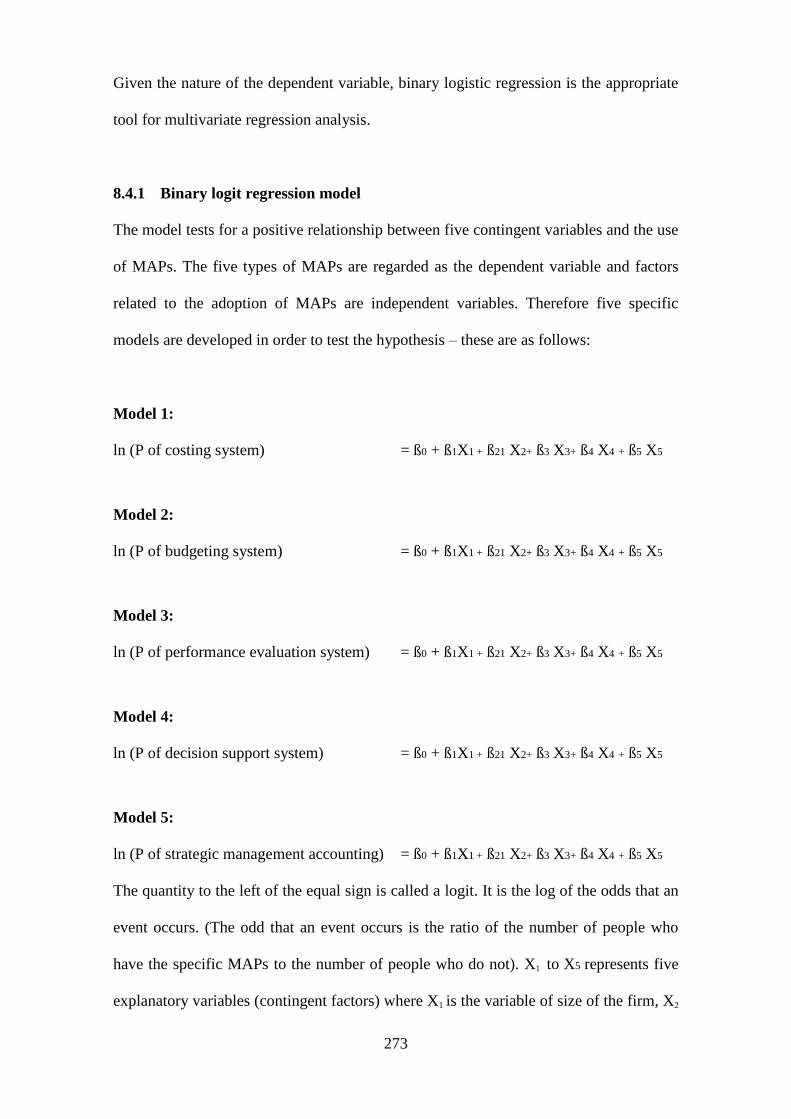
273
Given the nature of the dependent variable, binary logistic regression is the appropriate
tool for multivariate regression analysis.
8.4.1 Binary logit regression model
The model tests for a positive relationship between five contingent variables and the use
of MAPs. The five types of MAPs are regarded as the dependent variable and factors
related to the adoption of MAPs are independent variables. Therefore five specific
models are developed in order to test the hypothesis – these are as follows:
Model 1:
ln (P of costing system) = ß0 + ß1X1 + ß21 X2+ ß3 X3+ ß4 X4 + ß5 X5
Model 2:
ln (P of budgeting system) = ß0 + ß1X1 + ß21 X2+ ß3 X3+ ß4 X4 + ß5 X5
Model 3:
ln (P of performance evaluation system) = ß0 + ß1X1 + ß21 X2+ ß3 X3+ ß4 X4 + ß5 X5
Model 4:
ln (P of decision support system) = ß0 + ß1X1 + ß21 X2+ ß3 X3+ ß4 X4 + ß5 X5
Model 5:
ln (P of strategic management accounting) = ß0 + ß1X1 + ß21 X2+ ß3 X3+ ß4 X4 + ß5 X5
The quantity to the left of the equal sign is called a logit. It is the log of the odds that an
event occurs. (The odd that an event occurs is the ratio of the number of people who
have the specific MAPs to the number of people who do not). X1 to X5 represents five
explanatory variables (contingent factors) where X1 is the variable of size of the firm, X2

274
is the variable the intensity of market competition, X3, is the variable of participation of
owners/directors of firms, X4 is variable of the use of advanced manufacturing
technology and X5 is the level of the qualification of accounting staff.
Given the discussion on whether or not the level of qualification of accounting staff is
an exogenous or endogenous variable (see Chapter 4, section 4.4.4) the analyses will be
run with and without this variable. The analyses reported in the next five sections will
first looking at the regression without inclusion of the variable for the level of
qualification of accounting staff.
8.4.2 Factors that affect the use of a costing system
Table 8.5 reports the result of binary logistic regression of a model relating to the
contingent factors that affect the use of a costing system.
Table 8.5: Logistic regression analysis relating to the factors that affect the use of a
costing system.
B S.E. Wald p-value Exp(B)
Annual sales turnover 1.453 0.481 9.130 0.002 4.276
Intensity of market competition 1.233 0.612 4.061 0.022 3.431
Participation of owner/manager 0.538 0.474 1.287 0.129 1.712
Advanced manufacturing technology 1.729 0.520 11.046 0.001 5.633
Constant -16.453 4.561 13.014 0.000 0.000
Chi-square 0.000
Cox and Snell R square 0.345
Nagelkerke R square 0.630
McFadden R square 0.534
Log likelihood 35.498
Significant predictor
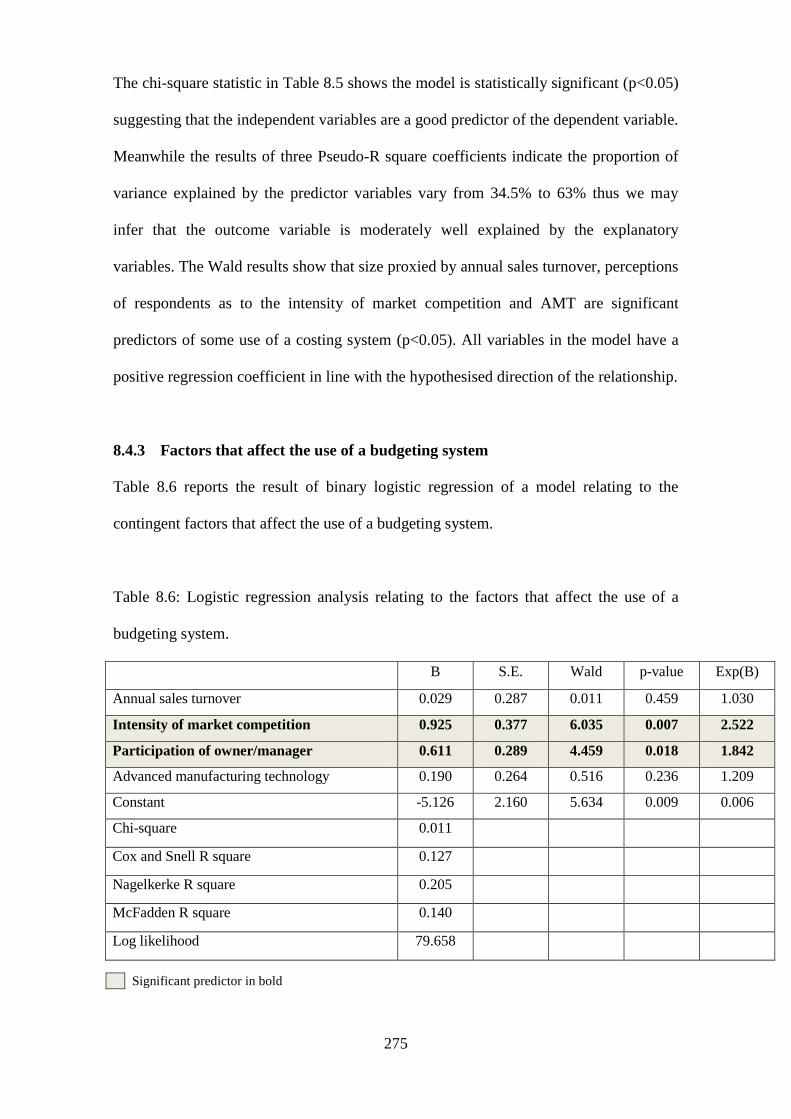
275
The chi-square statistic in Table 8.5 shows the model is statistically significant (p<0.05)
suggesting that the independent variables are a good predictor of the dependent variable.
Meanwhile the results of three Pseudo-R square coefficients indicate the proportion of
variance explained by the predictor variables vary from 34.5% to 63% thus we may
infer that the outcome variable is moderately well explained by the explanatory
variables. The Wald results show that size proxied by annual sales turnover, perceptions
of respondents as to the intensity of market competition and AMT are significant
predictors of some use of a costing system (p<0.05). All variables in the model have a
positive regression coefficient in line with the hypothesised direction of the relationship.
8.4.3 Factors that affect the use of a budgeting system
Table 8.6 reports the result of binary logistic regression of a model relating to the
contingent factors that affect the use of a budgeting system.
Table 8.6: Logistic regression analysis relating to the factors that affect the use of a
budgeting system.
B S.E. Wald p-value Exp(B)
Annual sales turnover 0.029 0.287 0.011 0.459 1.030
Intensity of market competition 0.925 0.377 6.035 0.007 2.522
Participation of owner/manager 0.611 0.289 4.459 0.018 1.842
Advanced manufacturing technology 0.190 0.264 0.516 0.236 1.209
Constant -5.126 2.160 5.634 0.009 0.006
Chi-square 0.011
Cox and Snell R square 0.127
Nagelkerke R square 0.205
McFadden R square 0.140
Log likelihood 79.658
Significant predictor in bold
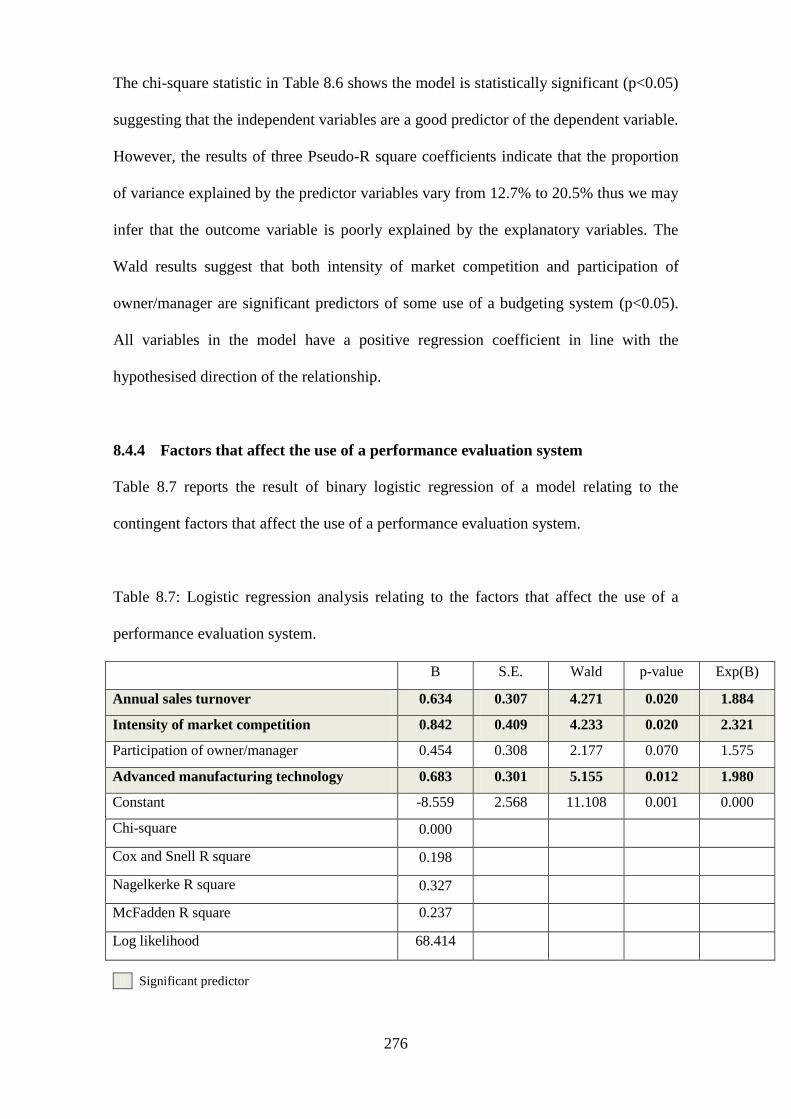
276
The chi-square statistic in Table 8.6 shows the model is statistically significant (p<0.05)
suggesting that the independent variables are a good predictor of the dependent variable.
However, the results of three Pseudo-R square coefficients indicate that the proportion
of variance explained by the predictor variables vary from 12.7% to 20.5% thus we may
infer that the outcome variable is poorly explained by the explanatory variables. The
Wald results suggest that both intensity of market competition and participation of
owner/manager are significant predictors of some use of a budgeting system (p<0.05).
All variables in the model have a positive regression coefficient in line with the
hypothesised direction of the relationship.
8.4.4 Factors that affect the use of a performance evaluation system
Table 8.7 reports the result of binary logistic regression of a model relating to the
contingent factors that affect the use of a performance evaluation system.
Table 8.7: Logistic regression analysis relating to the factors that affect the use of a
performance evaluation system.
B S.E. Wald p-value Exp(B)
Annual sales turnover 0.634 0.307 4.271 0.020 1.884
Intensity of market competition 0.842 0.409 4.233 0.020 2.321
Participation of owner/manager 0.454 0.308 2.177 0.070 1.575
Advanced manufacturing technology 0.683 0.301 5.155 0.012 1.980
Constant -8.559 2.568 11.108 0.001 0.000
Chi-square 0.000
Cox and Snell R square 0.198
Nagelkerke R square 0.327
McFadden R square 0.237
Log likelihood 68.414
Significant predictor
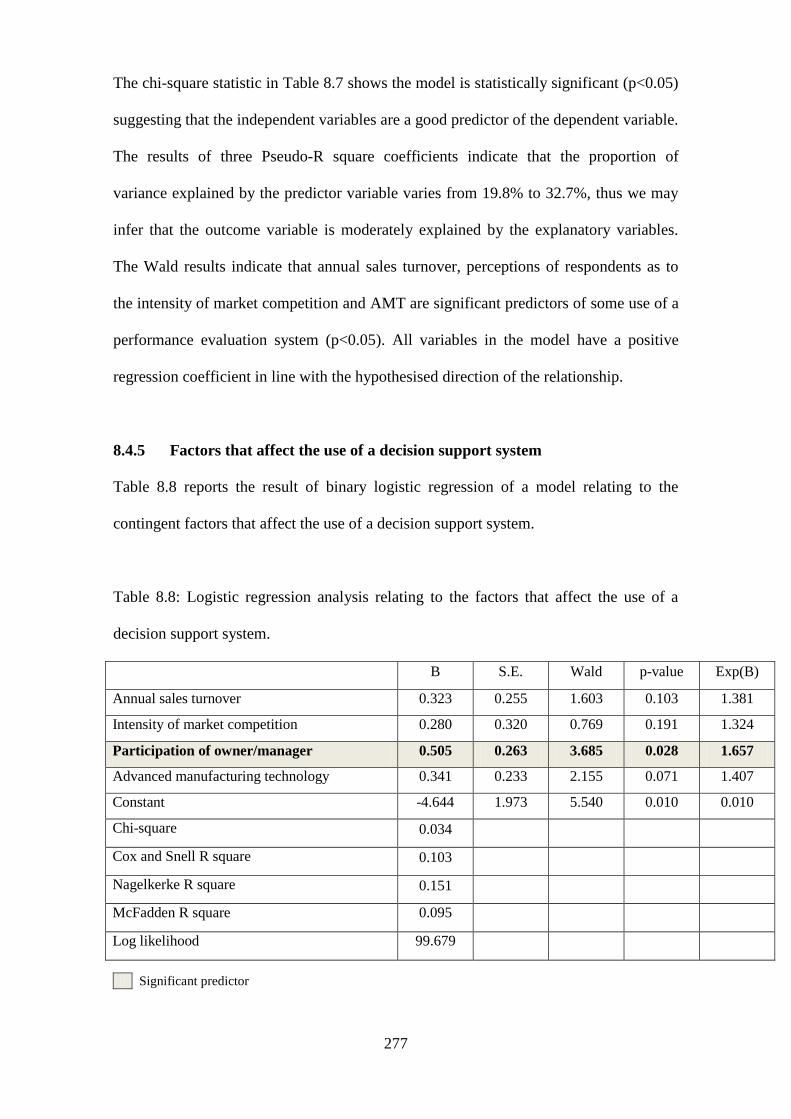
277
The chi-square statistic in Table 8.7 shows the model is statistically significant (p<0.05)
suggesting that the independent variables are a good predictor of the dependent variable.
The results of three Pseudo-R square coefficients indicate that the proportion of
variance explained by the predictor variable varies from 19.8% to 32.7%, thus we may
infer that the outcome variable is moderately explained by the explanatory variables.
The Wald results indicate that annual sales turnover, perceptions of respondents as to
the intensity of market competition and AMT are significant predictors of some use of a
performance evaluation system (p<0.05). All variables in the model have a positive
regression coefficient in line with the hypothesised direction of the relationship.
8.4.5 Factors that affect the use of a decision support system
Table 8.8 reports the result of binary logistic regression of a model relating to the
contingent factors that affect the use of a decision support system.
Table 8.8: Logistic regression analysis relating to the factors that affect the use of a
decision support system.
B S.E. Wald p-value Exp(B)
Annual sales turnover 0.323 0.255 1.603 0.103 1.381
Intensity of market competition 0.280 0.320 0.769 0.191 1.324
Participation of owner/manager 0.505 0.263 3.685 0.028 1.657
Advanced manufacturing technology 0.341 0.233 2.155 0.071 1.407
Constant -4.644 1.973 5.540 0.010 0.010
Chi-square 0.034
Cox and Snell R square 0.103
Nagelkerke R square 0.151
McFadden R square 0.095
Log likelihood 99.679
Significant predictor
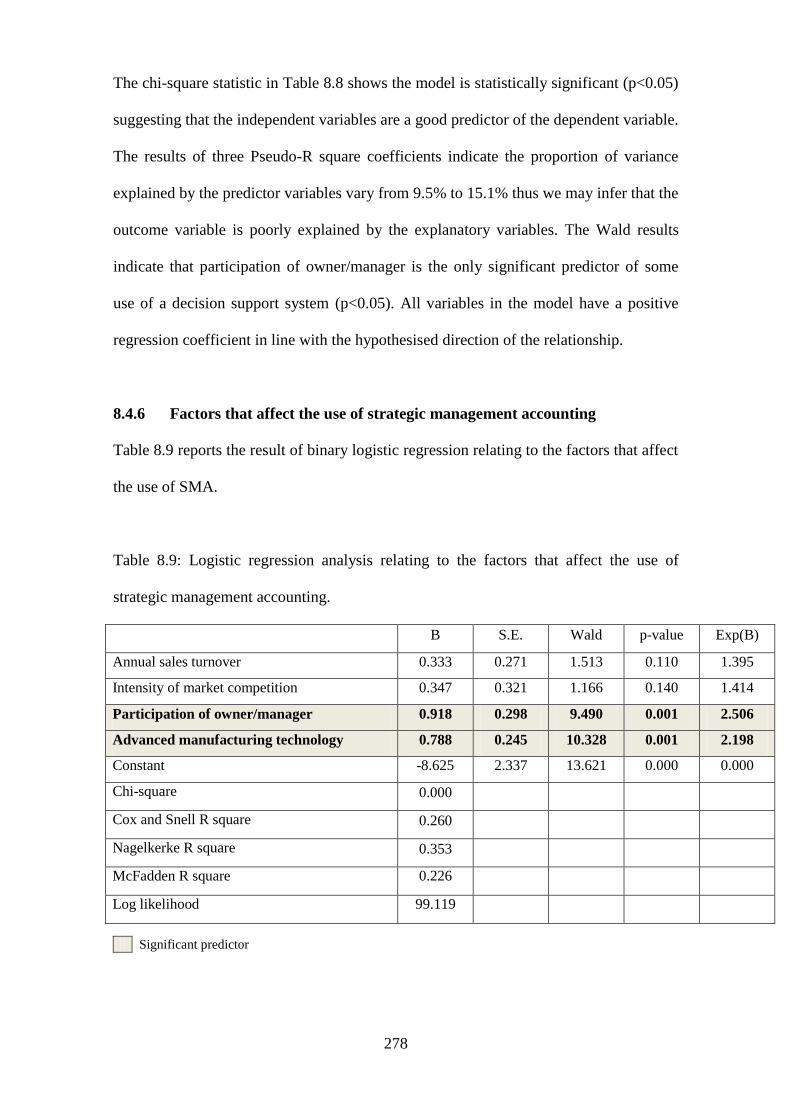
278
The chi-square statistic in Table 8.8 shows the model is statistically significant (p<0.05)
suggesting that the independent variables are a good predictor of the dependent variable.
The results of three Pseudo-R square coefficients indicate the proportion of variance
explained by the predictor variables vary from 9.5% to 15.1% thus we may infer that the
outcome variable is poorly explained by the explanatory variables. The Wald results
indicate that participation of owner/manager is the only significant predictor of some
use of a decision support system (p<0.05). All variables in the model have a positive
regression coefficient in line with the hypothesised direction of the relationship.
8.4.6 Factors that affect the use of strategic management accounting
Table 8.9 reports the result of binary logistic regression relating to the factors that affect
the use of SMA.
Table 8.9: Logistic regression analysis relating to the factors that affect the use of
strategic management accounting.
B S.E. Wald p-value Exp(B)
Annual sales turnover 0.333 0.271 1.513 0.110 1.395
Intensity of market competition 0.347 0.321 1.166 0.140 1.414
Participation of owner/manager 0.918 0.298 9.490 0.001 2.506
Advanced manufacturing technology 0.788 0.245 10.328 0.001 2.198
Constant -8.625 2.337 13.621 0.000 0.000
Chi-square 0.000
Cox and Snell R square 0.260
Nagelkerke R square 0.353
McFadden R square 0.226
Log likelihood 99.119
Significant predictor

279
The chi-square statistic in Table 8.9 shows the model is statistically significant (p<0.05)
suggesting that the independent variables are a good predictor of the dependent variable.
Meanwhile the results of three Pseudo-R square coefficients indicate that the proportion
of variance explained by the predictor variables vary from 22.6% to 35.3% thus we may
infer that the outcome variable is moderately well explained by the explanatory
variables. The Wald results show that both participation of owner/manager and AMT
are significant predictors of some use of a SMA (p<0.05). All variables in the model
have a positive regression coefficient in line with the hypothesised direction of the
relationship.
8.4.7 Additional analysis: Binary logistic regression analysis in factors related to
the use of management accounting practices (with level of qualification of
accounting staff)
As discussed in section 8.4.1, an additional set of analyses were carried out to ascertain
whether inclusion of an independent variable for the level of qualification of accounting
staff would affect the outcome. Below is the summary of binary logistic regression
results for factors related to the use of MAPs taking into account the level of
qualification of accounting staff.
Table 8.10: Comparisons of models fitting and R squares with and without qualified
accounting staff.
Model fitting (p-value) Range of Pseudo R square
With Without With Without
Model 1 (Costing system) 0.000 0.000 29.5 to 57.1% 34.5 to 63%
Model 2 (Budgeting system) 0.010 0.011 14.9 to 24.3% 12.7 to 20.5%
Model 3 (PMS) 0.006 0.000 16.2 to 28.4% 19.8 to 32.7%
Model 4 (DSS) 0.086 0.034 8.6 to 14.6% 10.3 to 15.1%
Model 5 (SMA) 0.000 0.000 27 to 41.1% 26 to 35.3%

280
Overall the results for the five models are not markedly different with the exception that
Model 4 (where use of a decision support system was the dependent variable) was not
significant if qualified accounting staff was included as exogenous variable. The
proportions of variance (Pseudo R square) explained by the predictor variables are
similar with three models marginally improved (model 1, model 3 and 4) and the others
marginally worse. Table 8.11 shows comparisons of significance value of predictors
with and without qualified accounting staff.
Table 8.11: Comparisons of significance value of predictors with and without qualified
accounting staff.
Significant predictors Significance value (p)
with without
Costing system
Annual sales turnover 0.005 0.002
Intensity of market competition 0.025 0.022
Participation of owner/manager 0.122 0.129
Advanced manufacturing technology 0.002 0.001
Qualification of accounting staff 0.458 -
Budgeting system
Annual sales turnover 0.229 0.459
Intensity of market competition 0.010 0.007
Participation of owner/manager 0.012 0.018
Advanced manufacturing technology 0.204 0.236
Qualification of accounting staff 0.336 -
Performance evaluation system
Annual sales turnover 0.091 0.020
Intensity of market competition 0.054 0.020
Participation of owner/manager 0.027 0.070
Advanced manufacturing technology 0.015 0.012
Qualification of accounting staff 0.484 -
Decision support system
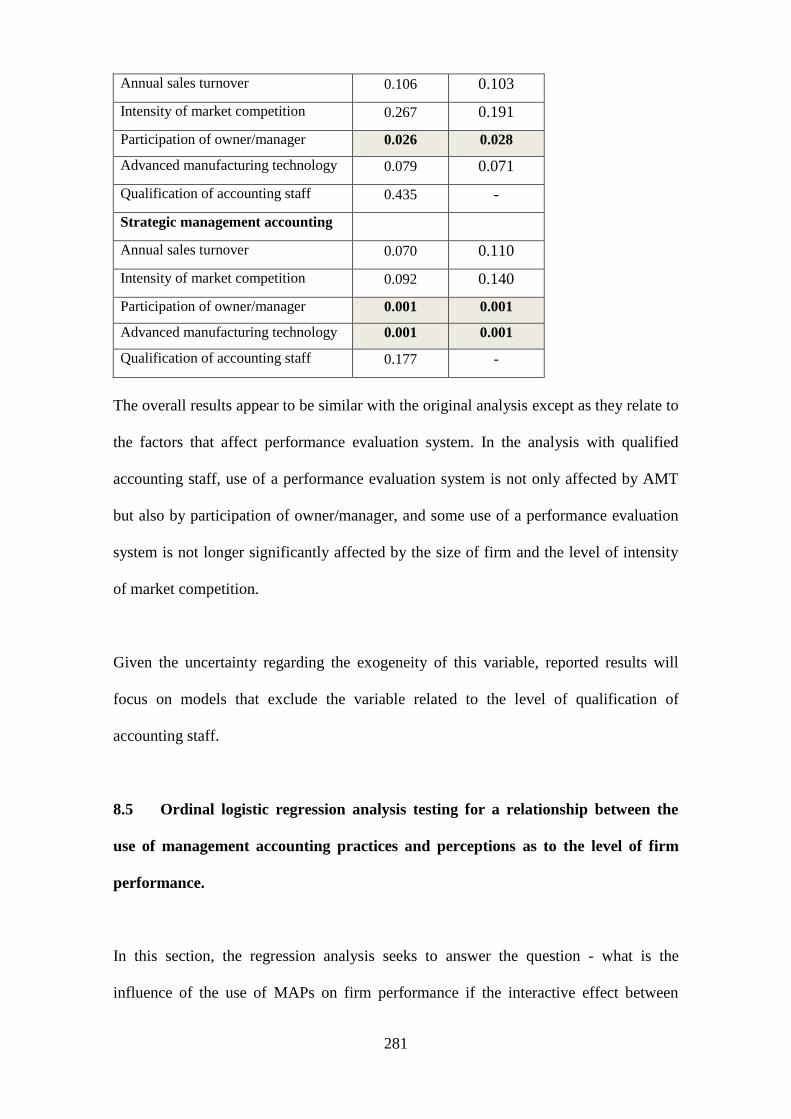
281
Annual sales turnover 0.106 0.103
Intensity of market competition 0.267 0.191
Participation of owner/manager 0.026 0.028
Advanced manufacturing technology 0.079 0.071
Qualification of accounting staff 0.435 -
Strategic management accounting
Annual sales turnover 0.070 0.110
Intensity of market competition 0.092 0.140
Participation of owner/manager 0.001 0.001
Advanced manufacturing technology 0.001 0.001
Qualification of accounting staff 0.177 -
The overall results appear to be similar with the original analysis except as they relate to
the factors that affect performance evaluation system. In the analysis with qualified
accounting staff, use of a performance evaluation system is not only affected by AMT
but also by participation of owner/manager, and some use of a performance evaluation
system is not longer significantly affected by the size of firm and the level of intensity
of market competition.
Given the uncertainty regarding the exogeneity of this variable, reported results will
focus on models that exclude the variable related to the level of qualification of
accounting staff.
8.5 Ordinal logistic regression analysis testing for a relationship between the
use of management accounting practices and perceptions as to the level of firm
performance.
In this section, the regression analysis seeks to answer the question - what is the
influence of the use of MAPs on firm performance if the interactive effect between

282
explanatory variables is taken into account. Since the outcome variable is in an ordered
category, ordinal regression which is designed explicitly for ordinal outcomes is chosen.
8.5.1 Background of ordinal logistic regression
Ordinal measures in response to questions asked are very common in the social
sciences. Attitudinal questions on social and public opinion surveys often take the form
of Likert-type scales covering a range from ‗strongly disagree‘ to ‗strongly disagree‘ or
from ‗least important‘ to ‗most important‘. These responses are normally coded
0,1,2,3,4 and so on (or 1,2,3,4,5 etc). However, many researchers have treated ordinal
outcome variables as if they were continuous and applied a linear regression model
(LRM) in their analysis, sometimes claiming support from studies that find little bias
from assuming interval measurement for ordinal variables (Winship and Mare,
1984).Yet these studies may be misleading because they are typically atheoretical
simulations of limited scope (Winship and Mare, 1984). Long (1997) stated that
examples where regression of ordinal outcome have provided misleading results were
reported by both McKelvey and Zavoina (1975, p. 117) and Winship and Mare (1984,
p.521-523). Given this risk, it is more prudent to apply ordinal regression analysis
which is specifically designed for use with ordinal variables.
As noted in discussion of the underlying logistic assumption (see section 8.2.1) it is
implausible to assume the normality and homogeneity of variance for ordered
categorical dependent variables when that ordinal dependent variable contains merely a
small number of discrete categories (Chen and Hughes, 2004). Thus the ordinal
regression model becomes a preferable modelling tool that does not assume the
normality and constant variance, but requires the assumption of parallel lines across all

283
levels of the categorical outcome (Chen and Hughes, 2004). The test of parallel lines is
designed to make judgement concerning the model adequacy.
In ordinal regression analysis, the two major link functions e.g. logit link or the
complementary log-log (cloglog) links are used to build specific models. There is no
clear-cut method to distinguish the preference of using different link functions.
However the logit link is generally suitable for analyzing the ordered categorical data
evenly distributed among all categories. The cloglog link may be used to analyze the
ordered categorical data when higher categories are more preferable (Chen and Hughes,
2004). For the purpose of this study, the logit link functions will be used first. However
if the analysis fails to find significant models or fails to meet the parallel lines
assumption, the complementary log-log link will be run to see if it yields improved
results.
In this study, ordinal regression analysis is utilized in order to fulfil the fourth research
objective which is to explore the relationship between MAPs and the performance of
medium sized firms. The outcome variable is the perceptions of changes in firm
performance measured by a five-point Likert scale (1 ‗decreased significantly‘ to 5
‗increased significantly‘). Six individual dependent variables tested for measuring firm
performance are: level of productivity; product quality; number of deliveries on time;
sales growth rate; operating profit growth rate; and cash flow growth rate. The
independent variables are whether or not some use is made of MAPs categorized in the
five main areas specified previously.
284
8.5.2 The ordinal regression model (Cumulative odds (CO) logit models)
Ordinal model
The ordinal regression model is called a cumulative logit model because the model is
built based on cumulative response probabilities yj (X) of being in category (j) or lower
given the known explanatory variables (Chen and Hughes, 2004). In general, the ordinal
model assumes that while intercepts will be different across these logistic regression
equations, the slopes are equal (parallel lines assumption)
ln (πj/1- πj) = αoj + ß1 X1 + ß2 X2+... + ßn Xn
where πj is the probability of being at or below category j of an ordinal variable with k
categories, 1 ≤ j ≤ k-1. With the model written as above, positive coefficients would
indicate an association of increases in the predictor variable with lower scores on the
dependent variable. To make the interpretation of coefficients more intuitive
ln (πj/1- πj) = αoj – (ß1 X1 + ß2 X2+... +ßn Xn)
The alpha αoj is expected log odds of Y≤ j when all predictors are 0, where j goes from 1
to the number of categories minus. It represents a separate intercept or threshold for
each cumulative probability.
ßn show the amount of change in expected log odds of being at or below any category of
the dependent variable for each 1 unit increase in Xn. The minus sign before the
coefficients for the predictor variables instead of the customary plus sign is done to
make the interpretation of coefficients more intuitive. That is done so that larger
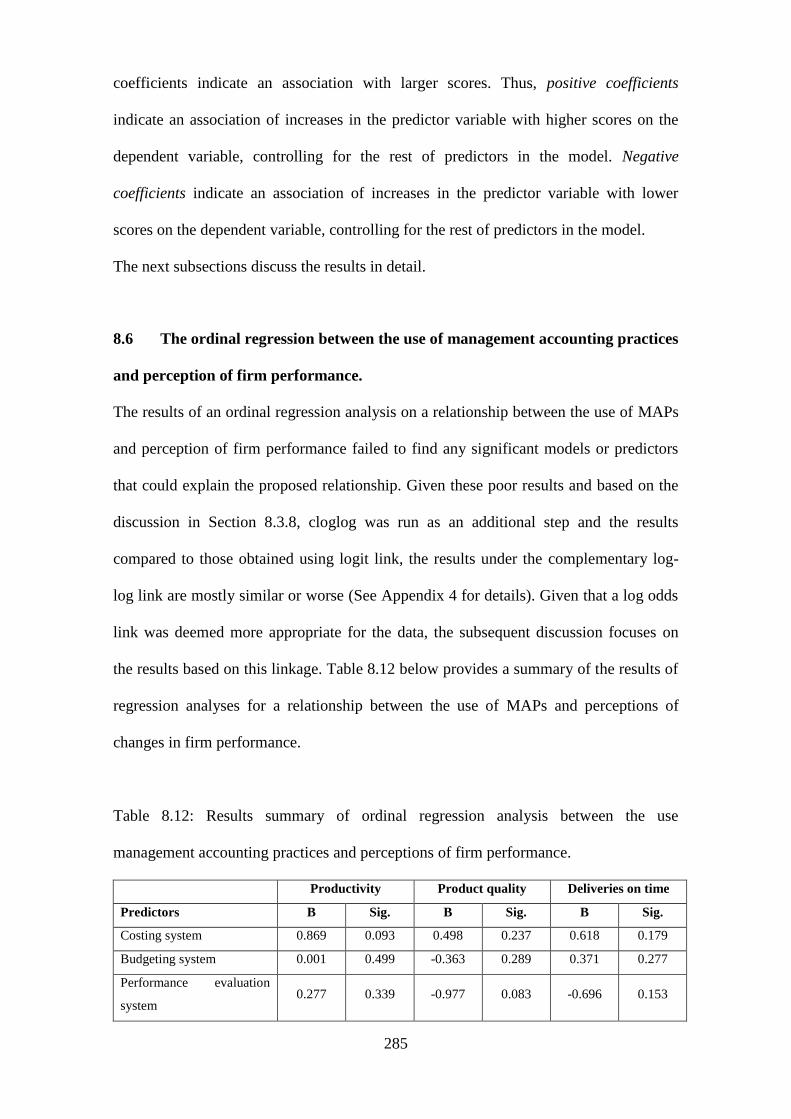
285
coefficients indicate an association with larger scores. Thus, positive coefficients
indicate an association of increases in the predictor variable with higher scores on the
dependent variable, controlling for the rest of predictors in the model. Negative
coefficients indicate an association of increases in the predictor variable with lower
scores on the dependent variable, controlling for the rest of predictors in the model.
The next subsections discuss the results in detail.
8.6 The ordinal regression between the use of management accounting practices
and perception of firm performance.
The results of an ordinal regression analysis on a relationship between the use of MAPs
and perception of firm performance failed to find any significant models or predictors
that could explain the proposed relationship. Given these poor results and based on the
discussion in Section 8.3.8, cloglog was run as an additional step and the results
compared to those obtained using logit link, the results under the complementary log-
log link are mostly similar or worse (See Appendix 4 for details). Given that a log odds
link was deemed more appropriate for the data, the subsequent discussion focuses on
the results based on this linkage. Table 8.12 below provides a summary of the results of
regression analyses for a relationship between the use of MAPs and perceptions of
changes in firm performance.
Table 8.12: Results summary of ordinal regression analysis between the use
management accounting practices and perceptions of firm performance.
Productivity Product quality Deliveries on time
Predictors B Sig. B Sig. B Sig.
Costing system 0.869 0.093 0.498 0.237 0.618 0.179
Budgeting system 0.001 0.499 -0.363 0.289 0.371 0.277
Performance evaluation
system 0.277 0.339 -0.977 0.083 -0.696 0.153

286
Decision support system -0.306 0.292 0.307 0.297 0.093 0.434
Strategic management acc. 0.432 0.171 0.447 0.173 0.566 0.108
Model fittings 0.300 0.613 0.425
Goodness of fit 0.585 0.289 0.985
Test of parallel lines 0.123 0.018 0.444
Pseudo R square
Cox and Snell R square 0.054 0.032 0.044
Nagelkerke R square 0.060 0.037 0.050
McFadden R square 0.024 0.017 0.021
Sales growth Operating profit Cash flow growth
Predictors B Sig. B Sig. B Sig.
Costing system 0.767 0.115 0.298 0.324 0.907 0.079
Budgeting system 0.617 0.150 0.884 0.073 0.153 0.399
Performance evaluation
system -0.216 0.367 -0.328 0.311 -0.438 0.249
Decision support system -0.353 0.257 0.270 0.311 0.606 0.132
Strategic management acc. 0.327 0.229 0.404 0.185 0.519 0.126
Model fittings 0.412 0.158 0.085
Goodness of fit 0.809 0.418 0.564
Test of parallel lines 0.884 0.054 0.007
Pseudo R square
Cox and Snell R square 0.045 0.071 0.084
Nagelkerke R square 0.049 0.078 0.093
McFadden R square 0.018 0.030 0.037
The ordinal regression analysis between the use of MAPs and perceptions of firm
performance indicate that none of the models fitting are statistically significant
(p>0.05). The value of Pseudo squares are very low across the analyses where they
range from 1.7% up to 8.4%. The results also indicate that none of the predictor
variables are significant at 5% level of significance. The associations are positive in line
with the hypothesised relationship for costing systems, budgeting systems and SMA but
there are two negative associations for performance evaluation and decision support
systems. Thus it can be concluded that there are no or only very weak relationships
between the use of MAPs and perceptions of firm performance. The results probably
reflect one of three situations. First the nature of the dichotomy in the independent
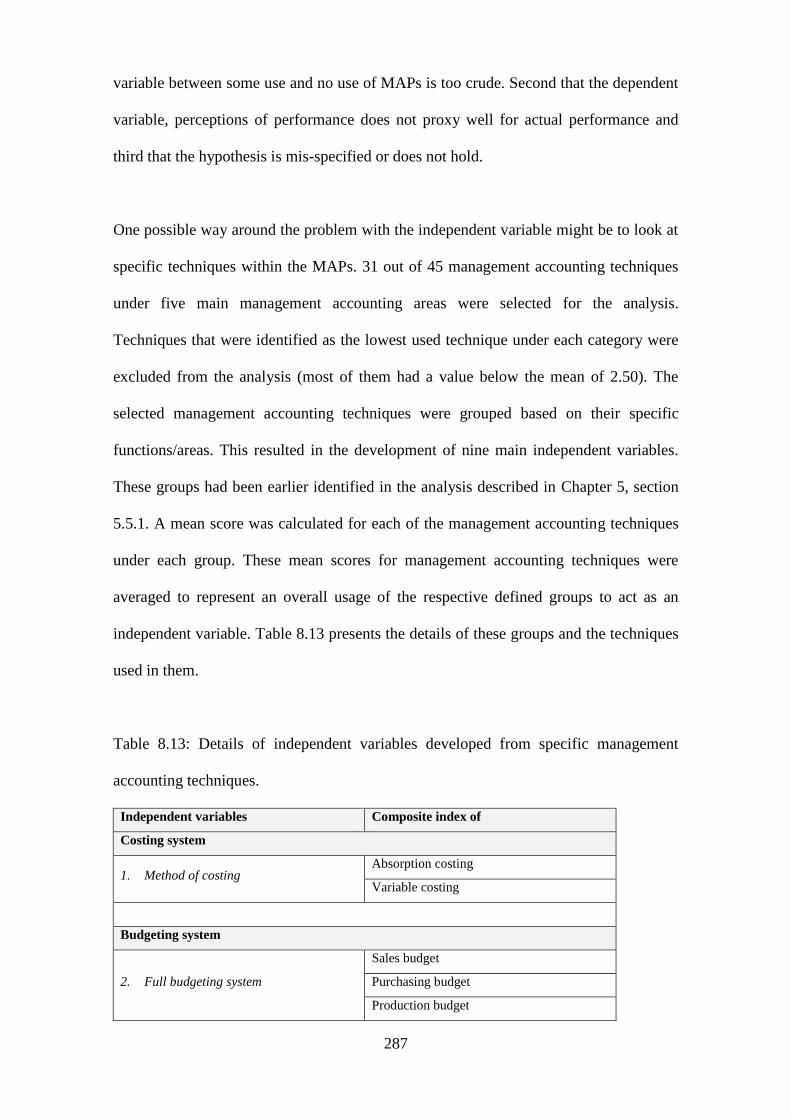
287
variable between some use and no use of MAPs is too crude. Second that the dependent
variable, perceptions of performance does not proxy well for actual performance and
third that the hypothesis is mis-specified or does not hold.
One possible way around the problem with the independent variable might be to look at
specific techniques within the MAPs. 31 out of 45 management accounting techniques
under five main management accounting areas were selected for the analysis.
Techniques that were identified as the lowest used technique under each category were
excluded from the analysis (most of them had a value below the mean of 2.50). The
selected management accounting techniques were grouped based on their specific
functions/areas. This resulted in the development of nine main independent variables.
These groups had been earlier identified in the analysis described in Chapter 5, section
5.5.1. A mean score was calculated for each of the management accounting techniques
under each group. These mean scores for management accounting techniques were
averaged to represent an overall usage of the respective defined groups to act as an
independent variable. Table 8.13 presents the details of these groups and the techniques
used in them.
Table 8.13: Details of independent variables developed from specific management
accounting techniques.
Independent variables Composite index of
Costing system
1. Method of costing Absorption costing
Variable costing
Budgeting system
2. Full budgeting system
Sales budget
Purchasing budget
Production budget
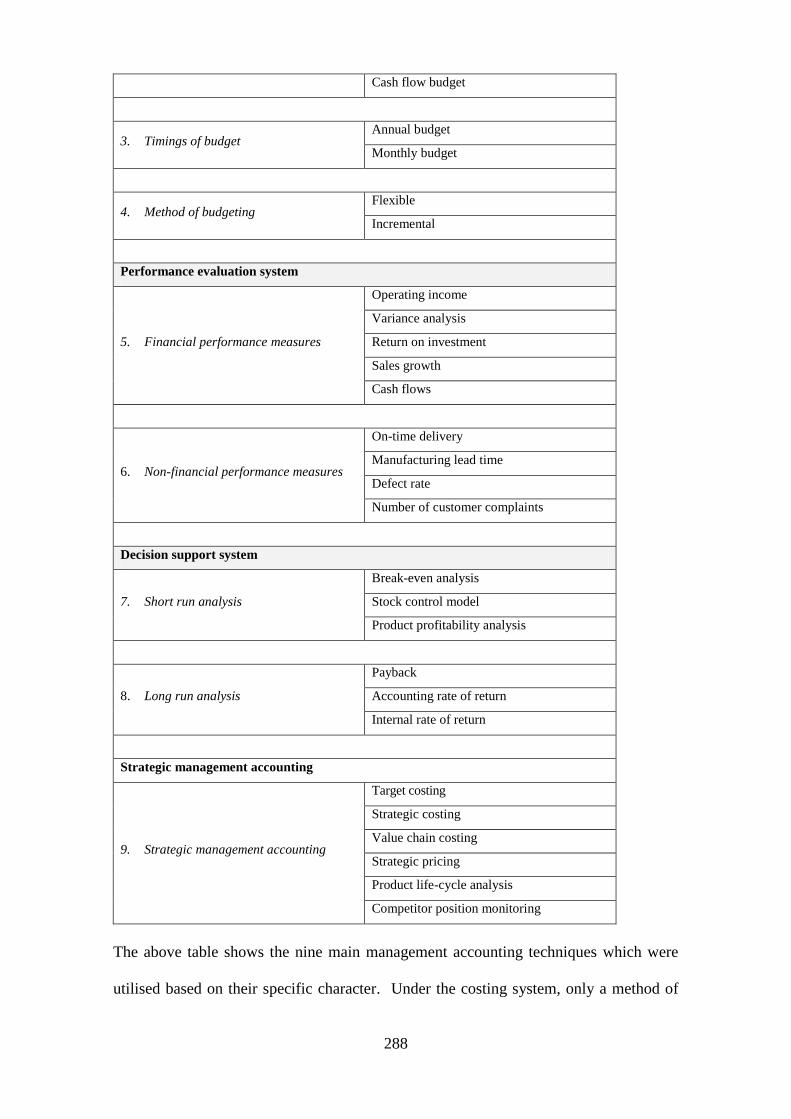
288
Cash flow budget
3. Timings of budget Annual budget
Monthly budget
4. Method of budgeting Flexible
Incremental
Performance evaluation system
5. Financial performance measures
Operating income
Variance analysis
Return on investment
Sales growth
Cash flows
6. Non-financial performance measures
On-time delivery
Manufacturing lead time
Defect rate
Number of customer complaints
Decision support system
7. Short run analysis
Break-even analysis
Stock control model
Product profitability analysis
8. Long run analysis
Payback
Accounting rate of return
Internal rate of return
Strategic management accounting
9. Strategic management accounting
Target costing
Strategic costing
Value chain costing
Strategic pricing
Product life-cycle analysis
Competitor position monitoring
The above table shows the nine main management accounting techniques which were
utilised based on their specific character. Under the costing system, only a method of
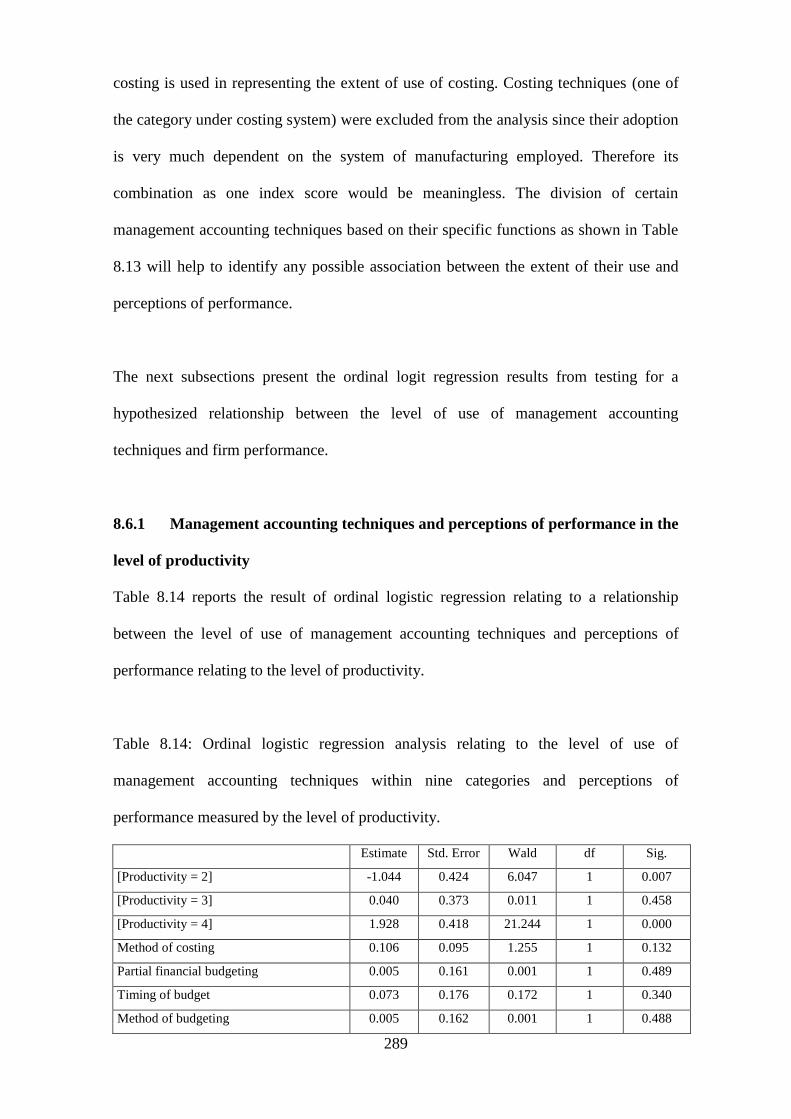
289
costing is used in representing the extent of use of costing. Costing techniques (one of
the category under costing system) were excluded from the analysis since their adoption
is very much dependent on the system of manufacturing employed. Therefore its
combination as one index score would be meaningless. The division of certain
management accounting techniques based on their specific functions as shown in Table
8.13 will help to identify any possible association between the extent of their use and
perceptions of performance.
The next subsections present the ordinal logit regression results from testing for a
hypothesized relationship between the level of use of management accounting
techniques and firm performance.
8.6.1 Management accounting techniques and perceptions of performance in the
level of productivity
Table 8.14 reports the result of ordinal logistic regression relating to a relationship
between the level of use of management accounting techniques and perceptions of
performance relating to the level of productivity.
Table 8.14: Ordinal logistic regression analysis relating to the level of use of
management accounting techniques within nine categories and perceptions of
performance measured by the level of productivity.
Estimate Std. Error Wald df Sig.
[Productivity = 2] -1.044 0.424 6.047 1 0.007
[Productivity = 3] 0.040 0.373 0.011 1 0.458
[Productivity = 4] 1.928 0.418 21.244 1 0.000
Method of costing 0.106 0.095 1.255 1 0.132
Partial financial budgeting 0.005 0.161 0.001 1 0.489
Timing of budget 0.073 0.176 0.172 1 0.340
Method of budgeting 0.005 0.162 0.001 1 0.488
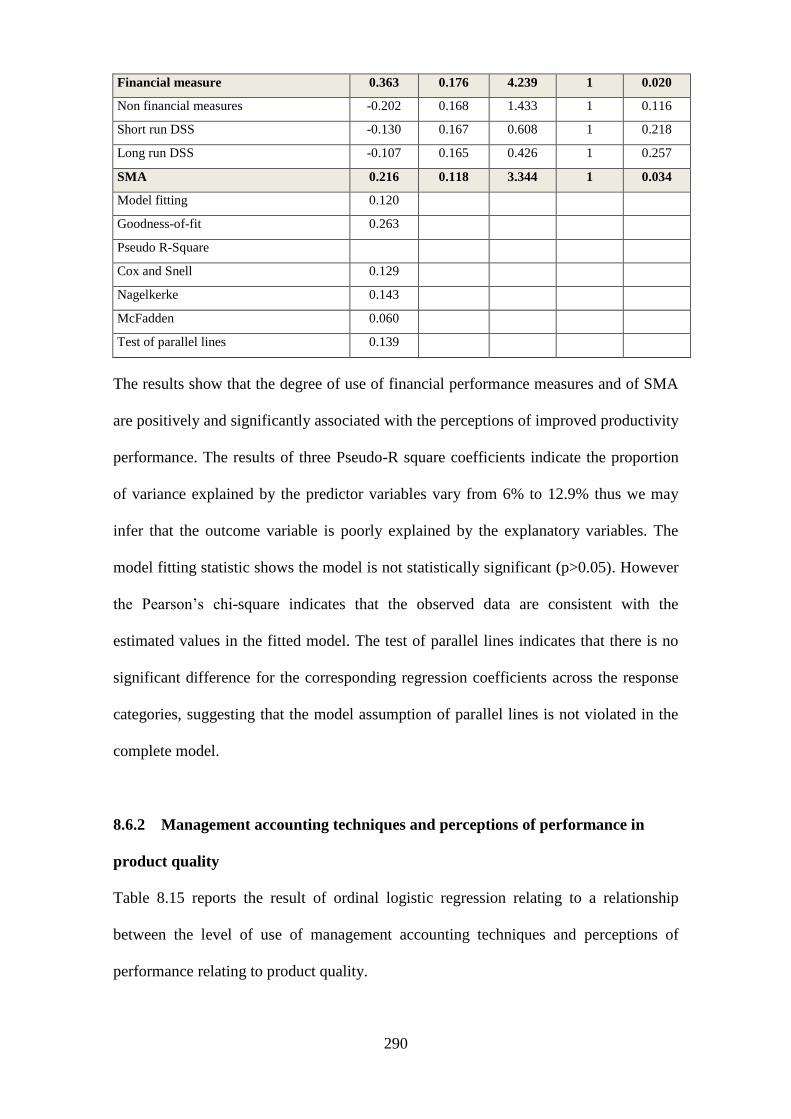
290
Financial measure 0.363 0.176 4.239 1 0.020
Non financial measures -0.202 0.168 1.433 1 0.116
Short run DSS -0.130 0.167 0.608 1 0.218
Long run DSS -0.107 0.165 0.426 1 0.257
SMA 0.216 0.118 3.344 1 0.034
Model fitting 0.120
Goodness-of-fit 0.263
Pseudo R-Square
Cox and Snell 0.129
Nagelkerke 0.143
McFadden 0.060
Test of parallel lines 0.139
The results show that the degree of use of financial performance measures and of SMA
are positively and significantly associated with the perceptions of improved productivity
performance. The results of three Pseudo-R square coefficients indicate the proportion
of variance explained by the predictor variables vary from 6% to 12.9% thus we may
infer that the outcome variable is poorly explained by the explanatory variables. The
model fitting statistic shows the model is not statistically significant (p>0.05). However
the Pearson‘s chi-square indicates that the observed data are consistent with the
estimated values in the fitted model. The test of parallel lines indicates that there is no
significant difference for the corresponding regression coefficients across the response
categories, suggesting that the model assumption of parallel lines is not violated in the
complete model.
8.6.2 Management accounting techniques and perceptions of performance in
product quality
Table 8.15 reports the result of ordinal logistic regression relating to a relationship
between the level of use of management accounting techniques and perceptions of
performance relating to product quality.
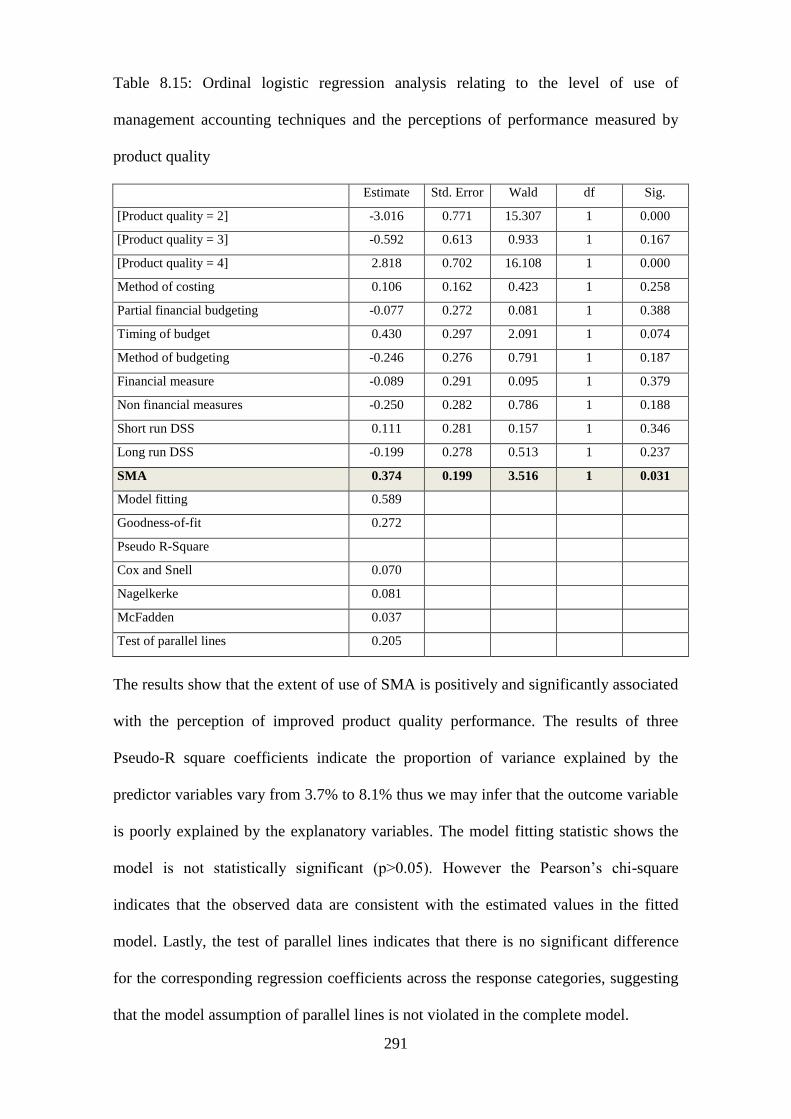
291
Table 8.15: Ordinal logistic regression analysis relating to the level of use of
management accounting techniques and the perceptions of performance measured by
product quality
Estimate Std. Error Wald df Sig.
[Product quality = 2] -3.016 0.771 15.307 1 0.000
[Product quality = 3] -0.592 0.613 0.933 1 0.167
[Product quality = 4] 2.818 0.702 16.108 1 0.000
Method of costing 0.106 0.162 0.423 1 0.258
Partial financial budgeting -0.077 0.272 0.081 1 0.388
Timing of budget 0.430 0.297 2.091 1 0.074
Method of budgeting -0.246 0.276 0.791 1 0.187
Financial measure -0.089 0.291 0.095 1 0.379
Non financial measures -0.250 0.282 0.786 1 0.188
Short run DSS 0.111 0.281 0.157 1 0.346
Long run DSS -0.199 0.278 0.513 1 0.237
SMA 0.374 0.199 3.516 1 0.031
Model fitting 0.589
Goodness-of-fit 0.272
Pseudo R-Square
Cox and Snell 0.070
Nagelkerke 0.081
McFadden 0.037
Test of parallel lines 0.205
The results show that the extent of use of SMA is positively and significantly associated
with the perception of improved product quality performance. The results of three
Pseudo-R square coefficients indicate the proportion of variance explained by the
predictor variables vary from 3.7% to 8.1% thus we may infer that the outcome variable
is poorly explained by the explanatory variables. The model fitting statistic shows the
model is not statistically significant (p>0.05). However the Pearson‘s chi-square
indicates that the observed data are consistent with the estimated values in the fitted
model. Lastly, the test of parallel lines indicates that there is no significant difference
for the corresponding regression coefficients across the response categories, suggesting
that the model assumption of parallel lines is not violated in the complete model.
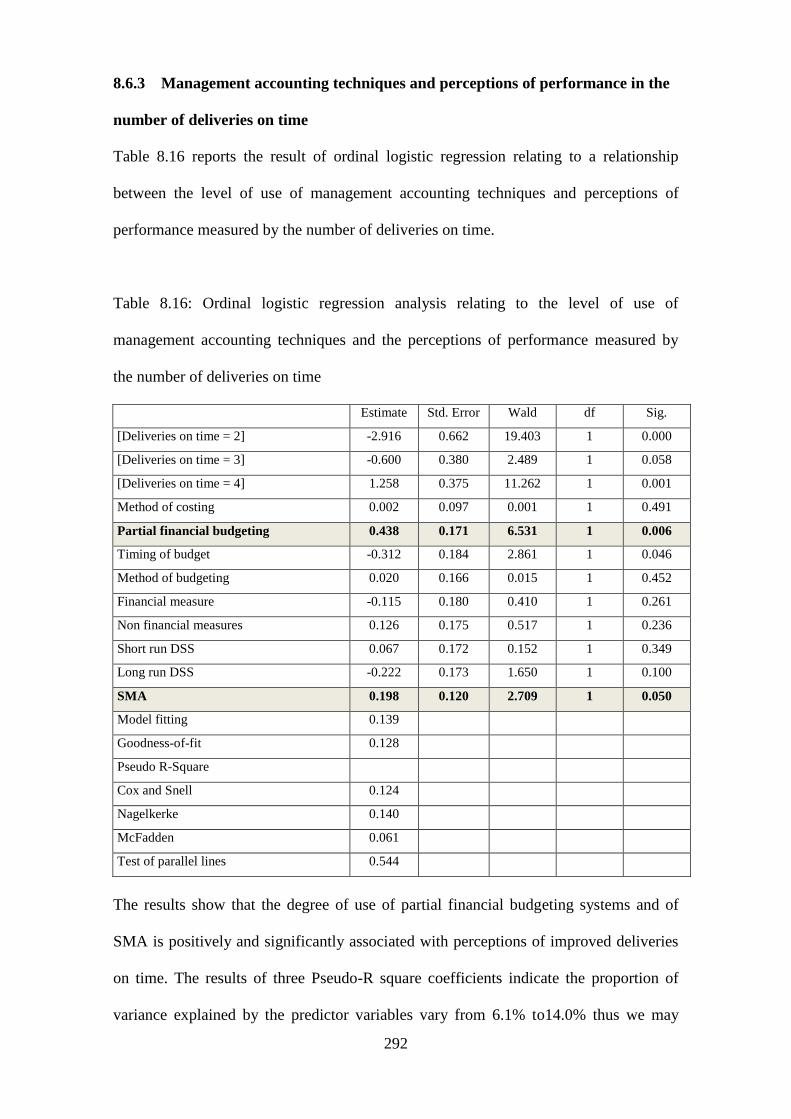
292
8.6.3 Management accounting techniques and perceptions of performance in the
number of deliveries on time
Table 8.16 reports the result of ordinal logistic regression relating to a relationship
between the level of use of management accounting techniques and perceptions of
performance measured by the number of deliveries on time.
Table 8.16: Ordinal logistic regression analysis relating to the level of use of
management accounting techniques and the perceptions of performance measured by
the number of deliveries on time
Estimate Std. Error Wald df Sig.
[Deliveries on time = 2] -2.916 0.662 19.403 1 0.000
[Deliveries on time = 3] -0.600 0.380 2.489 1 0.058
[Deliveries on time = 4] 1.258 0.375 11.262 1 0.001
Method of costing 0.002 0.097 0.001 1 0.491
Partial financial budgeting 0.438 0.171 6.531 1 0.006
Timing of budget -0.312 0.184 2.861 1 0.046
Method of budgeting 0.020 0.166 0.015 1 0.452
Financial measure -0.115 0.180 0.410 1 0.261
Non financial measures 0.126 0.175 0.517 1 0.236
Short run DSS 0.067 0.172 0.152 1 0.349
Long run DSS -0.222 0.173 1.650 1 0.100
SMA 0.198 0.120 2.709 1 0.050
Model fitting 0.139
Goodness-of-fit 0.128
Pseudo R-Square
Cox and Snell 0.124
Nagelkerke 0.140
McFadden 0.061
Test of parallel lines 0.544
The results show that the degree of use of partial financial budgeting systems and of
SMA is positively and significantly associated with perceptions of improved deliveries
on time. The results of three Pseudo-R square coefficients indicate the proportion of
variance explained by the predictor variables vary from 6.1% to14.0% thus we may

293
infer that the outcome variable is poorly explained by the explanatory variables. The
model fitting statistic shows the model is not statistically significant (p>0.05). However
the Pearson‘s chi-square indicates that the observed data are consistent with the
estimated values in the fitted model. Lastly, the test of parallel lines indicates that there
is no significant difference for the corresponding regression coefficients across the
response categories, suggesting that the model assumption of parallel lines is not
violated in the complete model.
8.6.4 Management accounting techniques and perceptions of performance in
sales growth rate
Table 8.17 reports the result of ordinal logistic regression relating to a relationship
between the level of use of management accounting techniques and perceptions of
performance related to the sales growth rate.
Table 8.17: Ordinal logistic regression analysis relating to the level of use of
management accounting techniques and the perceptions of performance measured by
sales growth rate.
Estimate Std. Error Wald df Sig.
[Sales growth rate = 1] -3.114 0.898 12.025 1 0.001
[Sales growth rate = 2] -0.887 0.590 2.259 1 0.067
[Sales growth rate = 3] 0.311 0.571 0.296 1 0.294
[Sales growth rate = 4] 2.981 0.658 20.550 1 0.000
Method of costing 0.390 0.157 6.162 1 0.007
Partial financial budgeting 0.652 0.262 6.185 1 0.007
Timing of budget 0.133 0.279 0.227 1 0.317
Method of budgeting -0.475 0.263 3.266 1 0.036
Financial measure 0.001 0.270 0.000 1 0.499
Non financial measures -0.298 0.263 1.276 1 0.130
Short run DSS 0.027 0.265 0.011 1 0.459
Long run DSS -0.302 0.263 1.318 1 0.126
SMA 0.205 0.186 1.223 1 0.135
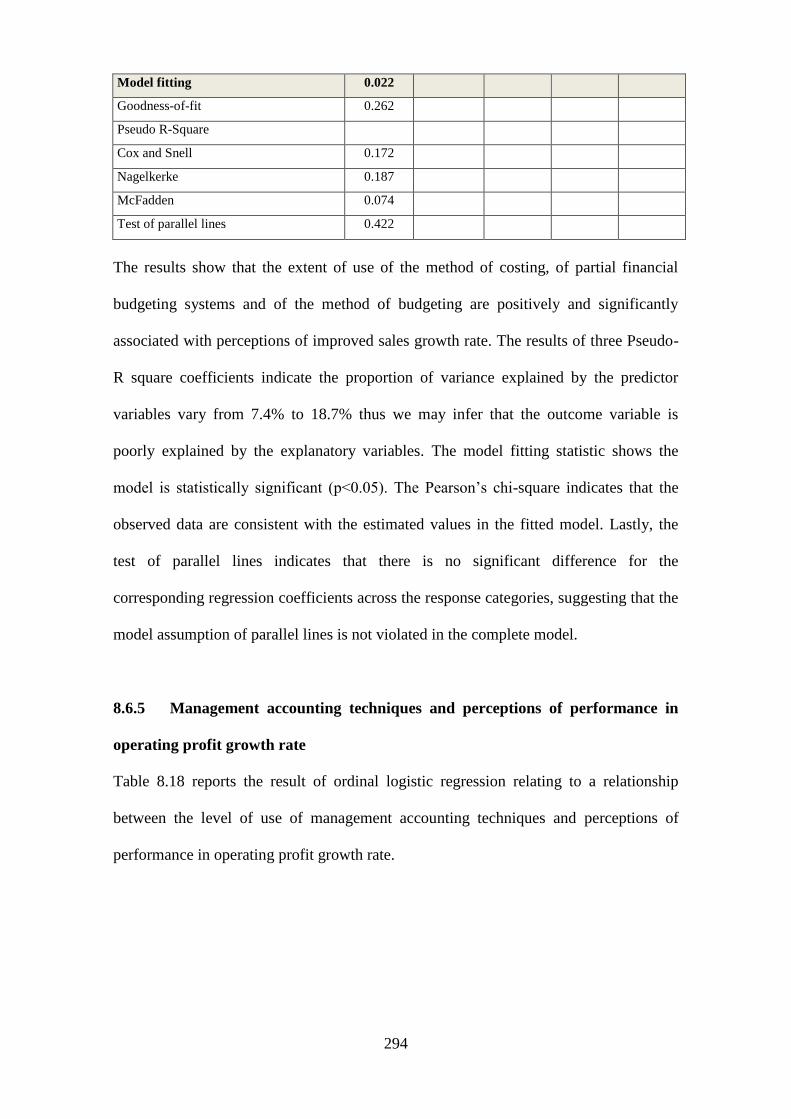
294
Model fitting 0.022
Goodness-of-fit 0.262
Pseudo R-Square
Cox and Snell 0.172
Nagelkerke 0.187
McFadden 0.074
Test of parallel lines 0.422
The results show that the extent of use of the method of costing, of partial financial
budgeting systems and of the method of budgeting are positively and significantly
associated with perceptions of improved sales growth rate. The results of three Pseudo-
R square coefficients indicate the proportion of variance explained by the predictor
variables vary from 7.4% to 18.7% thus we may infer that the outcome variable is
poorly explained by the explanatory variables. The model fitting statistic shows the
model is statistically significant (p<0.05). The Pearson‘s chi-square indicates that the
observed data are consistent with the estimated values in the fitted model. Lastly, the
test of parallel lines indicates that there is no significant difference for the
corresponding regression coefficients across the response categories, suggesting that the
model assumption of parallel lines is not violated in the complete model.
8.6.5 Management accounting techniques and perceptions of performance in
operating profit growth rate
Table 8.18 reports the result of ordinal logistic regression relating to a relationship
between the level of use of management accounting techniques and perceptions of
performance in operating profit growth rate.
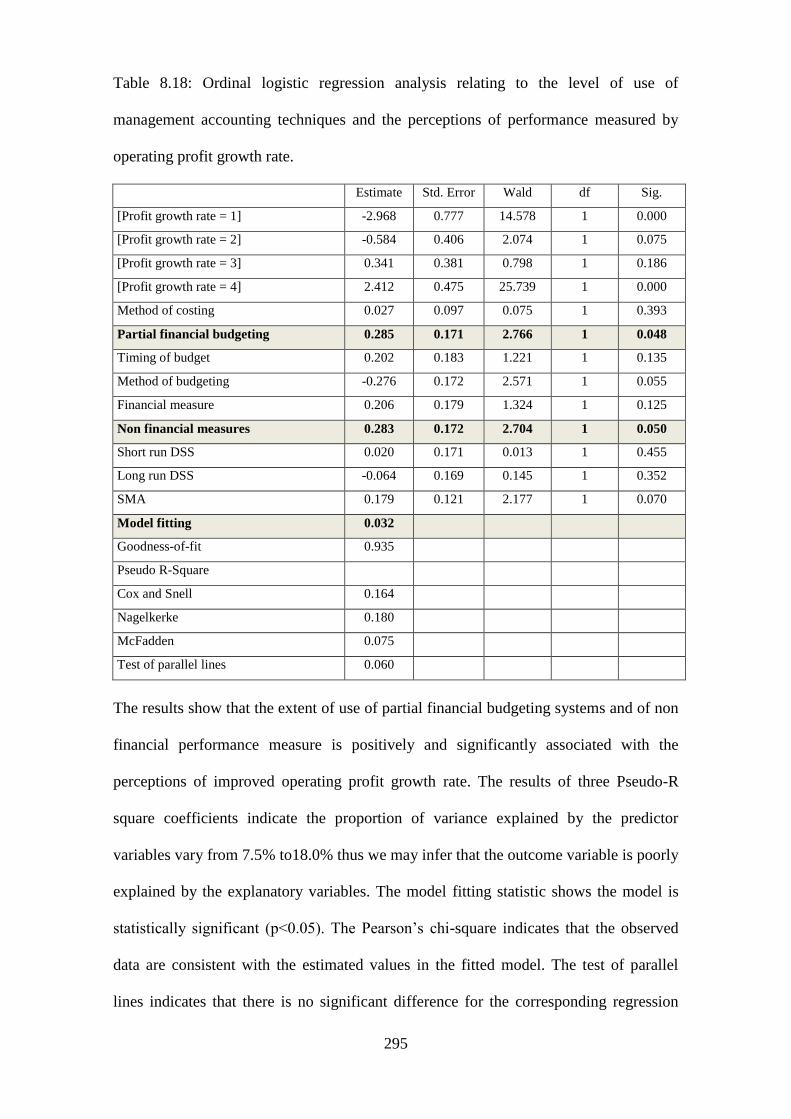
295
Table 8.18: Ordinal logistic regression analysis relating to the level of use of
management accounting techniques and the perceptions of performance measured by
operating profit growth rate.
Estimate Std. Error Wald df Sig.
[Profit growth rate = 1] -2.968 0.777 14.578 1 0.000
[Profit growth rate = 2] -0.584 0.406 2.074 1 0.075
[Profit growth rate = 3] 0.341 0.381 0.798 1 0.186
[Profit growth rate = 4] 2.412 0.475 25.739 1 0.000
Method of costing 0.027 0.097 0.075 1 0.393
Partial financial budgeting 0.285 0.171 2.766 1 0.048
Timing of budget 0.202 0.183 1.221 1 0.135
Method of budgeting -0.276 0.172 2.571 1 0.055
Financial measure 0.206 0.179 1.324 1 0.125
Non financial measures 0.283 0.172 2.704 1 0.050
Short run DSS 0.020 0.171 0.013 1 0.455
Long run DSS -0.064 0.169 0.145 1 0.352
SMA 0.179 0.121 2.177 1 0.070
Model fitting 0.032
Goodness-of-fit 0.935
Pseudo R-Square
Cox and Snell 0.164
Nagelkerke 0.180
McFadden 0.075
Test of parallel lines 0.060
The results show that the extent of use of partial financial budgeting systems and of non
financial performance measure is positively and significantly associated with the
perceptions of improved operating profit growth rate. The results of three Pseudo-R
square coefficients indicate the proportion of variance explained by the predictor
variables vary from 7.5% to18.0% thus we may infer that the outcome variable is poorly
explained by the explanatory variables. The model fitting statistic shows the model is
statistically significant (p<0.05). The Pearson‘s chi-square indicates that the observed
data are consistent with the estimated values in the fitted model. The test of parallel
lines indicates that there is no significant difference for the corresponding regression
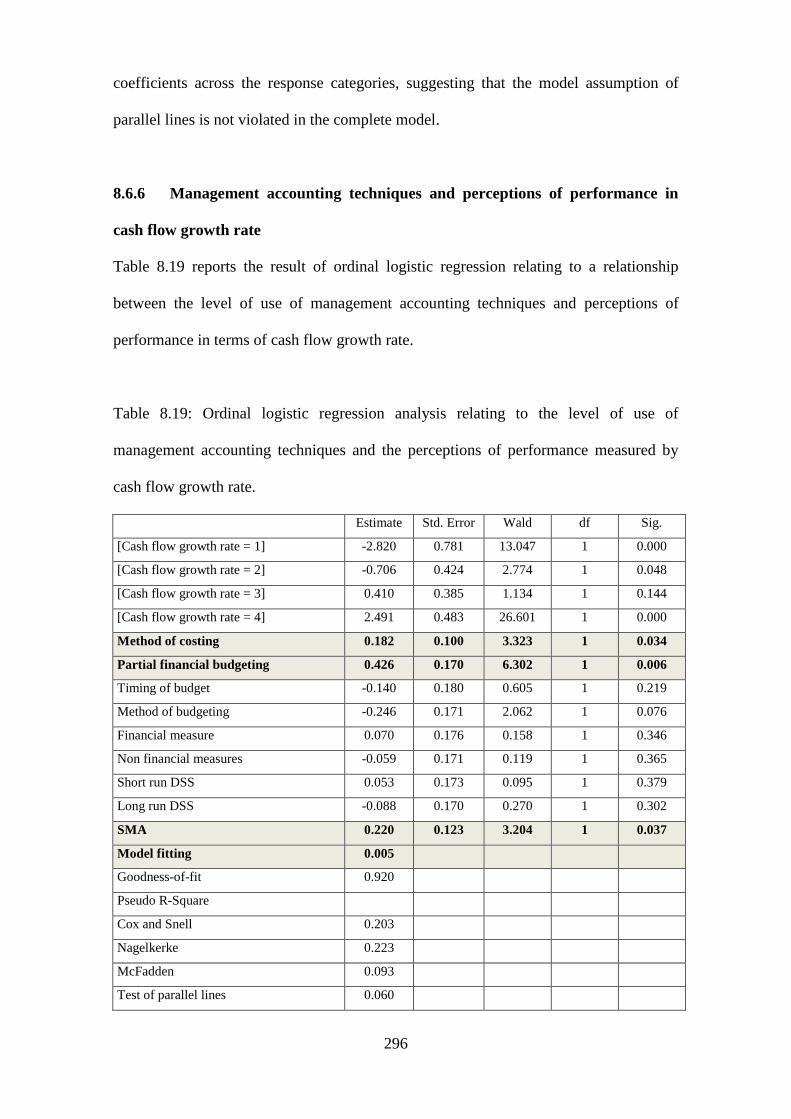
296
coefficients across the response categories, suggesting that the model assumption of
parallel lines is not violated in the complete model.
8.6.6 Management accounting techniques and perceptions of performance in
cash flow growth rate
Table 8.19 reports the result of ordinal logistic regression relating to a relationship
between the level of use of management accounting techniques and perceptions of
performance in terms of cash flow growth rate.
Table 8.19: Ordinal logistic regression analysis relating to the level of use of
management accounting techniques and the perceptions of performance measured by
cash flow growth rate.
Estimate Std. Error Wald df Sig.
[Cash flow growth rate = 1] -2.820 0.781 13.047 1 0.000
[Cash flow growth rate = 2] -0.706 0.424 2.774 1 0.048
[Cash flow growth rate = 3] 0.410 0.385 1.134 1 0.144
[Cash flow growth rate = 4] 2.491 0.483 26.601 1 0.000
Method of costing 0.182 0.100 3.323 1 0.034
Partial financial budgeting 0.426 0.170 6.302 1 0.006
Timing of budget -0.140 0.180 0.605 1 0.219
Method of budgeting -0.246 0.171 2.062 1 0.076
Financial measure 0.070 0.176 0.158 1 0.346
Non financial measures -0.059 0.171 0.119 1 0.365
Short run DSS 0.053 0.173 0.095 1 0.379
Long run DSS -0.088 0.170 0.270 1 0.302
SMA 0.220 0.123 3.204 1 0.037
Model fitting 0.005
Goodness-of-fit 0.920
Pseudo R-Square
Cox and Snell 0.203
Nagelkerke 0.223
McFadden 0.093
Test of parallel lines 0.060

297
The results show that the degree of use of the method of budgeting, of partial financial
budgeting systems and of SMA is positively and significantly associated with the
perceptions of improved cash flow growth rate. The results of three Pseudo-R square
coefficients indicate the proportion of variance explained by the predictor variables vary
from 9.3% to 22.3% thus we may infer that the outcome variable is poorly explained by
the explanatory variables. The model fitting statistic shows the model is statistically
significant (p<0.05). The Pearson‘s chi-square indicates that the observed data are
consistent with the estimated values in the fitted model. The test of parallel lines
indicates that there is no significant difference for the corresponding regression
coefficients across the response categories, suggesting that the model assumption of
parallel lines is not violated in the complete model.
8.7 Summary
This chapter reports the results of the logistic regression analysis of data obtained from
medium sized firms in the Malaysian manufacturing sector. The objectives of the
analysis were firstly to investigate for significant relationships between a number of
contingent variables and the use of specific MAPs; and secondly to investigate whether
there was any significant relationship between the use of MAPs and perceptions of firm
performance. Two main logistic regression analyses (binary logistic regression and
ordinal regression) were employed to investigate these hypothesized relationships.
8.7.1 Possible relationship between the use of management accounting practices
and contingent factors
The results of a binary logistic regression analysis of the relationships between selected
contingent variables and the use of MAPs in terms of the five main categories show that
four contingent variables (size of firms, intensity of market competition, participation of
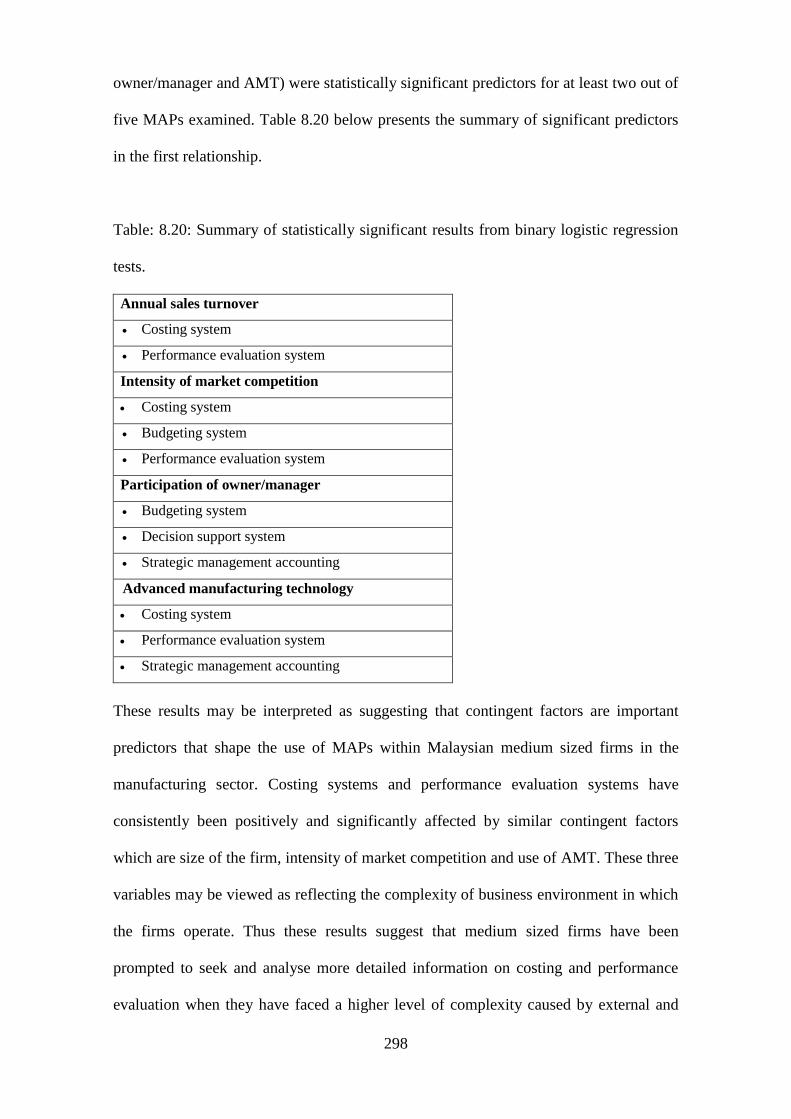
298
owner/manager and AMT) were statistically significant predictors for at least two out of
five MAPs examined. Table 8.20 below presents the summary of significant predictors
in the first relationship.
Table: 8.20: Summary of statistically significant results from binary logistic regression
tests.
Annual sales turnover
Costing system
Performance evaluation system
Intensity of market competition
Costing system
Budgeting system
Performance evaluation system
Participation of owner/manager
Budgeting system
Decision support system
Strategic management accounting
Advanced manufacturing technology
Costing system
Performance evaluation system
Strategic management accounting
These results may be interpreted as suggesting that contingent factors are important
predictors that shape the use of MAPs within Malaysian medium sized firms in the
manufacturing sector. Costing systems and performance evaluation systems have
consistently been positively and significantly affected by similar contingent factors
which are size of the firm, intensity of market competition and use of AMT. These three
variables may be viewed as reflecting the complexity of business environment in which
the firms operate. Thus these results suggest that medium sized firms have been
prompted to seek and analyse more detailed information on costing and performance
evaluation when they have faced a higher level of complexity caused by external and

299
internal factors. This perhaps shows the importance of firms having comprehensive
records on production costs as well as an evaluation of progress or performance so that
firms are able to act wisely and competitively. Additionally both intensity of market
competition and the use of AMT have also significantly affected the use of other MAPs.
First intensity of market competition is positively and significantly associated with a
higher level of use of budgeting systems. This finding implies that increased market
competition causes medium sized firms to be more prudent in planning and controlling
their activities in order to survive and compete effectively in the market. Second the
result indicates that the use of AMT has been positively and significantly associated
with a greater use of SMA. This result suggests that as a firms‘ business environment
becomes increasingly dynamic (i.e through the use of modern technology), firms have
found it increasingly important to use management accounting to develop coherent and
logically consistent business strategies.
Table 8.20 also shows that the participation of the owner/manager has a positive and
significant relationship with the use of a budgeting, decision support systems and SMA.
Therefore owner/managers have major influence on the use of MAPs that related to
decision making in the short-run, and planning and control including the development
of strategy. This is perhaps because in smaller firms, which probably exhibit an
entrepreneurial organization structure, the owner/manager acts as the main decision
maker and is usually the shaper of the future of the business (Thong et al., 1996).
Therefore committed owner/managers would have the means to press for MAPs that
deliver appropriate managerial information to assist them achieve their strategic goals
and objectives. The results fail to find positive and significant relationship between
participation of owner/manager and use of a costing system or performance evaluation
system.
300
Overall, the results show that not all practices are affected by the same contingent
variables. In particular use of a costing system and performance evaluation are
dependent on internal and external pressures whereas the use of other practices largely
depends on owner/manager participation. In conclusion, the hypothesis is partially
accepted and provides support for a contingency based explanation for the extent of use
of MAPs by respondents.
8.7.2 Comparison of results with previous research.
The first contingent variable; size of the firms was only found to be positively and
statistically significant related to use of a costing system and a performance evaluation
system. The results are consistent with studies by Halma and Laats (2002), who found
that the application of cost accounting tends to increase in line with company size, and
Hoque and James (2000) who found a link between size and the use of performance
measures. However the present results fail to find a relationship between size of the
firms and the use of sophisticated management accounting and this is contrary to
findings by, for example, Abdel-Kader and Luther (2008) and Cadez and Guilding
(2008). Abdel-Kader and Luther (2008) found that differences in management
accounting sophistication are explained by size of a firm and Cadez and Guilding
(2008) revealed that SMA usage is positively associated with company size. Similarly
Hansen and Van der Stede (2004) reported that organizational size drives the use of
budgets for performance evaluation and communication of goals. As has been
previously observed, these differences in findings probably reflect the narrow size band
of the firms who responded.
The second contingent variable; intensity of market competition has a positive and
statistically significant relationship with use of a costing system, performance
301
evaluation and a budgeting system. The result is consistent with a number of previous
findings such as by Chenhall and Moris (1986); Mia and Clarke (1998); and Abdel-
Maksoud et al. (2005). For example, Abdel-Maksoud et al. (2005) speculated that
companies in difficult competitive situations measure performance on all the
dimensions available to them. However the findings are at variance with the majority
previous studies, which have reported a positive and significant association between
market competition and the use of sophisticated MAPs. For example, Khandwalla
(1972) and Al-Omiri and Drury (2007) found a positive relationship between intensity
of market competition and the employment of sophisticated management controls. A
possible reason for these different findings is the narrow base from which the
respondents came. It is probable that firms in a limited number of sectors and not
widely varied in size face a similar competitive environment. Thus the variation in
reported intensity of competition is insufficient to generate statistically significant
relationships.
The third contingent variable, participation of owner/manager has a positive and
statistically significant relationship with use of budgeting system, decision support
system and SMA. This result supports the argument and findings of the previous studies
that an owner/manager‘s participation plays a critical role in the effectiveness of
information system implementation in SMEs. For example, Thong and Yap (1995) held
that the owner/manager is an entrepreneur figure, who is crucial in determining the
innovative attitude of a small business. Hence the participation of the owner/manager is
the determinant of the overall management style of the business and would possibly
affect the adoption level of MAPs. Lybaert (1998), who analysed the influences on
information use among Belgian SMEs, also found that owner/managers play a role in
302
the development of MAPs. Al-Omiri (2003) also reported that top management was
significantly associated with ABC implementation success.
The fourth contingent variable, AMT, has a positive and statistically significant
association with use of costing system, performance evaluation system and SMA. This
suggests that technology can be an important factor that affects the use of MAPs in the
smaller firm context. The association between technology with the use of costing
system and performance evaluation system is consistent with several previous findings.
For example Tayles and Drury (1994) reported AMT had a significant or very
significant effect in changing company‘s management accounting system for
performance evaluation system. Similarly Chenhall (1997) and Fullerton and
McWatters (2002), who examined the interaction between JIT and TQM and the use of
performance measures, similarly discovered a positive relationship between these two
variables. Al-Omiri and Drury (2007) found a positive association between higher
levels of cost system sophistication and the extent of the use of JIT and lean production
techniques.
A significant link between AMT and SMA is consistent with past research. For
example, Abdel-Maksoud et al. (2005) found that relatively sophisticated MAPs exist in
firms that have made significant investments in AMT, TQM and JIT, and Abdel-Kader
and Luther (2008) concluded that differences in management accounting sophistication
are explained by the adoption of AMT, TQM and JIT systems.

303
8.7.3 Possible relationship between perceptions of firm performance and the use
of management accounting practices
The results of ordinal regression analysis of the relationships between the use of MAPs
and the perception of firm performance indicate that none of the models were
satisfactory either in terms of significance or explanatory power. Therefore, it may be
concluded that there is no support for the existence of any statistically significant
relationship between the use of MAPs and perceptions of firm performance. A second
attempt to establish a significant relationship was undertaken by reforming the
information on MAPs into nine categories of management accounting techniques. The
results were little improved as the majority of models were not statistically significant
and all lacked significance and explanatory power but some associations for particular
measures were found as shown in Table 8.21 below:
Table: 8.21: Summary of statistically significant results from ordinal regression tests for
an association between nine accounting techniques and perceptions of firm performance
Method of costing
sales growth rate
cash flow growth rate
Partial financial budgeting system
sales growth rate
operating profit growth rate
cash flow growth rate
Method of budgeting
sales growth rate
Non financial performance measures
operating profit growth rate
SMA
cash flow growth rate
304
Table 8.21 indicates that the degree of use of a method of costing, a partial financial
budgeting system, a method of budgeting, non-financial performance measures and
SMA in models that although they have poor explanatory power are significant.
Therefore, given that the results exhibit no consistent or coherent pattern and the models
are generally unsatisfactory, it may be concluded that there is no support for the second
hypothesis and that there is no positive relationship between the use of MAPs and
perception of firm performance. This outcome may be explained by the reliance on
perceptions of performance rather than actual performance data. Perceptions of
performance are inevitably subjective and will exhibit less variability than measures of a
firm‘s actual performance. It was noted, for example, that the majority of the
respondents perceived their performances to be fairly good. Given this pattern of
answers, the demonstration of an association between the use of MAPs and performance
would be hard to establish.
8.7.4 Comparison of results with previous research.
The results fail to provide any consistent or coherent evidence for any relationship that
would support the second hypothesis. Thus the study is at variance with some previous
research, for example Shields (1995) and Kennedy and Graves (2001), who found a
significant association between the use of costing systems and firm performance, and
Hoque and James (2000); Maiga and Jacobs (2003); and Jusoh et al. (2008) who
reported strong evidence for an association between the use of performance measures
and firm performance.
However, the results are consistent with other studies that report a weak or negative
association between the use of MAPs and performance measurement. For example,
Perera et al. (1997) found no association between the use of non-financial measures and

305
perceived performance, Young and Selto (1993) reported that there is little evidence of
an association between the use of non-financial measures in a modern manufacturing
environment and differences in manufacturing performance, and Ittner et al. (2002)
found weak evidence for any relationship between the use of a costing system and
performance.
306
Chapter 9
Conclusions, limitations, and recommendations for future research
9.1 Introduction
This chapter summarises the conclusions reached with respect to the research questions
and hypotheses developed in this study. The chapter starts by reiterating the research
problem, the research questions and the hypotheses before stating the conclusions
reached on each research questions. Lastly, the limitations of the research and some
areas for further research are identified.
9.2 The research problems and conclusions
The importance of small and medium-sized enterprises for the Malaysian economy is
undeniable. As discussed in chapter 3, SMEs in Malaysia play a crucial role by
providing employment opportunities and boosting the growth of the economy. The
SME sector has also proved valuable in helping Malaysia to achieve sustainable
economic growth as the sector has been resilient to the adverse impact of global
economic challenges that impact on the Malaysian economy. Among the different
sectors in which SMEs operate, the manufacturing sector is most significant in terms of
the contribution to GDP and exports from Malaysia, whereas the service and agriculture
sectors contribute most in terms of employment. On balance it is reasonable to claim
that the manufacturing sector is the most important SME sector in Malaysia and to
make it the focus of the research.
A major contributor to the success of SMEs has been support from the Malaysian
government to this sector. Given the various potential advantages from a thriving SMEs
sector, the Malaysian government/policy makers have enacted various policies and

307
interventions to promote SME development and to ensure the sector‘s sustainability and
survival. Financial assistance as well as training in technical aspects of business,
marketing and management skills is among the support from the government for this
sector. These policies and support have successfully stimulated the growth of this
sector. Despite the increasing interest in the SME sector, there is a dearth of academic
research into Malaysian SMEs including their use of MAPs.
Research has shown that MAPs have a role in ensuring that the management of a firm is
efficient and effective and may also improve performance. MAPs also permit firms to
compete in the market place and reduce the likelihood of business failure. Given these
advantages from MAP use, it is important to promote knowledge and awareness of
MAPs among small business in Malaysia so that firms may benefit from the advantages
that have been highlighted above. Furthermore, in a Malaysian context, this lack of
research into MAPs and SMEs may result in a failure by government to appreciate the
importance of MAPs for SMEs. For example, knowledge of MAPs is not included in
management skills training for entrepreneurs provided by the government. This research
may ensure that policy makers are better informed. Therefore the thesis addressed this
literature gap by investigating four research questions:
1. What is the extent of the use of MAPs by Malaysian SMEs?
2. What are the roles of management accounting in SMEs‘ management?
3. What factors affect the extent of the use of MAPs by SMEs?
4. Is there a positive relationship between the use of MAPs and the performance of
SMEs?
Research questions 3 and 4 were expressed in terms of the following two general
hypotheses for empirical testing:
308
H1: There are significant and positive relationships between selected contingent
factors and the use of MAPs.
H2: There is a significant and positive relationship between the use of MAPs and
organizational performance.
The four research questions were answered through evidence obtained from a survey of
1,000 Malaysian SMEs, which elicited 160 useable responses. Three main type of
analyses; descriptive; bivariate and multivariate were undertaken to help answering the
above research questions. The main conclusions for each research question are as
follows:
Research question 1
This research question investigates the current state of the extent of use of MAPs in
Malaysian manufacturing SMEs. Five sub-divisions for MAPs (costing, budgeting,
performance evaluation, decision-making and SMA) were identified. The results
showed a significant uptake of these MAPs in both small and medium sized firms. The
percentage of respondents making some use of these practices varied from 35% to 76%
for small firms and from 58% to 86% among medium sized enterprises. The
unexpectedly high uptake of MAPs may be partly explained by the extensive
employment of qualified accountants by these enterprises with 68% of small firms and
94% of medium sized firms having qualified accountants and the majority of the
remainder employing part-qualified accountants. The employment of qualified
accounting staff is significantly higher in medium sized enterprises compared to small
sized firms and this may account for the relatively higher uptake of MAPs by medium
sized enterprises as opposed to small enterprises. However, it must be remembered that

309
non-response bias tests showed that the sample of small sized firms may not be
representative of the total sample and therefore it is possible that the position is
unrepresentative. The obvious concern is that responses from small sized firms are
biased towards respondents who use MAPs.
The results also indicated that use of traditional MAPs (costing systems and budgeting
systems and performance evaluation systems) was higher than for more sophisticated
MAPs (decision support system and SMA). The significantly lower adoption of
sophisticated MAPs (between 51% and 63%) as opposed to traditional MAPs (76% to
83%) may be because either management is doubtful of the relevancy of those practices
for the relatively small sized of firms or because management is unaware of them. Apart
from that, since newly developed MAPs were created initially for large firms especially
in developed countries, firms in less a developed country may take more time to learn
new ideas and techniques, especially smaller sized firms. Perhaps, also some of the
practices are not yet practical for firms in a developing country due to differences in
culture, state of technology or level of market competitiveness.
The study also investigated the specific extent of use of a range of specific MAPs by
Malaysian SMEs detailing the extent of use of 46 management accounting techniques
under five broad headings of MAPs. Again the results confirm that the use of traditional
management accounting techniques was relatively higher than the use of more recently-
developed management accounting techniques. Financial-based management
accounting techniques such as full financial budgeting, financial performance measures,
product profitability analysis and conventional costing systems, such as process costing,
variable costing and job costing, were widely used by both small and medium sized
enterprises.
310
The results also showed that non-financial performance measures related to internal
processes and to customers are clearly very important in small and medium sized
enterprises. The predominance of the use of these measures indicates the importance for
manufacturing firms to assure the performance of their supply chain. The rest of
recently-developed management accounting techniques largely related to SMA and
decision support systems predictably received less attention from the Malaysian SMEs.
The result is consistent with most of the previous literature relating to management
accounting in developing countries (see for example, Joshi, 2001; Phadoongsitthi, 2003;
and El-Ebaishi et al., 2003).
In terms of category of enterprises, the research showed that medium sized enterprises
outnumbered the small sized enterprises in all five areas of the use of MAPs. The most
significant differences can be seen in the use of techniques under budgeting systems and
both sophisticated MAPs (decision support systems and SMA).
The study concludes that although both Malaysian small and medium sized firms make
extensive use of traditional MAPs they only selectively use modern MAPs. Such
adoption of MAPs by Malaysian SMEs may be largely attributed to the broad
employment of qualified accounting staff with more than 80% of small and medium
sized enterprises indicating that they have hired qualified or part-qualified accounting
staff in their firms. The difference in uptake is greater for sophisticated MAPs, which
are employed reasonably extensively by medium sized enterprises but markedly less by
small enterprises. In addition a significant uptake of traditional MAPs by Malaysian
SMEs may be attributed to the fact that information on these measures is more readily
available as opposed to modern management accounting techniques which may be
perceived as more uncertain, less practical and costly. Apart from that size of firms may
311
be a key factor in these results. As argued before, larger firms need more sophisticated
MAPs to manage the complexity of their operation due to their larger investment.
Besides, larger firms have advantages in term of a greater access of resources to employ
new management practices in their firm (see Chenhall and Langfield-Smith, 1998 and
Abdel-Kader and Luther, 2008). As such the results support the contingency theory of
the impact of size on the level of use of sophisticated MAPs.
Research question 2
The results suggest that MAPs were perceived as playing important roles in the
management of Malaysian SMEs - despite assertions from some commentators that
management accounting is irrelevant to meeting managerial needs especially in a
modern manufacturing environment (see for example Johnson and Kaplan, 1987 and
Cooper, 1990). The results confirm that in Malaysian SMEs MAPs are perceived as
relevant and useful to today‘s organizations. Respondents agreed that MAPs have a
specific role in helping these SMEs to plan, control, evaluate performance, optimize the
use of resources, assist in decision making, and improve communication.
Research question 3
The analyses of factors that affect the use of MAPs among Malaysian SMEs only
considered data from medium sized enterprises. This was due to the concerns about
non-response bias in the responses from small enterprises. Table 9.1 below provides a
summary of the results.

312
Table 9.1: Summary of the results of bivariate and multivariate analyses regarding
factors affecting the use of MAPs.
Bivariate analysis Multivariate analysis
Annual sales
turnover
Costing system
Performance evaluation system
Costing system
Performance evaluation system
Intensity of market
competition
Costing system
Budgeting system
Performance evaluation system
Costing system
Budgeting system
Performance evaluation system
Participation of
owner/manager
Decision support system
Strategic management accounting
Budgeting system
Decision support system
Strategic management accounting
Advanced
manufacturing
technology
Costing system
Performance evaluation system
Strategic management accounting
Costing system
Performance evaluation system
Strategic management accounting
The level of
qualification of
accounting staff
None None
The analyses using bivariate and regression approaches delivered relatively consistent
results in that size of firm, intensity of market competition and AMT were found to
have positive and statistically significant relationships with the use of certain MAPs in
both analyses. Those contingent variables have similarly associated with the use of
costing systems and performance evaluation systems. Further the use of budgeting and
more sophisticated MAPs is largely associated with participation of the owner/manager
of firm. The last variable; the level of qualification of accounting staff was only tested
by bivariate analysis. The variable was found not to have positive and significant
relationships with the use of any MAPs. Given the uncertainty regarding the exogeneity
of this variable, it was excluded in the multivariate analysis. Even if it is included, the
variable was found not to have a statistically significant association with any of the five
categories of MAPs which is consistent with the results in the bivariate analysis.
313
Overall the results indicate that some use of particular MAPs depends upon specific
contingent factors. Four out of five contingent factors; size of the firm, intensity of
market competition, participation of owner/manager of firm and AMT have a positive
and statistically significant relationship with the use of certain MAPs. Therefore, it is
probable that the Malaysian SMEs make more use of MAPs when their firms face
environmental complexity either internally or externally or when the owner/manager is
committed to their use.
Research question 4
The possibility of a relationship between the use of MAPs and firm performance was
analysed using both bivariate and multivariate analysis. Some moderate evidences were
found in the bivariate analysis. However in the multivariate analysis, only a few
potential statistically significant relationships were traced, however the overall strength
of the regression models involved were generally extremely weak and thus the results
must be deemed unreliable. Therefore, the results from the two analyses find no
coherent pattern of association between the use of MAPs and firm performance. The
results suggest that MAPs do not directly produce an improvement in firm performance.
Probably MAPs act as supporting tools that can help to increase efficiency and help
management to effectively manage activity rather than directly improve the
performance of firms.
314
9.3 Implications and recommendation
This research concerns the use of MAPs by SMEs. Although there is a body of literature
examining the use of MAPs, the focus has been on larger firms and no previous
research has exclusively addressed the use of MAPs in SMEs particularly in a
developing country. This research therefore makes its own specific contribution by
providing knowledge of MAPs in SMEs in a developing country. The research is
distinct not only because it documents the uptake of MAPs among SMEs; but also
because it addresses the roles of MAPs in the management of SMEs; investigates
factors affecting the use of MAPs, and examines the impact of MAPs on the
performance of firms in SME sector.
By filling this research gap, this study has sought to advance understanding of recent
developments of MAPs in SMEs particularly in a developing country context by adding
new empirical evidence to the body of knowledge on the use of MAPs as well as
responding to calls for research into MAPs in small business (see Mitchell et al., 1998;
Mitchell and Reid, 2000; and Nimtrakoon, 2009).
This research considers a broad range of MAPs instead of focusing on a single MAP or
a limited set of MAPs. The information will increase an understanding on how far small
businesses have taken advantages of the available MAPs and whether they have adopted
newly developed techniques to some extent.
Using the notion of contingency theory as a foundation, this research has also advanced
the current state of knowledge by shedding light on factors influencing the use of MAPs
in small businesses in a developing country. The findings indicate that MAPs can be
influenced by external environment as well as by factors within the organization. As
315
such this research has responded to the recent calls for additional contingency based
research in management accounting in order to enhance understanding of potential
contingency factors which explain the use of MAPs (Chenhall and Langfield-Smith,
1998; and El-Ebaishi et al., 2003). It extends the body of knowledge that use
contingency theory to explore the significance of contingency variables in small
businesses.
Further this research has made at contribution by exploring the roles of MAPs in the
management of SMEs and examining for a possible association between the some use
of MAPs and improved firm performance. As such this research has highlighted the
importance of management accounting in the management as well as the relationship of
their use to organisational performance. Consequently this research has extended the
findings of Chenhall and Langfield-Smith (1998) and El-Ebaishi et al. (2003) among
others.
This research has increased knowledge of MAPs in a SMEs context. Malaysia as a
developing country has strived to move to parity with more developed economies, and
find the research useful to provide relevant knowledge that can support efforts to
enhance the performance of Malaysian SMEs. The findings will be informative for
policy makers intent on developing management accounting skills among Malaysian
SMEs. In specific it is hoped that the Malaysian government will enhance the existing
training programmes to the Malaysian entrepreneurs or young graduates by subsidising
the training in the use of MAPs so that the SMEs. The training should bring more
awareness to the use of MAPs particularly to the use of more modern MAPs. More
broadly this research will promote interest among Malaysian researchers as well as
researchers of other countries to take the SMEs sector as a focus of interest for their
316
research. This study can be also a starting point for further investigations and analysis of
MAPs among SMEs in Malaysia.
The study suggests that there is ample room to increase both awareness of and
understanding of the importance of MAPs within smaller firms since these practices are
vital ingredients in the success of any organizations. The results indicated that
traditional and financially oriented MAPs have high level of usage but the adoption of
newly-developed MAPs remains patchy. Perhaps Malaysian policy makers could
provide training in these techniques for entrepreneurs or future graduates in Malaysia.
In conclusion, the work presents a comprehensive survey and explanations of the use of
MAPs in SMEs and therefore makes a contribution to the awareness of management
accounting in small firms particularly in a developing economy.
9.4 Limitations of the study
The study has the following limitations. First, the low response to the questionnaire
survey potentially introduces non-response bias especially for small sized enterprises
category where such bias was identified by testing. For small sized enterprises, this bias
restricted generalization of the findings and prevented further statistical analyses for this
group but caution must also be exercised when generalizing from the results for medium
sized enterprises given the low response rate. However, data collection for SMEs is
difficult and therefore the limitation of low response rates cannot be avoided.
Second, the performance of firms across different dimensions was measured using
qualitative perceptions rather than quantitative results. As argued before, organizational
performance is complex and difficult to measure. Hence the concept of

317
multidimensionality has been used increasingly in many management accounting
researches (Nimtrakoon, 2009). Although a self-rating scale has been criticised on
grounds of a lack of objectivity, it is the only source available given that SMEs are
unwilling to divulge quantitative results. However, Dess and Robinson (1984) reported
that subjective perceptions of top management on performance were consistent with
actual performance; hence the use of subjective measures is appropriate in the absence
of objective measures.
Third, this research only focused on one sector (manufacturing sector) because it
contained the largest concentration of medium sized firms and had the greatest
economic significance of any sector. The sampling design therefore restricts the
generalisability of the research findings to all SMEs.
Fourth, the range of contingent variables used in this study is quite small. This reflects
the less complex environment in which SMEs operate. The limited number of variables
was also decided upon to avoid confusing respondents or discouraging them from
responding by excessive complexity. Considerations that is especially important given
that the sample is unused to academic research questionnaires.
The use of a postal survey imposes some restrictions in terms of the nature and volume
of questions and it does not facilitate follow-up questions to explore potentially
interesting areas or apparently inconsistent responses. The possibility of
misinterpretation or misunderstanding of questions by respondents can never be ruled
out. As the study examined a large number of items, it is possible that respondents may
have misinterpreted some items. Furthermore, the results were derived from the
responses of a majority of accounting managers who are likely have some biased views

318
in the success of management accounting techniques and practices. This is why a few
results such as the use of ABC and target costing are relatively higher than in the
previous study.
Lastly, this study contained complex aspects of MAP usage within yes or no questions
or Likert scale questions and as with all surveys, it is possible that respondents may
have misinterpreted some questions. This possibility was minimised through the pilot
study and the care taken to ensure that the survey was completed by accounting
executive or accounting manager.
Despite these limitations, the study provides evidence of the state of MAP usage by
Malaysian SMEs with additional information on the significant factors that affected the
use of MAPs in Malaysian SMEs and the effect of the use of MAPs on organizational
performance. It is suggested that, this piece of work has made an important contribution
to research on the employment of MAPs and has successfully responded to the need for
research into MAP usage by SMEs in developing countries.
9.5 Recommendations for future research
The results of this research raise several issues that warrant future research.
First, the sample of small firms should be extended to achieve a valid set of responses.
This would enable differences based upon size to be clearly identified and highlight the
effect of contingent factors in different contexts. However, this may prove difficult as
there must be the possibility that small firms without MAPs will be much less likely to
complete the questionnaire and thus bias the responses.
319
Second, in the context of contingency theory it might be advantageous to focus on a
sample from one particular industry such as electric and electronics or food and
beverages in the manufacturing sector. This would mean that the sample would be more
homogeneous and might be expected to use certain types of MAPs or certain
techniques. This might make the contingent factors explaining differences more distinct.
Alternatively a case study approach might be employed to highlight differences and
reasons for them in a more detailed context so that how and why practices and
techniques are applied or not applied would be identifiable.
Third the nature of the dependence between traditional and recently-developed MAPs
needs further investigation. The lower use of sophisticated MAPs raises the question of
the conditions necessary to effectively implement these techniques within smaller firms.
Again a qualitative case study approach would be likely to provide additional insights
beyond those that can be gleaned from a questionnaire survey approach.
Fourth, the next few years are likely to see increased global competitiveness in the
Malaysian industrial markets; therefore it would be interesting to expand the survey to
provide a longitudinal study of management accounting change by documenting
changes over time in the adoption of specific management accounting techniques in a
more detailed way.
Lastly, research in this area can be developed by conducting a comparative study of the
Malaysian situation on adoption of MAPs against that in other developing countries in
order to explore differences in terms of cultural and other contingent factors.
320
References
Abdel-Kader, M. and Luther, R. (2006). Management accounting practices in the
British food and drinks industry. British Food Journal, vol. 108, no.5, pp. 336-357.
Abdel-Kader, M. and Luther, R. (2008). The impact of firm characteristics on
management accounting practices: A UK-based empirical analysis. The British
Accounting Review, vol. 40, pp. 2-27.
Abdel-Maksoud, A. (2004). Manufacturing in the UK: contemporary characteristics and
performance indicators. Journal of Manufacturing Technology Management, vol. 15,
no. 2, pp. 155-171.
Abdel-Maksoud, A., Dugdale, D. and Luther, R. (2005). Non-financial performance
measurement in manufacturing companies. The British Accounting Review, vol. 37, pp.
261-297.
Abdel-Maksoud, A., Asada, T. and Nakagawa, M. (2008). Performance measures,
managerial practices and manufacturing technologies in Japanese manufacturing firms:
state-of-the-art. International Journal Business Performance Management, vol. 10, no.
1.
Abdul Ghani, Z. (2007). The SME sector in Malaysia. Bank for International Settlement
(BIS) Review. Retrieved from http://www.bis.org/review/r070704e.pdf?frames=0
Abdullah, M.A., Latif, A.A., Bakar, M.I. and Nor, N.M. (2000). The outreach of
support programmes for bumiputra‘s entrepreneurs in SMEs: Evidence from Malaysia.
The 46th 18 International Conference on Small Business (46th ICSB), 17-19th June
2001, Small Business Development Corporation, Taiwan.
Abernethy, M.A. and Lillis, A.M. (1995). The impact of manufacturing flexibility on
management control system design. Accounting, Organizations and Society, vol. 20,
no.4, pp. 241-258.
Adler, R., Everett, A.M. and Waldron, M. (2000). Advanced management accounting
techniques in manufacturing: utilization, benefits, and barriers to implementation.
Accounting Forum, vol. 24, no. 2, pp. 131-150.
Abs, G., Grimstad, C., Hay, R., Howe, W.A., La Place, W., McGurr, F.J. and Serraino,
W. (1954). Historical Dates in Accounting. The Accounting Review, vol. 29, no. 3, pp.
486-493.
Agresti, A. (1990). Categorical Data analysis. New York: Jon Wiley.
Ahmed, S., Hassan, M.H. and Taha, Z. (2004). State of implementation of TPM in
SMIs: a survey study in Malaysia. Journal of Quality in Maintenance Engineering, vol.
10, no. 2, pp. 93-106.
Alam, S.S. and Ahsan N. (2007). ICT adoption in Malaysian SMEs from services
sectors: preliminary findings. Journal of Internet Banking and Commerce, vol. 12, no.3.
321
Alasadi, R. and Abdelrahim, A. (2008). Analysis of Small Business Performance in
Syria. Education, Business and Society: Contemporary Middle Eastern Issues, vol.1,
pp. 50-62.
Alawattage, C., Hopper, T. and Wickramasinghe, D. (2007). Introduction to
management accounting in less developed countries. Journal of Accounting &
Organizational Change, vol. 3, no. 3, pp. 183-191.
Alnamri, M.J. (1993). Management accounting in Saudi Arabia: A comparative
analysis and western approaches. Ph.D Thesis, University of Newcastle Upon Tyne,
United Kingdom.
Allot, A., Weymouth, P. and Claret, J. (2000). Transforming the profession
management accounting is changing. The Chartered Institute of Management
Accountant (CIMA). pp. 127-147.
Allot, A. (2000). Management Accounting Change. The Chartered Institute of
Management Accountant (CIMA).
Al-Omiri, M. and Drury, C. (2007). A survey of factors influencing the choice of
product costing systems in UK organizations. Management Accounting Research, vol.
18, pp. 399-424.
Al-Omiri, M. (2003). The diffusion of management accounting innovations: a study of
the factors influencing the adoption, implementation levels and success of ABC in UK
companies. Ph.D Thesis, University of Huddersfield, United Kingdom.
Amat, J., Carmona, S. and Roberts, H. (1994). Context and change in management
accounting systems: A Spanish case study. Management Accounting Research, vol. 5,
no. 2, pp. 107-122.
Anderson, W.E., Fornell, C. and Lehmann, D. (1994). Customer satisfaction, market
share, and profitability: Findings from Sweden. Journal of Marketing (July): pp. 53-66.
Andersen, M. and Rohde, C. (1994). Empirical Study of the Design of Management
Accounting in Danish Companies. The 17th Annual Congress of the European
Accounting Association. Collected Abstracts, Venice, pp. 103.
Anderson, S.W. and Lanen, W. (1999). Economic transition, strategy and the evolution
of management accounting practices: The case of India. Accounting, Organizations and
Society, vol. 24, no. 5-6, pp. 379-412.
Ansari, S.L. (1977). An Integrated Approach to Control System Design. Accounting,
Organizations and Society, pp. 101-112.
Anthony, R.N. (1965). Planning and Control Systems: A Framework for Analysis.
Boston: Division of Research. Graduate Svhool of Business Administration, Harvard
University.
Aris, M.N. (2006). SMEs: Building Blocks for economic growth. National statistics
conference. Department of Statistics, Malaysia.

322
Aris, N.M. (2007). SMEs: Building Blocks for Economic Growth. Journal of
Department of Statistics, Malaysia, vol. 1.
Armitage, H.M. and Nicholson, R. (1993). Activity based costing: a survey of Canadian
practice. Issue paper no. 3, Mississauga, Ontario, Canada: Society of Management
Accountants of Canada.
Armitage P. and Berry, G. (1994). Statistical Methods in Medical Research. 3rd
ed.
Blackwell.
Armstrong, J.S. and Overton, T.S. (1977). Estimating nonresponse bias in mail surveys.
Journal of Marketing Research, vol.14, pp. 396-402.
Armstrong, P., Marginson, P., Edwards, P. and Purcell, J. (1996). Budgetary control and
the labor force: findings from a survey of large British companies. Management
Accounting Research, vol.7, pp.1-23.
Arnold, H.L. (1902). The factory manager and accountant: some examples of the latest
American factory practice. University of California Libraries.
Ask, U., Ax, C. and Jonsson, S. (1996). Cost management in Sweden: from modern to
post-modern, in Bhimani, A. (ed). Management Accounting: European Perspectives,
Oxford, Oxford University Press, pp. 199-217.
Atkinson, A.A., Banker, R.D., Kaplan, R.S. and Young, S.M. (2001). Management
Accounting, 3rd
ed., New Jersey: Prentice Hall.
Azen, R. and Walker, C.M. (2011). Categorical Data Analysis for the Behavioral and
Social Sciences. USA: Taylor and Francis Group.
Banker, R.D., Potter, G. and Srinivasan, D. (2000). An empirical investigation of an
incentive plan that includes non-financial performance measures. The Accounting
Review, vol. 75, pp. 65-92.
Berry, T., Sweeting, B., Goto, J. and Taylor, M. (2002). Financial Management
practice amongst SMEs. Working paper series, Manchester Metropolitan University.
Bhimani, A. (1996). Management Accounting, European Perspectives. Oxford
University Press, Oxford.
Bhimani, A. (2002). Management Accounting and Organizational Excellence,
Management Press International LTD, United Kingdom.
Bjørnenak, T. (1997). Diffusion and accounting: the case of ABC in Norway.
Management Accounting Research, vol. 8, pp. 3-17.
Blau, Peter M. (1970). A formal theory of differentiation in organizations. American
Sociological Review, vol. 35, pp. 201-218.
Boocock, G. and Shariff M.N.M. (2005). Measuring effectiveness of credit guarantee
schemes: Evidence from Malaysia. International Small Business Journal, vol. 23, pp
427.

323
Bourne, M. (2004). Driving value through strategic planning and budgeting. A report on
the Better Budgeting forum from CIMA and ICAEW. CIMA.
Bose, J. (2001). Nonresponse bias analyses at the national center for education statistics.
Proceedings of statistics Canada symposium, Achieving data quality in statistical
agency: A methodological perspective. Canada.
Botsch, R.E. (2011). Significance and measures of association. Retrieved from
http://www.usca.edu/polisci/apls301/Text/Chapter%2012.%20Significance%20and%20
Measures%20of%20Association.htm
Bright, J., Davies, R.E., Downes, C.A. and Sweeting, R.C. (1992). The deployment of
costing techniques and practices: a UK study. A Management Accounting, vol. 3, no. 3,
pp. 201-212.
Bromwich, M. (1990). The case for strategic management accounting: The role of
accounting information for strategy in competitive markets. Accounting, Organizations
and Society, vol. 15, pp. 27-46.
Brown, A., Booth, P. and Giacobbe, F. (2004). Technological and Organizational
Influences on the Adoption of activity-based costing in Australia. Accounting and
Finance, vol. 44, no. 3, pp. 329-356.
Bruggeman, W., Slagmulder, R. and Waeytens, D. (1996). Management accounting
changes: the Belgium experience, in Bhimani, A. (ed.). Management Accounting:
European Perspectives. Oxford: Oxford University Press, pp. 1-30.
Bruns, W.J. and Waterhouse, J.H. (1975). Budgetary control and organization structure.
Journal of Accounting Research vol. 13, pp.177-203.
Bruns Jr., W.J. and Kaplan, R.S. (1987). Accounting and Management: Field Study
Perspectives. Harvard Business School Press, Boston, pp. 97–118.
Bryant, L., Jones, D.A. and Widener, S.K. (2004). Managing value creation within the
firm: An examination of multiple performance measures. Journal of Management
Accounting Research, vol. 16, pp. 107-131.
Bryman, A. (2008). Social Research Methods, 3rd
ed. New York: Oxford.
Bryman, A. and Cramer, D. (2008). Quantitative data analysis with SPSS 14, 15 and
16: A guide for social scientists. London: Routledge.
Burns, J., Ezzamel, M. and Scapens, R.S. (1999). Management accounting change in the
U.K. Management Accounting, vol. 77, no. 3, pp. 28-30.
Burns, J. and Scapens, R. (2000). The Changing Nature of Management Accounting and
the Emergence of ‗Hybrid‘ Accountants. Financial and Management Accounting.
Burns, T. and Stalker, G.M. (1961). The Management of Innovation. London Tavistock.
324
Cadez, S. and Guilding, C. (2008). An exploratory investigation of an integrated
contingency model of strategic management accounting. Accounting, Organizations and
Society, vol. 33, pp. 836-863.
Caplan, D. (2006). Management Accounting Concepts and Techniques. University at
Albany (State University of New York). Retrieved from
http://denniscaplan.fatcow.com/Chapter02.htm
Cassell, M. (2003). Can we budge it? (beyond budgeting). Financial Management,
November.
Central Bank of Malaysia (CBM) (2003). A comprehensive framework for the
development of Small and Medium enterprises in Malaysia. Central Bank of Malaysia.
Available from
http://www.bnm.gov.my/files/publication/ar/en/2004/cp01_002_whitebox.pdf.
Central Bank of Malaysia (CBM) (2005). Small and Medium Enterprise (SME) Annual
Report 2005.Central Bank of Malaysia. Malaysia.
Chapman, C.S. (1997). Reflections on a contingency view of accounting. Accounting,
Organizations and Society, vol. 22, no. 2, pp.189-205.
Chen, C.K. and Hughes, J. Jr. (2004). Using ordinal regression model to analyze student
satisfaction questionnaires. IR applications, Using Advanced tools, techniques and
methodology, vol. 1. Association for institutional research.
Chenhall, R.H. and Morris, D. (1986). The impact of structure, environment, and
interdependence on the perceived usefulness of management accounting systems. The
Accounting Review, vol. 61, no. 1, pp. 16-35.
Chenhall, R.H. and Brownell, P. (1988). The effect of participative budgeting on job
satisfaction and performance: role ambiguity as an intervening variable. Accounting,
Organizations and Society, vol. 13, no. 3, pp. 225-233.
Chenhall, R.H. (1997). Reliance on manufacturing performance measures, total quality
management and organisational performance. Management Accounting Research, vol.
8, no. 2, pp. 187-206.
Chenhall, R.H. and Langfield-Smith, K. (1998). Adoption and benefits of management
accounting practices: An Australian study. Management Accounting Research, vol. 9,
no. 1, pp. 1-19.
Chenhall, R.H. (2003). Management control systems design within its organizational
context: findings from contingency-based research and directions for the future.
Accounting, Organizations and Society, vol. 28, pp. 127-168.
Chenhall, R.H. and Langfield-Smith, K. (2007). Multiple perspectives of performance
measures. European Management Journal, vol. 25, no. 4, pp. 266-282.
Choe, J. (2004). The relationships among management accounting information,
organizational learning and production performance. Journal of Strategic Information
Systems, vol. 13, pp. 61-85.
325
Chong, V.K. and Chong, K.M. (2002). Budget goal commitment and informational
effects of budget participation on performance: a structural equation modeling
approach. Behavioral Research in Accounting, vol. 14, pp. 65-86.
Chow, C.W., Shields, M.D. and Wong-Boren, A. (1988). A compilation of recent
surveys and company-specific descriptions of management accounting practices.
Journal of Accounting Education, vol. 6, pp. 183-207.
Chun, L.S., Kassim, N.A.A. and Minai, B. (1994). Are management accounting systems
in Malaysia outmoded?. Singapore Management Review, pp. 55-67.
Ciaran, M. and John, C. (1995). Enlarging the role of management accounting with
DSS. Management Accounting: Magazine for Chartered Management Accountants, vol.
73, Issue 3, pp. 54.
CIMA (1987). Management Accounting Official Terminology. The Chartered Institute
of Management Accountant.
CIMA (2002). Latest trends in corporate performance measurement. Developing and
promoting strategy. July. CIMA. London.
CIMA (2005). Management Accounting Official Terminology. The Chartered Institute
of Management Accountant.
Cinquini, L., Collini, P., Marelli, A., Quagli A. and Riccardo, S. (1999). A survey on
cost accounting practices in Italian large and medium size manufacturing firms. The
22nd annual congress of the European Accounting Association Bordeaux, France 5 - 7
May. France.
Cinquini, L. and Mitchell, F. (2005). Success in management accounting: lessons from
the activity-based costing/management experience. Journal of Accounting and
Organisational Change, vol.1, pp.63-78.
Collier, P.A. (1994). Factors affecting the voluntary formation of audit committees in
major UK listed companies. Ph.D Thesis, University of Exeter, United Kingdom.
Collier, P.A. and Wallace, R.S.O. (1992). Mail accounting survey response patterns: an
example of the total design method. Accounting Education, vol. 1, no. 4, pp. 277-291.
Collier, P.A. and Gregory, A. (1995). Strategic management accounting: A UK hotel
sector case study. International Journal of Contemporary Hospitality Management, vol.
7, no. 1, pp. 16-21.
Collins, F., Holzmann, O. and Mendoza, R. (1997). Strategy, budgeting, and crisis in
Latin America. Accounting, Organizations and Society, vol. 22, no. 7, pp. 669-689.
Collis, J. and Jarvis, R. (2002). Financial information and the management of small
private companies. Journal of Small Business and Enterprise Development, vol. 9, no.
2, pp. 100-110.
Collis, J. and Hussey, R. (2009). Business research. A practical guide for
undergraduate & postgraduate students. 3rd ed. Palgrave Macmillan, New York.
326
Cook, P. (2001). Finance and small and medium-sized enterprise in developing
countries. Journal of Developmental Entrepreneurship; vol. 6, no. 1, pp. 17.
Cooper, R. (1990). Explicating the logic of ABC. Management Accounting (UK), pp.
58-60.
Cramer, J.S. (1990). An Introduction the Logit Model for Economist. Routledge:
Chapman and Hall Inc.
Cress, W.P. and Pettijohn, J.B. (1985). A survey of budget-related planning and control
policies and procedures. Journal of Accounting Education, vol. 3, pp. 61-78.
Cunningham, G.M. (1992). Management control and accounting systems under a
competitive strategy. Accounting, Auditing and Accountability Journal, vol. 5, no. 2, pp.
85-158.
Daft, R.L. and Macintosh, N.B. (1978). A new approach to design and use of
management information, California Management Review, vol. XXI, no. 1, pp. 82-92.
Dean, G.W., Joye, M.P. and Blayney, P.J. (1993). Strategic management accounting
survey: overhead cost allocation performance evaluation practices of Australian
manufacturers. The Accounting Review, vol. 68, no. 2, pp. 426-427.
De Joysa, A. and Kanthi Herath, S. (2007). Standard costing in Japanese firms: Re-
examination of its significance in the new manufacturing environment. Industrial
Management & Data Systems, vol. 107, no. 2, pp. 271-283.
Dekker, H.C. (2003). Value chain analysis in interfirm relationships: A field study.
Management Accounting Research, vol. 14, pp. 1-23.
Dekker, H.C. and Smidt, P. (2003). A survey of the adoption and use of target costing
in Dutch firms. International Journal Production Economics, vol. 84, pp. 293-305.
Dent, J.F. (1990). Strategy, organization and control: some possibilities for accounting
research. Accounting, Organizations and Society, vol. 15, no. 1, pp. 3-25.
Demirbag, M., Tatoglu, E., Tekinkus, M. and Zaim S. (2006). An analysis of the
relationship between TQM implementation and organizational performance: Evidence
from Turkish SMEs. Journal of Manufacturing Technology Management, vol. 17, no. 6,
pp. 829-847.
Demong, R.F. and Croll, D.B. (1981). Cost accounting for the small business. American
Journal of Small Business, vol. 5, no.4, pp. 48-60.
Deros, B.M, Yusof, S.M. and Salled, A.M. (2006). A benchmarking implementation
framework for automotive manufacturing SMEs. Benchmarking International Journal,
vol. 13, no. 4, pp. 396-43.
Dess, G.G. and Robinson, R.B. (1984). Measuring organizational performance in the
absence of objective measures: The case of the privately-held firm and conglomerate
business unit. Strategic Management Journal, vol. 5, no. 3, pp. 265-273.
327
Dillman, D.A. (1978). Mail and Telephone Surveys: The Total Design Method. John
Wiley & Sons, New York.
DOS (2005). Census of Establishments and Enterprises. Profile of Small and Medium
Enterprises. Department of Statistic. Malaysia.
Drury, C., Braund, S., Osborne, P. and Tayles, M. (1993). A survey of management
accounting practices in UK manufacturing companies, Chartered Association of
Certified Accountants.
Drury, C. (1994). Costing. An introduction. Chapman and Hall.
Drury, C. and Tayles, M. (1995). Issues arising from surveys of management
accounting practice. Management Accounting Research, vol.6, pp.267-280.
Drury, C. (ed) (1996). Management Accounting Handbook, 2nd ed. CIMA,
Butterworth-Heinemann, pp. 1-13.
Drury, C. and Tayles, M. (2006). Profitability analysis in UK organizations: An
exploratory study. The British Accounting Review, vol. 38, pp. 405-425.
Dugdale, D. and Lyne, S. (2004). Beyond budgeting or better budgeting?. A report on
the Better Budgeting forum from CIMA and ICAEW. CIMA.
Dunk, A.S. (1993). The effect of budget emphasis and information asymmetry on the
relation between budgetary participation and slack. The Accounting Review, vol. 68, no.
2, pp. 400-410.
Dunk, A.S. (2004). Product life cycle cost analysis: The impact of customer profiling,
competitive advantage, and quality of IS information. Management Accounting
Research, vol. 15, pp. 401-414.
Dunn, P.M., Ezell, D.E. and Roberts, A.T. (1980). The use of accounting information in
the small business firm's planning and control process. American Journal of Small
Business, vol. IV, no. 4.
Easterby-Smith, M., Thorpe, R. and Jackson, P.R. (2008). Management research. 3rd
ed.
Sage Publications Ltd.
Ekholm, B-G. and Wallin, J. (2000). Is the annual budget really dead?. The European
Accounting Review, vol. 9, no. 4, pp. 519–539.
El-Ebaishi, M., Karbhari, Y. and Naser, K. (2003). Empirical evidence on the use of
management accounting techniques in a sample of Saudi manufacturing companies.
International Journal of Commerce and Management, vol. 13, no. 2, pp. 74-101.
Emmanuel, C., Otley, D. and Merchant, K., (1990). Accounting for Management
Control, 2nd
ed., London: Chapman & Hall.
Emory, C.W. and Cooper, D.R. (1991). Business Research Methods. Irwin.
328
Epstein, M. and Manzoni, J. (1998). Implementing corporate strategy: from tableaux de
bord to balanced scorecards. European Management Journal, vol. 16, pp. 190-203.
Fan, Q. (2003). Importance of SMEs and the role of public support in promoting SME
development. Creating a conducive legal & regulatory framework for small and medium
enterprise development in Russia. A Policy Dialogue Workshop, St. Petersburg, Russia.
September 14-16. Russia.
Feng, M., Terziovski, M. and Samson, D. (2008). Relationship of ISO 9001:2000
quality system certification with operational and business performance. A survey in
Australia and New Zealand-based manufacturing and service companies. Journal of
Manufacturing Technology Management, vol. 19, no. 1, pp. 22-37.
Field, A. (2000). Discovering statistics using SPSS for windows. London, Sage.
Firth, M. (1996). The diffusion of managerial accounting procedures in the People‘s
Republic of China and the influence of foreign partnered joint ventures. Accounting,
Organizations and Society, vol. 21, no. 7/8, pp. 629-54.
Fisher, J., Maines, L.A., Peffer, S.A. and Sprinkle, G.B. (2002). Using budgets for
performance evaluation: Effects of resource allocation and horizontal information
asymmetry on budget proposals, budget slack, and performance. The Accounting
Review, vol. 77, no. 4, pp. 847-865.
Fisher, J. (1996). The impact of perceived environmental uncertainty and individual
differences on management information requirements: A research note. Accounting,
Organizations and Society, vol. 21, no. 4, pp. 361-369.
Flamholtz. E.G. (1983). Accounting, Budgeting and Control Systems in Their
Organizational Context, Accounting, Organizations and Society, pp. 15-169.
Folk, J.M., Ray H.G. and Eric W.N. (2002). Introduction to Managerial Accounting.
New York: McGraw-Hill.
Foster, G. and Swenson D.W. (1997). Measuring the success of activity-based cost
management and its determinants. Journal of Management Accounting Research, vol.
9, pp. 109-142.
Fowler, F.J.J. (1993). Survey Research Methods. 2nd
ed. Applied Social Research
Methods Series, vol. 1, SAGE Publications.
Freedman, J.M. (1996). Development of Activity-based costing applications: Trends in
financial management,. Management Accounting (USA), June.
Frezatti, F. (2007). The ―economic paradigm‖ in management accounting return on
equity and the use of various management accounting artifacts in a Brazilian context.
Managerial Auditing Journal, vol. 22, no. 5, pp. 514-532.
Fruitticher, L., Stroud, N., Laster, J. and Yakhou, M. (2004). USA budget practices case
studies. Managerial Auditing Journal, vol. 20, no. 2, pp. 171-178.
329
Fry. T.D., Steele, D.C. and Saladin, B.A. (1998). The use of management accounting
systems in manufacturing. International Journal of Production Research, vol. 36, no. 2,
pp. 503-525.
Fullerton, R.R. and McWatters, C.S. (2002). The role of performance measures and
incentive systems in relation to the degree of JIT implementation. Accounting,
Organizations and Society, vol. 27, no. 8, pp. 735-771.
Galbraith, J.R. (1973). Designing Complex Organizations. Addison-Wesley.
Garrison, R. and Noreen, E. (2000). Managerial Accounting, 9th
ed., USA: Irwin
McGraw-Hill.
Garcke, E. and Fells, J.M. (1887). Factory Accounts. London. Crosby Lockwood.
Garg, V.K., Walters, B.A. and Priem, R.L. (2003). Chief executive scanning emphases,
environmental dynamism and manufacturing firm performance. Strategic Management
Journal, vol. 24, no. 8, pp. 725-44.
Garner, S.P. (1947). Historical Development of Cost Accounting, The Accounting
Review, vol. 22, no. 4, pp. 385-389.
Ghauri, P., Gronhaug, K. and Kristianslund, I. (1995). Research methods in business
studies. A practical guide. Prentice Hall.
Georgellis, Y., Joyce, P. and Woods, A. (1999). Entrepreneurial action, innovation and
business performance: The small independent business. Journal of Small Business and
Enterprise Development, vol. 7, no. 1.
Gerdin, J. and Greve, J. (2004). Forms of contingency fit in management accounting
research - a critical review. Accounting, Organizations and Society, vol. 29, pp. 303-
326.
Gerdin, J. (2005). Management accounting system design in manufacturing
departments: an empirical investigation using a multiple contingencies approach.
Accounting, Organizations and Society, vol. 30, pp. 99-126.
Ghosh, B.C. and Chan, Y.K. (1997). Management accounting in Singapore-well in
place?. Managerial Auditing Journal, vol. 12, no.1, pp. 16-18.
Ginzberg, M.J. (1980). An organizational contingencies view of accounting and
information systems implementation. Accounting, Organizations and Society, vol. 5, pp.
369–382.
Gomes, C.F., Yasin, M.M. and Lisboa, J.V. (2004). An examination of manufacturing
organizations‘ performance evaluation; Analysis, implications and a framework for
future research. International Journal of Operations & Production Management, vol. 24
no. 5, pp. 488-513.
Gordon, L.A. and Miller, D. (1976). A contingency framework for the design of
accounting information systems. Accounting, Organizations and Society, pp. 59-69.

330
Gordon, L.A. and Narayanan, V.K. (1984). Management accounting systems, perceived
environmental uncertainty and organization structure: An empirical investigation.
Accounting, Organizations and Society, vol. 9, no. 1, pp. 33-47.
Gordon, L.A. and Silvester. K.J. (1999). Stock market reactions to activity-based
costing adoptions. Journal of Accounting and Public Policy, vol. 18, pp. 229-251.
Gosselin, M. (1997). The effect of strategy and organizational structure on the adoption
and implementation of activity-based costing. Accounting, Organizations and Society,
vol. 22, no. 2, pp. 105-122.
Govindarajan, V. (1984). Appropriateness of accounting data in performance
evaluation: An empirical examination of Environmental uncertainty as an intervening
variable. Accounting, Organizations and Society, pp. 125-136.
Govindarajan, V. and Gupta, A.K. (1985). Linking control systems to business unit
strategy: Impact on performance. Accounting, Organizations and Society, vol. 20, pp.
51-66.
Green, F.B. and Amenkhienan, F.E. (1992). Accounting innovations: a cross-sectional
survey of manufacturing firms. Journal of Cost Management, vol. 6, pp. 58-64.
Groebner, D.F., Shannon, P.C. and Smith, K.D. (2008). Business Statistics, A decision
making approach. 7th
ed., Prentice Hall.
Guilding, C., Lamminmaki D. and Drury, C. (1998). Budgeting and standard costing
practices in New Zealand and the United Kingdom. The International Journal of
Accounting, vol. 33, no. 5, pp. 569-588.
Guilding, C., Cravens, K.S. and Tayles, M. (2000). An international comparison of
strategic management accounting practices. Management Accounting Research, vol. 11,
pp.113–135.
Gul, F.A. (1991). The effects of management accounting systems and environmental
uncertainty on small business managers' performance. Accounting and Business
Research, vol. 22, no. 85. pp. 57-61.
Gunasekaran, A., Marri, H.B. and Grieve, R.J. (1999.) Justification and implementation
of activity based costing in small and medium sized enterprises. Logistics Information
Management, vol. 12, no. 5, pp. 386-394.
Gupta, A.K. and Govindarajan, V. (1984). Build, hold, harvest: Converting strategic
intentions into reality. Journal of Business Strategy, vol. 4, pp. 34-47.
Hair, J.F.J., Tatham, R.L., Anderson, R.E. and Black, W. (1998). Multivariate Data
Analysis, 5th
ed., USA: Prentice Hall.
Hair, J.F.J., Black, B., Babin, B., Anderson, R.E. and Tatham, R.L. (2006). Multivariate
Data Analysis, 6th
ed., USA: Prentice Hall.
Hair, J.F.J., Money, A.H., Samouel, P. and Page, M. (2007). Research Methods for
Business. U.S: Wiley.

331
Hamid A.B.A., Baharun R. and Hashim N.H. (2004). Comparative analysis of
managerial practices in small and medium enterprises in Malaysia. Faculty of
management and human resource development, Universiti Teknologi Malaysia.
Hansen, S.C., Otley, D.T. and Van der Stede, W.A. (2003). Practice developments in
budgeting: an overview and academic perspective. Journal of Management Accounting
Research, vol. 15, pp. 95-116.
Hall, C. (2003). The SME policy framework in ASEAN and APEC: Benchmark
comparisons and analysis. A 16th
Annual Conference of Small Enterprise Association of
Australia and New Zealand.
Hall, M. (2008). The effect of comprehensive performance measurement systems on
role clarity, psychological empowerment and managerial performance. Accounting,
Organizations and Society, vol. 33, pp. 141-163.
Hansen, S.C. and Van der Stede, W.A. (2004). Multiple facets of budgeting: an
exploratory analysis. Management Accounting Research, vol. 15, pp. 415-439.
Haldma,T. and Laats, K. (2002). Contingencies influencing the management accounting
practices of Estonian manufacturing companies. Management Accounting Research,
vol. 13, pp. 379-400.
Hashim, K. (2000). SMEs in Malaysia: Past, Present and Future. Malaysian
Management Review, vol. 35, no. 1.
Hashim, M.K., Mahajar, A.J. and Ahmad, S. (2003). Innovative practices of Malaysian
firms: Some evidence from enterprise 50 winners. Malaysian Management Review.
Hassan, Z. (2008). Entrepreneurship Development for competitive SMEs: A Malaysian
comparative analysis. UITM, Malaysia.
Hayes, D.C. (1977). The contingency theory of managerial accounting. Accounting
Review, vol. 52, no. 1, pp. 22-39.
Heidmann, M., Schaffer, U. and Strahringer, S. (2008). Exploring the role of
management accounting systems in strategic sense making. Information Systems
Management, vol. 2, pp. 244-257.
Henry, G.T. (1990). Practical Sampling. Newbury Park; London: Sage Publications.
Hermes, N., Smid, P. and Yao, L. (2007). Capital budgeting practices: A comparative
study of the Netherlands and China. International Business Review, vol. 16, pp. 630-
654.
Hiromoto, T. (1988). Another hidden edge-Japanese management accounting. Harvard
Business Review (July-August): PP. 22-26. Hotel Association of New York.
Holmes, S. and Nicholls, D. (1989). Modelling the accounting information requirements
of small businesses. Accounting and Business Research, vol.19, no.74, pp.143-150.
332
Hope, J. and Fraser, R. (1997). Beyond budgeting: breaking through the barrier to ‗The
Third Wave‘. Management Accounting, pp. 20-26.
Hopper, T., Koga, T. and Goto, J. (1999). Cost accounting in small and medium sized
Japanese companies: an exploratory study. Accounting and Business Research, vol. 30,
no. 1, pp. 73-86.
Hopwood, A.G. (1972). An empirical study of the role of accounting data in
performance evaluation. Journal of Accounting Research, vol. 10, pp. 156-182.
Hoque, Z. and James,W. (2000). Linking balanced scorecard measures to size and
market factors: Impact on organizational performance. Journal of Management
Accounting Research, vol. 12. pp. 1-16.
Hoque, Z. (2004). A contingency model of the association between strategy,
environmental uncertainty and performance measurement: impact on organizational
performance. International Business Review, vol. 13, pp. 485-502.
Horngren, C.T., Bhimani, A., Foster, G. and Datar, S.M. (1999). Management and Cost
Accounting. Europe: Prentice Hall.
Hosmer, D.W. and Lemeshow, S. (1989). Applied Logistic Regression, U.S: Wiley.
Hrisak, D. (1996). The controller as business strategist. Management Accounting, vol.
78, no. 6, pp. 48-49.
Hutaibat, A.K. (2005). Management Accounting Practices in Jordan - A Contingency
Approach. Ph.D Thesis, University of Bristol, United Kingdom.
Hyv¨onen, J. (2007). Strategy, performance measurement techniques and information
technology of the firm and their links to organizational performance. Management
Accounting Research, vol. 18, pp. 343-366.
IFAC. (1998). International Management Accounting Practice Statement: Management
Accounting Concepts. New York.
Innes, J. and Mitchell, F. (1991). ABC: a survey of CIMA members. Management
Accounting, vol. 69, no. 9, pp. 28-30.
Innes, J. and Mitchell, F. (1995). A survey of activity-based costing in the U.K‘s largest
companies. Management Accounting Research, vol. 6, pp.137-153.
Innes, J., Mitchell, F. and Sinclair, D. (2000). Activity-based costing in the U.K.‘s
largest companies: a comparison of 1994 and 1999 survey results. Management
Accounting Research, vol. 11, no. 3, pp. 349-362.
IMA. (2008). Definition of Management Accounting. Institute of Management
Accountant.
Isa, M.R. and Haslinda, K. (2006). Comparative study on technical progress among
SMEs in the manufacturing and selected services sectors. Unpublished survey, Malaysia
productivity corporation Malaysia.

333
Isa, R.M. (2008). Small and medium enterprises (SMEs) development in Malaysia‖. 5th
SMEs Global Economy Conference, August 2nd
-3rd
, Senshu University, Kandajimbocho,
Tokyo, Japan.
Islam, M. and Kantor, J. (2005). The development of quality management accounting
practices in China. Managerial Auditing Journal, vol. 20, no. 7, pp. 707-724.
Ismail, T.H. (2007). Performance evaluation measures in the private sector: Egyptian
practice. Managerial Auditing Journal, vol. 22, no. 5, pp. 503-513.
Ismail, N.A. and King, M. (2007). Factors influencing the alignment of accounting
information systems in small and medium sized Malaysian manufacturing firms.
Journal of Information Systems and Small Business, vol. 1, no. 1/2, pp. 1-20.
Israelsen, P., Anderson, M., Rohde, C. and Sorensen, P. (1996). Management
accounting in Denmark: Theory and practice‘ in Bhimani, A. (ed). Management
Accounting: European Perspectives, Oxford, Oxford University Press, pp. 31-53.
Ittner, C.D. and Larcker, D.F. (1998a.). Innovations in performance measurement:
trends and research implications. Journal of Management Accounting Research, vol. 6,
pp. 205-238.
Ittner, C.D. and Larcker, D.F. (1998b). Are nonfinancial measures leading indicators of
financial performance? An analysis of customer satisfaction. Journal of Accounting
Research, vol. 36, pp.1-35.
Ittner, C.D. and Larcker, D.F. (2001). Assessing Empirical Research in Managerial
Accounting: A Value-based Management Perspective. Journal of Accounting &
Economics, vol. 32, pp. 349-410.
Ittner, C.D., Lanen, W.N. and Larcker, D.F. (2002). The association between activity-
based costing and manufacturing performance. Journal of Accounting Research, vol.
40, no. 3, pp. 711-726.
Jarvis, R., Kitching, J., Curran, J. and Lightfoot, G. (2000). The use of quantitative and
qualitative criteria in the measurement of performance in small firms. Journal of Small
Business and Enterprise Development, vol. 7, no. 2, pp. 123-134.
Johnson, H.T. (1981). Toward a New Understanding of Nineteenth-Century Cost
Accounting. The Accounting Review, vol. 56, no. 3, pp. 510-518.
Johnson, H.T. and Kaplan, R.S. (1987). Relevance Lost: The Rise and Fall of
Management Accounting. Boston, Massachusetts: Harvard Business School Press.
Joshi, P.L. (2001). The international diffusion of new management accounting
practices: the case of India. Journal of International Accounting, Auditing and Taxation,
vol. 10, pp. 85-109.
Joshi, P.L., Al-Mudhaki,J. and Bremser, W.G. (2003). Corporate budget planning,
control and performance evaluation in Bahrain. Managerial Auditing Journal, vol.18,
no. 9, pp. 737-750.
334
Judd, C.M., Smith, E.R. and Kidder L.H. (1991). Research Methods in Social Relation.
6th
ed. Harcourt Brace: The Dryden Press, Saunders College Publishing.
Jusoh, R. and Parnell, J.A. (2008). Competitive strategy and performance measurement
in the Malaysian context. An exploratory study. Management Decision, vol. 46, no. 1,
pp. 5-31.
Jusoh, R., Ibrahim, D.N. and Zainuddin, Y. (2008). The performance consequences of
multiple performance measures usage, Evidence from the Malaysian manufacturers.
International Journal of Productivity and Performance Management, vol. 57, no. 2, pp.
119-136.
Kaplan, R.S. (1984). The evolution of management accounting. The Accounting Review,
LIX(3), pp. 390-418.
Kaplan, R.S. (1990). Measures of Manufacturing Excellence. Harvard Business School
Press, Boston MA.
Kaplan, S.E. and Mackey, J.T. (1992). An examination of the association between
organizational design factors and the use of accounting information for managerial
performance evaluation. Journal of Management Accounting Research, vol. 4.
Kaplan, R.S. (1994). Management accounting (1984-1994): Development of new
practice and theory. Management Accounting Research, vol. 5, pp. 247-260.
Kaplan, R.S. (1995). New roles for management accountants. Journal of Cost
Management, Fall, pp.13.
Kaplan, R.S. and Norton, D.P. (1996) The Balanced Scorecard-Translating Strategy
into Action. Harvard Business School Press, Boston, MA.
Kattan, F., Pike, R. and Tayles, M. (2007). Reliance on management accounting under
environmental uncertainty; The case of Palestine. Journal of Accounting &
Organizational Change, vol. 3, no. 3, pp. 227-249.
Khandwalla, P.N. (1972). The effect of different types of competition on the use of
management controls, Journal of Accounting Research, pp. 275-285.
Kelly, M. and Pratt, M.J. (1994). Management Accounting Texts in New Zealand: The
Need for a Paradigm Shift. Accounting Education, vol. 3 no. 4, pp. 313-329.
Kent, R. (2001). Data Construction and data analysis for survey research. Palgrave.
Kennedy, T. and Graves, J.A. (2001). The Impact of activity-based costing techniques
on firm performance‘ Journal of Management Accounting Research, vol. 13.
Klammer, T.P. (1973). The association of capital budgeting with firm performance,
Accounting Review, vol. 48, pp. 353-364.
Klammer, T., Koch, B. and Wilner, N. (1991). Capital budgeting practices-a survey of
corporate use. Journal of Management Accounting Research, vol. 1, pp. 13-130.
335
Kraus, S., Harms, R. and Schwarz, E.J. (2006). Strategic planning in smaller enterprises
– new empirical findings. Management Research News, vol. 29, no. 6, pp. 334-344.
Krumwiede, K.R. (1998). The implementation stages of activity-based costing and the
impact of contextual and organizational factors. Journal of Management Accounting
Research, vol. 10, pp. 239-277.
Lamminmaki, D. and Drury, C. (2001). A comparison of New Zealand and British
product-costing practices. The International Journal of Accounting, vol. 36, no. 3, pp.
329-427.
Langfield-Smith, K. (2008). Strategic management accounting: how far have we come
in 25 years?. Accounting, Auditing & Accountability Journal, vol. 21, no. 2, pp. 204-
228.
Larson C.M. and Clute R.C. (1979). The failure syndrome. American Journal of Small
Business, vol. IV, no. 2.
Lawrence, P.R. and Lorsch, J.W. (1967). Organization and Environment, Boston:
Harvard University.
Lazaridis, I.T. (2004). Capital budgeting practices: A survey in the firms in Cyprus.
Journal of Small Business Management, vol.42, no.4, pp. 427–433.
Leftesi, A. (2008). The Diffusion of Management Accounting Practices in Developing
Countries: Evidence from Libya. Ph.D Thesis, University Huddersfield, United
Kingdom.
Liao, T.F. (1994). Interpreting Probability Models Logit, Probit and Other Generalized
Linear Models. Sage, U.S.
Libby, T. and Waterhouse, J. (1996). Predicting Change in Management Accounting
Systems. Journal of management accounting research, vol. 8, pp. 137-150.
Lind, D.A., Marchall W.G. and Mason R.D. (2002). Statistical Techniques in Business
& Economics, 11th En. McGraw-Hill Irwin.
Lobo, M.X., Tilt, C. and Forsaith D. (2004). The Future of Management Accounting:
A South Australian Perspective‘ Journal of Management Accounting Research, vol. 2,
no. 1.
Long, J.S. (1997). Regression Models for Categorical and Limited Independent
Variables. California: Sage.
Lord, B.R. (1996). Strategic Management Accounting: The emperor‘s new clothes?.
Management Accounting Research, vol. 7, pp. 347-366.
Lukka, K. and Granlund, M. (1996). Cost accounting in Finland: current practice and
trends of development. The European Accounting Review, vol. 5, pp.1-28.

336
Luther, R.G. and Longden, S. (2001). Management accounting in companies adapting to
structural change and volatility in transition economies: a South African study.
Management Accounting Research, vol. 12, pp. 299-320.
Lybaert, N. (1998). The information use in an SME: its importance and some elements
of influence. Small Business Economics, vol. 10, no. 2, pp. 171-191.
Lynch, R.L. and Cross, K.F. (1991). Measure up – The Essential Guide to Measuring
Business Performance, Mandarin, London.
Lyne, S.R. (1988). The role of the budget in medium and large U.K. companies and the
relationship with budget pressure and participation, Accounting and Business Research ,
vol. 18, no. 71, pp. 195-212.
Macintosh, N.B. and Daft, R.L. (1987). Management control systems and departmental
interdependencies: An empirical study. Accounting, Organizations and Society, vol. 12,
no. 1, pp. 49-41-61.
Maiga, A.S. and Jacobs, F.A. (2003). Balanced scorecard, activity-based costing and
company performance: an empirical analysis. Journal of Managerial Issues, vol. 25, no.
3, pp. 283-301.
Maiga, A.S. and Jacobs, F.A. (2006). Assessing the impact of benchmarking
antecedents on quality improvement and its financial consequences. Journal of
Management Accounting Research, vol. 18, pp. 97-123.
Malmi, T. (1999). Activity-based costing diffusion across organizations: an exploratory
empirical analysis of Finnish firms. Accounting, Organizations and Society, vol. 24, pp.
649-672.
Margaret May (1995). The role of management accounting in performance
improvement. Management Accounting: Magazine for Chartered Management
Accountants, vol. 73, Issue 4.
Mcintyre, E.V. and Icerman, J.I. (1985). The accounting rate of return—Appropriate for
small businesses?. American Journal of Small Business, vol. IX, no.3, pp. 41-49.
McMann, P.J. and Nanni, A.J. (1995). Means versus ends: a review of the literature on
Japanese management accounting. Management Accounting Research, vol. 6, no. 4, pp.
313-346.
McNair, C.J. (1997). Beyond The Bottom Line: Measuring World Class Performance.
Homewood III, Irwin.
Merchant, K.A. (1981). The design of the corporate budgeting system: influences on
managerial behavior and performance. Accounting Review, vol. 56, pp. 813–829.
Merchant, K.A. (1984). Influences on departmental budgeting: An empirical
examination of a contingency model. Accounting, Organizations and Society, vol. 9, no.
3/4, pp. 291-307.
337
McChlery, S., Meechan, L. and Godfrey, A.D. (2004). Barriers and catalysts to sound
financial management systems in small sized enterprises. Research Executive
Summaries Series. CIMA, vol. 1, no. 3.
Mia, L. and Chenhall, R.H. (1994). The usefulness of management accounting systems,
functional differentiation and managerial effectiveness. Accounting, Organizations and
Society, vol. 19, no. 1, pp. 1-13.
Mia, L. and Clarke, B. (1999). Market competition, management accounting systems
and business unit performance. Management Accounting Research, vol. 10, pp. 137-58.
Miles, J. and Shevlin, M. (2005). Applying Regression & Correlation. A Guide for
Students and Researchers. Sage Publications Ltd.
Miles, R.W. and Snow, C.C. (1978). Organizational Strategy, Structure, and Process.
New York: McGraw-Hill.
Mintzberg, H. (1975). Impediments of the Use of Management Information. New York:
National Association of Accountants.
Mitchell, F., Gavin, R. and Julia, S. (1998). A case for researching management
accounting in SMEs. Management Accounting: Magazine for Chartered Management
Accountants, vol. 76, no. 9, pp. 30.
Mitchell, F. and Reid, G.C. (2000). Editorial problems, challenges and opportunities:
the small business as a setting for management accounting research. Management
Accounting Research, vol. 11, pp. 385–390.
Monden, Y. and Hamada, K. (1991). Target costing and kaizen costing in Japanese
automobile companies. Journal of Management Accounting Research, pp. 16-34.
Nandan, R. (2010). Management Accounting Needs of SMEs and the Role of
Professional Accountants: A Renewed Research Agenda. Journal of Management
Accounting Research (JAMAR), vol. 8, no. 1.
National Association of Accountants (1983). Management Accounting Terminology. no.
2 June 1
National SME Development Council (NSDC) (2005). SME Annual Report 2005.,
Malaysia.
National SME Development Council (NSDC) (2006). SME Annual Report 2006.,
Malaysia.
National SME Development Council (NSDC) (2007). SME Annual Report 2007.,
Malaysia.
National SME Development Council (NSDC) (2008). SME Annual Report 2008.,
Malaysia.
National SME Development Council (NSDC) (2010). SME Annual Report 2009/10.,
Malaysia.
338
Neuman, W.L. (2005). Social Research Methods. 6th
ed., London: Pearson.
Nik Ahmad, N.N., Sulaiman, M. and Alwi, N.M. (2003). Are budgets useful? A survey
of Malaysian companies. Managerial Auditing Journal, vol. 18, no. 9, pp. 717-724.
Nimtrakoon, S. (2009). Organization Strategy, Management Techniques and
Management Accounting Practices: Contingency Research in Thailand. Ph.D Thesis,
University of Hull, United Kingdom.
O‘Connor, N.G., Chow, C.W., and Wu, A. (2004). The adoption of ‗‗Western‘‘
management accounting/controls in China‘s state-owned enterprises during economic
transition. Accounting, Organizations and Society, vol. 29, no. 3/4, pp. 349-375.
Oppenheim, A.N. (1992) Questionnaire Design, Interviewing and Attitude
Measurement (new edn). London: Continuum International.
O‘Regan, N. and Sims, M.A. (2008). Leaders, loungers, laggards: The strategic-
planning-environment performance relationship re-visited in manufacturing SMEs.
Journal of Manufacturing Technology Management, vol. 19, no. 1, pp. 6-21.
Osborne, J. and Waters, E. (2002). Four assumptions of multiple regression that
researchers should always test. Practical Assessment, Research & Evaluation, vol. 8,
no. 2. Retrieved August 23, 2011 from http://PAREonline.net/getvn.asp?v=8&n=2
Osman, I. and Hashim, K. (2003). An evaluation of the business practices in Malaysian
SMEs. Malaysian Management Review, vol. 38, no. 2.
Otley, D.T. (1978). Budget use and managerial performance. Journal of Accounting
Research, vol. 16, pp.122-149.
Otley, D.T. (1980). The contingency theory of management accounting: achievement
and prognosis. Accounting, Organizations and Society, vol. 5, no. 4, pp. 413-428.
Otley, D. and Pollanen, R.M. (2000). Budgetary criteria in performance evaluation: a
critical appraisal using new evidence. Accounting, Organizations and Society, vol. 25,
pp. 483-96.
Owler, L.W.J. and Brown, J.L. (1978). Cost Accounting and Costing Methods. 14th
ed.,
Macdonals and Evans Ltd.
Parker, R.H. (1969). Management Accounting: An Historical Perspective. Macmillan
and Co Ltd.
Parker, L.D. (2002). Reinventing management accountant. The Chartered Institute of
Management Accountant.
Parker, R. J. and Kyj, L. (2006). Vertical information sharing in the budgeting process.
Accounting, Organizations and Society, vol. 31, pp. 27-45.
Patton, J. and Zelenka, 1. (1997). An empirical analysis of the determinants of the
extent of disclosure in annual reports of joint stock companies in the Czech Republic.
The European Accounting Review, vol. 6, no. 4, pp. 605-626.
339
Perera, S., Harrison, G. and Poole, M. (1997). Customer-focused manufacturing
strategy and the use of operations-based non-financial performance measures: A
research note. Accounting, Organizations and Society, vol. 22, no. 6, pp. 557-572.
Perez, B.E., Gonzalez, J.M.G. and Gallardo, A.L. (2008). Organisational Control
System in a Continuous Improvement Environment: Special Reference to the Role of
Management Accounting. Journal of Accounting – Business & Management, vol. 15,
pp. 1-32.
Perrow, C. (1967). A framework for the comparative analysis of organizations.
American Sociological Review, pp. 194-208.
Phadoongsitthi, M. (2003). The role of management accounting in emerging economies:
An empirical study of Thailand. Ph.D Thesis, University of Maryland, College Park.
Pierce, B. and O‘Dea, T. (1998). Management accounting practices in Ireland – The
preparers‘ perspective‘ Research Paper Series Paper, no. 34.
Porter, M.E. (1980). Competitive Strategy: Techniques for Analyzing Industries and
Competitors. New York: Free Press.
Preda, P. and Watts, T. (2004). Contemporary Accounting Innovations in Australia:
Manufacturing versus service organizations. Journal of Management Accounting
Research, vol. 2.
Puxty, A.G. and Lyall, D. (1989). A Survey of Standard Costing and Budgeting
Practices in the UK, London: CIMA.
Ramos, M.M. (2004). Interaction between management accounting and supply chain
management. Supply Chain Management: An International Journal, vol. 9, no. 2, pp.
134-138.
Ratnatuga, J. (2004). Empowerment Accounting: The Role of Financial Statements in
the Shift from the Informational to the Influential Paradigm. Journal of Management
Accounting Research, vol. 2, no. 2
Raymond, L. and Magnenat-Thalmann, N. (1982). Information Systems in Small
Business: Are they used in Managerial Decisions?. American Journal of Small Business,
vol. VI, no. 4.
Reid, G.C. and Smith, J.A. (2000). The impact of contingencies on management
accounting system development. Management Accounting Research, vol. 11, pp. 427-
450.
Reid, G.C. and Smith, J.A. (2002). The bigger picture. Financial Management.
Richard, M. (2000). Why Small Businesses Fail. CMA Management.
Roscoe, J.T. (1975). Fundamental Research Statistics for the Behavioral Sciences. 2nd
ed. New York: Holt, Rinehart and Winston.
340
Roslender, R. and Hart, S. (2003). In search of strategic management accounting:
Theoretical and field study perspectives. Management Accounting Research, vol.14, pp.
255–279.
Rozali, M.B, Taib, M.H., Latif, R.A. and Salim M. (2006). Small firm‘s demand for
finance in Malaysia. International conference on business and information (BAI) July
12-14 Pan Pacific Hotel Singapore, vol. 3, ISSN 17299322 Academy of Taiwan
Information Systems Research.
Russell, K.A., Siegel, G.H. and Kulesza, C.S.B. (1999). Counting more, counting less:
Transformations in the management accounting profession, Strategic Finance,
September, vol. 81, Issue 3, pp. 39-44.
Said, A.A., HassabElnably, H.R. and Wier, B. (2003). An empirical investigation of the
performance consequences of nonfinancial measures. Journal of Management
Accounting Research, vol. 15, pp.193-223.
Samudhram, A. and Sivalingam, G. (2009). Formulating Policies for robust SME
development: Schumpeterarrow- Inverted U Debate - Evidence from Malaysian SMEs.
Accountancy Business and the Public Interest, vol. 8, no. 1, pp. 103.
Saleh, A.S., Caputi, P. and Harvie, C. (2008). Perceptions of business challenges facing
Malaysian SMEs: Some preliminary results. 5th
SMEs in a Global Economy Conference,
August 2nd
- 3rd
, Senshu University, Kandajimbocho, Tokyo, Japan.
Saleh, A.S. and Ndubisi, N.O. (2006). An evaluation of SME development in Malaysia.
International Review of Business Research, vol.2, no.1, pp.1-14.
Saunders, M., Lewis, P. and Thornhill, A. (2009). Research Methods for Business
Students, 5th
ed. England: Pearson Education Ltd.
Scarbrough, P., Nanni, A.J. and Sakurai, M. (1991). Japanese management accounting
practices and the effects of assembly and process automation. Management Accounting
Research, vol. 2, no.1, pp. 27-46.
Scapens, R.W. and Sale, J.T. (1985). An international study of accounting practices in
divisionalized companies and their associations with organizational variables. The
Accounting Review, vol. 60, no. 2, pp. 231-247.
Scapens, R.W. (1991). Management Accounting: A Review of Recent Developments.
The Macmillan Press Ltd.
Scherrer, G. (1996). Management accounting: a German perspective‘, in Bhimani, A.
(ed), Management Accounting: European Perspectives, Oxford, Oxford University
Press, pp. 100-22.
Sekaran, U. (2004). Research Methods for Business, 4th
ed., New York: John Wiley &
Sons, Inc.
Sharma, R., Jones, S. and Ratnatunga, J. (2006). The relationships among broad scope
MAS, managerial control, performance, and job relevant information: A concomitant
analysis. Review of Accounting and Finance, vol. 5, no. 3, pp. 228-250.
341
Shields, M.D., Chow, C.W. and Kao, Y. (1991). Management accounting practices in
the U.S. and Japan: Comparative survey findings and research implications. Journal of
International Financial Management and Accounting, vol. 3, no. 1.
Shields, M.D. (1995). An empirical analysis of firms' implementation experiences with
activity-based costing. Journal of Management Accounting Research, vol. 7, no. 1, pp.
148-166.
Shields, M. (1997). Research in management accounting by North Americans in the
1990s. Journal of Management Accounting Research, vol. 9, pp. 3-62.
Silva, L.F.D. and Abreu, F. B.E. (2010). Reengineering IT Infrastructures: A method for
topology discovery. Seventh International Conference on the Quality of Information and
Communications Technology.
Sim, K. and Killough, L. (1998). The performance effects of complementarities between
manufacturing practices and management accounting systems. Journal of Management
Accounting Research, vol. 10, pp. 325-346.
Simons, R. (1987). Accounting control systems and business strategy, Accounting
Organizations, and Society, pp. 357-374.
Smith, M. (2003). Research Methods in Accounting. SAGE Publications.
SMIDEC (2003). SME Performance Report 2003. Small and Medium Industries
Development Corporation (SMIDEC). Malaysia.
SMIDEC (2005). SME Performance Report 2005. Small and Medium Industries
Development Corporation (SMIDEC). Malaysia.
Sousa, S.D., Aspinwall, E.M. and Rodrigues, A.G. (2006). Performance measures in
English small and medium enterprises: survey results. Benchmarking: An International
Journal, vol. 13, no. 1/2, pp. 120-134.
Soobaroyen, T. and Poorundersing, B. (2008). The effectiveness of management
accounting systems: Evidence from functional managers in a developing country.
Managerial Auditing Journal, vol. 23, no.2, pp. 187-219.
Speckbacher, G., Bischof, J. and Pfeiffer, T. (2003). A descriptive analysis on the
implementation of Balanced Scorecards in German-speaking countries. Management
Accounting Research, vol. 14, pp. 361-387.
Stutely, R. (2003). Number Guides: The Essentials of Business Numeracy. London:
Bloomberg Press.
Sulaiman, M., Wafa, A. and Hashim, K. (2000). Strategic management in Malaysian
SMEs: An empirical assessment. Malaysian Management Review.
Sulaiman, M. Ahmad, N.A.N. and Alwi, N. (2004). Management accounting practices
in selected Asian countries. Managerial Auditing Journal, vol. 19, no.4, pp. 493-508.
342
Sulaiman, M. and Hashim, M.K. (2004). Issues and research agenda for Malaysian
SMEs revisited‖. 8th
International Conference on Global Business & Economic
Development, Mexico, January 7-10, Mexico.
Sulaiman, S. and Mitchell, F. (2005). Using a typology of management accounting
change: An empirical analysis. Management Accounting Research, vol. 16, no. 4, pp.
422-437.
Sulaiman, S., Ramli, A. and Mitchell, F. (2007). Financial management in Malaysia.
Financial Management, CIMA.
Smyth, E.B. (1960). Management accounting in Australia. The Accounting Review, vol.
35, no. 3, pp. 464-470.
Swenson, D. (1995). The benefits of activity-based cost management to the
manufacturing industry. Journal of Management Accounting Research, vol. 7, pp. 167-
180.
Szychta, A. (2002). The scope of application of management accounting methods in
Polish enterprises. Management Accounting Research, vol.13, pp. 401-418.
Tambunan, T. (2008). SME development, economic growth, and government
intervention in a developing country: The Indonesian story. Journal International
Entrepreneurship, vol. 6, pp. 147-167.
Tani, T., Okano, H., Shimizu, H., Iwabuchi, Y., Fukyda, J. and Cooray, S. (1994).
Target cost management in Japanese companies: current state of the art. Management
Accounting Research, vol. 5, no. 1, pp. 67-81.
Tayles, M. and Drury, C. (1994). New manufacturing technologies and management
accounting system: Some evidence of the perceptions of UK management accounting
practitioners. International Journal of Production Economics, vol. 36, pp. 1-17.
Tayles, M., Pike, R.H. and Sofian, S. (2007). Intellectual capital, management
accounting practices and corporate performance. Perceptions of managers. Accounting,
Auditing & Accountability Journal, vol. 20, no. 4, pp. 522-548.
Thompson, J.D. (1967). Organizations in Action New York: McGraw-Hill.
Thong, J.Y.L. and Yap, C.S. (1995). CEO characteristics, organizational characteristics
and information technology adoption in small businesses. OMEGA International
Journal of Management Science, vol. 23, no. 4, pp. 429-442.
Thong, J.Y.L., Yap, C.S. and Raman, K.S. (1996). Top management support, external
expertise and information systems implementation in small businesses. Information
Systems Research, vol. 7, no. 2, pp. 248-267.
Turney, P.B.B. (1991). Activity Based Costing: The ABC Performance Breakthrough.
How to Succeed with Activity Based Costing, Cost Technology, Beaverton, Oregon.
343
UCLA (2011) Introduction to SAS. : Academic Technology Services, Statistical
Consulting Group. from http://www.ats.ucla.edu/stat/sas/notes2/ (accessed July 20,
2011).
UNDP (2007). Malaysia Small and Medium Enterprises: Building an Enabling
Environment. United Nations Development Programme UNDP.
Valančienė, L. and Gimžauskienė, E. (2007). Changing Role of Management
Accounting: Lithuanian Experience Case Studies. ISSN 1392-2785, Engineering
Economics, no. 5 (55).
Van Triest, S. and Elshahat, M.F. (2007). The use of costing information in Egypt: a
research note. Journal of Accounting and Organizational Change, vol. 3, no. 3, pp. 329-
343.
Vatter, W.J. (1950). Managerial Accounting, Prentice-Hall, Englewood Cliffs: New
Jersey
Virtanen, K., Malmi, T., Vaivio, J. and Kasanen, E. (1996). Drivers of management
accounting in Finland. in Bhimani, A. (ed) Management Accounting: European
Perspectives, Oxford University Press, Oxford, pp. 218-41.
Wahab, I.A. and Buyong, S.Z. (2008). Financing Technology-Bases SMEs in Malaysia:
Practices and Problems. 5th
SMEs in a Global Economy Conference, August 2nd
- 3rd
,
Senshu University, Kandajimbocho, Tokyo, Japan.
Waweru, N.M., Hoque, Z. and Uliana, E. (2004). Management accounting change in
South Africa Case studies from retail services. Accounting, Auditing & Accountability
Journal, vol. 17, no. 5, pp. 675-704.
Watson, J. and Everett, J.E. (1996). Do small businesses have high failure rates?
Evidence from Australian retailers. Journal of Small Business Management, pp. 45-62.
Wendy, M.Y. and Teoh, S.C. (2008). Improving women entrepreneurs in small and
medium enterprises in Malaysia: Policy recommendation. Communications of the
IBIMA, vol. 2.
Wichmann, H. (1983). Accounting and marketing: key small business problems.
American Journal of Small Business, vol. VII, no. 4.
Wilson, R.M.S. and Chua, W.F. (1993). Managerial Accounting: Method and Meaning.
2nd
ed. U.K: Chapman & Hall.
Wilson, R.M.S. and Chua, W.F (1988). Managerial Accounting: Method and Meaning.
Van Nostrand Reinhold (International) Co.Ltd.
Williams, J. J. and Seaman, A. E. (2001). Predicting change in management accounting
systems: national culture and industry effects. Accounting, Organization and Society,
vol. 26, pp. 443-460.
344
Wijewardena, H. and De Zoysa, A. (1999). A comparative analysis of management
accounting practices in Australia and Japan: an empirical investigation. The International
Journal of Accounting, vol. 34, no. 1, pp. 49-70.
Winship, C. and Mare, R.D. (1984). Regression Models with Ordinal Variables.
American Sociological Review, vol. 49, no. 4, pp. 512-525.
Woodward, J. (1965). Industrial Organization, Theory and Practice. London: Oxford
University.
Wong, K.Y. and Aspinwall, E. (2005). An empirical study of the important factors for
knowledge-management adoption in the SME sector. Journal of Knowledge
Management, vol. 9, no. 3, pp. 64-82.
Wu, J., Boateng, A. and Drury, C. (2007). An analysis of the adoption, perceived
benefits, and expected future emphasis of western management accounting practices in
Chinese SOEs and JVs. The International Journal of Accounting, vol. 42, pp. 171-185.
Yoshikawa, T., Innes, J. and Mitchell, F. (1989). Japanese Management Accounting: A
Comparative Survey, Management Accounting (UK), vol. 67, no.10, pp. 20-23.
Yoshikawa, T. (1994). Some aspects of the Japanese approach to management
accounting‘, Management Accounting Research, vol. 5, pp. 279-89.
Young, S.M. and Selto, F.H. (1993). Explaining cross-sectional workgroup performance
differences in a JIT facility: A critical appraisal of a field-based study. Journal of
Management Accounting, vol. 5, pp. 300-326.
Zakaria, M., and Hashim, K. (2004). Perceptions of E-business among Malaysian
SMEs: A recent survey. Malaysian Management Review, vol. 39, no.1.
Zarowin, S. (1997). Finance‘s Future: Challenge or Threat?. Journal of Accountancy,
vol. 183, no. 4, pp 38- 42.

345
Glossary 1: Management accounting practices
Costing system
Activity-based costing (ABC)
Cost contribution to cost units on the basis of benefit received from indirect activities e.g
ordering, setting-up and assuring quality.
Traditional absorption costing
The procedure which charges fixed as well as variable overhead to cost units.
Direct costing systems
The accounting system in which variable costs are charged to cost units and fixed costs of
the period are written-off full against the aggregate contribution. Its special value is in
decision-making.
Budgeting
Incremental budgeting
Incremental budgeting bases a period‘s expenditure level for a discretionary item on the
amount spent for that item during the previous period.
Zero-based budgeting
A method of budgeting whereby all activities are re-evaluated each time a budget is set.
Discrete levels of each activity are valued and a combination chosen to match funds
available.
Operational budgeting
Budget of the profit and loss account and its supporting schedules such as monthly forecasts
of sales, production, and operating expenses.
Financial budgeting
Those budgets that identify the expected financial consequences of the activities
summarized in the operating budgets. This includes balance sheets, income statement and
cash flow statements.
Flexible budget
A budget which, by recognizing different cost behaviour patterns, is designed to change as
volume of output changes.
Rolling budget
Method in which a budget established at the beginning of an accounting period is
continually amended to reflect variances that arise due to changing circumstances.
Performance evaluation
Performance evaluation based on financial measures (s)
The financial measures such as return on investment, budget variance analysis, divisional
profit
Performance evaluation based on non-financial measure(s) related to customers
The measures which include customers satisfaction survey and customer complaints.
Performance evaluation based on non-financial measures related to operations
The measures which include ongoing supplier evaluation, stock turnover and product
quality.
Performance evaluation based on non-financial measure(s) related to employees
The measures which include team performance and employee attitude.

346
Benchmarking
Benchmarking within an organization or with outside organizations on operational process,
product characteristics, management process and strategic priorities.
Decision support system
Cost-volume-profit analysis
The study of the effects on future profit of changes in fixed cost, variable cost, sales price,
quantity and mix.
Stock control model
Stock control is the systematic regulation of stock levels. A model such as Economic order
quantity, and JIT.
Investment appraisal discounting techniques (e.g. NPV, IRR)
A valuation of investment projects by adjusting cash flows for the time value of money using
techniques as net present value (NPV) or internal-rate-of-return (IRR)
Investment appraisal non-discounting techniques (e.g. Payback, ROI)
A valuation of investment projects which does not consider the time value of money. For
example payback period and return on investment.
Customer profitability analysis
Customer profitability (CP) is the difference between the revenues earned from and the
costs associated with the customer relationship in a specified period.
Product profitability analysis
An analysis on the relative profitability attributable to individual product.
Strategic management accounting
That body of Management Accounting concerned with the provision of strategically orientated
information for decision-making and control.
Target costing
A product cost estimate derived from a competitive market price. Used to reduce costs through
continuous improvement and replacement of technologies and processes.
Quality costing
Quality costs are those costs associated with the creation, identification, repair, and
prevention of defects. These can be classified into three categories; prevention, appraisal,
and failure costs. Cost of quality reports are produced for the purpose of directing
management attention to prioritize quality problems.
Strategic costing
The use of cost data based on strategic and marketing information to develop and identify
superior strategies that will sustain a competitive advantage.
Strategic pricing
The analysis of strategic factors in the pricing decision process. These factors may include:
competitor price reaction; price elasticity; market growth; economies of scale; and
experience.
Value chain costing
An activity-based costing approach where costs are allocated to activities required to
design, procure, produce, market, distribute, and service a product or service.
347
Competitor cost assessment,
The provision of regularly updated estimates of a competitor‘s costs based on, for example,
appraisal of facilities, technology, economies of scale. Sources include direct observation,
mutual suppliers, mutual customers and ex-employees.
Competitive position monitoring
The analysis of competitor positions within the industry by assessing and monitoring trends
in competitor sales, market share, volume, unit costs, and return on sales. This information
can provide a basis for the assessment of competitor‘s market strategy.
Product life cycle analysis
The appraisal of costs based on the length of stages of a product or service‘s life. These
stages may include design, introduction) growth, decline, and eventually abandonment.
Process costing
Process costing is a method of costing used to ascertain the cost of the product at each
process, operation or stage of manufacture
Glossary 2: Standard Definition of SMEs
Primary agriculture General definition:
"A small and medium enterprise in primary agriculture is an enterprise with full-time employees
not exceeding 50 or annual sales turnover not exceeding RM5 million."
Specific definitions:
"A micro enterprise in primary agriculture is an enterprise with full-time employees of less than
5 or with annual sales turnover of less than RM200,000."
"A small enterprise in primary agriculture is an enterprise with full-time employees of between
5 and 19 or with annual sales turnover of between RM200,000 and less than RM1million."
"A medium enterprise in primary agriculture is an enterprise with full-time employees of
between 20 and 50 or with annual sales turnover of between RM 1 million and RM5 million."
Manufacturing (including Agro-Based) and manufacturing-related services (MRS)
General definition:
"A small and medium enterprise in manufacturing (including agro-based) and MRS is an
enterprise with full-time employees not exceeding 150 or with annual sales turnover not
exceeding RM25 million."
Specific definitions:
"A micro enterprise in manufacturing (including agro-based) and MRS is an enterprise with
full-time employees of less than 5 or with annual sales turnover of less than RM250,000."
"A small enterprise in manufacturing (including agro-based) and MRS is an enterprise with full-
time employees of between 5 and 50 or with annual sales turnover of between RM250,000 and
less than RM10 million."
"A medium enterprise in manufacturing (including agro-based) and MRS is an enterprise with
full-time employees of between 51 and 150 or with annual sales turnover of between RM10
million and RM25 million."
Services sector (including ICT)

348
General definition:
"A small and medium enterprise in services is an enterprise with full-time employees not
exceeding 50 or annual sales turnover not exceeding RM5 million."
Specific definitions:
"A micro enterprise in services is an enterprise with full-time employees of less than 5 or with
annual sales turnover of less than RM200,000."
"A small enterprise in services is an enterprise with full-time employees of between 5 and 19 or
with annual sales turnover of between RM200,000 and less than RM1million."
"A medium enterprise in services is an enterprise with full-time employees of between 20 and
50 or with annual sales turnover of between RM 1 million and RM5 million."
Appendix 1: List of literature in management accounting

349
Table A1: Major studies in management accounting practices Studies Classification of management accounting practices
Developed countries
Smyth (1960) : Australia
Delegation of authority and responsibility; budgets and
budgetary control; standards of performance; control reports and
device.
Chow et al. (1988) : U.S Cost accounting system design, decision making, planning,
control, and the use of quantitative methods.
Shields et al. (1990) :U.S and Japan
Cost accounting system design, short term decision making,
capital budgeting decisions, operational budgeting, operational
control and management control.
Scarbrough et. al (1991) Product costing and inventory valuation, cost analysis and
planning, and control and performance evaluation.
Drury et al. (1993) :U.K Product costing; budgetary control; capital investment; AMT
environment; divisional control; changes in practices.
Yoshikawa (1994) :Japan Costing systems, cost management activity, budgeting systems,
and long-term decision-making.
Tayles and Drury (1994) : U.K Use for costing, performance measurement, control and
investment appraisal.
McMann and Nanni (1995) : Japan
Five themes in Japanese literature review 1. the ‗eyes‘ of
market; 2. Quality of work; 3. ‗Waste‘ as the measure of cost; 4.
Continually improving the way work is done; and 5. Sharing
knowledge through vertical and horizontal communication.
Bhimani (1996) : Europe Literature review of European studies
Shields (1997) : U.S Review on topics, setting, theories, research methods and
results.
Chenhall and Langfield-Smith (1998)
: Australia
Long term planning, detailed budgeting systems, product
costing, performance evaluation, and decision support systems
Wijewardena and De Zoysa (1999)
: New Zealand
Investment appraisal, budgeting, overhead allocation, inventory
level, quantitative techniques, performance evaluation, product
costing, costing systems
Abdel-Kader and Luther (2006) : U.K Costing system; budgeting; performance evaluation
information for decision making; and strategic analysis
Pierce and O‘ Dean (1998)
Traditional and ‗new‘ management accounting techniques, long-
term planning and appraisal of investment efficiency,
information usefulness of the accounting system
Szychta (2002) : Poland Cost accounting systems and operational budgeting.
Preda and Watts (2004) : Australia Value-based Management (VBM), Total Quality Management
(TQM), BSC, ABC and ABM.
Hyvo¨ nen (2005) : Finland Long term planning; detailed budgeting systems; product
costing; performance evaluation, and decision support systems.
Developing countries
Firth (1996) : China Product cost systems, budgeting, planning, and uses of
accounting data.
Ghosh and Kai Chan (1997):Singapore Control and planning, decision support system, ABC and
pricing method.
Sulaiman et al. (2004) review on the
works of Abdul Rahman et al. (1998)
and Thou et al. (1998): Malaysia
Budgeting, standard costing, performance evaluation, CVP, and
contemporary techniques
Anderson and Lanen (1999) : India Cost management; planning and control; performance
measurement and evaluation.
Joshi (2001) : India Long term planning; detailed budgeting systems; product
costing; performance evaluation and decision support systems.
Phadoongsitthi (2003) : Thailand Long term planning, Detailed budgeting systems, Product
costing, Performance evaluation, and Decision support systems
O‘Connor et al. (2004) : China Formal procedures, approval procedures, total quality control
procedures, budget targets, performance targets
Sulaiman and Mitchell (2005) : Malaysia Management accounting change
Frezatti (2007) : Brazil
Structured and formalized costing system; strategic plan and
budget; .management reports; waste-reduction program; value-
management system.
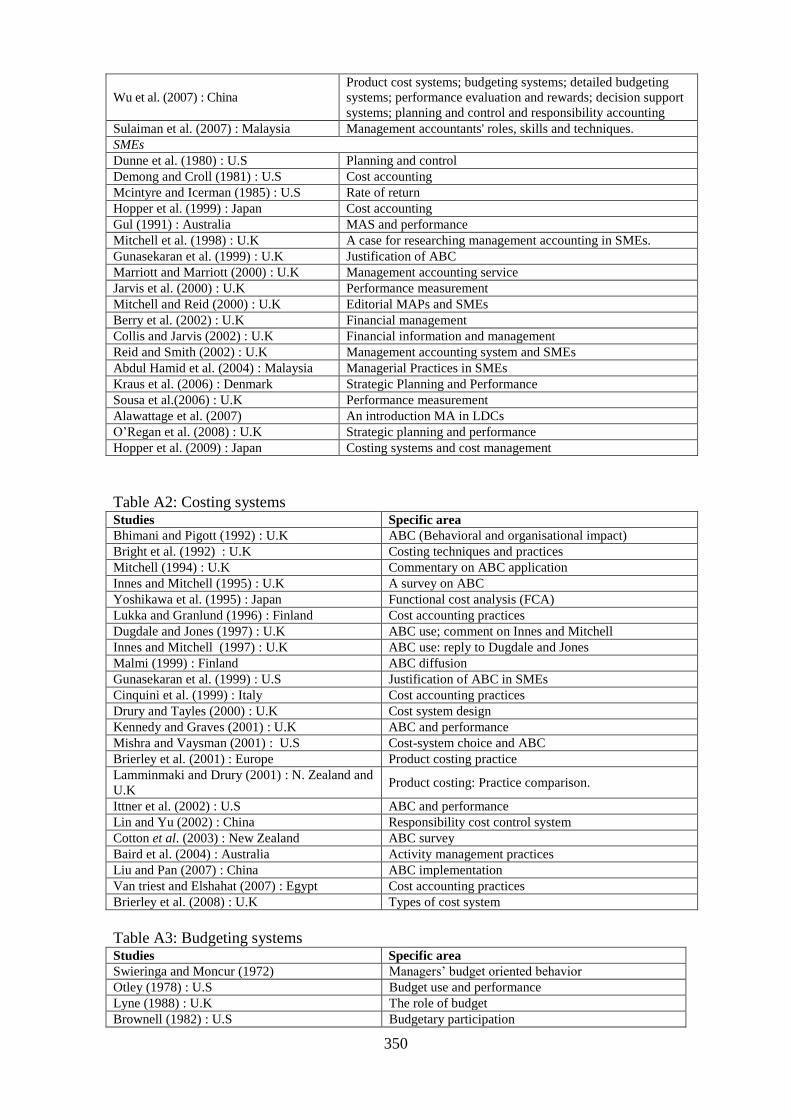
350
Wu et al. (2007) : China
Product cost systems; budgeting systems; detailed budgeting
systems; performance evaluation and rewards; decision support
systems; planning and control and responsibility accounting
Sulaiman et al. (2007) : Malaysia Management accountants' roles, skills and techniques.
SMEs
Dunne et al. (1980) : U.S Planning and control
Demong and Croll (1981) : U.S Cost accounting
Mcintyre and Icerman (1985) : U.S Rate of return
Hopper et al. (1999) : Japan Cost accounting
Gul (1991) : Australia MAS and performance
Mitchell et al. (1998) : U.K A case for researching management accounting in SMEs.
Gunasekaran et al. (1999) : U.K Justification of ABC
Marriott and Marriott (2000) : U.K Management accounting service
Jarvis et al. (2000) : U.K Performance measurement
Mitchell and Reid (2000) : U.K Editorial MAPs and SMEs
Berry et al. (2002) : U.K Financial management
Collis and Jarvis (2002) : U.K Financial information and management
Reid and Smith (2002) : U.K Management accounting system and SMEs
Abdul Hamid et al. (2004) : Malaysia Managerial Practices in SMEs
Kraus et al. (2006) : Denmark Strategic Planning and Performance
Sousa et al.(2006) : U.K Performance measurement
Alawattage et al. (2007) An introduction MA in LDCs
O‘Regan et al. (2008) : U.K Strategic planning and performance
Hopper et al. (2009) : Japan Costing systems and cost management
Table A2: Costing systems Studies Specific area
Bhimani and Pigott (1992) : U.K ABC (Behavioral and organisational impact)
Bright et al. (1992) : U.K Costing techniques and practices
Mitchell (1994) : U.K Commentary on ABC application
Innes and Mitchell (1995) : U.K A survey on ABC
Yoshikawa et al. (1995) : Japan Functional cost analysis (FCA)
Lukka and Granlund (1996) : Finland Cost accounting practices
Dugdale and Jones (1997) : U.K ABC use; comment on Innes and Mitchell
Innes and Mitchell (1997) : U.K ABC use: reply to Dugdale and Jones
Malmi (1999) : Finland ABC diffusion
Gunasekaran et al. (1999) : U.S Justification of ABC in SMEs
Cinquini et al. (1999) : Italy Cost accounting practices
Drury and Tayles (2000) : U.K Cost system design
Kennedy and Graves (2001) : U.K ABC and performance
Mishra and Vaysman (2001) : U.S Cost-system choice and ABC
Brierley et al. (2001) : Europe Product costing practice
Lamminmaki and Drury (2001) : N. Zealand and
U.K Product costing: Practice comparison.
Ittner et al. (2002) : U.S ABC and performance
Lin and Yu (2002) : China Responsibility cost control system
Cotton et al. (2003) : New Zealand ABC survey
Baird et al. (2004) : Australia Activity management practices
Liu and Pan (2007) : China ABC implementation
Van triest and Elshahat (2007) : Egypt Cost accounting practices
Brierley et al. (2008) : U.K Types of cost system
Table A3: Budgeting systems Studies Specific area
Swieringa and Moncur (1972) Managers‘ budget oriented behavior
Otley (1978) : U.S Budget use and performance
Lyne (1988) : U.K The role of budget
Brownell (1982) : U.S Budgetary participation
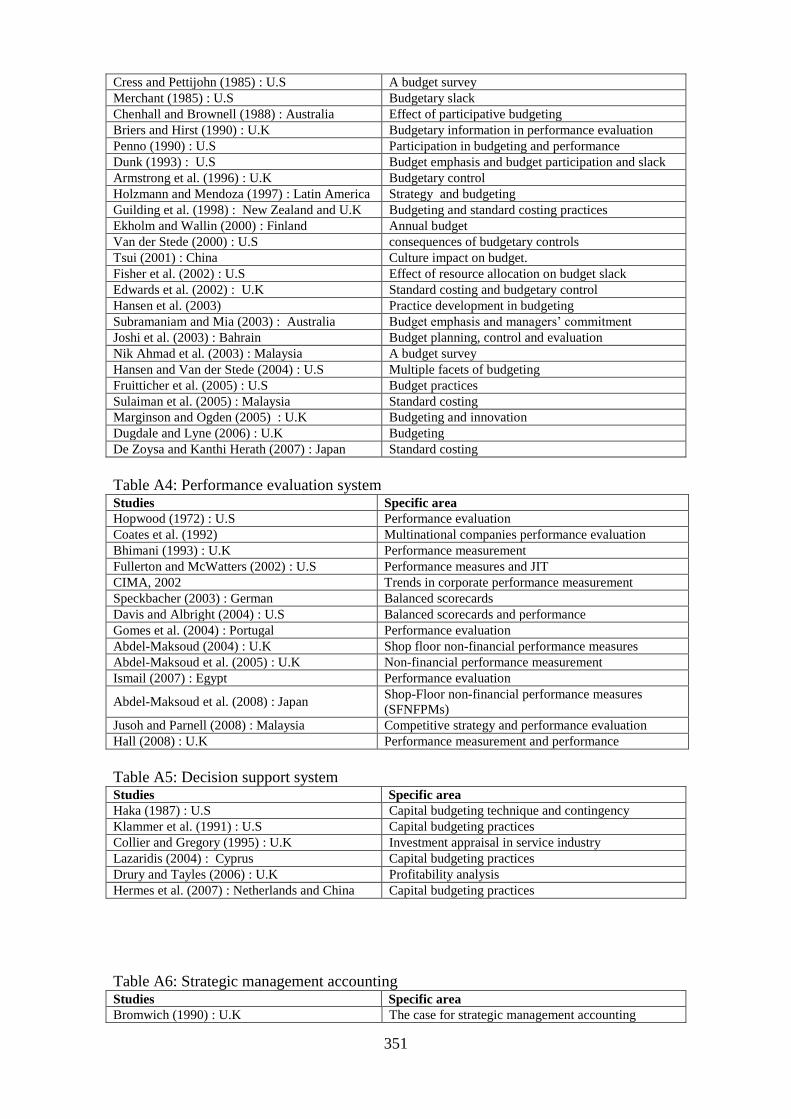
351
Cress and Pettijohn (1985) : U.S A budget survey
Merchant (1985) : U.S Budgetary slack
Chenhall and Brownell (1988) : Australia Effect of participative budgeting
Briers and Hirst (1990) : U.K Budgetary information in performance evaluation
Penno (1990) : U.S Participation in budgeting and performance
Dunk (1993) : U.S Budget emphasis and budget participation and slack
Armstrong et al. (1996) : U.K Budgetary control
Holzmann and Mendoza (1997) : Latin America Strategy and budgeting
Guilding et al. (1998) : New Zealand and U.K Budgeting and standard costing practices
Ekholm and Wallin (2000) : Finland Annual budget
Van der Stede (2000) : U.S consequences of budgetary controls
Tsui (2001) : China Culture impact on budget.
Fisher et al. (2002) : U.S Effect of resource allocation on budget slack
Edwards et al. (2002) : U.K Standard costing and budgetary control
Hansen et al. (2003) Practice development in budgeting
Subramaniam and Mia (2003) : Australia Budget emphasis and managers‘ commitment
Joshi et al. (2003) : Bahrain Budget planning, control and evaluation
Nik Ahmad et al. (2003) : Malaysia A budget survey
Hansen and Van der Stede (2004) : U.S Multiple facets of budgeting
Fruitticher et al. (2005) : U.S Budget practices
Sulaiman et al. (2005) : Malaysia Standard costing
Marginson and Ogden (2005) : U.K Budgeting and innovation
Dugdale and Lyne (2006) : U.K Budgeting
De Zoysa and Kanthi Herath (2007) : Japan Standard costing
Table A4: Performance evaluation system Studies Specific area
Hopwood (1972) : U.S Performance evaluation
Coates et al. (1992) Multinational companies performance evaluation
Bhimani (1993) : U.K Performance measurement
Fullerton and McWatters (2002) : U.S Performance measures and JIT
CIMA, 2002 Trends in corporate performance measurement
Speckbacher (2003) : German Balanced scorecards
Davis and Albright (2004) : U.S Balanced scorecards and performance
Gomes et al. (2004) : Portugal Performance evaluation
Abdel-Maksoud (2004) : U.K Shop floor non-financial performance measures
Abdel-Maksoud et al. (2005) : U.K Non-financial performance measurement
Ismail (2007) : Egypt Performance evaluation
Abdel-Maksoud et al. (2008) : Japan Shop-Floor non-financial performance measures
(SFNFPMs)
Jusoh and Parnell (2008) : Malaysia Competitive strategy and performance evaluation
Hall (2008) : U.K Performance measurement and performance
Table A5: Decision support system Studies Specific area
Haka (1987) : U.S Capital budgeting technique and contingency
Klammer et al. (1991) : U.S Capital budgeting practices
Collier and Gregory (1995) : U.K Investment appraisal in service industry
Lazaridis (2004) : Cyprus Capital budgeting practices
Drury and Tayles (2006) : U.K Profitability analysis
Hermes et al. (2007) : Netherlands and China Capital budgeting practices
Table A6: Strategic management accounting Studies Specific area
Bromwich (1990) : U.K The case for strategic management accounting
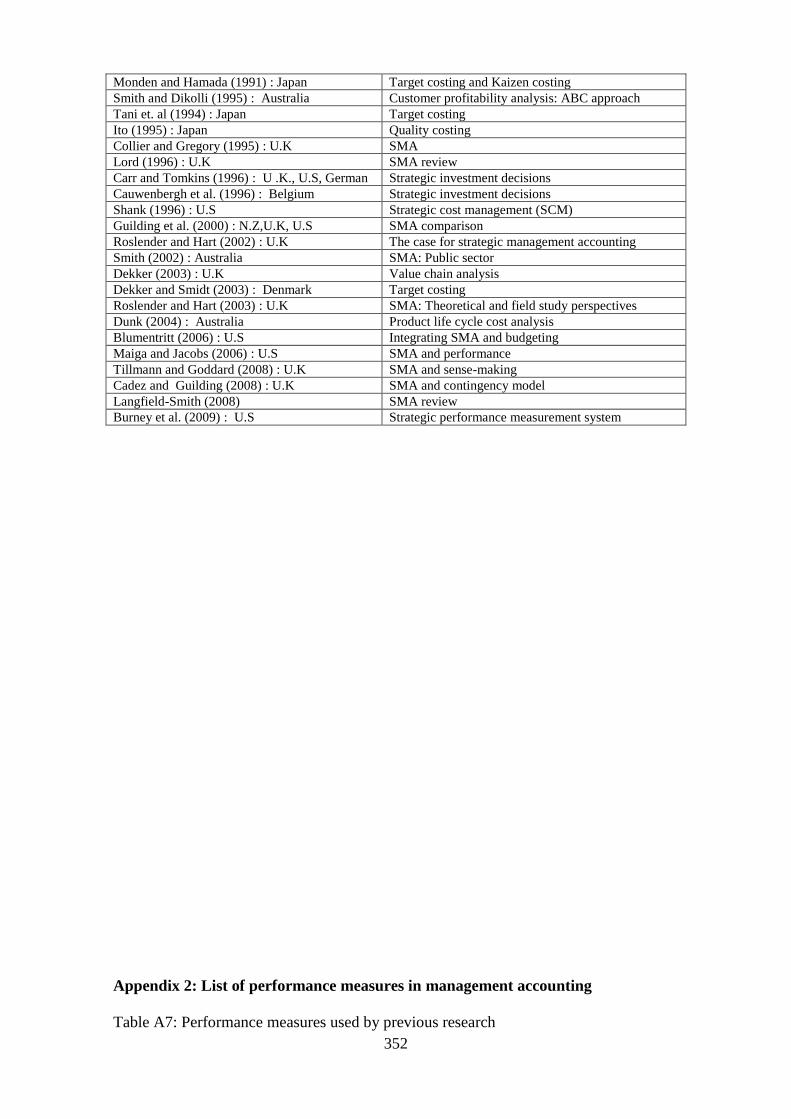
352
Monden and Hamada (1991) : Japan Target costing and Kaizen costing
Smith and Dikolli (1995) : Australia Customer profitability analysis: ABC approach
Tani et. al (1994) : Japan Target costing
Ito (1995) : Japan Quality costing
Collier and Gregory (1995) : U.K SMA
Lord (1996) : U.K SMA review
Carr and Tomkins (1996) : U .K., U.S, German Strategic investment decisions
Cauwenbergh et al. (1996) : Belgium Strategic investment decisions
Shank (1996) : U.S Strategic cost management (SCM)
Guilding et al. (2000) : N.Z,U.K, U.S SMA comparison
Roslender and Hart (2002) : U.K The case for strategic management accounting
Smith (2002) : Australia SMA: Public sector
Dekker (2003) : U.K Value chain analysis
Dekker and Smidt (2003) : Denmark Target costing
Roslender and Hart (2003) : U.K SMA: Theoretical and field study perspectives
Dunk (2004) : Australia Product life cycle cost analysis
Blumentritt (2006) : U.S Integrating SMA and budgeting
Maiga and Jacobs (2006) : U.S SMA and performance
Tillmann and Goddard (2008) : U.K SMA and sense-making
Cadez and Guilding (2008) : U.K SMA and contingency model
Langfield-Smith (2008) SMA review
Burney et al. (2009) : U.S Strategic performance measurement system
Appendix 2: List of performance measures in management accounting
Table A7: Performance measures used by previous research
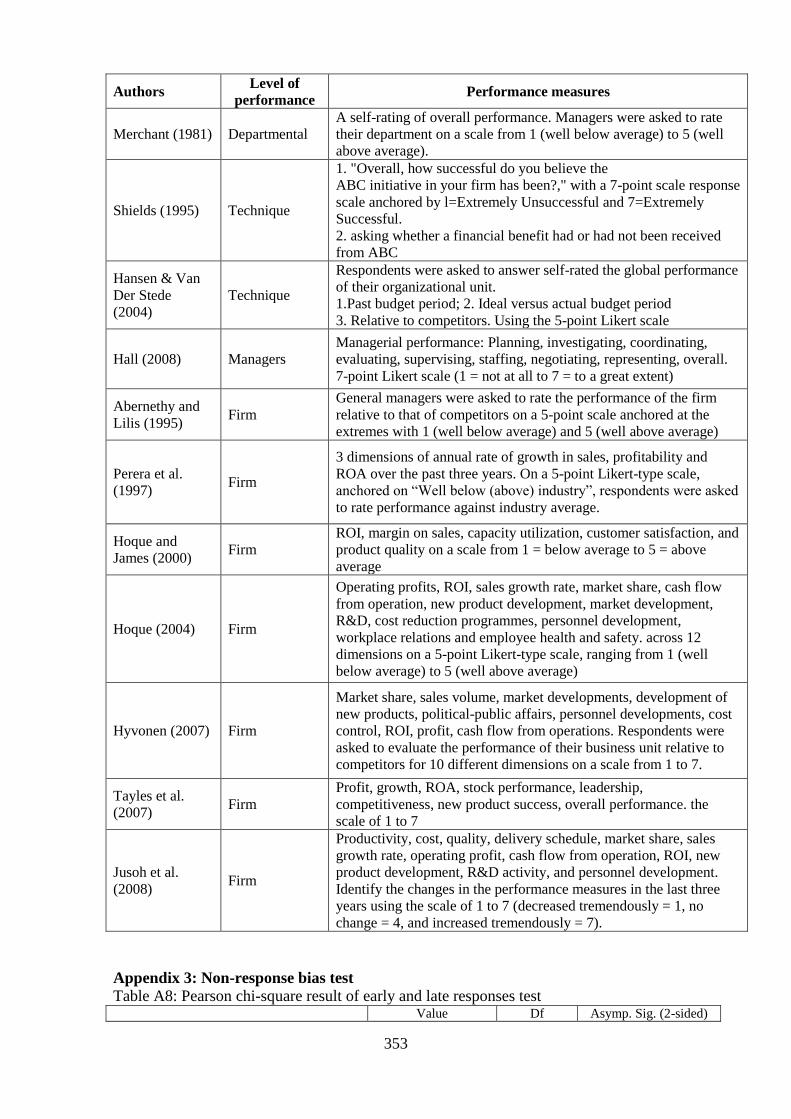
353
Authors Level of
performance Performance measures
Merchant (1981) Departmental A self-rating of overall performance. Managers were asked to rate
their department on a scale from 1 (well below average) to 5 (well
above average).
Shields (1995) Technique
1. "Overall, how successful do you believe the ABC initiative in your firm has been?," with a 7-point scale response
scale anchored by l=Extremely Unsuccessful and 7=Extremely
Successful. 2. asking whether a financial benefit had or had not been received
from ABC
Hansen & Van
Der Stede
(2004) Technique
Respondents were asked to answer self-rated the global performance
of their organizational unit. 1.Past budget period; 2. Ideal versus actual budget period 3. Relative to competitors. Using the 5-point Likert scale
Hall (2008) Managers Managerial performance: Planning, investigating, coordinating,
evaluating, supervising, staffing, negotiating, representing, overall.
7-point Likert scale (1 = not at all to 7 = to a great extent)
Abernethy and
Lilis (1995) Firm
General managers were asked to rate the performance of the firm
relative to that of competitors on a 5-point scale anchored at the
extremes with 1 (well below average) and 5 (well above average)
Perera et al.
(1997) Firm
3 dimensions of annual rate of growth in sales, profitability and
ROA over the past three years. On a 5-point Likert-type scale,
anchored on ―Well below (above) industry‖, respondents were asked
to rate performance against industry average.
Hoque and
James (2000) Firm
ROI, margin on sales, capacity utilization, customer satisfaction, and
product quality on a scale from 1 = below average to 5 = above
average
Hoque (2004) Firm
Operating profits, ROI, sales growth rate, market share, cash flow
from operation, new product development, market development,
R&D, cost reduction programmes, personnel development,
workplace relations and employee health and safety. across 12
dimensions on a 5-point Likert-type scale, ranging from 1 (well
below average) to 5 (well above average)
Hyvonen (2007) Firm
Market share, sales volume, market developments, development of
new products, political-public affairs, personnel developments, cost
control, ROI, profit, cash flow from operations. Respondents were
asked to evaluate the performance of their business unit relative to
competitors for 10 different dimensions on a scale from 1 to 7.
Tayles et al.
(2007) Firm
Profit, growth, ROA, stock performance, leadership,
competitiveness, new product success, overall performance. the
scale of 1 to 7
Jusoh et al.
(2008) Firm
Productivity, cost, quality, delivery schedule, market share, sales
growth rate, operating profit, cash flow from operation, ROI, new
product development, R&D activity, and personnel development.
Identify the changes in the performance measures in the last three
years using the scale of 1 to 7 (decreased tremendously = 1, no
change = 4, and increased tremendously = 7).
Appendix 3: Non-response bias test
Table A8: Pearson chi-square result of early and late responses test Value Df Asymp. Sig. (2-sided)
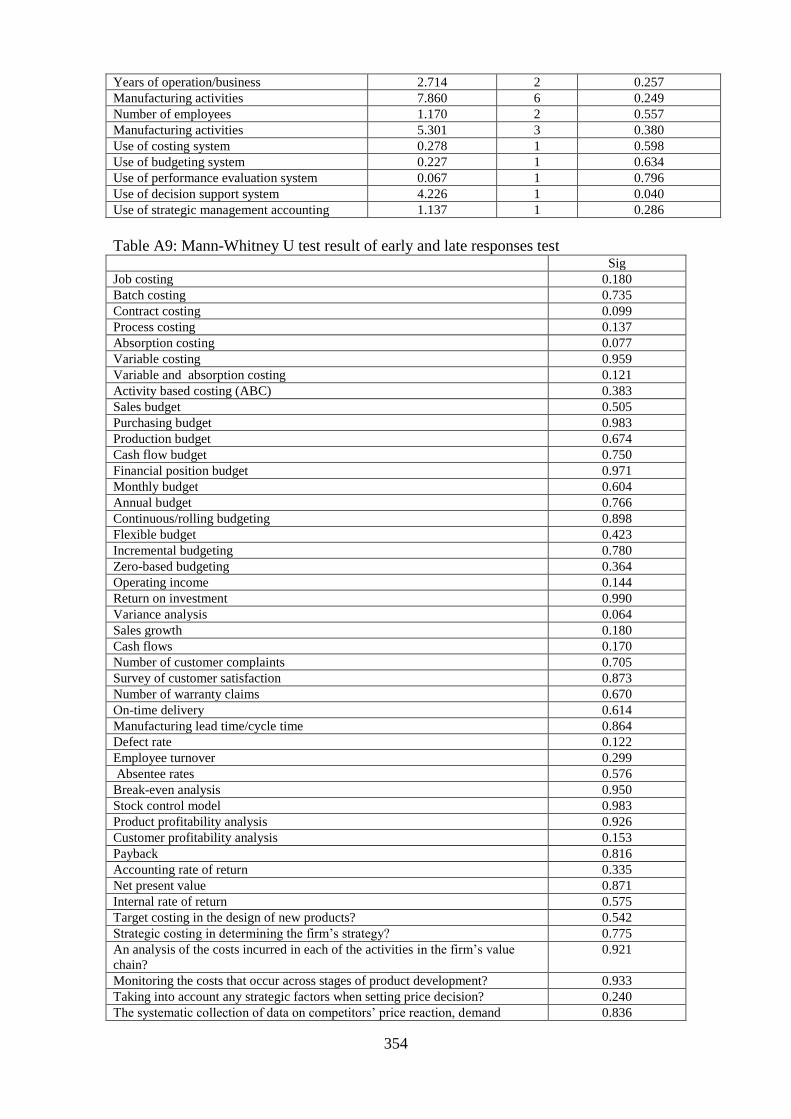
354
Years of operation/business 2.714 2 0.257
Manufacturing activities 7.860 6 0.249
Number of employees 1.170 2 0.557
Manufacturing activities 5.301 3 0.380
Use of costing system 0.278 1 0.598
Use of budgeting system 0.227 1 0.634
Use of performance evaluation system 0.067 1 0.796
Use of decision support system 4.226 1 0.040
Use of strategic management accounting 1.137 1 0.286
Table A9: Mann-Whitney U test result of early and late responses test Sig
Job costing 0.180
Batch costing 0.735
Contract costing 0.099
Process costing 0.137
Absorption costing 0.077
Variable costing 0.959
Variable and absorption costing 0.121
Activity based costing (ABC) 0.383
Sales budget 0.505
Purchasing budget 0.983
Production budget 0.674
Cash flow budget 0.750
Financial position budget 0.971
Monthly budget 0.604
Annual budget 0.766
Continuous/rolling budgeting 0.898
Flexible budget 0.423
Incremental budgeting 0.780
Zero-based budgeting 0.364
Operating income 0.144
Return on investment 0.990
Variance analysis 0.064
Sales growth 0.180
Cash flows 0.170
Number of customer complaints 0.705
Survey of customer satisfaction 0.873
Number of warranty claims 0.670
On-time delivery 0.614
Manufacturing lead time/cycle time 0.864
Defect rate 0.122
Employee turnover 0.299
Absentee rates 0.576
Break-even analysis 0.950
Stock control model 0.983
Product profitability analysis 0.926
Customer profitability analysis 0.153
Payback 0.816
Accounting rate of return 0.335
Net present value 0.871
Internal rate of return 0.575
Target costing in the design of new products? 0.542
Strategic costing in determining the firm‘s strategy? 0.775
An analysis of the costs incurred in each of the activities in the firm‘s value
chain?
0.921
Monitoring the costs that occur across stages of product development? 0.933
Taking into account any strategic factors when setting price decision? 0.240
The systematic collection of data on competitors‘ price reaction, demand 0.836

355
reaction, and market position?
How intense is competition for the firm‘s main product/product lines? How
intense is competition for the firm‘s main product/product lines?
0.547
To what extent did your owner/manager participate in the development of
management accounting practices for your firm?
0.880
Flexible manufacturing system 0.523
Computer numerically controlled machines 0.504
Others 0.519
Level of productivity 0.724
Product quality 0.455
Number of deliveries on time 0.978
Sales growth rate 0.766
Operating profit growth rate 0.589
Cash flow growth rate 0.313
planning the future strategies, tactics and operations 0.537
controlling current activities 0.194
measuring and evaluating performance 0.501
optimizing the use of firm‘s resources 0.213
reducing subjectivity in the decision making process 0.281
improving internal and external communication 0.392
Appendix 4: Results summary of ordinal regression analysis between the use
management accounting practices and perceptions of firm performance using
Cloglink
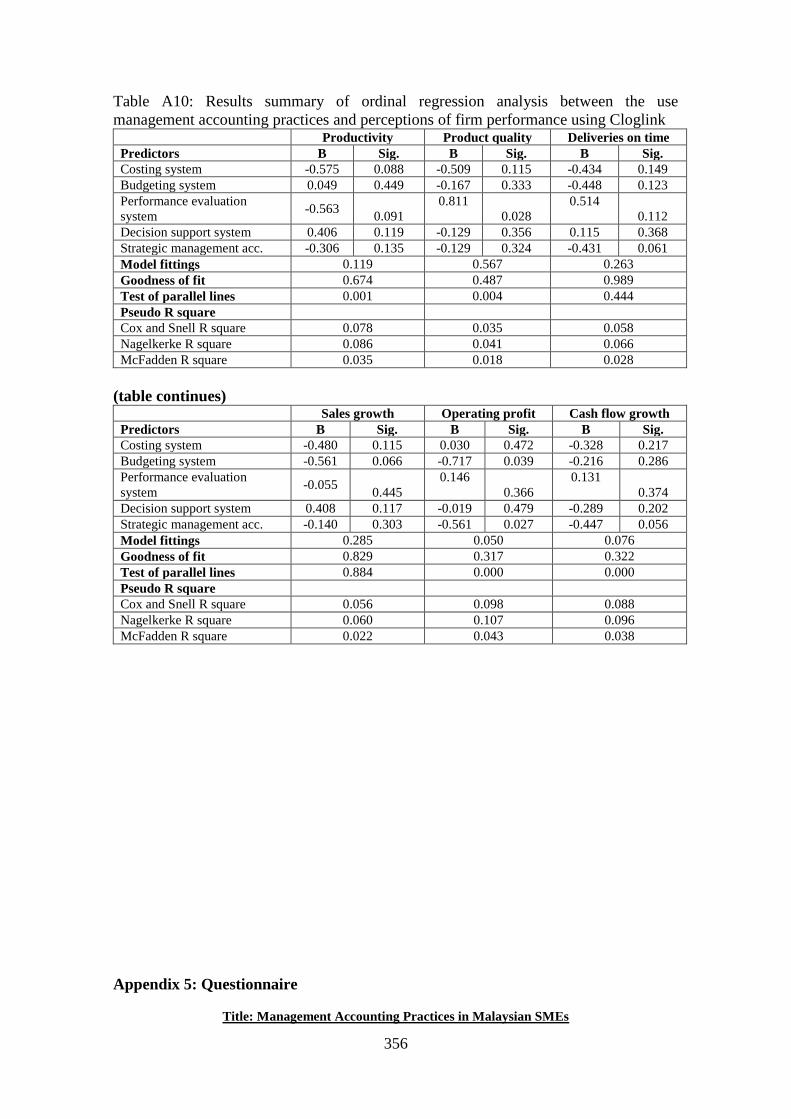
356
Table A10: Results summary of ordinal regression analysis between the use
management accounting practices and perceptions of firm performance using Cloglink Productivity Product quality Deliveries on time
Predictors B Sig. B Sig. B Sig.
Costing system -0.575 0.088 -0.509 0.115 -0.434 0.149
Budgeting system 0.049 0.449 -0.167 0.333 -0.448 0.123
Performance evaluation
system -0.563
0.091
0.811
0.028
0.514
0.112
Decision support system 0.406 0.119 -0.129 0.356 0.115 0.368
Strategic management acc. -0.306 0.135 -0.129 0.324 -0.431 0.061
Model fittings 0.119 0.567 0.263
Goodness of fit 0.674 0.487 0.989
Test of parallel lines 0.001 0.004 0.444
Pseudo R square
Cox and Snell R square 0.078 0.035 0.058
Nagelkerke R square 0.086 0.041 0.066
McFadden R square 0.035 0.018 0.028
(table continues) Sales growth Operating profit Cash flow growth
Predictors B Sig. B Sig. B Sig.
Costing system -0.480 0.115 0.030 0.472 -0.328 0.217
Budgeting system -0.561 0.066 -0.717 0.039 -0.216 0.286
Performance evaluation
system -0.055
0.445
0.146
0.366
0.131
0.374
Decision support system 0.408 0.117 -0.019 0.479 -0.289 0.202
Strategic management acc. -0.140 0.303 -0.561 0.027 -0.447 0.056
Model fittings 0.285 0.050 0.076
Goodness of fit 0.829 0.317 0.322
Test of parallel lines 0.884 0.000 0.000
Pseudo R square
Cox and Snell R square 0.056 0.098 0.088
Nagelkerke R square 0.060 0.107 0.096
McFadden R square 0.022 0.043 0.038
Appendix 5: Questionnaire
Title: Management Accounting Practices in Malaysian SMEs
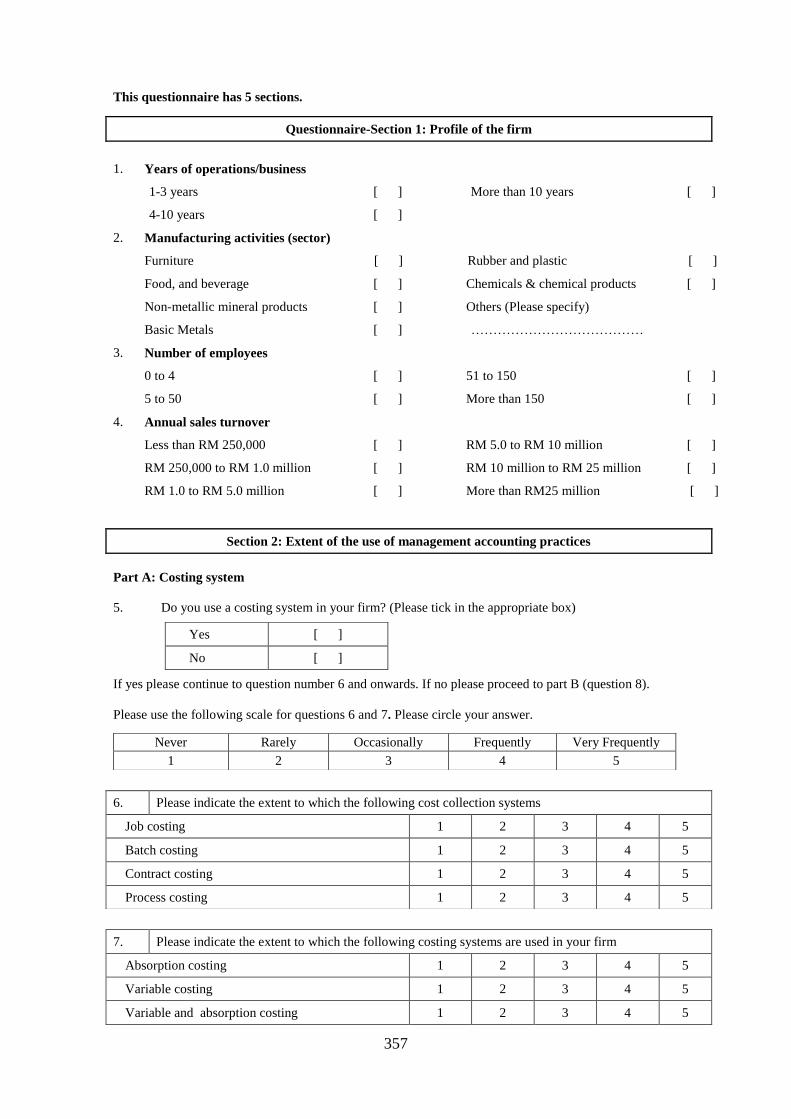
357
This questionnaire has 5 sections.
1. Years of operations/business
1-3 years [ ] More than 10 years [ ]
4-10 years [ ]
2. Manufacturing activities (sector)
Furniture [ ] Rubber and plastic [ ]
Food, and beverage [ ] Chemicals & chemical products [ ]
Non-metallic mineral products [ ] Others (Please specify)
Basic Metals [ ] …………………………………
3. Number of employees
0 to 4 [ ] 51 to 150 [ ]
5 to 50 [ ] More than 150 [ ]
4. Annual sales turnover
Less than RM 250,000 [ ] RM 5.0 to RM 10 million [ ]
RM 250,000 to RM 1.0 million [ ] RM 10 million to RM 25 million [ ]
RM 1.0 to RM 5.0 million [ ] More than RM25 million [ ]
Part A: Costing system
5. Do you use a costing system in your firm? (Please tick in the appropriate box)
If yes please continue to question number 6 and onwards. If no please proceed to part B (question 8).
Please use the following scale for questions 6 and 7. Please circle your answer.
Never Rarely Occasionally Frequently Very Frequently
1 2 3 4 5
Questionnaire-Section 1: Profile of the firm
Section 2: Extent of the use of management accounting practices
Yes [ ]
No [ ]
6. Please indicate the extent to which the following cost collection systems
Job costing 1 2 3 4 5
Batch costing 1 2 3 4 5
Contract costing 1 2 3 4 5
Process costing 1 2 3 4 5
7. Please indicate the extent to which the following costing systems are used in your firm
Absorption costing 1 2 3 4 5
Variable costing 1 2 3 4 5
Variable and absorption costing 1 2 3 4 5
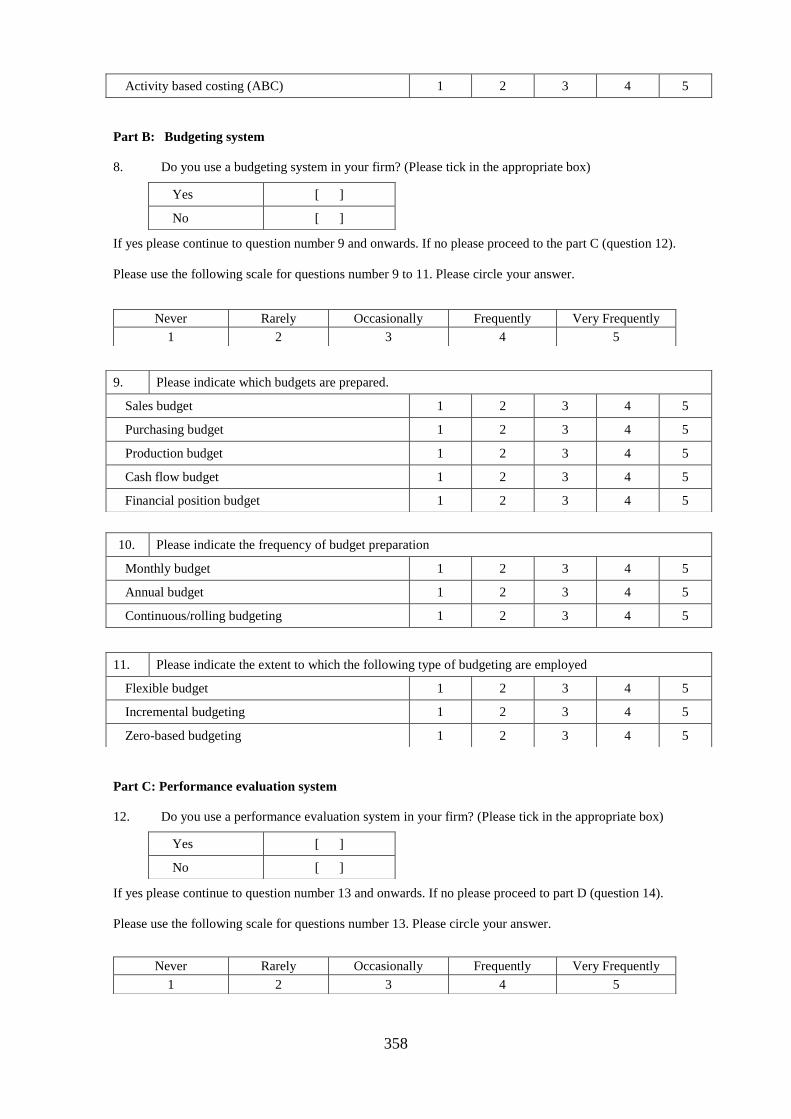
358
Part B: Budgeting system
8. Do you use a budgeting system in your firm? (Please tick in the appropriate box)
If yes please continue to question number 9 and onwards. If no please proceed to the part C (question 12).
Please use the following scale for questions number 9 to 11. Please circle your answer.
Never Rarely Occasionally Frequently Very Frequently
1 2 3 4 5
Part C: Performance evaluation system
12. Do you use a performance evaluation system in your firm? (Please tick in the appropriate box)
If yes please continue to question number 13 and onwards. If no please proceed to part D (question 14).
Please use the following scale for questions number 13. Please circle your answer.
Never Rarely Occasionally Frequently Very Frequently
1 2 3 4 5
Activity based costing (ABC) 1 2 3 4 5
Yes [ ]
No [ ]
9. Please indicate which budgets are prepared.
Sales budget 1 2 3 4 5
Purchasing budget 1 2 3 4 5
Production budget 1 2 3 4 5
Cash flow budget 1 2 3 4 5
Financial position budget 1 2 3 4 5
10. Please indicate the frequency of budget preparation
Monthly budget 1 2 3 4 5
Annual budget 1 2 3 4 5
Continuous/rolling budgeting 1 2 3 4 5
11. Please indicate the extent to which the following type of budgeting are employed
Flexible budget 1 2 3 4 5
Incremental budgeting 1 2 3 4 5
Zero-based budgeting 1 2 3 4 5
Yes [ ]
No [ ]
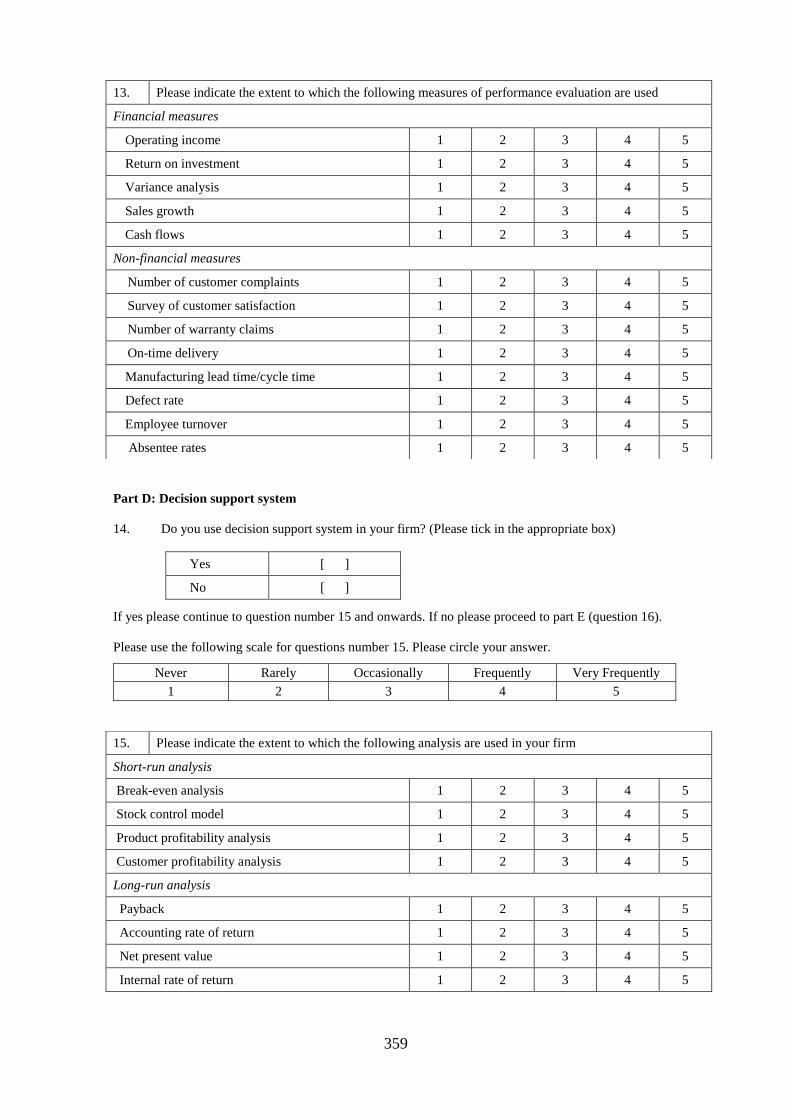
359
Part D: Decision support system
14. Do you use decision support system in your firm? (Please tick in the appropriate box)
Yes [ ]
No [ ]
If yes please continue to question number 15 and onwards. If no please proceed to part E (question 16).
Please use the following scale for questions number 15. Please circle your answer.
Never Rarely Occasionally Frequently Very Frequently
1 2 3 4 5
13. Please indicate the extent to which the following measures of performance evaluation are used
Financial measures
Operating income 1 2 3 4 5
Return on investment 1 2 3 4 5
Variance analysis 1 2 3 4 5
Sales growth 1 2 3 4 5
Cash flows 1 2 3 4 5
Non-financial measures
Number of customer complaints 1 2 3 4 5
Survey of customer satisfaction 1 2 3 4 5
Number of warranty claims 1 2 3 4 5
On-time delivery 1 2 3 4 5
Manufacturing lead time/cycle time 1 2 3 4 5
Defect rate 1 2 3 4 5
Employee turnover 1 2 3 4 5
Absentee rates 1 2 3 4 5
15. Please indicate the extent to which the following analysis are used in your firm
Short-run analysis
Break-even analysis 1 2 3 4 5
Stock control model 1 2 3 4 5
Product profitability analysis 1 2 3 4 5
Customer profitability analysis 1 2 3 4 5
Long-run analysis
Payback 1 2 3 4 5
Accounting rate of return 1 2 3 4 5
Net present value 1 2 3 4 5
Internal rate of return 1 2 3 4 5

360
Part E: Strategic Management Accounting
16. Do you use strategic management accounting in your firm? (Please tick in the appropriate box)
Yes [ ]
No [ ]
If yes please continue to question number 17 and onwards. If no please proceed to section 3, part A
(question 18).
Please use the following scale for questions number 17. Please circle your answer.
Never Rarely Occasionally Frequently Very Frequently
1 2 3 4 5
*for example costs of installation, operation, support, maintenance and disposal.
** for example factors: competitor price reaction, elasticity, market growth, economies of scale, and
experience.
Part A: Market competition
Please use the following scale for question 18. Please circle your answer.
Not intense at all Not intense Slightly intense Intense Very intense
1 2 3 4 5
Part B: Qualified internal accountant
Please tick in the appropriate box for question 19 and 20.
19. Do you employ any accounting staff?
If yes, please continue to question 20 and onwards, if no please proceed to Part C (question 21)
20. Please indicate the highest qualifications of your firm‘s internal accountant.
17. To what extent do you employ the following practices
Target costing in the design of new products? 1 2 3 4 5
Strategic costing in determining the firm‘s strategy? 1 2 3 4 5
An analysis of the costs incurred in each of the activities in the
firm‘s value chain? 1 2 3 4 5
Monitoring the costs that occur across stages of product
development? * 1 2 3 4 5
Taking into account any strategic factors when setting price
decision?** 1 2 3 4 5
The systematic collection of data on competitors‘ price reaction,
demand reaction, and market position? 1 2 3 4 5
Section 3 : Factors which affect of the extent of the use of management accounting practices
18. How intense is competition for the firm‘s main
product/product lines? 1 2 3 4 5
Yes [ ]
No [ ]
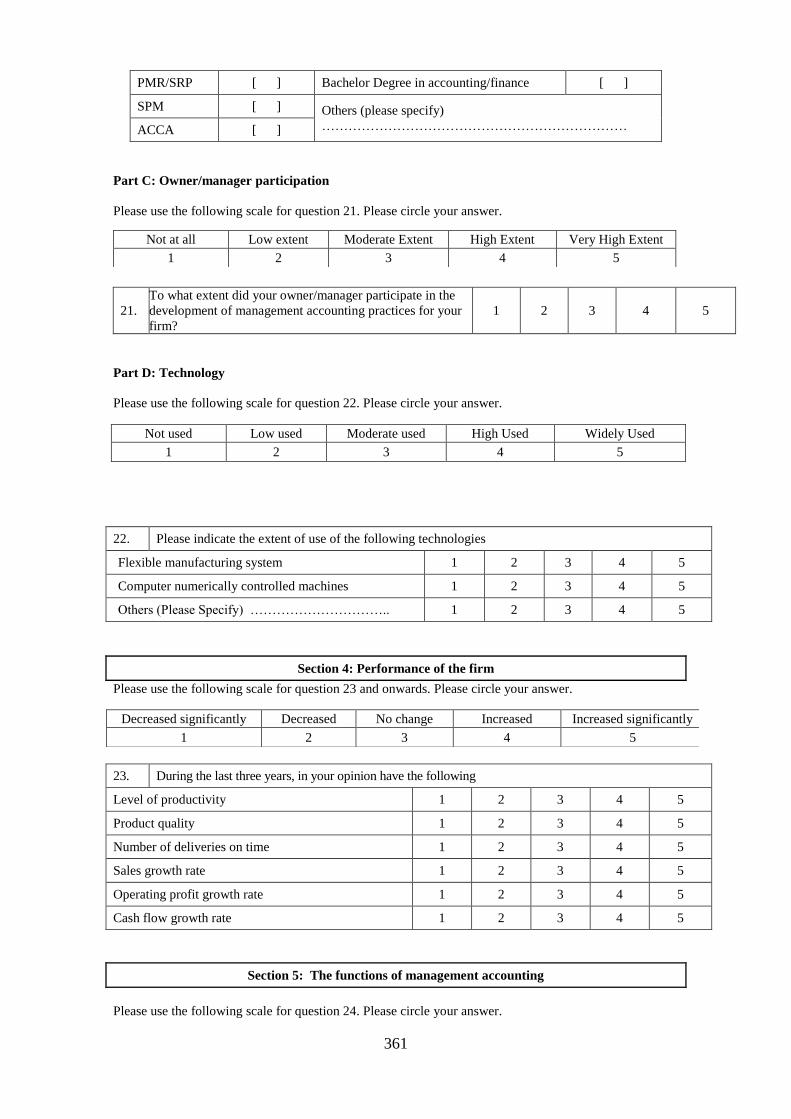
361
Part C: Owner/manager participation
Please use the following scale for question 21. Please circle your answer.
Not at all Low extent Moderate Extent High Extent Very High Extent
1 2 3 4 5
21.
To what extent did your owner/manager participate in the
development of management accounting practices for your
firm?
1 2 3 4 5
Part D: Technology
Please use the following scale for question 22. Please circle your answer.
Not used Low used Moderate used High Used Widely Used
1 2 3 4 5
22. Please indicate the extent of use of the following technologies
Flexible manufacturing system 1 2 3 4 5
Computer numerically controlled machines 1 2 3 4 5
Others (Please Specify) ………………………….. 1 2 3 4 5
Please use the following scale for question 23 and onwards. Please circle your answer.
Please use the following scale for question 24. Please circle your answer.
PMR/SRP [ ] Bachelor Degree in accounting/finance [ ]
SPM [ ] Others (please specify)
…………………………………………………………… ACCA [ ]
Section 4: Performance of the firm
Decreased significantly Decreased No change Increased Increased significantly
1 2 3 4 5
23. During the last three years, in your opinion have the following
Level of productivity 1 2 3 4 5
Product quality 1 2 3 4 5
Number of deliveries on time 1 2 3 4 5
Sales growth rate 1 2 3 4 5
Operating profit growth rate 1 2 3 4 5
Cash flow growth rate 1 2 3 4 5
Section 5: The functions of management accounting
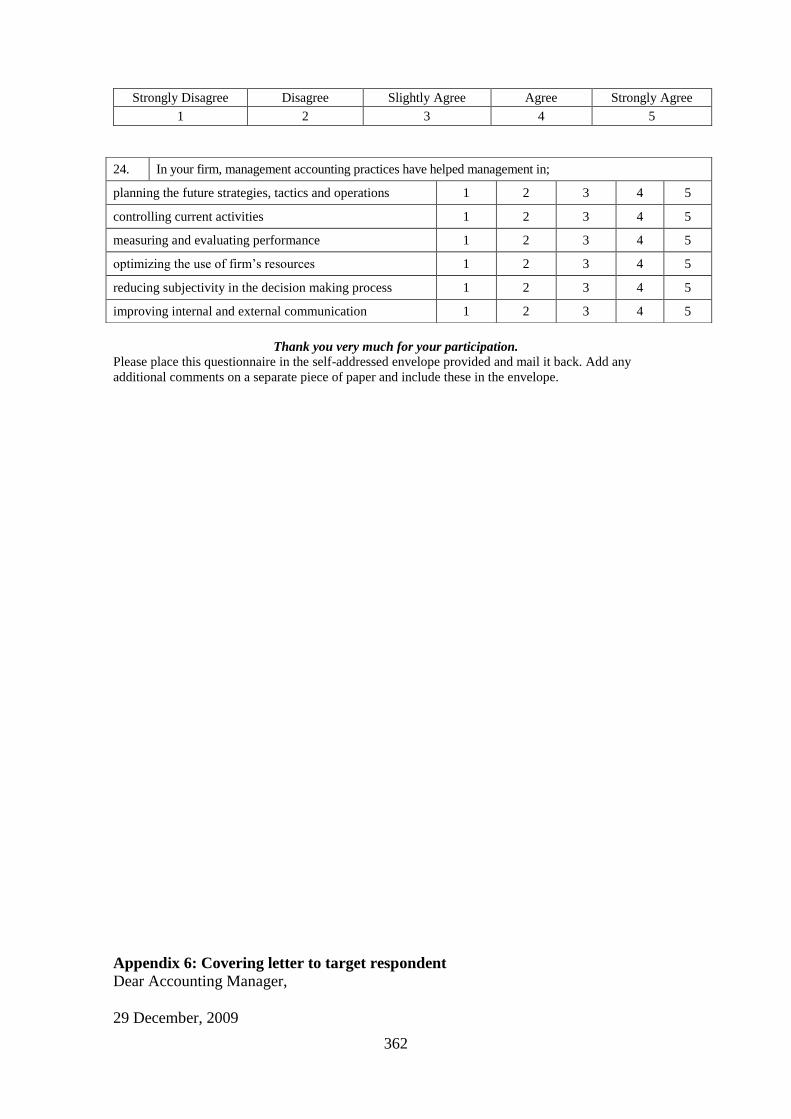
362
Thank you very much for your participation.
Please place this questionnaire in the self-addressed envelope provided and mail it back. Add any
additional comments on a separate piece of paper and include these in the envelope.
Appendix 6: Covering letter to target respondent
Dear Accounting Manager,
29 December, 2009
Strongly Disagree Disagree Slightly Agree Agree Strongly Agree
1 2 3 4 5
24. In your firm, management accounting practices have helped management in;
planning the future strategies, tactics and operations 1 2 3 4 5
controlling current activities 1 2 3 4 5
measuring and evaluating performance 1 2 3 4 5
optimizing the use of firm‘s resources 1 2 3 4 5
reducing subjectivity in the decision making process 1 2 3 4 5
improving internal and external communication 1 2 3 4 5

363
I am a lecturer at the University of Tun Hussien Onn Malaysia (UTHM) who is
undertaking a Ph.D as part of my job requirement. My thesis is based on a study of the
management accounting practices and their impact on the performance of SMEs in
Malaysia. I am writing to invite you to participate in this research through the
completion of the enclosed questionnaire.
This survey is being conducted as part of my Ph.D. research at the University of Exeter
Business School. The questionnaire should take approximately 20 minutes to complete.
Please be assured that all information collected will be treated as strictly confidential.
No individual identities will be revealed and only aggregate results will be presented.
The numbers at the end of the questionnaire are used only as a code for following up
non-respondents.
After answering the questions at your leisure over a one to two week period, please place
the attached questionnaire in the postage- paid envelope provided. If you would like to
review the results of the study when completed, please place a business card in the
envelope and I will send you a copy of the executive summary of my research as a
token of my appreciation.
If you have any questions, please feel free to contact me at my e-mail address below.
The success of this study depends upon your responses, accordingly your participation
is much appreciated.
Yours sincerely,
Home address
Kamilah Ahmad Kamilah Ahmad
Ph.D Candidate in Accounting Di alamat:
Business School Surya Azlina Ibrahim
University of Exeter Sekolah Keb. Sri Cheras
Streatham Court, Exeter Km. 5, Jalan Cheras
EX4 4PU, United Kingdom 56100, Kuala Lumpur,Malaysia
[email protected] [email protected]
Appendix 7: Covering letter : 1st Follow-up
Dear Accounting Manager,

364
29 December, 2009
I am a lecturer at the University of Tun Hussien Onn Malaysia (UTHM) who is
undertaking a Ph.D as part of my job requirement. Two months ago a questionnaire was
mailed to your firm seeking your perceptions on management accounting practices
among Malaysian SMEs. As of today I have not yet received your completed
questionnaire.
This survey is being conducted as part of my Ph.D. research at the University of Exeter
Business School. The questionnaire should take approximately 20 minutes to complete.
In case you did not receive the questionnaire that I sent to you previously, I have
enclosed another questionnaire. Please complete and return the questionnaire at your
earliest convenience. For your views to be included in this important study, your
completed questionnaire must be received no later than January 15th
2010.
Please be assured that all information collected will be treated as strictly confidential.
No individual identities will be revealed and only aggregate results will be presented.
The numbers at the end of the questionnaire are used only as a code for following up
non-respondents.
After answering the questions, please place the attached questionnaire in the postage-
paid envelope provided. If you would like to review the results of the study when
completed, please place a business card in the envelope and I will send you a copy of
the executive summary of my research as a token of my appreciation.
If you have any questions, please feel free to contact me at my e-mail address below.
The success of this study depends upon your responses, accordingly your participation
is much appreciated.
Yours sincerely,
Home address
Kamilah Ahmad Kamilah Ahmad
Ph.D Candidate in Accounting Di alamat:
Business School Surya Azlina Ibrahim
University of Exeter Sekolah Keb. Sri Cheras
Streatham Court, Exeter Km. 5, Jalan Cheras
EX4 4PU, United Kingdom 56100, Kuala Lumpur,Malaysia
[email protected] [email protected]
Appendix 8: Covering letter: 2nd Follow-up
Dear Account Manager,

365
22 March, 2010
I am writing to you about the survey of management accounting practices among
Malaysian SMEs. As of today I have not yet received your completed questionnaire.
This survey is being conducted as part of my Ph.D. research at the University of Exeter
Business School. The questionnaire should take approximately 15 minutes to complete.
In case you did not receive the questionnaire that I sent to you previously, I have
enclosed another questionnaire. May I urge you to complete it and return it as soon as
possible. Please be assured that all information collected will be treated as strictly
confidential. No individual identities will be revealed and only aggregate results will be
presented.
After answering the questions, please place the attached questionnaire in the postage-
paid envelope provided. If you would like to review the results of the study when
completed, please place a business card in the envelope and I will send you a copy of
the executive summary of my research as a token of my appreciation.
If you have any questions, please feel free to contact me at my e-mail address below.
The success of this study depends upon your responses, accordingly your participation
is much appreciated.
Yours sincerely,
Home address
Kamilah Ahmad Kamilah Ahmad
Ph.D Candidate in Accounting Di alamat:
Business School Surya Azlina Ibrahim
University of Exeter Sekolah Keb. Sri Cheras
Streatham Court, Exeter Km. 5, Jalan Cheras
EX4 4PU, United Kingdom 56100, Kuala Lumpur,Malaysia