Embed Size (px)
Citation preview

© OECD/IEA 2010
The Use of Energy Statistics to Estimate CO2 Emissions
Aidan Kennedy
CO2 Emissions Statistics
Energy Statistics Division
IEA Energy Statistics Training
Tbilisi, Nov. 5-9, 2012

© OECD/IEA 2010
Outline
International context
About CO2 emissions and how to estimate them
IPCC Methodologies
Notes on Bunkers and LULUCF
Using the Revised 1996 IPCC Guidelines: Sectoral Approach
Data quality
Examples
National policy options and the importance of energy statistics

© OECD/IEA 2010
International Context
Stabilisation of greenhouse gas concentrations in the atmosphere.
1992: United Nations Framework Convention on Climate Change (UNFCCC) at Rio de Janeiro conference
1995 (1996): IPCC Guidelines for National Greenhouse Gas InventoriesDevelopment of methodologies for gases not controlled by the Montreal Protocol.
1997: Kyoto Protocol (entry into force 2005)Reduction of anthropogenic greenhouse gas emissions for the period 2008-2012 of about 5% compared to 1990.
2000: Good Practice Guidance and Uncertainty Management in National Greenhouse Gas Inventories.
2006: 2006 IPCC Guidelines for National Greenhouse Gas Inventories.

© OECD/IEA 2010
Energy 83%
Industrial processes
7%
Agriculture 7%
Waste 3%
94%
5%1%
CH4
N2O
CO2
Key point: Accounting for the largest share of Annex I GHG
emissions, energy emissions are predominantly CO2.
Share of energy in GHG emissions
Source: UNFCCC

© OECD/IEA 2010
Key point: Despite growth in renewable energy, fossil fuels still
satisfy most of the world’s energy supply.
Gt of oil equivalent
World primary energy supply
0
2
4
6
8
10
12
14
1971 2009
Fossil Non fossil
86%
81%
19%
14%
86%
81%
19%
© OECD/IEA 2010
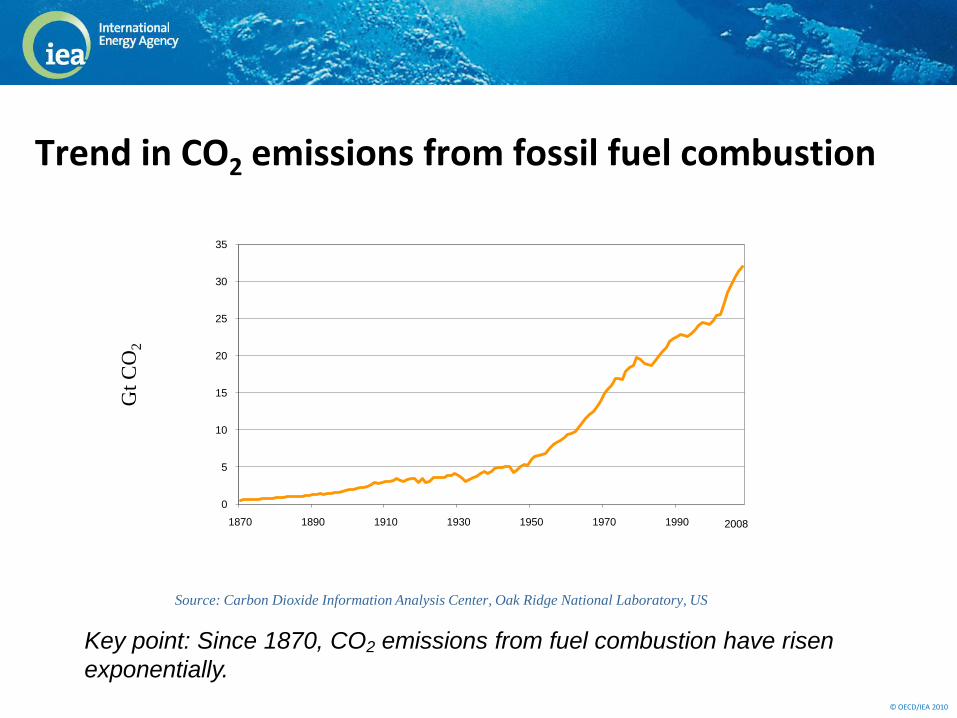
Key point: Since 1870, CO2 emissions from fuel combustion have risen
exponentially.
Trend in CO2 emissions from fossil fuel combustion
Source: Carbon Dioxide Information Analysis Center, Oak Ridge National Laboratory, US
Gt
CO
2
0
5
10
15
20
25
30
35
1870 1890 1910 1930 1950 1970 1990 2008

© OECD/IEA 2010
Key point: Although non- and low-emitting sources are growing, electricity
generation is becoming more CO2-intensive as a result of coal use.
Non emitting
World electricity generation by fuel
0
5000
10000
15000
20000
25000
1971 1975 1979 1983 1987 1991 1995 1999 2003 2009
TW
h
Coal/peat Oil Gas Nuclear Hydro Other

© OECD/IEA 2010
Key point: The combined share of power generation and transport makes up
2/3 of global emissions, up from ~50% in 1971.
Total emissions: 29.0 Gt CO2
World CO2 emissions by sector in 2009

© OECD/IEA 2010
Key point: When electricity and heat emissions are allocated to their consuming
sectors, Industry becomes the largest emitting sector; Transport emissions
change only slightly, while Residential and Other increase significantly.
Total emissions: 29.0 Gt CO2
World CO2 emissions by sector in 2009 with electricity and heat allocated

© OECD/IEA 2010
Energy Balances
CO2
Emissions
IPCC
Methodologies
Energy Statistics
How IEA estimates CO2 emissions from fuel combustion
© OECD/IEA 2010
Feasib
ility
Accura
cy
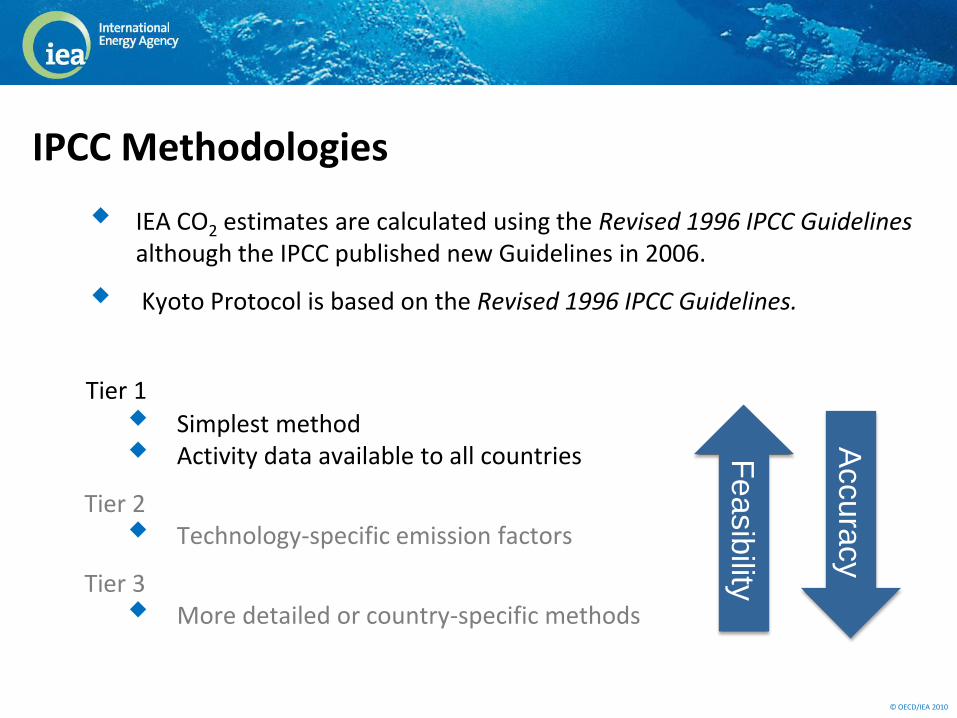
IPCC Methodologies
IEA CO2 estimates are calculated using the Revised 1996 IPCC Guidelinesalthough the IPCC published new Guidelines in 2006.
Kyoto Protocol is based on the Revised 1996 IPCC Guidelines.
Tier 1
Simplest method Activity data available to all countries
Tier 2 Technology-specific emission factors
Tier 3 More detailed or country-specific methods

© OECD/IEA 2010
Can be done from two independent sets of data:
Supply of fuels to the country
Reference Approach
Consumption by end-use sectors
Sectoral Approach
IPCC 1996 Guideline Methodologies
Basic computation for CO2 emissions:
CO2 emissions by product: Fuel Quantity x Emission Factor
(with corrections for stored and unoxidised carbon)
Sum over all different products

© OECD/IEA 2010
IPCC Guidelines: International aviation and international marine
bunkers are not included in national totals.
Note on international bunkers
0
5
10
15
20
25
30
1990 1992 1994 1996 1998 2000 2002 2004 2006 2009
Kyoto target(4)
International Bunkers
Non-Annex I Parties
Non-Participating Annex I Parties
Kyoto Parties with targets
Gt CO2

© OECD/IEA 2010
IPCC Guidelines: Biomass is not included in national totals for
CO2 emissions from fuel combustion.
Biomass contains carbon, absorbed by plants through
photosynthesis.
However, if biomass is sustainably grown, no additional CO2 is
considered as emitted into the atmosphere.
If there is a change in the biomass stocks, then the CO2 is accounted
for in LULUCF.
Note on Biomass

© OECD/IEA 2010
Converting to a common energy unit
(common energy unit: TJ)
Step 6:
Step 1:
Step 4:
Step 3:
Step 2:
Step 5:
Estimating sectoral fuel consumption
Multiplying by carbon emission factors
Calculating carbon stored
Correcting for carbon unoxidised
Converting to CO2 Emissions
(tonnes of CO2)
Using the Revised 1996 IPCC Guidelines: Sectoral Approach

© OECD/IEA 2010
Step 1: Estimating Sectoral Fuel ConsumptionMODULE ENERGY
SUBMODULE CO2 FROM FUEL COMBUSTION (TIER I SECTORAL APPROACH)
WORKSHEET STEP BY STEP CALCULATIONS
SHEET MANUFACTURING INDUSTRIES AND CONSTRUCTION
STEP 1 STEP 2 STEP 3
A B C D E F
Manufacturing Industries
and Construction
Consumption Conversion
Factor
(TJ/unit)
Consumption
(TJ)
Carbon
Emission
Factor
(t C/TJ)
Carbon
Content
(t C)
Carbon
Content
(Gg C)
C=(AxB) E=(CxD) F=(E x 10-3)
Crude Oil
Natural Gas Liquids
Gasoline
Jet Kerosene
Other Kerosene
Gas/Diesel Oil
Residual Fuel Oil
LPG
Units: Could be in natural units (e.g. 1000
tonnes) or in energy units (e.g. TJ)
Separate sheet filled
out for each sector:
Main activity producer
electricity and heat
Unallocated autoproducers
Other energy industries
Manufacturing industries and
construction
Transport
of which: road
Other sectors
of which: residential

© OECD/IEA 2010
MODULE ENERGY
SUBMODULE CO2 FROM FUEL COMBUSTION (TIER I SECTORAL APPROACH)
WORKSHEET STEP BY STEP CALCULATIONS
SHEET MANUFACTURING INDUSTRIES AND CONSTRUCTION
STEP 1 STEP 2 STEP 3
A B C D E F
Manufacturing Industries
and Construction
Consumption Conversion
Factor
(TJ/unit)
Consumption
(TJ)
Carbon
Emission
Factor
(t C/TJ)
Carbon
Content
(t C)
Carbon
Content
(Gg C)
C=(AxB) E=(CxD) F=(E x 10-3)
Crude Oil
Natural Gas Liquids
Gasoline
Jet Kerosene
Other Kerosene
Gas/Diesel Oil
Residual Fuel Oil
LPG
SELECTED NET CALORIFIC
VALUES FROM THE 1996 GLS
Factors (TJ/103
tonnes)
Refined petroleum products
Gasoline 44.80
Jet kerosene 44.59
Other kerosene 44.75
Shale oil 36.00
Gas/diesel oil 43.33
Residual fuel oil 40.19
LPG 47.31
Ethane 47.49
Naphtha 45.01
Bitumen 40.19
Lubricants 40.19
Petroleum coke 31.00
Refinery feedstocks 44.80
Refinery gas 48.15
Other oil products 40.19
Other products
Coal oils and tars
derived from coking
coals
28.00
Oil shale 9.40
Orimulsion 27.50
Country-specific NCVs for natural
gas and coal are given explicitly in
the Revised 1996 IPCC Guidelines
Step 2: Converting to a Common Energy Unit

© OECD/IEA 2010
MODULE ENERGY
SUBMODULE CO2 FROM FUEL COMBUSTION (TIER I SECTORAL APPROACH)
WORKSHEET STEP BY STEP CALCULATIONS
SHEET MANUFACTURING INDUSTRIES AND CONSTRUCTION
STEP 1 STEP 2 STEP 3
A B C D E F
Manufacturing Industries
and Construction
Consumption Conversion
Factor
(TJ/unit)
Consumption
(TJ)
Carbon
Emission
Factor
(t C/TJ)
Carbon
Content
(t C)
Carbon
Content
(Gg C)
C=(AxB) E=(CxD) F=(E x 10-3)
Crude Oil
Natural Gas Liquids
Gasoline
Jet Kerosene
Other Kerosene
Gas/Diesel Oil
Residual Fuel Oil
LPG
CARBON EMISSION FACTORS (CEF)
Fuel Carbon emission
factor (t C/TJ)LIQUID FOSSIL
Primary fuels
Crude oil 20.0
Orimulsion 22.0
Natural gas liquids 17.2
Secondary fuels/products
Gasoline 18.9
Jet kerosene 19.5
Other kerosene 19.6
Shale oil 20.0
Gas/diesel oil 20.2
Residual fuel oil 21.1
LPG 17.2
Ethane 16.8
Naphtha (20.0) (a)
Bitumen 22.0
Lubricants (20.0) (a)
Petroleum coke 27.5
Refinery feedstocks (20.0) (a)
Refinery gas 18.2 (b)
Other oil (20.0) (a)
CARBON EMISSION FACTORS (CEF)
Fuel Carbon emission
factor (t C/TJ)SOLID FOSSIL
Primary fuels
Anthracite 26.8
Coking coal 25.8
Other bituminous coal 25.8
Sub-bituminous coal 26.2
Lignite 27.6
Oil shale 29.1
Peat 28.9
Secondary fuels/products
BKB & patent fuel (25.8) (a)
Coke oven / gas coke 29.5
Coke oven gas 13.0 (b)
Blast furnace gas 66.0 (b)
GASEOUS FOSSIL
Natural gas (dry) 15.3
Step 3: Multiplying by Carbon Emission Factors

© OECD/IEA 2010
MODULE ENERGY
SUBMODULE CO2 FROM FUEL COMBUSTION (TIER I SECTORAL APPROACH)
WORKSHEET 2 STEP BY STEP CALCULATIONS
SHEET MANUFACTURING INDUSTRIES AND CONSTRUCTION
STEP 4 STEP 5 STEP 6
G H I J K L
Manufacturing
Industries and
Construction
Fraction of
Carbon
Stored
Carbon
Stored
(Gg C)
Net Carbon
Emissions
(Gg C)
Fraction of
Carbon
Oxidised
Actual
Carbon
Emissions
(Gg C)
Actual CO2
Emissions
(Gg CO2)
H=(FxG) I=(F-H) K=(IxJ) L=(K x
[44/12])
Crude Oil
Natural Gas Liquids
Gasoline
Jet Kerosene
Other Kerosene
Gas/Diesel Oil
Residual Fuel Oil
LPG
Default values: fraction of
carbon stored
Naphtha* 0.8
Lubricants 0.5
Bitumen 1.0
Coal Oils and Tars
0.75
Natural Gas* 0.33
Gas/Diesel Oil*
0.5
LPG* 0.8
Ethane* 0.8
*When used as feedstocks
Step 4: Calculating Carbon Stored
© OECD/IEA 2010
MODULE ENERGY
SUBMODULE CO2 FROM FUEL COMBUSTION (TIER I SECTORAL APPROACH)
WORKSHEET 2 STEP BY STEP CALCULATIONS
SHEET MANUFACTURING INDUSTRIES AND CONSTRUCTION
STEP 4 STEP 5 STEP 6
G H I J K L
Manufacturing
Industries and
Construction
Fraction of
Carbon
Stored
Carbon
Stored
(Gg C)
Net Carbon
Emissions
(Gg C)
Fraction of
Carbon
Oxidised
Actual
Carbon
Emissions
(Gg C)
Actual CO2
Emissions
(Gg CO2)
H=(FxG) I=(F-H) K=(IxJ) L=(K x
[44/12])
Crude Oil
Natural Gas Liquids
Gasoline
Jet Kerosene
Other Kerosene
Gas/Diesel Oil
Residual Fuel Oil
LPG
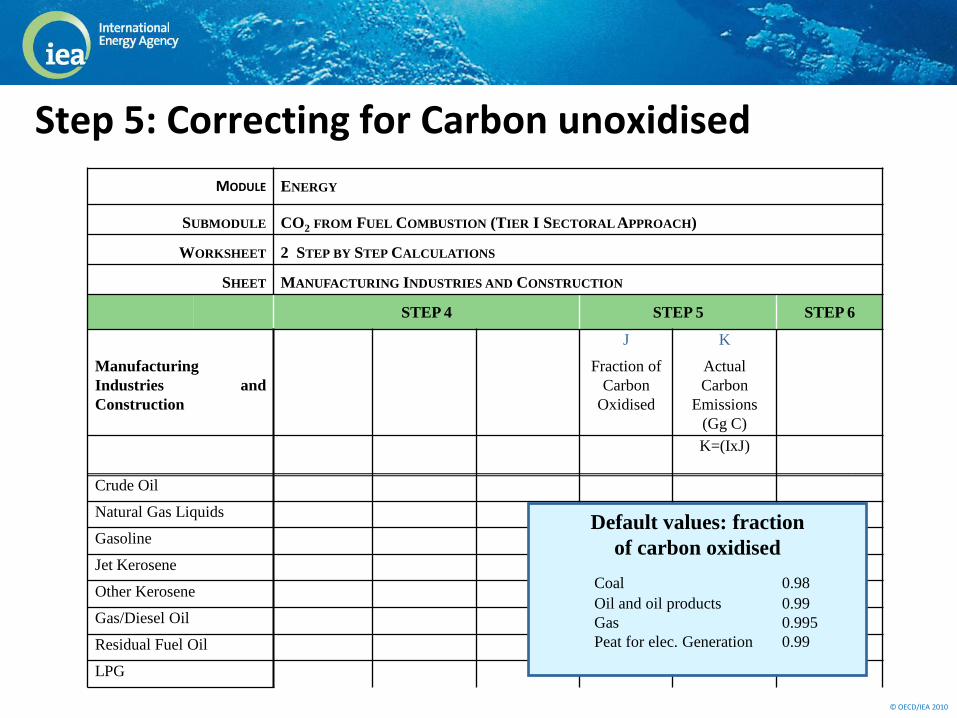
Default values: fraction
of carbon oxidised
Coal 0.98
Oil and oil products 0.99
Gas 0.995
Peat for elec. Generation 0.99
Step 5: Correcting for Carbon unoxidised

© OECD/IEA 2010
MODULE ENERGY
SUBMODULE CO2 FROM FUEL COMBUSTION (TIER I SECTORAL APPROACH)
WORKSHEET 2 STEP BY STEP CALCULATIONS
SHEET MANUFACTURING INDUSTRIES AND CONSTRUCTION
STEP 4 STEP 5 STEP 6
G H I J K L
Manufacturing
Industries and
Construction
Fraction of
Carbon
Stored
Carbon
Stored
(Gg C)
Net Carbon
Emissions
(Gg C)
Fraction of
Carbon
Oxidised
Actual
Carbon
Emissions
(Gg C)
Actual CO2
Emissions
(Gg CO2)
H=(FxG) I=(F-H) K=(IxJ) L=(K x
[44/12])
Crude Oil
Natural Gas Liquids
Gasoline
Jet Kerosene
Other Kerosene
Gas/Diesel Oil
Residual Fuel Oil
LPG
Multiply by 44/12
(the molecular weight ratio of CO2 to C)
Step 6: Converting to CO2 Emissions

© OECD/IEA 2010
Reference
ApproachSectoral
Approach
Part of Fugitive
Emissions
e.g. natural gas leakage
from pipelines, emissions
from energy transformation, etc.
<5% of the
reference
approach
Stock changes at
final consumers
Key point: Comparing the Reference Approach and the Sectoral Approach
is one way to control data quality.
Reference Approach is generally an upper limit for Sectoral Approach
Data Quality: Reference vs. Sectoral Approach
(and statistical differences!)
© OECD/IEA 2010
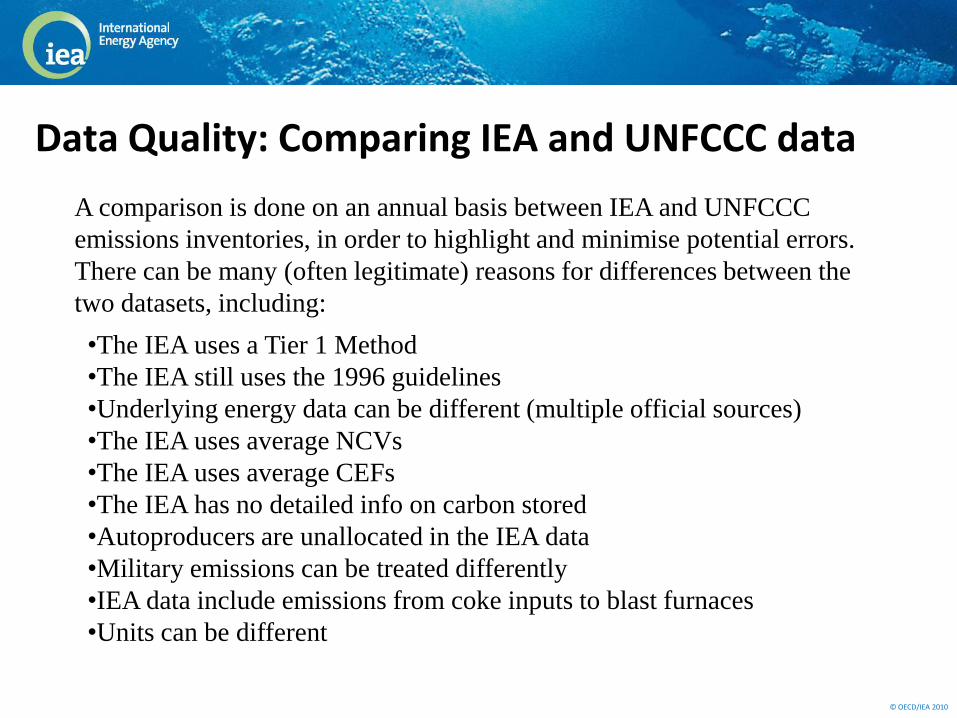
Data Quality: Comparing IEA and UNFCCC data
A comparison is done on an annual basis between IEA and UNFCCC
emissions inventories, in order to highlight and minimise potential errors.
There can be many (often legitimate) reasons for differences between the
two datasets, including:
•The IEA uses a Tier 1 Method
•The IEA still uses the 1996 guidelines
•Underlying energy data can be different (multiple official sources)
•The IEA uses average NCVs
•The IEA uses average CEFs
•The IEA has no detailed info on carbon stored
•Autoproducers are unallocated in the IEA data
•Military emissions can be treated differently
•IEA data include emissions from coke inputs to blast furnaces
•Units can be different

© OECD/IEA 2010
2009 World CO2 emissions
Bunker fuels are
included in transport
for the world total (but
excluded for all
countries and regions)
Residential only includes
emissions from fuels actually
combusted in households (hence
its relatively small share), not
electricity or heat consumption
We show both the reference
approach and sectoral approach
emissions (the difference
coming from statistical
differences, and losses and
transformation)We show emissions for main activity
and autoproducer plants separately
(we don’t have the required data to
allocate autoproducers to their
consuming sectors)
Other only includes
industrial waste and
non-renewable
municipal waste (not
biofuels)

© OECD/IEA 2010
CO2 Intensities of major countries
0
0,2
0,4
0,6
0,8
1
1,2
1,4
1,6
1,8
0 5 10 15 20 25
CO
2/ G
DP
PP
P (
kg C
O2
per
2000 U
SD
)
CO2 / population (t CO2 per capita)
United
States
Russian Federation
China
India
Japan
1990 2009
Key point: Various CO2 indicators can be used to track
countries with different economies against each other.

© OECD/IEA 2010
Dealing with Climate Change: National Policy Options
Emit less (be more efficient, restructure economy)
Emit differently (switch fuels or processes to deliver same outcome)
CO2 capture and storage
Do without (change behaviour)
Adapt (learn to live with it)
A need for energy statistics to be able to monitor progress of the
various policies

© OECD/IEA 2010
Importance of energy statistics for estimating GHG emissions
Fossil fuel combustion is the single largest human influence on climate.
Two sectors, both growing rapidly, represent the bulk of CO2
emissions from fuel: electricity and heat generation transport
Effective emissions mitigation will require all countries, regardless of energy demand and infrastructure, to use energy in a sustainable manner.
Up-to-date and accurate information on energy use and GHG emissions is essential for countries to monitor their progress in reducing GHG emissions.

© OECD/IEA 2010
A large amount of data is available for free at the following
address: http://www.iea.org/co2highlights
CO2 Emissions from Fuel Combustion (2011 Edition) is
available now.
Thank you. [email protected]