Embed Size (px)
Citation preview

The use of DPSIR and SAF for the Management of
Eutrophication in the Ria Formosa.
Sirak Robele Gari
MSc. Thesis
April 2010

MSc Thesis Sirak Robele Gari
ii
UNIVERSIDADE DO ALGARVE UNIVERSITY OF ALGARVE
FACULDADE DE CIÊNCIAS E TECNOLOGIA
FACULTY OF SCIENCES AND TECHNOLOGY
The use of DPSIR and SAF for the Management of
Eutrophication in the Ria Formosa.
MESTRADO EM GESTÃO DA ÁGUA E DA COSTA
(CURSO EUROPEU)
ERASMUS MUNDUS EUROPEAN JOINT MASTER
IN WATER AND COASTAL MANAGEMENT
Sirak Robele Gari
FARO, 2010

MSc Thesis Sirak Robele Gari
iii
NOME / NAME: Sirak Robele Gari
DEPARTAMENTO / DEPARTMENT:
Faculdade de Ciências e Tecnologia da Universidade do Algarve
ORIENTADOR / SUPERVISOR:
Professor Alice Newton (Faculty of Science)
Dr John D. Icely (CIMA)
DATA / DATE: 19/04/2010
TÍTULO DA TESE / TITLE OF THESIS:
The use of DPSIR and SAF for the Management of
Eutrophication in the Ria Formosa.
JURI: Dr. Tomazs Boski (CIMA, Universidade do Algarve)
Dr. Christopher D. Lowe (University of Plymouth)
Dr. Stephen M. Mudge (University of Wales)
Prof. Alice Newton ( FCT, Universidade do Algarve)
Dr. John D. Icely (CIMA, Universidade do Algarve)
MSc Thesis Sirak Robele Gari
iv
Acknowledgement
First and foremost I would like to thank my supervisor, Professor Alice Newton of
Algarve University, for the clear guidance and materials she provided me with for my
thesis. I thank her also for her first letter announcing the good news that I was selected
for the Erasmus Mundus scholarship. Dr John D. Icely, my co-supervisor deserves my
immense gratitude for his valuable advice.
My sincere gratitude goes to all the staff at the University of Plymouth who made my
stay in England easy: especially Mrs Susan Halley for her efficient cooperation and
quick responses to my doubts and requests, Dr Gillian Glegg for her valuable guidance
on academic issues.
I am immensely grateful for Ms Carmen Valle, the secretary of the Erasmus Mundus
Master’s programme at the University of Cadiz who helped me in matters regarding
Water & Coastal Management (WCM) programme and made my stay in Spain feasible.
I sincerely thank my colleague, Loli for her help when I needed it the most.
I would like to extend my gratitude to the staff in the Mobility office of Algarve
University: Paula, Merces, Celia, Palmira, Marleni and Paulo for their help and
cooperation with various aspects of my stay in Portugal.
I warmly thank my colleagues from all over the world in the WCM group, who created
a friendly atmosphere that made our little ―hut‖ warm and cosy and left pleasant
indelible memories.
Last but not least, the European Union should be thanked for launching the Erasmus
Mundus Scholarship Programme (that attracts scholars and students from around the
Globe) which made my study in Europe possible

MSc Thesis Sirak Robele Gari
v
Abbreviations
APRH: Associaçao Português dos Recursos Hidrológicos
AWMS: Agricultural Waste Management System
CPF: Capitania do Porto de Faro
CZSFL: Coastal Zone System Feedback Loop.
DAIN: Dissolved Available Inorganic Nitrogen
DAIP: Dissolved Available Inorganic Phospherous
DIN: Dissolved Inorganic Nitrogen
DITT : Department for Investment Trade and Tourism
DMS: Departamento Maritimo do Sul
DoW: Description of Work
DPSIR: Driver-Pressure-State-Impact-Response
ESE : Ecologic, Social and Economic
HAB: Harmful Algal Bloom
ICZM: Integrated Coastal Zone Management
INAG: Portuguese Water Institute
MADRP: Ministerio da Agricultura, Desinvolvimento Rural e das Pescas.
MESPRD: Ministry of Environment, Spatial Planning and Regional Development
ND: Nitrate Directive
SA: System Appraisal
SAF: Systems Approach Framework
SD: System Design
SF: System Formulation
SO: System Output
SPICOSA: Science and Policy Integration for Coastal System Assessment
SSA: Study Site Applications
VS: Virtual System
UWWTD: Urban Waste Water Directive
UWWTP: Urban Waste Water Treatment Plant
WFD: Water Framework Directive.
WP: Work Package

MSc Thesis Sirak Robele Gari
vi
Resumo
O Driver-Pressure-State-Impact-Response (DPSIR) chegada considera atividades
humanas como uma parte essencial da ecossistema e traz ciência natural junta, ciência
social e economia em uma estrutura para gerência adaptável. Systems Approach
Framework (SAF) abrange o ecológico, componentes sociais e econômicos das zonas
costeiras e objetivos estabelecer um diálogo permanente entre cientistas, interessados e
criadores de apólice nas zonas costeiras européias para desenvolver ICZM eficaz. O
objetivo do estudo presente é achar opções de gerência para eutrophication do Ria
Formosa por DPSIR e SAF. O objetivo inclui indicando a possibilidade que as mesmas
chegadas também podiam ser adaptadas em qualquer lugar no mundo para corpos
diferentes de água. A chegada de DPSIR foi usada para identificar os Motoristas,
Pressões, Estado, Impactam e Respostas assim como indicadores ambientais no Ria
Formosa. A agricultura e gado, Aquaculture e Pescaria, Turismo e Urbanização eram os
motoristas importantes. A pressão era enriquecimento de nutriente. O Estado revelou se
em concentração considerável de nutriente, Macro crescimento algáceo, ocorrência de
HAB em algumas partes da lagoa e flutuar concentração de oxigénio. O impacte
Ecológico era mortalidade alta de amêijoa. A diminuição associada em produtos de
aquaculture, perda de trabalho e intoxicação humana devido a HAB pertencem a
impactes Socioeconômicos. Respostas anteriores incluem medidas contra nutriente
carregar e mortalidade de amêijoa. Respostas adicionais foram recomendados,
principalmente para redução de nutriente carregar. Os quatro passos de SAF foram
seguidos. Os interessados foram identificados e o assunto de eutrophication foi
concordado em. Tendo definido o sistema virtual, o modelo conceitual do Ria Formosa
foi feito. Conseqüentemente, a possibilidade de formular o modelo conceitual num
modelo numérico representando o ecológico, componentes sociais e econômicos do
sistema foi discutido. O ligar dos três componentes num modelo de simulação e corrida
que os cenários era, então, discutidos. O processo de deliberação entre os interessados e
criadores de apólice, o corpo científico como promotor é destacado. O formato por que
o pacote final de saída é disseminado é sugerido. Assim, DPSIR e SAF podem ser
usados para a gerência de eutrophication em qualquer parte do mundo com as
modificações necessárias por recursos e características de sistema.
.
Palavras chaves: DPSIR, Eutrophication, Ria Formosa, SAF, SPICOSA.
MSc Thesis Sirak Robele Gari
vii
Abstract
The Driver-Pressure-State-Impact-Response (DPSIR) approach considers human
activities as an integral part of the ecosystem and brings together natural science, social
science and economics in one framework for adaptive management. Systems Approach
Framework (SAF) encompasses the ecological, social and economic components of the
coastal zones and aims to establish a permanent dialogue between scientists,
stakeholders and policy makers in the European coastal zones for developing effective
ICZM. The objective of the present study is to find management options for
eutrophication of the Ria Formosa through DPSIR and SAF. The objective includes
indicating the possibility that the same approaches could also be adapted anywhere in
the world for different water bodies. DPSIR approach was used to identify the Drivers,
Pressures, State, Impact and Responses as well as environmental indicators in the Ria
Formosa. Agriculture and Livestock, Aquaculture and Fishery, Tourism and
Urbanization were the major drivers. The pressure was nutrient enrichment. The State
revealed itself in considerable nutrient concentration, Macro algal growth, occurrence of
HAB in some parts of the lagoon and fluctuating oxygen concentration. The Ecological
impact was high clam mortality. The associated decrease in aquaculture products, job
loss and human intoxication due to HAB belong to Socio-economic impacts. Earlier
Responses include measures against nutrient loading and clam mortality. Additional
Responses have been recommended, mainly for reduction of nutrient loading. The four
steps of SAF were followed. The stakeholders were identified and the issue of
eutrophication was agreed on. Having defined the virtual system, the conceptual model
of the Ria Formosa was made. Consequently, the possibility of formulating the
conceptual model into a numerical model representing the ecological, social and
economic components of the system was discussed. The linking of the three
components in a simulation model and running the scenarios was, then, discussed. The
deliberation process among the stakeholders and policy makers, the scientific body as
facilitator is highlighted. The format by which the final output package is disseminated
is suggested. Thus, DPSIR and SAF can be used for the management of eutrophication
in any part of the world with the necessary modifications on the basis of resources and
system characteristics.
Key words: DPSIR, Eutrophication, Ria Formosa, SAF, SPICOSA.
MSc Thesis Sirak Robele Gari
viii
Table of Contents
Acknowledgement ........................................................................................................................ iv
Abbreviations .................................................................................................................................v
Resumo ......................................................................................................................................... vi
Abstract ........................................................................................................................................ vii
1. Introduction ........................................................................................................................... 1
1.1. Research question:……………………………………………………………………. 3
1.2. Objective:…………………………………………………………………………….. 3
1.2.1. Aims: ..................................................................................................................... 4
2. Literature Review .................................................................................................................. 5
2.1. Drivers-Pressure-State-Impact-Response (DPSIR)…………………………………... 5
2.1.1. Emergence and uses of DPSIR frame work. ......................................................... 5
2.1.2. DPSIR approach in Eutrophication management .................................................. 7
2.1.2.1. Drivers ........................................................................................................... 8
2.1.2.2. Pressures ........................................................................................................ 9
2.1.2.3. State ............................................................................................................... 9
2.1.2.4. Impact .......................................................................................................... 10
2.1.2.5. Responses .................................................................................................... 11
2.2. DPSIR in the context of the Ria Formosa…………………………………………... 11
2.3. Systems Approach Framework (SAF)……………………………………………… 12
2.3.1. Science and Policy Integration for Coastal Systems Assessment (SPICOSA) ... 12
2.3.2. Systems Approach ............................................................................................... 13
2.3.3. System Design (SD) ............................................................................................ 15
2.3.4. System Formulation (SF) .................................................................................... 16
2.3.5. System Appraisal (SA) ........................................................................................ 16
2.3.6. System Outputs (SO) ........................................................................................... 17
2.4. Eutrophication………………………………………………………………………. 18
2.4.1. What is eutrophication? ....................................................................................... 18
2.4.2. Consequences of eutrophication.......................................................................... 19
2.4.3. Eutrophication in the Ria Formosa...................................................................... 20
3. Materials and Methods ........................................................................................................ 22
3.1. Study area (The Ria Formosa)………………………………………………………. 22
3.1.1. Socio-economic activities ................................................................................... 25
3.1.2. Ecological/Environmental conditions ................................................................. 26
3.2. DPSIR……………………………………………………………………………….. 27

MSc Thesis Sirak Robele Gari
ix
3.3. SAF………………………………………………………………………………….. 27
4. Results ................................................................................................................................. 28
4.1. Driver-Pressure-State-Impact-Response (DPSIR)………………………………….. 28
4.1.1. Socio-Economic activities (Drivers) ................................................................... 28
4.1.1.1. Agriculture/Livestock ................................................................................. 30
4.1.1.2. Aquaculture/Fishery .................................................................................... 34
4.1.1.3. Tourism ....................................................................................................... 37
4.1.1.4. Urban Development .................................................................................... 41
4.1.2. Pressures .............................................................................................................. 46
4.1.3. State ..................................................................................................................... 50
4.1.4. Impact .................................................................................................................. 54
4.1.4.1. Ecological Impact ........................................................................................ 54
4.1.4.2. Socio-economic impact ............................................................................... 55
4.1.5. Responses ............................................................................................................ 56
4.1.5.1. Earlier responses ......................................................................................... 56
4.1.5.2. Recommendations ....................................................................................... 58
4.1.5.2.1. Agriculture/Livestock .............................................................................. 58
4.1.5.2.2. Aquaculture, fishery and manufacturing/processing enterprises ......... 60
4.1.5.2.3. Tourism and Urbanization ...................................................................... 63
4.1.6. Environmental Indicators .................................................................................... 64
4.2. Systems Approach Framework (SAF)………………………………………………. 65
4.2.1. Rationale ............................................................................................................. 65
4.2.2. System Design ..................................................................................................... 66
4.2.2.1. Issue resolution ............................................................................................ 66
4.2.2.1.1. Stakeholder mapping ............................................................................... 66
4.2.2.1.2. Stakeholders ............................................................................................ 67
4.2.2.1.3. Roles and views of Stakeholders ............................................................. 68
4.2.2.1.4. Institutional map ..................................................................................... 69
4.2.2.1.5. Economic activities .................................................................................. 71
4.2.2.1.6. Policy issue .............................................................................................. 72
4.2.2.1.7. Scenarios.................................................................................................. 73
4.2.2.1.8. Indicators ................................................................................................. 74
4.2.2.2. System Definition ........................................................................................ 74
4.2.2.3. Conceptual model ........................................................................................ 75

MSc Thesis Sirak Robele Gari
x
4.2.2.4. Methods and Information requirement ........................................................ 78
4.2.2.5. Problem scaling ........................................................................................... 78
4.2.3. System formulation ............................................................................................. 79
4.2.4. System Appraisal ................................................................................................ 86
4.2.5. System Output ..................................................................................................... 89
4.2.5.1. Recapitulation ............................................................................................. 90
4.2.5.2. Presenting and Running Scenarios .............................................................. 91
4.2.5.3. Conducting deliberations ............................................................................ 91
5. Discussion ........................................................................................................................... 94
6. Conclusion .......................................................................................................................... 97
7. References ........................................................................................................................... 98

1. Introduction
The Driver-Pressure-State-Impact-Response (DPSIR) approach considers human
activities as an integral part of the ecosystem and brings together natural science, social
science and economics in one framework for adaptive management (Zaldivar et al.,
2008). Social and economic developments (Drivers) create a set of Pressures on the
environment which produces the State change of the environment with the consequent
Impacts affecting human uses; this necessitates Response on the part of the society
(Aubry and Elliot, 2006).
Systems Approach Framework (SAF) is a protocol adopted by the Science and Policy
Integration for Coastal Systems Assessment (SPICOSA) project. SAF will be used to
explore the dynamics of Coastal-Zone Systems and potential consequences of
alternative policy scenarios (SPICOSA-DoW, 2009). This approach encompasses the
ecological, social and economic components of the coastal zones. SAF, having several
steps, ends up by producing outputs that will be communicated to the stakeholders and
policy makers. This is in accordance with the objective of SPICOSA to establish a
permanent dialogue between scientists and stakeholders (SPICOSA-DoW, 2009). True
to the principles of adaptive management, interaction between science and policy
creates results in an ever evolving improvement policies for integrated coastal zone
management.
These methods can be applied to finding management options for eutrophication. The
State of eutrophication of coastal waters produced by Pressure driven by socio-
economic activities such as agriculture, aquaculture and fishery, tourism and

MSc Thesis Sirak Robele Gari
2
urbanization with the consequent Impact of water quality deterioration can fit in the
DPSIR frame work. The Responses are adoption of solution-seeking policies.
Similarly the SAF approach, making use of its four major steps of System Design,
System Formulation, System Appraisal and System Output serves as a useful tool to
provide policy makers with alternative policy options for the management of
eutrophication.
DPSIR and SAF have common features regarding Drivers and Pressures. With regard to
eutrophication, for example, both methods identify them as socio-economic activities
and nutrient-loading respectively. However, they have their differences.SAF has several
more steps in which the virtual system is defined, stakeholders are mapped and issues
are resolved in an iterative manner. The Responses in the DPSIR framework assume the
form of recommendations to the policymakers for implementation. But SAF simulates
different management scenarios and demonstrate to policy makers what would occur if
these management options were taken. Presupposing what kind of policy decision to
take is not its objective (SPICOSA-WP3, 2007).
The aim of the present study is to apply DPSIR and SAF for the management of
eutrophication in the Ria Formosa. The Ria Formosa is a coastal barrier lagoon (55X6 km)
in Southern Portugal (Mudge et al., 1998). The ecosystem receives fresh water inputs, rich
in organic and mineral nutrients derived from urban, agricultural and industrial effluents
and domestic sewage and is subject to strong anthropogenic pressures due to tourism and
shellfish/fish farming (Pereira & Duarte, 2006). According to Newton et al., (2003) there
are a number of pressure-producing drivers on the Ria Formosa including urbanization,
intensive agriculture, fishing and aquaculture. There is evidence of some undesirable
changes occurring in the lagoon system, such as a declining bivalve harvest, attributed to

MSc Thesis Sirak Robele Gari
3
the deterioration in water quality, although a direct link has still to be conclusively
established (Newton et al., 2003).
The assessment based on the European Environmental Agency criteria of nutrient
concentrations indicated that the situation in the lagoon is ―poor‖ to ―bad‖; in contrast,
the USA National Eutrophication Estuarine Assessment, based on symptoms, such as
high chlorophyll and low oxygen saturation, indicated that the lagoon is near pristine
(Newton & Icely, 2006). Using simple screening model Newton and Icely (2006)
showed that the nutrient input in the Ria Formosa is high but the large tidal exchange
flushes most of the system daily, resulting in relatively low chlorophyll-a concentration.
Filter feeders are also considered to check on phytoplankton (Ferreira et al., 2009). On
the other hand; Mudge et al., (2007) indicated that the inner lagoons may not be
effectively flushed as the highest residence time calculated was 7 days.
Application of the two methods is considered to be a useful exercise to manage
eutrophication not only in the Ria Formosa but also elsewhere.
1.1. Research question:
The research question is: can DPSIR and SAF be used to manage eutrophication in
the Ria Formosa?
1.2. Objective:
The objective of the present study is to find management options for the
eutrophication of the Ria Formosa lagoon using the DPSIR and SAF approaches. By
doing this, an attempt will be made to indicate that these approaches may be
employed anywhere with the necessary modifications depending on resources and
system characteristics.

MSc Thesis Sirak Robele Gari
4
1.2.1. Aims:
Description of the various socio-economic drivers leading to
eutrophication.
Description of pressures related to the identified drivers.
Description of ecological, economic and social impacts resulting from
State change.
Recommendation of appropriate Responses.
Identification of various environmental indicators of Pressures and State.
Identification of Stakeholders relevant to eutrophication.
Definition of the virtual system.
Demonstrating the steps of SAF for eutrophication management in the
Ria Formosa.

MSc Thesis Sirak Robele Gari
5
2. Literature Review
2.1. Drivers-Pressure-State-Impact-Response (DPSIR)
2.1.1. Emergence and uses of DPSIR frame work.
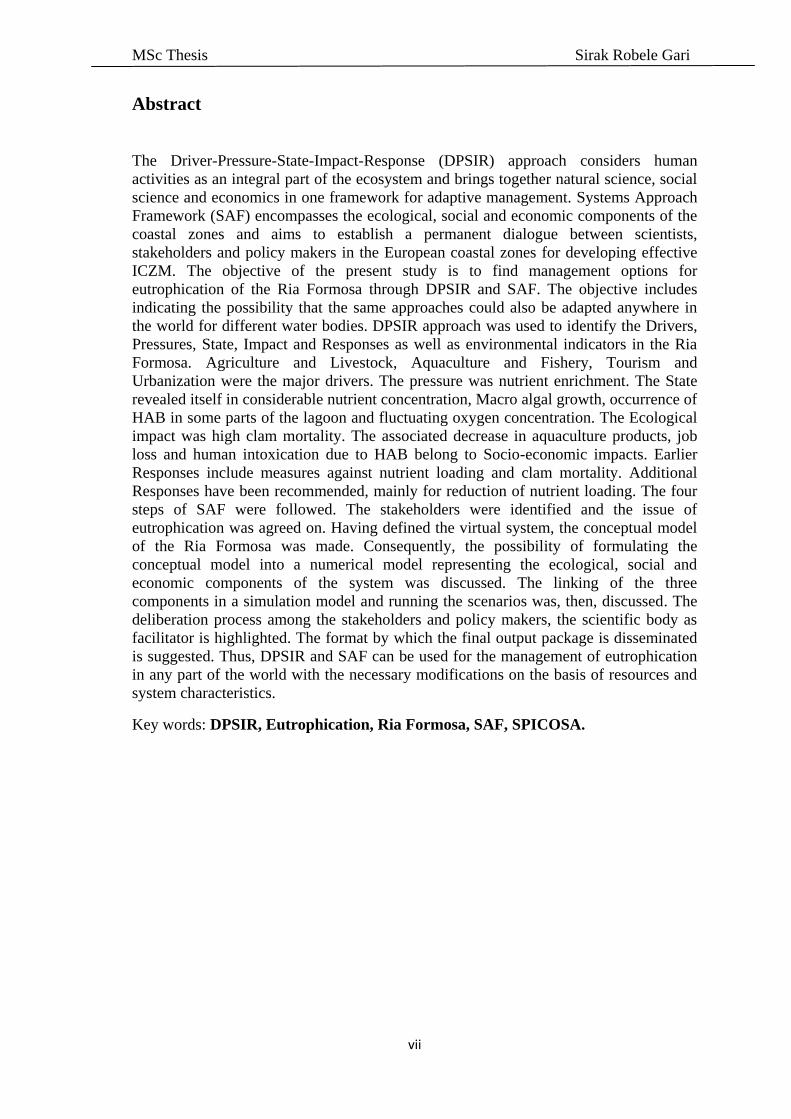
Several authors (e.g. Klotz, 2007, Svarstad et al., 2008) consider the works of Statistics
Canada, which developed Stress-Response (S-R) framework in 1979, as the pioneer of
the PSR and subsequently the DPSIR frameworks (Fig. 2-1). OECD employed the PSR
framework for the evaluation of environmental performance, eutrophication among
others, using the core set of selected indicators (OECD, 1993). DPSIR was first
elaborated in the EEA-sponsored Dobris Assessment of Europe’s environment (Air,
Water, and Soil) and adopted an environmental programme in Europe (EEA, 1995).
Therefore, this approach can be employed for assessment of different aspects of both
the aquatic and terrestrial ecosystems. For example, it has been used: for evaluation of
development and sustainability in coastal areas (Bidone et al., 2003); in Water Frame
Work Directive for protection of ground water, inland surface waters, estuaries and
coastal waters (Borja et al., 2006); for the risks in biodiversity (Maxim et al., 2009); and
for assessment of impacts of development activities on environment and society. Two
features that contributed to its wide use are; first it structures the indicators with
reference to the political objectives related to the environmental problem addressed; and
second, it focuses on supposed causal relationships in a clear way that appeals to policy
actors (Smeets & Wetterings, 1999).
The DPSIR framework allows the description of environmental problems by defining
the relationships between anthropogenic activities and the environment (Pacheco et al.,

MSc Thesis Sirak Robele Gari
6
2007). The framework provides a better context in which to integrate different types of
indicators, enabling the possibility of taking into account not only environmental but
also socio-economic impacts that result from changes in the state of coastal systems (
WR,2002, Cited in: Pacheco et al., 2007).
Figure 2-1: DPSIR framework (Smeets & Weterings, 1999).
OECD (1993) explains that using indicators to represent the elements of the chain
simplifies the information conveyed to broad groups of stakeholders and the general
public, providing clear messages, thus enhancing the transparency of decision-making.
Indicators can also be used to assess the effectiveness of the actions and policies
implemented, by measuring progress towards environmental targets (OECD, 1993).
As DPSIR might be poorly understood by decision makers, it should be used without
obviously refering to the term. Despite the wide utilization of the framework, Carr et al.,
(2007) mention several critiques of DPSIR as stemming from misunderstanding of its
purpose: First, it creates a set of stable indicators that serve as a basis for analysis, not

MSc Thesis Sirak Robele Gari
7
taking into account the changing dynamics of the system; second it does not capture
trends except by repeating the study of the same indicators at a regular intervals; third,
DPSIR does not illustrate clear cause-effect relations for environmental problems; and
finally it suggests linear unidirectional causal chains in the context of complex
environmental problems. Carr et al., (2007), however have critiques of their own
regarding the flaws in DPSIR. They argue that the framework implicitly creates a
hierarchy and privileges. The Response component starts with national governments
and international organizations followed by environment ministries and NGOs as the
privileged actors that are considered capable of influencing Drivers, Pressures and the
State. This undermines the role played by the local Response that can influence not only
the impacts but also the pressures and even the drivers. Moreover, although the didactic
clarity is appealing, the apparent simplicity can be misguiding, ignoring the possible
synergistic relations existing between the DPSIR components: for example a specific
Impact can be caused by several State conditions and by Responses to other Impacts
(Maxim et al., 2009). Svarstad et al., (2008) criticize the DPSIR framework for its
shortcomings in establishing good communication between researchers, on the one
hand, and stakeholders and policy makers on the other. They further argue that it lacks
efforts to find a satisfactory way of dealing with the multiplicity of attitudes and
definitions of issues by stakeholders and the general public.
2.1.2. DPSIR approach in Eutrophication management
The DPSIR approach with the necessary adaptations to specific cases can be used for
assessment of the eutrophication water bodies. In the process, the socio economic
drivers, the pressures that produce the state change in the aquatic environments, the
socio-economic and ecological impacts felt both by the society and the ecosystem can
be identified. Appropriate policy Responses can, then be envisaged, formulated and
MSc Thesis Sirak Robele Gari
8
implemented. For example, in conjunction with other methods of quantification of
nutrient loads and concentrations, appropriate management options for reducing the
input can be recommended through DPSIR.
DPSIR links causes of environmental change to influences that trigger societal
Responses. For instance, Aliaume et al., (2007) describe the causal relations in
eutrophication as follows: Economic Drivers, such as for example, agriculture generates
Pressure like nutrient emission that ultimately changes the environmental State resulting
in hypoxia (oxygen deficit) and anoxia (oxygen loss) which in turn cause loss of habitat
and biodiversity. Such environmental changes will consequently have an impact on
human activities and welfare, for example through losses of aquaculture productivity, or
health impacts on coastal populations. As a Response, this instigates the government
institutions to take suitable measures in order to reduce Pressures, to ameliorate the
environmental state and hence to reduce Impacts on human populations and activities.
2.1.2.1. Drivers
Borja et al., (2006) described Driving Forces as the economic and social policies of
governments, and economic and social goals of those involved in industry. On the other
hand, MEA (2003) defines Drivers as being not only anthropogenic, but also natural.
Both ways, Drivers are those components triggering Pressures on the system.
Changes in life style produce Drivers such as increased urbanization of coastal areas for
permanent residency and tourism (Zaldivar et al., 2008). Zaldivar et al., (2008) further
state that tourist development, aquaculture and golf are examples of newly created
drivers and the latter, in its use of fertilizers, is similar to intensive agriculture. Zaldivar
et al., (2008) further states that tourist development, aquaculture and golf are examples
of newly created Drivers and the latter, in its use of fertilizers, is similar to intensive
MSc Thesis Sirak Robele Gari
9
agriculture. Changes in land use have also created additional new Drivers such as land
clearing, reclamation of wetlands, and damming (Zaldivar et al., 2008). According to
the same authors, port development and shipping activities which might be stimulated
by marine policy belong to yet another set of Drivers.
2.1.2.2. Pressures
Pressures are the ways Drivers are actually expressed, and the specific ways that ecosystems
and their components are perturbed (Borja et al., 2006). Similarly, Pressures are
anthropogenic factors inducing environmental changes which are usually unwanted and
seen as negative (Maxim et al., 2009).
Pressures arising from the above mentioned Drivers are mainly high nutrient load.
Nutrients originate in agricultural runoff, domestic sewage, detergents and animal
manures. Loss of riparian vegetation and loss of dentrification capacity are Pressures
resulting from changes in land use including port development and shipping activities
(Zaldivar et al., 2008). Further, the latter activities additionally create high release of N
and P, as well as changes in the residence and flushing times of the water bodies.
According to Zaldivar et al., (2008) fish aquaculture practiced in ponds, reclaimed from
a wetland, produces a Pressure from dentrification loss. Moreover, the same authors
explain that the sterilization of the ponds with bleach followed by neutralization with
thiosulfate disrupts the biogeochemical cycle leading to a disturbance in nutrient cycle.
The fish food and excreta are other factors leading to high input of organic matter.
2.1.2.3. State
State is the condition of the environment which is not static but that reflects the current
environmental trends (Carr et al., 2007). The change in State is a result of Pressures.

MSc Thesis Sirak Robele Gari
10
The State of a system can be measured making use of quantifiable environmental
indicators. For example; eutrophication which is the expected consequence of the
Pressures is quantified through chlorophyll-a measurement and phytoplankton cell
count. Moreover the concentration of nutrients and the level of oxygen in the system are
State metrics that indicate the eutrophication status of the system.
For instance, Scavia and Bricker (2006) have used six indicators to determine the
various stages of eutrophicaton: Chlorophyll-a, epiphytes and macro algae for detection
of primary symptoms; Dissolved oxygen (DO), loss of submerged aquatic vegetation
and occurrence of harmful algal blooms for detection of secondary or well-developed
eutrophication.
2.1.2.4. Impact
Impacts are the effects produced on the ecosystem and the society as a result of a
change in the State of the system. They have various forms and sizes depending on the
nature and extent of the State change. Deterioration of water quality for drinking and
bathing purposes produce economic Impacts. These economic Impacts are produced
because the former necessitates construction of expensive water treatment plants and the
latter may undermine touristic revenues due to poor quality bathing water. The
occurrence of toxic algal blooms produces ecological Impact of loss of biodiversity. A
decrease in transparency of water and low oxygen availability likewise, create Impacts
of low productivity and demise of aquatic organisms. The effect on public health due to
algal blooms and loss of jobs resulting from collapse of fishery serve as examples of
social Impacts.

MSc Thesis Sirak Robele Gari
11
2.1.2.5. Responses
Responses are actions by the society to mitigate or remove the unwanted results
produced initially by the Drivers. As figure 2-1 indicates, the Responses could be to all
four components of the system or restricted to only one of them. The Responses are
usually expressed as policy reactions made by government or international institutions.
However, as some critics of DPSIR indicated (Carr et al., 2007), locally manifested
individual and group Responses at different levels of the system are possible.
The common Responses with respect to eutrophication are reduction of nutrient load
into water bodies, construction of Urban Waste Water Treatment Plants (UWWTPs)
and connecting households to sewer systems. Policy Responses to reduce the pressure
of pollutant load include economic instruments (polluters pay principle) and drafting
policy (e.g. European Nitrate Directive).
2.2. DPSIR in the context of the Ria Formosa.
There are many conflicting interests over management such as fishing, aquaculture,
tourism, salt production, harbor activities, urban development and conservation
(Cristina et al., 2008). Cristina et al., (2008) further explain that several institutions ,for
example, the natural park authority, municipalities and the Portuguese navy are
stakeholders involved in the decision making process concerning the area. Therefore in
such a complex system, DPSIR provides the means to manage the coastal ecosystem by
analyzing cause-effect relationships and recommending the required policy Responses.
Though there are a number of issues to be addressed as highlighted above, the issue of
Eutrophication was chosen to serve as an example of using the DPSIR framework. The

MSc Thesis Sirak Robele Gari
12
deliberative process of choosing an issue was not followed due to the time constraints of
the present study.
The Drivers identified in the Ria Formosa relevant to eutrophication, are socio-
economic activities producing the Pressures of high nutrient and pollutant input into the
lagoon. This has created a State change with respect to nutrient concentration,
macroalgal growth and oxygen fluctuation; all symptoms of eutrophication. The
resulting Impacts are, then, exemplified by deterioration of water quality, bivalve
mortality and negative economic and health effects on the communities. Using
environmental quality indicators like the level of oxygen and chlorophyll-a, the degree
of State change can be quantified. Once the chain reaction of causes and effects up to
the Impact stage is identified the next step would be finding Responses to mitigate the
Impact by reacting to any one of the components. Thus, through DPSIR scheme
different policy Responses can be recommended for management of eutrophication in
the Ria Formosa.
2.3. Systems Approach Framework (SAF)
2.3.1. Science and Policy Integration for Coastal Systems Assessment
(SPICOSA)
SPICOSA is a project developed under the European Sixth Framework Programme
Priority. Its objectives are briefly described as follows in SPICOSA-DoW,(2009) : The
overall objective of SPICOSA is to develop a self-evolving, holistic research approach
for integrated assessment of Coastal Systems so that the best available scientific
knowledge can be mobilized to support deliberative and decision-making processes
aimed at improving the sustainability of Coastal Systems by implementing Integrated
Coastal Zone Management (ICZM) policies. Based on a systems approach, a

MSc Thesis Sirak Robele Gari
13
multidisciplinary assessment framework will be developed with a balanced
consideration of the Ecological, Social and Economic sectors (ESE) of Coastal Systems.
The SAF and its tools will be implemented in eighteen coastal Study Site Applications,
which range from Norway to Portugal to Turkey and to Romania.
Achieving this objective will require a restructuring of the science and methodology
needed to understand and to quantify the response of the coastal ecosystems, together
with their consequences to their social and economic services, when these ecosystems
are subjected to changing environmental and anthropogenic conditions (SPICOSA-
DoW, 2009).
2.3.2. Systems Approach
The Greek word Synistanai meaning to bring together or combine is the basis for the term
System. A system is not confined only to the physical world but also belongs to the
human society and has emergent properties, spatial and temporal boundaries as well as
an internal state, which can change in time as a response to internal dynamics or to
external influences (SPICOSA-WP3, 2007). It also has a hierarchy of levels of
organization in which emergent properties at one level contribute to relationships at a
higher-level. System may be closed or open. A closed system is one where interactions
occur only among the system components and not with the environment whereas an
open system is one that receives input from the environment and/or releases output to
the environment (Wallonick, 1993).
Choosing the framework of system approach is often considered as a powerful
procedure which allows combining multidisciplinary knowledge to describe complex
systems (SPICOSA-WP4, 2009). The systems approach integrates the analytic and the
synthetic method, encompassing both holism and reductionism (Heylighen, 1998).
MSc Thesis Sirak Robele Gari
14
Systems theory proposed by the biologist Ludwig von Bertalanffy is a reaction to
reductionism seen in physical sciences and an attempt to revive the unity of science; so
instead of reducing an entity to the properties of its parts, it focuses on the arrangement
of and relations between the parts which connect them into a whole (Heylighen, 1998).
The key features of physical and human systems can be abstracted into conceptual or
mathematical models, which can be used by humans to manage the real system for a
defined purpose, as the project SPICOSA is currently doing with the ecological and
social systems.
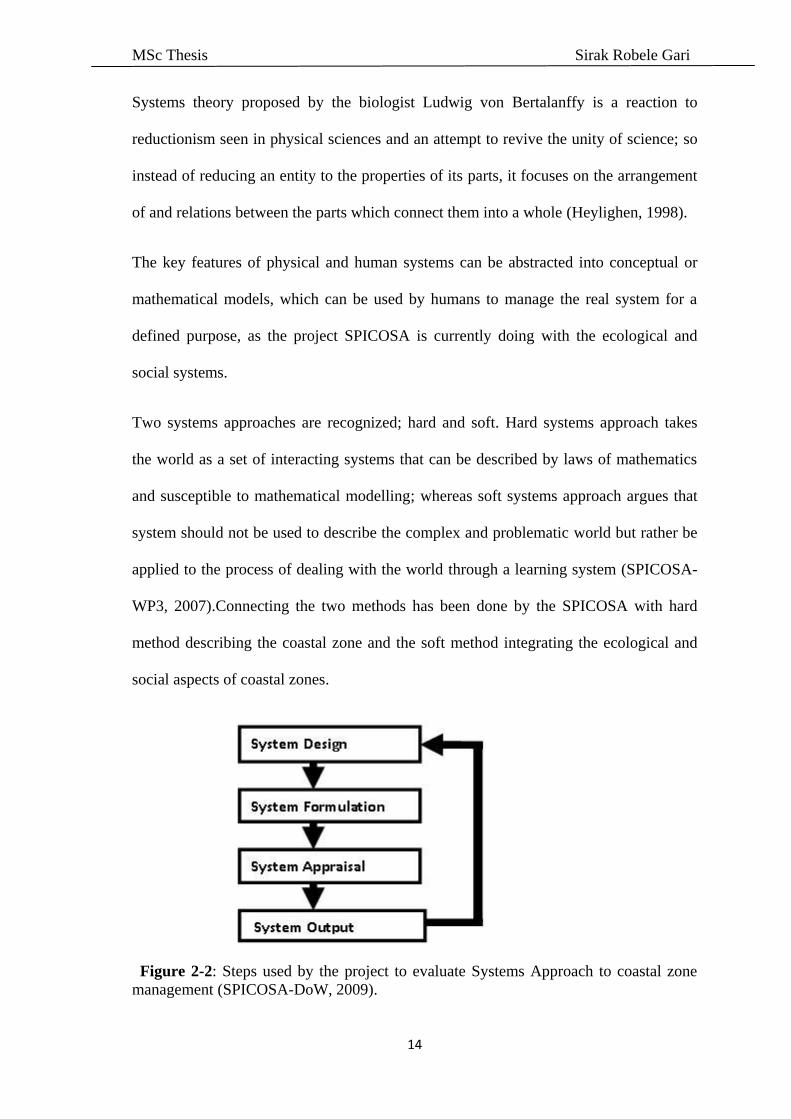
Two systems approaches are recognized; hard and soft. Hard systems approach takes
the world as a set of interacting systems that can be described by laws of mathematics
and susceptible to mathematical modelling; whereas soft systems approach argues that
system should not be used to describe the complex and problematic world but rather be
applied to the process of dealing with the world through a learning system (SPICOSA-
WP3, 2007).Connecting the two methods has been done by the SPICOSA with hard
method describing the coastal zone and the soft method integrating the ecological and
social aspects of coastal zones.
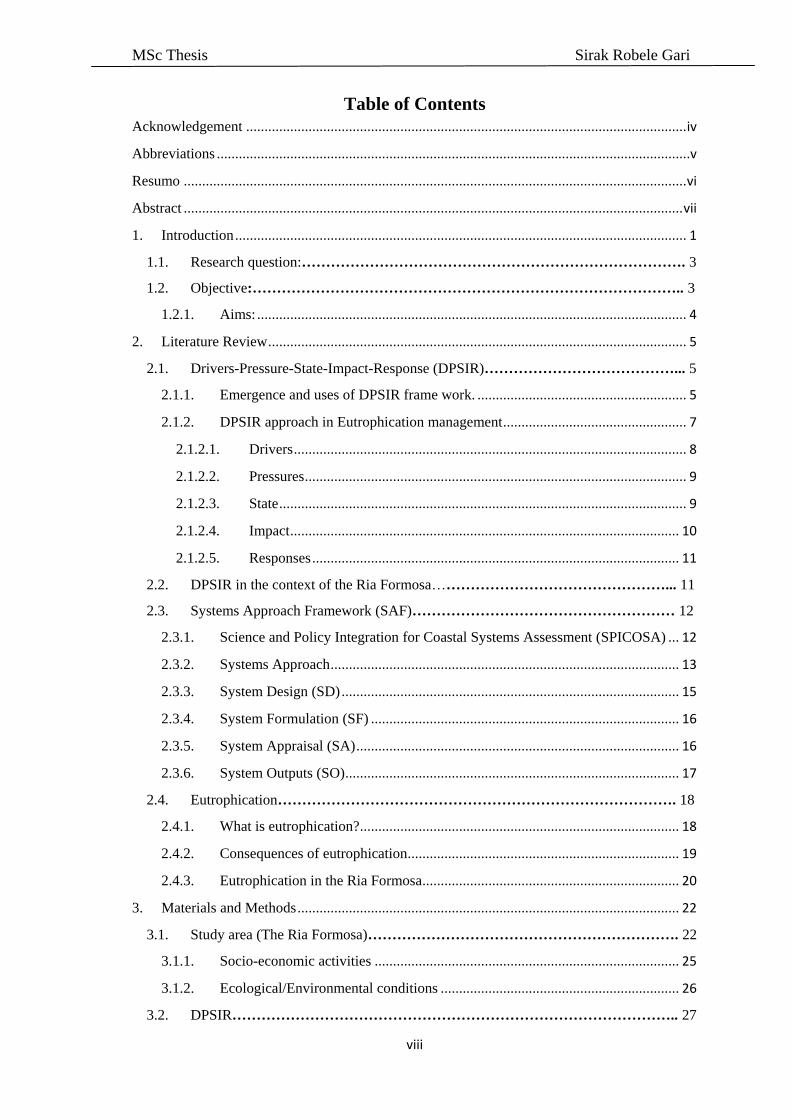
Figure 2-2: Steps used by the project to evaluate Systems Approach to coastal zone
management (SPICOSA-DoW, 2009).

MSc Thesis Sirak Robele Gari
15
2.3.3. System Design (SD)
SPICOSA-WP3 (2007) defines System Design as a the first step in Systems Approach
Framework which deals with the identification of an environmental problem in the
coastal zone, and the designing of a conceptual model to deal with this problem, taking
account of ecological, social and economic factors.
The process has several sub-tasks as enumerated below (SPICOSA-WP3, 2007):
Issue resolution: After identifying the key stakeholders and relevant economic
activities, a particular issue is chosen to address at the study site. Then
objectives are set by which the resolution of this Issue and the successful
management of the system relevant to this Issue can be assessed.
System definition: Following the identification of the scale and extent of things
affected by the issue, system boundaries are defined. Key relevant ecosystem
features within and at the boundaries, and the key social and political features
relevant to the issue are identified.
Conceptual model: A conceptual model of the System is constructed in relation
to the issue, showing the relationships between the main ecosystem, social and
economic components identified in the previous step.
Acquiring the existing relevant data and provision to other data requirements, and
problem scaling are the last two sub-tasks. The latter involves checking the
feasibility, on the basis of resources, of the system description. It is recommended to
reconceptualise and simplify the system if necessary.
MSc Thesis Sirak Robele Gari
16
2.3.4. System Formulation (SF)
The System formulation (SF) step involves in systematically organizing, quantifying
and analysing the Virtual System (VS) as needed to implement the Policy Issues.
Essentially, the SF step defines how to represent the functionality of the VS for
simulation/interpretation by selecting the most relevant inputs, processes, and internal
interactions and by assembling these into functional components that can be
independently modelled and calibrated (SPICOSA-WP4, 2009).
System formulation step receives three important outputs from the System design step.
They are: definition of the virtual system, information on how and what to be
quantified and the type of input needed to evaluate the virtual system (SPICOSA-WP4,
2009).
In system formulation step, Environmental,Social and Economic (ESE) models are
constructed using various symbols, feedback loops and stock/flow diagrams. The
formulation of the model is explained with existing examples which illustrate the
modelling strategy .Various modeling software (STELLA, EXTEND) are chosen. The
overall aim of this step, then, is to give methodological guidelines in qualitative and
quantitative assessment of VS in each SSA.
2.3.5. System Appraisal (SA)
The System Appraisal (SA) step explains how to carry out the simulation and validation
of a system model including ecological, economic and sociological components, and
how to interpret the results of the model concerning the Coastal Zone Response to
selected Policy Issues (SPICOSA-WP5, 2009)

MSc Thesis Sirak Robele Gari
17
Using as a basis the assessment methodologies such as ecological ,social and economic
(ESE) assessment plans and information about the input data obtained from the
formulation step, SA step runs the simulation model and conducts the interpretative
analysis relative to the policy issues; thereby providing scientific and descriptive
supplements to the model outputs (SPICOSA-WP5, 2009).
2.3.6. System Output (SO)
In the System Output step the results that have been received out of the SA step will be
shown to the stakeholders / policy makers / decision makers who have initially decided
upon the policy issue to be inserted into the SAF. In stakeholders’ forum, results
produced in the prior steps will be presented; findings will be explained with plain
language for non-scientists with the objectives of deliberating with the stakeholders
(SPICOSA- WP6, 2009).
SPICOSA-WP6 (2009) further states that it will be crucial that the Output Step
recapitulates the SAF process for transparency when holding the science-policy
consultations. This will include explanations about uncertainties (general and about
individual scenarios and their assumptions), about long term benefits, tradeoffs, data
gaps etc. Moreover, the Output Step will give suggestions on how to prepare the
science-policy consultations, what needs to be considered when approaching the bigger
stakeholder audience and what presentation formats can be used.

MSc Thesis Sirak Robele Gari
18
2.4. Eutrophication
2.4.1. What is eutrophication?
From the time eutrophication has been recognized as an undesirable phenomenon in
water bodies, a number of definitions have been suggested. It has been defined as a
process, a trophic state and an effect of increased nutrient input on a water body. Some
have divided eutrophication into two categories- natural and cultural (Anthropogenic).
Thus, stimulation of algal growth through enrichment of waters by nutrients
(Richardson, 1989), accumulation of carbon (Rabalais et al, 2009), increase in the
supply of organic matter (Nixon, 1995), the accelerated production of organic matter,
particularly algae, in a water body (Bricker et al., 2003), enhanced primary production
due to human-induced excess supply of nutrients (EEA, 2001) are some examples of the
various definitions given to eutrophication.
The Council of the European Communities in its Urban Waste Water Directive (1991)
defines Eutrophication as the enrichment of water by nutrients, especially compounds of
nitrogen and/or phosphorus, causing an accelerated growth of algae and higher forms
of plant life to produce an undesirable disturbance to the balance of organisms present
in the water and to the quality of the water concerned.
Despite their differences, all agree on the excessive growth of algae caused by supply of
nutrients leading to the deterioration of water quality. So it leads to a conclusion that
eutrophication is a phenomenon (that persists as long as nutrient supply is present), of
excessive algal growth above the background level which results from increased supply
of nutrients and causes loss of water quality through oxygen depletion and decreased
water clarity.

MSc Thesis Sirak Robele Gari
19
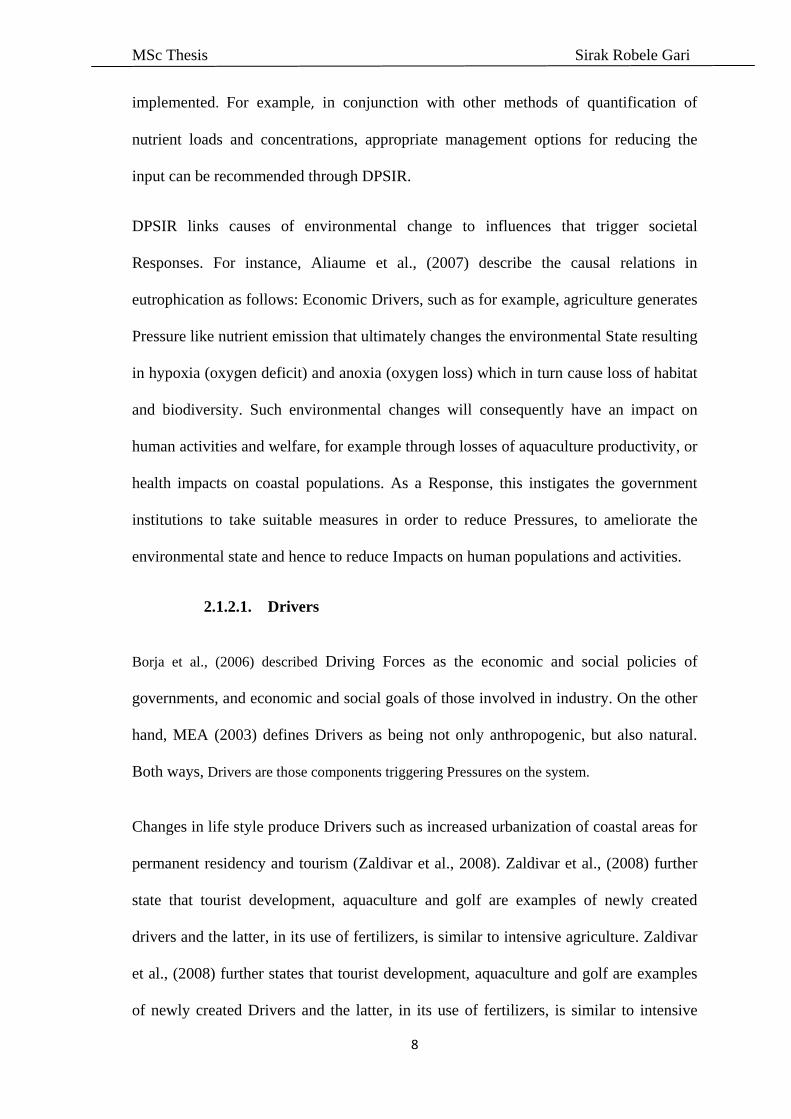
Figure 2-3: Algal bloom in area or restricted exchange.
2.4.2. Consequences of eutrophication
Eutrophication has been producing negative impacts both on the aquatic ecosystem and
the society. Its effects range from changes in the structure and function of the aquatic
ecosystem to socio-economic disruption as expressed by collapse of fisheries, decreased
tourism and bad human health. For example, Cloern (2001) states that benthic and
submerged vascular plants decline as a result of decreased transparency affecting the
availability of light, and other stressors such as enhanced epiphytic growth; moreover,
some species of algal blooms produce toxins that can impair the growth and
reproduction of invertebrates and can be lethal to fish and threats to human health. For
example, when fish with high concentration of these toxins are consumed, neurological
and gastrointestinal is poisoning may occure. While hypoxic and anoxic environments
have existed through geological time, their occurrence in shallow coastal and estuarine
areas appears to be increasing, most likely accelerated by human activities leading to
Photo: S.Mudge

MSc Thesis Sirak Robele Gari
20
loss of biodiversity through migration and death of species (Cloern, 2001).
Additionally, the impacts include alteration of food webs; degradation and loss of sea
grass beds, kelp beds and coral reefs (Scavia & Bricker, 2006) with the associated loss
of ecosystem goods and services.
2.4.3. Eutrophication in the Ria Formosa
Sewage and agriculture are the major sources of nutrients in the Ria Formosa with
nitrogen more enriched than phosphorous, and silicon concentration exceeds nitrogen in
winter and vice versa in summer (Newton, 1995; cited in Newton & Icely, 2006). Tett et
al., (2003) estimated dissolved available inorganic nitrogen (DAIN), dissolved available
inorganic phosphorous (DAIP), and dissolved silica (DSi) to be 38µM, 1.5 µM and 35
µM respectively. Nitrate and phosphate are imported from the adjoining coastal area to
the lagoon during the spring (>60%), and silicates are permanently exported out of it
(Falcão & Vale, 2003). Falcão and Vale (2003) further clarified while silicates at low
tide exceeded values at high tide throughout the year, nitrates and phosphates exhibited
a clear-cut seasonal variation at high spring tide, with maxima in the period of low
temperatures (early spring), indicative of their import from the adjacent coastal zone.
Moreover, nutrient dynamics exhibited spatial variations. Newton et al., (2003) showed
that the concentration of dissolved available inorganic nitrogen, phosphate and silicate
is much higher in the eastern lagoon where the population density is lower and the
proportion of agricultural land is greater than in the western lagoon, , probably
indicating the importance of agriculture than sewage. The particularly high
concentrations of nutrients in the eastern lagoon during winter months can be attributed,
in part to freshwater runoff (Newton et al., 2003). In addition to the coastal waters, the
MSc Thesis Sirak Robele Gari
21
sediment is a source of nutrients to the lagoon (Falcão & Vale, 2003, Newton & Icely,
2006).
It appears that the productivity of the lagoon checks on the abundance of nutrients in it.
For example, the lower nutrient values at low tide and the increase in chlorophyll a
(upto 2 μg g-1) point to a rapid biological consumption of the imported nutrients (Falcão
& Vale, 2003). Thus algal blooms in the lagoon periodically reduce nutrient availability
and inflowing coastal water becomes a nutrient source (Newton & Icely, 2006).
MSc Thesis Sirak Robele Gari
22
3. Materials and Methods
3.1. Study area (The Ria Formosa)
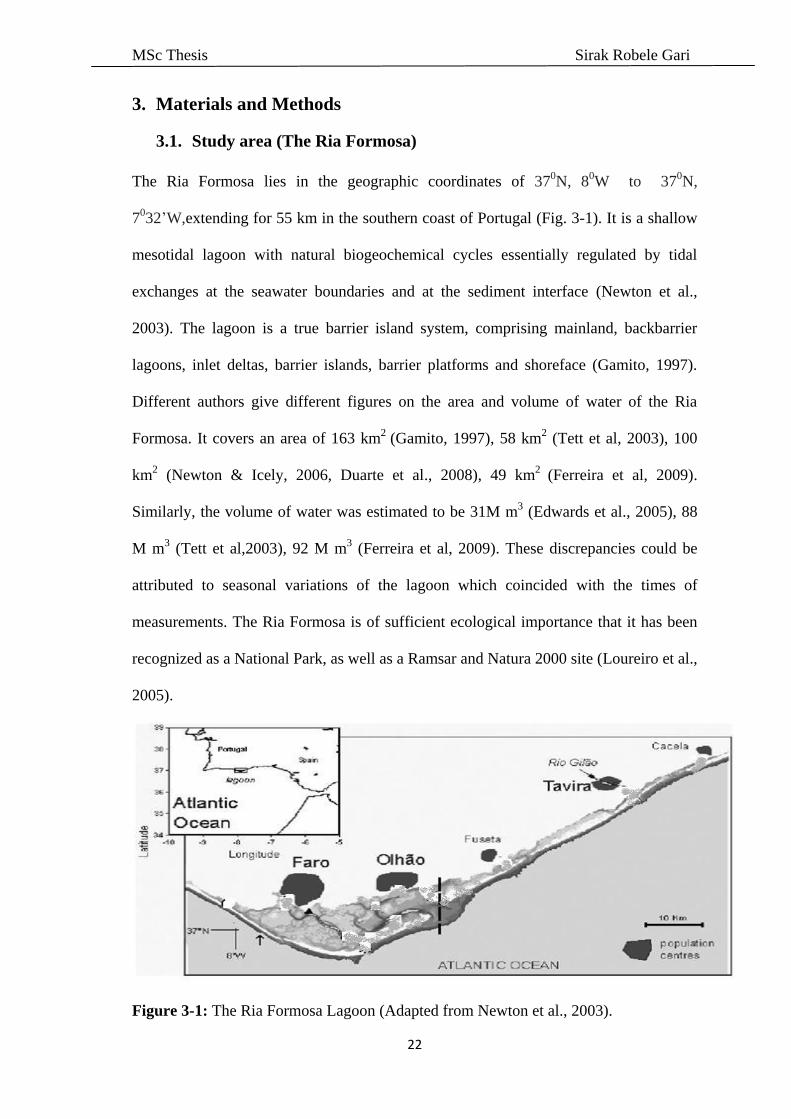
The Ria Formosa lies in the geographic coordinates of 370N, 8
0W to 37
0N,
7032’W,extending for 55 km in the southern coast of Portugal (Fig. 3-1). It is a shallow
mesotidal lagoon with natural biogeochemical cycles essentially regulated by tidal
exchanges at the seawater boundaries and at the sediment interface (Newton et al.,
2003). The lagoon is a true barrier island system, comprising mainland, backbarrier
lagoons, inlet deltas, barrier islands, barrier platforms and shoreface (Gamito, 1997).
Different authors give different figures on the area and volume of water of the Ria
Formosa. It covers an area of 163 km2
(Gamito, 1997), 58 km2 (Tett et al, 2003), 100
km2 (Newton & Icely, 2006, Duarte et al., 2008), 49 km
2 (Ferreira et al, 2009).
Similarly, the volume of water was estimated to be 31M m3 (Edwards et al., 2005), 88
M m3 (Tett et al,2003), 92 M m
3 (Ferreira et al, 2009). These discrepancies could be
attributed to seasonal variations of the lagoon which coincided with the times of
measurements. The Ria Formosa is of sufficient ecological importance that it has been
recognized as a National Park, as well as a Ramsar and Natura 2000 site (Loureiro et al.,
2005).
Figure 3-1: The Ria Formosa Lagoon (Adapted from Newton et al., 2003).

MSc Thesis Sirak Robele Gari
23
Newton and Mudge (2003) indicated that freshwater is supplied to the Ria Formosa by
five small rivers and 14 streams most of which dry out completely in summer; and the
mean annual rainfall in the basin is 634 mm and is often concentrated into only a few
winter days. It has an estimated volume of 88Mm3 of water with fresh water inflow of
0.22Mm3/d and a maximum and mean depth of 19m and 1.5m respectively (Tett et al.,
2003).The lagoon is characterized by semi-diurnal tidal regime with a tidal range of
1.35m at neap and 3m at spring tides respectively (Newton & Mudge,2003).
Consequently, there is an exchange of about 50-75% of the lagoon water with the ocean
each tidal cycle (Tett et al., 2003).
The water salinity can reach about 36.5 with temperature of 27OC (Newton & Mudge,
2003). The evaporation of water from the shallow inner regions coupled with the small
and seasonal freshwater input (negligible run off in summer) leads to greater salinities
in the lagoon compared to the external ocean waters (Mudge et al., 1998). The hot and
dry summer weather heats the water and increases its temperature (250C), evaporation
and salinity, whereas in the cooler winter the rainfall dilutes the lagoon with freshwater
so that the water temperature and salinity decrease (Newton and Mudge, 2003).
It has several inlets which showed variability through time. For example, Newton and
Mudge (2003) stated that there are seven inlets two of which are artificially
consolidated that allow exchanges of water with the Atlantic Ocean. The restriction of
the exchange of water to the seven inlets makes the lagoon a region of restricted
exchange (Newton and Mudge, 2003). The most recent work by Dias et al., (2009)
indicates that there are six tidal inlets, which restricts its exchange even more.
Sediment dynamics is an important environmental factor in aquatic ecosystem. It is
associated with the transparency of the water which affects the light penetration and

MSc Thesis Sirak Robele Gari
24
hence photosynthetic activity. Sediment is also associated with pollutant and nutrient
dynamics. For example, as salinity increases the nutrient adsorption on the sediment
decreases (Carrit and Goodgal 1954, cited; Murray et al., 2006) hence releasing
sediment-bound phosphorous (P) in to seawater ; therefore in estuaries or coastal
lagoons, where salinity is altered by fresh water inputs or high evaporation, the
proportion of sediment-bound P will change accordingly (Murray et al.,2006).
Furthermore, Murray et al., (2006) showed that in the Ria Formosa, sediment pore water
concentrations of nutrients exceeded seawater concentrations, and sediments were
sources of inorganic nutrients to the overlying seawater. Sediments contribute to the
preservation of coastal salt marshes. Fassetta et al., (2006) for instance, have indicated
that, the sedimentary balance of lagoon marshes was altered by human activities and
many marshes in the Ria Formosa do not receive sufficient sedimentary inputs to
support their growth.
The Ria Formosa is known to be a highly productive ecosystem. Its different habitats
support a rich diversity of flora and fauna (Newton & Mudge,2003).The lagoon has a
long tradition of bivalve farming, where 80% of Portugal’s mollusc fisheries is
harvested, especially R.deucussatus and other significant species like Ruditapes
romboids (Coelho et al., 2002). Beside the fact that many fish species are taken within
the lagoon, it is an important nursery for species caught in the surrounding coastal
waters (Newton & Mudge, 2005). As the Ria Formosa is a Ramsar and Natura 2000
site, it has an important population of water birds. Beach-nesting Charadrius
alexandrinus and Sterna albifrons as well as wintering waders and duck numbering as
high as 20,000 on a regular basis are notable examples (BI, 2009).The lagoon is
included in special birds protection area (Loureiro et al., 2006).
MSc Thesis Sirak Robele Gari
25
The combination of hydro-graphic factors and the nature of the substrates
(predominantly sand and clay) constitute ideal conditions for the development of
benthic communities (Austen et al., 1989: cited in Coelho et al., 2002). The
macrobenthic species are dominated by bivalves Abra segmentum, Cerastoderma spp
and Loripes lacteus, the gastropods Bittium reticulatum and Cerithium vulgatum, the
polychaetes Hediste diversicolor, Heteromastus filiformis and Streblospio spp, the
crustaceans Apseudes latreillii, Corophium spp, and Microdeutopus spp (Cristina et
al.,2008).
3.1.1. Socio-economic activities
The resident population around the Ria Formosa in the three population centres of Faro,
Olhão and Tavira was 124,000 in 2001(Duarte et al., 2006) with some increase
currently. According to Mudge and Bebiano (1997) the population increases three fold
in summer. The population centres along the barrier island system too, have extremely
variable annual population depending on the type of economic activity such as tourism,
fishing, commerce and shellfish farming (Duarte et al., 2006). The population dynamics
is strongly associated with the demand for waste water treatment.
Other economic activities in the Ria Formosa include salt extraction, sand mining and
intense agriculture. The shallow soft bottom of the lagoon provides a suitable habitat for
clams, which live in the mud (Cristina et al.,2008) and approximately 95% of the total
production of the clam Ruditapes decussatus originates in the Ria Formosa and involves
approximately 10 000 people (Chicharo et al., 2008). According to Ferreira et al.,
(2009) clam cultivation provides a yield of about 8000 tons of total fresh weight (TFW)
per year.

MSc Thesis Sirak Robele Gari
26
aosabordamare.blogs.sapo.pt/2009/02/01/
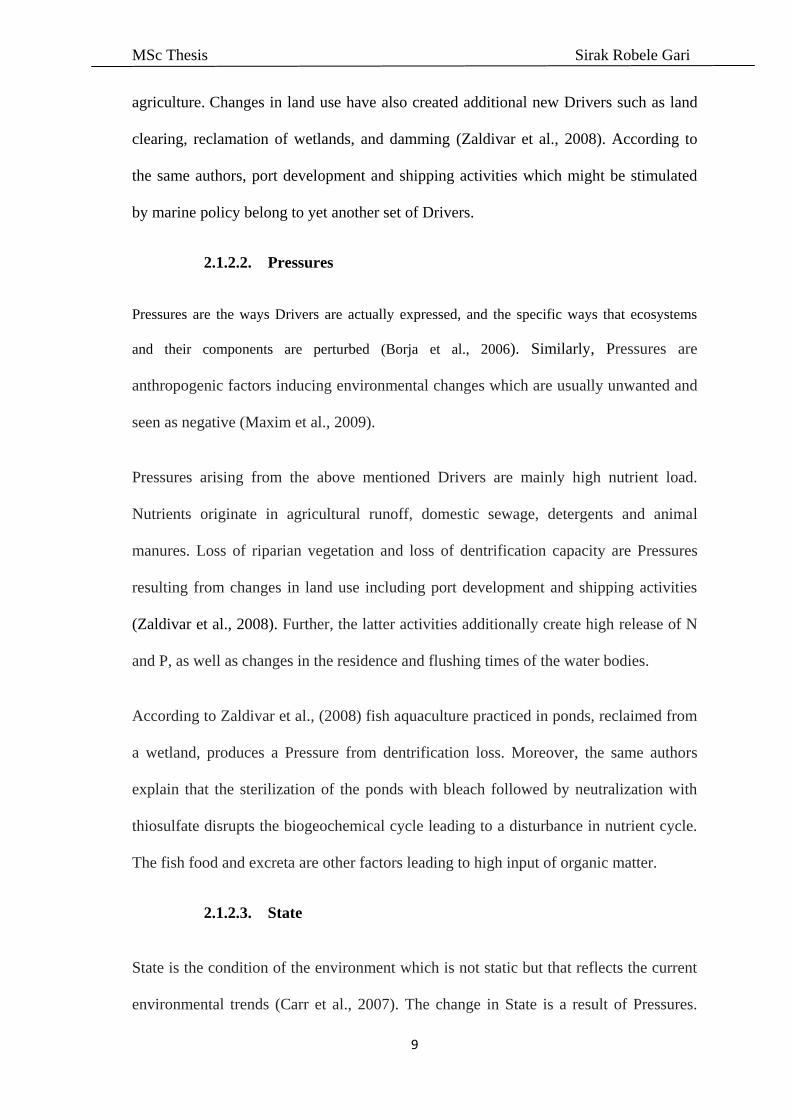
Figure 3-2: Economic activities in the Ria Formosa
3.1.2. Ecological/Environmental conditions
Several authors have indicated that a substantial load of anthropogenic material derived
from domestic sewage, agriculture and aquaculture enter directly into the lagoon,
causing eutrophication in the system. The consequent oxygen depletion then produces
ecological disturbances. For instance, Mudge et al., (2007) stated that due to direct
discharge of sewage in to the Ria Formosa, which has a longest residence time of up to
12 days, oxygen consumption rate at neap tide was found to be 18% per day .This may
have contributed to water quality deterioration in summer months, which caused clam
mortality.
Clam Aquaculture Agriculture
Traditional salt pans Tourism
Photo: B. Fragoso
Photo: S. Cristina
http://www.portugalvirtual.pt/_tourism/algarve/

MSc Thesis Sirak Robele Gari
27
Population pressure associated with tourism has contributed a great deal for
eutrophication in that it increased the load on UWWTPs. The population increase in the
summer tourist months makes domestic sewage an important source of ammonium and
phosphate particularly near the towns of Faro and Olhão (Newton & Mudge, 2005).
Similarly, the intensive farming in the hinterland of the lagoon with the use of
ammonium nitrate, urea and phosphate fertilisers (Newton & Mudge, 2005) carried in
the agricultural runoff is an important source of nutrients to the lagoon (Newton et al.,
2003). Urbanisation and several golf courses bordering the lagoon pose an ever
increasing stress upon the lagoon system (Cristina et al., 2008).
3.2. DPSIR
The DPSIR frame work was used to describe the Drivers, Pressures and Impacts that
produced a change in the State of the system. The major socio-economic activities
(Drivers), Pressures, State and Impacts in the Ria Formosa were described. Then the
appropriate policies Responses to one or more components of the framework were
suggested in the form of recommendations. Moreover various environmental
indicators were identified and listed.
3.3. SAF
The four steps of SAF, namely System design, System formulation, System appraisal
and System output were followed. In the first step, the major socio-economic activities
and stakeholders were identified. The policy issue of eutrophication in the Ria Formosa
was agreed upon. Scenarios were formulated and environmental indicators were chosen.
Then the conceptual model was constructed. The next three steps were discussed and
model components were demonstrated to show the possibility of using SAF for the
management of eutrophication.

MSc Thesis Sirak Robele Gari
28
4. Results
4.1. Driver-Pressure-State-Impact-Response (DPSIR)
4.1.1. Socio-Economic activities (Drivers)
For the definition of the driving-forces that lead to environmental pressures, it is
important to identify the corresponding major stakeholders too, their values and
interests, and also the possible conflicts between them. In the Ria Formosa, agricultural
and aquaculture farmers, fishermen, local inhabitants and tourists are identified as major
stakeholders on individual basis. Different government, educational and private
institutions associated with the socio-economic and research activities are the other
institutional stakeholders. Some examples are National Park authorities, Agriculture and
Fishery department, Port authorities, Real estate developers, Tourist operators and
resorts. Each stakeholder has its own world views sometimes in conflict with one
another.
As an example, the primary aim of the agricultural farmers is maximization of
production, which necessitates the use of fertilizers. Nutrients washed off to the water
body could produce excessive algal growth causing ecological degradation. This
degradation reveals itself in reduced water clarity, oxygen depletion, probable
occurrence of harmful algal blooms (HAB) and the consequent loss of biodiversity.
Fishermen will be affected as their catch is reduced. Tourist operators could, similarly,
be affected as tourists may not want to visit or bath in a water body with excessive algal
growth. The expansion of golf courses by tourist operators produces the same effect as
agriculture.
As a second example, the government has interests and responsibilities to upgrade the
overall living standards of the population. Among these, urbanization holds an
MSc Thesis Sirak Robele Gari
29
important place. Development of infrastructure with tons of sediments from
construction sites, increased sewage, both treated and untreated, contributes its share to
the deterioration of the aquatic ecosystem. The resulting eutrophication produces
ecological, economical and social negative consequences leading to a web of conflicts
among the stake holders. While ecological consequences are obvious, the economic
losses are expressed as increased cost for construction of urban waste water treatment
plants by governments (Nobre, 2009), loss of income by the fishermen and loss of
revenue by the tourist operators. The social effects are loss of jobs (Zaldivar et al.,
2008), poor health and decreased productivity of the society.
These conflicting interests can be mitigated if the stakeholders find some common
platform for mediation and conflict resolution. For example, agricultural and
aquaculture farmers can cooperate so that both stakeholders come out as winners.
Cultured bivalves provide a means of top-down control of eutrophication symptoms
associated with excessive loading of nutrients to the coastal zone (Ferreira et al., 2009).
Ferreira et al., (2009) in their Farm Agricultural Resource Management (FARM) model
show that in the Ria Formosa, a net total of about 28.5 ton/y of nitrogen and 22.5 ton/y
of carbon as phytoplankton are removed from the water through filtration of algae and
detritus. These authors suggest that the shellfish aquaculture can sell nitrogen credits to
agriculture and finfish farming with the objective of offsetting nitrogen emissions, in
exactly the same way as is currently traded for carbon.
Agriculture/livestock, aquaculture/fishery, tourism and urbanization have been
identified as major socio-economic drivers in the Ria Formosa. These activities can be
managed well so that the human welfare is maximized while maintaining the
sustainability of coastal systems. This can be achieved by adopting Integrated Coastal

MSc Thesis Sirak Robele Gari
30
Zone Management that involves the relevant stakeholders and makes use of the best
available scientific knowledge for management.
4.1.1.1. Agriculture/Livestock
The Algarve has 68.5%, 1.7% and 29.8% of utilized agricultural areas in mountainous,
agriculturally less favoured and not less-favoured areas of Portugal respectively
(MADRP, 2007). The Ria Formosa lies in one of the not less-favoured areas (Fig.4-1).
The region has in the Natura 2000 area 23% of agriculture, 34% of forest, and 33.2% of
natural vegetation, which makes the Algarve contain 30% of heterogeneous agriculture
(MADRP, 2007). MADRP (2007) further elaborates that it contributed to the economy
of the country by absorbing about 4.1% of the economically active population in 2001.
Figure 4-1: Land use showing mountainous, less favoured and not less-favoured areas
for agriculture (MADRP, 2007).
Mountainous areas
Less favoured areas
Not less- favoured areas
Ria Formosa

MSc Thesis Sirak Robele Gari
31
The total utilized agricultural area in Algarve is 102,765 ha, out of which arable land
and permanent cultivation constitute 40,745 ha and 41,475 ha respectively: the rest is
composed of pastures (19,616 ha) and family plots (924 ha) (INE, 2007). 68.5%, 29.8%
and 1.7% of Algarve lies in mountainous, not less-favoured and less-favoured areas
respectively and corresponding proportion of farms (64.3%, 35.1% and 0.6%
respectively) are found in the three different categories of agricultural areas (MADRP,
2007).
Different kinds of cereals (wheat, maize, barley, oats etc..) ,potatoes , beans and fruits
(Orange, apple, pear, peach etc..), as well as apricots and olive are produced in Algarve
region (INE,2004). The intensive horticultural farms are especially important to the Ria
Formosa.
According to 2002 statistics, 224,515 metric tons of fertilizers excluding traditional
animal and plant manures are used in Portugal; this gives a per capita consumption of
19,965 metric tons per one million population and an average consumption per hectare
of about 84.3 Kg. (NM, 2002).
With a 30% of the region used for heterogeneous agriculture, Algarve use a
considerable amount of fertilizer. According to Newton and Mudge (2005) the
hinterland of the Ria Formosa is intensively farmed with the use of ammonium nitrate,
urea and phosphate fertilisers. The seasonal rainfall with the resulting agricultural
runoff during autumn rainy months contributes a particularly high input, and in spring
when rainfall occurs, additional load of fertilizer is drained into the lagoon after
springtime fertilizer applications (Newton & Mudge, 2005).
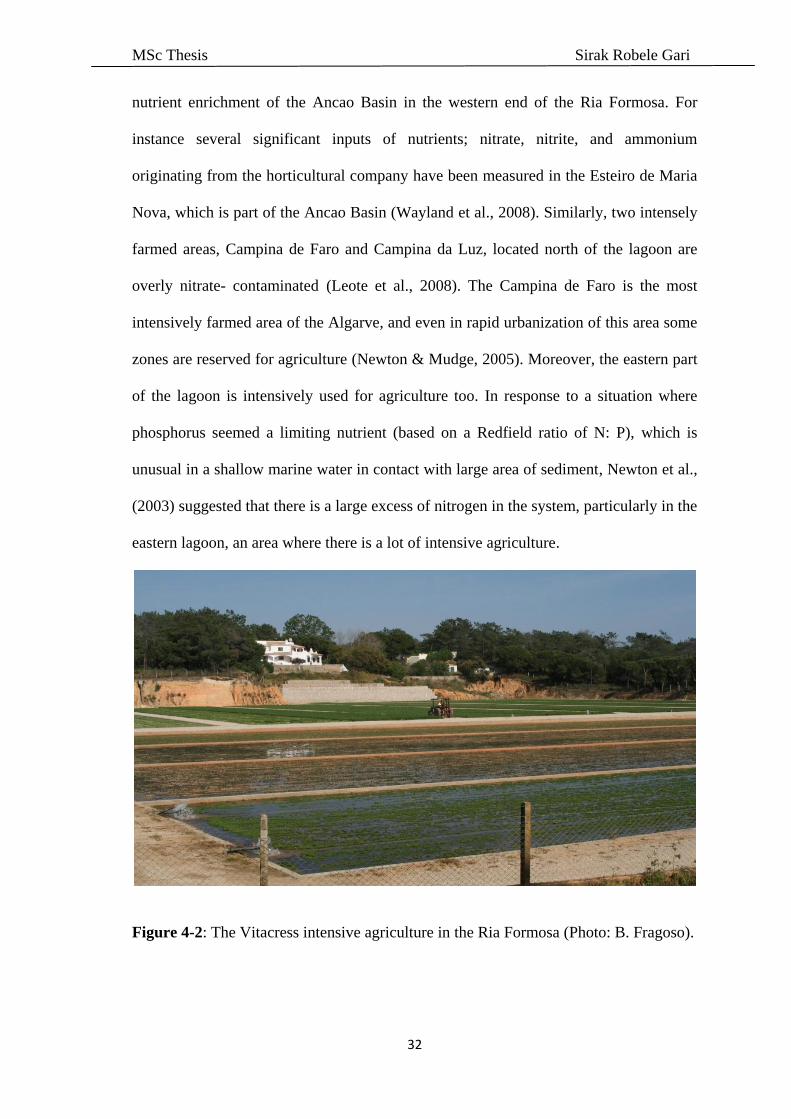
The Ria Formosa catchment, as it is in agriculturally favoured area of the Algarve has
an important agricultural component. Horticultured farms (Fig 4-2) contribute to the
MSc Thesis Sirak Robele Gari
32
nutrient enrichment of the Ancao Basin in the western end of the Ria Formosa. For
instance several significant inputs of nutrients; nitrate, nitrite, and ammonium
originating from the horticultural company have been measured in the Esteiro de Maria
Nova, which is part of the Ancao Basin (Wayland et al., 2008). Similarly, two intensely
farmed areas, Campina de Faro and Campina da Luz, located north of the lagoon are
overly nitrate- contaminated (Leote et al., 2008). The Campina de Faro is the most
intensively farmed area of the Algarve, and even in rapid urbanization of this area some
zones are reserved for agriculture (Newton & Mudge, 2005). Moreover, the eastern part
of the lagoon is intensively used for agriculture too. In response to a situation where
phosphorus seemed a limiting nutrient (based on a Redfield ratio of N: P), which is
unusual in a shallow marine water in contact with large area of sediment, Newton et al.,
(2003) suggested that there is a large excess of nitrogen in the system, particularly in the
eastern lagoon, an area where there is a lot of intensive agriculture.
Figure 4-2: The Vitacress intensive agriculture in the Ria Formosa (Photo: B. Fragoso).

MSc Thesis Sirak Robele Gari
33
Irrigation of four golf courses , namely, Quinta do Lago, Quinta do Lago- Ria Formosa,
Quinta do Lago-Sao Lorenz and Quinta do Lago-Pinheiros Altos was planned using a
desalinized sea water and the desalinization unit located in Loulé municipality was
expected to start in 2006 (Koundri et al., 2006). Golf courses are considered equivalent
to intensive agriculture. A significant amount of phosphate enrichment of the the Ria
Formosa lagoon is associated with the golf complex (Wayland et al., 2008).
Figure 4-3: Quinta do Lago Golf course (http://premier-direct.com/riafmosa.htm)
Portugal’s share of cattle, pigs and sheep (and goats) in the European Union is 10.2% ,
8.4% 2.3% respectively (MADRP, 2007). In year 2007, 1,924,660 metric tons of cow
milk ,96154 metric tons of sheep milk and 119,119 metric tons of hen’s eggs have been
produced (FAOSTAT,2007). Livestock rearing is an important agricultural activity in
Algarve. There were about 10,000 heads of cattle, 73,000 heads of sheep, 21,000 heads
of goats and 54,000 heads of pigs (MADRP, 2007). However, according to MADRP
(2007), the livestock density index has decreased by half from 0.4 in 1999 to 0.2 in
2005. The consequent statistics from 2006 to 2008, likewise, shows a slightly
decreasing trend except for the cattle (Fig. 4-4).

MSc Thesis Sirak Robele Gari
34
Figure 4-4: Livestock in Algarve (INE, 2008).
4.1.1.2. Aquaculture/Fishery
Fishery’s output in Portugal, in the year 2005 was 218,246 tons and 6484-6695 tons
from fish catch and aquaculture respectively, and the fishing fleet numbered 9155
(MADRP, 2007). MADRP (2007) further shows that despite a slight decrease in finfish
production, fishery’s output, in general, has shown an increasing trend from 94.4 % to
95.2 % between 1995 and 2005. The larger share belongs to finfish, ranging from 71.2
% to 72.5% and that of shellfish and invertebrates is between 4.6 % and 12.3 %
(MADRP, 2007).
Aquaculture and fishery are among the most important socio-economic activities around
the Ria Formosa. The Ria Formosa has a considerable wealth of species of fish. Ribeiro
et al., (2008) showed that within the space of 22 years (1980-2002), 57 taxa of 24
families of fish have been identified in the lagoon. Of these, 10 species that were
present in 1980s seem to be replaced with 12 new species ( Ribeiro et al., 2008).This
ecosystem is considered a nursery for a large number of coastal species, and its extensive
intertidal areas are being used for clam and aquaculture ponds.
010,00020,00030,00040,00050,00060,00070,00080,000
2006 2007 2008
Cattle
Sheep
Goat
Pig
Year
Live
sto
ck

MSc Thesis Sirak Robele Gari
35
Table 4-1: Fishery’s output in Portugal (Source, MADRP, 2007)
As mentioned earlier, 80% of Portugal’s bivalve fishery is harvested in this lagoon.
Other authors make the percentage even higher. For instance, Newton et al., (2003)
stated that saltpans and aquaculture ponds occupy about 1000 ha of the lagoon and in
1989 around 7000 tons of clams were harvested from the sand flats of the lagoon,
supplying 90% of the Portuguese market. However, the production declined to 2000
tons by 1990 (Dinis, 1992, Cited in: Newton et al., 2003) presumably owing to the
deterioration of water quality. Bebiano (1995), on the other hand, indicating the total
area of the lagoon used for extensive clam culture (e.g. cross carpet shell Venerupis
decussata, banded carpet shell Venerupis rhomboides, the thick trough shell Spisula
solida, the common cockle Cerastodemaa edule, the oyster Crassostrea angulata and
the mussel Mytilus galloprovincialis) as 10,000 ha, gives an elevated figure of
production of 10,000 tons in 1988, which declined to 3000 tons in the following six
years. Figure 4-5 diagrammatically summarises the figures enumerated above.
Figure 4-5: Bivalve production 1988-2005
0
5000
10000
15000
1988 1989 1990 1991 1992 1993 1994 2005
Bivalve Production
Year
Biv
alv
e
1995-1999 2000-2005 Difference
Fish
72.5 %
71.2 %
-1.3
Crustacean 4.6 % 5.3 % 0.7
Cephalopods 12.1 % 12.3 % 0.2
Bivalves 4.8 % 6.2 %
1.4
MSc Thesis Sirak Robele Gari
36
According to Hubert et al., (2006), extensive multi-species fish farming is also a
traditional activity being undertaken in ancient saltpan reservoirs. Semi-intensive fish
farming of sea bass (Dicentrarchus labrax) and gildhead sea bream (Sparus aurata) has
been developing for the past 20 years; and it has also been undertaken in ancient
saltpans or in concrete tanks (Hubert et al., 2006).
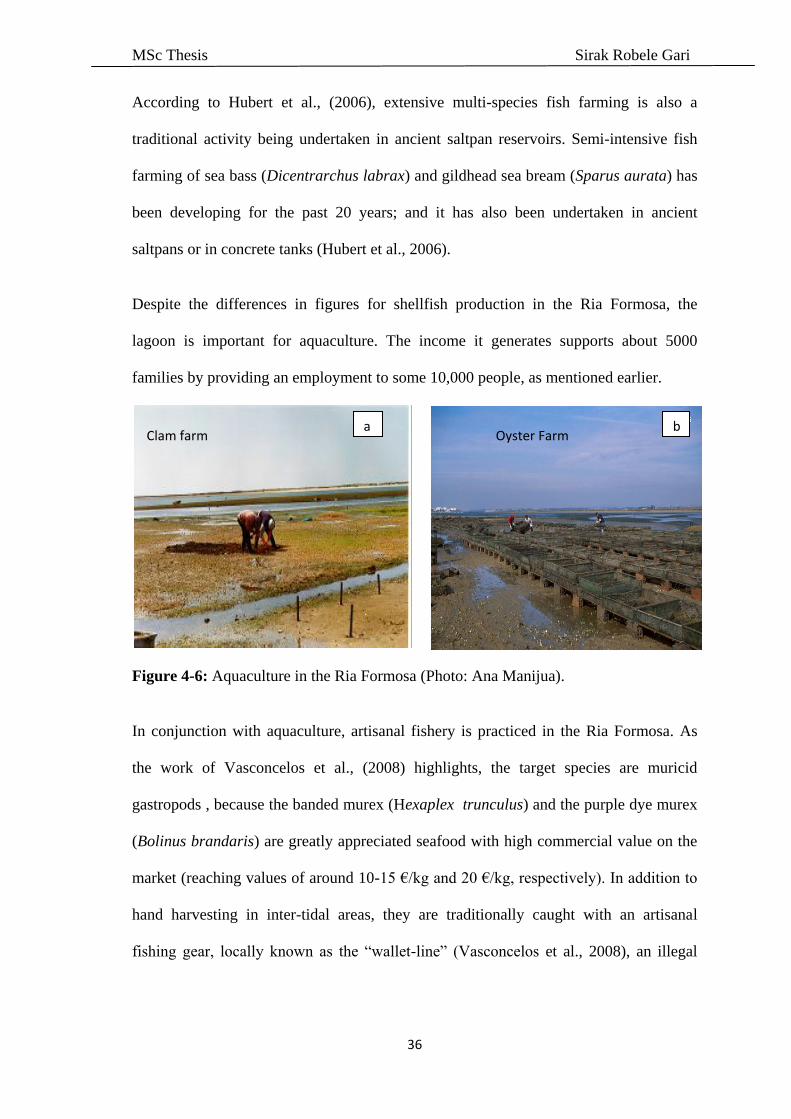
Despite the differences in figures for shellfish production in the Ria Formosa, the
lagoon is important for aquaculture. The income it generates supports about 5000
families by providing an employment to some 10,000 people, as mentioned earlier.
Figure 4-6: Aquaculture in the Ria Formosa (Photo: Ana Manijua).
In conjunction with aquaculture, artisanal fishery is practiced in the Ria Formosa. As
the work of Vasconcelos et al., (2008) highlights, the target species are muricid
gastropods , because the banded murex (Hexaplex trunculus) and the purple dye murex
(Bolinus brandaris) are greatly appreciated seafood with high commercial value on the
market (reaching values of around 10-15 €/kg and 20 €/kg, respectively). In addition to
hand harvesting in inter-tidal areas, they are traditionally caught with an artisanal
fishing gear, locally known as the ―wallet-line‖ (Vasconcelos et al., 2008), an illegal
Clam farm Oyster Farm a b

MSc Thesis Sirak Robele Gari
37
fishing gear according to the regulations for the fishery in the lagoon (D.R., 1990, Cited
In: Vasconcelos et al., 2008).
Figure 4-7: Muricid Gastropods harvested in the Ria Formosa. (http://www.george-
shells.com/murex6/brandaris_long_3s708.jpg
While Ruditapes decussatus is the main species harvested in the Ria Formosa (Chicharo
et al, 2008, Nobre, 2009), other clam species such as Venerupis decussatus, Venerupis
rombiods and Spisula solida are also found in the lagoon.
4.1.1.3. Tourism
The Algarve region is one of the most tourist-frequented areas in Portugal. Large-scale
tourist industry development in this region began in the 1980s and has consisted mostly
in the commercial exploration of the sea-sun binomial, held in particularly high regard
by Northern European tourism operators ( Estevens & Barroqueiro,2004). But its
popularity dates back to 1960s due to its reputation as an upmarket alternative to the
Mediterranean coast ( Petrov et al., 2009).
The size of the population in the major touristic centres grows dramatically during
tourist seasons. According to Mudge and Bebianno (1997), the population of the area
triples from approximately 150,000 inhabitants to 450,000 during the summer months.
This assumption is consistent with Portuguese National Statistics Institute (INE).
Hexaplex trunculus Bolinus brandalis

MSc Thesis Sirak Robele Gari
38
According to INE (2008) the number of tourists in Algarve was 146,900, 49,100 and
43,200 for one night stay, for one to four nights stay and for four and more days stays
respectively. This makes the total tourist population in 2008 about 239,200.
From the south western tip of Sagress to the north western tip of Margem do Guadiana,
the beautiful beaches of Lagos, Albufeira, Olhão and Tavira to mention but a few and
the beautiful isles (eg., Barreta, Cultra, Armona and Tavira) in the Ria Formosa Nature
Reserve are major tourist attractions in this region. The nature reserve plays an
important part in the conservation of many varieties of fish, flora and birds. The park
has been involved in preserving the cultural heritage of the area; for example, the tidal
mill and Roman salting tanks. Besides the natural beauty of the landscape with
associated fauna and flora such as birds, aquatic animals and vegetation, there are a
number of Golf courses and water sport facilities that increased the amenability of the
region for tourism.
Moreover, the medieval walls, monuments, cathedrals, museums, the Roman ruins and
the remnants of the 10th
century Moorish castles reminiscent of the Arab occupation of
Portugal contribute a great deal to the tourist flux in to the region
Figure 4-8: Tourism trend in Algarve region (INE, 2004-08)
0.00E+00
2.00E+06
4.00E+06
6.00E+06
8.00E+06
1.00E+07
1.20E+07
1.40E+07
1.60E+07
2004 2005 2006 2007 2008
Tourists
Overnight
stays
Year
Tou
ris
ts/S
tay
s
Tourism trend (2004-2008)

MSc Thesis Sirak Robele Gari
39
Figure 4-9: Beaches in Lagos (http://www.portugalvirtual.pt/_tourism/algarve/)
Figure 4-10: Beaches in Albufeira (http://www.portugalvirtual.pt/_tourism/algarve/)
The Ria Formosa holds an important place in Algarve as a valuable resource of tourism
(Newton et al., 2003). The area of land used in the Ria Formosa for tourism is second
only to urban development (Tett et al., 2003). The major population centres are Faro,
Olhao, Tavira, Fuseta and Cacela in an order of decreasing importance. The Ria
Formosa, being largely near Faro, the capital city of the region, has borne most of the
tourist burden. The city of Faro houses a number of notable ancient edifices to visit (e.g.
Figures 4-11 & 12), marina for boat travel to the surrounding islands and hotels to cater
for the incoming tourists, a fact that contributes to the population increase during high
tourist seasons.

MSc Thesis Sirak Robele Gari
40
Figure 4-11: Church of Sé Pedro
(http://www.portugalvirtual.pt/_tourism/algarve/).
Figure 4-12: Nossa Senhora de Fatima.
Photo: Sirak.R.Gari

MSc Thesis Sirak Robele Gari
41
Figure 4-13: Nature reserve, No 10 is the Ria Formosa.
(http://portimao.com/algarve/nature_reserves_uk.htm)
The Algarve region continues to be a retreat for those who want to escape from the
excessive and rather chaotic congestion of the Lisbon and O Porto metropolitan areas
(Estevens & Barroqueiro, 2004). In 2008, residents of Portugal spent 61.3 million
overnight stays outside their usual place of residence and Algarve absorbs 23.4% of this
(INE, 2008). Its agreeable, mild climate has even made it one of the most sought after
locations for foreigners to enjoy their retirement and as holiday/secondary homes,
especially the British, Germans and other northern Europeans too (AlgarveMais, 2009,
WTTC, cited in: Petrov et al., 2009).
4.1.1.4. Urban Development
The Algarve region has been increasingly urbanized owing mostly to a thriving tourist
industry. Since 1970 important changes of land use pattern throughout the country,
especially in Algarve occurred and tourism has been the driving force that influenced
significant changes of the landscape, economy, social structure, and cultural behaviour
(Petrov et al., 2006).

MSc Thesis Sirak Robele Gari
42
According to Petrov et al., (2006) the changes in the last 30 years led to a construction
pressure, mainly that of residential and tourist facilities on the agricultural and nature
areas; and based on statistics they stated that an increase of 64% of development of
residential area from 1972 to 1986 was observed, mainly on the shorelines. Besides, the
growth in the industrial buildings was 8.7 % in the nineties. In 2008 alone 3279 family
dwellings and other buildings were constructed in Algarve. Among these 2618 were
new constructions and the rest constitute expansions and reconstructions (INE, 2008).
INE (2008) further elaborates that in association with these buildings, 6976 pavements
covering an area of about 2 km2 were made. Moreover 9346 apartments were
constructed. From 2002 to 2008, about 23,201 family dwellings and other buildings
were built in the Algarve region (Fig.4-14) (INE, 2008).
Figure 4-14: Family residences and other buildings in Algarve (INE, 2003-08)
The number of these types of buildings was the highest in 2002 and decreased till 2004
and increased again in 2005. Having decreased in 2006, showed a steady increase till
2008. However, big hotels and large apartment buildings are no longer allowed to be
constructed. Nonetheless, golf courses and holiday villages continue to develop along
the Algarve coast; and urban areas continue to expand as very small and dispersed
patches along the shorelines (Petrov et al., 2006).
2500
3000
3500
4000
4500
5000
2000 2002 2004 2006 2008 2010
Building construction trend in Algarve
Year
Nu
mb
er
of
bu
ildin
gs

MSc Thesis Sirak Robele Gari
43
Tourist development has been one of the most important stimulating forces behind
urbanization. As the tourist industry grew, new infrastructural development was
necessary to cater for tourists. Table 4-2 summarises establishments in 2008 for the
benefit of tourists.
Table 4-2: Establishments for tourists in Algarve (Source, INE, 2008)
According to the criteria used by the Portuguese National Institute of Statistics, the
Algarve region consists of 18 urban centres, most of which are located along the coast,
and accounts for 5.7% of the total number of urban centres in the country (Estevens &
Barroqueiro, 2004). Estevens and Barroqueiro (2004) further explain that the spatial
distribution of the urban centres is indicative of considerable urbanisation along the
coast and of the existence of two spatial sub-systems: one structured around the Faro
urban centre, the other around the Portimão, Lagos and Lagoa urban centres.
The area around the Ria Formosa is an important urban centre as Faro is the capital and
the most important centre of the region. For example, The Faro,Loule and Tavira urban
centers located within the Ria Formosa are ranked 31st,48
th and 64
th in the country with
respect to their centrality; especially the Faro urban centre fulfilled 112 of 117 criteria
Year 2008
Hotels Hotel-
apartments
Tourist
apartments
Tourist
settlements Motels Hostels Inns Pensions Total
90
63
137
25
5
3
8
86
417
Rooms 12730
6895
10957
4467
249
120
208
2007
37633
Capacity
(Prs) 27500 20768 32608 12245 625 240 451 4287 98724
Employment
(Prs) 7176 2728 2767 1591 85 96 208 423 15074

MSc Thesis Sirak Robele Gari
44
for constructing centrality index, indicating its importance in the Algarve region
(Estevens & Barroqueiro, 2004).
Besides residential and industrial buildings, parking lots, pavements, hospitals,
industrial buildings and waste water treatment plants have been constructed. For
example, additional to existing waste water treatment plants (~ 27 in number, Nobre,
2009), a 9.7 million euro UWWTP has been inaugurated in September, 2009 (Aguas do
Algarve, 2009). UWWTPs, particularly have an important implication to the lagoon’s
eutrophication as the effluent they release in to the Ria Formosa is a significant
pressure.
Urbanization in the region is still going on. AlgarveMais (2009) enumerates the
following plans that will be completed in the next few years.
A €130 million project to develop the capacity of Faro airport from six million
passengers a year to eight million by 2013 is planned.
More than ten private hospitals with the primary aims of serving tourists will be
built in Algarve. The first one in Faro built on 12,000 ha of land was recently
opened (Fig 4-15).
Luxury town-homes and apartments in Vilamoura, only with less than 30
minutes distance from Faro airport, and a hospital with 50 beds in Albufeira will
be built.
A €150 million luxury resort called Quinta da Praia will be built on 22.5 ha area
close to the beach in Alvor .It includes five star hotel, 197 villas and town
houses. An area between the development and the beach will be renovated and
walkways to the beach will be built.

MSc Thesis Sirak Robele Gari
45
The industrial development accompanying urbanization is a feature that should not be
neglected. Manufacturing industries were about 2564, 3013, 2985 and 2913 in number
in the period of four years from 2003 to 2006 respectively (INE, 2003-2006). Likewise,
those enterprises involved in agricultural, livestock, fishery and forestry products,
manufacturing and processing industries numbered 5926, 5916, 5398 and 5801 in the
period of the same four years respectively (INE, 2003-2006).
Figure 4-15: Hospital Particular Do Algarve.
Figure 4-16: Manufacturing and processing enterprises in Algarve (INE, 2003-2006).
0
1000
2000
3000
4000
5000
6000
2002 2003 2004 2005 2006 2007
Processing
industry
Manufacturing
industry
Year
No
En
terp
rise
s
Enterprises in Algarve (2003-06)
Photo: Sirak R. Gari

MSc Thesis Sirak Robele Gari
46
As most of the urbanization process and population concentration is along the coasts,
wetland decrease due to reclamation has been observed in the Ria Formosa.
Deforestation too is associated with urban development. Decrease in green spaces of
cities also is a problem if urban planning is not properly carried out.
Figure 4-17: The towns of Faro (a) and Albufeira (b), Algarve
(www.observatoriodoalgarve.com/cna/noticias_ve), (www.tripadvisor.com/Hotel_Review-g189112-
d286... )
4.1.2. Pressures
Pressure with respect to eutrophication in the Ria Formosa has different forms. It can be
in the form of domestic sewage containing organic matter, fertilizer-laden run-off from
agricultural fields and feedlots, as well as sediments on which chemical elements are
adsorbed. All these forms end up in nutrient enrichment that enhances a profligate algal
growth and other symptoms of eutrophication in the lagoon. One additional pressure on
the lagoon has been parasitic infection of clams.
Several studies have shown that the Ria Formosa is enriched annually with nutrients
originating in the four major categories of socio-economic activities discussed earlier.
a b

MSc Thesis Sirak Robele Gari
47
Agriculture and Golf courses use fertilizers and release nutrients. Animal rearing
releases organic matter and nutrients in the manure. For example, the intensive
agriculture of Campina de Faro and Campina da Luz, the golf courses of Quinta do
Lago ,the chicken farm at Aviludo and pig and livestock farms are some of those
responsible for producing this pressure. Thus released nutrients find their way in to the
lagoon as run-off.
The load of nitrogen in to the Ria Formosa from agriculture, forest and other vegetation
is 1060 t /yr (Ferreira et al., 2006). Furthermore, Nobre (2009) estimated a diffuse load
of about 4000 t/yr of N and about 2700 t/yr of P originating in both agriculture and
livestock in the period between 1980 and 1985. Likewise this author estimated~2450
t/yr of N and ~1500 t/yr of P to enter the Ria Formosa from the same diffuse source
between 1995-99. The main source of silicate in the Ria Formosa appears to be a flux
from the inner lagoon sediments in the summer months and freshwater inputs during the
rainy season (Newton et al., 2003, Newton, 1995; Cited: In Newton & Mudge, 2005)
which reaches 761 µM m-2
d-1
(Falcão & Vale, 1990).
Aquaculture has its own significant contribution to the pressure of nutrients and organic
matter. The organic waste from the shellfish farms, artificial food leftovers, faeces and
excreta from the finfish cultures are the sources of these pressures. Disturbance of
sediments by trawling allows re-suspension in the water column. Fish discard could also
be an important source of pollution to the lagoon. Though shellfish farming has a
significant effect at reducing the pressure by grazing on phytoplankton, some of what
was ingested is returned to the lagoon in the form of excreta. Thus Ferreira et al., (2007)
estimate it to be 40%, which means only a 60% net removal of nutrients ingested as
phytoplankton.

MSc Thesis Sirak Robele Gari
48
Though urbanization and tourism may have their own particular pressures on the
lagoon, they have some common characteristics with regard to eutrophication. The
development of infrastructures such as housing and waste water treatment plants, the
demographic factors such as population increase accompanied by elevated waste
production and the consequent load on UWWTPs are among these common features.
With an increase in population during tourist seasons, besides the significant volume of
sewage entering the Lagoon (both treated and untreated) the amount of food debris
dumped on the beaches and other organic pollutant sources contribute their own share to
the organic matter input.
According to the study by Wayland et al., (2008) the sewage treatment plants release
146 µM and 180 µM of ammonia to the river Esteiro da Maria Nova and Ramalhete
channel respectively, which drain in to the lagoon. Similarly Phosphate from the former
was 44 µM and the latter released 2.4 µM. Furthermore, World Bank (1993) indicated
that approximately 400 metric tons of nitrogen/yr and 200 Metric tons of phosphorus/yr
from domestic sewage and detergent are supplied to the lagoon (Cited in: Newton &
Mudge,2005).With a triple increase in population during summer months, the figure
may be elevated correspondingly. Nobre (2009) estimated the point source discharges
from the UWWTPs in 1980/85 to be ~500 t yr-1
of N and 125 t yr-1
of P, and in 1995/99
to be ~500 t yr-1
of N and ~100 t yr-1
of P. The UWWTPs have reduced the organic load
in the entire catchment but might have induced a localized increase of nutrient load in
the vicinities of their outlet (Nobre, 2009).
Ferreira et al., (2003) showed that 421 tons of nitrogen and 83 tons of phosphorus per
year were loaded in to the Ria Formosa originating from urban and industrial effluents
(Cited in: Ferreira et al., 2006). However, the same authors claim that these figures

MSc Thesis Sirak Robele Gari
49
represent only part of the total load of nitrogen and phosphorus which is 1028 tons and
164 tons per year respectively (Leote et al., 2008). According to Nobre (2009), the
waste contribution of industry to the Ria Formosa in terms of BOD5 was ~1880 BOD5
yr-1
and~500 BOD5 yr-1
in 1980/85 and 1995/99 respectively.
Figure 4-18: Pressure trend in to the Ria Formosa (Ferreira, 2006, Nobre, 2009).
Urbanization is usually accompanied by wetland reclamation and deforestation which
has an impact on nutrient cycling. Nitrogen is fixed by bacteria in the soil and legumes
of plants. The natural death of plants releases nitrogen in to the soil, which is eventually
used by the living plants. This ensures the natural nutrient cycle. But deforestation,
resulting in loss of riparian vegetation will disrupt this cycle. Moreover, atmospheric
deposition of phosphorus due to biomass burning will decrease depleting the soil of this
element. Runoff washes off all available nutrients and denudes the soil of its mineral
content, while enriching the receiving water, i.e, the Ria Formosa. This results in an
increased pressure of nutrient enrichment (Nitrogen and Phosphorus) in the lagoon.
Urbanization, agriculture and aquaculture seem to be closely linked. The population
increase which is an integral part of urban development places high demands on
agriculture and aquaculture. So, more food should be produced. This necessitates an
0500
10001500200025003000350040004500
1980 1985 1990 1995 2000 2005 2010
Nitrogen
Phosphorus
BOD5
N, P and BOD5 loads into the Ria Formosa
Year
Load
(t)

MSc Thesis Sirak Robele Gari
50
increased use of fertilizers, increased number of food processing enterprises, artificial
food for finfish farming and more area for aquaculture as a whole. All these factors lead
to an increasing pressure on the Ria Formosa.
Figure 4-19: Faro Noroeste UWWTP releasing its effluent in to the Ria Formosa.
4.1.3. State
The state of the Ria Formosa lagoon has changed for the worse as a result of
anthropogenic activities in the system and its catchment. Some authors (eg. Nobre,
Photo: Sirak.R.Gari
Photo: Sirak.R.Gari
Photo: Sirak.R.Gari

MSc Thesis Sirak Robele Gari
51
2009) base this assumption on the abnormal clam mortalities due to parasite infection
and on benthic eutrophication symptoms in specific problematic areas.
Nutrient concentrations exhibit spatial and temporal variations indicating the non-
uniformity of the lagoon. The mean concentrations of DAIN fluctuate around 20 µmol
dm-3
with greater concentrations in the eastern lagoon compared to the western, and this
difference is greatest during the winter months, with concentrations in the eastern
lagoon increasing up to 150 µmol dm-3
(Newton et al., 2003). Newton et al., (2003)
further elaborate that the mean concentrations of phosphate are generally greater than
0.6 µmol dm-3
and, except in February, are always higher in the eastern lagoon
compared to the western lagoon .The same authors indicated that during late spring and
early summer months, the peaks being up to 1.4 µmol dm-3
decrease to below 0.8 µmol
dm-3
during the late summer and early autumn. The concentrations of phosphate
increase during the late autumn and the early winter, particularly, in the eastern lagoon
where it increases up to 1.2 µmol dm-3
in November (Newton et al., 2003). With respect
to silicate, Newton et al., (2003) showed that the mean concentrations are generally low
for most of the year with an increase during the winter months to 80 µmol dm-3
in the
western lagoon and a much greater 600 µmol dm-3
in the eastern lagoon.
Nobre (2009), based on ecological model results showed some problematic areas mostly
in the eastern part of the lagoon which have shown benthic eutrophication symptoms,
especially due to pressures from UWWTP effluent having their outlet in the vicinity.
According to the author, while total biomass increases relatively little in response to
nutrient load, the macroalgal growth of the larger mass class was from less than 50% to
about 150%. This is an important result indicating that although the overall seaweed
biomass does not increase significantly under higher nutrient loads, the larger algae,

MSc Thesis Sirak Robele Gari
52
responsible for smothering of benthic fauna and seagrasses becomes important (Peckol
& Rivers,1996; Cited in: Nobre et al.,2005).
Newton et al., (2003) using the criteria adopted by European Environment Agency
(EEA) and United States National Estuarine Eutrophication Assessment (US-NEEA)
reached contrasting conclusions on the eutrophication status of the Ria Formosa. The
former suggests the usage of winter nutrient concentrations, chl-a and bottom oxygen
concentrations; and the latter makes use of only the eutrophication symptoms of
chlorophyll and oxygen concentration for assessment. Thus on the basis of nutrient
concentration the Ria Formosa was in a state of ―Poor‖ to ―Bad‖ (particularly in winter)
according to EEA and almost pristine according to US-NEEA on the basis of
chlorophyll and oxygen concentrations (Newton et al.,2003). Table 4-3 shows the EEA
standard of nutrients for comparison with nutrient concentrations obtained at different
seasons in the Ria Formosa.
Table 4- 3: Nutrient quality standard of Transitional, Coastal and Marine waters (EEA,1999)
The mean values of chl-a are in the range of about 2–3 µg dm-3
and 90% of the
measured oxygen concentration values showed 90% saturation in the Ria Formosa
indicating the near pristine condition according to US-NEEA criteria (Newton et al.,
2003). However, a morning oxygen sag (48% saturation) and afternoon super-
saturation, especially during the summer months was observed (in 1995) but no anoxic
bottom water layer was found except for ephemeral stratification at the seawater inlets
Quality Nitrate+Nitrite (µmolL-1
) Phosphate (µmolL-1
)
Good < 6.5 < 0.5
Fair 6.5-9 0.5-0.7
Poor 9-16 0.7-1.0
Bad >16 >1.1

MSc Thesis Sirak Robele Gari
53
and near the mouth of the river Gilão (Newton et al., 2003). A recent study by Newton
et al., (2009) revealed a night DO sag and regular early morning hypoxia (< 2 mg/dm-3
)
in the inner lagoon near the city of Faro.
Nobre et al., (2005) state that the Ria Formosa has a short water residence time with no
apparent eutrophication symptoms in the water column, but benthic symptoms are
expressed as excessive macroalgal growth and strong dissolved oxygen fluctuations in
the tide pools. According to Baptista (1993, Cited in: Newton et al., 2003) some
evidences show an increasing incidence of harmful algal blooms.
Fig 4-20 below shows chl-a concentration ranging from 1.2 to 10.8µg L-1
and oxygen
concentration ranging from 3.7 mg L-1
to 7.8 mg L-1
.
4-20: Interpolated surfaces indicating chlorophyll-a and Oxygen concentrations: (a)
chl-a—90 th percentile; (b) dissolved oxygen—10 th percentile (Nobre et al., 2005).
Moreover, Ferreira et al. assessed the eutrophication status of the Ria Formosa by
means of the ASSETS screening model, and a grade of Moderate Low, which

MSc Thesis Sirak Robele Gari
54
corresponds to a Water Frame work Directive (WFD) classification of Good, was given
on the basis of data collected over a number of years for primary and secondary
eutrophication symptoms.
Table 4-4: Summary of the State of the Ria Formosa
4.1.4. Impact
4.1.4.1. Ecological Impact
According to several authors (eg. Nobre, 2009, Newton et al., 2003) the most important
ecological impact associated with bacterial infection enhanced by deterioration of water
quality in the Ria Formosa is clam mortality. The local clam species of Ruditapes
decussates, which constitutes 80-90% of the national production drastically decreased
from 1980s (Azevedo,1989, Bebiano,1995, Newton et al., 2003) on wards and only
recovered somewhat in 2005 ( MADRP,2007). The decrease of bivalve production was
from 3-4 kg m-2
to 500 g m-2
and the concurrent increase in bivalve mortality was 50%,
(Bebiano, 1995).
Nobre (2009) attributes the clam mortality, in addition to the bacterial infection and low
dissolved oxygen (DO) that enhances the disease, to benthic eutrophication symptoms;
but suggests more research to establish a link between the introduction of the Japanese
clam Ruditapes fillipinarium and the appearance of the parasite. Additionally, fish kills
occur with increasing frequency in the summer months (Newton et al., 2003) probably
due to harmful algal blooms and low DO.
Nutrient concentration
(µmol dm-3
)
Chl-a conc. DO conc.
(mg L-1
)
DO saturation Macro algal growth
(larger class)
DAIN 20-150 1.2-10.8 µg L- < 2 – 8.0 48% - 140% 50% -150%
Phosphate 0.6-1.4 - - - -
Silica 35-600 - - - -

MSc Thesis Sirak Robele Gari
55
In addition to actual impacts observed so far, the potential impacts if eutrophication
intensifies are oxygen depletion, decrease in water clarity, and adverse habitat change
resulting in loss of biodiversity in the lagoon.
The losses of ecosystem goods and services are revealed in lower clam production,
lower fish catches, decreased nutrient removal capacity of bivalves, lowered
oxygenation of the lagoon and less provision of nursery habitat for juvenile fishes by
seagrasses. All these losses are linked with the consequent socio-economic impacts.
4.1.4.2. Socio-economic impact
Nobre (2009) using a differential DPSIR approach estimated the economic loss in the
Ria Formosa due to anthropogenic activities (1985-95) to be between €315 million and
€565 million. Similarly for three time periods between 1980-1999, the economic loss
was estimated by the same author to be from €502 million to €752 million. Out of this
€299 million constitute a negative change in the economic value of the economic
activities (Drivers). The rest (€202.9M - €453.7M) was in the form of responses.
Taking into account the fact that about 10,000 individuals representing 5000 families
depend on aquaculture and fishery in the Ria Formosa, the socio-economic effect
created by a continuous decrease of production is considerable. When seen on a wider
perspective the decrease in the Ria Formosa’s clam production which covers 80-90% of
the total bivalve production of the country produces a significant economic impact on
the nation. According to Campos and Cachola (2006) most of the production is exported
to western European countries, especially to Spain. The presence of occasional harmful
algal blooms and other pollutants associated with fish kills is another source of concern
for economic loss.

MSc Thesis Sirak Robele Gari
56
The effect of the deterioration of water quality due to nutrient enrichment can reveal
itself in the loss of tourism too. The economic trend in the region of Algarve is seen in
shrinkage of the primary sector (Agriculture) and expansion of the tertiary sector
(Services and Commerce) (INE, 2007). This trend owes its existence to the expanding
tourist industry. So, loss of tourism will have a tremendously grave impact on the
economy of the region and the country. The obvious social impact is loss of jobs
associated with decreased production both in aquaculture and fisheries while health
problems are the possible results of algal blooms. For example, dinoflagellate biotoxins
were found to be accumulated in Donax clams harvested at Fuzeta resulting in human
intoxication (Vale & Sampayo, 1999).
4.1.5. Responses
4.1.5.1. Earlier responses
In tackling the actual and potential problem of eutrophication and clam mortality due to
bacterial infection, various responses have been made. Most of the responses were
against the pressures, i. e. nutrient enrichment. Nobre (2009) mentions the Management
Plan of Ria Formosa Natural Park as having several actions aimed at reducing nutrient
enrichment and protection of the aquatic resources. These include: load reduction,
industrial process improvement, aquatic resources quality improvement, sustainable
tourism, environmental education, technical and scientific research, and agriculture-
related actions. The cost of the actions adopted was estimated by Nobre (2009) at
€175.9 million.
One of the load reduction methods was the construction and upgrading of UWWTPs.
These infrastructures certainly reduce the organic and nutrient load into the lagoon,
though localized nutrient enrichment is observed. Upgrading UWWTPs to have a

MSc Thesis Sirak Robele Gari
57
tertiary treatment unit as suggested by Newton et al., (2003) removes much more
nutrients. Dredging has been performed which improves the tidal dilution and flushing
of nutrients by deepening the channel (Newton & Mudge, 2005). Further, the opening
of a new inlet in the west of the lagoon encourages the tidal exchange of phytoplankton
between the lagoon and the adjacent coastal waters. Dredging enhances this function.
However, according to the same authors, dredging has shortcomings of mobilization of
nutrients and metals found in higher concentrations in the sediment. Moreover, it can
physically damage important components of the ecosystem such as seagrass beds and
clams: it can also increase turbidity temporarily (Newton & Mudge, 2005). Therefore
making a balance between the losses and gains would be necessary before taking this
management option. It would also be necessary to know where to use this method and
where not to.
For reducing clam infection intensities and prevalence, different management options
were suggested by Nobre (2009). They were; good screening of seed infections and
buying certified seeds, improvement of DO condition (by reducing nutrient load) in
clam beds and lowering population densities of clams. The economic value of these
responses over a 10 year response implementation period was estimated to be €376,500.
Furthermore, the Portuguese fisheries authorities regularly inspect the bivalves for
toxins from blooms of harmful algae, which are sometimes detected, especially during
the autumn (Edwards et al., 2005).
Newton et al., (2003) suggested a number of recommendations in relation to monitoring
of the Ria Formosa. They were: establishment of an appropriate monitoring network for
the ecological and chemical status of the lagoon by the national and regional authorities.
The parameters (indicators of eutrophication) to be monitored were nitrogen,
phosphorus, DO and chl-a. Additionally, Monitoring of the abundance of epiphytes and

MSc Thesis Sirak Robele Gari
58
macroalgae, loss of submerged aquatic vegetation and appearance of toxic algal blooms
was suggested. Measurement of biomasses and species composition of phytoplankton,
macrophyte, macrozoobenthos and their depth distribution are features to be included in
the monitoring programme. A regular monitoring of at least a 5-year period for trend
analysis was also recommended.
In line with this, some measures have been taken. For example, the project ―Monitoring
Plan for Water Quality and Ecology of Portuguese Transitional and Coastal Waters‖, or
MONAE, was financed by the Portuguese Water Institute, INAG, and carried out by an
interdisciplinary team drawn from marine science and management experts in the E.U.,
U.S. and South Africa (Ferreira et al., 2006).
4.1.5.2. Recommendations
Important responses have either been made or planned. Useful management options
have been suggested and scenarios simulated. Several studies on the Ria Formosa have
been concluded with valuable recommendations. What might be lacking could be the
financial and institutional resources and the will to implement the plans. The following
recommendations are not replacements to the already adopted and suggested measures
but rather complementary and reinforcing.
4.1.5.2.1. Agriculture/Livestock
Agriculture and livestock share the largest contribution of organic matter and nutrient
enrichment to the Ria Formosa. So an effective Agricultural Waste (and runoff)
Management Plan (AWMP) should be prepared. The planning process, while owned by
the Ministry of Environment, Spatial Planning and Regional Development (MESPRD),
it should involve MDARP, INAG, Portuguese Association for Water Resources

MSc Thesis Sirak Robele Gari
59
(APRH) and the property owners (Farmers and livestock raisers’ representatives).
Experts such as geologists, soil scientists, agronomists and engineers should be present
in these institutions. Property owners should be convinced of both the environmental
and economic implications of agricultural waste treatment.
The agricultural waste (and runoff) management system should be simple and easily
managed.
Use of constructed wetland is an environment friendly way of agricultural runoff
management which greatly reduces nutrient load (Fig. 4-21).
Use of Cover crops, Filter strips, Strip cropping and crop residue management
prevent erosion and filter nutrients.
Grazing management and usage of grassed waterways trap nutrients.
Nutrient management encourages effective use of nutrients, thereby reducing
unnecessary load.
Simple aerobic or anaerobic ponds could be constructed at feedlots and dairy
product processing enterprises for reduction of BOD5 and nutrients.
Larger stabilization ponds could be constructed serving a number of farmsteads
to treat diffuse agricultural runoff (Fig. 4-22).
The soil characteristics to remove organic matter, nutrients and metals through
filtration, biodegradation and chemical reactions (adsorption, precipitation,
complexation) should be considered when siting a waste management system
The resulting biosolids could then be utilized in areas which need fertilizers.
This reduces commercial fertilizer costs.
Economic instruments of emission levels could also be imposed on
agriculturalists and livestock raisers.

MSc Thesis Sirak Robele Gari
60
Figure 4-21: Constructed wetland (USDA-NRCS, 1999).
Figure 4-22: Waste storage pond; the shoreline and the reflective surface of the pond
make it appear to be a traditional farm pond (US-NRCS, 1999). Properly managed, it
can contribute to aesthetic beauty of the area instead of marring it.
4.1.5.2.2. Aquaculture, fishery and manufacturing/processing
enterprises
Economic instruments of polluter’s pay principle and emission standards
for nutrients, organic matter and metals should be applied by MESPRD.

MSc Thesis Sirak Robele Gari
61
Both manufacturing and processing industries should have on site
WWTPs at least on a primary level. This requirement should be imposed
upon them by MESPRD.
With respect to finfish and shellfish farming, cooperation with the two
activities so that the waste produced by the former is removed by the
latter should be encouraged. A common platform for negotiations could
be found by forming associations of aquaculture farmers.
Moreover, following the suggestion by Ferreira et al., (2005) practicing
nutrient emission trade will be extremely useful. Figure 4-23 summarizes
the benefits of shellfish farming. Research institutions can promote this
possibility.
Figure 4-23: Mass balance and nutrient emissions trading for clam aquaculture in the
Ria Formosa. (Ferreira et al., 2009).
Shellfish farming in addition to the economic benefits it provides saves sewage
treatment costs. This nutrient removal capacity can be traded.

MSc Thesis Sirak Robele Gari
62
The study done by Leite et al., (2004) indicated that high salinity and temperature, high
clam density per bed and importing clam seeds, features favouring the enhancement
and the spread of the Perkinsus. sp. infection were observed in the Ria Formosa.
Therefore:
Tightening the control on imported seeds and screening them for the presence of
the causative agent should be practiced by Ministry of agriculture (MADRP) to
reduce clam mortality.
Decreasing density of clam beds by aquaculture farms reduces the occurrence of
proximity infection. What should be noted here is that it is much better to
produce healthy individuals in reasonably stacked beds than lose the greater
proportion of the product due to infection.
As pollution causes physiological stress and makes shellfish susceptible to
infections, reduction of pollutant load is essential. The role of UWWTPs in this
respect is indispensable. The responsibility rests with the municipalities and
Aguas Do Algarve.
It might be advisable to avoid seeds of Ruditapes phillipinarium, as this species
is a known host for the Perkinsus.sp
Using appropriate fishing gears discourages discarding of fish and prevents
organic pollution resulting from decomposition of dead fish.
Environmental research and monitoring as well as awareness creation activities
regarding the Ria Formosa should be a continuous process. So, the current monitoring
programmes (eg. MONAE) should be strengthened. The monitoring could be done by
the Portuguese Water Institute (INAG) as the owner of the monitoring project and
various national and international institutions could be involved. These include the

MSc Thesis Sirak Robele Gari
63
University of Algarve and other national educational and research institutions. Training
volunteers and school children for the simple, routine monitoring activities can also
save resources and raise the environmental awareness of the community. Since the Ria
Formosa falls under the EU-WFD, institutions from the other European countries can
also be invited.
4.1.5.2.3. Tourism and Urbanization
Tourism, as a very important economic sector for Algarve, needs to be an activity that
holds the sustainability of the environment in high priority. Its fate is closely tied with
aesthetically sound environment. One such feature is the golf courses. But they require
the use of fertilizers which in turn affects the coasts. So with respect to golf courses the
recommendations forwarded for agriculture apply. The tourism office of the region
should take responsibility for this.
Regarding the cleanliness of the beaches; provision of garbage bins, notices calling
tourists to a responsible behaviour, monitoring and a bit of control organized by the
Department of Investment, Trade and Tourism (DITT) of the region and the Nature
Reserve authorities is necessary.
The increase in population during high tourist seasons with the proportional increase in
domestic waste is a problem that should be handled by UWWTPs. Construction of
adequate UWWTPs is the duty of the municipalities and Aguas Do Algarve.
One of the consequences of urbanization regarding eutrophication is elevated sediment
load into the Ria Formosa. So, measures that reduce this problem should be sought.
Urban parks, besides their aesthetic, recreational, psychological and economic benefits
to the communities, they provide significant ecosystem services (Loures et al., 2007).

MSc Thesis Sirak Robele Gari
64
One such service is to reduce the urban runoff and increase the infiltration rate of the
soil. This can be achieved by increasing green areas in towns and by constructing un-
cemented cobble stone roads instead of concrete-asphalt streets. In this regard, the sole
responsibility rests with the municipalities.
Even more important is the population increase with all its requirements. Its important
aspect with regard to eutrophication is waste production from households and
manufacturing and processing enterprises, which cater for the needs of the population.
So, concerning the domestic wastes, providing adequate sewer system and UWWTP is
the responsibility of Aguas Do Algarve and the municipalities. The enterprises should
be convinced or legally forced by MESPRD to treat their wastes on-site to meet
emission standards or else bear fines (Economic instruments).
4.1.6. Environmental Indicators
Indicators are values derived from parameters, which provide information about a
phenomenon, and they should neither be too large to avoid cluttering the overview nor
too few not to fail to provide sufficient information (OECD, 1993). Environmental
indicators could be pressure or state indicators. Pressure indicator with respect to
eutrophication is nutrient load expressed as Kg ha-1
yr-1
or alternatively Ton yr-1
of N,P
and Si. Some of the state indicators selected are concentrations of nutrients (N,P,Si) in
µmol L-1
, chl-a (µg L-1
), BOD5 (mg L-1
), DO (mg L-1
) or DO saturation (%). Algal cell
count, biotoxins, turbidity for water transparency and weight measurements for clam
production also are included in the indicator’s list.

MSc Thesis Sirak Robele Gari
65
OECD (1993) elaborates that selection of indicators depends on policy relevance,
analytical soundness and measurability. The selected indicators fulfill these functions.
Chl-a, for example indicates the algal biomass that is exactly a direct result of
eutrophication, namely, the appearance of phytoplankton, macro algae and possible
algal blooms. DO, like wise is an excellent indicator of the degree of eutrophication, as
its concentration is depleted proportional to the severity of eutrophication. Nutrient
loading provides information about the nutrient enrichment of the lagoon and the
likelihood of eutrophication. The other indicators, too, are useful in providing the
necessary information of their own. All the indicators are fairly easily measurable and
can be analyzed based on standards.
4.2. Systems Approach Framework (SAF)
4.2.1. Rationale
SAF was originally adopted for the 18 Study Site Applications (SSAs) in the SPICOSA
project. The Ria Formosa, however, is not part of this project. Still, this approach can be
used in other coastal areas as well as other natural water bodies.
The Responses in the DPSIR framework are forwarded in the form of recommendations
to the policymakers so that they are implemented. But SAF simulates different
management scenarios and demonstrate to policy makers what occurs if these
management options are taken. Presupposing what kind of policy decision to take is not
its objective (SPICOSA-WP3, 2007).
So, as DPSIR was used to come out with recommendations for the management of
eutrophication in the Ria Formosa, SAF can be used for finding several management

MSc Thesis Sirak Robele Gari
66
options and simulate several management scenarios using appropriate model to
demonstrate their outcome.. The final management decision rests with the policy
makers.
Nevertheless, the scope of the present study is merely to indicate the use of SAF for the
eutrophication management in the Ria Formosa. As such it does not attempt to
formulate and run any model and does not simulate management scenarios. At best, it
identifies stakeholders, drivers, issues and suggests management options as bases for
scenarios and describes the various steps of SAF in relation to the Ria Formosa and
provides examples of these steps as were conceived by the SPICOSA project.
4.2.2. System Design
As explained earlier, the first step in SAF is System Design. System design step, in turn,
contains five sub-tasks. They are Issue resolution, System definition, Conceptual model,
Methods & Information requirement and Problem scaling.
4.2.2.1. Issue resolution
4.2.2.1.1. Stakeholder mapping
The stakeholder mapping consists of identification of the stakeholders in a given coastal
zone area and the way these stakeholders relate to one another, and the subsequent
analysis of the way in which stakeholders relate to the issues (SPICOSA-WP1, 2007).
As management of the coast is linked to managing the coastal uses of the society, the
success of coastal management depends on the support and participation of the
stakeholders who have a direct or indirect interest in actions or decisions. Therefore,

MSc Thesis Sirak Robele Gari
67
inclusion of all stakeholders and addressing all the key policy issues pertaining to
coastal zone is of paramount importance in ICZM.
The active involvement of the community and stakeholders at an early stage of ICZM
provides local knowledge, encourages dialogue, fosters support and raises awareness of
the programme, the outcome of which provides decision makers with a clear overview
of the nature of the human and physical coastal environment, the urgency of the issues
to be resolved and the limitations of the contemporary management regime (Cummins
et al., 2003).
Stakeholder mapping calls for process legitimacy, process efficiency and transparency
with respect to identification of both stakeholders and policy issues (SPICOSA-WP1,
2007). Process legitimacy refers to the fact that all stake holders and their concerns are
included. Process efficiency, similarly, refers to that, that all resources having
information are used and no key policy issues are left out. Transparency emphasizes on
that all information are shared and no policy issue is hidden.
4.2.2.1.2. Stakeholders
Agricultural farmers, animal raisers, fishermen and aquaculturists, tourists and local
inhabitants are the major stakeholders. Institutions concerned are different government,
educational and private institutions with the management and control of the economic
activities and the environment. Additionally research institutions are among the stake
holders.

MSc Thesis Sirak Robele Gari
68
Hence, the Ministry of Agriculture (MADRP) and its regional branch (DRAP-Algarve),
Nature Reserve, the Department of Investment, Trade and Tourism (DITT), Tourism
operators, the Ministry of Environment, Spatial Planning and Regional Development
(MESPRD), Municipalities, Aguas do Algarve, The Navy, Maritime Department
(DMS), office of the Port of Faro (CPF), Portuguese Water Institute (INAG),
Portuguese Association for Water Resources (APRH) and the University of Algarve
(UAlg) are included.
The basis for choosing these stakeholders is the obvious influence they have on the
lagoon by their economic, administrative and academic activities. Once these
stakeholders are identified a forum for consultation by means of workshops, formal and
informal meetings can be arranged.
4.2.2.1.3. Roles and views of Stakeholders
As Table 4-5 below summarizes, agriculturalists/animal raisers are beneficiaries of
their activities as the lagoon is a sink to their waste. Aquaculturists, on the other hand,
have initially benefited until deterioration of water quality caused a decrease in
production of seafood. Tourists, likewise, benefited as the luxurious golf-courses were
constructed which needed artificial fertilizers and there was plenty of seafood to
consume. But, as the water quality deteriorated and there was some poisoning of
seafood, they turned in to victims. The same can be said of the urban population.
The relationship among the various stakeholder groups is defined. The world view that
governs economic groups is maintaining livelihoods and making profit. The government
offices are more concerned with regulation and management. The world view of the

MSc Thesis Sirak Robele Gari
69
scientists is sustainable utilization of natural resources. Therefore, concern about the
consequences of eutrophication forms the core of their worldview.
The group of scientists conducting this study and MESPRD are the owner of the policy
issue (eutrophication) and the world view about eutrophication is chosen to be that of
these owners. In assigning the roles to the stakeholders, the view of the scientists and
the Environment ministry is taken as a basis to give a context to the transformational
process of eutrophication. This is in consideration of the vast, objective knowledge and
understanding this group has on the phenomenon, the impartiality of its stand and the
position it has as a policy owner.
Table 4-5: CATWOE in the Ria Formosa, relative to eutrophication.
C Customer Beneficiaries
- Agriculturalists/Animal raisers
- Aquaculturists
- Tourists
Victims
- Anglers
- Tourists
- Aquaculturists
-Seafood consumers
A Actors Agriculturalists
Aquaculturists
Tourists
Urban Population
T Transformational Process Nutrient input leading to Eutrophication
W Weltanschaung Consequences of Eutrophication
O Owners MESPRD & Research Institutes
E Environmental constraints Climatic factors (Flood, Sunlight etc…)
4.2.2.1.4. Institutional map
SPICOSA-WP3 (2007) suggests the identification of the main property rights and
governance structure related to the policy issue and making institutional map. The
agricultural, fishery and aquaculture sectors belong mainly to private ownership but the
governance rests with MADRP, particularly to DRAP-Algarve. The environmental
governance is the domain of MESPRD and Nature Reserve. The Naval office, the DMS

MSc Thesis Sirak Robele Gari
70
and CPF are concerned with naval activities and port development. Tourism activities
are exercised by various tourism operators but regulated by DITT. Urban development
lies in the realm of the municipalities. Research and educational institutions (INAG,
UAlg, APRH etc...) play the roles of consultants on environmental issues.
Figure 4-24: Map of the stakeholder institutions.
As is evident in Fig. 4-24, the institutions under the central government and their
regional offices are regulatory bodies of the economic activities and environmental
aspects. They interact among themselves. The research and educational institutions,
acting in the capacity of consultants interact with the regulatory entities and among
themselves. Due to shortage of data, public institutions such as trade unions and
professional associations related to the economic activities are not included. In the
presence of these entities, interaction with the regulatory bodies and the consultancy
groups is obvious.

MSc Thesis Sirak Robele Gari
71
4.2.2.1.5. Economic activities
The major economic activities in the Ria Formosa are Agriculture and Livestock,
Aquaculture and Fishery, Tourism and Urbanization. Though data on the full economic
values of these activities in the Ria Formosa is unavailable, INE (2007) states that 9148
tons of cereals, 210,000 tons of citrus fruits, 15,824 tons of fresh fruits and 1785 tons of
nuts were produced in the Algarve region. As described in the previous chapters, the
total heads of livestock in Algarve ranges from 10,000 to 60,000 in 2008. About 5356
tons of aquaculture products were harvested from the Ria Formosa in 2005. More than 2
million tourists visit this region annually.
The negative externalities envisaged within the Ria Formosa are the costs associated
with loss of shellfish products caused by parasitic infection and benthic eutrophication
symptoms. Response costs, for instance, those of UWWTP construction also are
counted towards externalities. The latter cost was estimated by Nobre (2009) to be
€176M in 1980-99.
Several methods of economical valuation of ecosystem goods and services are used by
several environmental economists. Travel cost method; hedonic valuation and stated
preference are the common examples. In the absence of sufficient data, the value of
economic activities (Drivers) that depend on the ecosystem can be approximated
(Nobre, 2009). It gives the partial ecosystem value (PEV). In relation to the economic
analysis of management scenarios, cost-benefit analysis (CBA) will be used.

MSc Thesis Sirak Robele Gari
72
4.2.2.1.6. Policy issue
There are a number of multiple issues requiring attention in the Ria Formosa (e.g.
tourism, erosion, fishing, aquaculture, salt production, eutrophication, etc…). In this
study, it was not possible to go through all of the SAF’s steps of issue resolution due to
time limitation of the project. Therefore, eutrophication was chosen as an example to
show the usage of SAF for eutrophication management.
The symptoms of eutrophication have been reported to appear in the Ria Formosa.
Macro-algal growth, occasional appearance of toxic algal blooms and fluctuation in
oxygen concentration are among the symptoms. The symptoms are associated with
nutrient enrichment from the identified economic activities and UWWTP out lets. The
impacts of deteriorated water quality are revealed in fish kill, decrease in shellfish
production as well as shellfish and human poisoning due to HAB.
To add impetus to the collaborative process among the stakeholders to agreeing on
issues, assistance from European directives and treaties that have been transposed into
the country’s laws and regulations can be sought. Water Framework Directive (WFD),
the Nitrate Directive (ND) and Urban Waste Water Treatment Directive (UWWTD) are
among these.WFD aims to achieve European waters of good ecological quality by 2015.
The ND has the objective of reducing water pollution caused by nitrate from
agricultural sources. The UWWTD stipulates the provision of UWWT facilities to
urban areas based on population and the sensitivity of the receiving waters to
eutrophication.
Therefore, the issue for consideration was chosen to be eutrophication.

MSc Thesis Sirak Robele Gari
73
4.2.2.1.7. Scenarios
The main concern in the eutrophication of the Ria Formosa is nutrient load. So the
objective of the management should be nutrient reduction. Therefore, scenarios based
on the following policy options will serve this purpose:
Do nothing
Construction of UWWTPs of varying technical status. This includes from
primary to tertiary UWWTPs.
Installing Agricultural runoff management system (Constructed Wetland, Strip
cropping, Filter strips, Nutrient management).
Making AWMS of varying scale, capacity and type. Scale refers to AWMS on a
farm or at the community level. Capacity refers to the size of ponds to be
constructed, and type indicates whether the ponds are aerobic or anaerobic.
Using economic instruments (Polluters pay principle) is important management
option which encourages economic actors to treat their waste and initiate
nutrient trade.
Policies aimed at change of Drivers can also be considered. These could include,
for example, arresting urban development close to shores or decreasing areas of
finfish farming.
The views of different stake holders on the management options vary. For example, the
farmers and livestock raisers might be concerned with the cost and feasibility of
AWMS as well as with the economic instruments. Finfish farmers, besides the
economic instruments, might be worried about the reduction of finfish farming areas.
Discouragement of Golf course development could disconcert tourism operators

MSc Thesis Sirak Robele Gari
74
whereas arresting urbanization might worry municipalities. However, negotiation is the
key to overcome such concerns. The agriculturists and livestock raisers might be
encouraged by the prospect of turning waste in to money (selling manure as organic
fertilizers). Nitrogen trading could be a consolation to finfish aqua-culturist.
4.2.2.1.8. Indicators
The possible indicators of the success of the policy responses are the environmental
indicators of change in the Pressure and the State. So, the following indicators should be
selected:
Table 4-6: Selected indicators (Source: OECD, 1993, EEA, 1999, EEA, 2001)
Environmental Indicators
Pressure Indicator Nutrient Enrichment N,P,Si (Load)
State Indicator Nutrient Concentration N,P,Si
Organic Pollution BOD5
Algal Biomass Chl-a
Algal Abundance Cell count
Macro algal growth Area cover, % increase
Oxygen Concentration Dissolved Oxygen (DO)
Toxic Blooms Biotoxins, Cell count
Species composition Cell count
Water Transparency Turbidity, Secchi depth
Shellfish, Finfish Production Kg/Ton
4.2.2.2. System Definition
The extent of the Ria Formosa has already been described in the previous chapters. But
to put it very briefly, it extends to about 55 km in length and 6 km in width at its widest
point. It is a shallow mesotidal lagoon with natural biogeochemical cycles essentially
regulated by tidal exchanges. The lagoon is a true barrier island system, comprising
mainland, inlet deltas, and barrier islands. It covers 163 km2
of area 20 km2 of which are
occupied by salinas and aquaculture ponds.

MSc Thesis Sirak Robele Gari
75
The Ria Formosa is subject to eutrophication due to the four major economic activities
identified. Whereas fishery and aquaculture are practiced right in the lagoon, agriculture
and livestock are activities done outside of it. Finfish farming supplies nutrients to the
lagoon while shellfish farming both supply and removes nutrients from it. Agriculture
and livestock contribute the greatest share of nutrients to the lagoon. Tourism affects the
lagoon directly, for example, through boat trips (including bird watching), recreational
fishing and swimming; and indirectly by increasing pressures on the UWWTPs.
Urbanization likewise has a direct influence on the Ria Formosa by enriching it with
domestic sewage, sediments and construction debris, and indirect influence by
increasing the population of town centers. The increase in population is accompanied by
an increased food demand including seafood and an increased waste load.
The Ria Formosa is much affected by what is occurring outside of it, namely, by runoff
due to a few torrential streams and the perennial river Gilão, by increased tourist
population which augmented the load of waste. Urbanization exerts similar pressures on
the lagoon. It has important interactions with the coastal water with respect to tidal
flushing and nutrient exchange. Therefore, the catchment of the Ria Formosa around the
town centers and the Atlantic coast form its system boundary conditions.
4.2.2.3. Conceptual model
In the SPICOSA project conceptual models are constructed using the EXTEND
modelling software. However, in this study the software used to make the conceptual
model is Adobe Illustrator version CS4. SPICOSA states some of the reasons to use
EXTEND as its ability to turn conceptual models in to numerical models and for easy
communication among SSAs and other researchers by using the same modelling

MSc Thesis Sirak Robele Gari
76
software and symbols. However, the purpose of the present study is not to actually
formulate and run a numerical model, but to show that eutrophication can be managed
through SAF. So, as long as the conceptual model is sufficient to qualitatively convey
what is happening in the system and show relationships among the important
components of the system, it is considered sufficient.

MSc Thesis Sirak Robele Gari
77
Figure 4-25: Conceptual model of nutrient dynamics in the Ria Formosa.

MSc Thesis Sirak Robele Gari
78
4.2.2.4. Methods and Information requirement
Information about the Ria Formosa was obtained from published literature. The
literature includes scientific studies about the environmental and socio-economic
aspects of the lagoon, and statistical data published by the Institute of National Statistics
(INE).
SPICOSA-WP3 (2007) elaborates that for constructing mathematical equations from the
conceptual model, for solving these equations and to make a numerical simulation,
methods are needed. The standard method in the SPICOSA project is EXTEND.
Nevertheless, as the scope of this study does not stretch to the extent of making and
running a model, there was no need for choosing such methods. Instead, a few
mathematical models used by different modellers are shown to illustrate system
formulation.
4.2.2.5. Problem scaling
It is believed that the conceptual model corresponds to the actual coastal system and
includes all the necessary functionalities with respect to nutrient loading and
eutrophication. This does not mean, however, that iteration is excluded. Depending on
the level of information obtained on the lagoon and its boundary conditions the
conceptual model can be improved.
Effort has been exerted not to complicate or to oversimplify the conceptual model.
Appropriate scaling of the system and the scope of the task was crucial as the time and
resource constraints are limiting. So, the current conceptual model does not include all
the environmental and socio-economic features of the system but the major ones.

MSc Thesis Sirak Robele Gari
79
Conversely, it does not exclude the necessary environmental features, socio-economic
activities and stakeholders. Most importantly, the study does not make any attempt at
quantifying state variables by using models.
4.2.3. System Formulation
The conceptual model of the Ria Formosa can be formulated into a mathematical model
by incorporating the necessary inputs in to the model. The features needed for
evaluation of the system through modelling are nutrient loading. Algal biomass and
abundance; Dissolved oxygen concentration and saturation as well as species
composition (biodiversity) are among the important features. The actions of grazers,
tidal exchange and residence time can also be included, for they influence the extent of
eutrophication by acting as filters. The sedimentation and re-suspension also have a
considerable significance in the nutrient dynamics. These features belong to the
ecological and physical aspects of the Ria Formosa.
For determination of nutrient loading; flow rate of runoff in to the system and nutrient
concentration in the runoff are the necessary inputs. The evaluation of algal biomass
needs parameters such as light, nutrient and algal growth rate as inputs. Grazing rate
and hydrodynamic characteristics of the lagoon (tidal range, flushing volume) are the
necessary inputs for the determination of the influences of filters on eutrophication.
Sedimentation and re-suspension rates are parameter inputs for simulation of sediment
dynamics.
With respect to socio-economic aspects, economic activities in the system such as
aquaculture and fishery, that part of tourism which has a direct impact on the system

MSc Thesis Sirak Robele Gari
80
(recreational boating, swimming and fishing) should be considered. Agriculture,
urbanization and waste production from tourism that act on the system boundaries as
well as employment and impact on human health are included. But care must be taken
not to clutter the model which renders it unnecessarily complex. The outputs of the
evaluation are envisaged to be management options that will be suggested to policy
makers.
The necessary equations and symbols to be used in the simulation model are chosen and
adopted in this step. Some symbols mentioned by SPICOSA are shown here (Fig. 4-26).
Figure 4-26: Symbols used in some graphic software (SPICOSA-WP4, 2009).
State Variable
Action, Influence
Parameter
Indicator
Forcing function
Flux, Flow rate
Mathematical function
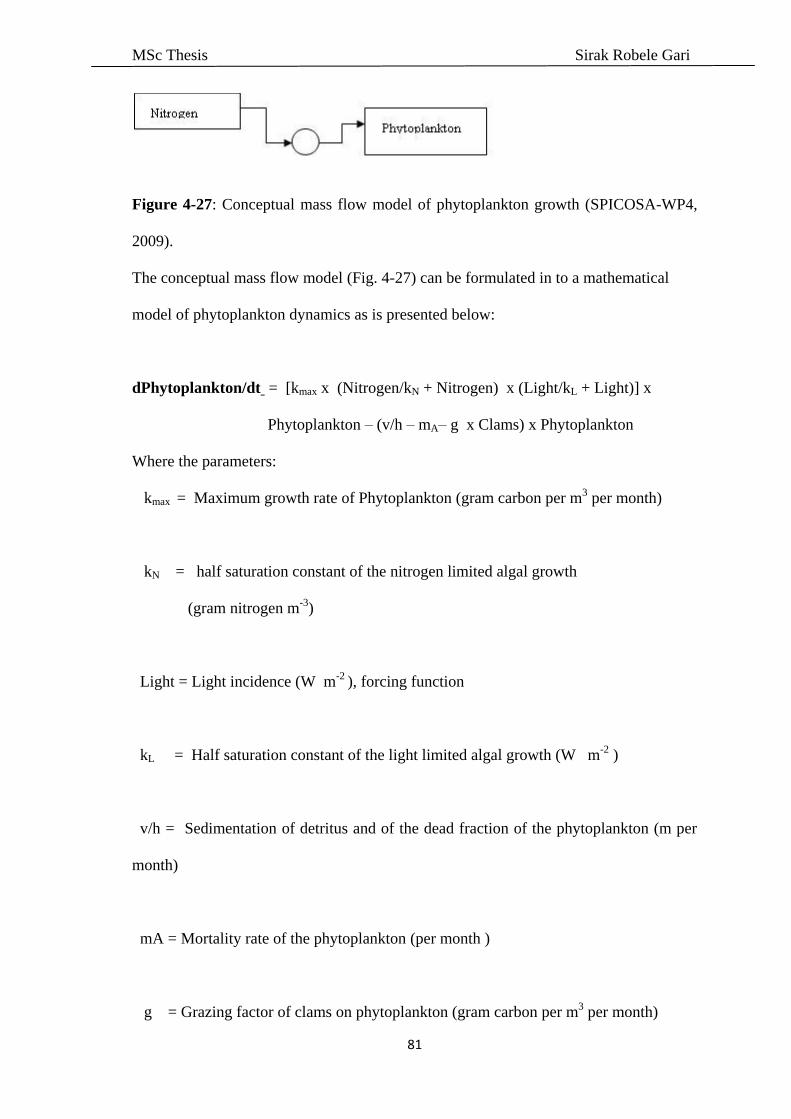
MSc Thesis Sirak Robele Gari
81
Figure 4-27: Conceptual mass flow model of phytoplankton growth (SPICOSA-WP4,
2009).
The conceptual mass flow model (Fig. 4-27) can be formulated in to a mathematical
model of phytoplankton dynamics as is presented below:
dPhytoplankton/dt = [kmax x (Nitrogen/kN + Nitrogen) x (Light/kL + Light)] x
Phytoplankton – (v/h – mA– g x Clams) x Phytoplankton
Where the parameters:
kmax = Maximum growth rate of Phytoplankton (gram carbon per m3 per month)
kN = half saturation constant of the nitrogen limited algal growth
(gram nitrogen m-3
)
Light = Light incidence (W m-2
), forcing function
kL = Half saturation constant of the light limited algal growth (W m-2
)
v/h = Sedimentation of detritus and of the dead fraction of the phytoplankton (m per
month)
mA = Mortality rate of the phytoplankton (per month )
g = Grazing factor of clams on phytoplankton (gram carbon per m3 per month)

MSc Thesis Sirak Robele Gari
82
After formulation of the mathematical model, Fig. 4-27 can be updated as in Fig. 4-28
below:
Figure 4-28: Updated conceptual mass flow model of phytoplankton growth
(SPICOSA-WP4, 2009)
The ecological and economic sub systems then are linked. van den Bergh et al., (2006)
stated that ecological- economic models usually describe a causal chain between socio-
economic drivers that cause physical or ecological changes through polluting or
resource harvesting (Cited in : SPICOSA-WP4,2009). So, a change in a socio-economic
variable is linked to a change in physical variables; then the changes in the ecological
system provide a feedback to the socio-economic system (SPICOSA-WP4, 2009). van
den Bergh (2006, Cited in: SPICOSA-WP4,2009) further provides example of fisheries
management in which fish catch reduces a fish stock which increases the harvest costs.
The benefits derived from the major socio-economic activities in the Ria Formosa and
the costs on the ecosystem due to negative externalities can be quantified by coupling
ecological and economic subsystems. Several material and energy flows exist between
the ecological and economic subsystems in the Ria Formosa. Fisheries and aquaculture
directly extract biological resources in the lagoon. Tourism and Urbanization likewise

MSc Thesis Sirak Robele Gari
83
exert direct and indirect pressures on it. This utilization of resources (seafood,
recreation) enriches the lagoon, in return, with nutrients and sediments. Agriculture
draws on the lagoon water and supplies nutrients to the system.
The added value, revenues, employment and social welfare in general are the benefits
whereas expenses incurred to remediate the deteriorated water quality, decreased
production in aquaculture, loss of ecosystem goods and services are the costs. These are
some of the inputs needed to model a coupled ecological-economic system.
SPICOSA-WP4 (2009) provided a pertinent example on economic-ecologic linkage that
serves as an example for the interaction between these two sub-systems (Fig. 4-29).
Figure 4-29: Feedback loops of Ecological-Economic models (Adapted from
SPICOSA-WP4, 2009).
The economic and ecological systems show the flow of money and carbon respectively.
At two points, flows cross the interdisciplinary model borders; the money flow enters
Clam biomass
Production
+

MSc Thesis Sirak Robele Gari
84
the ecological subsystem where the infrastructure (the value of which can be
represented in money) exerts a pressure on the clam biomass. The converter is
efficiency to grow clams, the rate at which clam biomass increases. In the same manner,
the carbon flow enters the economic model when clam biomass (ton of clams) is
converted to money. The converter in this case is the price per ton of clams. A
mathematical model is formulated out of this relationship. More elaborated economic
feedback loop and updated conceptual model are also presented in the figures below
(Figures 4-30 and 4-31) to serve as examples of formulation of economic models.
Figure 4-30 Economic feedback loop of clam farm (Adapted from SPICOSA-WP4,
2009)
The mathematical model:
dInfrastructure/dt = (k1 X Turnover - k2 X Infrastructure) - Infrastructure/L
Where: k1= Tax rate (%)
k2 = Employment per unit infrastructure.
L = Lifespan of infrastructure.
The mathematical model was updated in to the following conceptual model indicating
the iterative nature of the systems approach.
+
Production
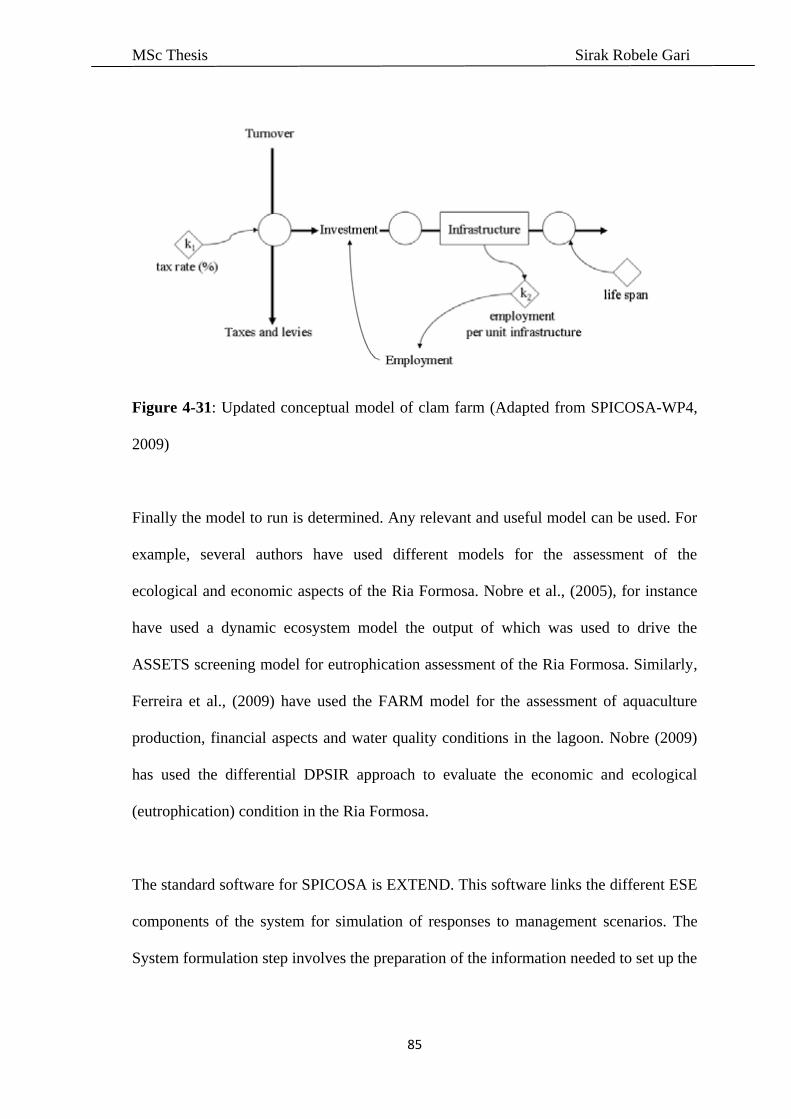
MSc Thesis Sirak Robele Gari
85
Figure 4-31: Updated conceptual model of clam farm (Adapted from SPICOSA-WP4,
2009)
Finally the model to run is determined. Any relevant and useful model can be used. For
example, several authors have used different models for the assessment of the
ecological and economic aspects of the Ria Formosa. Nobre et al., (2005), for instance
have used a dynamic ecosystem model the output of which was used to drive the
ASSETS screening model for eutrophication assessment of the Ria Formosa. Similarly,
Ferreira et al., (2009) have used the FARM model for the assessment of aquaculture
production, financial aspects and water quality conditions in the lagoon. Nobre (2009)
has used the differential DPSIR approach to evaluate the economic and ecological
(eutrophication) condition in the Ria Formosa.
The standard software for SPICOSA is EXTEND. This software links the different ESE
components of the system for simulation of responses to management scenarios. The
System formulation step involves the preparation of the information needed to set up the

MSc Thesis Sirak Robele Gari
86
Simulation Model and accompanying Interpretative Analyses (SPICOSA-WP4, 2009)
by making use of this model and other models if needed.
4.2.4. System Appraisal
System appraisal involves construction of the simulation model which incorporates the
ecological, social and economic models (ESE) and run simulation of scenarios resulting
from management responses. The results of the simulations, then, are documented and
interpretatively analysed. The system appraisal has sequential activities (Fig. 4-32).
Since it will be unduly detailed to elaborate all the activities, some of the important ones
are summarily described. It is the responsibility of the study team to follow minutely the
sequential activities during the actual study.
Figure 4-32: Appraisal sequence trajectories (Adapted from SPICOSA-WP5, 2009).
First, reviewing the actions taken in the System formulation step is an important
measure. This ensures that the functional representation of the virtual system is focused
on the simulation and information output of the selected scenarios and no major aspect
of the scenarios are missing. Second, since the chosen software EXTEND cannot

MSc Thesis Sirak Robele Gari
87
execute all the necessary tasks of the simulation process, seeking complementary or
supplementary assistance from other models is necessary. So, the results of other
models can be used as inputs, or dynamic linkage between other models and EXTEND
can be made. Moreover, other models could generate results to the output independently
of EXTEND in areas where it is inefficient. Third, though the ESE models are tested,
calibrated and validated in System formulation step, they might require some adaptation
when running the scenario simulation. This means running the ESE models has
significant role in refining the simulation process.
The individual ESE components have interactions among them. So, the Simulation
model is constructed by coupling them. According to SPICOSA-WP5 (2009) system
models with unilateral interactions may be ecologically oriented in which the model
focuses on the changes in the ecological subsystem caused by the economic subsystem.
They could also be economically oriented in which the ecological subsystem provides
inputs for the economic subsystem. In the Ria Formosa the first coupling seems more
pertinent because the study focuses more on the changes in the lagoon caused by the
economic activities.
The important task in linking the three components is finding appropriate linking
variable. It is by means of this link that the Simulation model is constructed. Figure 4-
33 shows how ESE component models can be linked.

MSc Thesis Sirak Robele Gari
88
Figure 4-33: Simple model demonstrating direct links between ecologic, economic and
social components. (Adapted from SPICOSA-WP5, 2009).
The linking variable Nutrient release (load) originates from fertilizer use and is a
pressure produced by the employed people in the agricultural activities who use
fertilizers. Nutrient release has effects on the Lagoon. So this variable links the three
components of the Simulation model.
Verification, validation and sensitivity test of the Simulation model ensures that the
system is represented by the model as closely as possible. The next step is running the
model using the selected management options. SPICOSA-WP5 (2009) identifies three

MSc Thesis Sirak Robele Gari
89
areas of scenarios; Public policy, Natural events and interactions between nature and
society and suggests to evaluate the feasibility of scenarios. So, our scenarios belong to
the first and the third categories and they are feasible and address the issue.
Once the simulation has been done the results are documented for further treatment. The
treatment includes evaluation of their effectiveness in capturing information that can be
passed on to policy .The need whether to modify them and why so do is also to be
considered. The acceptance of the results by the stakeholders, and the ability of the
scenarios to provide sufficient prognostic answers relative to the issue are important
points which call for consideration.
4.2.5. System Output
This is the final step in the SAF protocol. It involves the preparation of the output
package and disseminating it to the concerned stakeholders (In various formats)
including those on the position of policy making. It contains an important part of
deliberation among the stakeholders on the results obtained in the previous steps.
SPICOSA-WP6 (2009) suggests the following steps (Fig 4-34) for preparation of
Science-Policy consultation and deliberation.

MSc Thesis Sirak Robele Gari
90
Figure 4-34: System Output steps; Adapted from SPICOSA-WP6 (2009)
The Deliberation Forum provides an opportunity for the stakeholders to understand the
extent and consequences of eutrophication in the Ria Formosa. This will enable them to
make decisions and implement it to arrest this environmental problem.
4.2.5.1. Recapitulation
What have been done in the previous steps should be explained to the stakeholders to
increase transparency. In our case the chosen policy issue (eutrophication), the virtual
system, i.e. the Ria Formosa with its catchment and the coast, its economic and social
components must be highlighted. The formulation of the conceptual model in to
mathematical/numerical model, the possible scenarios and indicators of the success of
the policy options as well as the linked ESE model should be explained as clearly as
possible. Care must be taken not to make this recapitulation process either too complex
or too simple.

MSc Thesis Sirak Robele Gari
91
4.2.5.2. Presenting and Running Scenarios
Presenting scenarios makes stakeholders aware of the different alternatives for the
future and help them make decisions (SPICOSA-WP6, 2009). So the chosen policy
options will be presented and explained regarding their advantages and possible
shortcomings. Additionally transparency is increased by exposing the limitations of the
models and calling for their improvement. Uncertainties regarding the values of
economic goods and services and the causes are explained.
Having run the scenarios, results are recorded. The outcomes are then compared with
the current values. Presentations of the results should correspond to the levels of
understanding and background of the audience. So modification of the information
according to the stakeholders might be necessary. The information presented should be
free of bias and value judgment. For example, a decrease in fish landings may be
regarded positively by an ecologist because it means less pressure on the ecosystem,
whereas it is disastrous for a fisherman because it means loss of livelihood (SPICOSA-
WP6, 2009). Therefore the results obtained in the simulation of scenarios must be
presented as scientific information for discussion by the stakeholders including
managers and policy makers.
4.2.5.3. Conducting deliberations
Through a deliberation process stakeholders are able to scrutinize and change their
preference as a result of persuasions by other participants (SPICOSA-WP6, 2009).
Deliberation includes exploration of technical alternatives, for example, construction of
UWWTPs and establishment of AWMS of different technical specifications, in the case
of our scenarios. The implementation costs, long-term benefits and trade-offs associated
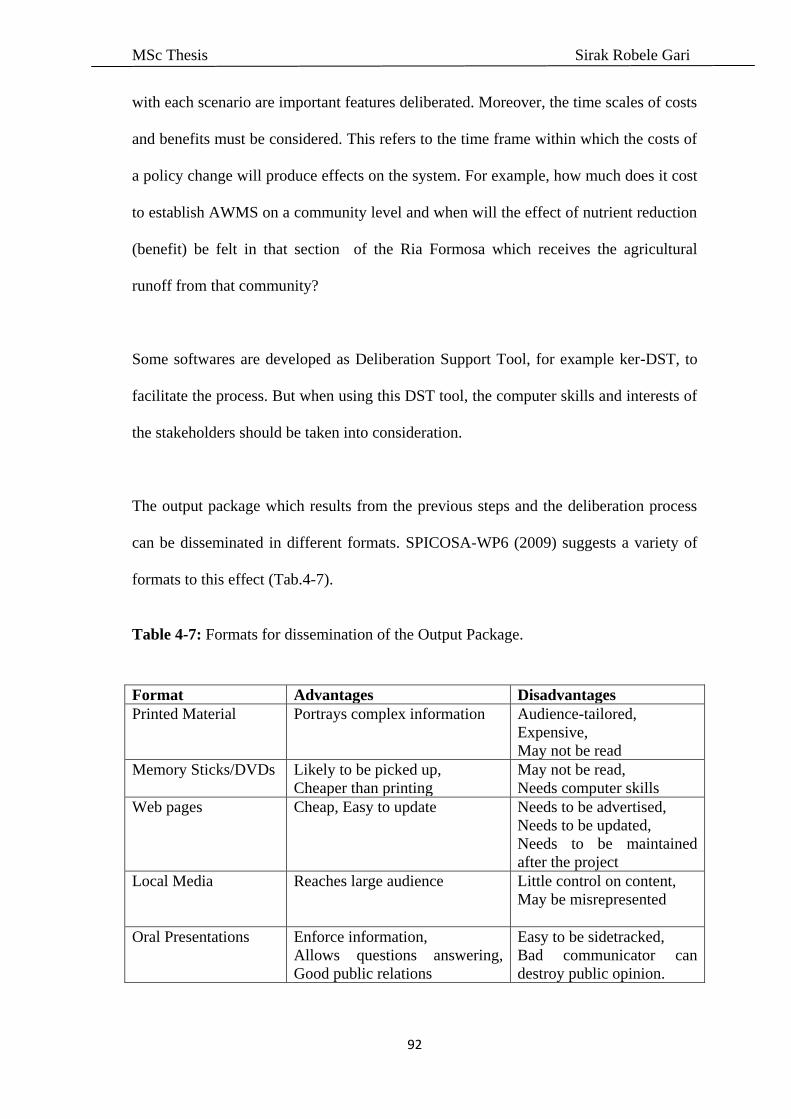
MSc Thesis Sirak Robele Gari
92
with each scenario are important features deliberated. Moreover, the time scales of costs
and benefits must be considered. This refers to the time frame within which the costs of
a policy change will produce effects on the system. For example, how much does it cost
to establish AWMS on a community level and when will the effect of nutrient reduction
(benefit) be felt in that section of the Ria Formosa which receives the agricultural
runoff from that community?
Some softwares are developed as Deliberation Support Tool, for example ker-DST, to
facilitate the process. But when using this DST tool, the computer skills and interests of
the stakeholders should be taken into consideration.
The output package which results from the previous steps and the deliberation process
can be disseminated in different formats. SPICOSA-WP6 (2009) suggests a variety of
formats to this effect (Tab.4-7).
Table 4-7: Formats for dissemination of the Output Package.
Format Advantages Disadvantages
Printed Material Portrays complex information Audience-tailored,
Expensive,
May not be read
Memory Sticks/DVDs Likely to be picked up,
Cheaper than printing
May not be read,
Needs computer skills
Web pages Cheap, Easy to update Needs to be advertised,
Needs to be updated,
Needs to be maintained
after the project
Local Media Reaches large audience Little control on content,
May be misrepresented
Oral Presentations Enforce information,
Allows questions answering,
Good public relations
Easy to be sidetracked,
Bad communicator can
destroy public opinion.

MSc Thesis Sirak Robele Gari
93
Concluding the deliberation process does not mean the end of the Science-Policy
interaction. The outcome of the deliberation will then be used as a feedback to the
system design step. Since SAF is a self-evolving research and assessment methodology,
the dialogues continue in an interactive way. This ensures the ever developing
characteristics of the systems approach framework. Every new piece of information
adds up to the knowledge about the ESE components of the system and consolidates
ICZM.
MSc Thesis Sirak Robele Gari
94
5. Discussion
A decreasing trend of nutrient load (Pressure) in to the Ria Formosa is observed (Fig 4-
18). This might be due to a shift of Drivers in Algarve from the agricultural sector,
which is most important as nutrient source, to services and commerce sector with less
release of nutrients. The Nitrate and UWWT directives as well as the discouragement
on the use of Phosphate detergents might be responsible for this trend. But still, 70% of
detergents in Portugal contain phosphate (Wind & Henkel, 2007). The role of
UWWTPs in reducing the overall load may be considerable. This is especially true
when considering the P contribution from detergents in the raw sewage is about 43%
(Wind & Henkel, 2007). However, Portugal’s rank in complying with EU-UWWTD is
among the lowest. For instance the country’s compliance with more stringent waste
treatment was only 13% whereas that of Germany and Netherlands was 100% (CEC,
2009). Similarly, while its compliance with the waste collecting system is 95%, it is
only 41% regarding secondary treatment requirements (CEC, 2009).
The Ria Formosa cannot be considered a eutrophied system as a whole. Except for the
inner parts of the lagoon where flushing is low and at localities where the UWWTPs
release their effluent as well as the eastern parts where agricultural runoff enters, it does
not show signs of eutrophication. This may be due to its short residence time and good
flushing in which 50-75% of the lagoon’s water is exchanged with that of the ocean.
The role of filter feeders has also an important role in checking on the phytoplankton
community. However, with the present release of nutrients which produced
concentrations in the lagoon higher than the EEA’s threshold value, it could potentially
be eutrophied. This is especially true if anything that increases the residence time and

MSc Thesis Sirak Robele Gari
95
decreases the flushing rate materializes, such as the closure or the reduction of the
inlets.
The ecological impacts are revealed in massive clam mortality, fish kills and appearance
of HAB. Human poisoning, possible loss of jobs, an employment shift from the primary
sector to the tertiary sectors, lowered clam production and fish catch are some examples
of the socio-economic impacts. Though there is a recovery in clam production, the
earlier responses might not be enough as the recovery attained is only a bit higher than
half of its previous value. This calls for more efficient and stronger responses.
Since the scope of the study was limited to indicating the way how different
management options could be found for the management of eutrophication problem in
the Ria Formosa and consequently anywhere in the world by making use of the DPSIR
and SAF approaches, practical exercise had little role. This is particularly true in the
System formulation, System appraisal and System output steps of SAF. The duration of
the study was the limiting factor in this case. Moreover, it should be noted that the four
SAF steps are not a one-man job. They were conceived to be implemented by several
teams comprising multidisciplinary experts.
Data on the economic value of the Drivers particularly in the Ria Formosa were
insufficient. Some data gap could have been narrowed if interviews with actors of the
socio-economic activities were made. As the application of DPSIR and SAF were more
of theoretical than practical, some assumptions have been made and examples are
provided to illustrate the process.
What might be considered a limitation of DPSIR is that its Driver component is entirely
concerned with anthropogenic causes of eutrophication and disregard natural causes. So
a way must be found to expand the framework to accommodate the natural drivers.

MSc Thesis Sirak Robele Gari
96
After all, the framework developed through time from S-R to PSR to DPSIR. DPSIR
can be either a fine or a clumsy tool for environmental assessment depending on the
level of knowledge about the issue at hand and the system under consideration.
The SAF protocol is still a developing approach and needs more refining. Identification
of stakeholders comes prior to identification of economic activities. But since economic
activities are more obvious and easier to identify, their identification must come earlier.
Since each economic activity has actors, the task of stakeholder mapping becomes
simpler once the economic activities are identified. The standard model EXTEND
might need some more refining to reduce dependency on auxiliary models.
The objective of the study is sufficiently fulfilled as it was possible to show how the
two approaches could be used for responding to the policy issue- Eutrophication. The
approaches could be refined and adapted to fit the particular system under study when
they are actually implemented. This proves the ever-evolving nature of the methods.

MSc Thesis Sirak Robele Gari
97
6. Conclusion
DPSIR and SAF can be used as tools for the management of eutrophication in any part
of the world with the necessary modifications on the basis of resources and system
characteristics. In applying these approches, the limitations inherent in them should
have adequate consideration for overcoming them. For the use of DPSIR in
eutrophication management, a sound knowledge of the current conceptual model of
eutrophication and the system characteristics is necessary.
The highlighted limitations of DPSIR such as its inability to create good
communications among researchers, stakeholders and policy makers, as well as its
unsatisfactory ways of dealing with the multiple attitudes and definitions of issues by
stakeholders may be corrected by SAF. This is because SAF’s strong feature is
provision of interface between science and policy, hence providing a means for
permanent communication among researchers, stakeholders and policy makers. This
suggests that a hybrid approach may be more effective.
Though the standard modelling software used in the System Approach Framework of
the SPICOSA project is EXTEND, it does not preclude the use of other models. So in
applying SAF somewhere else, other appropriate models can be used. It would also be
appropriate to develop a better model, in line with the quest of science to ever improve.

MSc Thesis Sirak Robele Gari
98
7. References
Aguas Do Algarve. (2009). "Águas do Algarve inaugurates Station Wastewater
Treatment Faro West ", from www.aguasdoalgarve.pt. 1pp
AlgarveMais, I. p. from http://www.algarvemais.com/index.php.8pp.
Aliaume C., D. C. T., Viaroli P., Zaldívar J. M. (2007). "Coastal lagoons of Southern
Europe: recent changes and future scenarios. ." Transitional Waters Monograph 1: 1-12.
Aubry, A., Elliot,M. (2006). "The use of environmental integrative indicators to assess
seabed disturbance in estuaries and coasts: Application to the Humber Estuary, UK."
Marine Pollution Bulletin. 53: 175-185.
Azevedo, C. (1989). "Fine structure of Perkinsus atlanticus n. sp. (Apicomplexa,
Perkinsea) parasite of the clam Ruditapes decussatus from Portugal." J. Parasitol 75:
627–635.
Bebbiano, M. J. (1995). "Effects of pollutants in the Ria Formosa Lagoon, Portugal."
The Science of the Total Environment 171: 107-115.
BI, B. I. (2009). "BirdLife IBA Factsheet "
http://www.birdlife.org/datazone/sites/index.html?action=SitHTMDetails.asp&sid=377
&m=0. 2pp.
Bidone, E. D., Lacerda,D. (2004). "The use of DPSIR framework to evaluate
sustainability in coastal areas. Case study: Guanabara Bay basin, Rio de Janeiro,
Brazil." Regional Environmental Change 4: 5-16.
Borja, A., Galparsoro,I., Solaun,O., Muxika,I., Tello,E.M., Uriarte,A., Valencia,V.
(2006). "The European Water Framework Directive and the DPSIR, a methodological
approach to assess the risk of failing to achieve good ecological status." Estuarine,
Coastal and Shelf Science . 66: 84-96
Bricker, S. B., Ferreira,J.G, Simas,T (2003). "An integrated methodology for
assessment of estuarine trophic status." Ecological Modelling. 169: 39-60.
Campos, C. J. A., Cachola,R.,A. (2006). "The introduction of the Japanese Carpet
Shell in coastal lagoon systems of the Algarve (south Portugal): a food safety concern
(Short communication)." Internet Journal of Food Safety 8: 1-2.
Carr, E. R., Wingard,P.M.,Yorty,S.C.,Thompson,M.C.,Jensen,N.K.,Roberson,J. (2007).
"Applying DPSIR to Sustainable Development." International Journal of Sustainable
Development & World Energy 14: 543-555.
CEC (2009). ―5th Commission Summary on the Implementation of the Urban Waste
Water Directive.‖ Commission Staff Working Document SEC (2009) 1114 final.
Brussels, Commission of the European Communities: 23pp.

MSc Thesis Sirak Robele Gari
99
Chícharo, L., Gaspar, M.B. , Vafidis, D., Marin, M.G., da Ros, L., Pellizato, M.,
Labarta, U., Reiriz, M-J., Chícharo, M.A (2008). "Impact of Bivalve fisheries in the Ria
Formosa Lagoon (Portugal), Venice Lagoon (Italy) and Aegean Sea (Greece): An
integrated overview." ICES CM 2001/J:08. 30pp.
Cloern.J.E. (2001). "Our evolving conceptual model of the coastal eutrophication
problem." Marine Ecology Progress Series. 210: 223-253.
C. O. E.C (1991). ―Council Directive 91/271/EEC of 21 May 1991 concerning urban
waste-water treatment‖. The Council of the European Communities: from http://eur-lex.europa.eu/LexUriServ/LexUriServ.do?uri=CELEX:31991L0271:EN:HTML :7pp
Coelho, M. R., Bebbianno,M.J.,Langston,W.J (2002). "Organotin levels in Ria Formosa
lagoon,Portugal." Applied Organometallic Chemistry. 16: 384-390
Cristina, S., Ana Sequeira, Newton.A, Ferreira,J.G, Icely,J,D (2008). "ECASA Study
Site Report Ria Formosa Coastal Lagoon,Portugal." IMAR.52pp.
Cummins, V., O Mahony, C., Connolly, N. (2003.). Review Of Integrated Coastal Zone
Management & Principles Of Best Practice., Coastal and Marine Resources Centre:
Environmental Research Institute University College Cork Ireland. 84pp.
Dias, J. M., Sousa,M.C. (2009). "Numerical modelling of Ria Formosa tidal dynamics."
Journal of Coastal Research 56: 1345-1349.
Duarte, P., Azevedo,B., Ribeiro,C., Pereira,A.,Falcão,M.,Serpa,D., Bandeira,R., Reia,J.
(2006). Scenario Analysis in Ria Formosa with EcoDynamo. EESD project EVK3-CT-
2002-00084: : 33pp.
Duarte , P., Azevedo, B., Guerreiro, M., Ribeiro, C., Bandeira, R., Pereira, A., Falcão,
M., Serpa , D., Reia, J. (2008). "Biogeochemical modelling of Ria Formosa (South
Portugal)." Hydrobiologia ( 611): 115–132.
Edwards, V., Icely,J., Newton,A., Webster,R. (2005). "The yield of chlorophyll from
nitrogen: a comparison between the shallow Ria Formosa lagoon and the deep oceanic
conditions at Sagres along the southern coast of Portugal." Estuarine, Coastal and Shelf
Science 62: 391-403.
.
EEA (1991). Urban Waste Water Treatment Directive. E. Union.7pp.
EEA (1995). Europe’s Environment: the Dobris Assessment. Copenhagen.
EEA (1999). Nutrients in European Ecosystems. Environmental Assessment Report No.
4. T. N, European Environment Agency.: 156pp.
EEA (2001). "Eutrophication in Europe’s coastal waters." Topic report 7. 86pp.
MSc Thesis Sirak Robele Gari
100
Estevens, A., Barroqueiro,M. (2004). A Sub-Region with peri-urban Characteristics or
the Emergence of sustainable and alternative medium-sized City? The case of Faro and
its surrounding municipalities. 40th ISoCaRP Congress. Faro. 10pp.
Falcão, M., Vale,C.,(1990). "Study of the Ria Formosa ecosystem: benthic nutrient
remineralization and tidal variability of nutrients in the water. " Hydrobiologia(207):
137-146.
Falcão, M. V., C. (2003). "Nutrient dynamics in a coastal lagoon (Ria Formosa,
Portugal): The importance of lagoon–sea water exchanges on the biological
productivity." Ciencias Marinas 29(3): 425-433.
FAOSTAT. (2007). "Food and Agricultural commodities production." from
http://faostat.fao.org/DesktopDefault.aspx?PageID=339&lang=en&country=174 . 2pp.
Fassetta, G. A., Bertrand,F, Costa,S., Davidson,R (2006). "The western lagoon marshes
of the Ria Formosa (Southern Portugal): Sediment-vegetation dynamics, long-term to
short-term changes and perspective." Continental Shelf Research 26: 363-384.
Ferreira,J.G.,Abreu,P.F.,Bettencourt,A.M.,Bricker,S.B.,Marques,J.C.,Melo,J.J,Newton,
ANobre,A.,Patricio,J.,Rocha,F.,Rodrigues,R.,Salas,F.,Silva,M.C.,Simas,T.,Soares,
C.V., Stacey, P.E., Vale, C., de Wit, M., Wolff, W.J. (2006). Monitoring Plan for
Portuguese coastal waters. Water Quality and Ecology.164pp.
Ferreira, J. G., Hawkins, A.J.S., Bricker, S.B. (2007). "Management of productivity,
environmental effects and profitability of shellfish aquaculture — the Farm Aquaculture
Resource Management (FARM) model." Aquaculture 264: 160-174.
Ferreira , J. G., Sequeira ,A., Hawkins,A.J.S., Newton,A., Nickell,T.D., Pastres, R.,
Forte,J.. Bodoy, A., Bricker,S.B. (2009). "Analysis of coastal and offshore aquaculture:
Application of the FARM model to multiple systems and shellfish species."
Aquaculture 289: 32-41.
Gamito, S. (1997). "Sustainable management of a coastal lagoonal system (Ria
Formosa, Portugal): An ecological model for extensive aquaculture " International
Journal of Salt Lake Research. 6(2): 145-173.
Gowen, R. J., Tett, P., Jones, K.J (1992). "Predicting marine eutrophication: the yield of
chlorophyll from nitrogen in Scottish coastal waters." Marine Ecology Progress Series
85: 153–161.
Heyligon, F. (1998). ―Basic Concepts of the Systems Approach‖ from
http://cleamc11.vub.ac.be/REFERPCP.html. 5pp.
Hubert, F. N., Pellaud,M., Sofia Gamito,S. (2007). " Environmental effects of marine
fish pond culture in the Ria Formosa (Southern Portugal). ." Hydrobiologia 555: 289-
297.

MSc Thesis Sirak Robele Gari
101
INE (2003). Statistical year book of Algarve. P. N. S. Institute. Lisbon.
INE (2004). Statistical year book of Algarve. P. N. S. Institute. Lisbon.
INE (2005). Statistical year book of Algarve. P. N. S. Institute. Lisbon.
INE (2006). Statistical year book of Algarve. P. N. S. Institute. Lisbon.
INE (2007). Statistical year book of Algarve,P. N. S. Institute. Lisbon.
INE (2008). Tourism Statistics 2008 ,P. N. S. Institute. Lisbon.
Klotz, S. (2007). "Drivers and Pressures on Biodiversity in Analytical Frameworks."
Environmental Science and Technology (25): 252-262.
Koundri, P., Karousakis,K., Assimacopoulos,D.,Jefferey,P.,Lange,M.eds (2006). Water
management in arid & semi arid regions: Interdisciplinary perspective, Edward Elgar
Pub.Ltd. United Kingdom.
Leite, R. B., Afonso, R., Cancela,M.L. (2004). "Perkinsus sp. infestation in carpet-shell
clams,Ruditapes decussatus (L), along the Portuguese coast. Results from a 2-year
survey." Aquaculture. 240: 39-53.
Leote, C., Ibanez J.S.,Rocha, C. (2008). "Submarine Groundwater Discharge as a
nitrogen source to the Ria Formosa studied with seepage meters." Biogeochemistry 88:
185-194.
Loureiro, S., Newton,A., Icely,J. (2005) ―Effects of nutrient enrichments on primary
production in the Ria Formosa coastal lagoon (Southern Portugal).). Hydrobiologia 550:
29-45.
Loureiro, S., Newton ,A., Icely,J. (2006). "Boundary conditions for the European Water
Framework Directive in the Ria Formosa lagoon, Portugal (physico-chemical and
phytoplankton quality elements)." Estuarine, Coastal and Shelf Science 67: 382-398.
Loures, L., Santos,R.,Panagopoulos,T. (2007). "Urban Parks and Sustainable City
Planning - The Case of Portimão, Portugal." WSEAS Transactions on Environment and
Development 3(10): 171-180.
MADRP, P. M. o. A., Rural Development and Fisheries. (2007). Agriculture, Forestry
and Fisheries indicators: 89pp.
Maxim, L., Spangberg,J.H., O’Connor,M (2009). "An analysis of risks for biodiversity
under the DPSIR framework." Ecological Economics 1-12.
MEA, M. E. A. (2003). "Ecosystems and Human Well-Being: A Framework for
Assessment." 25pp.

MSc Thesis Sirak Robele Gari
102
Mudge, S. M., Bebianno, M.J (1997). "Sewage contamination following an accidental
spillage in the Ria Formosa, Portugal." Marine Pollution Bulletin. 34(3): 163-170.
Mudge, S. M., East, J.A.,Bebianno,M.J.,Barreira,L.A (1998). "Fatty acids in the Ria
Formosa Lagoon, Portugal." Organic Geocheistry. 29(4): 963-977.
Mudge, S. M., Icely,J.D, Newton,A. (2007). "Oxygen depletion in relation to water
residence times." Journal of Environmental Monitoring 9: 1194-1198.
Murray, L. G., Mudge,S.M, Newton,A. Icely,J.D (2006). "The effect of benthic
sediments on dissolved nutrient concentrations and fluxes." Biogeochemistry . 81: 159-
178.
NationMaster.com. (2002). "Fertilizer consumption in metric tones (2002) by country."
from http://www.nationmaster.com/graph/agr_fer_con_met_ton_percap-consumption-
metric-tons-per-capita&date=2002. 5pp.
Newton, A., Icely, J.D.,Falcao,M., Nobre,A., Nunes,J.B, Ferreirad,J.G., Vale, C.
(2003). "Evaluation of eutrophication in the Ria Formosa coastal lagoon, Portugal."
Continental Shelf Research. 23: 1945-1961.
Newton, A., Mudge, S.M . (2003). "Temperature and salinity regimes in a shallow,
mesotidal lagoon,the Ria Formosa, Portugal." Estuarine, Coastal and Shelf Science. 57:
73-85.
Newton, A., Mudge,S.M. (2005). "Lagoon-sea exchanges, nutrient dynamics and water
quality management of the Ria Formosa (Portugal)." Estuarine, Coastal and Shelf
Science 62: 405-414.
Newton, A., Icely,J.D (2006). "Oceanographic Applications to Eutrophication in Tidal,
Coastal Lagoons: the Ria Formosa, Portugal." Journal of Coastal Research. 39: 1346 –
1350.
Newton, A.,Oliveira, P.S., Icely, J.D., Foster, P.A. (2009). "Monitoring of oxygen
condition in the Ria Formosa coastal lagoon, Portugal." Journal of Environmental
Monitoring 12: 355-360.
Nixon, S. W. (1995). "Coastal marine eutrophication: a definition, social Causes and
future concerns." Ophelia. 41: 199-219.
Nobre, A. M., Ferreira,J.G., Newton,A.,Simas,T.,Icely,J.D.,Neves,R. (2005). "
Management of coastal eutrophication: Integration of field data, ecosystem-scale
simulations and screening models." Journal of Marine Systems 56: 375-390.
.

MSc Thesis Sirak Robele Gari
103
Nobre, A. M. (2009). "An Ecological and Economic Assessment Methodology for
Coastal Ecosystem Management." Environmental Management 44: 185-204.
OECD (1993). OECD Core set of indicators for environmentl performance reviews.
Environment monograms No 83. Paris, Organization for Economic Co-operation and
Development: 39pp.
Pacheco. A, C., A.R., Vila-Concejoa,A., Ferreira, O. Dias, J.A. (2007). "A coastal
management program for channels located in backbarrier systems " Ocean & Coastal
Management 50: 119-143.
Pereira, A., Duarte,P (2006). " Development of an information technology tool for the
management of Southern European lagoons under the influence of river-basin runoff
" (DITTY Project) EVK3-CT-2002-00084. 26pp.
Petrov, L., Lavalle,C., Sagris,V., Kasanko, M., McCormick,N. (2006). Simulating
urban and regional evolutions: Scenarios of development in three study cases: Algarve
province (Portugal), Dresden-Prague transport corridor (Germany-Czech republic) and
Friuli-Venezia Giulia Region (Italy). European Commission : DG-Joint Research
Centre, Institute for Environment and Sustainability, Land Management and Natural
Hazards Unit, Ispra, Italy.16pp.
Petrov, L. O., Lavalle,C.,Kasanko,M. (2009). "Urban land use scenarios for a tourist
region in Europe: Applying the MOLAND model to Algarve, Portugal." Landscape and
Urban Planning 92: 10-23.
Rabalais, N. N., Eugene T,R., Diaz,R.J, Justic,D. (2009). "Global change and
eutrophication of coastal waters." ICES Journal of Marine Science. 66: 1-10.
Ribeiro, J., Monteiro,C.C., Monteiro,P., Bentes ,L., Coelho,R, Goncalves,J.M.S.,
Lino,P.G., Erzini,K. (2008). "Long-term changes in fish communities of the Ria
Formosa coastal lagoon (southern Portugal) based on two studies made 20 years apart."
Estuarine, Coastal and Shelf Science 76: 57-68.
Richardson, K. (1989). "Algal Blooms in the North-Sea - the Good, the Bad and the
Ugly." Dana-a Journal of Fisheries and Marine Research 8: 83-93.
Scavia, D., Bricker,S.B. (2006). "Coastal eutrophication assessment in the United
States." Biogeochemistry 79: 187-208.
Smeets, E., Weterings,R. (1999). "Environmental indicators: Typology and overview."
Technical report No 25,EEA.19pp.
SPICOSA (2009). Description of Work.: 218pp.
SPICOSA-WP1 (2007). User’s Manual for ICZM Stakeholder-Policy Mapping (Draft
Report). 1.1: 35pp.
SPICOSA-WP3 (2007). System Design. 1.26: 227pp.

MSc Thesis Sirak Robele Gari
104
SPICOSA-WP4 (2009). System Formulation. 4.2: 122pp.
SPICOSA-WP5 (2009). System Appraisal. 5.1: 55pp.
SPICOSA-WP6 (2009). System Output. 6.1: 30pp.
Svarstad, H., Petersen,L.K., Rothman,D, Siepel,H., Wätzold,F. (2008). "Discursive
biases of the environmental research framework DPSIR." Land Use Policy 25: 116–125.
Tett, P., Gilpin, L., Svendsen, H., Erlandsson,C.P., Larsson,U, Kratzer,S,
Fouilland,E., Janzen,C., Jae-Young Lee, Grenz,C, Newton,A, Ferreira,J.G
Fernandes,T.,Serge Scory,S (2003). "Eutrophication and some European waters of
restricted exchange." Continental Shelf Research. 23: 1635-1671
Vale, P., Sampayo, M.A.M. (1999). "Esters of okadaic acid and dinophysistoxin-2 in
Portuguese bivalves related to human poisonings." Toxicon 37: 1109-1121.
Vasconcelos , P., Carvalho,S , Castro,M., Gaspar,M.B. (The artisanal fishery for
muricid gastropods (banded murex and purple dye murex) in the Ria Formosa lagoon
(Algarve coast, southern Portugal)). Scientia Marina 72(2): 287-298.
US-NRCS (1999). Agricultural Waste Management Plan Field Hand book.US-Natural
Resources Conservation Service. Washington D.C.
USDA-NRCS (1999). Best Management Practices Factsheets.US Department of
Agriculture-Natural Resources Conservation Service. Washington D.C.
Wallonick, D. S. (1993). "General Systems Theory." from http://www.survey-software-
solutions.com/walonick/systems-theory.htm. 18pp.
Wayland, D., Megson,D.P.,Mudge,S.M., J. D. Icely., Newton,A. (2008). "Identifying
the Source of Nutrient Contamination in a Lagoon System." Environmental Forensics 9:
231-239.
Wind, T., Henkel, KGa. (2007). ―The Role of Detergents in the Phosphate-Balance of
European Surface Waters.‖ Official Publication of the European Water Association
(EWA):19pp.
Zaldívar, J ,Cardoso, A.,Viaroli, P.,Newton, A., Wit, R., Ibañez, C., Reizopoulou, S.,
Somma, F., Razinkovas, A., Basset, A.,Holmer, M.,Murray, M. (2008). ―Eutrophication
in transitional waters: an overview;‖(JRC-EU). Transitional Waters Monographs1:1-78.

MSc Thesis Sirak Robele Gari
105
Apendix 1a: Summary of DPSIR (Agriculture/Livestock and Aquaculture/Fishery)
* The responsible bodies for response implementations are mentioned in the main body of the report.
Driver Pressure State Impact Response*
Agriculture Nutrient enrichment from agricultural
field run-off
Nutrient concentration
Nutrient ratio
Organic pollution
Chlorophyll-a concentration
Toxic algal bloom presence
Oxygen concentration/saturation
Clam production
Species composition
WQ deterioration
Biodiversity loss
Sp. composition change
Oxygen depletion
Nut.ratio change
Fish poisoning and kills
Human intoxication
Water clarity loss
Revenue loss
Job loss
Agricultural Waste M. Plan
Nutrient/OM Load reduction
Industrial process improvement
Tech.& scientific research
Monitoring
Env. awareness creation
Dredging
Emission standards
Economic instruments
Nutrient enrichment and Organic Matter
pollution from animal waste discharge
Aquaculture/
Fishery
Parasitic infection Low clam production Clam mortality Screen clam seeds
Purchase certified seed
Improve DO
Decrease clam density/bed
Inspect bivalves for toxins
Nutrient/OM enrichment from fish
excretion, faeces & fishmeal spill
Same as in agriculture Same as in Agriculture Nitrogen trade
Emission standard
Monitoring
Research
Improved aquaculture practice

MSc Thesis Sirak Robele Gari
106
Appendix 1b: Summary of DPSIR (Tourism and Urbanization).
Driver Pressure State Impact Response*
Tourism Nutrient enrichment and Organic Matter pollution
from increased human waste discharge
Nutrient concentration
Nutrient ratio
Organic pollution
Chlorophyll-a concentration
Toxic algal bloom presence
Oxygen concentration/saturation
Clam production
Species composition
WQ deterioration
Biodiversity loss
Sp. composition change
Oxygen depletion
Nut.ratio change
Fish poisoning and kills
Human intoxication
Water clarity loss
Revenue loss
Job loss
Maintain cleanliness of beach
Control, Monitor, use notices
Provide adequate UWWTP
Nutrient enrichment from Golf courses (run-off) Agricultural Waste M.Plan
Urbanization Nutrient enrichment from sediments (run-off)
The same as in Tourism
The same as in Tourism
Increase city green area
Construct un-cemented cobble-stone
roads to increase infiltration
Nutrient enrichment and Organic Matter pollution
from increased population
The same as in Tourism
The same as in Tourism
Provide adequate sewer system and
UWWTPs
Emission standards
Economic instruments
* The responsible bodies for response implementations are mentioned in the main body of the report