Embed Size (px)
Citation preview

i
THE USE OF DYNAMIC INDICATORS OF BASIC EARLY LANGUAGE SKILLS
(DIBELS) AND MEASURES OF ACADEMIC PROGRESS (MAP) TO COMPARE
READING PROFICIENCY IN NATIVE ENGLISH SPEAKERS AND ENGLISH
LANGUAGE LEARNERS
BY
RYAN ELLETT
Submitted to the graduate degree program in Curriculum and Teaching and the Graduate
Faculty of the University of Kansas in partial fulfillment of the requirements for the
degree of Doctor of Philosophy.
__________________________________________
Paul L. Markham, Ph.D.
Chairperson
__________________________________________
Bruce B. Frey, Ph.D.
__________________________________________
Phil C. McKnight, Ph.D.
__________________________________________
Lizette A. Peter, Ph.D.
__________________________________________
Sean J. Smith, Ph.D.
Date Defended: April 22, 2014

ii
The Dissertation Committee for Ryan Ellett certifies that this is the approved version of
the following dissertation:
THE USE OF DYNAMIC INDICATORS OF BASIC EARLY LANGUAGE SKILLS
(DIBELS) AND MEASURES OF ACADEMIC PROGRESS (MAP) TO COMPARE
READING PROFICIENCY IN NATIVE ENGLISH SPEAKERS AND ENGLISH
LANGUAGE LEARNERS
_____________________________
Paul L. Markham, Ph.D.
Chairperson
Date approved: April 22, 2014

iii
Abstract
Reading is the central component of the elementary school curriculum and ELLs have been
shown to lag significantly behind English-speaking peers (Flores, Batalova, & Fix, 2012; Mazzeo,
Carlson, Voelkl, & Lutkus, 2000). This is a major concern as the nation’s ELLs are now approximately
10.8% of the school population (Cheung & Slaving, 2012; U.S. General Accounting Office, 1994).
Third grade is a critical point in reading instruction. Students who are experiencing reading
difficulties by third grade are likely to struggle with reading throughout their school years and into
adulthood (Bruck, 1990, 1992; Shaywitz, et al. 1999; Scarborough, 1998). Early reading interventions
provide the best opportunities to help struggling readers achieve grade level by the end of third grade
(Cavanaugh, Kim, Wanzek, & Vaughn, 2004; Pressley & Wharton-McDonald, 1997).
This study compares native English, Spanish, Lao, Chinese, Korean, Vietnamese, Arabic, and
all other ELL students over one, two, three, and four-year spans to determine if certain groups appear to
face more difficulties in developing early reading mastery by third grade. This study also examines
whether socio-economic status impacts the differences in literacy growth.
Findings suggest that Spanish speaking students are more likely to begin school at a
disadvantage in reading compared to ELL peers and continue to be more likely than ELL peers to be at
risk of reading failure by third grade, after four years of sheltered instruction and tiered interventions
with ESOL-certified staff. Longitudinally, Lao speaking students are increasingly likely to be at risk for
reading failure over successively longer intervals. Among ELL students at low risk for reading failure,
On the other end of the achievement spectrum, Spanish speaking students are less likely than ELL
peers to be in the highest achieving group early in their schooling and continue to be so after four years
of instruction.

iv
Acknowledgements
I would like to thank Dr. Paul Markham, my advisor since starting this doctoral journey seven
years ago. Through the hardest parts of this endeavor he was as steady mentor and advocate. Without
his input and guidance this dissertation would be a lesser work.
Dr. Sean Smith is to be commended for his support as well. After serving as advisor for my
Masters program he kindly agreed to serve on my doctoral committee, commitments that have kept us
in contact now for twelve years.
To Dr. Bruce Frey, who didn’t hesitate to join the committee and offer his help in crafting the
appropriate statistical analysis for these research questions. With a shared love of old-time radio, our
conversations frequently drifted off the focus of this dissertation.
Both D. McKnight and Dr. Peter have been important instructors as well as valued sources of
suggestions and advice in this endeavor.
It has been a privilege and a pleasure to work with this committee. They have been supportive
through the whole process and always helped me balance family, work, and studies. Without them this
whole effort would have been abandoned long ago.
Finally, my family deserves endless thanks. They’ve given up countless hours with their
husband and father so this program could be completed. Their encouragement and support were vital in
persevering through the many challenges along the way.
v
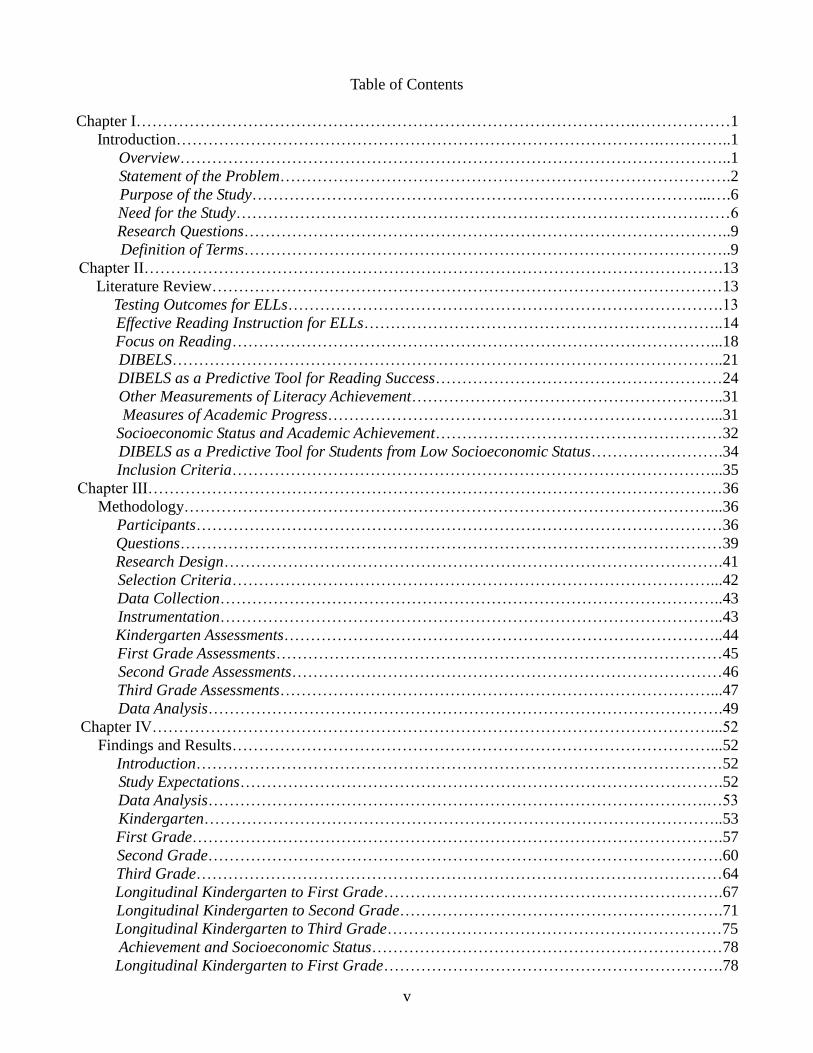
Table of Contents
Chapter I………………………………………………………………………………….………………1
Introduction……………………………………………………………………………….…………..1
Overview…………………………………………………………………………………………..1
Statement of the Problem………………………………………………………………………….2
Purpose of the Study…………………………………………………………………………...….6
Need for the Study…………………………………………………………………………………6
Research Questions………………………………………………………………………………..9
Definition of Terms………………………………………………………………………………..9
Chapter II……………………………………………………………………………………………….13
Literature Review……………………………………………………………………………………13
Testing Outcomes for ELLs……………………………………………………………………….13
Effective Reading Instruction for ELLs…………………………………………………………..14
Focus on Reading………………………………………………………………………………...18
DIBELS…………………………………………………………………………………………..21
DIBELS as a Predictive Tool for Reading Success………………………………………………24
Other Measurements of Literacy Achievement…………………………………………………..31
Measures of Academic Progress………………………………………………………………...31
Socioeconomic Status and Academic Achievement………………………………………………32
DIBELS as a Predictive Tool for Students from Low Socioeconomic Status…………………….34
Inclusion Criteria………………………………………………………………………………...35
Chapter III………………………………………………………………………………………………36
Methodology………………………………………………………………………………………...36
Participants………………………………………………………………………………………36
Questions…………………………………………………………………………………………39
Research Design………………………………………………………………………………….41
Selection Criteria………………………………………………………………………………...42
Data Collection…………………………………………………………………………………..43
Instrumentation…………………………………………………………………………………..43
Kindergarten Assessments………………………………………………………………………..44
First Grade Assessments…………………………………………………………………………45
Second Grade Assessments………………………………………………………………………46
Third Grade Assessments………………………………………………………………………...47
Data Analysis…………………………………………………………………………………….49
Chapter IV……………………………………………………………………………………………...52
Findings and Results………………………………………………………………………………...52
Introduction………………………………………………………………………………………52
Study Expectations……………………………………………………………………………….52
Data Analysis………………………………………………………………………………….…53
Kindergarten……………………………………………………………………………………..53
First Grade……………………………………………………………………………………….57
Second Grade…………………………………………………………………………………….60
Third Grade………………………………………………………………………………………64
Longitudinal Kindergarten to First Grade……………………………………………………….67
Longitudinal Kindergarten to Second Grade…………………………………………………….71
Longitudinal Kindergarten to Third Grade………………………………………………………75
Achievement and Socioeconomic Status…………………………………………………………78
Longitudinal Kindergarten to First Grade……………………………………………………….78

vi
Longitudinal Kindergarten to Second Grade…………………………………………………….81
Longitudinal Kindergarten to Third Grade………………………………………………………83
Summary………………………………………………………………………………………….85
Chapter V……………………………………………………………………………………………….88
Summary, Discussion, and Recommendations……………………………………………………...88
Introduction………………………………………………………………………………………88
Summary of Findings…………………………………………………………………………….89
Implications of Findings…………………………………………………………………………90
Limitations……………………………………………………………………………………….92
Future Directions………………………………………………………………………………...93
Generalizability…………………………………………………………………………………..94
Conclusion…………………………………………………………………………………….....94
References……………………………………………………………………………………………97
Appendix……………………………….………………………………………………………109

vii
List of Tables
Table 1: DIBELS Cut-off Scores……………………………………………………………………….48
Table 2: MAP Cut-Off Scores…………………………………………………………………………..49
Table 3: Percent students scoring At Risk on DIBELS Spring kindergarten Letter Naming Fluency….55
Table 4: Percent students scoring Low Risk on DIBELS Spring kindergarten Letter Naming Fluency.56
Table 5: Percent students scoring At Risk on DIBELS Spring first grade Nonsense Word Fluency…...58
Table 6: Percent students scoring Low Risk on DIBELS Spring first grade Nonsense Word Fluency...60
Table 7: Percent students scoring At Risk on DIBELS Spring second grade Oral Reading Fluency…..62
Table 8: Percent students scoring Low Risk on DIBELS Spring second grade Oral Reading…………..
Fluency………………………………………………………………………………………………….63
Table 9: Percent students scoring 1st – 33rd percentile on Spring third grade MAP…………..………65
Table 10: Percent students scoring 66th – 99th percentile on Spring third grade MAP………………..66
Table 11: Percent students scoring At Risk on DIBELS Spring first grade Oral Reading Fluency……69
Table 12: Percent students scoring Low Risk on DIBELS Spring first grade Oral Reading Fluency….70
Table 13: Percent students scoring At Risk on DIBELS Spring second grade Oral Reading Fluency…72
Table 14: Percent students scoring Low Risk on DIBELS Spring second grade Oral Reading…………..
Fluency……………………………………………………………………….…………………………74
Table 15: Percent students scoring 1st – 33rd percentile on Spring third grade MAP…………………76
Table 16: Percent students scoring 67th – 99th percentile on Spring third grade MAP………………..77
Table 17: Percent low-SES students on DIBELS Spring first grade Oral Reading Fluency…………...79
Table 18: Percent high-SES students on DIBELS Spring first grade Oral Reading Fluency…………..80
Table 19: Percent low-SES students on DIBELS Spring second grade Oral Reading Fluency………..81
Table 20: Percent high-SES students on DIBELS Spring second grade Oral Reading Fluency……….82
Table 21: Percent low-SES students on the Spring third grade MAP…………………………………..84
Table 22: Percent high-SES students on the Spring third grade MAP………………………………….85
Appendix
Percent students scoring At Risk on DIBELS Fall kindergarten Letter Naming Fluency………….…109
Percent students scoring Low Risk on DIBELS Fall kindergarten Letter Naming Fluency………….109
Percent students scoring At Risk on DIBELS Fall first grade Nonsense Word Fluency…………..….110
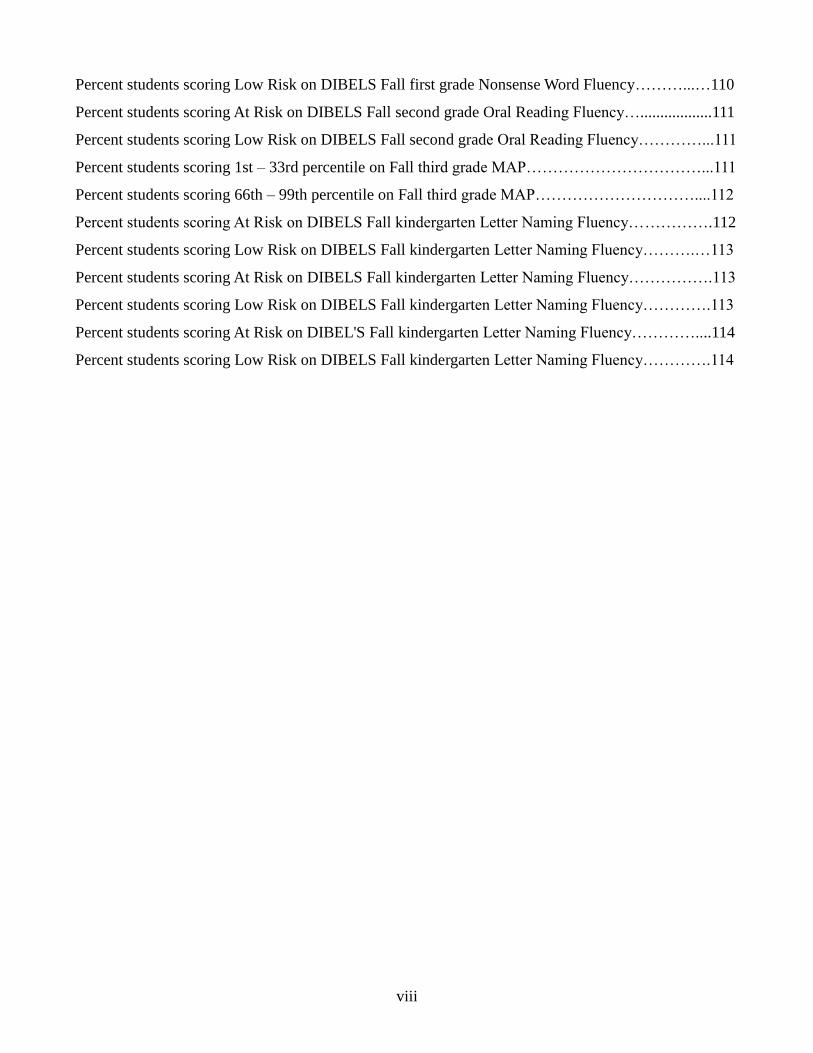
viii
Percent students scoring Low Risk on DIBELS Fall first grade Nonsense Word Fluency………...…110
Percent students scoring At Risk on DIBELS Fall second grade Oral Reading Fluency…..................111
Percent students scoring Low Risk on DIBELS Fall second grade Oral Reading Fluency…………...111
Percent students scoring 1st – 33rd percentile on Fall third grade MAP……………………………...111
Percent students scoring 66th – 99th percentile on Fall third grade MAP…………………………....112
Percent students scoring At Risk on DIBELS Fall kindergarten Letter Naming Fluency…………….112
Percent students scoring Low Risk on DIBELS Fall kindergarten Letter Naming Fluency……….…113
Percent students scoring At Risk on DIBELS Fall kindergarten Letter Naming Fluency…………….113
Percent students scoring Low Risk on DIBELS Fall kindergarten Letter Naming Fluency………….113
Percent students scoring At Risk on DIBEL'S Fall kindergarten Letter Naming Fluency…………....114
Percent students scoring Low Risk on DIBELS Fall kindergarten Letter Naming Fluency………….114

1
Chapter 1
Introduction
Overview
Between 2007 and 2009 the United States and many other regions of the world
experienced the worst economic decline since the end of World War II. Now widely referred to
as the Great Recession, during this decline unemployment in the United States hit a high of
10.1% in October, 2009, up 5.7% from a pre-Recession low of only 4.4%. This growth in
unemployed workers surpassed even the stark economic downturn of the mid-1970s (Elsby,
Hobijn, & Sahin, 2010).
Though the recession affected individuals from all income levels and educational
backgrounds, an in-depth analysis of a number of economic indexes by Princeton's Henry Farber
(2010) revealed that workers without a college diploma faced job losses at increased rates, those
without a high school diploma fared worst of all, as might be expected. Approximately 25% of
men and women who failed to graduate from high school lost a job between 2007 and 2009,
more than twice the rate of those with a college degree, 11% of whom experienced job loss at
some point during that time span.
As of 2008 75% of this nation's students graduate from high school (Balfanz et al., 2010).
However, that rate masks much less encouraging numbers for various student sub-populations,
among them students who are English language learners (ELLs). Various studies have found
graduation rates for ELL students of anywhere from 53% to 70% depending upon the variables
used (Fry, 2007; Karp & Uriarte, 2010; Menken, 2009). Students in this group are especially
vulnerable to dropping out of high school or to having fewer economic opportunities as adults
even if they finish their secondary education.
Though it's very difficult to identify the exact dropout percentages among English
language learners because different states use various combinations of language proficiency test

2
scores, reported home language, parent input, and teacher observations to make classifications
(Kindler 2002), English proficiency level is a primary indicator of students' likelihood of
graduating high school (Lan and Lanthier, 2003; Rumberger 1995, 2004). ELLs' academic
performance is overall lower as a whole than those with English fluency (Abedi 2004; Genessee
et al. 2005) and they are more at risk for failing to graduate.
One key component for this group's poorer academic performance is reading difficulty. In
one analysis of results on the NAEP's (National Assessment of Educational Progress) 12th grade
English/language arts test, 50% of ELL students scored below grade level (Mazzeo, Carlson,
Voelkl, & Lutkus, 2000). Similarly, a large-scale study of Texas' 832,000 ELL students revealed
that less than 30% of students who at some point in their school career were identified as ELL
met the standard for passing the state's 11th grade reading assessment (Flores, Batalova, & Fix,
2012). When so much of the secondary curriculum requires literacy competency, is it any wonder
struggling readers are tempted to give up pursuing a diploma?
Reading proficiency is not just a concern in high school, of course, as evidenced by the
tremendous attention paid to and resources directed toward the No Child Left Behind (NCLB)
legislation passed over ten years ago. This last reauthorization of the Elementary and Secondary
Education Act (ESEA) requires states to assess students in reading every year from 3rd to 8th
grade and then once between 10th and 12th grade (U.S. Department of Education). Student
literacy competency is also not a new concern, either for ELL students or all students in general,
with much energy focused on overhauling public schools, especially in the last three decades.
Statement of the Problem – Reading Failure Among ELL Students
In 1983 the National Commission on Excellence in Education issued a policy report
entitled A Nation at Risk which raised alarm over the state of America's public education system
(NAR; National Commission on Excellence in Education [NCEE], 1983). Though in retrospect it

3
is considered by many to be a faulty and even negligent report (Bracey, 2003; Gabbard, 2003;
Hewitt, 2008), it nevertheless had a profound impact on public education during the ensuing
decades including an emphasis on the performance of ELLs, a group which did not receive
notable attention in the original report.
Guthrie and Springer (2004) point out a number of these long-term influences. While
lamenting the federalization of education and increasingly myopic focus on standardized test
scores, they do acknowledge some benefits which were ultimately derived from the study. First
and foremost, they argue, the report turned the emphasis in education policy away from simply
funding issues to the actual student outcomes achieved with that funding. Further, achievement
outcomes, which would come to be measured by any number of standardized tests, indirectly led
to an increased focus on underachieving students which include a great number of students with
disabilities, students of color, and ELLs.
That English language learners would be beneficiaries of some of A Nation At Risk's
outcomes is fortunate considering the population trends of the group. Between 1985 and 1991,
the years immediately following the report's release, the nation's ELL population grew over 50%
to 2.3 million students (Olsen, 1993; U.S. General Accounting Office, 1994). This explosive
growth continued during the 1990s and the number of identified ELL students grew by another
50% to 3.5 million around the turn of the millenium. This student population, which numbers 5.3
million as of the 2008-09 school year – yet another 50% increase during the first decade of the
21st century – now represents 10.8% of the total school-age body (National Clearinghouse for
English Language Acquisition and Language Instruction Educational Programs, 2011). These
students represent approximately 10% of the entire non-native English speaking population in
the United States which numbered 52 million in 2005 (Cheung & Slaving, 2012).
Between 1992 and 2007 achievement scores on the National Assessment of Educational
Progress (NAEP) increased for both White and Hispanic students according to the National

4
Center for Education Statistics. There remained a significant gap, however, between the two
groups on the fourth grade test. Hispanic students, who scored on average 29 points below their
White peers, had narrowed that gap only slightly by 2009 to 25 points. The achievement
differential was comparable for the NAEP reading test taken by White and Hispanic 8th graders
(Hemphill, Vanneman, Rahman, 2011). Hispanic students, by far the largest group of ELLs at
62% (Cheung & Slavin, 2012), actually fared better than the ELL population as a whole. A
staggering 73% of ELL students scored “below basic” on the fourth grade NAEP reading test in
2005 compared to 59% of Hispanic students and only 25% of White students. By eighth grade
ELL students showed little improvement, with 71% still scoring “below basic” while Hispanics
had improved to 49% scoring “below basic” and only 19% of White students scoring at that level
(Fry, 2007).
The reasons behind this notable achievement gap have been studied by a number of
researchers but a clear consensus has yet to be reached. A number of factors impact the
achievement of ELL students, chief among them race, socioeconomic status, and low-performing
schools. English language learners are almost always members of a minority racial or ethnic
group, with children of Hispanic background making up approximately 72% of the group (Planty
et al., 2008). In addition, a large majority of ELL students come from families with incomes low
enough to qualify for free and reduced-price school lunches (Zehler et al., 2003). To compound
the problems, children who are both racial minorities and from low-income families are more
likely to attend schools with high rates of poverty and poor academic records (Evans, 2004;
Hanushek, Kain, & Rivkin, 2009; Kainz & Vernon-Feagans, 2007).
Clarkson (2008), in her review of ELL students and NCLB data, further elaborated upon
the difficulties of developing educational policy which will most effectively address the
legitimate needs of this diverse group of learners. While the demographic subgroups into which
students are commonly divided (such as ethnicity, gender, home language, and socioeconomic
5
status) are insightful, they do not touch on students' immigrant status which introduces a whole
new group of learning variables.
Ethnic categories are usually overly broad, meaning that students from China, Japan,
India, and Southeast Asian nations are lumped together despite sometimes drastic cultural
differences in language, attitudes, and educational experiences. Racial categories, too, can fail to
distinguish between dissimilar cultural groups. Clarkson notes that African-Americans could
identify English-speaking black students raised in the United States with its long tradition of
racial antagonism. Yet it could also refer to North African Muslim immigrants or African
children from the central or southern portions of the continent which have little in common with
the Islamic region. Students in this same group just as likely may trace their ancestry to the
Caribbean and find little in common with the African or Black American students with whom
they are grouped.
Categorizing students by home language also leads to problems in addressing educational
needs. All Spanish-speaking students may be lumped together despite coming from any number
of Central or South American countries stretching from Mexico in the north to Argentina in the
South. These groups may share few similarities outside of language and a shared history of
European colonization. All of these categories into which student performance data is
disaggregated are further complicated by issues including the family's historical economic status,
students' past access to formal education, and reasons for familial immigration.
The ways in which ELLs receive literacy instruction varies considerably, adding yet
another layer of variability to attempts to determine the most effective reading strategies for this
group of students. As many as 50% of ELL students receive at least a portion of their reading
instruction in their native language (Goldenberg, 2008). Some of these are in paired bilingual
programs which provide reading instruction alternately in both English and the native language
at differing times throughout the day. Many others are taught in transition programs which

6
provide more native language instruction in the early years and gradually phase the students into
all-English environments (Cheung & Slavin, 2012).
Purpose of the Study
With so many obstacles facing English language learners, every teacher who works with
these students must make every effort to ensure they receive the highest quality educational
experience. Under NCLB students begin to take state reading assessments in third grade, and
there is a strong correlation between reading difficulties at the third grade and continued reading
difficulties in the following school years (Shaywitz, et al. 1999; Scarborough, 1998). In fact,
early reading difficulties often persist into adulthood, thus contributing to some of the poor life
outcomes described above (Bruck, 1990, 1992). It is therefore critical to identify students at risk
for reading failure as early as possible in order to minimize reading deficits by third grade.
The purpose of this study is to compare the scores of ELL students on the Dynamic
Indicators of Basic Early Literacy Skills (DIBELS) and Measures of Academic Progress (MAP)
over the course of their kindergarten, first grade, second grade, and third grade school years. The
results will provide insight as to whether test scores are equally proportional between ELL
groups and native English speakers over various testing intervals or if groups demonstrate
different proportions on their test achievement. While some studies have shown conflicting
results as to whether DIBELS is more or less predictive for ELLs as a single group, research has
yet to show what differences may exist between language groups within the wider ELL student
population.
Need for the Study
In an effort to minimize reading failure and reading difficulties by third grade, it is
necessary to begin interventions in the preceding school years. Naturally, the earlier the risk of

7
reading failure is recognized, the more time there is to put interventions in place to address
difficulties and prevent those difficulties. In a seminal 1988 study, Connie Juel profiled how 21
of 24 students who scored in the bottom quartile of the Iowa Test of Basic Skills were still
significantly below grade level on reading comprehension in fourth grade. The study
demonstrated how early childhood educators can identify many students at risk for reading
failure and that early deficiencies in areas such as phonemic awareness and word decoding do
not just disappear on their own. Juel suggested that even identification at the end of first grade
may be too late to significantly improve reading performance for many students.
Numerous studies have shown the effectiveness of early interventions on a variety of
reading skills, including most of those skills addressed by the National Reading Panel's
influential 2000 report, “Teaching Children to Read” (National Reading Panel, 2000). These
skills which can be considerably enhanced with early intervention include basic ones such as
phonemic awareness, decoding, and sight words (Bus & van Ijzendoorn, 1999; Cavanaugh, Kim,
Wanzek, & Vaughn, 2004; Gyovai et al., 2009; O'Shaughnessy & Swanson, 2000). Early
intervention is also a proven practice with higher level literacy skills including fluency and
comprehension, which leads to improved long-term outcomes (Fuchs, Fuchs, Mathes, &
Simmons, 1997; Pressley & Wharton-McDonald, 1997). Improvement in the latter reading skills
is especially notable because fluency and comprehension are notoriously difficult to remediate
and are the cause of much academic difficulty in students' later years (Blachman et al., 2004;
Rashotte, MacPhee, & Torgesen, 2001). It should be noted that early intervention is not a
panacea. Even high-quality intervention during preschool years does not guarantee long-term
academic gains if not followed up by ongoing quality instruction in the early elementary years.
Numerous studies show that early gains can dissipate and be lost by third or fourth grade without
continued interventions and effective general education environment (Currie & Thomas, 1995;
McLoyd, 1998; Snow & Paez, 2004).

8
Unfortunately, much of the literature on early reading intervention does not take into
account the race and English proficiency status of the student subjects. This is a curious omission
considering the long history of disproportionate representation of racial, ethnic, and language
minorities in special education programs, the study of which reaches back over forty years
(Donovan & Cross, 2002; Heller, Holtzman, & Messick, 1982). Since various minority school
populations are more likely to need intervention services including Title 1 and special education,
it seems that the effects of the ever-growing number of early intervention strategies on these
particular populations would be of notable interest to researchers. However, as pointed out by
Artiles et al (2010) in their review of disproportionality research, most research is conducted
with a “color-blind” approach (p. 280). This, according to Spencer (2008), is inappropriate since
“differences in experience by youth . . . require different coping processes” (p. 256). Thus,
strategies which are effective for some groups of students may not be so effective for others, but
the difference may not be noticeable if the studies don't specifically look at that viewpoint. The
sample size may mask negative results for some populations which would otherwise be
identified by a more nuanced review of the data.
Though still insufficient, there is a growing body of literature regarding the effectiveness
of early reading intervention for ELL students. There are extra challenges when teaching non-
English speakers to read in English, of course, but they are surmountable. Because different
languages have phonological characteristics which vary from English, this factor creates
difficulties in mastering the phonics components of English (Fashola, Drum, Mayer, & Kang,
1996; Wang & Geva, 2003). Geva and Wang's work has demonstrated that phonological
awareness in home languages as varied as Punjabi, Hebrew, Spanish, and Chinese transfers to
English learners and facilitates their development of literacy in English.
Teachers can be proactive and facilitate the language acquisition process by gaining a
basic knowledge of their students' first languages. This allows those teachers to specifically

9
target linguistic differences and address them during instruction. Such direct instruction can lead
to English learners gaining the phonological awareness and decoding skills necessary for literacy
as quickly as native English speakers (Geva, 2000; Thompson, Vaughn, Hickman-Davis, &
Kouzekanani, 2003). The gains are not temporary; longitudinal studies suggest that both ELL
and English language natives can develop basic literacy skills in English at the same rate and in
the same stages (Chiappe, Siegel, & Wade-Woolley, 2002).
Research Questions
Research was conducted to answer the following questions:
1. When comparing the cut score ranges of beginning of year and end of year reading
assessments over single year and multi-year intervals, are there significant differences between
the ratios of English, Spanish, and Other ELL students in each language group which begin and
end in the At Risk and Low Risk groups?
2. Do any of the ELL native speakers (Arabic, Chinese, Korean, Lao, and Vietnamese) have
significantly different ratios of students in the lowest and highest reading categories as
disaggregated in question one?
3. Does socioeconomic status (SES) as measured by free and reduced lunch status
significantly affect the ratios of students in each language group who score in the lowest and
highest reading groupings?
Definition of Terms
A number of terms are used in this dissertation concerning reading, second language
instruction, and assessments. To ensure clarity for the reader, the author's use of each term is
explained below.
DIBELS: The Dynamic Indicators of Basic Early Literacy Skills is a series of short assessments

10
designed to measure specific skills known to be common among successful readers. The
measures are intentionally short so they can be used on a regular basis as a progress monitoring
tool to detect students who may not be making adequate growth toward mastering the skills
necessary to be a successful reader in successive years.
DIBELS was designed to measure components of all five Big Ideas singled out by the
National Reading Panel (2000) in their report on reading mastery. These are phonological
awareness, the alphabetic principle, accuracy and fluency with connected text, comprehension,
and vocabulary (Retrieved December 21, 2012 from https://dibels.uoregon.edu/). Progress or
lack thereon on the indicators is then intended to guide teaching staff in making appropriate
instructional choices for the child.
Early intervention: The process of providing specific academic interventions with struggling
students as early in their schooling as possible. While reading is the most common focus of early
interventions, it could apply to any domain including math, behavior, or social skills. Research
suggests that there is a strong likelihood that students who are experiencing difficulty reading in
first grade will still be struggling in fourth grade. Considerable research, however, suggests that
later reading failure can be significantly reduced by exposing students to valid, research-
supported additional instruction as early as possible. Nevertheless, effective early intervention
can be elusive because it requires accurate assessment of reading needs, an appropriate plan to
address the reading deficits, and fidelity to the plan by all staff involved in the intervention
(Menzies, Mahdavi and Lewis, 2008).
English Language Learner: Students for whom English is not a first language have been, and
continue to be, identified by a number of labels both in practice and in the professional literature.
Other terms include students with Limited English Proficiency (LEPs) and Second Language
Learners (SLLs). Frequently they are referred to as students for whom English is a Second
Language (ELLs) and English Language Learners (ELLs). Occasionally they are labeled
11
linguistic minority students or dual language learners. More recently the term Culturally and
Linguistically Diverse students (CDLs) has come into wider use. Proponents posit that CDL does
not imply that lack of English proficiency is a deficiency as might be interpreted by other terms.
The term ELL is used by this author it is the most commonly used in school and government
databases.
Language Proficiency: Student language proficiency can mean different things in varying
situations. Cummins (1980, 2000) noted two important forms of proficiency, basic interpersonal
communicative skills (BICS) and cognitive academic language proficiency (CALP) which are
still commonly referenced by educators today. MacSwan and Pray (2005) take a broader view
and insist that it encompasses all aspects of students' language development, from social use, to
grammar, to accent. A general and regularly used understanding of language proficiency is
TESOL, Inc.'s which considers it a level of competence at which an individual (student or
otherwise) can use a language for basic communicative and academic tasks (TESOL, 2000).
Measures of Academic Progress: The Measures of Academic Progress, commonly referred to as
MAP, is an assessment based on unidimensional item response theory (IRT) and administered to
students by computer. The tests were originally developed by Northwest Evaluation Association
(NWEA) in 2000 and continue to be published by that organization.
Native English speaker: While researchers and educational agencies define English language
learners in a number of ways and identify them by a number of characteristics, rarely are their
counterparts – native speakers of English – defined in the literature. Kieffer (2008) may come as
close as any in contrasting them to ELLs. Whereas ELLs and language minority students (LMs)
have been exposed to a non-English language at home, it can be assumed that native English-
speakers have not. Similarly, whereas the former could have English proficiency that falls on a
considerable continuum, Kieffer suggests native speakers are both English proficient and
dominant. They will not “lack the English proficiency to gain full access to mainstream

12
instruction without [instructional] support” (p. 851).
Reading Failure: Students without the literacy skills to decode and comprehend text written at
their grade level (Yurick, Cartledge, Kourea, & Keyes, 2012). This problem is well documented
in the literature and found disproportionately among students in poverty and in urban areas
(Foorman & Moats, 2004).
Response to Intervention (RTI): RTI is an instructional model developed to aid in the
determination of whether or not a student might have a learning disability. Students struggling in
a school context, be it academic, social, or behavioral, are provided increasingly intense
interventions depending on their responsiveness or lack thereof to less-intensive treatments. A
three-tiered system is the most common, with Tier 1 representing the general education
environment and Tier 3 representing the most intensive small-group or one-on-one instructional
setting (Fuches et al, 2011).
These definitions are central to understanding the questions posed in this study, and the
literature and practice from which these questions emerged. Students' success or failure in
reading – a skill which is intertwined tightly with language – has real life consequences which
can significantly impact the communities in which they live, most notably through gainful
employment.

13
Chapter II
Literature Review
Testing Outcomes for ELLs
In order to gauge the effectiveness of instruction both over short and longer periods of
time, educators are increasingly using progress monitoring tools to determine adequate growth
toward academic goals and increasing levels of intervention to meet goals when necessary.
However, progress monitoring is only so helpful as the assessments used.
Bachman puts forth an assessment use argument which can “lead to a focused, efficient
program for collecting the most critical evidence in support of the interpretations and uses for
which the assessment is intended (p. 2)” (Bachman, 2005). To be effective a test both needs to
have valid construct – in this case language ability – and valid context – the specific tasks being
tested. To be useful, however, the tests must be used appropriately (Bachman, 1990).
While very much an area still under considerable study, several scholars have attempted
to set forth criteria by which to judge test validation (Kane, 2002; Mislevy, 2003, Mislevy,
Steinberg, & Almond, 2003). Further, there clearly are misuses and abuses that can arise when
educators do not use test results in a fair and honest manner, as highlighted by Shohamy (2001).
Thus the need for practitioners and administrators to recognize exactly what information tests
may be giving and not giving.
But to synthesize the strands of thought and research in test validity and assessment
utilization theory, Bachman goes further and attempts to address how the actual use of test results
should be considered as strongly as strictly interpretive views of test results. Assessment use
theory allows for those who will be interpreting and making decisions based on these results to
collect the most important evidence to arrive at “clearer” and “transparent” interpretations.
This idea, then, informs the background against which the DIBELS and MAP are
administered in this one Midwestern school district. Since validity of these assessments in regard
14
to ELL students has little specific literature behind it, Bachman's theory suggests that district
officials are using the results appropriately when comparing them to determine students most in
need of extra instruction through a tiered system of supports.
A review of the literature supporting the district's assessment tools, DIBELS and MAP, its
instructional model, SIOP, and its systematic delivery of increasingly individualized and
intensive supports through a Response-to-Intervention (RtI) model is necessary by the
assessment use argument to determine if differences in scores between ELL groups are legitimate
and should raise red flags for administrators about the varying responses of some populations to
these educational structures.
Effective Reading Instruction for ELLs
To maximize all students' acquisition of literacy, it is important to grow our understanding
of how various factors affect that acquisition. Spoken language, naturally, plays a critical part in
learning a written language. Though not nearly as well researched as reading instruction for
English-only students, research provides insights to effective literacy teaching for ELLs. In
general, instructional strategies which work for native English speakers also work for English
learners (Baker & Gersten, 1997; Garcia, 2000; Gersten & Geva, 2003). Synthesizing the
research in the area, August and Shanahan (2006) identity phonemic awareness, phonics, fluency,
vocabulary, and comprehension – all components of successful reading in EO students according
to the National Reading Panel (2000) – as constituting a beneficial instructional approach for
ELLs as well.
There are various methods by which ELL students are instructed in schools. Bilingual
classrooms feature school environments in which students are taught primarily in their native
language. In transitional bilingual programs students are taught to read in their native language,
at least for the first few years. Much of the rest of the school day students are taught in English.

15
There is variation even within these programs; “early-exit” programs move ELL students out of
the bilingual component around second or third grade while “late-exit” versions don't move them
out until upper elementary (Ramirez, et al., 1991). Alternatively, some bilingual programs
frequently called paired bilingual teaching offer reading instruction in both L1 and English at
differing times during the same day (Willig, 1985). Perhaps the rarest of the models is the so-
called dual language or dual immersion model in which ELLs and native English speakers are
taught in English and a non-English language (Calderon & Minaya-Rowe, 2003). A final model
which is not especially pertinent to this study is one that attempts to preserve heritage languages
such as those of Native American tribes.
Slavin and Cheung (2005) conducted a meta-analysis to determine which of these
classroom approached was most effective with ELL students. Their review included ten studies
of paired bilingual programs, two studies focusing on transitional bilingual programs, one study
of an undetermined bilingual approach, two involving heritage language programs, and the final
two reviewed the results of native language instruction with secondary school students.
Of the seventeen total studies included in Slavin and Cheung's meta-study, twelve
demonstrated findings which supported the use of some sort of bilingual instruction while the
other five failed to show any difference. Nine of the thirteen studies which included elementary-
aged subjects supported bilingual education with a median effect size of 0.45 for all thirteen
studies. Notably, not a single study of the entire nineteen supported English immersion over any
sort of bilingual education.
In 2006 Francis, Lesaux, and August published their meta-review of studies comparing
English-only to bilingual types of instruction. Their criteria resulted in the use of twenty studies,
some of which had been used in previous meta-analyses and some of which were new to their
research. Fourteen of the studies focused on elementary students while two focused on secondary
students. One of the included studies evaluated a heritage language program and the final three

16
reviewed French immersion programs in Canada, a body of literature many bilingual researchers
don't utilize because they don't find comparisons to United States programs useful.
The authors concluded that the fifteen studies encompassing elementary, secondary, and
heritage language studies demonstrated a “positive effect on English reading outcomes” (p. 392)
with effect sizes which were small to moderate. Though not directly pertinent to this study,
Francis, Lesaux, and August's review of three French immersion studies consistently showed that
immersing English-speaking students in French instruction did not result in any negative affects
on their L1 reading. This does indicate that English-only students in paired bilingual programs
likely will not be negatively affected by the experience.
A third meta-analysis conducted by Rolstad, Mahoney, and Glass in 2005 found results
similar to those above. One of the criteria which sets this work apart from the two above is the
authors' review of studies which were published after Willig's 1985 work. Several of those used
by Slavin and Cheung and Francis, Lesaux, and August, date back to the 1970s and early 1980s.
Rolstad, Mahoney, and Glass selected 17 publications for inclusion in their study based on three
criteria: Each involved ELL students from kindergarten to secondary school, statistical
information needed for the meta-study was included in the original work, and the authors
provided an adequate description of both the treatment and comparison programs.
This work found that bilingual education programs were “superior” (p. 590) to all-
English alternatives. Further, the authors concluded that dual bilingual education, during which
students are taught in both their home language and English, results in better outcomes than
transitional bilingual education models which transition instruction from the home language to
English at some point during the elementary school years.
Despite the considerable literature that indicates some sort of bilingual approach is
conducive to the best student outcomes, political pressures and funding concerns in recent years
have led to an increase in English-only programs for ELLs. High profile legislation in Arizona

17
(Proposition 203), California (Proposition 227), and Massachusetts (Question 2) put severe
restrictions on the use of bilingual programming in schools with Arizona's implementation
making it nearly impossible for any non-English-only program to be used in the schools
(Mahoney, Thompson, & MacSwan, 2004; Rolstad, Mahoney, & Glass, 2005).
Faced with these realities researchers are searching for the most effective instructional
practices for teaching ELLs in English. Sheltered instruction, which is a strategy for teaching
ELL students within an English-only classroom, is most effective when it includes teachers
speaking slower and enunciating as clearly as possible, using relevant visual supports and
demonstrations, explicitly teaching vocabulary, and connecting instruction to students'
experiences (Genesee, 1999). Even so, these practices are not effective in the long-term without a
systematic approach to teaching language (Short & Echevarria, 2004).
To provide an effective model including all these elements for teachers to follow in their
daily instruction Echevarria, Vogt, and Short developed the Sheltered Instruction Observation
Protocol (SIOP) model. The researchers developed a system of creating and delivering research-
based strategies which they grouped into eight interconnected components. They are:
Preparation, Building Background, Comprehensible Input, Strategies, Interaction,
Practice/Application, Lesson Delivery, and Review/Assessment (Short & Echevarria, 2004).
SIOP is not a curriculum but rather a framework in which to teach the curriculum that
will provide maximum benefit to both ELL and native-English students. It is designed to
promote both curriculum content mastery and language mastery. SIOP is not designed to be used
only by ELL teachers or similar specialists. Its use of such techniques as language objectives,
and building background knowledge are intended to be used by all teachers across the school
environment, both in the general education environment and in special services classrooms.
SIOP is also a set of strategies which are best implemented after teachers have had proper
training to ensure the model will be used with fidelity and according to the research on which it

18
is based (Echevarria, Short, & Powers, 2003).
SIOP requires that teachers carefully think about language skills which will be necessary
to complete an assigned task. With these requirements in mind, teachers must then plan language
lesson objectives in addition to the regular content objectives which include language
components that are made explicitly clear to the students. It expects teachers to introduce and
explicitly teach core academic terms and concepts that may be widely recognized by English-
speaking students but not ELL students with comparable cognitive ability. Because ELLs often
have differing background experiences than their English-speaking peers and sometimes have
had intermittent formal schooling, they do not come to a lesson with the same knowledge base.
Topics such as cultural and historical references frequently require extra elaboration by the
teacher. Finally, SIOP encourages teachers to challenge ELLs to expand their verbal interactions
with the use of academic language and to participate as much as possible in content-related
classroom discussions.
This is the model of ELL integration experienced by the students investigated in this
study. For maximum effectiveness it is necessary not only for school staff to be trained in
sheltered instructional techniques, it is key that they use the techniques daily. In fact, the
techniques must be interwoven in all aspects of the classroom and school environment.
Unfortunately, there is no quick and easy way for SIOP implementation to be measured; it relies
on teacher and administrator fidelity and self-monitoring, characteristics which can be tricky to
quantify.
Focus on Reading
SIOP's evidence-based approach to enhancing the literacy skills of ELL students came at
an important time as the nation's schools were increasingly focusing efforts and resources on
raising reading achievement. A number of factors contributed to the heavy focus on literacy

19
(often at the expense of the rest of the curriculum) now found in most elementary schools.
Perhaps none of those factors were more influential than the 2000 publication of the National
Reading Panel's (NRP) “The Report of the National Reading Panel: Teaching Children to Read”
and the 2001 reauthorization of the Elementary and Secondary Education Act (ESEA), more
commonly referred to as No Child Left Behind (NCLB).
Charged by Congress in 1997 to “convene a national panel to assess the status of
research-based knowledge, including the effectiveness of various approaches to teaching children
to read,” (National Reading Panel, n.d.), the National Reading Panel returned its results in 2000.
The report focused on five big ideas: Phonemic awareness, phonics, vocabulary, fluency, and
comprehension.
Phonemic awareness is composed of a set of skills that focus on units of spoken sound
and includes the ability to identify, segment, blend, and otherwise manipulate these sounds.
Phonics is more specifically text-centered and includes skills such as letter-sound correlation,
decoding and reading words, and recognizing patterns within printed words. Vocabulary involves
expanding readers' word awareness and understanding of concepts. Fluency reflects the speed
with which students read accurately and with appropriate expression. Automaticity with literacy
skills is key. Comprehension is the final big idea and pulls together all the earlier big ideas.
Comprehension requires that the reader makes meaning of the text and can engage with it
critically, and allows for the effective communication of ideas through the written word
(National Reading Panel, 2000).
When NCLB was reauthorized in 2001, the year after the release of the NRP report, and
implemented during the 2002-03 school year, it put in place a requirement that by 2013-14 all
students would be proficient in both reading and math as determined by assessments created at
the state level. Growth toward this goal of 100% proficiency was measured against annual
benchmarks set at the state level and reported as adequate yearly progress (AYP). Additional
20
resources were provided to schools and districts who failed to meet the proscribed benchmarks;
prolonged failure instigated a series of corrective actions which could include replacing staff,
altering governing structures, or even closing schools (Taylor et al., 2010).
The effects of NCLB's implementation are starting to be investigated but it will surely be
years before the Act's ramifications are fully understood and there likely will never be agreement
in regards to its benefits and drawbacks. Evidence suggests that cheating and skill drill schemes
to produce short-term score gains at the expense of long-term learning occurred (Neal &
Schanzenback, 2010; Jacob & Levitt, 2003). Yet Dee, Jacob, and Schwartz's (2012) analysis
concludes that there were systemic, concrete improvements in education as a result of NCLB.
They found that per-student funding increased and the increase primarily went directly to student
instructional services. Related to that, teacher salaries – especially in high-poverty districts –
increased “meaningfully” (p. 2) and the percentage of teachers with advanced degrees increased.
Student behaviors, including attendance and attitude, appear to have improved based on teacher
surveys.
Much more time is now devoted to math and language arts, the primary focus of NCLB
assessments, while that focused on the hard sciences, social sciences, and arts has decreased
proportionately. Under NCLB all students must show growth toward 100% grade level reading
proficiency, even those who are identified as having a disability and those who are English
language learners. The inherent problem with this expectation for non-native English speaking
students is that the state assessments used to meet the NCLB criteria are administered in English.
This appears to be a step back from the goal of the 1968 Bilingual Education Act (Title
VII of the Elementary and Secondary Education Act), one of the earliest large scale efforts to
provide language support services to ELL students. In fact, NCLB replaced the Bilingual
Education Act with Title III, the English Language Acquisition, Language Enhancement, and
Academic Achievement Act. This update removed the term “bilingual” from the federal law and

21
increased the emphasis on learning English at the expense of students' native language, requiring
all ELLs to take the state tests after they have been in the United States for one year. Further, it is
disappointingly ironic that NCLB, which is the most recent reauthorization of the ESEA
originally passed in 1965 as a part of President Johnson's War on Poverty, may actually be
harming some of the nation's most needy school children when the Act's original intent was to
specifically aid those same children (Menken, 2010).
Out of the NCLB legislation came Reading First, a reading initiative that was eventually
implemented in all 50 United States and many territories. The purpose of Reading First was
admirable, as most educational initiatives are: all students would be reading at grade level by the
end of third grade. Reading First required significant changes for many schools, including
creating a daily 90 minute block devoted to language arts instruction and using a common
reading program from kindergarten through third grade (Baker, et al., 2011). It also required
considerable professional development, reflecting the failure of previous reading initiatives due
at least in part to insufficient teacher preparation (Borman, Hewes, Overman, & Brown, 2003;
Elmore, 1996.)
With over $6 billion invested in Reading First until it was finally defunded by Congress
in 2009, the initiative was one of the largest ever in education. In the final report on Reading
First's impact (Gamse, et al., 2009) the authors found that it did increase the amount of time
spent each day on reading, the amount of explicit instruction grew, and “high quality student
practice” (p. 18) increased as well. Unfortunately, despite these noted positive steps in reading
instruction, the report did not find that Reading First led to a statistically significant
improvement in reading achievement scores, the primary purpose of the program in the first
place. Nevertheless, dissenting voices insist that Reading First was more successful than the
report would suggest (Carlisle, Cortina, & Zeng, 2010; Foorman, et al., 2010; Mitchell, 2008).

22
DIBELS
No matter how valid an assessment may be considered, its true validation is still very
much local, according to Bachman & Palmer (2010). For the students reviewed in this study, that
applies to DIBELS, a national assessment which returns results to the district which are still very
much influenced by the unique demographic and sociological settings of this one Midwestern
city. For staff in this district DIBELS is used as a dipstick to inform them of how students are
progressing toward whole literacy while measuring singular components of reading.
An important component of the Reading First initiative was the use of curriculum-based
measurements (CBMs) to monitor student progress. One of the most widely used among Reading
First schools was The Dynamic Indicators of Basic Early Literacy Skills (DIBELS), a set of
reading sub-tests devised by faculty at the University of Oregon to measure the reading
proficiency of early elementary students. DIBELS assesses students on various reading skills
identified by the National Reading Panel and others as the three Big Ideas in beginning reading:
phonological awareness, alphabetic understanding, and fluency (Simmons & Kameenui, 1998;
National Reading Panel, 2000). The DIBELS tests are Initial Sound Fluency (ISF), Letter
Naming Fluency (LNF), Phoneme Segmentation Fluency (PSF), Nonsense Word Fluency
(NWF), and Oral Reading Fluency (ORF). The Daze – a cloze assessment – was added more
recently and is given to upper elementary students as a comprehension component.
The DIBELS is not designed to be nor is it intended to be a thorough assessment of
children's reading. Rather, the measures are “indicators,” or “a brief, efficient index that provides
a fair degree of certainty about a larger, more complex system or process” (Good III &
Kaminski, 2011). Because each test is a snapshot of students' performance at a point in time, they
are quick to administer, each generally taking no more than one minute.
The first DIBELS measure is Initial Sound Fluency (ISF) which requires students to
isolate and identify the initial sound in a given word. Letter Naming Fluency (LNF) measures the

23
rate at which students can identify letters presented in random order. Though identifying letters
by name is not recognized as a basic early literacy skill, it is considered a robust indicator of
future reading skill, thus included in the DIBELS battery. It is given during kindergarten
alongside the ISF. A third test, Phoneme Segmentation Fluency (PSF), is also introduced in
kindergarten, though later in the year than ISF and LNF and given through early first grade. The
assessor orally gives students a word which they are then expected to break into its component
sounds and repeat individually.
Nonsense Word Fluency is given over a longer time span than the three previous
assessments, from the middle of kindergarten to early second grade. It consists of a series of
consonant-vowel-consonant (CVC) and vowel-consonant (VC) pseudo-words which students
read by applying common decoding rules. NWF can measure fluency in both decoding sound by
sound and by reading whole words. The final DIBELS test pertinent to this study is Oral Reading
Fluency (ORF), a one-minute reading of a grade-level passage. Since this test is given from the
middle of first grade all the way through the end of elementary school it can provide a long-term
overview of a student's fluency growth on grade-level passages. After the reading is complete the
student retells what he or she remembers from the text as a simple comprehension check.
A number of studies have questioned the usefulness of DIBELS as a literacy
measurement especially as its use by school districts increased in the years following the release
of the National Reading Panel's 2000 report and the growth of teacher accountability under the
then still-new No Child Left Behind. By mid-decade numerous authors cautioned users about
DIBELS' limits and usefulness as a diagnostic tool (Kamii & Manning, 2005; Pressley, Hilden,
& Shankland, 2005). In their critique of DIBELS Tierney and Thomes (2006) suggest that using
DIBELS to monitor student reading leads to better DIBELS scores in the future but not
necessarily to “improve[d] literacy performance and the advancement of literacies in society” (p.
51). They complain that while well-intentioned, DIBELS may be better at creating good DIBELS

24
testers than better readers.
Despite these cautionary voices, DIBELS remains widely used, bolstered by its own body
of literature supporting its effectiveness. This research has been conducted not only by the
creators of DIBELS (Cummings, Kaminski, Good, & O'Neil, 2011; Good, Baker, & Peyton,
2008; Good, Simmons, & Kame'enui, 2001; Powell-Smith, Kaminski, & Good, 2011) but by
external authors who are less invested in the program's success (Burke, Hagen-Burke, Kwok, &
Parker, 2009; Catts, H. W., et al., 2009; Riedel, 2007; Roehrig, et al., 2008). Despite any
disagreement over the usefulness of using DIBELS to monitor student reading progress, it has
become perhaps the most widely used single tool to track this progress. Since its inception in
1998 it has been used in over 15,000 schools in all 50 states (UO DIBELS Data System, 2012).
As of 2006 it was being administered to over 2,000,000 students (Goodman, et al., 2006) and just
a few years later it was utilized by 1 out of 6 public schools.
DIBELS as a Predictive Tool for Reading Success
The usefulness of DIBELS as a tool to predict future reading failure and success has been
the focus of numerous studies which have reported a range of findings depending on the specific
subtests in question and the longitudinal nature of the research. Initial Sound Fluency, the first of
the DIBELS tests, is not heavily researched but is supported by some of the available literature.
The predictive power of ISF was demonstrated in a study conducted across three school
districts involving approximately 1,100 students (Cummings, et al., 2011). In 2006 kindergarten
students in three districts in the Midwest, Rocky Mountain West, and Pacific Northwest were
administered the ISF and LNF at the beginning, middle, and end of the academic year, and the
NWF and PSF at the middle and end of the year. A much smaller group of students, just over 80,
were given the Phonemic Awareness Composite, Sound Matching subtest scaled score, Elision
subtest scaled score, and Blending Words subtest scaled score, all components of the

25
Comprehensive Test of Phonological Processing. Initial Sound Fluency was found to have
medium to large correlations to LNF, NWF and PSF assessments given later over the course of
the year; it was also slightly more predictive than its DIBELS predecessor, ISF. Unfortunately,
while the overall student population of the districts included in the study is broken down by race,
socioeconomic status, and ELL designation, these demographics are not available for the specific
students involved in the study. Therefore, it is impossible to determine how the correlational
findings might apply to ELL students.
A separate study by the DIBELS authors (Dewey, Latimer, Kaminski, & Good 2012)
found similar results though it measured predictive strength only over the course of one
academic year. Their study involved 609 students in kindergarten, first, third, fourth, and fifth
grades in one Northwestern school district. Only some of these are relevant to the ISF portion of
the study. The ISF data reflect 97 participants, PSF had 96 participants, NWF-correct letter
sounds (NWF-CLS) had 90 participants, and NWF-whole words read correctly (NWF-WRC)
had 86 participants. All data were collected from the same three benchmarks: middle-of-year,
middle-of-year alternate form, and end-of-year. The report showed that Initial Sound Fluency
had a strong correlation (.74) relationship with middle-of-year Phoneme Segmentation Fluency,
moderate-strong correlation (.53) with end-of-year PSF, moderate relationship (.34) with end-of-
year Nonsense Word Fluency with correct letter sounds and only a small (.25) correlation with
NWF with words read completely and correctly. This study gives no indication as to the number
of ELL students who were counted in the findings nor how their scores compared to native
English-speaking peers.
The next portion of the DIBELS battery, Nonsense Word Fluency, has some support as a
measure predictive of future Oral Reading Fluency (Vanderwood, Linklater, & Healy, 2008). A
group of 280 ELL first grade students in one Southern California school were given the NWF
three times over the course of one year. That same cohort was then given the DIBELS ORF three

26
times during their third grade year; of the original 280 students tracked in the study, only 150
remained two years later, of whom 134 were identified as ELL. The vast majority of this group,
89%, spoke Spanish as a first language. The remaining 11% percent spoke unspecified languages
at home.
Analysis using the Pearson correlation showed that ELL status and all three NWF data
points across the first grade year had significant correlations to third grade Oral Reading
Fluency. Using the NWF cut-off scores devised by the authors of DIBELS to determine whether
a student was “at risk” or “not at risk,” the authors' predictive accuracy results showed that
NWF's ability to correctly identify future successful readers was satisfactory. The sensitivity
level, especially for identifying future poor readers, was not similarly satisfactory. The NWF was
not sufficiently sensitive, resulting in a high number of false-negatives. For ELL students
classified in the group with the lowest English proficiency; of those deemed to be “not at risk” in
first grade by NWF, over half were “below expectations” by third grade, indicating that with the
weakest English speakers NWF alone was not an adequate predictive tool.
Nelson (2008) compared the accuracy of DIBELS outcomes to results from the Test of
Phonological Awareness - 2nd Edition: Plus (TOPA-2+) and the Woodcock-Johnson Test of
Achievement, Third Edition (WJ III). The study included 177 kindergarten students from ten
classrooms and two schools in a small Midwestern city. While race statistics were provided, the
results reflect outcomes of a predominately white population (92.7%) and provide no insight to
the language status of any of the students.
In this study the NWF had scores very similar to comparable assessments in the TOPA-2+
and WJ III at both 75% sensitivity and 90% sensitivity levels. It was much less successful in its
specificity measures with scores ranging from .42 to .72. The subtest also failed to demonstrate
positive predictive power, the criteria generally used to decide which students will be included in
specific interventions using the measure. Nelson's findings indicate that the NWF in addition to

27
other DIBELS scores were more effective at identifying readers with adequate skills than readers
with inadequate skills.
Only one study has taken an in-depth look at the outcomes of ELL and native English
students on the DIBELS NWF. Fien et al (2008) collected data over three years as part of
Oregon's Reading First initiative from 34 participating schools (33 schools during the third year).
Approximately half of these schools were in urban areas while the rest were split evenly between
midsize cities and rural districts. The schools represented fourteen school districts. The school
demographics suggest a diverse student body. While exact numbers varied across data collection
points over three years, approximately 15,000 students participated in the study. Of that group
77% qualified for free and reduced-price lunch, 54% were categorized as members of a minority
group, and 34% were identified as ELLs.
The NWF was administered six times: during winter and spring of kindergarten year, fall,
winter, and spring of 1st grade year, and fall of 2nd grade year. Each of those scores was then
compared to the results of the ORF which was administered in the spring of 1st grade and spring
of 2nd grade, as well as the SAT-10 which was given during the spring of kindergarten, 1st grade,
and 2nd grade. Because the sample size was so large, even a moderate correlation of .23 would
have been statistically significant. To get more meaningful results the authors decided to interpret
the correlations as effect sizes instead and used squared correlations and differences between
those squared correlations. The correlations ranged from .51 to .76 and unsurprisingly they grew
stronger as the time between compared assessments decreased. The lowest overall correlation –
though still moderately strong at .51 – was between the NWF given during the winter of
kindergarten and the ORF given during the spring of 2nd grade. The highest overall correlations
were between the NWFs administered during the winter and spring of 1st grade with the ORF
given during spring of 1st grade, both at .76.
Across all eleven test comparison points the native English speakers' scores reflected

28
higher correlations than their ELL peers, though in only three were the differences statistically
significant. These three data points were winter kindergarten NWF/ spring 1st grade ORF, fall 1st
grade NWF/spring 1st grade ORF, and winter kindergarten NWF/spring 2nd grade ORF. The
authors suggest that the lower correlations which primarily involve the winter kindergarten NWF
assessments possibly are related to the steeper learning curve many ELLs experience gaining
mastery of letter sounds or for another unknown reason is simply more “demanding or
confusing” (p. 403) for ELLs than native English speakers.
Phoneme Segmentation Fluency, usually administered from mid-kindergarten until the
end of first grade, has modest evidence supporting its use as both a progress monitoring tool and
an accurate predictor of future reading success. Kaminski and Good (1996) researched the
effectiveness of PSF in a study conducted at a rural elementary school in the Pacific Northwest.
Two cohort groups were utililized, one of 37 kindergarten students and one of 41 first grade
students. Each cohort was further divided into two groups, one of which received regular
progress monitoring with DIBELS' PSF.
Compared with the Rhode Island Pupil Identification scale, the McCarthy Scales of
Children's Abilities, and a teacher rating scale, the DIBELS proved to be a reliable measure of
student growth on Letter Naming Fluency (a subtest no longer used), Picture Naming Fluency (a
preschool progress monitoring tool), and PSF. The authors found considerable reliability in the
assessment level estimates, .97 to .99 for the kindergarten subjects. Reliability was lower for first
grade students but still above .80. The study provides no details about the usefulness of PSF with
ELL students.
A separate in-depth statistical analysis (Goffreda, Diperna, & Pedersen, 2009) sought out
the predictive power of four DIBELS subtests, LNF, PSF, NWF, and ORF for two standardized
reading tests, the TerraNova California Achievement Test (CAT) Assessment, administered in 2nd
grade, and the Pennsylvania System of School Assessment (PSSA), administered in 3rd grade.

29
For this study the authors used 67 1st grade students from a rural Pennsylvania school district.
Though 22% of the students were classified in a minority racial or ethnic group, no native
language background was reported.
Using binary regression analysis the study found that all four of the DIBELS tests taken
together were a significant predictor of proficiency on the CAT. Similarly, all four taken together
were a significant predictor of passing the PSSA. When assessed individually, only ORF had
significant predictive power. PSF was the least accurate predictor of CAT achievement (p = .57)
and the second most accurate (though not significant) predictor of PSSA achievement (p = .16).
Good, Simmons, and Kame'enui (2001) investigated the ability of the PSF to predict
year-over-year ORF scores in first grade. Fifty-six students at one elementary school in the
Pacific Northwest were assessed with PSF in kindergarten and then ORF in first grade. No
further demographic information about the students was provided, thus it is impossible to
determine whether the findings apply similarly to ELL students with varying home languages.
Using DIBELS' benchmark scores for each test, the authors found that the PSF's
predictive accuracy was strong with student who scored 35 or higher on the assessment when
given during the Spring of kindergarten year and also with those who scored 10 or below. Of the
higher scoring group, 92% read 40 or more words on the ORF at the end of 1st grade and of the
lower-scoring group 89% failed to reach the end-of-grade reading benchmarks. The largest group
of students (27) scored between 10 and 40 on the PSF correlation with 1st grade reading success
was mixed, with only 35% of them reaching 40 or more words on the ORF.
A separate component of the same study using a much larger population (n=302) found
that PSF was not very strong in predicting success on the next chronological DIBELS
assessment, the NWF, which was administered during the winter of 1st grade, a few months
before the ORF. Only 55% of students who met the kindergarten PSF benchmark also met the 1st
grade NWF benchmark. This was well below the other four comparison groups, OnRF (revised

30
later as the ISF) and PSF, NWF and ORF first grade, ORF 1st grade and ORF 2nd grade, and ORF
3rd grade spring and OSA (a standardized achievement test of reading and literature) 3rd grade
spring. In all four other assessment comparisons at least 90% of students who met satisfactory
levels on the first test also met benchmark levels on the subsequent test. As the authors point out,
however, this discrepancy may not reflect problems with the PSF so much as it might point out
curricular and instructional deficits in teaching the early literacy skills measured by the PSF's
successor test, the NWF.
The final DIBELS assessment designed for early elementary students is the Oral Reading
Fluency, a measure which is generally administered beginning in the middle of first grade. It is
then readministered up to three times per year through students' elementary years. ORF is by far
the most thoroughly researched of the DIBELS tests in regards to its ability to predict future
reading success, both on a short-term basis and longitudinally over several years.
Roehrig et al. (2008) carried out a study which measured the accuracy of ORF in
predicting future reading comprehension. They used a data set drawn from a sizable student
population of 35,207 third graders from Reading First schools in Florida. Unlike many studies
noted above, these authors provided demographic information including race, ELL status,
socioeconomic status, and some disability information. The sample population was deemed to be
similar to the greater Florida student body as a whole. The larger group was split into two
smaller, one for calibration and one for cross-validation.
In addition to comparing DIBELS scores to each other across one school year, the authors
also compared them to the Stanford Achievement Test (SAT-10), a standardized reading
comprehension test, and the Florida Comprehensive Assessment Test – Sunshine State Standards
(FCAT-SSS), the state's achievement test used to measure student reading proficiency for NCLB
purposes. Both the SAT-10 and FCAT-SSS are administered in the spring. Normally the ORF is
only given three times in a school year but the students in the sample actually took it four times

31
over the year. The final ORF test, given in the spring, took place after students had taken the
SAT-10 and FCAT-SSS so those scores were not included in the final results.
By using a receiver-operating characteristic (ROC) curve, the study found statistically
significant correlations between the results of the Fall ORF scores and the Winter 1 and Winter 2
scores. The area under the curve (AUC), a value which measures the probability that an
independent variable correctly classifies a pair of individual data, returned results between .88
and .92 with 1.0 representing a perfect classification. The AUC scores between ORF and FCAT-
SSS and SAT-10 grew from .66 to .71 with a steady increase with each administration of the
ORF. Since these authors had access to limited demographic data they were able to use a logistic
regression analysis to determine that the ORF identified at risk readers equally well regardless of
any specific demographic characteristic.
Other Measurements of Literacy Achievement
In assessing student literacy achievement levels, multiple data points consisting of
various assessment tools provides the practitioner with a more thorough and nuanced picture of
student performance. Another commercial testing product now utilized by school districts in all
fifty states is the Measures of Academic Progress (MAP), which gives teachers a detailed profile
of student reading skills (Gray et al., 2012; Long & Huebner, 2014). In addition, since the
passage of No Child Left Behind states have created their own unique tests to meet requirements
set forth by the legislation determine levels of reading and math proficiency in students third-
grade and above. Similarly, states have devised instruments to specifically test the English
proficiency of English Language Learners across various communication domains.
Measures of Academic Progress
The Measures of Academic Progress is a series of adaptive tests based on unidimensional
32
item response theory (IRT) delivered via computer that were originally developed by Northwest
Evaluation Association (NWEA) in 2000 and have been published by them since. The adaptive
feature means that the tests are dynamic and the questions vary based on an individual student's
performance throughout the duration of the assessment. The MAP's reading portion gives
feedback over four broad areas of literacy: Word Meaning, Literal Comprehension, Inferential
Comprehension, and Evaluative Comprehension (NWEA, 2014; Wang, McCall, Jiao, & Harris,
2013).
Some recent research has focused on the use of computer adaptive testing (CAT), of
which the MAP is an example, and its effectiveness as a universal screening tool in place of
curriculum-based measurements (CBMs) such as DIBELS. They have been found to have at
least moderate predictive validity when compared with other tools and to have strong internal
reliability with the ability to predict more variability than CBM alternatives (Ball et al., 2001;
Ball & Christ, 2012; NWEA, 2009). School personnel will find trade-offs using a CAT in place
of a CBM. CATs require a greater investment of time to administer and they generally are more
expensive. They can be delivered to groups of students, however, as opposed to individually and
they offer a greater breadth of student skill assessment.
Socioeconomic Status and Academic Achievement
An important confounding factor in assessing the impact of any school initiative on ELLs
is the incidence of low socioeconomic status (SES). Children who come from homes classified
as low SES – regardless of the language spoken within that home – frequently demonstrate lower
academic achievement than peers from homes with higher SES status. In addition to low income,
these low SES homes often have parents with low levels of educational attainment and jobs with
low prestige (Hoff, 2013). Nearly 22% of children come from low-SES homes so poor that they
are considered to be in poverty (Tavernise, 2011).

33
A number of reasons have been put forth for the lower academic outcomes frequently
shown by students classified as low socioeconomic status (SES). Overall, poorer parents discuss
school less with their children and have lower achievement expectations (Zhang, et al., 2011).
The home environments of students from low and high SES backgrounds vary significantly.
Language exposure increases dramatically with household income. Student vocabulary appears
to be significantly impacted by family SES status, with poorer children disproportionately
represented in the bottom half of vocabulary test scores (Arriaga, Fenson, Cronan, and Pethick,
1998). More specifically, children as young as three from wealthier homes demonstrated a
vocabulary twice that of their poorer counterparts (Hart & Risley, 1995).
Low SES students are more likely to attend schools with larger numbers of poor students
which, in turn, tend to attract a lower-caliber teaching staff. Teachers who graduate from better
colleges and score higher on standardized tests do show greater gains with their students in the
classroom but are less likely to work at low-income schools (Greenwald, Hedges, and Laine,
1996). There is also evidence that low-SES populations receive more procedural instruction (i.e.
memorization, rote computation, low-level problem solving) than their advantaged peers who
receive more conceptual instruction (i.e. critical thinking, evaluating, reasoning) (Kozma &
Croninger, 1992; Smith, Desimone, & Ueno, 2005). Time spent on instruction is especially
important for these disadvantaged students (Desimone & Long, 2010 ).
Not only do low-SES students start off their schooling with fewer skills than higher-SES
students, they are more likely to demonstrate lower achievement trajectories over the course of
their school career (Dauber et al., 1996; Luster & McAdoo, 1996; Sirin, 2005). In the best case
scenarios disadvantaged students start behind their advantaged classmates and learn at the same
rate, thus never closing the achievement gap but not necessarily falling further behind (Entwisle
et al., 2003). In some instances, however, children from low-SES households begin school with
fewer academic skills only to see the achievement gap widen over the course of succeeding years

34
(Caro, McDonald, & Willms, 2009).
ELL students are more likely to come from low-income homes than their English-
speaking peers as evidenced by schools with high numbers of low SES students having
disproportionately more ELL students than schools with fewer poor students (Ransdell, 2012;
Warschauer, 2003). Keigher (2009) reports that the 2007-2008 Schools and Staffing Survey
showed that more than 60% of ELLs qualified for free and reduced lunch, a common indicator of
low family income. This compared to just half that number – 30% - of English-speaking students
who qualified for free and reduced lunch. Broadly speaking, homes with bilingual families
disproportionately fall in the category of low SES (Haskins, Greenberg, & Fremstad, 2004).
DIBELS as a Predictive Tool for Students from Low Socioeconomic Status
The effects of low-SES status on student achievement are mirrored in their specific
achievement in the domain of reading. Much of this seems to begin at home where low-income
parents do not nurture the early development of literacy to the same extent as wealthier families
(Haycock, 2003; Heath, 1991; McCormick, 2003). Further research suggests that student income
levels are connected to the type of reading instruction they receive and to the quality of discourse
to which they are exposed in the school environment (Finn, 1999; Hicks, 2002).
The skills that DIBELS assesses have individually been linked to SES patterns, with
higher-SES students scoring better on them. Income is strongly linked to performance on
phonemic awareness, letter identification, and basic word recognition, moderately linked to
performance on reading fluency, and weakly or not at all linked to reading comprehension.
Focusing on one of the earliest literacy skills, Bowey (1995) looked at a sample of 148
Australian preschool children over a two-year span from kindergarten through first grade. In
addition to differences in IQ, letter knowledge, early reading ability, and language skills such as
receptive vocabulary and verbal working memory, Bowey (1995) examined phonemic awareness

35
scores between low-, middle-, and upper-income students. Her multiple regression analysis
showed that students from low-income households had considerably less developed phonemic
awareness than classmates from higher-income households even after controlling for IQ and
verbal ability.
Similar results were found in a British study examining approximately 150 elementary
students from one high SES and one low SES school. Letter awareness was significantly
different, especially in the younger grades, while Nonsense Word Identification was significantly
different in all the grades under review (Duncan & Seymour 2000).
The role of SES on Oral Reading Fluency is less clearly defined. A study of over 1,000
South Dakota third, fourth, and fifth graders (which included only significant numbers of
Caucasian and Native American students) revealed statistical significance in regards to the
contribution of SES on ORF scores for third an fifth grade students but not for fourth grade
students (Gayle & Pearce, 2008). Conversely, in a smaller study of 215 third graders in six urban
and two rural schools, Paleologos and Brabham (2011) found that the proficient ORF scores did
not significantly predict actual comprehension scores in low-income students.
Inclusion Criteria
The research literature used for this dissertation was primarily located using the Google
Scholar search engine to access various databases such as ERIC, Academic Search Complete,
ProQuest Research Library, Academic OneFile, and SAGE Premier 2013. These resources were
available through the University of Kansas Libraries website.
The following criteria were used to choose the literature utilized in this research:
1. Peer reviewed articles, studies, or publications about beginning reading which included key
terms “ELL,” “ELL,” “phonological awareness,” and “early literacy.”
2. Peer reviewed articles, studies, or publications about ELL reading achievement which

36
included key terms “DIBELS,” “predictive,” “Measures of Academic Progress,” “second
language acquisition,” and “reading achievement.”
3. Peer reviewed articles, studies, or publications which provided research results concerning
English language learners and the National Reading Panel's five big ideas in beginning reading.
4. Peer reviewed articles, studies, or publications which were cited in resources included in this
dissertation to the extent they were relevant to its focus.
5. Peer reviewed articles, studies, or publications suggested by dissertation committee members
and other consulted faculty.
This literature review will further inform the reader about basic successful early reading
strategies for ELL students and why it is important to answer the questions guiding this study.
Using Bachman’s theory of assessment use, the school district’s ongoing use of specific test
scores to identify students in need of specific intervention services is justified because the goal is
to grow overall reading ability. Together, this study's literature review and questions regarding
commonalities and differences in literacy acquisition between language groups will provide
guidance for district administrators, both within the Kansas district profiled here and for others
with growing ELL populations, on how to adjust instruction and achievement expectations for
different subgroups if outcomes vary by subgroup using common instruction strategies, tiered
interventions, and progress monitoring tools.

37
Chapter III
Method
In order to identify potential differences in DIBELS' reliability and the rate of literacy gains
between language groups and SES status, it was necessary to find a sample of students that was diverse
in language backgrounds and home economic status. A certain level of population stability was
preferred to allow for longitudinal analysis.
Participants
The participants in this study included approximately 967 students enrolled in a medium-size
(<100,000 population) city in Kansas from the 2007-08 to 2011-12 academic school years. The
demographics for this Kansas school district for the 2013-14 school year as reported on the Kansas
Department of Education website were as follows: 70.5% White, 14.9% Other, 7.5% Hispanic, and
7.1% African American. Within this population 35.4% were identified as economically disadvantaged,
12.2% had a disability and received special education services under the Individuals with Disabilities
Education Act (IDEA), and 95.3% were enrolled for the full academic year. The ELL population
includes 7.4% of the district's students. Because of the way demographic information is reported to the
state it is not possible to determine with certainty what percent of students identified as English
language learners are of Hispanic background and how many are of East Asian, Mideastern, or other
linguistic backgrounds.
Four elementary schools were included in the study. Their demographic information as reported
on the Kansas Department of Education website was as follows.
School 1: 61.9% White, 21.8% other, 12.6% Hispanic, and 3.7% African American. Within this
population 45.6% were identified as economically disadvantaged, 8.8% had a disability and received
special education services under the Individuals with Disabilities Education Act (IDEA), and 96.3%
were enrolled for the full academic year. The ELL population includes 23.5% of the school's students.

38
School 2: 41.5% White, 35.1% other, 17.8% Hispanic, and 5.6% African American. Within this
population 59.6% were identified as economically disadvantaged, 7.8% had a disability and received
special education services under IDEA, and 96.1% were enrolled for the full academic year. The ELL
population includes 61.3% of the school's students.
School 3: 55.1% White, 18.2% other, 15.8% Hispanic, and 10.9% African American. Within
this population 59.5% were identified as economically disadvantaged, 9.6% had a disability and
received special education services under IDEA, and 95.0% were enrolled for the full academic year.
The ELL population includes 21.0% of the school's students.
School 4: 66.0% White, 17.3% other, 9.0% Hispanic, and 7.7% African American. Within this
population 38.7% were identified as economically disadvantaged, 10.6% had a disability and received
special education services under IDEA, and 96.0% were enrolled for the full academic year. The ELL
population includes 13.0% of the school's students.
The general education classroom teachers at all four schools provided whole group and small
group reading instruction during the day. All classroom teachers in these schools have received their
ESOL endorsement from the state of Kansas or are required to be working toward the endorsement to
remain employed at these schools.
Two of the four schools had additional math and reading service providers funded through Title
1, who provided extra instruction for at-risk students. The other two schools had instructional support
assistants (ISA) in both math and reading who provided extra instruction for at-risk students. These ISA
staff are funded by the district and placed in schools that do not qualify for Title 1 support staff. ELL
students qualify for these services under the same guidelines as do native English-speaking students.
All four schools had ELL staff members specifically hired to work with and support ELL
students. They assess students' English proficiency using the Kansas English Language Proficiency
Assessment (KELPA), develop individualized student plans which focus on speaking, listening,
writing, and reading, implement instruction to achieve the student plan goals, and monitor student

39
progress toward those goals. ELL paraeducators assist in carrying out some of these tasks.
A small number of ELL students receive support from special education staff if they qualify
under the requirements proscribed by IDEA. Teacher of students with disabilities at these four schools
are also required to earn their ELL endorsement from the state of Kansas in addition to the
endorsements necessary to work with special needs students. ELL students receiving special education
services will have an Individualized Education Plan (IEP) developed with the IEP team (parents,
teachers, support staff) which includes goals toward which special education staff work and provide a
variety of levels of support. Special education paraeducators assist in carrying out some of the
instructional and support tasks.
These tiered intervention services look similar between the schools though there will be
differences due to the autonomy allowed by district administrators and certainly among teachers as is
the case with all instructional implementation. While the district stresses a preference for “push-in”
services, this can look different in varying situations. Intervention service is provided in the general
education classroom when possible, but the student needs sometimes require a separate setting for the
most effective instruction and sometimes logistics (classroom size, number of teachers providing
intervention services, etc.) dictate that student groups meet somewhere besides the general education
classroom. Intervention services are encouraged by district leaders to be provided during the language
arts block though not during core instruction.
Questions
1. When comparing the cut score ranges of beginning of year and end of year reading assessments
over single year and multi-year intervals, are there significant differences between the ratios of English,
Spanish, and Other ELL students in each language group which begin and end in the At Risk and Low
Risk groups?
This question has seven components:

40
A. When comparing the cut score ranges of the beginning of year DIBELS Letter Naming
Fluency to the end of year Letter Naming Fluency for kindergarten students, are there significant
differences between the ratios of English, Spanish, and Other ELL students in each language group
which begin and end in the At Risk and Low Risk groups?
B. When comparing the cut score ranges of the beginning of year DIBELS Nonsense Word
Fluency to the end of year Nonsense Word Fluency for first grade students, are there significant
differences between the ratios of English, Spanish, and Other ELL students in each language group
which begin and end in the At Risk and Low Risk groups?
C. When comparing the cut score ranges of the beginning of year DIBELS Letter Naming
Fluency for kindergarten students to the end of first grade Nonsense Word Fluency cut score ranges, are
there significant differences between the ratios of English, Spanish, and Other ELL students in each
language group which begin and end in the lowest and highest achievement groups?
D. When comparing the cut score ranges of the beginning of year DIBELS Oral Reading
Fluency to the end of year Oral Reading Fluency for second grade students, are there significant
differences between the ratios of English, Spanish, and Other ELL students in each language group
which begin and end in the At Risk and Low Risk groups?
E. When comparing the cut score ranges of the beginning of year DIBELS Letter Naming
Fluency for kindergarten students to the end of second grade DIBELS Oral Reading Fluency cut score
ranges, are there significant differences between the ratios of English, Spanish, and Other ELL students
in each language group which begin and end in the lowest and highest achievement groups?
F. When comparing the beginning of year MAP percentile groupings for third grade students to
the end of year MAP percentile groups, are there significant differences between the ratios of English,
Spanish, and Other ELL students in each language group which begin and end in the lowest and highest
achievement groups?
G. When comparing the cut score ranges of the beginning of year DIBELS Letter Naming

41
Fluency for kindergarten students to the end of third grade MAP percentile groups, are there significant
differences between the ratios of English, Spanish, and Other ELL students in each language group
which begin and end in the lowest and highest achievement groups?
2. Do any of the other ELL groups (Arabic, Chinese, Korean, Lao, and Vietnamese) have
significantly different ratios of students in the lowest and highest reading categories as disaggregated in
question one? The question one subquestions were the same as for question two. However, instead of
comparing three groups (English, Spanish, Other ELL), there were seven. Native speakers of languages
other than English and Spanish, analyzed as a single group in question one, were examined individually
in question two.
3. Does socioeconomic status (SES) as measured by free and reduced lunch status significantly
affect the ratios of students in each language group who score in the lowest and highest reading
groupings?
Research Design
In order to answer the research questions most effectively, it was necessary to use a quantitative
analysis approach. This study uses a causal comparative, non-experimental design which utilized ex
post facto data (from the Latin “after the fact”). The data collected covered a period of five years, from
the 2007-2008 to 2011-12 school year. A causal comparative study seeks to establish cause-effect
relationships explaining existing differences between two groups (Fraenkel & Wallen, 1996; Gay,
1996). The focus of this research is to identify a variable which differentiates the groups and isolate the
important factor that led to this difference. This study is considered a non-experimental design because
the students, for practical reasons, were not randomly selected to participate in the study nor were they
randomly assigned to groups.
The DIBELS was used district-wide beginning in kindergarten to screen for needed literacy
42
interventions and to create a longitudinal database that would allow district personnel to track reading
growth across large numbers of students. While some schools used DIBELS progress monitoring more
frequently, all schools used it at least three times per year, in the fall, winter, and spring. These scores
could be compared to classroom, school, district, and national norms. Regular review of DIBELS data
at the classroom and building level allowed for timely interventions and changes in instruction as
needed.
MAP has been rolled out in the district’s schools more recently than was DIBELS. Initially it
was used to assess math progress in the intermediate grades but has been phased backwards to finally
encompass K-5. During this process schools also began using the MAP reading assessment, again
starting with third grade and above and phasing in the lower grades over time.
The DIBELS was administered by a number of staff members throughout the buildings. These
staff could include general education teachers, Title 1 service providers, instructional support assistants,
ELL teachers, special education teachers, and paraprofessionals. The responsibility for progress
monitoring was determined by different criteria such as time availability and familiarity with the
students. All DIBELS administrators were trained by district staff in the proper use of the various
subtests.
The MAP was administered by general education teachers with assistance from various building
staff members who could include Title 1 service providers, instructional support assistants, ELL
teachers, special education teachers, and paraprofessionals. The primary responsibility of staff was to
log students into the appropriate MAP test and then monitor progress to ensure students appeared to
make a quality effort in answering question. They do not provide any instructions or guidance in
answering questions.
Selection Criteria
All participants were students in one of the district's four ELL schools between the 2007-08 and

43
2011-12 school years. They were enrolled in kindergarten, first, second, or third grade for at least one
year during that period and were assessed with the same DIBELS subtest or MAP twice during that
year, one of the two administrations being the end-of-year test. Students were identified as ELL based
on their classification in the district's Viewpoint database. They were chosen for this study if their home
language was recorded as anything other than English. Native English speaking students were chosen
randomly from students with a listed home language of English.
Data Collection
The scores from students grouped together according to home language as recorded in
Viewpoint were compared against each other. The student language groups compared in this study were
English, Spanish, Chinese, Lao, Arabic, Korean, Vietnamese and all other languages. The cut-off scores
to determine reading levels of Low Risk (coded as “1” in this study), Some Risk (coded as “2”), and At
Risk (coded as “3”) were provided by DIBELS and were based on their procedures using a national
pool of students. The same coding procedure was used with MAP. Low Risk (coded as “1” in this
study) was associated with the top 1/3rd percentile, Some Risk (coded as “2”) was associated with the
middle 1/3rd percentile, and At Risk (coded as “3”) was associated with the top 1/3rd percentile.
Instrumentation
Ex post facto data for this study was collected through the school district's online data
warehouse system, Viewpoint. Student data available in Viewpoint go back to the 2007-08 school year
and include demographic, attendance, discipline, academic, and assessment reports. These data can be
further disaggregated by such variables as gender, ethnicity, ELL status, home language, migrant status,
special education status, and free and reduced lunch status.
Student DIBELS and MAP scores were retrieved from Viewpoint for the 2007-08 through 2011-
12 school years. These data were recorded in a Microsoft-compatible spreadsheet and then manipulated
in Excel for analysis. The data reflected performance on DIBELS' Letter Naming Fluency, Initial

44
Sound Fluency, Phoneme Segmentation Fluency, Nonsense Word Fluency, and Oral Reading Fluency
along with MAP reading scores for students enrolled in the school district's four ELL schools.
Score categories for the DIBELS subtests and score percentiles for MAP reading tests were
compared between the home language groups in the four ELL schools in this one medium-size Kansas
school district. Tests administered at the beginning of kindergarten, first grade, second grade, and third
grade were compared to both end-of-year DIBELS (kindergarten, first grade, and second grade) and the
end-of-third grade MAP reading to determine at what point educators could begin to confidently infer
that an ELL student was at serious risk of not achieving grade level reading skills.
Kindergarten Assessments
During the kindergarten year the Initial Sound Fluency subtest is given at the beginning (first
three months) and middle (months 4-6) of the school year. During the beginning of the year a score of
0-3 puts a student at risk, a score of 4-7 indicates some risk, and a score of 8 and above is considered
low risk. By the middle of the year a score of 0-9 indicates a deficit, a score of 10-24 indicates the skill
is emerging, and a score of 25 or above shows the skill is established. In general ISF is not
administered past this point.
Letter Name Fluency is also given at the beginning and middle of kindergarten and then also at
the end of the school year. At Risk scores are 0-1, 0-14, and 0-28 during the beginning, middle, and end
of year respectively. Some Risk scores are 2-7, 15-26, and 29-39 across the three testing periods. Low
Risk scores are 8 and above, 27 and above, then 40 and above.
Phoneme Segmentation Fluency, the third subtest, is not administered until the middle of
kindergarten. Middle-of-year scores are 0-6 (At Risk), 7-17 (Some Risk), and 18 and above (Low
Risk). End-of-year scores are 0-9 (Deficit), 10-34 (Emerging), and 35 and above (Established).
The fourth and final DIBELS assessment given during kindergarten is Nonsense Word Fluency,
administered during the middle of the year and then again at the end of the year. At Risk scores are 0-4

45
and 0-14 respectively over those two time points. Some Risk scores are 5-12 and 15-24 respectively
and Low Risk scores are 13 and above and 25 and above respectively.
First Grade Assessments
During first grade four DIBELS tests are also given, though the battery changes slightly. Initial
Sound Fluency is dropped while Oral Reading Fluency is added later in the year. The first subtest,
Letter Naming Fluency, is generally only given once, at the beginning of the academic year. Children
are considered At Risk if they score 0-24, at Some Risk if they score 10-34, and at Low Risk if they
score 37 or above.
The Phoneme Segmentation Fluency (PSF) test is administered three times, at the beginning,
middle, and end of the year. Risk status scores stay consistent for the entire year; cutoff scores do not
increase from beginning to the end of the year. A score of 0-9 places a child in the Deficit range. A
score of 10-34 places a child in the Emerging range and a score above 34 places a child in the
Established range.
Like the PSF, the Nonsense Word Fluency test is given three times over the school year. During
the first round of assessing cutoff scores are 0-12 (At Risk), 13-23 (Some Risk), and 24 and above
(Low Risk). Cutoff scores rise for the mid-year assessment and stay the same for the end of the year.
Students are considered to be in the Deficit range if they score 0-29, the Emerging range if they score
30-49, and Established range if they score 50 or above.
Twice during first grade – at the middle and end of the year – students are assessed with the
Oral Reading Fluency. At the year's midpoint a score of 0-7 puts a child At Risk. A score of 8-19 places
a child in the Some Risk range and a score of 20 and above in the Low Risk range. At the end of the
year a child who scores 0-19 is considered At Risk, 20-39 as having Some Risk, and 40 or above as
Low Risk.
During the period in which data collected for the district were reviewed for this study, the

46
school district began using the MAP as both a progress monitoring and summative assessment tool.
Schools began using it in different years so some schools have more first grade results than others.
In the fall, raw MAP scores are identified as follows: bottom 33rd percentile of test takers < 155,
the 34th to 66th percentile of test takers score between 155 and 165, the 67th to 94th percentile of test
takers score 166 to 180, and test takers in the 95th percentile and above score 181 or higher.
In the spring, raw MAP scores are identified as follows: bottom 33rd percentile of test takers <
171, the 34th to 66th percentile of test takers score between 171 and 183, the 67th to 94th percentile of
test takers score 184 to 200, and test takers in the 95th percentile and above score 201 or higher.
Second Grade Assessments
By second grade only two DIBELS progress monitoring tests are given, the NWF and the ORF.
The NWF is given only once, at the beginning of the year. A child who scores 0-29 is in the Deficit
range. A score of 30-49 indicates a child is Emerging while a score of 50 or more indicates they are
Established in this skill.
The other test, ORF, is given at three points over the year. Beginning-of-year scores are 0-25 At
Risk, 26-43 Some Risk, and 44 and above Low Risk. It should be noted that although the cut scores are
only a few points higher than the end-of-first grade scores, the reading passages are considered grade
level and are thus more difficult than those used in first grade.
As with data collected for first grade students, MAP results vary across schools because they
did not all begin using MAP with second grade students at the same time. Thus, some schools report
more second grade MAP data than others. In the fall, raw MAP scores are identified as follows: bottom
33rd percentile of test takers < 174, the 34th to 66th percentile of test takers score between 175 and 182,
the 67th to 94th percentile of test takers score 183 to 200, and test takers in the 95th percentile and above
score 201 or higher.
In the spring, raw MAP scores are identified as follows: bottom 33rd percentile of test takers <
47
184, the 34th to 66th percentile of test takers score between 184 and 195, the 67th to 94th percentile of
test takers score 196 to 213, and test takers in the 95th percentile and above score 214 or higher.
Third Grade Assessments
During the third grade academic year the only DIBELS assessment given is the Oral Reading
Fluency. As in the prior year, it is administered at the beginning, middle, and end of the school year. If
students score from 0-52 at the beginning of the year they are considered At Risk readers while a score
from 53-76 shows Some Risk and a score above 77 shows Low Risk. By mid-year the At Risk score
rises to 0-66, the Some Risk score to 67-91, and the Low Risk score to 92 and above. By the end of
third grade a student is identified as At Risk with a score of 79 or below, at Some Risk with a score of
80-109, and as Low Risk with a score of 110 or above.
In the fall, raw MAP scores for third graders are identified as follows: bottom 33rd percentile of
test takers < 184, the 34th to 66th percentile of test takers score between 184 and 196, the 67th to 94th
percentile of test takers score 197 to 213, and test takers in the 95th percentile and above score 214 or
higher.
In the spring, raw MAP scores are identified as follows: bottom 33rd percentile of test takers <
193, the 34th to 66th percentile of test takers score between 193 and 205, the 67th to 94th percentile of
test takers score 206 to 222, and test takers in the 95th percentile and above score 223 or higher.

48
Table 1: DIBELS Cut-off Scores
Kindergarten
Beginning of year Middle of year End of year
Initial Sound Fluency
(ISF)
(3) 0-3 At Risk
(2) 4-7 Some Risk
(1) 8-above Low Risk
(3) 0-9 Deficit
(2) 10-24 Emerging
(1) 25-above Established
Letter Naming Fluency
(LNF)
(3) 0-1 At Risk
(2) 2-7 Some Risk
(1) 8-above Low Risk
(3) 0-14 At Risk
(2) 15-26 Some Risk
(1) 27-above Low Risk
(3) 0-28 At Risk
(2) 29-39 Some Risk
(1) 39-above Low Risk
Phoneme Segmentation
Fluency (PSF)
(3) 0-6 At Risk
(2) 7-17 Some Risk
(1) 18-above Low Risk
(3) 0-9 At Risk
(2) 10-34 Some Risk
(1) 35-above Low Risk
Nonsense Word Fluency
(NWF)
(3) 0-4 At Risk
(2) 5-12 Some Risk
(1) 13-above Low Risk
(3) 0-14 At Risk
(2) 15-24 Some Risk
(1) 25-above Low Risk
First Grade
Letter Naming Fluency
(LNF)
(3) 0-24
(2) 25-36 Some Risk
(1) 37-above Low Risk
Phoneme Segmentation
Fluency (PSF)
(3) 0-9 Deficit
(2) 10-34 Emerging
(1) 35-above Established
(3) 0-9 Deficit
(2) 10-34 Emerging
(1) 35-above Established
(3) 0-9 Deficit
(2) 10-34 Emerging
(1) 35-above Established
Nonsense Word Fluency
(NWF)
(3) 0-12 Deficit
(2) 13-23 Emerging
(1) 24-above Established
(3) 0-29 Deficit
(2) 30-49 Emerging
(1) 50-above Established
(3) 0-29 Deficit
(2) 30-49 Emerging
(1) 50-above Established
Oral Reading Fluency
(ORF)
(3) 0-7 At Risk
(2) 8-19 Some Risk
(1) 20-above Low Risk
(3) 0-19 At Risk
(2) 20-39 Some Risk
(1) 40-above Low Risk
Second Grade
Nonsense Word Fluency
(NWF)
(3) 0-29 Deficit
(2) 30-49 Emerging
(1) 50-above Established
Oral Reading Fluency
(ORF)
(3) 0-25 At Risk
(2) 26-43 Some Risk
(1) 44-above Low Risk
(3) 0-51 At Risk
(2) 52-67 Some Risk
(1) 68-above Low Risk
(3) 0-69 At Risk
(2) 70-89 Some Risk
(1) 90-above Low Risk
Third Grade
Oral Reading Fluency
(ORF)
(3) 0-52 At Risk
(2) 53-76 Some Risk
(1) 77-above Low Risk
(3) 0-66 At Risk
(2) 67-91 Some Risk
(1) 92-above Low Risk
(3) 0-79 At Risk
(2) 80-109 Some Risk
(1) 110-above Low Risk

49
Table 2: MAP Cut-Off Scores
Fall Spring
First grade (1st to 33rd %ile) 0 – 154
(34th to 66th %ile) 155 – 165
(67th to 94th %ile) 166 – 180
(95th to 99th %ile) 181 – above
(1st to 33rd %ile) 0 – 170
(34th to 66th %ile) 171 – 183
(67th to 94th %ile) 184 – 200
(95th to 99th %ile) 201 – above
Second grade (1st to 33rd %ile) 0 – 174
(34th to 66th %ile) 175 – 182
(67th to 94th %ile) 183 – 200
(95th to 99th %ile) 201 – above
(1st to 33rd %ile) 0 – 183
(34th to 66th %ile) 184 – 195
(67th to 94th %ile) 196 – 213
(95th to 99th %ile) 214 – above
Third grade (1st to 33rd %ile) 0 – 183
(34th to 66th %ile) 184 – 196
(67th to 94th %ile) 197 – 213
(95th to 99th %ile) 114 – above
(1st to 33rd %ile) 0 – 192
(34th to 66th %ile) 193 – 205
(67th to 94th %ile) 206 – 222
(95th to 99th %ile) 223 – above
Data Analysis
1. To answer question one, each student's score on the DIBELS tests was coded depending on the
ranges established by DIBELS. MAP scores were coded by percentiles provided the school district. The
lowest scoring range or percentile, generally referred to as At Risk, was coded as “3,” the mid-scoring
range or percentile, frequently labeled Some Risk, was coded as “2,” and the highest scoring range or
percentile, most often labeled Low Risk was coded as “1.”
Each beginning-of-year test score was first compared to the end-of-year test score to discover
the ratios of students remaining in the same score range over the course of the school year. Individual
students were then grouped by language classification to determine if category ratios were comparable
across the three groups.
Each of these same test scores were then compared to the year-end first grade, second grade,
and third grade scores to determine the ratios of students remaining in the same performance category
across one-year time intervals and then longitudinally across multiple-year intervals.
After finding the percentages of each language group scoring in each of three performance
categories, the percentages were run in a test for significance of difference between two proportions.
These tests result in a series of 2 x 2 tables to determine differences in proportion and whether there is

50
significance between them. Since this question involves three groups, the model was run six times,
comparing each group against the others in paired comparisons for At Risk then for Low Risk groups.
Thus, At Risk group A (native English speakers) is compared to At Risk group B (native Spanish
speakers), then At Risk group A is compared to At Risk group C (all other native language speakers),
and finally group B is compared to group C. This series of comparisons is then repeated with groups A,
B, and C in the Low Risk category. The null hypothesis assumes that the changes in reading scores
between groups will change at comparable rates over times.
2. The second question under investigation sought to build on the first question by looking more
closely at the students in the third group which included all non-Spanish speaking ELL students. The
same approach was used to answer the second question as was used to answer the first. However,
instead of three comparisons (group A – group B, group B – group C, and group A – group C), there
were many more. All languages previously grouped together as Other native languages were compared
individually to all other language groups. The groups compared to each other in question two were
English, Spanish, Arabic, Chinese, Korean, Lao, Vietnamese, and all other language speakers. With
eight groups there are a resulting 28 paired comparisons analyzed with the test for significance of
difference between two proportions.
3. Tests for significance of differences between two proportions were again used to answer the
third question to determine the impact of socioeconomic status on the ratios of students scoring in the
At Risk and Low Risk categories on DIBELS and MAP tests. Three student groups were used: English,
Spanish, and Other ELL. The groups were then divided into low-SES (qualifying for free and reduced
lunch) and high-SES (not qualifying for free and reduced lunch). It should be noted here that SES is
purely reflective of a family’s income as reported to the district; it does not take into account any social
aspects of a family’s history. At Risk low-SES group A (native English speakers) is compared to At
Risk low-SES group B (native Spanish speakers), then At Risk low-SES group A is compared to At
Risk low-SES group C (all other native language speakers), and finally At Risk low-SES group B is

51
compared to At Risk low-SES group C. This series of comparisons is then repeated with groups A, B,
and C in the Low Risk category, groups A, B, and C in the At Risk high-SES category, and finally
groups A, B, and C in the Low Risk high-SES category.
This study's method provides results for both short-term (single year) and long-term (up to four
years) time spans. Both are necessary for educators to make instructional and interventional decisions
which are timely and also mindful of possible differences in the rates at which different language and
SES groups will experience literacy gains.

52
Chapter IV
Findings and Results
Introduction
This chapter will present the findings and results from this analysis comparing the single-year
and multi-year ratios in reading achievement levels between native English speakers and various
groups of non-native English speakers to determine whether ratios are comparable at different
proficiency levels over varying amounts of time. Specific ELL groups focused on in these results are
those which face an increased risk of reading failure by third grade. The tables will show that some
groups, notably Korean and Chinese ELLs regularly significantly outperform not only their ELL peers
but native English speakers as well. However, the thrust of this study is to identify struggling readers in
need of interventions beyond those provided by the district.
This chapter will also discuss the extent to which student socioeconomic status impacted these
achievement ratios between groups. The data utilized in this study were gathered for a five-year span,
from 2007-08 to 2011-12. DIBELS and MAP were administered to students in a medium-size suburban
Kansas school district. A total of 477 ELL students between kindergarten and third grade were
identified as having taken at least one of these assessments twice during that span of time.
This study's purpose was to find possible differences in the ratios of literacy achievement
between various groups of native English speaking and ELL students with different non-English home
languages during the first years of elementary school in four schools in this Kansas district.
Study Expectations
The literature suggests that DIBELS is a fairly reliable measure of reading growth in young
students and is generally predictive of future literacy proficiency (Burke, Hagen-Burke, Kwok, &
Parker, 2009; Good III & Kaminski, 2011; Roehrig, et al., 2008). Also based on the reviewed literature,
it was expected that ELL students would demonstrate lower performance than native-English peers and

53
be consistently below those English-speaking peers by the end of third grade. The literature base does
not indicate that there should be any expected achievement differences between ELL language groups.
Data Analysis
The ratios in literacy skills at different data points over time as measured by DIBELS and MAP
was compared between native-English and ELL students in kindergarten to third grade in one medium
suburban Kansas school district. A causal comparative, descriptive analysis of ex post facto data was
used to analyze the between-group tendencies to remain in the same score category over time or to drop
out of that performance category.
This data were collected for the school years 2007-08 to 2011-12 from the data warehouse of a
medium-size suburban Kansas school district. It was then disaggregated by the researcher according to
home language and socioeconomic status whereupon descriptive statistics were used to determine rates
of growth and change in proficiency levels between ELL and native English speaking student scores.
The analysis was conducted using tests for significance of difference between two proportions.
The database was utilized to create a series of single-year and multi-year comparison groups. Each
comparison group was composed only of students who were enrolled in the district at the beginning
and ending of each pair of comparison points.
Kindergarten
The first one-year comparison set examined the change in ratio of readers scoring in the highest
and lowest performance categories on DIBELS Letter Naming Fluency at the beginning of
kindergarten and then at the end of kindergarten. There were nine groups of readers used in the
comparison: Students classified by the district as native speakers of English, Spanish, Arabic, Chinese,
Korean, Lao, and Vietnamese. The eighth group, “Others,” consisted of all ELL students not
categorized with one of the seven preceding language groups. The ninth group, “All Others,” consisted

54
of all ELL students except those to which the group is being compared (either native Spanish or Lao
speakers) and was used only in comparison to native English, Spanish, and Lao speaking students.
In the four schools utilized for this study between 2007-08 and 2011-12, a total of 311 ELL
students were found to have taken the LNF in both the fall and spring of their kindergarten year. A
comparable pool of 363 native English speaking students was chosen at random for comparison
purposes. This includes students who scored in all three performance categories: At Risk, Some Risk,
and Low Risk.
Fall results demonstrate that among students who took the LNF in both the fall and spring of
their kindergarten year, native Spanish speakers were significantly more likely than native English and
all other ELL speakers to score in the At Risk category (Appendix A). Among specific ELL groups they
were significantly more likely than Chinese, Korean, and Other ELL language speakers to score in the
At Risk category during the fall testing period. Because these scores are from early in the kindergarten
academic year, they suggest skill deficits which developed during the early childhood years and not as
a result of elementary school instruction.
Among students who took the LNF in both the fall and spring of their kindergarten year, native
Lao speakers were significantly more likely than native English and all other ELL language speakers to
score in the At Risk category in the fall. Among specific ELL groups they were significantly more
likely than Chinese, Korean, Arabic, and Other ELL language speakers to score in the At Risk category
during the fall testing period. As with the significant differences shown with the Spanish speaking
students, these scores suggest skill deficits which developed during the early childhood years and not as
a result of elementary school instruction because they show up early in the kindergarten academic year.

55
Table 3: Percent students scoring At Risk on DIBELS Spring kindergarten Letter Naming Fluency
Test for significance of difference between two proportions
Valid Kindergarten Cases
English
n=363
Spanish
n=118
Others
n=75
Chinese
n=28
Korean
n=26
Lao
n=23
Vietnamese
n=12
Arabic
n=29
All Others
(No Span.)
n=193
All Others
(No Lao)
n=288
English
4.4%
All Others
(No Span.)
5.2%
All
Others
(No Lao)
8.0%
Chinese
0.00%
Korean
0.00%
Lao
13.0%
Vietnamese
8.3%
Arabic
6.9%
Others
5.3%
Spanish
13.6%
Z=3.483
P=0.000**
Z=2.593
P=0.010*
Z=2.068
P=0.039*
Z=1.995
P=0.046*
Z=0.077
P=0.939
Z=0.518
P=0.604
Z=0.985
P=0.325
Z=1.843
P=0.065
Lao
13.0%
Z=1.851
P=0.064
Z=0.833
P=0.130
Z=1.966
P=0.049*
Z=1.897
P=0.063
Z=0.415
P=0.678
Z=0.742
P=0.458
Z=1.257
P=0.209
* The difference between two proportions is significant to the 0.05 level.
** The difference between two proportions is significant to the 0.001 level.
These data show that among students who took the LNF in both the fall and spring of their
kindergarten year, after the spring assessment window native Spanish speakers continued to be
significantly more likely than native English and all other ELL speakers to score in the At Risk
category. Among specific ELL groups they were significantly more likely than Chinese and Korean
speakers to score in the At Risk category. Unlike the fall scores, these significant discrepancies more
possibly reflect the results – or lack thereof – of the district's instructional practices.
Among students who took the LNF in both the fall and spring of their kindergarten year, after
the spring assessment window native Lao speakers were no longer significantly more likely than native
English and all other ELL speakers to score in the At Risk category. Among specific ELL groups they
were significantly more likely than only Chinese speakers to score in the At Risk category. This is a
notable contrast to their Spanish-speaking peers who, after a year of kindergarten instruction, continued
to demonstrate significantly more students in the At Risk category than all other peers. The Lao
population experienced growth from the same instruction that the Spanish population did not.

56
Fall results show that among students who took the LNF in both the fall and spring of their
kindergarten year, native Spanish speakers were significantly less likely than native English and all
other ELL speakers to score in the Low Risk category during the fall testing period. Among specific
ELL groups they were significantly less likely than Arabic, Chinese, Korean, and Other ELL language
speakers to score in the Low Risk category. Because these scores are from early in the kindergarten
academic year, they suggest fewer native Spanish speaking students begin kindergarten with letter
naming skills than their English and ELL peer groups.
Among students who took the LNF in both the fall and spring of their kindergarten year, native
Lao speakers were significantly less likely than native English and all other ELL speakers to score in
the Low Risk category during the fall testing period. Among specific ELL groups they were
significantly less likely than Arabic, Chinese, Korean, Vietnamese, and Other ELL language speakers
to score in the Low Risk category. Because these scores are from early in the kindergarten academic
year, they suggest fewer native Lao speaking students begin kindergarten with letter naming skills than
their English and ELL peer group.
Table 4: Percent students scoring Low Risk on DIBELS Spring kindergarten Letter Naming Fluency
Test for significance of difference between two proportions
English
54.8%
All Others
(No Span.)
52.3%
All Others
(No Lao)
Chinese
75.0%
Korean
73.1%
Lao
8.7%
Vietnamese
25.0%
Arabic
37.9%
Others
60.0%
Spanish
33.6%
Z=4.014
P=0.000**
Z=3.224
P=0.001**
Z=4.000
P=0.000**
Z=3.714
P=0.000**
Z=2.396
P=0.017*
Z=0.605
P=0.545
Z=0.437
P=0.662
Z=3.609
P=0.000**
Lao
8.7%
Z=4.292
P=0.000**
Z=3.671
P=0.000**
Z=4.735
P=0.000**
Z=4.546
P=0.000**
Z=1.308
P=0.191
Z=2.416
P=0.016*
Z=4.308
P=0.000**
* The difference between two proportions is significant to the 0.05 level.
** The difference between two proportions is significant to the 0.001 level.
These data show that among students who took the LNF in both the fall and spring of their
kindergarten year, after the spring assessment window native Spanish speakers were significantly less
likely than native English and all other ELL speakers to have scored in the Low Risk Category. Among
specific ELL groups they were significantly less likely than Chinese, Korean, and Other ELL language

57
speakers to have scored in the Low Risk category. While all language groups see the number of
students initially scoring in the highest achievement level drop over the course of the year (while other
students move up to the highest achievement level from lower levels), native Spanish speakers were
significantly less likely than other ELL students as a whole to be reading at the highest level.
Among students who took the LNF in both the fall and spring of their kindergarten year, after
the spring assessment window native Lao speakers were significantly less likely than native English
and all other ELL speakers to have scored in the Low Risk Category. Among specific ELL groups they
were significantly less likely than Chinese, Korean, Arabic and other ELL speakers to have scored in
the Low Risk category. They were less likely than even native Spanish ELL students – who themselves
are significantly less likely than ELL peers – to score in the highest reading achievement level.
First Grade
The second one-year comparison set examined the change in ratio of readers scoring in the
highest and lowest performance categories on DIBELS Nonsense Word Fluency at the beginning of
first grade and then at the end of first grade. There were nine groups of readers used in the comparison:
Students classified by the district as native speakers of English, Spanish, Arabic, Chinese, Korean, Lao,
and Vietnamese. The eighth group, “Others,” consists of all ELL students not categorized with one of
the seven preceding language groups. The ninth group, “All Others,” consists of all ELL students
except those to which the group is being compared (either native Spanish or Lao speakers) and was
used only in comparison to native English, Spanish, and Lao speaking students.
In the four schools utilized for this study between 2007-08 and 2011-12, a total of 301 ELL
students were found to have taken the NWF in both the fall and spring of their first grade year. A
comparable pool of 387 native English students was chosen at random for comparison purposes. This
includes students who scored in all three performance categories: At Risk, Some Risk, and Low Risk.
Fall results show that among students who took the NWF in both the fall and spring of their first

58
grade year, native Spanish speakers were significantly more likely than native English and Chinese
speakers to score in the At Risk category during the fall testing period. They were not significantly
more likely than all other ELL speakers combined to score in the At Risk category. This is an
improvement over kindergarten when native Spanish speakers started the year significantly more at risk
than their ELL peers.
Among students who took the NWF in both the fall and spring of their first grade year, native
Lao speakers were significantly more likely than native English, Chinese, and Korean speakers to score
in the At Risk category during the fall testing period. They were not significantly more likely than all
other ELL speakers combined to score in the At Risk category. This is an improvement over
kindergarten when native Lao speakers started the year significantly more at risk than their ELL peers.
These results are slightly worse than Spanish peers whose ratio of students in the At Risk category was
not significantly different than Korean students.
Table 5: Percent students scoring At Risk on DIBELS Spring first grade Nonsense Word Fluency
Test for significance of difference between two proportions
Valid First Grade Cases
English
n=387
Spanish
N=119
Others
n=77
Chinese
n=29
Korean
n=24
Lao
n=18
Vietnamese
n=12
Arabic
n=24
All Others
(No Span.)
n=184
All Others
(No Lao)
n=285
English
6.5%
All Others
(No Span.)
3.8%
All Others
(No Lao)
5.3%
Chinese
0%
Korean
0%
Lao
11.1%
Vietnamese
8.3%
Arabic
4.2%
Others
3.9%
Spanish
8.4%
Z=0.699
P=0.484
Z=1.151
P=0.250
Z=1.834
P=0.067
Z=1.672
P=0.094
Z=0.378
P=0.706
Z=0.251
P=0.802
Z=0.858
P=0.391
Z=1.231
P=0.218
Lao
11.1%
Z=0.591
P=0.554
Z=1.700
P=0.089
Z=1.616
P=0.106
Z=1.472
P=0.141
Z=0.378
P=0.706
Z=0.012
P=0.990
Z=0.704
P=0.481
Z=1.236
P=0.216
* The difference between two proportions is significant to the 0.05 level.
** The difference between two proportions is significant to the 0.001 level.
These data show that among students who took the NWF in both the fall and spring of their first

59
grade year, after the spring assessment window native Spanish speakers were just as likely as English
and ELL peers to have demonstrated enough reading growth to move out of the At Risk category by the
end of the year. These results suggest that first grade is a period of relative strength in literacy
acquisition for struggling native Spanish speakers and they enjoy growth comparable to other
developing readers.
Among students who took the NWF in both the fall and spring of their first grade year, after the
spring assessment window native Lao speakers were just as likely as English and ELL peers to have
demonstrated enough reading growth to move out of the At Risk category by the end of the year. These
results suggest that first grade is a period of relative strength in literacy acquisition for struggling native
Lao speakers and they enjoy growth comparable to other developing readers.
Fall results show that among students who took the NWF in both the fall and spring of their first
grade year, native Spanish speakers were significantly less likely than native English and all other ELL
speakers to score in the Low Risk category during the fall testing session. Among specific ELL groups
they were significantly less likely than Chinese, Korean, and Other ELL language speakers to score in
the Low Risk category. Though low-achieving Spanish speaking students were proportionately
comparable to peers at the beginning of the year, the same could not be said for the high-achieving
Spanish speaking students.
Among students who took the NWF in both the fall and spring of their first grade year, native
Lao speakers were significantly less likely than native English but not all other ELL speakers to score
in the Low Risk category during the fall testing session. Among specific ELL groups they were
significantly less likely than Chinese and Korean speakers to score in the Low Risk category.

60
Table 6: Percent students scoring Low Risk on DIBELS Spring first grade Nonsense Word Fluency
Test for significance of difference between two proportions
English
51.4%
All Others
(No Span.)
54.3%
All Others
(No Lao)
54.3%
Chinese
65.5%
Korean
87.5%
Lao
27.8%
Vietnamese
33.3%
Arabic
33.3%
Others
55.8%
Spanish
38.7%
Z=2.424
P=0.015*
Z=2.654
P=0.008*
Z=2.607
P=0.009*
Z=4.370
P=0.000**
Z=0.891
P=0.373
Z=0.367
P=0.714
Z=0.498
P=0.619
Z=2.348
P=0.019*
Lao
27.8%
Z=1.958
P=0.050*
Z=1.787
P=0.074
Z=2.513
P=0.012*
Z=3.943
P=0.000**
Z=0.891
P=0.373
Z=0.322
P=0.747
Z=0.382
P=0.703
Z=2.139
P=0.032*
* The difference between two proportions is significant to the 0.05 level.
** The difference between two proportions is significant to the 0.001 level.
These data show that among students who took the NWF in both the fall and spring of their first
grade year, native Spanish speakers were significantly less likely than native English and all other ELL
speakers to score in the Low Risk category in the spring. Among specific ELL groups they were
significantly less likely than Chinese, Korean, and Other ELL language speakers to score in the Low
Risk category. Just as native Spanish speakers had a significantly lower number of students in the Low
Risk category at the end of kindergarten, so they continue to keep a significantly lower number of
students in the Low Risk category after another year of instruction in first grade, a troubling trend.
These data shows that among students who took the NWF in both the fall and spring of their
first grade year, native Lao speakers were significantly less likely than native English but not all other
ELL speakers to score in the Low Risk category in the spring. Among specific ELL groups they were
significantly less likely than Chinese, Korean, and Other ELL language speakers to score in the Low
Risk category. Based on this assessment first grade appears to be a year of strength for Lao speakers
with the highest literacy scores. They are no longer significantly less likely than ELL peers to be in the
highest category at the end of the year as they were at the end of kindergarten.
Second Grade
The third one-year comparison set examined the change in ratio of readers scoring in the highest
and lowest performance categories on DIBELS Oral Reading Fluency at the beginning of second grade

61
and then at the end of second grade. There were nine groups of readers used in the comparison:
Students classified by the district as native speakers of English, Spanish, Arabic, Chinese, Korean, Lao,
and Vietnamese. The eighth group, “Others,” consists of all ELL students not categorized with one of
the seven preceding language groups. The ninth group, “All Others,” consists of all ELL students
except those to which the group is being compared (either native Spanish or Lao speakers) and was
used only in comparison to native English, Spanish, and Lao speaking students.
In the four schools utilized for this study between 2007-08 and 2011-12, a total of 233 ELL
students were found to have taken the ORF in both the fall and spring of their second grade year. A
pool of 375 native English students was chosen at random for comparison purposes. This includes
students who scored in all three performance categories: At Risk, Some Risk, and Low Risk.
Fall results indicate that the relative success experienced by native Spanish speakers in the
lowest performing category on DIBELS assessments continued into early second grade. Among
students who took the ORF in both the fall and spring of their second grade year, native Spanish
speakers were significantly more likely than native English speakers to score in the At Risk category
during the fall testing period. Among ELL peers as a whole, however, they were not significantly more
likely to score in the At Risk category and only the individual language groups of Chinese and Korean
speakers were significantly less likely to score in the At Risk category.
The relative success experienced by native Lao speakers in the lowest performing category on
DIBELS assessments continued into early second grade. Among students who took the ORF in both the
fall and spring of their second grade year, native Lao speakers were not significantly more likely than
native English speakers to score in the At Risk category during the fall testing period. Among ELL
peers as a whole they were not significantly more likely score in the At Risk category and only the
individual language groups of Chinese and Korean speakers were significantly less likely to score in
the At Risk category.

62
Table 7: Percent students scoring At Risk on DIBELS Spring second grade Oral Reading Fluency
Test for significance of difference between two proportions
Valid Second Grade Cases
English
n=375
Spanish
n=93
Others
n=63
Chinese
n=21
Korean
n=18
Lao
n=14
Vietnamese
n=9
Arabic
n=15
All Others
(No Span.)
n=140
All Others
(No Lao)
n=229
English
15.5%
All Others
(No Span.)
16.4%
All Others
(No Lao)
20.5%
Chinese
0%
Korean
0%
Lao
42.9%
Vietnamese
33.3%
Arabic
26.7%
Others
15.8%
Spanish
30.1%
Z=3.253
P=0.001**
Z=2.478
P=0.013*
Z=2.895
P=0.004*
Z=2.692
P=0.007*
Z=0.959
P=0.338
Z=0.199
P=0.842
Z=0.268
P=0.789
Z=2.043
P=0.041*
Lao
42.9%
Z=2.713
P=0.007*
Z=1.967
P=0.049*
Z=3.298
P=0.001*
Z=3.083
P=0.002*
Z=0.959
P=0.338
Z=0.460
P=0.645
Z=0.917
P=0.359
Z=2.263
P=0.024*
* The difference between two proportions is significant to the 0.05 level.
** The difference between two proportions is significant to the 0.001 level.
These data show that among students who took the ORF in both the fall and spring of their
second grade year, native Spanish speakers were significantly more likely than native English and all
other ELL peers to be in the At Risk performance group in the spring. They were also significantly
more likely than the specific language groups of Chinese, Korean, and other language speakers to be in
the At Risk group. This is a notable development because other than in comparison to English speakers
and the specific groups of Chinese and Korean speakers, Spanish ELL students demonstrated similar
rates of reading difficulty at the beginning of the year.
Among students who took the ORF in both the fall and spring of their second grade year, native
Lao speakers were significantly more likely than native English and all other ELL peers to be in the At
Risk performance group in the spring. They were also significantly more likely than the specific
language groups of Chinese, Korean, and other language speakers to be in the At Risk group. This is a
notable development because other than in comparison to the specific groups of Chinese and Korean
speakers, Lao ELL students demonstrated similar rates of reading difficulty at the beginning of the
year.

63
Fall results indicate that, as happened in first grade, the ratio of native Spanish speakers in the
highest performing category on DIBELS assessments is not significantly different than all other ELL
students and specific language groups other than Chinese and Korean. However, they are significantly
less likely than English peers to score in the Low Risk range.
As happened in first grade, the ratio of native Lao speakers in the highest performing category
on DIBELS assessments is not significantly different than all other ELL students and specific language
groups other than Chinese and Korean. They are, however, significantly less likely than English peers
to score in the Low Risk range.
Table 8: Percent students scoring Low Risk on DIBELS Spring second grade Oral Reading Fluency
Test for significance of difference between two proportions
English
57.6%
All Others
(No Span.)
55.0%
All Others
(No Lao)
50.2%
Chinese
71.4%
Korean
83.3%
Lao
35.7%
Vietnamese
44.4%
Arabic
40.0%
Others
50.8%
Spanish
40.9%
Z=2.894
P=0.004*
Z=2.108
P=0.035*
Z=2.531
P=0.011*
Z=3.683
P=0.000**
Z=0.370
P=0.711
Z=0.204
P=0.839
Z=0.066
P=0.948
Z=1.220
P=0.223
Lao
35.7%
Z=1.624
P=0.104
Z=1.052
P=0.293
Z=2.091
P=0.037*
Z=2.759
P=0.006*
Z=0.370
P=0.711
Z=0.417
P=0.676
Z=0.238
P=0.812
Z=1.023
P=0.306
* The difference between two proportions is significant to the 0.05 level.
** The difference between two proportions is significant to the 0.001 level.
These data show that among students who took the ORF in both the fall and spring of their
second grade year, native Spanish speakers were significantly less likely than native English and all
other ELL speakers to score in the Low Risk category in the spring. Among specific ELL groups they
were significantly less likely than Chinese, Korean, and Other ELL language speakers to score in the
Low Risk category. Just as native Spanish speakers had a significantly lower number of students in the
Low Risk category at the end of kindergarten and first grade, so they continue to keep a significantly
lower number of students in the Low Risk category after a third year of instruction. This is notable
because at the beginning of the year the Spanish ELL students did not have a significantly different
number of students in the highest achieving group. Instruction at the second grade level proved to be
less effective for this group than all other ELLs as a whole.
64
Among students who took the ORF in both the fall and spring of their second grade year, native
Lao speakers were significantly less likely than only Chinese and Korean speakers to score in the Low
Risk category. They made gains in comparison to their English peers. This is in notable contrast to
Spanish ELL students who actually lost ground compared to all other ELL students. Between the two
lowest performing ELL groups, instruction at the second grade level proved to be less effective for
native Spanish speakers than for native Lao speakers.
Third Grade
The fourth one-year comparison set examined the change in ratio of the same readers scoring in
the top and bottom 1/3rd percentiles on Measures of Academic Progress (MAP) at the beginning of third
grade and then again at the end of third grade. There were nine groups of readers used in the
comparison: Students classified by the district as native speakers of English, Spanish, Arabic, Chinese,
Korean, Lao, and Vietnamese. The eighth group, “Others,” consists of all ELL students not categorized
with one of the seven preceding language groups. The ninth group, “All Others,” consists of all ELL
students except those to which the group is being compared (either native Spanish or Lao speakers) and
was used only in comparison to native English, Spanish, and Lao speaking students.
In the four schools utilized for this study between 2007-08 and 2011-12, a total of 238 ELL
students were found to have taken the MAP in both the fall and spring of their third grade year. A pool
of 354 native English students was chosen at random for comparison purposes. This includes students
who scored in all three performance categories: 1st – 33rd percentile, 34th – 66th percentile, and 67th –
100th percentile.
Fall results indicate that the relative success experienced by native Spanish speakers in the
lowest performing category on DIBELS assessments at the beginning of first and second grade did not
continue into the MAP in early third grade. Among students who took the MAP in both the fall and
spring of their third grade year, native Spanish speakers were significantly more likely than native

65
English speakers to score in the bottom 1/3rd percentile during the fall testing period. Among ELL peers
as a whole they were significantly more likely to score in the bottom 1/3rd percentile as well as in
comparison to the individual language group of Chinese and Korean speakers.
The relative success experienced by native Lao speakers in the lowest performing category on
DIBELS assessments in early first and second grade was repeated on the MAP in early third grade.
Among students who took the MAP in both the fall and spring of their third grade year, native Lao
speakers were significantly more likely than native English speakers to score in the bottom 1/3rd
percentile during the fall testing period. Compared to all other ELL peers as a whole, however, they
were not significantly more likely to score in the bottom 1/3rd percentile. They were significantly more
likely in comparison only to the individual language groups of Chinese and Korean speakers.
Table 9: Percent students scoring 1st – 33rd percentile on Spring third grade MAP
Test for significance of difference between two proportions
Valid Third Grade Cases
English
n=354
Spanish
n=96
Others
n=58
Chinese
n=20
Korean
n=18
Lao
n=16
Vietnamese
n=10
Arabic
n=20
All Others
(No Spanish)
n=142
All Others
(No Lao)
n=222
English
7.3%
All Others
(No Spanish)
16.2%
All Others
(No Lao)
21.8%
Chinese
0.00%
Korean
0.00%
Lao
18.6%
Vietnamese
10.0%
Arabic
35.0%
Others
20.7%
Spanish
28.1%
Z=5.616
P=0.000**
Z=2.211
P=0.027*
Z=2.706
P=0.007*
Z=2.574
P=0.010*
Z=0.795
P=0.427
Z=1.236
P=0.217
Z=0.617
P=0.537
Z=1.023
P=0.306
Lao
18.6%
Z=1.650
P=0.099
Z=0.300
P=0.764
Z=2.014
P=0.044*
Z=1.916
P=0.055
Z=0.795
P=0.427
Z=0.593
P=0.553
Z=1.092
P=0.275
Z=0.185
P=0.853
* The difference between two proportions is significant to the 0.05 level.
** The difference between two proportions is significant to the 0.001 level.
These data show that among students who took the MAP in both the fall and spring of their
third grade year, native Spanish speakers were significantly more likely than native English and all
other ELL peers to be in the bottom 1/3rd percentile in the spring. They were also significantly more
likely than the specific language group of Chinese and Korean speakers to be in the bottom 1/3rd

66
percentile. By the end of third grade, a critical period to reach reading success, native Spanish speakers
were still significantly more likely to be in the lowest performing group of readers than their English
and ELL peers.
Among students who took the MAP in both the fall and spring of their third grade year, native
Lao speakers made notable gains compared to native English speakers and were no longer significantly
more likely to be in the bottom 1/3rd percentile in the spring. They were only more likely than the
specific language group of Chinese speakers to be in the bottom 1/3rd percentile. Third grade reading
instruction was clearly beneficial for this group.
Fall results indicate that among students who took the MAP in both the fall and spring of their
third grade year, native Spanish speakers were significantly less likely than native English and all other
ELL peers to be in the top 1/3rd percentile in the fall. They were also significantly less likely than the
specific language groups of Chinese, Korean, and Other ELL language speakers to be in the top 1/3rd
percentile.
Among students who took the MAP in both the fall and spring of their third grade year, native
Lao speakers were significantly less likely than native English peers to be in the top 1/3rd percentile in
the fall. They were also significantly less likely than the specific language groups of Chinese and
Korean speakers to be in the top 1/3rd percentile.
Table 10: Percent students scoring 66th – 99th percentile on Spring third grade MAP
Test for significance of difference between two proportions
English
46.3%
All Others
(No Span.)
32.4%
All Others
(No Lao)
27.9%
Chinese
50.0%
Korean
55.6%
Lao
0.00%
Vietnamese
0.00%
Arabic
35.0%
Others
32.8%
Spanish
16.7%
Z=5.251
P=0.000**
Z=2.707
P=0.007*
Z=3.247
P=0.001*
Z=3.608
P=0.000**
Z=1.766
P=0.077
Z=1.403
P=0.161
Z=1.866
P=0.062
Z=2.309
P=0.021*
Lao
0.00%
Z=3.647
P=0.000**
Z=2.457
P=0.014*
Z=3.328
P=0.001**
Z=3.551
P=0.000**
Z=1.766
P=0.077
Z=0
P=0
Z=2.637
P=0.008*
Z=2.658
P=0.008*
* The difference between two proportions is significant to the 0.05 level.
** The difference between two proportions is significant to the 0.001 level.
These data show that among students who took the MAP in both the fall and spring of their

67
third grade year, native Spanish speakers were significantly less likely than native English and all other
ELL peers to be in the top 1/3rd percentile in the spring. They were also significantly less likely than
the specific language groups of Chinese, Korean, and Other ELL language speakers to be in the top
1/3rd percentile. This indicates enough of the Spanish readers dropped from the top category that they
were unable to make up ground against peers and that by the end of third grade native Spanish speakers
were still significantly less likely to be in the highest performing group of readers than their English
and ELL peers.
Among students who took the MAP in both the fall and spring of their third grade year, native
Lao speakers were significantly less likely than native English and all other ELL peers to be in the top
1/3rd percentile in the spring. They were also significantly less likely than the specific language groups
of Chinese, Korean, Arabic, and Other ELL language speakers to be in the top 1/3rd percentile. This
points to a dramatic drop in the number of Lao students in the top reading category as they lost ground
to all ELL peers as well as to the specific language groups of Arabic and Other ELL language speakers.
What looked to be a promising trajectory at the beginning of third grade went downhill and native Lao
speaking students found themselves at a severe disadvantage compared to almost all peers at the end of
the year.
Longitudinal Kindergarten to First Grade
The first longitudinal comparison set examined the change in ratio of readers scoring in the
highest and lowest performance categories over two academic years. The comparison used kindergarten
fall LNF score categories and first grade spring ORF score categories. There were nine groups of
readers used in the comparison: Students classified by the district as native speakers of English,
Spanish, Arabic, Chinese, Korean, Lao, and Vietnamese. The eighth group, “Others,” consists of all
ELL students not categorized with one of the seven preceding language groups. The ninth group, “All
Others,” consists of all ELL students except those to which the group is being compared (either native

68
Spanish or Lao speakers) and was used only in comparison to native English, Spanish, and Lao
speaking students.
In the four schools utilized for this study between 2007-08 and 2011-12, a total of 242 ELL
students were found to have taken the LNF in the fall of their kindergarten year and the NWF in the
spring of their first grade year. A pool of 322 native English students was chosen at random for
comparison purposes. This includes students who scored in all three performance categories: At Risk,
Some Risk, and Low Risk.
Fall results indicate that among students who took the LNF in the fall of their kindergarten year
and the ORF in the spring of their first grade year, native Spanish speakers were significantly more
likely than native English and all other ELL speakers to score in the At Risk category. Among specific
ELL groups they were significantly more likely than Chinese and Other ELL language speakers to
score in the At Risk category during the fall testing period.
Among students who took the LNF in the fall of their kindergarten year and the ORF in the
spring of their first grade year, native Spanish speakers were significantly more likely than native
English and all other ELL speakers to score in the At Risk category. Among specific ELL groups they
were significantly more likely than Chinese, Korean, and Other ELL language speakers to score in the
At Risk category during the fall testing period.

69
Table 11: Percent students scoring At Risk on DIBELS Spring first grade Oral Reading Fluency
Test for significance of difference between two proportions
Valid Longitudinal 2-Year Kindergarten to First Grade Cases
English
n=322
Spanish
n=96
Others
n=61
Chinese
n=26
Korean
n=18
Lao
n=18
Vietnamese
n=12
Arabic
n=19
All Others
(No Span.)
n=146
All Others
(No Lao)
n=232
English
5.9%
All Others
(No Span.)
6.8%
All Others
(No Lao)
11.2%
Chinese
0%
Korean
0%
Lao
22.2%
Vietnamese
8.3%
Arabic
10.5%
Others
4.9%
Spanish
20.8%
Z=4.407
P=0.000**
Z=3.238
P=0.001**
Z=2.543
P=0.011*
Z=2.131
P=0.033*
Z=0.134
P=0.894
Z=1.032
P=0.302
Z=1.044
P=0.297
Z=2.748
P=0.006*
Lao
22.2%
Z=2.680
P=0.007**
Z=0.379
P=0.705
Z=2.520
P=0.012*
Z=2.120
P=0.034*
Z=0.134
P=0.894
Z=1.001
P=0.317
Z=0.966
P=0.334
Z=2.272
P=0.023*
* The difference between two proportions is significant to the 0.05 level.
** The difference between two proportions is significant to the 0.001 level.
These data show that among students who took the LNF in the fall of their kindergarten year
and the ORF in the spring of their first grade year, native Spanish speakers were significantly more
likely than native English and all other ELL peers to be in the At Risk performance group. They were
also significantly more likely than the specific language groups of Chinese, Korean, and Other ELL
language speakers to be in the At Risk group. Despite decreases in all language groups in the ratios of
students scoring in the At Risk category, growth among Spanish speakers was not enough to close the
significant disparities between them and their English speaking and ELL peers even after two years of
instruction.
Among students who took the LNF in the fall of their kindergarten year and the ORF in the
spring of their first grade year, native Lao speakers were significantly more likely than native English
peers to be in the At Risk performance group. They were also significantly more likely than the specific
language groups of Chinese, Korean, and other language speakers to be in the At Risk group. Unlike
Spanish speakers who remained significantly behind these groups and all ELL peers, Lao students
made enough growth to eliminate the significant difference between their ratio of students in the lowest

70
performing category and the ratio of all ELL students.
Fall results show that among students who took the LNF in the fall of their kindergarten year
and the ORF in the spring of their first grade year, the ratio of native Spanish speakers in the highest
performing category on DIBELS assessments is significantly less than native English speakers as well
as all other ELL students. They were also significantly less likely than the specific language groups of
Chinese, Korean, and other language speakers to be in the Low Risk group. Only Lao speakers fared
worse, demonstrating a significantly lower ratio than even their Spanish speaking peers.
Among students who took the LNF in the fall of their kindergarten year and the ORF in the
spring of their first grade year, the ratio of native Lao speakers in the highest performing category on
DIBELS assessments is significantly different than every other language group in the study.
Table 12: Percent students scoring Low Risk on DIBELS Spring first grade Oral Reading Fluency
Test for significance of difference between two proportions
English
58.4%
All Others
(No Span.)
58.2%
All Others
(No Lao)
45.7%
Chinese
69.2%
Korean
77.8%
Lao
5.6%
Vietnamese
41.7%
Arabic
42.1%
Others
63.9%
Spanish
22.9%
Z=6.106
P=0.000**
Z=5.409
P=0.000**
Z=4.462
P=0.000**
Z=4.599
P=0.000**
Z=1.679
P=0.093
Z=2.602
P=0.009*
Z=1.742
P=0.082
Z=5.138
P=0.000**
Lao
5.6%
Z=4.388
P=0.000**
Z=3.312
P=0.001**
Z=4.188
P=0.000**
Z=4.393
P=0.000**
Z=1.679
P=0.093
Z=2.420
P=0.016*
Z=2.586
P=0.010*
Z=4.347
P=0.000**
* The difference between two proportions is significant to the 0.05 level.
** The difference between two proportions is significant to the 0.001 level.
These data show that among students who took the LNF in the fall of their kindergarten year
and the ORF in the spring of their first grade year, native Spanish speakers were significantly less
likely than native English and all other ELL speakers to score in the Low Risk category in the spring.
They even lost ground compared to their ELL peers. Among specific ELL groups not only were they
significantly less likely than Chinese, Korean, and Other ELL language speakers to score in the Low
Risk category was the case at the beginning of kindergarten, they now had a significantly lower ratio
than their Vietnamese peers. With two years of comparable instruction native Spanish speakers had not
only not made significant gains against their higher achieving peers, they were beginning to shows of

71
actually doing worse over time than other students.
Among students who took the LNF in the fall of their kindergarten year and the ORF in the
spring of their first grade year, native Lao speakers were significantly less likely than native English
and all other ELL speakers to score in the Low Risk category in the spring. Among specific ELL
groups they were significantly less likely than Chinese, Korean, Vietnamese, and Other ELL language
speakers to score in the Low Risk category. They did gain ground by closing the ratio gap with their
Spanish speaking peers. With two years of comparable instruction, native Lao speakers have shown
modest literacy gains against the highest achieving Spanish peer group.
Longitudinal Kindergarten to Second Grade
The second longitudinal comparison set examined the change in ratio of readers scoring in the
highest and lowest performance categories over three academic years. The comparison used
kindergarten fall LNF score categories and second grade spring ORF score categories. There were nine
groups of readers used in the comparison: Students classified by the district as native speakers of
English, Spanish, Arabic, Chinese, Korean, Lao, and Vietnamese. The eighth group, “Others,” consists
of all ELL students not categorized with one of the seven preceding language groups. The ninth group,
“All Others,” consists of all ELL students except those to which the group is being compared (either
native Spanish or Lao speakers) and was used only in comparison to native English, Spanish, and Lao
speaking students.
In the four schools utilized for this study between 2007-08 and 2011-12, a total of 169 ELL
students were found to have taken the LNF in the fall of their kindergarten year and the ORF in the
spring of their second grade year. A pool of 282 native English students was chosen at random for
comparison purposes. This includes students who scored in all three performance categories: At Risk,
Some Risk, and Low Risk.
Fall results indicate that among students who took the LNF in the fall of their kindergarten year

72
and the ORF in the spring of their second grade year, native Spanish speakers were significantly more
likely than native English to score in the At Risk category in the fall. Among specific ELL groups they
were significantly more likely than only the Other ELL language group to score in the At Risk category
during the fall testing period. Generally, then, their ratio of struggling readers is comparable to the ELL
group as a whole at the beginning of the academic year.
Among students who took the LNF in the fall of their kindergarten year and the ORF in the
spring of their second grade year, native Lao speakers were significantly more likely than native
English speakers and all other ELL students to score in the At Risk category. Among specific ELL
groups they were significantly more likely than Chinese and Other ELL students to score in the At Risk
category during the fall testing period. Generally, then, they were the lowest performing language
group upon entering kindergarten.
Table 13: Percent students scoring At Risk on DIBELS Spring second grade Oral Reading Fluency
Test for significance of difference between two proportions
Valid Longitudinal 3-Year Kindergarten to Second Grade Cases
English
n=282
Spanish
n=65
Others
n=45
Chinese
n=16
Korean
n=14
Lao
n=14
Vietnamese
n=7
Arabic
n=8
All Others
(No Span.)
n=104
All Others
(No Lao)
n=155
English
6.0%
All Others
(No Span.)
8.7%
All Others
(No Lao)
11.6%
Chinese
0%
Korean
0%
Lao
28.6%
Vietnamese
14.3%
Arabic
0%
Others
8.9%
Spanish
20.0%
Z=3.625
P=0.000**
Z=2.122
P=0.034*
Z=1.952
P=0.051
Z=1.831
P=0.067
Z=0.710
P=0.478
Z=0.362
P=0.717
Z=1.395
P=0.163
Z=1.583
P=0.113
Lao
28.6%
Z=3.220
P=0.001**
Z=1.811
P=0.070
Z=2.298
P=0.022*
Z=2.162
P=0.031*
Z=0.710
P=0.478
Z=0.725
P=0.468
Z=1.672
P=0.094
Z=1.879
P=0.060
* The difference between two proportions is significant to the 0.05 level.
** The difference between two proportions is significant to the 0.001 level.
These data show that among students who took the LNF in the fall of their kindergarten year
and the ORF in the spring of their second grade year, native Spanish speakers were significantly more
likely than native English and all other ELL peers to be in the At Risk performance group. They were

73
not, however, significantly more likely than any specific ELL language groups to be in the At Risk
group. This continues the trend established with the 2-year cohort group of Spanish-speaking students
to have a significantly higher ratio of test takers scoring in the At Risk category than all other ELL
students. The data for this three-year cohort group is particularly disappointing because the
performance of native Spanish speaking students has worsened in comparison to ELL peers from their
time in kindergarten to their time in second grade.
Among students who took the LNF in the fall of their kindergarten year and the ORF in the
spring of their second grade year, native Lao speakers were significantly more likely than native
English peers to be in the At Risk performance group. They were not, however, significantly more
likely than all other ELL students to be in the At Risk group as was the case at the beginning of
kindergarten, three years prior. They made gains in relation to ELL peers over three years that native
Spanish speaking students did not.
Fall data show that among students who took the LNF in the fall of their kindergarten year and
the ORF in the spring of their second grade year, the ratio of native Spanish speakers in the highest
performing category on DIBELS assessments is significantly lower than native English speakers as
well as all other ELL students. They were also significantly less likely than the specific language
groups of Chinese, Korean, and Other ELL language speakers to be in the Low Risk group.
Among students who took the LNF in the fall of their kindergarten year and the ORF in the
spring of their second grade year, the ratio of native Lao speakers in the highest performing category on
DIBELS assessments is significantly lower than native English speakers as well as all other ELL
students. They were also significantly less likely than the specific language groups of Chinese, Korean,
Vietnamese, Arabic, and other language speakers to be in the Low Risk group. Though not significantly
so, the ratio of Lao students scoring in the highest category was well below even that of Spanish
speaking students.

74
Table 14: Percent students scoring Low Risk on DIBELS Spring second grade Oral Reading Fluency
Test for significance of difference between two proportions
English
55.5%
All Others
(No Span.)
51.9%
All Others
(No Lao)
45.8%
Chinese
56.3%
Korean
71.4%
Lao
14.3%
Vietnamese
42.9%
Arabic
62.5%
Others
55.6%
Spanish
29.2%
Z=3.823
P=0.000**
Z=2.899
P=0.004*
Z=2.042
P=0.041*
Z=2.972
P=0.003*
Z=1.145
P=0.252
Z=0.748
P=0.455
Z=1.892
P=0.058
Z=2.779
P=0.005*
Lao
14.3%
Z=3.017
P=0.000**
Z=2.279
P=0.023*
Z=2.381
P=0.017*
Z=3.053
P=0.002*
Z=1.145
P=0.252
Z=1.450
P=0.147
Z=2.335
P=0.020
*
Z=2.709
P=0.007*
* The difference between two proportions is significant to the 0.05 level.
** The difference between two proportions is significant to the 0.001 level.
These data show that among students who took the LNF in the fall of their kindergarten year
and the ORF in the spring of their second grade year, native Spanish speakers continued to be
significantly less likely than native English and all other ELL speakers to score in the Low Risk
category in the spring. Among specific language groups they continued to be lag Chinese, Korean, and
Other ELL language speakers. With three years of instruction in this school district native Spanish
speaking students did not demonstrate any notable increase in achievement level among the highest
scorers in comparison to English and ELL peer groups.
Among students who took the LNF in the fall of their kindergarten year and the ORF in the
spring of their second grade year, native Lao speakers continued to be significantly less likely than
native English and all other ELL speakers to score in the Low Risk category in the spring. This is
perhaps not surprising considering the number of Lao students in the highest category in kindergarten
was so low to begin with. There are two signs, however, that instruction in this school district was
effective for Lao speakers. First, the number of students in the kindergarten to second grade cohort
remaining in the highest achievement category was a full 100% for Lao speakers, a feat matched by
only the Korean and Arabic language students. Second, they made gains against the Vietnamese
speakers and were no longer significantly below their achievement ratio.

75
Longitudinal Kindergarten to Third Grade
The third longitudinal comparison set examined the change in ratio of readers scoring in the
highest and lowest performance categories over four academic years. The comparison used
kindergarten fall LNF score categories and third grade spring MAP score percentiles. There were nine
groups of readers used in the comparison: Students classified by the district as native speakers of
English, Spanish, Arabic, Chinese, Korean, Lao, and Vietnamese. The eighth group, “Others,” consists
of all ELL students not categorized with one of the seven preceding language groups. The ninth group,
“All Others,” consists of all ELL students except those to which the group is being compared (either
native Spanish or Lao speakers) and was used only in comparison to native English, Spanish, and Lao
speaking students.
In the four schools utilized for this study between 2007-08 and 2011-12, a total of 169 ELL
students were found to have taken the LNF in the fall of their kindergarten year and the MAP in the
spring of their third grade year. A pool of 266 native English students was chosen at random for
comparison purposes. This includes students who scored in all three performance categories on the
DIBELs (At Risk, Some Risk, and Low Risk) and scored in all three percentile groupings on the MAP
(1st – 33rd, 34th – 66th, and 67th – 99th).
Fall data show that among students who took the LNF in the fall of their kindergarten year and
the MAP in the spring of their third grade year, native Spanish speakers were significantly more likely
than native English and all ELL speakers to score in the At Risk category. Among specific ELL groups
they were significantly more likely than the specific language groups of Chinese, Arabic, and Other
ELL language speakers to score in the At Risk category during the fall testing period.
Among students who took the LNF in the fall of their kindergarten year and the MAP in the
spring of their third grade year, native Lao speakers were significantly more likely than native English
speakers and all other ELL students to score in the At Risk category in the fall. Among specific ELL
groups they were significantly more likely than Chinese, Arabic, and Other ELL language speakers to

76
score in the At Risk category during the fall testing period. These reflect the same significant disparities
experienced by native Spanish students at the beginning of kindergarten.
Table 15: Percent students scoring 1st – 33rd percentile on Spring third grade MAP
Test for significance of difference between two proportions
Valid Longitudinal 4-Year Kindergarten to Third Grade Cases
English
n=266
Spanish
n=66
Others
n=41
Chinese
n=17
Korean
n=9
Lao
n=15
Vietnamese
n=8
Arabic
n=13
All Others
(No Spanish)
n=103
All Others
(No Lao)
N=154
English
2.6%
All Others
(No Span.)
4.9%
All Others
(No Lao)
7.8%
Chinese
0.00%
Korean
0.00%
Lao
26.7%
Vietnamese
12.5%
Arabic
0.00%
Others
0.00%
Spanish
16.7%
Z=4.535
P=0.000**
Z=2.551
P=0.011*
Z=1.809
P=0.070
Z=1.327
P=0.184
Z=0.899
P=0.368
Z=0.304
P=0.761
Z=1.588
P=0.112
Z=2.763
P=0.006*
Lao
26.7%
Z=4.699
P=0.000**
Z=2.386
P=0.017*
Z=2.278
P=0.023*
Z=1.698
P=0.089
Z=0.899
P=0.368
Z=0.786
P=0.432
Z=2.013
P=0.044*
Z=3.434
P=0.001**
* The difference between two proportions is significant to the 0.05 level.
** The difference between two proportions is significant to the 0.001 level.
These data show that among students who took the LNF in the fall of their kindergarten year
and the MAP in the spring of their third grade year, native Spanish speakers were significantly more
likely than native English and all other ELL peers to be in the bottom 1/3rd percentile. They continued
to be significantly more likely than Other ELL language speakers to be in the bottom 1/3rd percentile.
The data for this four-year cohort group is disappointing because after four years of comparable
instruction and interventions, the performance of native Spanish speaking students has shown only very
modest improvement with gains against two language peer groups, Chinese and Arabic speakers.
Among students who took the LNF in the fall of their kindergarten year and the MAP in the
spring of their third grade year, native Lao speakers were significantly more likely than native English
and all other ELL peers to be in the bottom 1/3rd percentile. They continued to be significantly more
likely than the specific language groups of Chinese, Arabic, and Other ELL language speakers to be in
the bottom 1/3rd percentile. The data for this four-year cohort group is disappointing because after four

77
years of comparable instruction and interventions, the performance of native Lao speaking students has
shown no demonstrable improvement against English or ELL peers against whom they performed
lower at the beginning of their kindergarten year.
The fall data indicate that among students who took the LNF in the fall of their kindergarten
year and the MAP in the spring of their third grade year, the ratio of native Spanish speakers in the
highest performing category on DIBELS assessments is significantly lower than native English
speakers as well as all other ELL students. They were also significantly less likely than the specific
language groups of Chinese and Other ELL language speakers to be in the Low Risk group.
Among students who took the LNF in the fall of their kindergarten year and the MAP in the
spring of their third grade year, the ratio of native Lao speakers in the highest performing category on
DIBELS assessments is significantly lower than native English speakers as well as all other ELL
students. They were also significantly less likely than the specific language groups of Chinese, Korean,
Vietnamese, and Other ELL language speakers to be in the Low Risk group. Though not significantly
so, the ratio of Lao students scoring in the highest category was well below even that of Spanish
speaking students.
Table 16: Percent students scoring 67th – 99th percentile on Spring third grade MAP
Test for significance of difference between two proportions
English
44.4%
All Others
(No Span.)
30.1%
All Others
(No Lao)
22.1%
Chinese
64.7%
Korean
44.4%
Lao
6.7%
Vietnamese
0.00%
Arabic
7.7%
Others
34.1%
Spanish
6.1%
Z=5.776
P=0.000**
Z=3.755
P=0.000**
Z=5.596
P=0.000**
Z=3.488
P=0.000**
Z=0.087
P=0.931
Z=0.718
P=0.473
Z=0.216
P=0.829
Z=3.764
P=0.000**
Lao
6.7%
Z=2.875
P=0.004*
Z=1.404
P=0.160
Z=3.382
P=0.001**
Z=2.202
P=0.028*
Z=0.087
P=0.931
Z=0.749
P=0.454
Z=0.102
P=0.918
Z=2.051
P=0.040*
* The difference between two proportions is significant to the 0.05 level.
** The difference between two proportions is significant to the 0.001 level.
These data show that among students who took the LNF in the fall of their kindergarten year
and the MAP in the spring of their third grade year, native Spanish speakers continued to be
significantly less likely than native English and all other ELL speakers to score in the top 1/3rd

78
percentile in the spring. They were also significantly less likely than the specific language groups of
Chinese, Korean, and Other ELL language speakers to remain in the top 1/3rd percentile. With four
years of instruction in this school district, native Spanish speaking students did not demonstrate any
notable increase in achievement level among the highest scorers in comparison to English and ELL
peer groups.
Among students who took the LNF in the fall of their kindergarten year and the MAP in the
spring of their third grade year, native Lao speakers continued to be significantly less likely than native
English speakers to score in the bottom 1/3rd percentile in the spring. However, they retained enough
readers in this highest achieving group that after four years they were no longer significantly less likely
than all ELL peers to be in the top 1/3rd percentile, likely due to their growth in comparison to Spanish
students. They continued to be significantly less likely than the specific language groups of Chinese,
Korean, and Other ELL language speakers to be in the top 1/3rd percentile.
Achievement and Socioeconomic Status
The next set of tables compares the longitudinal achievement levels of students classified as low
SES in three different language groups. The three language groups are native speakers of English,
native speakers of Spanish, and native speakers of all other languages.
Longitudinal Kindergarten to First Grade
The first comparison set examined the difference in ratio of readers scoring in the lowest and
highest performance category after two academic years among students who qualified for free or
reduced lunch and among those who did not. The comparison used a cohort group which took both the
kindergarten fall LNF and first grade spring ORF assessments. The ratio of each language group in the
highest and lowest scoring category was compared to the other two language groups to identify
potential significant ratio differences in achievement levels among low-income and high-income

79
students.
In the four schools utilized for this study between 2007-08 and 2011-12, a total of 164 ELL
students were found to have taken the LNF in the fall of their kindergarten year and the ORF in the
spring of their first grade year and been identified as eligible for free or reduced lunch. A pool of 125
native English students was chosen at random for comparison purposes. This includes students who
scored in the At Risk, Some Risk, and Low Risk performance categories.
Table 17: Percent low-SES students on DIBELS Spring first grade Oral Reading Fluency
Test for significance of difference between two proportions
Valid Longitudinal 2-Year Kindergarten to First Grade Cases (Low-SES)
English
n=125
Spanish
n=78
Other ELL
n=86
English (At Risk)
24.0%
English (Low Risk)
53.6%
Other ELL (At Risk)
19.8%
Other ELL (Low Risk)
65.1%
Spanish (At Risk)
38.5%
Z=2.202
P=0.028*
Z=2.644
P=0.008*
Spanish (Low Risk)
37.2%
Z=2.276
P=0.023*
Z=3.571
P=0.000**
* The difference between two proportions is significant to the 0.05 level.
** The difference between two proportions is significant to the 0.001 level.
These data show that among low-SES students who took the LNF in the fall of their
kindergarten year and the ORF in the spring of their first grade year, native Spanish speakers were
significantly more likely than native English and all other ELL speakers to score in the At Risk
category by the end of first grade.
Among low-SES students who took the LNF in the fall of their kindergarten year and the ORF
in the spring of their first grade year, native Spanish speakers were significantly less likely than native
English and all other ELL speakers to score in the Low Risk category by the end of first grade. The
data in both of these tables indicates that Spanish-speaking students are disproportionately adversely
affected by their low-income status compared to all peers.
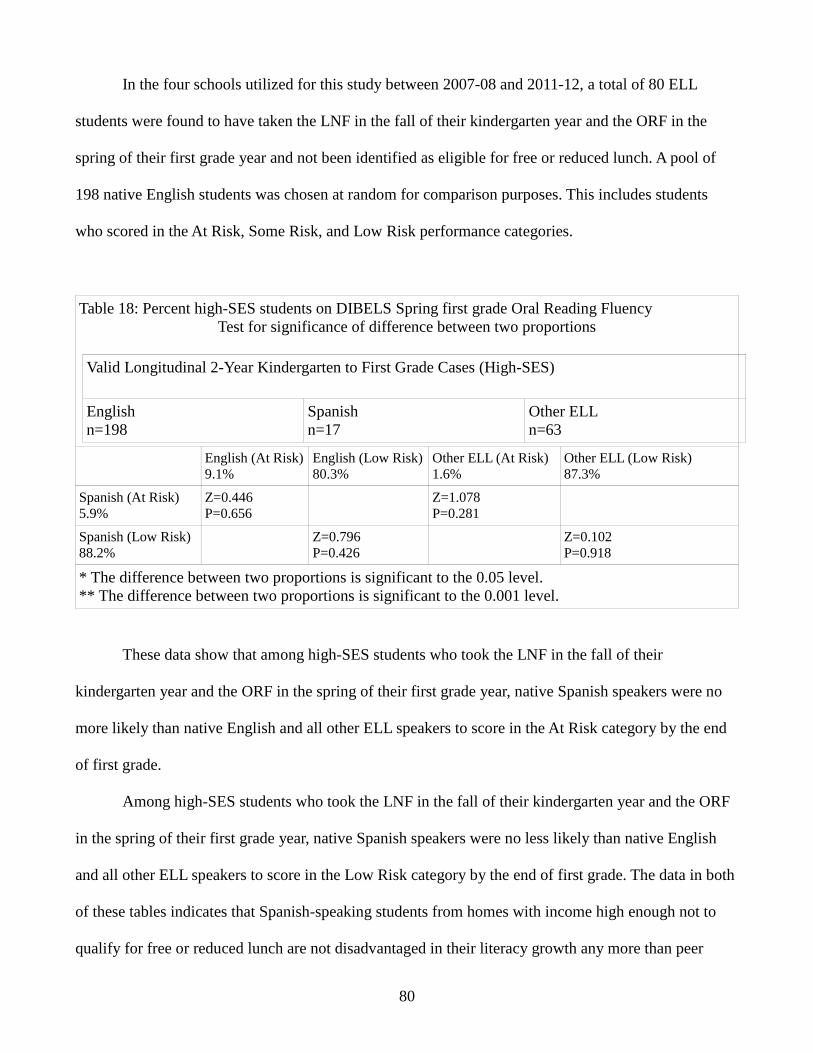
80
In the four schools utilized for this study between 2007-08 and 2011-12, a total of 80 ELL
students were found to have taken the LNF in the fall of their kindergarten year and the ORF in the
spring of their first grade year and not been identified as eligible for free or reduced lunch. A pool of
198 native English students was chosen at random for comparison purposes. This includes students
who scored in the At Risk, Some Risk, and Low Risk performance categories.
Table 18: Percent high-SES students on DIBELS Spring first grade Oral Reading Fluency
Test for significance of difference between two proportions
Valid Longitudinal 2-Year Kindergarten to First Grade Cases (High-SES)
English
n=198
Spanish
n=17
Other ELL
n=63
English (At Risk)
9.1%
English (Low Risk)
80.3%
Other ELL (At Risk)
1.6%
Other ELL (Low Risk)
87.3%
Spanish (At Risk)
5.9%
Z=0.446
P=0.656
Z=1.078
P=0.281
Spanish (Low Risk)
88.2%
Z=0.796
P=0.426
Z=0.102
P=0.918
* The difference between two proportions is significant to the 0.05 level.
** The difference between two proportions is significant to the 0.001 level.
These data show that among high-SES students who took the LNF in the fall of their
kindergarten year and the ORF in the spring of their first grade year, native Spanish speakers were no
more likely than native English and all other ELL speakers to score in the At Risk category by the end
of first grade.
Among high-SES students who took the LNF in the fall of their kindergarten year and the ORF
in the spring of their first grade year, native Spanish speakers were no less likely than native English
and all other ELL speakers to score in the Low Risk category by the end of first grade. The data in both
of these tables indicates that Spanish-speaking students from homes with income high enough not to
qualify for free or reduced lunch are not disadvantaged in their literacy growth any more than peer
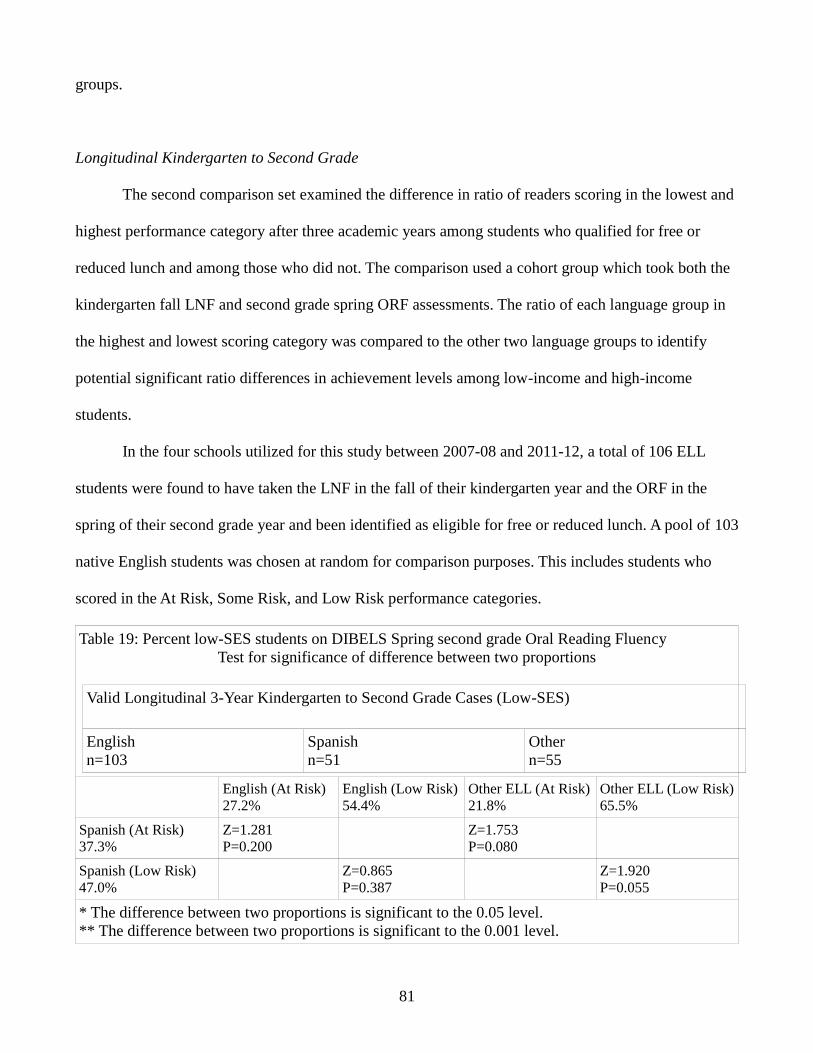
81
groups.
Longitudinal Kindergarten to Second Grade
The second comparison set examined the difference in ratio of readers scoring in the lowest and
highest performance category after three academic years among students who qualified for free or
reduced lunch and among those who did not. The comparison used a cohort group which took both the
kindergarten fall LNF and second grade spring ORF assessments. The ratio of each language group in
the highest and lowest scoring category was compared to the other two language groups to identify
potential significant ratio differences in achievement levels among low-income and high-income
students.
In the four schools utilized for this study between 2007-08 and 2011-12, a total of 106 ELL
students were found to have taken the LNF in the fall of their kindergarten year and the ORF in the
spring of their second grade year and been identified as eligible for free or reduced lunch. A pool of 103
native English students was chosen at random for comparison purposes. This includes students who
scored in the At Risk, Some Risk, and Low Risk performance categories.
Table 19: Percent low-SES students on DIBELS Spring second grade Oral Reading Fluency
Test for significance of difference between two proportions
Valid Longitudinal 3-Year Kindergarten to Second Grade Cases (Low-SES)
English
n=103
Spanish
n=51
Other
n=55
English (At Risk)
27.2%
English (Low Risk)
54.4%
Other ELL (At Risk)
21.8%
Other ELL (Low Risk)
65.5%
Spanish (At Risk)
37.3%
Z=1.281
P=0.200
Z=1.753
P=0.080
Spanish (Low Risk)
47.0%
Z=0.865
P=0.387
Z=1.920
P=0.055
* The difference between two proportions is significant to the 0.05 level.
** The difference between two proportions is significant to the 0.001 level.

82
These data show that among low-SES students who took the LNF in the fall of their
kindergarten year and the ORF in the spring of their second grade year, native Spanish speakers were
not significantly more likely than native English and all other ELL speakers to score in the At Risk
category by the end of second grade.
Among low-SES students who took the LNF in the fall of their kindergarten year and the ORF
in the spring of their second grade year, native Spanish speakers were not significantly less likely than
native English and all other ELL speakers to score in the Low Risk category by the end of first grade.
The data in both of these tables indicates that after three years in school, Spanish-speaking students are
no more adversely affected by their low-income status than all peers.
In the four schools utilized for this study between 2007-08 and 2011-12, a total of 60 ELL
students were found to have taken the LNF in the fall of their kindergarten year and the ORF in the
spring of their second grade year and not been identified as eligible for free or reduced lunch. A pool of
178 native English students was chosen at random for comparison purposes. This includes students
who scored in the At Risk, Some Risk, and Low Risk performance categories.
Table 20: Percent high-SES students on DIBELS Spring second grade Oral Reading Fluency
Test for significance of difference between two proportions
Valid Longitudinal 3-Year Kindergarten to Second Grade Cases (High-SES)
English
n=178
Spanish
n=13
Other
n=47
English (At Risk)
11.2%
English (Low Risk)
87.0%
Other ELL (At Risk)
4.3%
Other ELL (Low Risk)
78.7%
Spanish (At Risk)
7.7%
Z=0.390
P=0.697
Z=0.496
P=0.620
Spanish (Low Risk)
84.6%
Z=0.634
P=0.526
Z=0.471
P=0.638
* The difference between two proportions is significant to the 0.05 level.
** The difference between two proportions is significant to the 0.001 level.
These data show that among high-SES students who took the LNF in the fall of their
83
kindergarten year and the ORF in the spring of their second grade year, native Spanish speakers were
no more likely than native English and all other ELL speakers to score in the At Risk category by the
end of second grade.
Among high-SES students who took the LNF in the fall of their kindergarten year and the ORF
in the spring of their second grade year, native Spanish speakers were no less likely than native English
and all other ELL speakers to score in the Low Risk category by the end of second grade. The data in
both of these tables indicates that Spanish-speaking students from homes with income high enough not
to qualify for free or reduced lunch are not disadvantaged in their literacy growth any more than peer
groups.
Longitudinal Kindergarten to Third Grade
The third comparison set examined the difference in ratio of readers scoring in the lowest and
highest performance category after four academic years among students who qualified for free or
reduced lunch and among those who did not. The comparison used a cohort group which took both the
kindergarten fall LNF and third grade spring MAP assessments. The ratio of each language group in the
highest and lowest scoring category was compared to the other two language groups to identify
potential significant ratio differences in achievement levels among low-income and high income
students.
In the four schools utilized for this study between 2007-08 and 2011-12, a total of 106 ELL
students were found to have taken the LNF in the fall of their kindergarten year and the MAP in the
spring of their third grade year and been identified as eligible for free or reduced lunch. A pool of 97
native English students was chosen at random for comparison purposes. This includes students who
scored in the At Risk, Some Risk, and Low Risk performance categories on DIBELS and the 1st – 33rd,
34th – 66th, and 67th – 99th percentiles on MAP.

84
Table 21: Percent low-SES students on the Spring third grade MAP
Test for significance of difference between two proportions
Valid Longitudinal 4-Year Kindergarten to Third Grade Cases (Low-SES)
English
n=97
Spanish
n=48
Other
n=58
English
(1st – 33rd %ile)
15.5%
English
(66th – 99th %ile)
38.1%
Other ELL
(1st – 33rd %ile)
22.4%
Other ELL
(66th – 99th %ile)
39.7%
Spanish (1st – 33rd %ile)
25.0%
Z=1.382
P=0.167
Z=0.314
P=0.754
Spanish (66th – 99th %ile)
31.3%
Z=0.804
P=0.422
Z=0.897
P=0.369
* The difference between two proportions is significant to the 0.05 level.
** The difference between two proportions is significant to the 0.001 level.
These data show that among low-SES students who took the LNF in the fall of their
kindergarten year and the MAP in the spring of their third grade year, native Spanish speakers were not
significantly more likely than native English and all other ELL speakers to score in the bottom 1/3rd
percentile by the end of third grade.
Among low-SES students who took the LNF in the fall of their kindergarten year and the MAP
in the spring of their third grade year, native Spanish speakers were not significantly less likely than
native English and all other ELL speakers to score in the top 1/3rd percentile category by the end of
third grade.
In the four schools utilized for this study between 2007-08 and 2011-12, a total of 52 ELL
students were found to have taken the LNF in the fall of their kindergarten year and the MAP in the
spring of their third grade year and not been identified as eligible for free or reduced lunch. A pool of
171 native English students was chosen at random for comparison purposes. This includes students
who scored in the At Risk, Some Risk, and Low Risk performance categories on DIBELS and the 1st –
33rd, 34th – 66th, and 67th – 99th percentiles on MAP.

85
Table 22: Percent high-SES students on the Spring third grade MAP
Test for significance of difference between two proportions
Valid Longitudinal 4-Year Kindergarten to Third Grade Cases (High-SES)
English
n=171
Spanish
n=11
Other
n=42
English (1st – 33rd %ile) 9.4%
English (66th – 99th %ile) 24.6%
Other ELL (1st – 33rd %ile) 11.9%
Other ELL (66th – 99th %ile) 57.1%
Spanish (1st – 33rd %ile)
27.3%
Z=1.879
P=0.060
Z=1.270
P=0.119
Spanish (66th – 99th %ile)
9.1%
Z=1.172
P=0.241
Z=2.839
P=0.005*
* The difference between two proportions is significant to the 0.05 level.
** The difference between two proportions is significant to the 0.001 level.
These data show that among high-SES students who took the LNF in the fall of their
kindergarten year and the MAP in the spring of their third grade year, native Spanish speakers were no
more likely than native English and all other ELL speakers to score in the bottom 1/3rd percentile by the
end of third grade.
Among high-SES students who took the LNF in the fall of their kindergarten year and the MAP
in the spring of their third grade year, native Spanish speakers were no less likely than native English
speakers to score in the top 1/3rd percentile. They were, however, less likely to score in the top 1/3rd
percentile than their other ELL peers by the end of third grade. This indicates that over four years
higher SES students from Spanish-speaking homes develop a notable disadvantage in achieving at the
highest reading level compared to their ELL peer group.
Summary
From the data supplied by the mid-size Kansas school district, there are clear and consistent
statistical significant differences in reading scores between native Spanish speaking students, native
Lao speaking students, and all other ELL student groups across single year and multi-year periods.

86
These ongoing differences indicate ongoing instructional inadequacies for certain segments of the
student body.
For this study, expos facto data concerning DIBELS and MAP assessment scores, used both to
identify students in need for reading intervention and as progress monitoring, was obtained from the
school district. These scores were gathered and analyzed using tests for significance of difference
between two proportions to show that there are a series of significant statistical differences of p<0.05 in
achievement levels between English, Spanish, Lao, and all other ELL groups over multiple years.
When comparing group ratios at the end of each academic year and at the end of two-year,
three-year, and four-year periods, the ratios used to look for statistical significance only include
students who were in the respective performance categories at the beginning and end of each
comparison period. Other students in each lingual group may move in or out of the performance
categories but they are not counted for statistical purposes. Thus, these statistical findings do not
compare all speakers of the different languages but only those who could be included in computations
for both data collection points for each comparison.
At Risk Spanish speaking students scored lower to a statistical significant difference of p<0.05
against all other ELL students at the end of kindergarten, second grade, and third grade. Longitudinally,
At Risk Spanish speaking students scored lower to a statistical significant difference of p<0.05 against
all other ELL students at the end of two year (K-1), three year (K-2), and four year (K-3) periods. Low
Risk Spanish speaking students scored lower to a statistical significant difference of p<0.05 against all
other ELL students at the end of kindergarten, first grade, second grade, and third grade.
Longitudinally, Low Risk Spanish speaking students scored lower to a statistical significant difference
of p<0.05 against all other ELL students at the end of two year (K-1), three year (K-2), and four year
(K-3) periods.
At Risk Lao speaking students scored lower to a statistical significant difference of p<0.05
against all other ELL students at the end of the longitudinal four year (K-3) period. This is a curious,

87
though possibly not insignificant, finding considering native Lao speakers were not more likely to a
statistical significant difference of p<0.05 to be At Risk than all other ELL students over any single
academic year or any longitudinal period up to four years. Low Risk Lao speaking students scored
lower to a statistical significant difference of p<0.05 against all other ELL students at the end of
kindergarten and third grade. Longitudinally, Low Risk Spanish speaking students scored lower to a
statistical significant difference of p<0.05 against all other ELL students at the end of two year (K-1)
and three year (K-2) periods.
When accounting for socio-economic status as defined by qualification for free and reduced
lunch, there were statistical significant differences of p=0.05 involving native Spanish speaking
students. For the two year period of kindergarten and first grade, Spanish speaking students who
qualify for free and reduced lunch are more likely to a statistical significant difference of p=0.008 to
score in the lowest performing reading group. These differences disappeared in subsequent longitudinal
three year and four year periods indicating that as students age the disparities experienced by low-
income Spanish students compared to peers subsides.
Among students who do not qualify for free and reduced lunch there were no statistical
significant differences of p=0.05 between native Spanish speakers and their English and ELL peers
over two year (K-1) and three year (K-2) periods. Such a discrepancy, however, did develop by the end
of the four year (K-3) period between Spanish and all other ELL speakers.

88
Chapter V
Summary, Discussion, and Recommendations
Introduction
This chapter will summarize the results of this study and present the implications of its findings.
Additionally, it will propose ideas for further research on the topics and recommendations reflected in
these findings. This study also contains limitations which should be considered when reflecting on the
results of this multi-year analysis of DIBELS and MAP reading scores in one medium-size Kansas
suburban school district.
The purpose of this study was to broaden current research that shows clear and long-term
reading deficits on the part of ELL students compared to their native English speaking peers. Based on
national standardized tests, these deficits remain throughout the duration of the K-12 school years. This
study sought to find individualized results by language group, to further inform research that overall
only addresses the ELL population as a monolithic whole. A secondary objective of this study was to
determine the extent, if any, to which socioeconomic status influenced ELL reading outcomes.
Research Questions Restated
The outcomes of this study focused on the research questions:
1. When comparing the cut score ranges of beginning of year and end of year reading assessments
over single year and multi-year intervals, are there significant differences between the ratios of English,
Spanish, and Other ELL students in each language group which begin and end in the At Risk and Low
Risk groups?
2. Do any of the native speakers of Other ELL languages (Arabic, Chinese, Korean, Lao, and
Vietnamese) have significantly different ratios of students in the lowest and highest reading categories
as disaggregated in question one?
3. Does socioeconomic status (SES) as measured by free and reduced lunch status significantly
affect the ratios of students in each language group who score in the lowest and highest reading

89
groupings?
This study compared scores of English, Spanish, Chinese, Korean, Arabic, Lao, Vietnamese,
and Other language groups on reading assessments in a suburban Kansas school district. An analysis of
the relationship between specific language, socioeconomic status, and test score level was conducted
through statistical analysis. The primary purpose of this study was to contribute to the overall body of
research, as well as to gain insights that may affect the design and implementation of instruction for
ELL students in an effort to close the achievement gaps between ELL groups and English speakers.
This study’s student population was a total of 967 students who were enrolled during the 2007-
08 to 2011-12 school years. That total included 63 Arabic speaking students, 47 Chinese speaking
students, 39 Korean speaking students, 24 Lao speaking students, 172 Spanish speaking students, 15
Vietnamese students, 118 other ELL students, and 489 native English students. These students were all
enrolled at one point in at least one of four schools in this suburban Kansas school district which were
identified as ELL cluster sites or ELL neighborhood sites. Classroom staff in these buildings were
certified to teach ELL students or were in the process of attaining certification. Each school had
additional ELL resource staff as well as reading support staff.
Summary of Findings
Data for this study came from a data warehouse program used by the Kansas school district to
store student demographic and academic information. It was used to determine if there were significant
statistical differences in the ratios of students from different language groups scoring in low and high
categories across a number of reading measures. From the data set, groups of English, Spanish,
Chinese, Korean, Arabic, Vietnamese, and Other language speakers were identified and DIBELS and
MAP scores were pulled over a number of data collection points spanning up to four years. The
comparisons of these test scores as shown in chapter IV demonstrate that there were numerous
statistically significant differences between Spanish speaking students and all other ELL students over

90
single academic years as well as over multi-year periods. There were also fewer statistical significant
differences between Lao speaking students and all other ELL students over single academic years as
well as over multi-year periods. This study also adds to the overall DIBELS literature and indicates that
according to its measures, native Spanish speakers are significantly more likely than other ELLs to
struggle in acquiring early literacy skills.
Implications of Findings
The reading gap demonstrated by ELL students is supported by the findings of this study and
examined in more detail than in prior studies. This study finds that Spanish speaking students are much
more likely to score in the lowest range on reading assessments compared to ELL peers while being
much less likely to score in the highest range on those same assessments. Further, these differences
between Spanish and other ELL students are not diminished over time, either over one year periods or
longer multi-year periods. They start out behind their English and ELL peers and are not able to make
significant growth to close the reading gap by third grade.
This study’s findings also indicate that native Lao speaking students generally begin academic
years significantly behind English and ELL (except Spanish) peers but often make sufficient growth
over the course of a year to eliminate the statistical significance of the achievement differences. These
particular findings may be influenced by the much smaller Lao student population accessed for this
work compared to the Spanish student population. Nevertheless, the differences in these populations
were significant and point to different academic outcomes based on instructional inputs and supports
similar to those received by Spanish speakers.
Of considerable concern with these same Lao students are the significant differences between
their lowest group of readers and ELL peers longitudinally. The four-year K-3 At Risk cohort group
showed significantly lower scores compared to all other ELL students while the two year K-1 and three
year K-2 Low Risk cohorts did not show significantly lower scores compared to all other ELL students.

91
Again, though statistically significant, the small Lao sample may account for these inconsistent
comparisons with ELL peers.
When accounting for socioeconomic status as measured by qualification for free and reduced
lunch, this study did not find any long term trends. For the two year K-1 cohort low-SES Spanish
speaking students were significantly more likely to be in the At Risk category than their English and
ELL peers. However, this gap appears to disappear with time as neither the three year K-2 cohort nor
the four year K-3 cohort demonstrated this statistically significant gap. Socioeconomic status, then,
cannot be blamed for the persistent performance differences between Spanish speaking students and all
other ELLs.
Finally, this study’s findings suggest that much of the reading gap between English and ELL
students as a whole is a result of the lower achievement of Spanish speaking students within that ELL
population. Over two year (K-1), three year (K-2), and four year (K-3) time periods non-Spanish
speaking ELL students were never more likely than English peers to score in the At Risk range on
reading assessments. Similarly, of those three cohort groups only the four-year (K-3) group was less
likely to score in the Low Risk range than English peers. Either this K-3 population was an anomaly or
the highest achieving non-Spanish ELL students begin to lag their highest achieving English peers by
third grade, an outcome which cannot be further investigated with this study’s data.
The researcher expected that this study would find significant differences over short and long
periods of time between the reading performance of English and ELL students in one medium sized
Kansas school district. The findings indicate such an expectation is overly broad and not as nuanced as
it should be for both researchers and practitioners.
The findings from this study indicate that Spanish speaking ELL students underperform other
ELL students throughout the primary years of elementary school given comparable instruction and
intervention. Similarly, findings indicate that Lao speaking ELL students underperform other ELL
students throughout the primary years though not as consistently as the Spanish speaking population.

92
The findings also suggest that family socioeconomic status may account for some of this difference
initially but does not account for these differences over longer periods of time.
Limitations
This study has some limitations. The first limitation was that the sample was obtained from one
medium sized suburban district. The unique demographics of this community may affect the findings
and discourage generalizability. A second limitation was the very small sample sizes of some ELL
populations. Although some statistically significant findings resulted from the research, the sample
sizes also do not lend themselves to generalizability. The study does, however, contribute to the overall
body of educational research on the instruction of ELL students and their achievement on reading
measures over multi-year periods of time by suggesting that comparable sheltered instruction methods
and tiered systems of support do not make up for deficits experienced by Spanish speaking students
early in their schooling.
There were some inherent threats to the validity of the analyses and statistics used for this
study’s findings. Potentially, dozens of teachers were involved in the education of these students over
many years. Although all teachers have comparable qualifications for teaching ELL students, actual
instructional quality likely varied from teacher to teacher and even between students taught by the same
teachers. The researcher attempted to minimize such inconsistencies by only reviewing the data of
students from schools designated as ELL cluster sites or ELL neighborhood sites.
Another limitation was pre-existing differences between the sample’s students. The amount of
formal early literacy exposure possibly varied widely between participants. This is suggested by the
results of the kindergarten fall data which already found significant variations between student
achievement. ELL students did not begin their elementary school with equal reading preparation.
A fifth limitation was the range of diversity in socioeconomic status, educational levels,
immigrant experience, and cultural expectations between students in the ELL sample. The presence of

93
an institution such as a research university may skew these variables among ELL participants so that
they are not representative of particular language groups within the larger population. It is possible that
some language groups were more likely to be represented by students who were the children of
university students.
A final limitation was the use of MAP in finding longitudinal results through third grade. While
it continued the trends found using DIBELS scores during the earlier grades, the four-year results may
have been different if third grade ORF scores had been available.
Future Directions and Recommendations
The researcher proposes that longitudinal studies be conducted with larger samples of non-
Spanish speaking ELL students to more effectively determine generalizability. Larger sample sizes of
Spanish speaking ELL students over three and four year periods would reinforce this study’s findings.
The larger samples should be drawn from a wider geographic area than the one city utilized in this
study.
This study did not attempt to account for the family background of the sample population.
Analysis based on educational, vocational, and cultural background would add considerable depth to
these findings and allow for a finer discernment of the achievement differences between ELL
populations. It is not clear to what extent these variables contributed to the findings of this research.
Greater understanding could be pulled from the data if the language ability of individual ELL
students could be controlled for. With a larger sample size students with similar English skills could be
compared, allowing for an even finer recognition of trends within the data between ELL groups.
It is recommended that districts using SIOP or similar sheltered instruction for ELLs in
conjunction with a tiered level of supports as understood in RtI principles consider the effectiveness of
these methods with all ELL students. Outcomes experienced by Spanish and Lao speaking students in
this district indicate that these may not be enough to overcome initial reading deficits experienced by

94
some student groups early on or to avoid the development of reading deficits in later years. This may
be indicative of lower response rates by certain language groups to proven instructional strategies or it
may be indicative of problems with fidelity to SIOP and RtI, both by general education and
intervention teachers.
Generalizability
The generalizability of this study’s findings should be considered low without further
investigation. The potential uniqueness of the ELL sample population must be considered when
reviewing the final results. This study was limited to four schools in a single medium sized suburban
school district in Kansas. A researcher attempting to replicate this study in another city in Kansas or
another region in the United States may obtain different results. Though generalizability of these
findings is not recommended, the results do suggest the need for more research into the different
reading outcomes experienced by ELL students receiving comparable instruction and interventions.
Conclusion
The results of this study indicate that sheltered instruction and a tiered system of intervention
supports provided by Title 1, ISA, ESL, and special education staff to English, Spanish, and other ELL
speaking students does not consistently lead to comparable outcomes. While the lowest achieving non-
Spanish speaking ELL students scored within the range of English speaking students during
kindergarten, first grade, and second grade, the lowest achieving Spanish speaking ELL students only
scored within the range of English speaking students during first grade. Similarly, the lowest achieving
Spanish speaking students scored within range of the other ELL students only during first grade. The
highest achieving non-Spanish speaking ELL students scored within the range of English speaking
students during kindergarten, first grade, and second grade, while the highest achieving Spanish
speaking ELL students did not score within the range of English speaking students during any of the

95
primary academic years. Similarly, the highest achieving Spanish speaking students did not score
within range of the other ELL students during any of the primary academic years.
Longitudinally, At Risk cohort groups from K-1, K-2, and K-3 all had significantly lower
achievement ratios than both their English and other ELL speaking peers. These same statistical
discrepancies occur among the Low Risk readers across K-1, K-2, and K-3 cohorts. The Spanish
speaking population consistently has a higher ratio of students in the At Risk group and fewer students
in the Low Risk group. Cumulatively, these findings regarding Spanish ELLs are contrary to data
which shows that Hispanic students actually outperform other ELLs on the fourth grade and eighth
grade NAEP (Fry, 2007).
The data also showed that the lowest achieving Lao speaking ELL students scored within the
range of English speaking students during kindergarten and third grade after being significantly behind
at the beginning of those years. This group failed to score within range of English speaking students
after second grade. The lowest achieving Lao students did not score within range of their ELL peers
after second and third grade, indicating an increasing risk of reading difficulty with age. The highest
achieving Lao speaking failed to score within the range of English speaking students during
kindergarten, first grade, and third grade, and failed to score within the range of ELL speaking students
during kindergarten and third grade. These results indicate that instruction and interventions provided
to English, Spanish, and other ELL speaking students lead to inconsistent outcomes with this student
population compared to peers.
Longitudinally, the Lao population continued to demonstrate inconsistent results. Only the At
Risk cohort groups from K-3 had significantly lower achievement ratios than both their English and
other ELL speaking peers. Both the K-1 and K-2 cohorts were within range of ELL speaking peers.
These inconsistencies remain among the Low Risk cohort groups. The K-1 and K-2 cohorts
underperform their ELL peers but the K-3 cohort finishes within range of their ELL peers. The Lao
speaking population raises some red flags because they inconsistently demonstrate a higher ratio of

96
students in the At Risk group and lower ratio of students in the Low Risk group.
Finally, the data showed that SES contributed to outcome differences between Spanish speakers
and other English and ELL students only during the K-1 time span. Over longer periods of time, from
kindergarten to second grade and also from kindergarten to third grade, ratios of students in the lowest
and highest achievement groups does not differ significantly based on language.
As with all studies there are some limitations which should be kept in mind. These are sample
sizes and potential sample uniqueness which greatly limit the generalizability of findings. Nevertheless,
the researcher believes the study’s findings add to the body of ELL research by suggesting significant
discrepancies in reading achievement exist between non-native English speaking students, most notably
among Spanish speaking students and to a lesser extent among Lao speaking students. A replication of
this study with larger non-Spanish ELL samples across a wider geographic area is recommended to
validate and build on this study’s findings.
97
Bibliography
Abedi, J. (2004). The No Child Left Behind Act and English language learners: Assessment and
accountability issues. Educational Researcher, 33(1), 4-14.
Arriaga, R. I., Fenson, L., Cronan, T., & Pethick, S. J. (1998). Scores on the MacArthur
Communicative Development Inventory of children from low- and middle-income families. Applied
Psycholinguistics, 19, 209-224.
Artiles, A. J., Kozleski, E. B., Trent, S. C., Osher, D., & Ortiz, A. (2010). Justifying and explaining
disproportionality, 1968-2008: A critique of underlying views of culture. Exceptional Children,76(3),
279-299.
Aud, S. Hussar, W., Planty, M., Snyder, T., Bianco, K., Fo, M., Frohlich, L., Kemp, J., & Drake, L.
(2010). The condition of education 2010. Washington, DC: National Center for Education Statistics,
Institute of Education Sciences, U.S. Department of Education.
August, D., & Shanahan, L. (2006). Developing literacy in second-language learners: Report of the
National Literacy Panel on Language-Minority Children and Youth. Washington, DC: National
Literacy Panel on Language-Minority Children and Youth.
Bachman, L. F. (1990). Fundamental considerations in language testing. Oxford, England: Oxford
University Press.
Bachman, L. F. (2005). Building and supporting a case for test use. Language Assessment Quarterly,
2(1), 1-34.
Bachman, L. F, & Palmer, A. S. (2010). Language assessment in practice: developing language tests
and justifying their use in the real world. Oxford: Oxford University Press.
Baker, S. K., & Gersten, R. (1997). Exploratory meta-analysis of instructional practices for English
language learners (No. 97-01). Tech Rep.
Baker, S. K., Smolkowski, K., Smith, J. M., Fien, H., Kame'enui, E. J., & Beck, C. T. (2011). The
impact of Oregon Reading First on student reading outcomes. The Elementary School Journal, 112(2),
307-331.
Balfanz, R., Bridgeland, J. M., Fox, J. H., & Moore, L. A. (2010). Building a grad nation: Progress and
challenge in ending the high school dropout epidemic, 2010-2011 annual update. Washington, DC:
Civic Enterprises.
Ball, C. R. (2012). Supporting valid decision making: Uses and misuses of assessment data within the
context of RtI. Psychology in the Schools, 49(3), 213 – 244.
Blachman, B. A., Schatschneider, C., Fletcher, J. M., Francis, D. J., Clonan, S. M., Shaywitz, B. A., &
Shaywitz, S. E. (2004). Effects of intensive reading remediation for second and third graders and a 1-
year follow-up. Journal of Educational Psychology, 96(3), 444-461.

98
Borman, G. D., Hewes, G. M., Overman, L. T., & Brown, S. (2003). Comprehensive school reform and
student achievement: A meta-analysis. Review of Educational Research, 73(2), 125-230.
Bowey, J. A. (1995). Socioeconomic status differences in preschool phonological sensitivity and first-
grade reading achievement. Journal of Educational Psychology, 87(3), 476-487.
Bracey, G. W. (2003). April foolishness: The 20th anniversary of A Nation at Risk. Phi Delta Kappan,
84(8), 616-621.
Bruck, M. (1990). Word-recognition skills of adults with childhood diagnoses of dyslexia.
Developmental Psychology, 26(3), 439-454.
Bruck, M. (1992). Persistence of dyslexics' phonological awareness deficits. Developmental
Psychology, 28(5), 874-886.
Burke, M. D., Hagan-Burke, S., Kwok, O., & Parker, R. (2009). Predictive validity of early literacy
indicators from the middle of kindergarten to second grade. The Journal of Special Education, 42(4),
209-226.
Bus, A. G., & van Ijzendoorn, M. H. (1999). Phonological awareness and early reading: A meta-
analysis of experimental training studies. Journal of Educational Psychology, 91(3), 403-414.
Calderón, M., & Minaya-Rowe, L. (2003). Designing and implementing two-way bilingual
programs. Thousand Oaks, CA: Corwin.
Capps, R., Fix, M., Murray, J., Ost, J., Passel, J. S., & Herwantoro, S. (2005). The new demography of
America's schools: Immigration and the No Child Left Behind Act. Washington, DC: Urban Institute.
Carlisle, J. F., Cortina, K. S., & Zeng, J. (2010). Reading achievement in Reading First schools in
Michigan. Journal of Literacy Research, 42(1), 49-70.
Caro, D. H., McDonald, J. T., & Willms, J. D. (2009). Socio-economic status and academic
achievement trajectories from childhood to adolescence. Canadian Journal of Education, 32(3), 558-
590.
Catts, H. W., Petscher, Y., Schatschneider, C., Bridges, M. S., & Mendoza, K. (2009). Floor effects
associated with universal screening and their impact on the early identification of reading disabilities.
Journal of Learning Disabilities, 42(2), 163-176.
Cavanaugh, C. L., Kim, A., Wanzek, J., & Vaughn, S. (2004). Kindergarten reading interventions for at-
risk students: Twenty years of research. Learning Disabilities: A Contemporary Journal, 2(1), 9-21.
Cheung, C. K. & Slavin, R. E. (2012). Effective reading programs for Spanish dominant English
Language Learners (ELLs) in the elementary grades: A synthesis of research. Best Evidence
Encyclopedia, Retrieved November 21, 2012, from
http://www.bestevidence.org/word/ell_read_mar_19_2012.pdf.
Chiappe, P., Siegel, L. S., & Wade-Woolley, L. (2002). Linguistic diversity and the development of
99
reading skills: A longitudinal study. Scientific Studies of Reading, 6(4), 369-400.
Clarkson, L. M. C. (2008). Demographic data and immigrant student achievement. Theory into
Practice, 47(1), 20-26.
Cummings, K. D., Kaminski, R. A., Good, III, R. H., & O'Neil, M. (2011). Assessing phonemic
awareness in preschool and kindergarten: Development and initial validation of first sound fluency.
Assessment for Effective Intervention, 36(2), 94-106.
Cummins, J. (1980). The crosslinguistic dimensions of language proficiency: Implications for bilingual
education and the optimal age issue. TESOL Quarterly, 14(3), 175-187.
Cummins, J. (2000). Language, power and pedagogy: Bilingual children in the crossfire. Clevedon,
UK: Multilingual Matters.
Currie, J., & Thomas, D. (1995). Does Head Start make a difference? American Economic Review,
85(3), 341-364.
Dauber, S. L., Alexander, K. L., & Entwisle, D. R. (1996). Tracking and transitions through the middle
grades: Channeling educational trajectories. Sociology and Education, 69(4), 290-307.
Dee, T. S., Jacob, B., & Schwartz, N. L. (in press). The effects of NCLB on school resources and
practices. Educational Evaluation and Policy Analysis,
Desimone, L. M., & Long, D. (2010). Teacher effects and the achievement gap: Do teacher and
teaching quality influence the achievement gap between black and white and high- and low-SES
students in the early grades? Teachers College Record, 112(12), 3024-3073.
Dewey, E. N., Latimer, R. J., Kaminski, R. A., & Good, R. H. (2012). DIBELS Next Development:
Findings from Beta 2 Validation Study (Technical Report No. 10), Eugene, OR: Dynamic Measurement
Group.
DIBELS Data System, dibels.uoregon.edu (accessed December 1, 2012).
Donovan, S., & Cross, C. (Eds.). (2002). Minority students in special and gifted education.
Washington, DC: National Academy Press.
Duncan, L. G. & Seymour, P. H. K. (2000). Socio-economic differences in foundation-level literacy.
British Journal of Psychology, 90(2), 145-166.
Echevarria, J., Short, D., & Powers, K. (2003). School reform and standards-based education: How do
teachers help English language learners? (Technical report). Santa Cruz, CA: Center for Research on
Education, Diversity & Excellence.
Elmore, R. F. (1996). Getting to scale with good educational practice. Harvard Educational Review,
66(1), 1-26.
Elsby, M. W., Hobijn, B., & Sahin, A. (2010). The labor market in the Great Recession. The National
Bureau of Economic Research working paper no. 15979.

100
Engwisle, D. R., Alexander, K. L., & Olson, L. S. (2003). The first-grade transition in life coures
perspective. In J. T. Mortimer & M. J. Shanahan (Eds.), Handbook of the life course. New York:
Kluwer Academic/Plenum.
Evans, G. W. (2004). The environment of child poverty. American Psychologist, 59(2), 77-92.
Farber, H. S. Job loss and Unemployment in the 21st century: The Great Recession in labor market
perspective. Retrieved at https://www.frbatlanta.org/documents/news/conferences/10CHCS_farber.pdf
on March 4, 2012.
Fashola, O. S., Drum, P. A., Mayer, R. E., & Kang, S. J. (1996). A cognitive theory of orthographic
transitioning: Predictable errors in how Spanish-speaking children spell English words. American
Educational Research Journal, 33(4), 825-843.
Fien, H., Baker, S. K., Smolkowski, K., Smith, J. L. M., Kame'enui E. J., & Beck, C. T. (2008). Using
nonsense word fluency to predict reading proficiency in kindergarten through second grade for English
learners and native English speakers. School Psychology Review, 37(3), 391-408.
Finn, P. J. (1999). Literacy with an attitude: Educating working-class children in their own self-
interest. Albany, NY: State University of New York Press.
Flores, S. M., Batalova, J., & Fix, M. (2012). The educational trajectories of English language learners
in Texas. Washington, DC: Migration Policy Institute.
Foorman, B. R., & Moats, L. C. (2004). Conditions for sustaining research-based practices in early
reading instruction. Remedial and Special Education, 25(1), 51-60.
Foorman, B. R., Petscher, Y., Lefsky, E. B., & Toste, J. R. (2010). Reading First in Florida: Five years
of improvement. Journal of Literacy Research, 42(1), 71-93.
Francis, D. J., Lesaux, N., & August, D. (2006). Language of instruction. Developing literacy in
second-language learners, 365-413.
Fraenkel, J.R., & Wallen, N. E. (1996). How to Design and Evaluate Research in Education (3rd ed.)
New York: McGraw-Hill.
Fry, R. (2007). How far behind in math and reading are English Language Learners? Washington, DC:
Pew Hispanic Center.
Fuchs, D., Compton, D. L., Fuchs, L. S., Bouton, B., & Caffrey, E. (2011). The construct and predictive
validity of a dynamic assessment of young children learning to read: Implications for RTI frameworks.
Journal of Learning Disabilities, 44(4), 339-347.
Fuchs, D., Fuchs, L. S., Mathes, P. G., & Simmons, D., C. (1997). Peer-assisted learning strategies:
Making classrooms more responsive to academic diversity. American Educational Research Journal,
34(1), 174-206.
Gabbard, D. A. (2003). A nation at risk – reloaded: Part I. Journal for Critical Education Policy

101
Studies, 1(2), 1-14.
Gamse, B. C., Jacob, R. T., Horst, M., Boulay, B., Unlu, F., Bozzi, L., Caswell, L., Rodger, C., Smith,
W. C., Brigham, N., & Rosenblum, S. (2008). Reading First impact study: Final report. US
Department of Education, National Center for Education Evaluation and Regional Assistance, Institute
of Education Sciences.
Garcia, G. (2000). Bilingual children’s reading. In M.L. Kamil, P. B. Mosenthal, P. D. Pearson, & R.
Barr (Eds.), Handbook of reading research (Vol. 3, pp. 813–834). Mahwah, NJ: Erlbaum.
Gay, L. R. (1996). Educational Research: Competencies for Analysis and Application. (5th ed.) Upper
Saddle River, NJ: Prentice-Hall.
Gay, L. R., Mills, G. E., & Airasian, P. W. (2006). Educational research: Competencies for analysis and
applications.
Gayle, R. & Pearce, L. (2008). Oral reading fluency as a predictor of reading comprehension on a
state's measure of adequate yearly progress. International Journal of Psychology: A Biopsychosocial
Approach, 1, 51-70.
Genessee, F., Lindholm-Leary, K., Saunders, W., & Christian, D. (2005). English language learners in
U.S. Schools: Overview of research findings. Journal of Education for Students Placed at Risk, 10(4),
363-385.
Genessee, F. (Ed.). (1999). Program alternatives for linguistically diverse students. (Educational
Practice Report 1). Santa Cruz, CA & Washington, DC: Center for Research on Education, Diversity &
Excellence.
Gersten, R., & Geva, E. (2003). Teaching reading to early language learners. Educational Leadership,
60(7), 44-49.
Geva, E. (2000). Issues in the assessment of reading disabilities in L2 children. Dyslexia, 6(1), 13-28.
Geva, E., & Wang, M. (2001). The role of orthography in the literacy acquisition of young L2 learners.
Annual Review of Applied Linguistics, 21(1), 182-204.
Goffreda, C. T., Diperna, J. C., & Pedersen, J. A. (2009). Preventive screening for early readers:
Predictive validity of the Dynamic Indicators of Basic Early Literacy Skills (DIBELS). Psychology in
the Schools, 46(6), 539-552.
Goldenberg, C. (2008). Teaching English language learners. American Educator, Summer, 8-23, 42-44.
Good III, R. H., Baker, S. K., & Peyton, J. A. (2008). Making sense of nonsense word fluency:
Determining adequate progress in early first-grade reading. Reading & Writing Quarterly, 25(1), 33-56.
Good III, R. H., & Kaminski, R. A. (2011). DIBELS Next assessment manual. Dynamic Measurement
Group, Inc.
Good III, R. H., Simmons, D. C., & Kame'enui, E. J. (2001). The importance and decision-making

102
utility of a continuum of fluency-based indicators of foundational reading skills for third-grade high-
stakes outcomes. Scientific Studies of Reading, 5(3), 257-288.
Gray, S. A., Chaban, P., Martinussen, R., Goldberg, R., Gotlieb, H., Kronitz, R., & Tannock, R. (2012).
Effects of a computerized working memory training program on working memory, attention, and
academics in adolescents with severe LD and comorbid ADHD: a randomized controlled trial. Journal
of Child Psychology and Psychiatry, 53(12), 1277-1284.
Greenwald, R., Hedges, L., & Laine, R. (1996). The effect of school resources on student achievement.
Review of Educational Research, 66(3), 361-396.
Gross, K. R. (2012). Examination of curriculum-based measurement as a predictor of state assessment
proficiency levels, Emporia State University.
Guthrie, J. W., & Springer, M. G. (2004). A Nation at Risk revisited: Did “wrong” reasoning result in
“right” results? At what cost? Peabody Journal of Education, 79(1), 7-35.
Gyovai, L. K., Cartledge, G., Kourea, L., Yurick, A., & Gibson, L. (2009). Early reading intervention:
Responding to the learning needs of young at-risk English language learners. Learning Disability
Quarterly, 32(3), 143-162.
Hanushek, E. A., Kain, J. F., & Rivkin, S. G. (2009). New evidence about Brown v. Board of
Education: The complex effects of school racial composition on achivement. Journal of Labor
Economics, 27(3), 349-383.
Hart, B., & Risley, T. R. (1995). Meaningful differences in the everyday experience of young American
children. Baltimore, MD: Brookes.
Haskins, R., Greenberg, M., & Fremstad, S. (2004). Federal policy for immigrant children: Room for
common ground? [Policy brief]. Future of Children, 14(2), 1-5.
Haycock, K. (2003). Closing the disparity gap. Teacher Librarian, 30(4), 38.
Heath, S. B. (1991). The sense of being literate: Historical and cross-cultural features. In S.
McCormick. Instructing students who have literacy problems (p. 43). Upper Saddle River, NJ: Pearson
Education.
Heller, K. A., Holtzman, W., & Messick, S. (Eds.). (1982). Placing children in special education:A
strategy of equity. Washington, DC: National Academy Press.
Hemphill, F. C., Vanneman, A., & Rahman, T. (2011). Achievement gaps: How Hispanic and White
students in public schools perform in mathematics and reading on the National Assessment of
Educational Progress. Statistical Analysis Report. National Center for Education Statistics.
Hewitt, T. W. (2008). Speculations on “A Nation at Risk”: Illusions and Realities. The Phi Delta
Kappan, 89(8), 575-579.
Hicks, D. (2002). Reading lives: Working class children and literacy learning. New York, NY: Teachers
103
College Press.
Hoff, Erika. (2013). Interpreting the early language trajectories of children from low-SES and language
minority homes: Implications for closing the achievement gaps. Developmental Psychology, 49(1), 4-
14.
Juel, C. (1988). Learning to read and write: A longitudinal study of 54 children from first to fourth
grades. Journal of Educational Psychology, 80(4), 437-447.
Kainz, K., & Vernon-Feagans, L. (2007). The ecology of early reading development for children in
poverty. The Elementary School Journal, 107(5), 407-427.
Kaminksi, R. A., & Good III, R. H. (1996). Toward a technology for assessing basic early literacy
skills. School Psychology Review, 25(2), 215-227.
Kammii, C., & Manning, M. (2005). Dynamic Indicators of Basic Early Literacy Skills (DIBELS): A
tool for evaluating student learning? Journal of Research in Childhood Education, 20(2), 75-90.
Kansas State Department of Education. (2009). Kansas English Language Proficiency Assessment
(KELPA) Handbook. Topeka, KS. State Department of Education.
---. (2010). Kansas English Language Proficiency Assessment (KELPA). Retrieved February 15, 2014,
from htttp://www.ksde.org.
---. (2013). Kansas Assessment Examiner's Manual. Topeka, KS. State Department of Education.
Kane, M. (2002). Validating high-stakes testing programs. Educational Measurement: Issues and
Practice, 21(1), 31-41.
Karp, F. and Uriarte, M. (2010). Educational outcomes of English language learners in Massachusetts:
A focus on Latino/a students. Gaston Institute Publications. Paper 159.
Keigher, A. 2009. Characteristics of public, private, and Bureau of Indian Education elementary and
secondary schools in the United States: Results from the 2007-08 schools and staffing survey.
Washington, DC: National Center for Education Statistics.
Kieffer, M. J. (2008). Catching up or falling behind? Initial English proficiency, concentrated poverty,
and the reading growth of language minority learners in the United States. Journal of Educational
Psychology, 100(4), 851-868.
Kozma, R., & Croninger, R. (1992). Technology and the fate of at-risk students. Education and Urban
Society, 24(4), 440-453.
Laird, J., DeBell, M., Kienzl, G., & Chapman, C. (2007). Dropout rates in the United States: 2005.
Washington, DC: National Center for Education Statistics.
Lan, W., and R. Lanthier. (2003). Changes in students' academic performance and perceptions of school
and self before dropping out of schools. Journal of Education for Students Placed at Risk, 8(3), 309-
104
332.
Long, R. F., & Huebner, S. (2014). Differential validity of global and domain-specific measures of life
satisfaction in the context of schooling. Child Indicators Research, 1-24.
Luster, T., & McAdoo, H. (1996). Family and child influences on educational attainment: A secondary
analysis of the High/Scope Perry Preschool data. Developmental Psychology, 32(1), 26-39.
Mahoney, K. S., Thompson, M. S., & MacSwan, J. (2004). The condition of English language learners
in Arizona: 2004. In A. Molnar (Ed.), The condition of pre-K-12 education in Arizona: 2004 (pp. 3.1-
3.27). Tempe: Education Policy Studies Laboratory, Arizona State University.
MacSwan, J. & Pray, L. (2005). Learning English bilingually: Age of onset of exposure and rate of
acquisition among English language learners in a bilingual education program. Bilingual Research
Journal, 29(3), 653-678.
Mazzeo, J., Carlson, J. E., Voelkl, K. E., & Lutkus, A. D. (2000). Increasing the participation of special
needs students in NAEP: A report on 1996 NAEP research activities (NCES 2000-473). Washington,
DC: U.S. Department of Education, Office of Educational Research and Improvement, National Center
for Educational Statistics.
McCormick, S. (2003). Instructing students who have literacy problems. Upper Saddle River, NJ:
Pearson Education.
McLoyd, V. (1998). Socioeconomic disadvantage and child development. American Psychologist,
53(2), 185-204.
Menken, Kate. (2009). Policy failures: No Child Left Behind and English Language Learners. Critical
Pedagogy and Teacher Education in the Neoliberal Era Explorations of Educational Purpose, 6, 49-
62.
---. (2010). NCLB and English language learners: Challenges and consequences. Theory Into Practice,
49(2), 121-128.
Menzies, H. M., Mahdavi, J. N., & Lewis, J. L. Early intervention in reading: From research to
practice. Remedial and Special Education, 29(2), 67-77.
Mislevy, R. J. (2003). Argument and substance and argument structure in educational assessment. Law,
Probability and Risk, 2(4), 237-258.
Mislevy, R. J., Steinberg, L. S., & Almond, R. G. (2003). On the structure of educational assessments.
Measurement: Interdisciplinary Research and Perspective, 1, 3-62.
Mitchell, K. (2008). Response to the Reading First impact Study Interim Report. Doctoral dissertation,
State University of New York.
National Clearinghouse for English Language Acquisition and Language Instruction Educational
Programs. (2011). The growing numbers of English learner students: 1998/99–2008/09. Washington,
DC: National Clearinghouse for English Language Acquisition and Language Instruction Educational
105
Programs. Retrieved November 21, 2012, from
www.ncela.gwu.edu/files/uploads/9/growingLEP_0809.pdf.
National Institute of Child Health and Human Development (2000). Report of the National Reading
Panel. Teaching children to read: An evidence-based assessment of the scientific research literature on
reading and its implications for reading instruction (NIH Publication No. 00-4769). Washington, DC:
U.S. Government Printing Office.
National Reading Panel. (2000). Teaching children to read: An evidence-based assessment of the
scientific research literature on reading and its implications for reading instruction (NIH Publication
No. 00-4769). Washington, DC: National Institute of Child Health and Human Development.
National Reading Panel. (n.d.). About the National Reading Panel (NRP). Retrieved May 18, 2013,
from www.nationalreadingpanel.org.
Nelson, J. M. Beyond correlational analysis of the Dynamic Indicators of Basic Early Literacy Skills
(DIBELS): A classification validity study. School Psychology Quarterly, 23(4), 542-552.
Northwest Evaluation Association. (2009). Technical manual for Measures of Academic Progress and
Measures of Academic Progress for Primary Grades. Lake Oswego, OR: Author.
---. (2014). Retrieved February 15, 2014, from http://www.nwea.org.
Olsen, R. E. W-B. (1993). A survey of LEP and adults ELL enrollments in US public schools. In
Language minority student enrollment data. Symposium conducted at the 27th Annual TESOL
Convention, Atlanta, GA.
O'Shaughnessy, T. E., & Swanson, H. L. (2000). A comparison of two reading interventions for
children with reading disabilities. Journal of Learning Disabilities, 33(3), 257-277.
Paleologos, T. M., & Brabham, E. G. (2011). The effectiveness of DIBELS oral reading fluency for
predicting readingn comprehension of high- and low-income students. Reading Psychology, 32(1), 54-
74.
Planty, M., Hussar, W., Snyder, T., Provasnik, S., Kena, G., Dinkes, R., et al. (2008). The condition of
education 2008 (NCES 2008-031). Washington, DC: National Center for Education Statistics, Institute
of Education Sciences, U.S. Department of Education. Retrieved from
http://nces.ed.gov/pubs2008/2008031.pdf.
Powell-Smith, K. A., Kaminski, R. A., & Good, R. H. (2011). DIBELS Survey Beta (Technical Report
No. 8). Eugene, OR: Dynamic Measurement Group.
Pressley, M., & Wharton-McDonald, R. (1997). Skilled comprehension and its development through
instruction. School Psychology Review, 26(3), 448-466.
Pressley, M., Hilden, K., & Shankland, R. (2005). An evaluation of end-of-grade 3 Dynamic Indicators
of Basic Early Literacy Skills (DIBELS): Speed reading without comprehension, predicting little. East
Lansing: Literacy Achievement Research Center, Michigan State University.

106
Ramirez, J., Pasta, D. J., Yuen, S., Billings, D. K., & Ramey, D. R. (1991). Final report: Longitudinal
study of structural immersion strategy, early-exit, and late-exit transitional bilingual education
programs for language-minority children. San Mateo, CA: Aguirre International (Report to the U.S.
Department of Education).
Ransdell, S. (2012). There's still no free lunch: Poverty as a composite of SES predicts school-level
reading comprehension. American Behavioral Scientist, 56(7), 908-925.
Rashotte, C. A., MacPhee, K., & Torgesen, J. K. (2001). The effectiveness of a group reading
instruction program with poor readers in multiple grades. Learning Disability Quarterly, 24(2), 119-
134.
Reschly, A. L., Busch, T. W., Betts, J., Deno, S. L., & Long, J. D. (2009). Curriculum-based
measurement oral reading as an indicator of reading achievement: A meta-analysis of the correlational
evidence. Journal of School Psychology, 47(6), 427-469.
Riedel, B. W. (2007). The relation between DIBELS, reading comprehension, and vocabulary in urban
first-grade students. Reading Research Quarterly, 42(4), 546-567.
Roehrig, A. D., Petscher, Y., Nettles, S. M., Hudson, R. F., & Torgesen, J. K. (2008). Accuracy of the
DIBELS oral reading fluency measure for predicting third grade reading comprehension outcomes.
Journal of School Psychology, 46(3), 343-366.
Rolstad, K., Mahoney, K., & Glass, G. V. (2005). The big picture: A meta-analysis of program
effectiveness research on English language learners. Educational Policy, 19(4), 572-594.
Rumberger, R. (1995). Dropping out of middle school: A multilevel analysis of students and schools.
American Educational Research Journal, 32(3), 583-625.
Rumberger, R. (2004). Why students drop out of school. In Dropouts in America: Confronting the
graduation rate crisis, ed. G. Orfied. p. 131-155. Cambridge, MA: Harvard Education Press.
Scarborough, H. S. (1998). Predicting the future achievement of second graders with reading
disabilities: Contributions of phonemic awareness, verbal memory, rapid naming, and IQ. Annals of
Dyslexia, 48(1), 673-705.
Shaywitz, S. E., Fletcher, J. M., Holahan, J. M., Shneider, A. E., Marchione, K. E., Stuebing, K. K.,
Francis, D. J., Pugh, K. R., & Shaywitz, B. A. (1999). Persistence of dyslexia: The Connecticut
longitudinal study at adolescence. Pediatrics, 104(6), 1351-1359.
Shelton, N. R., Altwerger, B., & Jordan, N. (2009). Does DIBELS put reading first? Literacy Research
and Instruction, 48(2), 137-148.
Sheng, Z., Sheng, Y., & Anderson, C. J. (2011). Dropping out of school among ELL students:
Implications to schools and teacher education. Clearing House, 84(3), 98-103.
Short, D., & Echevarria, J. (2004). Teacher skills to support English language learners. Educational
Leadership, 62(4), 8-13.

107
Shohamy, E. (2001). The power of tests: A critical perspective on the uses of language tests. London:
Pearson.
Simmons, D. C., & Kameenui, E. J. (1997). Introduction. In D. Simmons, & E. Kameenui (Eds.) What
Research Tells Us About Children With Diverse Learning Needs. Mahwah, NJ: Lawrence Erlbaum
Associates.
Sirin, S. R. (2005). Socioeconomic status and academic achievement: A meta-analytic review of
research. Review of Educational Research, 75(3), 417-453.
Slavin, R. E. & Cheung, A. (2005). A synthesis of research on language of reading instruction for
English language learners. Review of Educational Research, 75(2), 247-284.
Smith, T., Desimone, L., & Ueno, K. (2005). “Highly qualified” to do what? The relationship between
NCLB teacher quality mandates and the use of reform-oriented instruction in middle school math.
Educational Evaluation and Policy Analysis, 27(1), 75-109.
Snow, C. E., & Paez, M. M. (2004). The Head Start classroom as an oral language environment: What
should the performance standards be? In E. Zigler & S. J. Styfco (Eds.), The Head Start Debates (pp.
113-128). Baltimore: Brookes.
Spencer, M. B. (2008). Lessons learned and opportunities ignored since Brown v. Board of Education:
Youth development and the myth of a color-blind society. Educational Researcher, 37(5), 253-266.
Swanson, C. B. (2011). Analysis finds graduation rates moving up: Strong signs of improvement on
graduation. Education Week, 39(34), 23-25.
Tavernise, S. (2011, September 13). Soaring poverty casts spotlight on “lost decade.” New York Times.
Retrieved September 29, 2011, from http://www.nytimes.com/2011/09/14/us/14census.html.
Taylor, J., Stecher, B., O'Day, J., Naftel, S., & Le Floch, K. C. (2010). State and local implementation
of the “No Child Left Behind Act”. Volume IX – Accountability under “NCLB”. Final report. US
Department of Education.
TESOL: Teachers of English to Speakers of Other Languages (2000). ELL Standards For Pre-K-12
Students. Pantagraph Printing: Bloomington, IL. Teachers of English to Speakers of Other Languages,
Inc.
Thompson, S. L., Vaughn, S., Hickman-Davis, P., & Kouzekanani, K. (2003). Effectiveness of
supplemental reading instruction for 2nd grade English learners with reading difficulties. Elementary
School Journal, 103(3), 221-238.
Tierney, R. J., & Thome, C. (2006). Is DIBELS leading us down the wrong path? In Kenneth S.
Goodman with Alan Flurkey... [et al.]; foreword by P. David Pearson (Ed.), The Truth about DIBELS:
What it is, what it does (pp. 50-59), Portsmouth, NH: Heinemann.
United States General Accounting Office. (1994). Limited English proficiency: A growing and costly
challenge facing many school districts. (GAO/HEHS 94-38). Washington, DC: Author.

108
Vanderwood, M. L, Linklater, D., & Healy, K. (2008). Predictive accuracy of nonsense word fluency
for English language learners. School Psychology Review, 37(1), 5-17.
Wang, M., & Geva, E. (2003). Spelling acquisition of novel English phonemes in Chinese children.
Reading and Writing: An Interdisciplinary Journal, 16(4), 325-348.
Wang, S., McCall, M., Jiao, H. & Harris, G. (2013). Construct validity and measurement invariance of
computerized adaptive testing: Application to Measures of Academic Progress (MAP) using
confirmatory factor analysis. Journal of Educational and Developmental Psychology, 3(1), 256-273.
Warschauer, M. (2003). Demystifying the digital divide. Scientific American, 289(2), 42-47.
Willig, A. (1985). A meta-analysis of selected studies on the effectiveness of bilingual education.
Review of Educational Research, 55(3), 269–317.
Yurick, A., Cartledge, G., Kourea, L., & Keyes, S. (2012). Reducing reading failure for kindergarten
urban students: A study of early literacy instruction, treatment quality, and treatment duration. Remedial
and Special Education, 33(2), 89-102.
Zehler, A. M., Fleischman, H. L., Hopstock, P. J., Stephenson, T. G., Pendzick, M. J., & Sapru, S.
(2003). Descriptive study of services to LEP students and LEP students with disabilities: Research
Report. Arlington, VA: Development Associates, Inc.
Zhang, D., Hsu, H., Kwok, O., Benz, M., & Bowman-Perrott, L. (2011). The impact of basic-level
parent engagements on student achievement: Patterns associated with race/ethnicity and socioeconomic
status (SES). Journal of Disability Policy Studies, 22(1), 28-39.

109
Appendix
Kindergarten
Percent students scoring At Risk on DIBELS Fall kindergarten Letter Naming Fluency
Test for significance of difference between two proportions
English
12.1%
All Others
(No Span.)
19.7%
All
Others
(No Lao)
25.5%
Chinese
10.7%
Korean
15.3%
Lao
52.1%
Vietnames
e
33.3%
Arabic
24.1%
Others
13.3%
Spanish
37.3%
Z=6.152
P=0.000**
Z=3.418
P=0.001**
Z=2.708
P=0.007*
Z=2.154
P=0.031*
Z=1.327
P=0.185
Z=0.274
P=0.784
Z=1.338
P=0.181
Z=3.621
P=0.000**
Lao
52.1%
Z=5.286
P=0.000**
Z=2.750
P=0.006*
Z=3.23
P=0.001*
Z=2.743
P=0.006*
Z=1.327
P=0.185
Z=1.060
P=0.289
Z=2.083
P=0.037*
Z=3.904
P=0.000**
* The difference between two proportions is significant to the 0.05 level.
** The difference between two proportions is significant to the 0.001 level.
Percent students scoring Low Risk on DIBELS Fall kindergarten Letter Naming Fluency
Test for significance of difference between two proportions
English
71.6%
All Others
(No Span.)
66.3%
All Others
(No Lao)
59.7%
Chinese
82%
Korean
80.8%
Lao
21.8%
Vietnamese
58.3%
Arabic
65.5%
Others
70.7%
Spanis
h
41.8%
Z=5.886
P=0.000**
Z=4.245
P=0.000**
Z=3.828
P=0.000**
Z=3.604
P=0.000**
Z=1.804
P=0.071
Z=1.099
P=0.272
Z=2.295
P=0.022*
Z=3.927
P=0.000**
Lao
21.8
Z=4.992
P=0.000**
Z=3.532
P=0.000**
Z=4.299
P=0.000**
Z=4.130
P=0.000**
Z=1.804
P=0.071
Z=2.159
P=0.031*
Z=3.139
P=0.002*
Z=4.175
P=0.000**
* The difference between two proportions is significant to the 0.05 level.
** The difference between two proportions is significant to the 0.001 level.

110
First Grade
Percent students scoring At Risk on DIBELS Fall first grade Nonsense Word Fluency
Test for significance of difference between two proportions
English
14.9%
All Others
(No Span.)
18.5%
All Others
(No Lao)
20.4%
Chinese
6.9%
Korean
8.3%
Lao
33.3%
Vietnamese
33.3%
Arabic
20.8%
Others
19.5%
Spanish
25.2%
Z=2.597
P=0.009*
Z=1.395
P=0.163
Z=2.147P
=0.032*
Z=1.813
P=0.070
Z=0.728
P=0.467
Z=0.610
P=0.542
Z=0.457
P=0.647
Z=0.927
P=0.354
Lao
33.3%
Z=2.097
P=0.036*
Z=1.452
P=0.147
Z=2.342P
=0.019*
Z=2.043
P=0.041*
Z=0.728
P=0.467
Z=0.000
P=1.000
Z=0.912
P=0.362
Z=1.270
P=0.204
* The difference between two proportions is significant to the 0.05 level.
** The difference between two proportions is significant to the 0.001 level.
Percent students scoring Low Risk on DIBELS Fall first grade Nonsense Word Fluency
Test for significance of difference between two proportions
English
57.4%
All Others
(No Span.)
58.7%
All Others
(No Lao)
53.3%
Chinese
69.0%
Korean
87.5%
Lao
33.3%
Vietnamese
58.3%
Arabic
37.5%
Others
58.4%
Spanish
42.0%
Z=2.947
P=0.003*
Z=2.842
P=0.004*
Z=2.611
P=0.009*
Z=4.067
P=0.000*
Z=0.700
P=0.484
Z=0.420
P=0.583
Z=0.409
P=0.683
Z=2.244
P=0.025*
Lao
33.3%
Z=2.015
P=0.044*
Z=1.647
P=0.099
Z=2.393
P=0.017*
Z=3.627
P=0.000**
Z=0.700
P=0.484
Z=1.354
P=0.176
Z=0.281
P=0.779
Z=1.923
P=0.055
* The difference between two proportions is significant to the 0.05 level.
** The difference between two proportions is significant to the 0.001 level.

111
Second Grade
Percent students scoring At Risk on DIBELS Fall second grade Oral Reading Fluency
Test for significance of difference between two proportions
English
22.4%
All Others
(No Span.)
27.9%
All Others
(No Lao)
30.1%
Chinese
0.00%
Korean
0.00%
Lao
42.9%
Vietnamese
33.3%
Arabic
53.3%
Others
34.9%
Spanish
35.5%
Z=2.611
P=0.009*
Z=1.229
P=0.219
Z=3.239
P=0.001**
Z=3.016
P=0.003*
Z=0.536
P=0.592
Z=0.132
P=0.895
Z=1.318
P=0.187
Z=0.077
P=0.939
Lao
42.9%
Z=1.786
P=0.074
Z=1.005
P=0.429
Z=3.298
P=0.001**
Z=3.083
P=0.002*
Z=0.536
P=0.592
Z=0.460
P=0.645
Z=0.560
P=0.575
Z=0.563
P=0.574
* The difference between two proportions is significant to the 0.05 level.
** The difference between two proportions is significant to the 0.001 level.
Percent students scoring Low Risk on DIBELS Fall second grade Oral Reading Fluency
Test for significance of difference between two proportions
English
61.9%
All Others
(No Span.)
54.7%
All Others
(No Lao)
53.9%
Chinese
80.9%
Korean
83.3%
Lao
35.7%
Vietnamese
44.4%
Arabic
40.0%
Others
52.4%
Spanish
46.2%
Z=2.753
P=0.006*
Z=1.271
P=0.204
Z=2.876
P=0.004*
Z=2.884
P=0.004*
Z=0.736
P=0.461
Z=0.103
P=0.978
Z=0.448
P=0.654
Z=0.760
P=0.447
Lao
35.7%
Z=1.973
P=0.048*
Z=1.322
P=0.186
Z=2.711
P=0.007*
Z=2.759
P=0.006*
Z=0.736
P=0.461
Z=0.417
P=0.676
Z=0.238
P=0.812
Z=1.131
P=0.258
* The difference between two proportions is significant to the 0.05 level.
** The difference between two proportions is significant to the 0.001 level.
Third Grade
Percent students scoring 1st – 33rd percentile on Fall third grade MAP
Test for significance of difference between two proportions
English
21.8%
All Others
(no Spanish)
29.6%
All Others
(no Lao)
34.7%
Chinese
0.05%
Korean
0.00%
Lao
50.0%
Vietnamese
50.0%
Arabic
40.0%
Others
34.5%
Spanish
44.8%
Z=4.518
P=0.000**
Z=2.401
P=0.016*
Z=3.337
P=0.001**
Z=3.599
P=0.000**
Z=0.387
P=0.699
Z=0.314
P=0.753
Z=0.393
P=0.694
Z=1.260
P=0.208
Lao
50.0%
Z=2.621
P=0.009*
Z=1.233
P=0.217
Z=1.233
P=0.217
Z=3.098
P=0.002*
Z=3.431
P=0.001**
Z=0.387
P=0.699
Z=0.000
P=1.000
Z=0.600
P=0.549
Z=1.132
P=0.258
* The difference between two proportions is significant to the 0.05 level.
** The difference between two proportions is significant to the 0.001 level.

112
Percent students scoring 66th – 99th percentile on Fall third grade MAP
Test for significance of difference between two proportions
English
54.0%
All Others
(No Span.)
45.1%
All Others
(No Lao)
37.4%
Chinese
60.0%
Korean
83.3%
Lao
18.6%
Vietnamese
20.0%
Arabic
35.0%
Others
43.1%
Spanish
22.9%
Z=5.413
P=0.000**
Z=3.497
P=0.000**
Z=3.316
P=0.001**
Z=5.023
P=0.000**
Z=0.383
P=0.702
Z=0.209
P=0.835
Z=1.137
P=0.256
Z=2.638
P=0.008*
Lao
18.6%
Z=2.773
P=0.006*
Z=1.512
P=0.131
Z=2.504
P=0.012*
Z=3.772
P=0.000**
Z=0.383
P=0.702
Z=0.088
P=0.930
Z=1.092
P=0.275
Z=1.789
P=0.074
* The difference between two proportions is significant to the 0.05 level.
** The difference between two proportions is significant to the 0.001 level.
Percent students scoring At Risk on DIBELS Fall kindergarten Letter Naming Fluency
Test for significance of difference between two proportions
English
12.4%
All Others
(No Span.)
23.3%
All Others
(No Lao)
27.2%
Chinese
12.5%
Korean
16.7%
Lao
55.6%
Vietnamese
33.3%
Arabic
26.3%
Others
14.8%
Spanish
40.6%
Z=6.197
P=0.000**
Z=2.869
P=0.004*
Z=2.672
P=0.008*
Z=1.929
P=0.054
Z=1.180
P=0.238
Z=0.487
P=0.626
Z=1.172
P=0.241
Z=3.420
P=0.001**
Lao
55.6%
Z=5.039
P=0.000**
Z=2.552
P=0.011*
Z=3.064
P=0.002*
Z=2.429
P=0.015*
Z=1.180
P=0.238
Z=1.199
P=0.230
Z=1.814
P=0.070
Z=3.557
P=0.000**
* The difference between two proportions is significant to the 0.05 level.
** The difference between two proportions is significant to the 0.001 level.
Percent students scoring Low Risk on DIBELS Fall kindergarten Letter Naming Fluency
Test for significance of difference between two proportions
English
70.5%
All Others
(No Span.)
65.1%
All Others
(No Lao)
55.6%
Chinese
73.1%
Korean
83.3%
Lao
11.1%
Vietnamese
44.4%
Arabic
57.9%
Others
67.2%
Spanish
37.5%
Z=5.875
P=0.000**
Z=4.215
P=0.000**
Z=3.236
P=0.001**
Z=3.586
P=0.000**
Z=2.180
P=0.029*
Z=1.388
P=0.165
Z=1.653
P=0.098
Z=3.628
P=0.000**
Lao
11.1%
Z=5.230
P=0.000**
Z=3.642
P=0.000**
Z=4.048
P=0.000**
Z=4.339
P=0.000**
Z=2.180
P=0.029*
Z=2.764
P=0.006*
Z=2.981
P=0.003*
Z=4.199
P=0.000**
* The difference between two proportions is significant to the 0.05 level.
** The difference between two proportions is significant to the 0.001 level.

113
Longitudinal Kindergarten to Second Grade
Percent students scoring At Risk on DIBELS Fall kindergarten Letter Naming Fluency
Test for significance of difference between two proportions
English
13.5%
All Others
(No Span.)
26.9%
All Others
(No Lao)
27.7%
Chinese
12.5%
Korean
28.6%
Lao
64.3%
Vietnamese
42.9%
Arabic
37.5%
Others
15.6%
Spanish
36.9%
Z=4.438
P=0.000**
Z=1.371
P=0.170
Z=1.873
P=0.061
Z=0.589
P=0.556
Z=1.886
P=0.059
Z=0.312
P=0.755
Z=0.033
P=0.974
Z=2.441
P=0.015*
Lao
64.3%
Z=5.073
P=0.000**
Z=2.843
P=0.004*
Z=2.937
P=0.003*
Z=1.894
P=0.058
Z=1.886
P=0.059
Z=0.934
P=0.350
Z=1.214
P=0.225
Z=3.578
P=0.000**
* The difference between two proportions is significant to the 0.05 level.
** The difference between two proportions is significant to the 0.001 level.
Percent students scoring Low Risk on DIBELS Fall kindergarten Letter Naming Fluency
Test for significance of difference between two proportions
English
68.4%
All Others
(No Span.)
59.6%
All Others
(No Lao)
55.5%
Chinese
68.8%
Korean
71.4%
Lao
14.3%
Vietnamese
57.1%
Arabic
62.5%
Others
66.7%
Spanish
40.0%
Z=4.277
P=0.000**
Z=2.481
P=0.013*
Z=2.072
P=0.038*
Z=2.140
P=0.032*
Z=1.823
P=0.068
Z=0.872
P=0.383
Z=1.215
P=0.224
Z=2.754
P=0.006*
Lao
14.3%
Z=4.166
P=0.000**
Z=2.955
P=0.003*
Z=3.005
P=0.003*
Z=3.053
P=0.002*
Z=1.823
P=0.068
Z=2.047
P=0.041*
Z=2.335
P=0.020*
Z=3.437
P=0.001**
* The difference between two proportions is significant to the 0.05 level.
** The difference between two proportions is significant to the 0.001 level.
Longitudinal Kindergarten to Third Grade
Percent students scoring At Risk on DIBEL'S Fall kindergarten Letter Naming Fluency
Test for significance of difference between two proportions
English
12.4%
All Others
(No Span.)
16.5%
All Others
(No Lao)
23.4%
Chinese
0.00%
Korean
22.2%
Lao
60.0%
Vietnamese
37.5%
Arabic
0.00%
Others
7.3%
Spanish
42.4%
Z=5.634
P=0.000**
Z=3.717
P=0.000**
Z=3.298
P=0.001**
Z=1.161
P=0.246
Z=1.235
P=0.217
Z=0.265
P=0.791
Z=2.922
P=0.003*
Z=3.892
P=0.000**
Lao
60.0%
Z=5.031
P=0.000**
Z=3.061
P=0.002*
Z=3.767
P=0.000**
Z=1.799
P=0.072
Z=1.235
P=0.217
Z=1.029
P=0.304
Z=3.390
P=0.001**
Z=4.257
P=0.000**
* The difference between two proportions is significant to the 0.05 level.
** The difference between two proportions is significant to the 0.001 level.

114
Percent students scoring Low Risk on DIBELS Fall kindergarten Letter Naming Fluency
Test for significance of difference between two proportions
English
71.1%
All Others
(No Span.)
64.1%
All Others
(No Lao)
58.4%
Chinese
94.1%
Korean
66.7%
Lao
20.0%
Vietnamese
62.5%
Arabic
23.1%
Others
80.5%
Spanish
40.9%
Z=4.607
P=0.000**
Z=2.958
P=0.003*
Z=3.915
P=0.000**
Z=1.463
P=0.144
Z=1.513
P=0.130
Z=1.165
P=0.244
Z=1.209
P=0.227
Z=4.013
P=0.000**
Lao
20.0%
Z=4.141
P=0.000**
Z=2.854
P=0.004*
Z=4.259
P=0.000**
Z=2.288
P=0.022*
Z=1.513
P=0.130
Z=2.038
P=0.042*
Z=0.199
P=0.842
Z=4.185
P=0.000**
* The difference between two proportions is significant to the 0.05 level.
** The difference between two proportions is significant to the 0.001 level.


![Linking The Learning Dibels Activities[1]](https://img.dokumen.tips/doc/110x75/548f0e75b479599f2f8b460c/linking-the-learning-dibels-activities1.jpg)