Embed Size (px)
Citation preview

The Use of B2B E-commerce Technologies in the Floral Industry
Dr. Melinda Knuth
Food and Resource Economics Department, Mid-Florida Research and Education Center, UF/IFAS
Dr. Charlie Hall
Ellison Chair in International Floriculture, Department of Horticultural Sciences, Texas A&M University
Dr. Marco Palma
Professor and Director of the Human Behavior Lab, Department of Agricultural Economics, Texas A&M University
2
Table of Contents
The Use of B2B E-commerce Technologies in the Floral Industry 1
Table of Contents 2
Executive Summary 6
Introduction 10
Characteristics of the respondents 13
Table Q2.1. Number and percentage of respondents by firm type. 13
Figure Q3.1. E-commerce revenue expectations 5 years from now. 14
Figure Q4.1. Number of locations of survey respondents. 16
Figure Q6.1. How many people does your company employ? 16
Figure Q7.1. Number of years in business by survey respondents. 17
Table Q7.1. E-commerce revenue expectations 5 years from now by years in business. 17
Figure Q23.1. What does your geographic coverage look like? 18
Figure Q23.2. Geographic coverage by type of business 19
Figure Q24.1. How many full-time employees does your company have that are dedicated solely to e-commerce? 20
Table Q24.1. How many full-time employees does your company have that are dedicated solely to e-commerce by firm type? 20
B2B Adoption 87
Table Q8.1. Overall response of respondents: What e-commerce services or technologies does your company currently
utilize? 22
Table Q8.2. Brick and Mortar Florists: What e-commerce services or technologies does your company currently utilize? 24
Table Q8.3. Online Florist: What e-commerce services or technologies does your company currently utilize? 26
Table Q8.4. Supermarkets: What e-commerce services or technologies does your company currently utilize? 28
Table Q8.5. Wholesale florists: What e-commerce services or technologies does your company currently utilize? 30
Table Q8.6. Wire Services: What e-commerce services or technologies does your company currently utilize? 32
Table Q8.7. Domestic Growers: What e-commerce services or technologies does your company currently utilize? 34
Table Q8.8. International Growers: What e-commerce services or technologies does your company currently utilize? 36
Table Q8.9. Importers: What e-commerce services or technologies does your company currently utilize? 37

3
Table Q8.10. Allied Trade Distributors: What e-commerce services or technologies does your company currently utilize? 39
Table Q8.11. Manufacturers: What e-commerce services or technologies does your company currently utilize? 41
Table Q8.12. Years in business by the type of e-commerce service utilized 43
Figure Q9.1. Do you currently accept the following payment methods on your website? 48
Table Q9.1. Overall: Do you currently accept the following payment methods on your website? 48
Table Q9.2. By firm type: Do you currently accept the following payment methods on your website? 48
Figure Q10.1. Do you offer the following e-commerce services on your website? 51
Table Q10.1. By firm type: Do you offer the following e-commerce services on your website? 51
Figure Q11.1. What have been the greatest obstacles you have faced in implementing B2B e-commerce? 56
Table Q11.1. By firm type: What have been the greatest obstacles you have faced in implementing B2B e-commerce? 57
Omnichannel 61
Figure Q12.1. Do you consider your firm to be omnichannel? 61
Table Q12.1. By firm type: Do you consider your firm to be omnichannel? 61
Figure Q13.1. What are the components that make up your omnichannel strategy? 62
Table Q13.1. What are the components that make up your omnichannel strategy? 62
Table Q13.2. By firm type: “What are the components that make up your omnichannel strategy?” 63
Figure Q14.1. After introducing your B2B e-commerce platform, what are you able to do now that previously you couldn’t? 66
Table Q14.1. By firm type: After introducing your B2B e-commerce platform, what are you able to do now that previously you
couldn’t? 66
Figure Q15.1. Does the potential for channel conflict prevent you from selling online? 69
Table Q15.1. By firm type: Does the potential for channel conflict prevent you from selling online? 69
Table Q16.1. How strongly do you agree or disagree with the following statements regarding your likelihood to use artificial
intelligence technology in implementing your B2B e-commerce: 69
Table Q16.2. By the number of employees: How strongly do you agree or disagree with the following statements regarding your
likelihood to use artificial intelligence (AI) technology in implementing your B2B e-commerce? 70
Figure Q17.1. What of the following features are you looking to introduce to help enhance your customers information gathering
and purchasing experience? 71
Table Q 17.1. By firm type: What of the following features are you looking to introduce to help enhance your customers information
gathering and purchasing experience? 72
Online Ordering 87
Figure Q18.1. Do you currently accept online orders? 74

4
Table Q18.1. By firm type: Do you currently accept online orders? 74
Figure Q19.1. What portion of your company’s total revenue in 2018, 2019, and projected in 2020 was transacted online? 75
Figure Q20.1 How many SKUs do you have for sale online each month? 76
Table Q20.1. By firm type: How many SKUs do you have for sale online each month? 76
Figure 21.1 How many online orders do you have each month? 78
Table Q21.1. By firm type: How many online orders do you have each month? 78
Figure Q22.1. How many online customers do you have each month? 80
Table Q22.1. By firm type: How many online customers do you have each month? 80
Preferences of respondents 82
Figure Q25.1. What are the challenges to the implementation of e-commerce in the floral industry? 82
Figure Q25.2. By Firm Type: What are the challenges to implementing e-commerce? 83
Table Q25.1.By firm type: What are the challenges to the implementation of e-commerce in the floral industry? 83
Table Q26.1. Respondents were asked to rank on a seven point scale of how much they Strongly Agreed to Strongly Disagreed each
statement. 84
Figure Q27.1. Are you using data from your e-commerce platform to support or manage key business drivers? 86
Table Q27.1. By firm type: Are you using data from your e-commerce platform to support or manage key business drivers? 86
Table Q27.2. By number of fully dedicated e-commerce employees: Are you using data from your e-commerce platform to support or
manage key business drivers? 86
Table Q27.3. By “Are you Omnichannel?”: Are you using data from your e-commerce platform to support or manage key business
drivers? 87
B2B Buyers 87
Figure Q28.1. How frequently do you place an online order with your top 10 suppliers? 88
Table Q28.1. By firm type: How frequently do you place an online order with your top 10 suppliers? 88
Figure Q29.1. Which of the following factors would persuade you to choose a vendor? 90
Table Q29.1. By firm type: Which of the following factors would persuade you to choose a vendor? 90
Table Q29.2. By future e-commerce revenue: Which of the following factors would persuade you to choose a vendor? 92
Table Q29.3. By number of firm locations: Which of the following factors would persuade you to choose a vendor? 92
Table Q29.3. By the number of employees: Which of the following factors would persuade you to choose a vendor? 93
Table Q30.1. Do you prefer accessing the following information online or offline? 94
Conclusion 94

5
Glossary 95
Affiliate Marketing: the process of earning a commission by promoting other people's (or company's products 95
Analytics: is the measurement, collection, analysis and reporting of web data for purposes of understanding and optimizing web usage. 95
Artificial Intelligence (AI): sometimes called machine intelligence, is intelligence demonstrated by machines, unlike the natural
intelligence displayed by humans and animals. 95
Comparison Engine Feeds: listing a product on a search engine. Pay fee for each click to your shop (i.e. Google shopping, Amazon
Marketplace, Ebay Commerce Network)) 95
Content Management: is a set of processes and technologies that supports the collection, managing, and publishing of information in any
form or medium. When stored and accessed via computers, this information may be more specifically referred to as digital content, or
simply as content. 95
Customer Relationship Management (CRM) software: refers to any tech solution that helps businesses manage communication with
current and potential clients. 95
Electronic Data Interchange (EDI): is the concept of businesses electronically communicating information that was traditionally
communicated on paper, such as purchase orders and invoices. Technical standards for EDI exist to facilitate parties transacting such
instruments without having to make special arrangements. 95
Enterprise Resource Planning (ERP) software: defined as the ability to deliver an integrated suite of business applications. ERP tools share
a common process and data model, covering broad and deep operational end-to-end processes, such as those found in finance, HR,
distribution, manufacturing, service and the supply chain. 96
Escrow: payment services like TraxPay, Syncada, and Basware 96
Native Mobile App: is one that is installed directly onto the smartphone and can work, in most cases, with no internet connectivity
depending on the nature of the app. Native apps are installed through an application store (such as Google Play or Apple's App Store). 96
Omnichannel: integrating the different methods of shopping available to consumers (e.g., online, in a physical store, or by phone) 96
Personalized Customer Management: using data insights regarding customer purchasing history and recent orders 96
Rich Media: includes advanced features like video, audio, or other elements that encourage viewers to interact and engage with the
content 96
Search Engine Marketing: is a form of Internet marketing that involves the promotion of websites by increasing their visibility in search
engine results pages primarily through paid advertising. 96
Social Media Marketing: is the use of social media platforms and websites to promote a product or service. Although the terms e-
marketing and digital marketing are still dominant in academia, social media marketing is becoming more popular for both practitioners
and researchers. 96
Web Analytics: is the measurement, collection, analysis and reporting of web data for purposes of understanding and optimizing web
usage. 96
Web Hosting: is a type of Internet hosting service that allows individuals and organizations to make their website accessible via the World
Wide Web. 96
Web Performance Management: measurement of a website's or web service's ability to respond efficiently to end-user interactions 96

6
Appendices 96

7
Executive Summary
Much has been written regarding the structural changes occuring in the floral industry including trade magazine articles, market
research reports, industry white papers, and academic journal articles. Nine floral associations commissioned and funded a study to
compile relevant secondary research and/or data in order to benchmark industry trends, determine gaps in the available information
that can be further researched and analyzed. The goal of this study was to make the findings widely accessible to the industry. One of
the prioritized gaps that was first investigated was the status of current (and planned) usage of B2B (business-to-business)
technologies in the floral industry. This project was particularly relevant because of the shift towards digital platforms during the
COVID-19 pandemic (see figure below).
B2B e-commerce stands for business-to-business electronic commerce and refers to online transactions between businesses involving
electronic tools or technologies (e.g. e-commerce websites, web-procurement software, vertical market networks, online marketplaces,
etc.). An example of a B2B transaction is when a manufacturer sells products directly to retail customers using an online webshop, or,
even perhaps, selling directly to end consumers via an online marketplace. A questionnaire was developed according to findings in the
literature and approved by each of the funding entities, who in early summer 2020 using their entire respective membership lists,
ensuring representation by companies participating in each sector in the floral industry supply chain.
A total of 306 firms responded to the survey. As anticipated, a large portion (44%) of the respondents were from the retail sector
including brick and mortar (B&M) florists and online florists. Least represented firms were from the distribution and manufacturing

8
sectors, which intuitively makes sense since we know from the make-up of the industry that there are far fewer manufacturers and
distributors than retail outlets. Other characteristics of the sample frame include:
● Approximately 50% of respondents believe e-commerce will account for 21-80% of their revenue in 5 years. About 31%
believe that 1-20% of their revenue will come from e-commerce in the future. On the extremes, 8% believe that none at all will
account for their revenue and 4% believe that all or nearly all of their revenue will come from e-commerce.
● About 63% of the respondents employ fewer than 25 people, with another 25% hiring 26 to 200 employees, and 13% employ
over 200 employees.
● Interestingly, 16% of the respondents have no official business location and another 61% only have one location. Slightly less
than a quarter of the respondents (23%) indicated that they operate 2 or more locations.
● The majority (60%) of the respondents have been in business for more than 20 years. Only 3% have been in business a year or
less and 7% have either been in business 2-5 years or 6-10 years.
It appears that there is a relatively low percentage of firms utilizing e-commerce services currently. Only two of the services or
technologies were used by more than half of the respondents either as a seller or as a buyer -- email marketing and social media
marketing.
● As sellers, most businesses are using analytics, customer reviews, e-commerce platforms, email marketing, fulfillment,
payment processing, site design, and social media marketing when selling a product.
● As buyers, no service was overwhelmingly utilized, but e-commerce platforms, email marketing, order management, payment
processing, and payment security were the most utilized of the services used by firms.
● Most businesses, as either sellers or buyers, do not utilize affiliate marketing, comparison engine feeds, customer relationship
management software, customer services software, enterprise resource planning software, live chats on their website,
marketplace management, rich media, shipping carrier integration, and website testing/optimization.
Historically, there has been some negativity associated with selling omnichannel and disrupting the traditional selling relationships.
Yet, we see firms become more and more omnichannel as technology allows them. As predicted by the main report and interviews
conducted, a great majority of the respondents consider themselves to be omnichannel (82%). Additionally, 40% of firms disagree or
strongly disagree that selling online to a wider customer base creates channel conflict and another 40% feel neutrally that it creates
channel conflict.
● When comparing components by firm, 51% of brick and mortar florists use their own webstore, 55% use social media, 56%
use their physical store as part of their omnichannel strategy. Twenty percent of firms use mobile apps, 34% use email
marketing with buy buttons, and 17% use faxing.

9
● Online florists use the components of their own website (50%), social media (50%), email marketing with buy buttons (38%),
and a physical store (44%) as part of their omnichannel strategy. Less than 15% use a distributor’s webstore, mobile apps
(13%), B2B marketplace (6%), call centers (13%), mail order (6%), and faxing (6%).
● Supermarkets use social media (20%) and mail orders (20%) as part of their omnichannel strategy.
● Wholesale florists use the components of their own webstore (25%), social media (41%), B2B marketplace (20%), call centers
(24%), a physical store (36%), and faxing (22%) as part of their omnichannel strategy. Less than 15% of wholesale florists use
a distributor’s webstore, mobile apps, email marketing with buy buttons, and other services.
● Wire Services use their own webstore (68%), social media (68%), email marketing with buy buttons (33%), a physical store
(68%), and mail ordering (33%).
● Domestic growers use the components of their own webstore (31%), social media (49%), call centers (23%), and a physical
store (23%). Less than 15% of domestic growers use a distributor’s webstore (3%), mobile apps (6%), B2B marketplace (9%),
mail ordering (3%), faxing (11%), and other services (11%).
● International growers use their own webstore (23%), social media (46%), and mail ordering (46%). Less than 15% of
international growers use mobile apps, email marketing with buy buttons, call centers, and faxing.
● Importers use the components of their own webstore (39%), social media (50%), mobile apps (17%), email marketing with buy
buttons (22%), B2B marketplace (39%), call center (33%), and a physical store (22%). Less than 15% of importers use a
distributor’s webstore, mail ordering, faxing and other services.
● Allied trade distributors use their own webstore (29%), distributor’s web stores (29%), social media (36%), mobile apps
(29%), B2B marketplace (43%), call centers (50%), physical store (21%), mail ordering (21%), and faxing (29%). Less than
15% of distributors use email marketing with buy buttons and other services as part of their omnichannel strategy.
● Manufacturers use social media (25%) and call centers (38%) as part of their omnichannel strategy. Less than 15% of
manufacturers use their own webstore, distributors’ web stores, faxing, and other services as part of their omnichannel
strategy.
Ninety-four percent of brick and mortar florists accept online ordering. One hundred percent of online florists and wire services accept
online orders. Sixty-eight percent of supermarkets accept online orders. Seventy-three percent of domestic growers accept online
orders while 45% of international growers do. Eighty-six percent of importers accept online orders and 78% of distributors accept
online orders. Only 33% of manufacturers accept online orders.
When assessing what is the challenge of implementing e-commerce into the floral industry, over half of the responses were of low
customer awareness (36%) and 23% indicated that other factors than presented in the survey were of challenges. Firms also felt that
slow internet penetration (19%) and lack of trust (15%) had effects. Seven percent of firms felt that security concerns were a
challenge.

10
Unsurprisingly, based on the number of services provided and challenges faced by firms, 63% of firms do not use their data from e-
commerce to support or help guide key business decisions. Brick and mortar and online florists and manufacturers are split 50/50 on if
they use their online data. Wholesale florists do not use their online data. This would be important for them to consider, especially
when many consider themselves to be in decline or unable to identify their customers well. Domestic growers are slightly more likely
to not use their online data (58%), and this is exaggerated more with international growers (88%) and importers (63%). Distributors do
not use their online data (100%).
Most firms indicated that they somewhat agreed that B2B e-commerce “is critical to developing a competitive advantage”. Firms felt
neutral regarding their company “wishes to be considered a leader in digital selling within our market/industry” and “accelerating B2B
e-commerce is a strategic priority for our company”. Firms disagree that they were “selling digitally faster than our competitors” and
disagree that “B2B is a threat to our sales organization”. Overall, firms seem optimistic that B2B e-commerce could assist in their
business model but do not feel confident where they stand versus their competitors in implementation. It is a positive note to see that
firms do not see online selling as competition with their sales force.
Overall, most firms that responded to the survey are not providing very many B2B e-commerce services or tools as sellers, yet as
buyers, they are interested in vendors providing the services for them. Overall, firms do not see B2B e-commerce as a deterrent to the
growth of their business, but an opportunity for their business to expand, earn additional revenue, and reach a new audience. This has
in turn expanded the omnichannel approach in the floral supply chain. Previously, being omnichannel was viewed cautiously, but
based on the attitudes and opinions expressed in the survey, firms are not as opposed to being omnichannel as previously thought.
There seem to be real barriers that prevent firms from implementing more B2B e-commerce. Firms in the future may have to invest
extensively in technologies to “catch up” with their customer base and stay relevant in the industry. In order to remain relevant and to
build a better relationship between partners, businesses will need to demonstrate reassurances within their supply chains.
In the face of COVID, it is even more apparent that firms should have an online presence in that it provides a safe way to interact with
online-savvy customers. Economists predict that customer demands will rebound slowly, and customer habits set today are likely to
outlast the immediate crisis. For example, Chinese shoppers have continued to rely on e-commerce long after the crisis subsided.
Similarly, B2B e-commerce companies in the manufacturing, distribution and warehousing sectors that reacted quickly experienced
growth, not contraction. While physical stores are reopening, retailers should plan for a change from pre-crisis levels of foot traffic.
B2B sales opportunities and activities changed, too. Digital technology has had a tremendous impact on sales. While leaders accept
the need for a move to increased use of digital technologies, it’s not as simple as just “moving to digital.” The sharp increase in the use
of digital and self-service technologies, including in the face of COVID-19, means that firms need to be thoughtful not only about how
to enable effective digital interactions but also about how to most effectively deploy their sales personnel. In an environment where

11
behaviors and attitudes have swiftly altered, and will likely continue to do so, firms need a clear outlook of what their customers need
and what steps their company can take to address those needs.

12
Introduction
Much has been written regarding the structural changes occuring in the floral industry including trade magazine articles, market
research reports, industry white papers, and academic journal articles. The WF&FSA, in conjunction with eight other floral
associations, commissioned and funded this study to compile relevant secondary research and/or data in order to benchmark industry
trends, determine gaps in the available information that can be further researched and analyzed, and to make the findings widely
accessible to the industry.
The research methodology used to conduct this study was unique and quite different from other research projects in that the research
team interacted with the funding entities throughout the entire project to ensure the research was applicable to the questions of interest
and met the diverse expectations of the funding organizations. The research was conducted in a stepwise fashion, with the findings of
each step determining the research plan for the next step in the process. Step 1, which included compiling and cataloging existing
floral industry research and/or secondary data, involved the following procedures:
● Creating a definitive data set of what information currently exists, including the timeframe when data was produced (to
determine if they are still relevant and applicable).
● Categorizing and summarizing the existing data/reports based on industry segments including wholesale florists, retail florists,
mass market, online, consumers, etc.
● Cataloging and benchmarking existing floral industry reports so future research studies can determine trends.
● Identifying and summarizing data gaps that need to be researched in order to complete the perspective of the entire floral
supply chain.
The research team examined the entire floral supply chain in the U.S. starting with the domestic and international grower sector,
shippers/importers, wholesale florists and other wholesale service-providing firms (e.g. bouquet manufacturers, wire services), florists
(event, studio, and brick-and-mortar), e-commerce firms, and end consumers. By using this sectoral approach, we were able to
determine the changes in industry structure, how firms conduct themselves in the marketplace, and the operational and financial
performance of firms in the floral industry.
The Structure-Conduct-Performance (SCP) paradigm of strategic industry-level analyses assumes market structure will determine firm
conduct which then will determine performance. In a typical SCP analysis, market structure establishes the overall environment (or
playing field) within which each firm operates. Essential market structure characteristics include the number and size distribution of

13
the sellers and buyers, the type of product offered for sale, barriers to entry, and whether any asymmetry of information exists between
buyers and sellers.
Market structure often differs across industries because of variations in basic conditions, including the underlying technological base,
the regulatory and legal environment, demand conditions, and the relative importance of economies of scale. All of these basic
conditions tend to affect the number and size distribution of firms observed in an industry. Market conduct, the second element, shows
up in the firm-level value chain activities such as production, pricing, marketing, promotion, and research and development. Whether
a firm decides its strategic intent independently or in conjunction with other firms in the market has a crucial impact on the conduct of
the industry. The third element, market performance, is reflected in the degree of production efficiencies, technological progress, and
other factors affecting revenue volatility.
Once the research team collected, cataloged, categorized, summarized, and benchmarked existing data and reports, gaps in existing
information were identified. In other words, in order to have a more complete picture of the SCP issues occuring in the floral industry,
what additional information would be needed? What additional research could be conducted to fill the gaps and/or data needs?
After reviewing the report from Step 1, WF&FSA and the funding partners then provided input regarding the proposed gap-filling
research projects and which ones to initiate first. Of the 10 proposed projects, the one that the funding partners wanted to begin
analyzing first was the status of current (and planned) usage of B2B (business-to-business) technologies in the floral industry. This
project was particularly relevant because of the shift towards digital platforms during the COVID-19 pandemic.
Definition of Business-to-Business (B2B) E-commerce
B2B e-commerce stands for business-to-business electronic commerce and refers to online transactions between businesses involving
electronic tools or technologies (e.g. e-commerce websites, web-procurement software, vertical market networks, online marketplaces,
etc.). An example of a B2B transaction is when a manufacturer sells products directly to retail customers using an online webshop, or
even perhaps selling directly to end consumers via an online marketplace.
Another example from outside the floral industry is the automotive industry, a complex supply chain comprised of companies that do
everything from supplying the initial raw materials (metals, glass, rubber, etc.), making and distributing all the components of the car
(from radios to headlamps, computer systems and more), manufacturing of the cars, and finally distribution of the cars through
dealerships. The automobile supply chain includes hundreds of businesses that are linked together through thousands of B2B
relationships to produce a single car that will then be sold to the end consumer. This same complexity is also indicative of the floral
industry today, but little is known about the extent of the industry’s usage of B2B e-commerce tools and technologies and this study
seeks to fill that gap by documenting the e-commerce applications currently being utilized and those planned for future adoption.

14
This study was initiated in early summer 2020. A questionnaire was developed according to findings in the literature during Step 1 and
approved by each of the funding entities, who then emailed their entire membership using their respective membership lists. This
ensured representation by companies participating in each sector in the floral industry supply chain.
Characteristics of the respondents
The survey was anonymous because we did not want to influence individuals' answers if they felt like they could be identified by the
response they gave to any particular question. Ten types of floral industry businesses were surveyed include brick and mortar (B&M)
florists, online florists, supermarket floral departments, wholesale florists, wire services, domestic growers, international growers,
importing firms, and allied trade manufacturers and distributors. For each type of firm, we collected data regarding their type of
business, geographical sales coverage, number of locations, number of years in business, and number of employees.
Table Q2.1. Number and percentage of respondents by firm type.
Types of Businesses Number of Respondents Percentage of Respondents
B&M Florist 135 44.1
Online Florist 16 5.2
Supermarket 5 1.6
Wholesale florists 59 19.3
Wire Services 3 1.0
Domestic Grower 35 11.4
International Grower 13 4.3
Importer 18 5.9
Distributor 14 4.6
Manufacturer 8 2.6

15
Total 306 100
The “number of respondents” column above reflects the number who indicated that the majority of their business is derived from
sales made in that particular floral sector. It should be noted that there were many firms whose sales were derived from two or more
floral sector categories. As anticipated, a large portion (44%) of the respondents were from the retail sector including brick and mortar
(B&M) florists and online florists. Least represented firms were from the distribution and manufacturing sectors, which intuitively
makes sense since we know from the make-up of the industry that there are far fewer manufacturers and distributors than retail outlets.
Throughout the report, we cross-tabulated the findings from each of the sectors (by the characteristics mentioned earlier) in order to
gain a clearer perspective of how B2B e-commerce is being utilized across the floral industry by various types of floral firms.
Figure Q3.1. E-commerce revenue expectations 5 years from now.

16
To gain insight as to the future e-commerce revenue expectations of respondents, the first question we asked was what extent of their
future revenue did they expect would come from e-commerce applications in five years. As seen in Figure Q3.1, most businesses
believe that e-commerce will be incorporated to some degree. The majority of respondents, 31%, believe that 1-20% of their revenue
will come from e-commerce in the future. Approximately 50% of respondents believe e-commerce will account for 21-80% of their
revenue in 5 years. On the extremes, 8% believe that none at all will account for their revenue and 4% believe that all or nearly all of
their revenue will come from e-commerce.
When broken down by business type, B&M florists were spread almost evenly across the 6 levels. Online florists were more bipolar in
their responses, with 33% indicating that e-commerce would account for none of their revenue in five years and 67% said all of their
revenue would come from e-commerce. wholesale florists were quite mixed in their expectations, with 27% indicating none of their
revenue would come from e-commerce, 46% said 1-20%, and only 18% said 41-60% in 5 years. They obviously are not very
optimistic about using online technologies, even with the recent growth of event and studio florists who may prefer to conduct
business online. Domestic growers are more optimistic, with 20% indicating that 61-100% of their revenue will come from e-
commerce. International growers indicate more moderate levels of revenue ranging from 21-60%. Distributors and manufacturers
expect less than 20% of their sales will be conducted via e-commerce.

17
Figure Q4.1. Number of locations of survey respondents.
Interestingly 16% of the respondents have no official business location and another 61% only have one location. Slightly less than a
quarter of the respondents (23%) indicated that they operate 2 or more locations.
Figure Q6.1. How many people does your company employ?
About 63% of the respondents employ fewer than 25 people, with another 25% hiring 26 to 200 employees, and 13% employ over 200
employees.

18
Figure Q7.1. Number of years in business by survey respondents.
The majority (60%) of the respondents have been in business for more than 20 years. Only 3% have been in business a year or less and
7% have either been in business 2-5 years or 6-10 years. Will people who have only been in business a few years immerse themselves
more into e-commerce or is this more evident in firms with more experience?
Table Q7.1. E-commerce revenue expectations 5 years from now by years in business.
Coefficient
GLM z-score
p-value
How much of your revenue 5 years from now do you
expect to be derived from e-commerce? -0.2526
-3.14
0.002
A generalized linear model shows the relationship between two questions. In the context of identifying a relationship between the
years in business and the e-commerce revenue expectation in 5 years, a negative relationship exists. This means that the younger the
business is, the more revenue is projected by the firm to be derived from e-commerce activities.

19
Figure Q23.1. What does your geographic coverage look like?
Responding firms tend to either function on a local level or on a larger geographic scale. Forty percent of firms sell locally while 35%
sell domestically (nationally). Some firms, 19%, sell internationally. A much smaller percentage of firms sell state-wide (2%) or
regionally (4%).

20
Figure Q23.2. Geographic coverage by type of business
Again, among the types of establishments who answered the survey, B&M Florists are most focused on local markets. Interestingly,
we expected more firms to have a regional and/or state-wide presence, especially among growers, wholesale florists, distributors, and
manufacturers. Slightly over half of the responding firms had either domestic (national) or international coverage.

21
Figure Q24.1. How many full-time employees does your company have that are dedicated solely to e-commerce?
When looking specifically at employees who participate in e-commerce responsibilities only, the graph is skewed to the left. Nearly
two-thirds of responding firms have only part-time employees doing e-commerce activities. Thirty percent have 1-to-5 employees
working in this area and approximately 2% have 6-10 e-commerce employees. Less than one percent have either 11-20 or more than
20 e-commerce-specific employees.
Table Q24.1. How many full-time employees does your company have that are dedicated solely to e-commerce by firm type?
Types of Businesses
Number of
Employees B&M Florist Online Florist
Wholesale
florists
Domestic
Grower Intl. Grower Importer Distributor Manufacturer

22
Column %
Only Part Time 82.4 66.7 70.0 84.2 87.5 62.5 100.0 100.0
1-5 17.6 33.3 30.0 15.8 12.5 37.5 0.0 0.0
Since many businesses predict their revenue via e-commerce to increase in five years, we would expect that over time the number of
employees who are responsible for e-commerce activities will increase. Currently, however, online florists, wholesale florists, and
importers are leading the way in B2B adoption.
B2B Adoption
We assessed the overall B2B service/technology utilization by the responding firms based on whether they were acting in the role of
seller, buyer, or neither (Table 2) and then broke the services down by business sector. This provides a snapshot of current B2B
service or technology usage among the different types of floral firms in the industry.
23
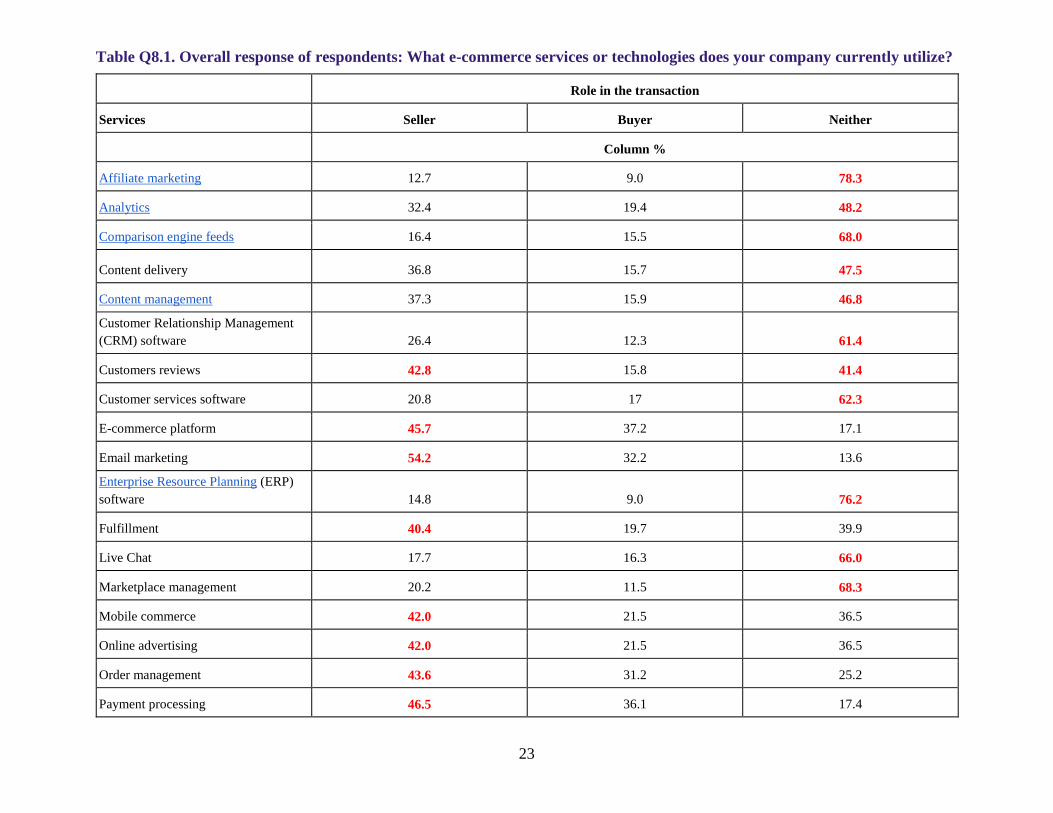
Table Q8.1. Overall response of respondents: What e-commerce services or technologies does your company currently utilize?
Role in the transaction
Services Seller Buyer Neither
Column %
Affiliate marketing 12.7 9.0 78.3
Analytics 32.4 19.4 48.2
Comparison engine feeds 16.4 15.5 68.0
Content delivery 36.8 15.7 47.5
Content management 37.3 15.9 46.8
Customer Relationship Management
(CRM) software 26.4 12.3 61.4
Customers reviews 42.8 15.8 41.4
Customer services software 20.8 17 62.3
E-commerce platform 45.7 37.2 17.1
Email marketing 54.2 32.2 13.6
Enterprise Resource Planning (ERP)
software 14.8 9.0 76.2
Fulfillment 40.4 19.7 39.9
Live Chat 17.7 16.3 66.0
Marketplace management 20.2 11.5 68.3
Mobile commerce 42.0 21.5 36.5
Online advertising 42.0 21.5 36.5
Order management 43.6 31.2 25.2
Payment processing 46.5 36.1 17.4

24
Payment security 41.9 31.1 27.0
Personalization 34.0 16.7 49.3
Rich media 32.2 16.1 51.7
Search engine marketing 37.9 19.6 42.5
Security certification 34.6 21.6 43.8
Shipping carrier integration 24.0 23.1 52.9
Site design 46.2 27.6 26.2
Site search 36.5 27.5 36.0
Social media marketing 57.1 26.1 16.8
Web analytics 44.6 21.1 34.3
Web hosting 37.4 29.2 33.3
Web performance management 31.6 21.1 47.4
Website testing/optimization 26.8 19.5 53.7
Other 0.0 2.2 97.8
It appears that there is a relatively low percentage of firms utilizing e-commerce services utilized currently. Only two of the services
or technologies were used by more than half of the respondents either as a seller or as a buyer -- email marketing and social media
marketing. As sellers, most businesses are using analytics, customer reviews, e-commerce platforms, email marketing, fulfillment,
payment processing, site design, and social media marketing when selling a product.
As buyers, no service was overwhelmingly utilized, but e-commerce platforms, email marketing, order management, payment
processing, and payment security were the most utilized of the services used by firms when acting as sellers in the market.
Most businesses, as either sellers or buyers, do not utilize affiliate marketing, comparison engine feeds, customer relationship
management software, customer services software, enterprise resource planning software, live chats on their website, marketplace
management, rich media, shipping carrier integration , and website testing/optimization.

25

26
Table Q8.2. Brick and Mortar Florists: What e-commerce services or technologies does your company currently utilize?
B&M Florist
Seller Buyer Neither
Column %
Affiliate marketing 8.0 9.2 82.8
Analytics 8.0 9.2 82.8
Comparison engine feeds 18.6 19.8 61.6
Content delivery 27.9 20.9 51.2
Content management 28.7 24.1 47.1
Customer Relationship Management
(CRM) software 14.0 12.8 73.3
Customers reviews 40.9 26.1 33.0
Customer services software 17.9 23.8 58.3
E-commerce platform 44.6 44.6 10.9
Email marketing 51.1 40.0 8.9
Enterprise Resource Planning (ERP)
software 5.1 5.1 89.9
Fulfillment 37.3 16.9 45.8
Live Chat 7.3 18.3 74.4
Marketplace management 18.3 13.4 68.3
Mobile commerce 43.2 30.7 26.1
Online advertising 43.2 30.7 26.1
Order management 39.3 38.1 22.6
Payment processing 48.9 42.2 8.9

27
Payment security 44.4 38.9 16.7
Personalization 36.5 25.9 37.6
Rich media 28.7 17.5 53.8
Search engine marketing 43.5 29.4 27.1
Security certification 38.6 30.1 31.3
Shipping carrier integration 14.5 22.9 62.7
Site design 40.7 43.0 16.3
Site search 32.5 38.6 28.9
Social media marketing 51.1 36.4 12.5
Web analytics 39.3 32.1 28.6
Web hosting 31.8 44.3 23.9
Web performance management 28.2 32.9 38.8
Website testing/optimization 20.5 30.1 49.4
Other 0.0 5.2 94.8
For B&M Florists acting as sellers, slightly over half utilize email marketing (51%) and social media marketing (51%). Customer
reviews, e-commerce platforms, mobile commerce, online advertising, payment processing, payment security, search engine
marketing, and site design were also used when B&M florists were acting as sellers, but to a much lesser degree..
As buyers, B&M florists use e-commerce platforms (44.6%), email marketing (40.0%), payment processing (42.2%), site design
(43.0%), and web hosting (44.3%). Even fewer use any other B2B services.
Table Q8.3. Online Florist: What e-commerce services or technologies does your company currently utilize?
Online Florist
Seller Buyer Neither

28
Column %
Affiliate marketing 0.0 20.0 80.0
Analytics 70.0 20.0 10.0
Comparison engine feeds 27.3 27.3 45.5
Content delivery 66.7 11.1 22.2
Content management 70.0 10.0 20.0
Customer Relationship Management
(CRM) software 36.4 18.2 45.5
Customers reviews 81.8 9.1 9.1
Customer services software 55.6 11.1 33.3
E-commerce platform 66.7 33.3 0.0
Email marketing 72.7 18.2 9.1
Enterprise Resource Planning (ERP)
software 10.0 10.0 80.0
Fulfillment 44.4 22.2 33.3
Live Chat 10.0 20.0 70.0
Marketplace management 55.6 11.1 33.3
Mobile commerce 60.0 20.0 20.0
Online advertising 60.0 20.0 20.0
Order management 60.0 40.0 0.0
Payment processing 63.6 36.4 0.0
Payment security 81.8 18.2 0.0
Personalization 70.0 20.0 10.0
Rich media 44.4 11.1 44.4
Search engine marketing 63.6 18.2 18.2

29
Security certification 45.5 27.3 27.3
Shipping carrier integration 10.0 30.0 60.0
Site design 60.0 20.0 20.0
Site search 50.0 20.0 30.0
Social media marketing 63.6 27.3 9.1
Web analytics 63.6 27.3 9.1
Web hosting 54.5 27.3 18.2
Web performance management 63.6 18.2 18.2
Website testing/optimization 50.0 20.0 30.0
Other 0.0 0.0 100.0
Online florists utilize many of the services as sellers including analytics, content delivery, content management, customer reviews,
customer service software, e-commerce platform, email marketing, marketplace management, mobile commerce, online advertising,
order management, payment processing, payment security, personalization, search engine marketing, site design, site search, social
media marketing, web analytics, web hosting, web performance management, and website testing/optimization. Because their
interaction with their customers is almost exclusively online, the frequency of use and the sophistication of technologies used would
naturally be higher than other business types. When acting as buyers, fewer tools are being utilized by online florists. This could be
because the services are not currently available to them.
Table Q8.4. Supermarkets: What e-commerce services or technologies does your company currently utilize?
Supermarket
Seller Buyer Neither
Column %
Affiliate marketing 0.0 50.0 50.0
Analytics 0.0 0.0 100.0
Comparison engine feeds 0.0 0.0 100.0

30
Content delivery 33.3 0.0 66.7
Content management 0.0 0.0 100.0
Customer Relationship Management
(CRM) software 33.3 33.3 33.3
Customers reviews 0.0 0.0 100.0
Customer services software 0.0 0.0 100.0
E-commerce platform 33.3 33.3 33.3
Email marketing 50.0 25.0 25.0
Enterprise Resource Planning (ERP)
software 50.0 25.0 25.0
Fulfillment 66.7 0.0 33.3
Live Chat 0.0 0.0 100.0
Marketplace management 0.0 50.0 50.0
Mobile commerce 50.0 0.0 50.0
Online advertising 50.0 0.0 50.0
Order management 75.0 25.0 0.0
Payment processing 75.0 25.0 0.0
Payment security 50.0 50.0 0.0
Personalization 50.0 0.0 50.0
Rich media 0.0 0.0 100.0
Search engine marketing 33.3 0.0 66.7
Security certification 50.0 0.0 50.0
Shipping carrier integration 33.3 0.0 66.7
Site design 50.0 25.0 25.0
31
Site search 0.0 50.0 50.0
Social media marketing 75.0 0.0 25.0
Web analytics 33.3 0.0 66.7
Web hosting 33.3 33.3 33.3
Web performance management 0.0 0.0 100.0
Website testing/optimization 0.0 0.0 100.0
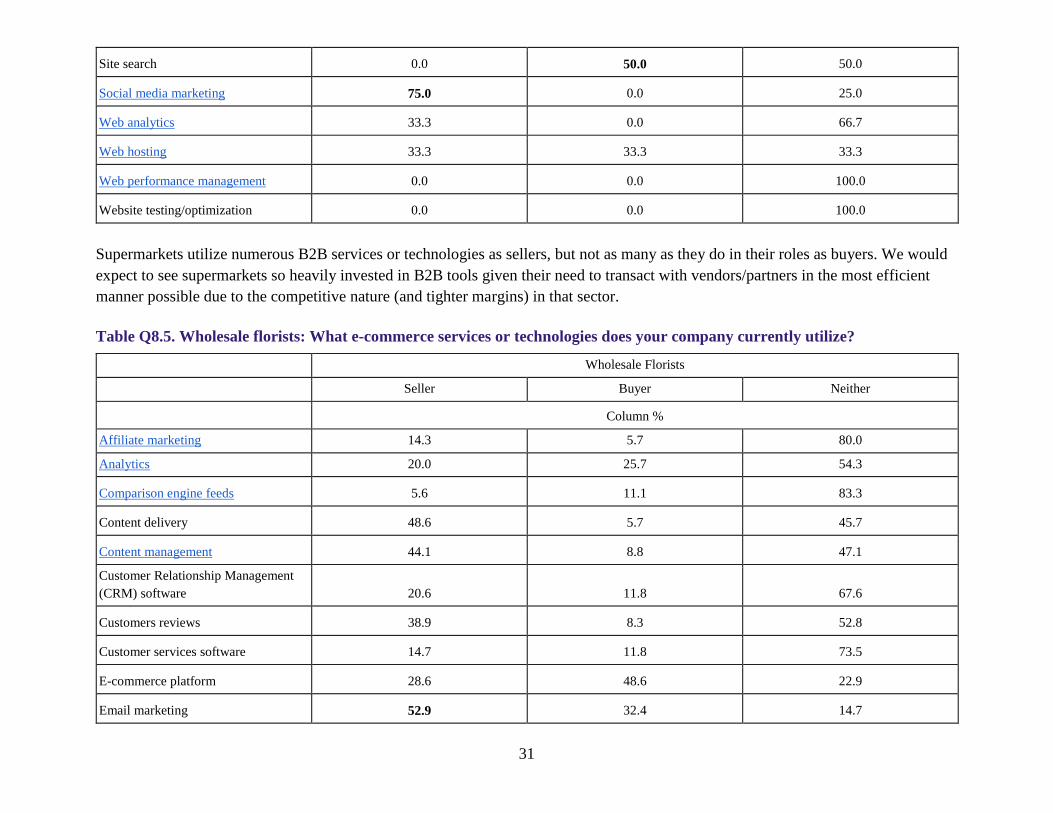
Supermarkets utilize numerous B2B services or technologies as sellers, but not as many as they do in their roles as buyers. We would
expect to see supermarkets so heavily invested in B2B tools given their need to transact with vendors/partners in the most efficient
manner possible due to the competitive nature (and tighter margins) in that sector.
Table Q8.5. Wholesale florists: What e-commerce services or technologies does your company currently utilize?
Wholesale Florists
Seller Buyer Neither
Column %
Affiliate marketing 14.3 5.7 80.0
Analytics 20.0 25.7 54.3
Comparison engine feeds 5.6 11.1 83.3
Content delivery 48.6 5.7 45.7
Content management 44.1 8.8 47.1
Customer Relationship Management
(CRM) software 20.6 11.8 67.6
Customers reviews 38.9 8.3 52.8
Customer services software 14.7 11.8 73.5
E-commerce platform 28.6 48.6 22.9
Email marketing 52.9 32.4 14.7

32
Enterprise Resource Planning (ERP)
software 20.6 14.7 64.7
Fulfillment 25.7 40.0 34.3
Live Chat 18.2 24.2 57.6
Marketplace management 9.4 15.6 75.0
Mobile commerce 30.3 21.2 48.5
Online advertising 30.3 21.2 48.5
Order management 33.3 39.4 27.3
Payment processing 32.4 38.2 29.4
Payment security 27.3 33.3 39.4
Personalization 20.7 10.3 69.0
Rich media 30.3 12.1 57.6
Search engine marketing 25.0 3.1 71.9
Security certification 38.7 6.5 54.8
Shipping carrier integration 28.1 37.5 34.4
Site design 43.8 9.4 46.9
Site search 31.2 18.8 50.0
Social media marketing 75.0 18.8 6.2
Web analytics 54.8 0.0 45.2
Web hosting 38.7 9.7 51.6
Web performance management 38.7 6.5 54.8
Website testing/optimization 32.3 6.5 61.3
Other 0.0 0.0 100.0

33
Most wholesale florists, when acting as sellers, utilize email marketing, web analytics, and social media marketing. Some wholesale
florists (40-50%) utilize content delivery, content management, and site design.
As buyers, some wholesale florists use ecommerce platforms (48%) while a smaller percentage of wholesale florists (25-39%) utilize
analytics, email marketing, fulfillment, order management, payment processing, payment security, and shipping carrier integration .
Most wholesale florists that took the survey do not utilize affiliate marketing, analytics, comparison engine feeds, customer
relationship management software, customer reviews, customer service software, enterprise resource planning software, live chat,
marketplace management, mobile commerce, online advertising, personalization, rich media, search engine marketing, security
certification, site search, web hosting, web performance management, and website testing/optimization. Given the structural changes
in the supply chain that were discussed in the main report, in addition to those being promulgated by COVID-19, it will be imperative
for wholesale florists to pivot and provide more of these B2B resources to potentially stay relevant with their customer base in the
future.
Table Q8.6. Wire Services: What e-commerce services or technologies does your company currently utilize?
Wire Services
Seller Buyer Neither
Column %
Affiliate marketing 0.0 100.0 0.0
Analytics 0.0 100.0 0.0
Comparison engine feeds 0.0 100.0 0.0
Content delivery 0.0 100.0 0.0
Content management 0.0 100.0 0.0
Customer Relationship Management
(CRM) software 0.0 0.0 100.0
Customers reviews 0.0 100.0 0.0
Customer services software 0.0 100.0 0.0
E-commerce platform 0.0 100.0 0.0

34
Email marketing 0.0 100.0 0.0
Enterprise Resource Planning (ERP)
software 0.0 0.0 100.0
Fulfillment 0.0 100.0 0.0
Live Chat 0.0 0.0 100.0
Marketplace management 0.0 100.0 0.0
Mobile commerce 0.0 0.0 100.0
Online advertising 0.0 0.0 100.0
Order management 0.0 100.0 0.0
Payment processing 0.0 100.0 0.0
Payment security 0.0 100.0 0.0
Personalization 0.0 0.0 100.0
Rich media 0.0 0.0 100.0
Search engine marketing 0.0 50.0 50.0
Security certification 0.0 50.0 50.0
Shipping carrier integration 0.0 0.0 100.0
Site design 0.0 100.0 0.0
Site search 0.0 100.0 0.0
Social media marketing 0.0 100.0 0.0
Web analytics 0.0 100.0 0.0
Web hosting 0.0 100.0 0.0
Web performance management 0.0 100.0 0.0
Website testing/optimization 0.0 0.0 100.0

35
As sellers, wire services do not utilize any of the e-commerce services listed in the survey. However, as buyers, they use nearly all of
the services, except for customer relationship management software, enterprise resource planning software, live chat, mobile
commerce, online advertising, personalization, rich media, shipping carrier integration , and website testing/optimization.
Table Q8.7. Domestic Growers: What e-commerce services or technologies does your company currently utilize?
Domestic Grower
Seller Buyer Neither
Column %
Affiliate marketing 9.5 4.8 85.7
Analytics 42.9 0.0 57.1
Comparison engine feeds 25.0 0.0 75.0
Content delivery 38.1 9.5 52.4
Content management 40.0 5.0 55.0
Customer Relationship Management
(CRM) software 47.6 0.0 52.4
Customers reviews 45.0 5.0 50.0
Customer services software 20.0 0.0 80.0
E-commerce platform 50.0 16.7 33.3
Email marketing 65.2 21.7 13.0
Enterprise Resource Planning (ERP)
software 10.0 5.0 85.0
Fulfillment 50.0 9.1 40.9
Live Chat 15.0 5.0 80.0
Marketplace management 23.8 4.8 71.4
Mobile commerce 28.6 9.5 61.9
Online advertising 28.6 9.5 61.9
Order management 50.0 15.0 35.0

36
Payment processing 47.8 21.7 30.4
Payment security 50.0 15.0 35.0
Personalization 41.2 0.0 58.8
Rich media 38.9 11.1 50.0
Search engine marketing 35.0 5.0 60.0
Security certification 27.8 11.1 61.1
Shipping carrier integration 47.4 15.8 36.8
Site design 61.9 4.8 33.3
Site search 52.6 10.5 36.8
Social media marketing 71.4 0.0 28.6
Web analytics 65.0 5.0 30.0
Web hosting 52.6 5.3 42.1
Web performance management 36.8 0.0 63.2
Website testing/optimization 33.0 0.0 66.7
Other 0.0 0.0 100.0
Domestic growers are more diverse in their e-commerce service utilization than other types of respondents. Most domestic growers, as
sellers, utilize email marketing, an e-commerce platform, fulfillment, order management, site design, site search, social media
marketing, web analytics, and web hosting. Some domestic growers (40-50%) utilize analytics, customer relationship management
software, customers reviews, payment processing, personalization, and shipping carrier integration.
As buyers they use minimal services. Most domestic growers, as neither buyers or sellers, do not use affiliate marketing, analytics,
comparison engine feeds, content delivery, customer relationship management software, customers reviews, customer services
software, enterprise resource planning software, live chat, marketplace management, mobile commerce, online advertising,
personalization, rich media, search engine marketing, security certification, web performance management, and website
testing/optimization.
37
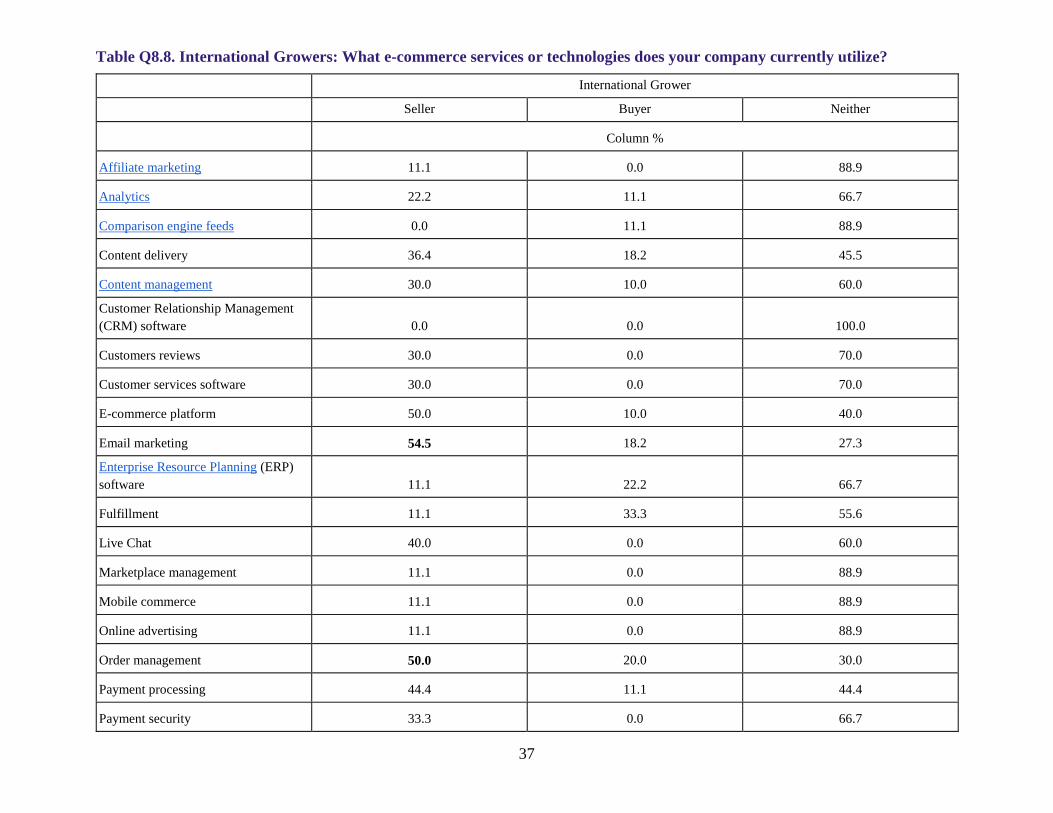
Table Q8.8. International Growers: What e-commerce services or technologies does your company currently utilize?
International Grower
Seller Buyer Neither
Column %
Affiliate marketing 11.1 0.0 88.9
Analytics 22.2 11.1 66.7
Comparison engine feeds 0.0 11.1 88.9
Content delivery 36.4 18.2 45.5
Content management 30.0 10.0 60.0
Customer Relationship Management
(CRM) software 0.0 0.0 100.0
Customers reviews 30.0 0.0 70.0
Customer services software 30.0 0.0 70.0
E-commerce platform 50.0 10.0 40.0
Email marketing 54.5 18.2 27.3
Enterprise Resource Planning (ERP)
software 11.1 22.2 66.7
Fulfillment 11.1 33.3 55.6
Live Chat 40.0 0.0 60.0
Marketplace management 11.1 0.0 88.9
Mobile commerce 11.1 0.0 88.9
Online advertising 11.1 0.0 88.9
Order management 50.0 20.0 30.0
Payment processing 44.4 11.1 44.4
Payment security 33.3 0.0 66.7

38
Personalization 12.5 0.0 87.5
Rich media 33.3 0.0 66.7
Search engine marketing 0.0 12.5 87.5
Security certification 0.0 0.0 100.0
Shipping carrier integration 0.0 0.0 100.0
Site design 45.5 18.2 36.4
Site search 44.4 0.0 55.6
Social media marketing 50.0 20.0 30.0
Web analytics 11.1 11.1 77.8
Web hosting 30.0 10.0 60.0
Web performance management 0.0 11.1 88.9
Website testing/optimization 0.0 11.1 88.9
Other 0.0 0.0 100.0
Over half of the international grower respondents, when acting as sellers, utilize e-commerce platforms, email marketing, order
management, and social media marketing. Some use live chat, payment processing, site design, and site search. As buyers, there’s not
a significant number of growers that use any of the services that are listed in the survey. A few, (approximately 30%) use fulfillment.
A great majority of international growers do not, as either seller or buyer, utilize most of the services listed in the survey.
Table Q8.9. Importers: What e-commerce services or technologies does your company currently utilize?
Importers
Seller Buyer Neither
Column %
Affiliate marketing 27.3 0.0 72.7
Analytics 30.8 23.1 46.2
Comparison engine feeds 20.0 10.0 70.0

39
Content delivery 40.0 10.0 50.0
Content management 45.5 9.1 45.5
Customer Relationship Management
(CRM) software 25.0 33.3 41.7
Customers reviews 36.4 18.2 45.5
Customer services software 9.1 36.4 54.5
E-commerce platform 64.3 21.4 14.3
Email marketing 70.6 17.6 11.8
Enterprise Resource Planning (ERP)
software 30.0 10.0 60.0
Fulfillment 53.8 23.1 23.1
Live Chat 38.5 23.1 38.5
Marketplace management 27.3 9.1 63.6
Mobile commerce 46.2 15.4 38.5
Online advertising 46.2 15.4 38.5
Order management 50.0 35.7 14.3
Payment processing 38.5 38.5 23.1
Payment security 25.0 41.7 33.3
Personalization 27.3 18.2 54.5
Rich media 18.2 27.3 54.5
Search engine marketing 36.4 18.2 45.5
Security certification 33.3 25.0 41.7
Shipping carrier integration 30.0 30.0 40.0
Site design 45.5 18.2 36.4

40
Site search 33.3 16.7 50.0
Social media marketing 71.4 14.3 14.3
Web analytics 45.5 9.1 45.5
Web hosting 53.8 23.1 23.1
Web performance management 20.0 20.0 60.0
Website testing/optimization 20.0 20.0 60.0
Other 0.0 0.0 100.0
As Sellers, importers utilize e-commerce platforms, email marketing, fulfillment, order management, social media marketing, and web
hosting. Some importers (40-50%) utilize content delivery, content management, mobile commerce, online advertising, site design,
and web analytics.
As buyers, a minority of importers (30-49%) utilize customer relationship management software, customer services software, order
management, payment processing, payment security, and shipping carrier integration logistics.
Most do not utilize affiliate marketing, comparison engine feeds, content delivery, customer services software, enterprise resource
planning software, marketplace management, personalization, rich media, site search, web performance management, and website
testing/optimization.
Table Q8.10. Allied Trade Distributors: What e-commerce services or technologies does your company currently utilize?
Distributor
Seller Buyer Neither
Column %
Affiliate marketing 20.0 10.0 70.0
Analytics 30.0 10.0 60.0
Comparison engine feeds 20.0 0.0 80.0
Content delivery 20.0 10.0 70.0
Content management 30.0 10.0 60.0

41
Customer Relationship Management
(CRM) software 50.0 0.0 50.0
Customers reviews 33.3 0.0 66.7
Customer services software 10.0 10.0 80.0
E-commerce platform 40.0 30.0 30.0
Email marketing 50.0 20.0 30.0
Enterprise Resource Planning (ERP)
software 40.0 10.0 50.0
Fulfillment 40.0 10.0 50.0
Live Chat 0.0 30.0 70.0
Marketplace management 0.0 40.0 60.0
Mobile commerce 50.0 10.0 40.0
Online advertising 50.0 10.0 40.0
Order management 30.0 20.0 50.0
Payment processing 40.0 20.0 40.0
Payment security 30.0 10.0 60.0
Personalization 20.0 10.0 70.0
Rich media 40.0 10.0 50.0
Search engine marketing 30.0 10.0 60.0
Security certification 30.0 10.0 60.0
Shipping carrier integration 50.0 20.0 30.0
Site design 30.0 10.0 60.0
Site search 30.0 10.0 60.0
Social media marketing 40.0 10.0 50.0

42
Web analytics 30.0 20.0 50.0
Web hosting 20.0 10.0 70.0
Web performance management 30.0 10.0 60.0
Website testing/optimization 20.0 20.0 60.0
Other 0.0 0.0 100.0
Most allied trade distributors as sellers utilize customer relationship management software, email marketing, mobile commerce, online
advertising, and shipping carrier integration management. Some (40-50%) utilize e-commerce platforms, enterprise resource planning
software, fulfillment, payment processing, rich media, and social media marketing.
As buyers, some allied trade distributors utilize marketplace management (40%) and e-commerce platforms (30%), but only a small
percentage of the other B2B services/technologies.
The majority of distributors, as either buyers or sellers, do not utilize affiliate marketing, analytics, comparison engine feeds, content
delivery, content management, customer relationship management software, customers’ reviews, customer service software, enterprise
resource planning software, fulfillment, live chat, marketplace management, order management, payment security, personalization,
rich media, search engine marketing, security certification, site design, site search, social media marketing, web analytics, web
hosting, web performance management, or website testing/optimization.
Table Q8.11. Manufacturers: What e-commerce services or technologies does your company currently utilize?
Manufacturer
Seller Buyer Neither
Column %
Affiliate marketing 0.0 25.0 75.0
Analytics 75.0 0.0 25.0
Comparison engine feeds 50.0 0.0 50.0
Content delivery 75.0 0.0 25.0
Content management 50.0 25.0 25.0
Customer Relationship Management 50.0 25.0 25.0

43
(CRM) software
Customers reviews 0.0 0.0 100.0
Customer services software 25.0 0.0 75.0
E-commerce platform 75.0 0.0 25.0
Email marketing 50.0 0.0 50.0
Enterprise Resource Planning (ERP)
software 50.0 0.0 50.0
Fulfillment 25.0 0.0 75.0
Live Chat 25.0 0.0 75.0
Marketplace management 0.0 0.0 100.0
Mobile commerce 75.0 0.0 25.0
Online advertising 75.0 0.0 25.0
Order management 50.0 0.0 50.0
Payment processing 50.0 50.0 0.0
Payment security 50.0 50.0 0.0
Personalization 0.0 0.0 100.0
Rich media 75.0 0.0 25.0
Search engine marketing 75.0 0.0 25.0
Security certification 50.0 0.0 50.0
Shipping carrier integration 75.0 25.0 0.0
Site design 75.0 25.0 0.0
Site search 75.0 25.0 0.0
Social media marketing 75.0 25.0 0.0
Web analytics 75.0 25.0 0.0
Web hosting 50.0 25.0 25.0
Web performance management 50.0 25.0 25.0

44
Website testing/optimization 50.0 25.0 25.0
Other 0.0 0.0 100.0
Most manufacturers as sellers use analytics, comparison content delivery, content management, customer relationship management
software, e-commerce platform, email marketing, enterprise resource planning software, mobile commerce, online advertising, order
management, payment processing, payment security, rich media, search engine marketing, security certification, shipping carrier
integration, site design, site search, social media marketing, web analytics, web hosting, web performance management, website
testing/optimization.
Most manufacturers, as buyers, use mainly payment processing and payment security. Manufacturers do not, as either buyers or
sellers, use affiliate marketing, comparison engine feeds (50%), customers’ reviews, email marketing (50%), enterprise resource
planning software (50%), fulfillment, live chat, marketplace management, order management (50%), personalization, and security
certification (50%).
Interestingly, when cross-tabulating the e-commerce services that are provided by manufacturers, the respondents who have been in
business for a shorter period of time use more e-commerce tools within their business (Table Q8.12). This table only reports the
services that have a significant difference in utilization by years in business. As easily viewed by the rows indicating “Neither” buyers
nor sellers utilize this service, businesses who have been in business longer are less likely to utilize some of the services.
Table Q8.12. Years in business by the type of e-commerce service utilized
Type of Service Years in Business Significance
(Fisher's Exact)
1 year 2-5 years 6-10 year More than 10 years
Number
Content Delivery 0.005
Seller 7 7 10 56
Buyer 3 2 3 27
Neither 2 1 25 78

45
Content Management 0.009
Seller 8 8 10 55
Buyer 2 1 5 26
Neither 2 1 22 78
Customer Relationship Management Software 0.026
Seller 7 5 6 39
Buyer 1 1 5 19
Neither 3 3 26 102
Customer Reviews 0.036
Seller 8 8 17 61
Buyer 2 0 6 25
Neither 2 2 14 74
E-commerce Platform 0.043
Seller 9 6 23 69
Buyer 3 3 10 68
Neither 0 0 8 31
Payment Processing 0.045
Seller 9 8 19 71
Buyer 3 2 16 60
Neither 0 0 4 35

46
Payment Security 0.014
Seller 8 8 20 57
Buyer 3 1 11 52
Neither 1 0 8 50
Personalization 0.000
Seller 9 5 15 39
Buyer 1 1 5 25
Neither 1 1 14 84

47
48

49
Figure Q9.1. Do you currently accept the following payment methods on your website?
Table Q9.1. Overall: Do you currently accept the following payment methods on your website?
Do you accept the following payment methods on your website?
Yes No
Payment Methods Column %
Credit/Debit Card 82.1 17.9
Checks 39.6 60.4
Cash on Delivery 38.7 61.3
Invoicing 41.2 58.9
Direct Bank Transfer 38.8 61.2
Customer Accounts 61.1 38.9
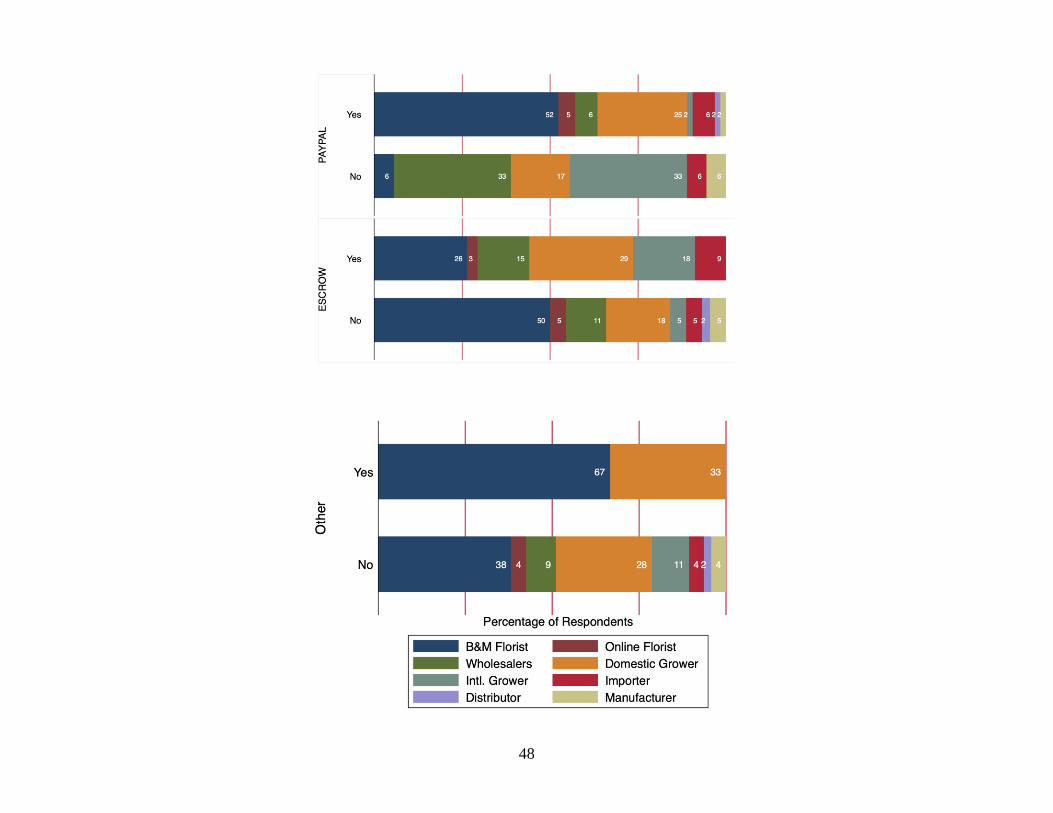
Paypal 33.5 66.5
Escrow 0.9 99.1
Other 10.1 89.9
Other payment methods included other online payment methods including ApplePay, Venmo, Square, GooglePay. Other payment
methods also included check by fax, honeybook, giftcards, and PO. Overall, credit/debit cards and customer accounts are the most
popular methods of payment online. Less popular but available (less than 50%) is checks, cash on delivery, invoicing, direct bank
transfer, and Paypal. Escrow payment systems are not preferred.
Table Q9.2. By firm type: Do you currently accept the following payment methods on your website?
Types of Businesses
B&M Florist Online Florist Supermarket
Wholesale
florists Wire Services
Domestic
Grower Intl. Grower Importer Distributor Manufacturer
Column %

50
Credit/Debit
Yes 95.0 100.0 50.0 65.7 100.0 85.2 40.0 50.0 70.0 50.0
No 5.0 0.0 50.0 34.3 0.0 14.8 60.0 50.0 30.0 50.0
Checks
Yes 31.5 54.5 33.3 45.5 50.0 57.7 70.0 38.5 30.0 25.0
No 68.5 45.5 66.7 54.5 50.0 42.3 30.0 61.5 70.0 75.0
Cash on Delivery
Yes 38.3 45.5 33.3 52.9 100.0 40.0 33.3 30.8 20.0 0.0
No 61.7 54.5 66.7 47.1 0.0 60.0 66.7 69.2 80.0 100.0
E-invoicing
Yes 35.2 54.5 0.0 42.4 0.0 62.5 30.0 50.0 40.0 25.0
No 64.8 45.5 100.0 57.6 100.0 37.5 70.0 50.0 60.0 75.0
Direct Bank Transfer
Yes 25.8 45.5 33.3 48.5 0.0 72.0 80.0 53.3 30.0 25.0
No 74.2 54.5 66.7 51.5 100.0 28.0 20.0 46.7 70.0 75.0
Customer Account
Yes 62.4 54.5 0.0 67.6 100.0 58.3 22.2 57.1 70.0 50.0
No 37.6 45.5 100.0 32.4 0.0 41.7 77.8 42.9 30.0 50.0
Paypal
Yes 36.0 40.0 0.0 23.5 0.0 47.8 50.0 8.3 10.0 25.0
No 64.0 60.0 100.0 76.5 100.0 52.2 50.0 91.7 90.0 75.0
Escrow
Yes 0.0 0.0 0.0 3.1 0.0 4.3 0.0 0.0 0.0 0.0
No 100.0 100.0 100.0 96.9 100.0 95.7 100.0 100.0 100.0 100.0

51
Other
Yes 12.5 0.0 0.0 0.0 0.0 13.3 0.0 14.3 0.0 0.0
No 87.5 100.0 100.0 100.0 100.0 86.7 100.0 85.7 100.0 100.0
For individual business types, brick and mortar florists generally accept credit/debit cards and customer accounts. Most brick and
mortar florists do not offer payment by checks, cash on delivery, e-invoicing, direct bank transfer, and Paypal. No B&M florists
accept Escrow. Online florists generally accept credit/debit cards, checks, e-invoicing, and customer accounts. Most online florists do
not accept cash on delivery, direct bank transfer, and Paypal. Supermarkets generally accept credit/debit cards (Y-50%/N-50%) and
some accept checks, cash on delivery, and direct bank transfer. Most supermarkets do not accept e-invoicing, customer accounts,
Paypal, and Escrow. wholesale florists generally accept credit/debit cards, cash on delivery, and customer accounts. Most wholesale
florists do not accept checks, e-invoicing, direct bank transfer, Paypal, and Escrow.
Wire services accept credit/debit cards, checks (Y-50%/N-50%), and cash on delivery. From our sample of wire services, they do not
accept e-invoicing, direct bank transfers, Paypal, and Escrow. Domestic growers accept quite a few options. They accept credit/debit
cards, checks, e-invoicing, direct bank transfer, and customer accounts. Domestic growers do not accept cash on delivery, Paypal, and
Escrow. International growers accept checks, direct bank transfer, and Paypal (Y-50%/N-50%). They generally do not accept
credit/debit cards, cash on delivery, e-invoicing, and customer accounts. Importers accept credit/debit cards (Y-50%/N-50%), e-
invoicing (Y-50%/N-50%), direct bank transfer, and customer account. They do not accept checks, cash on delivery, Paypal, and
Escrow. Allied trade distributors, like brick and mortar florists, generally accept credit/debit cards and customer accounts. They
generally do not accept checks, cash on delivery, e-invoicing, direct bank transfer, Paypal, and Escrow. Manufacturers accept
credit/debit cards (Y-50%/N-50%) and customer accounts (Y-50%/N-50%). They generally do not accept checks, cash on delivery, e-
invoicing, direct bank transfer, Paypal, and Escrow.

52
Figure Q10.1. Do you offer the following e-commerce services on your website?
Table Q10.1. By firm type: Do you offer the following e-commerce services on your website?
Types of Businesses
Services B&M Florist
Online
Florist Supermarket
Wholesale
florists
Wire
Services
Domestic
Grower Intl. Grower Importer Distributor Manufacturer
Column %
Live chat 4.4 12.5 0.0 6.8 0.0 5.7 23.1 5.6 14.3 0.0

53
Shopping
Cart 63.7 68.8 20.0 35.6 66.7 34.3 23.1 44.4 50.0 25.0
Bulk Pricing 10.4 6.3 20.0 23.7 0.0 28.6 0.0 22.2 21.4 12.5
Automatic
Reordering 9.6 12.5 0.0 0.0 0.0 2.9 7.7 5.6 7.1 0.0
Video 10.4 12.5 0.0 16.9 0.0 5.7 15.4 22.2 21.4 25.0
Intl.
Shopping 15.6 12.5 20.0 15.3 0.0 8.6 23.1 16.7 35.7 25.0
Product
Config/Custo
m tools 8.1 18.8 0.0 3.4 0.0 8.6 0.0 16.7 14.3 0.0
Approval
workflows
customized
by clients 0.0 0.0 0.0 0.0 0.0 2.9 7.7 0.0 7.1 0.0
Approval
Product Lists
Customized
by Client 0.7 0.0 0.0 3.4 0.0 5.7 0.0 11.1 0.0 0.0
Mobile-
optimized site
for B2B
customers 13.3 37.5 0.0 13.6 0.0 20.0 15.4 11.1 35.7 0.0
Native mobile
apps for B2B
customers 2.2 6.3 0.0 3.4 0.0 5.7 0.0 5.6 7.1 0.0
Links to
Social
Networks 48.9 56.3 0.0 39 66.7 34.3 53.8 50.0 28.6 12.5
Customer
Ratings/Revie
ws 50.4 68.8 0.0 10.2 33.3 25.7 0.0 11.1 7.1 0.0

54
Recommende
d Products 40.0 43.8 0.0 20.3 33.3 17.1 15.4 27.8 14.3 25.0
Advanced
Search 25.9 37.5 0.0 22.0 0.0 5.7 0.0 11.1 21.4 12.5
Detailed
Content 28.9 50.0 0.0 15.3 33.3 8.6 0.0 33.3 35.7 37.5
Mult.
Languages 8.1 12.5 20.0 6.8 0.0 5.7 38.5 16.7 7.1 0.0
Mult.
Currencies 2.2 18.8 0.0 3.4 0.0 2.9 0.0 0.0 14.3 0.0
Personalized
Content 12.6 31.3 0.0 6.8 0.0 5.7 0.0 5.6 7.1 0.0
Mult.
Taxation 5.2 18.8 0.0 5.1 0.0 2.9 0.0 5.6 14.3 0.0
Knowledge
base center
for customers 11.9 18.8 0.0 15.3 0.0 2.9 7.7 0.0 21.4 25.0
Digital,
Searchable
Catalog 5.2 37.5 20.0 15.3 0.0 5.7 30.8 11.1 21.4 12.5
Mult.
Delivery
Options 31.9 37.5 0.0 28.8 33.3 22.9 7.7 27.8 28.6 12.5
Other 1.5 0.0 0.0 1.7 0.0 5.7 7.7 5.6 7.1 0.0
Brick and mortar florists offer an online shopping cart (64%), links to social networks (49%), customer ratings/reviews (50%),
recommended products (40%), advanced search (26%), detailed content (29%), and multiple delivery options (32%). A few (under
20%) offer international shopping, product configuration/customized tools, mobile-optimized sites for B2B customers, multiple
languages (8%), personalized content (5%), knowledge base centers for customers (12%), and digital, searchable catalogs (5%).
Online florists offer an online shopping cart (69%), product configuration/customized tools (19%), mobile-optimized site for B2B
customers (38%), links to social networks (56%), customer ratings and reviews (69%), recommended products (44%), advanced

55
searches (38%), detailed content (50%), multiple currencies (19%), personalized content (31%), multiple taxation (19%), knowledge
base center for customers (19%), digital, searchable catalog (38%), and multiple delivery options (39%). Some (under 15%) offer live
chat (13%), bulk pricing (6%), automatic reordering (13%), video (13%), international shopping (13%), native mobile apps for B2B
customers (6%), and multiple languages (13%).
Supermarkets offer shopping carts (20%), bulk pricing (20%), international shipping (20%), multiple languages (20%), and digital,
searchable catalog (20%).
Wholesale florists offer shopping cart (36%), bulk pricing (24%), video (17%), links to social networks (39%), recommended
products (20%), advanced searches (22%), and multiple delivery options (29%). A few (under 15%) offer live chat (7%),
international shopping (15%), product configuration/customized tools (3%), approval product lists customized by clients (3%),
mobile-optimized site for B2B customers (14%), native mobile apps for B2B customers (3%), customer ratings/reviews (10%),
detailed content (15%), multiple languages (7%), multiple currencies (3%), personalized content (7%), multiple taxation (5%),
knowledge base center for customers (15%), digital, and searchable catalog (15%).
Wire services offer an online shopping cart (67%), links to social networks (67%), customer ratings/reviews (33.3%), recommended
products (33.3%), detailed content (33.3%), and multiple delivery options (33.3%).
Domestic growers offer an online shopping cart (34%), bulk pricing (29%), mobile-optimized site for B2B customers (20%), links to
social networks (34%), customer ratings/reviews (26%), recommended products (17%), and multiple delivery options (23%). Some
domestic growers (under 15%) offer live chat (6%), automatic reordering (3%), video (6%), international shopping (9%), product
configuration/customized tools (9%), approval workflows customized by clients (6%), native mobile app for B2B customer (6%),
advanced search (6%), detailed content (9%), multiple languages and currencies (6%, 3%), personalized content (6%), knowledge
base center for customers (3%), digital, searchable catalog (6%), and other services (6%).
International growers offer live chat (23%), an online shopping cart (23%), international shopping (23%), links to social networks
(54%), multiple languages (39%), and digital, searchable catalogs (31%). Some international growers (under 15%) offer automatic
reordering (7%), video (15%), approval workflows customized to B2B customers (7%), mobile-optimized site for B2B customers
(15%), recommended products (15%), knowledge base center for B2B customers (7%), multiple delivery options (7%), and other
services (7%).
Importers offer an online shopping cart (44%), bulk pricing (22%), video (22%), international shopping (17%), links to social
networks (50%), detailed content (33%), multiple languages (17%), and multiple delivery options (28%). Some importers (under 15%)

56
offer live chat (6%), automatic reordering (6%), approval workflows customized by customers (11%), mobile-optimized site for B2B
customers (11%), native mobile apps for B2B customers (6%), customer ratings/reviews (11%), personalized content (6%), multiple
taxation (6%), digital, searchable catalog (11%), and other services (6%).
Allied trade distributors offer an online shopping cart (50%), bulk pricing (21%), video (21%), international shopping (36%), mobile-
optimized apps for B2B customers (36%), links to social networks (29%), advanced search (21%), detailed content (36%), knowledge
base center for customers (21%), digital, searchable catalog (21%), and multiple delivery options (29%). Some distributors offer live
chat (14%), automatic reordering (7%), product configuration/customized tools (14%), approval workflows customized by clients
(7%), native mobile apps for B2B customers (7%), customer ratings/reviews (7%), recommended products (14%), multiple languages
(7%), multiple currencies (14%), multiple taxation (14%), and other services (7%).
Manufacturers offer an online shopping cart (25%), video (25%), international shopping (25%), recommended products (25%),
detailed content (38%), and a knowledge base center for customers (25%). Some manufacturers (under 15%) offer bulk pricing (13%),
links to social networks (13%), advanced search (13%), digital, searchable catalog (13%), and multiple delivery options (13%).

57
Figure Q11.1. What have been the greatest obstacles you have faced in implementing B2B e-commerce?
**Legend for Figure Q11.1. above:
1. Increased competition
2. A challenging marketplace
3. The marketplace is changing too
rapidly
4. Other parts of the business have
required my focus
5. Lack of internal e-commerce skills
or knowledge
6. Ill-defined project rollout
7. Lack of financial resources
8. Lack of senior management support
9. Lack of organizational support
10. Unable to access skills or knowledge
outside of the organization
11. Inflexible e-commerce solution
12. E-commerce software not focused
on B2B needs
13. E-commerce design and adaptation for
our needs was too expensive
14. Ill-defined strategy
15. Inability to integrate e-commerce into
broader IT infrastructure
16. Changing regulatory environment
17. Other
The top two obstacles faced by firms are 4. “other parts of the business have required my focus” and 5. “lack of internal e-commerce
skills or knowledge”. Mid-level obstacles are 2. “A challenging marketplace”, 7. “lack of financial resources”, and 12. “e-commerce
software not focused on B2B needs”. The rest of the obstacles, more low level, include 1. “increased competition”, 3.”the
marketplace is changing too rapidly”, 6.”ill-defined project rollout”, 8.”lack of senior management support”, 9.”lack of organizational
support”, 10.”unable to access skills or knowledge outside of the organization”, 11.”inflexible e-commerce solution”, 13.”e-commerce

58
design and adoption for our needs was too expensive”, 14.”ill-defined strategy”, 15.”inability to integrate e-commerce into broader IT
infrastructure”, 16.”changing regulatory environment”, and 17.”Other”.
Table Q11.1. By firm type: What have been the greatest obstacles you have faced in implementing B2B e-commerce?
Types of Businesses
Levels B&M Florist
Online
Florist Supermarket
Wholesale
florists
Wire
Services
Domestic
Grower Intl. Grower Importer Distributor Manufacturer
Column %
Top obstacles
Other
business
parts require
my focus 11.0 10.0 0.0 6.2 0.0 16.0 0.0 0.0 0.0 0.0
Lack Internal
E-commerce
Skill 13.2 20.0 25.0 15.6 0.0 20.0 18.2 0.0 22.2 0.0
Mid-level obstacles
Challenging
mkt. place 2.2 0.0 0.0 0.0 0.0 0.0 9.1 13.3 0.0 0.0
Lack
financial
resources 8.8 10.0 0.0 9.4 50.0 16.0 0.0 6.7 0.0 25.0
Software not
focused on
B2B 15.4 10.0 0.0 0.0 0.0 4.0 27.3 0.0 0.0 0.0
Low-level obstacles
Competition 2.2 0.0 0.0 3.1 0.0 0.0 0.0 0.0 0.0 0.0
Rapidly
changing
mkt. place 1.1 0.0 0.0 0.0 0.0 0.0 0.0 0.0 0.0 0.0

59
Ill-defined
project 2.2 0.0 0.0 3.1 0.0 0.0 0.0 0.0 0.0. 0.0
Lack of
mgmt.
support 2.2 0.0 0.0 3.1 0.0 0.0 9.1 0.0 0.0 0.0
Lack org.
support 2.2 10.0 0.0 0.0 0.0 4.0 9.1 13.3 0.0 50.0
No access to
knowledge
outside org. 5.5 0.0 50.0 0.0 0.0 0.0 0.0 0.0 0.0 0.0
inflexible
solution 0.0 0.0 0.0 3.1 0.0 0.0 0.0 6.7 11.1 0.0
Too
expensive 4.4 10.0 0.0 9.4 50.0 8.0 18.2 0.0 11.1 0.0
Ill-defined
strategy 9.9 10.0 0.0 3.1 0.0 8.0 0.0 6.7 0.0 0.0
Inability to
integrate with
existing IT 5.5 20.0 25.0 28.1 0.0 24.0 9.1 53.3 11.1 25.0
Changing
regulatory
environment 1.1 0.0 0.0 6.2 0.0 0.0 0.0 0.0 11.1 0.0
Other 13.2 0.0 0.0 9.4 0.0 0.0 0.0 0.0 33.3 0.0
When looking individually at the firms, brick and mortar florists selected “e-commerce software not focused on B2B needs” (15% of
the firms) followed by lack of internal e-commerce skill (13%) and other business parts required my focus (11%).
Online florists cite the inability to integrate with existing IT infrastructure (20%) and lack of internal e-commerce skill (20%) as the
greatest obstacles.
Supermarkets report lack of internal e-commerce skill (25%), no access to knowledge outside of organization (50%), and inability to
integrate with existing IT infrastructure (25%) as the greatest obstacles.
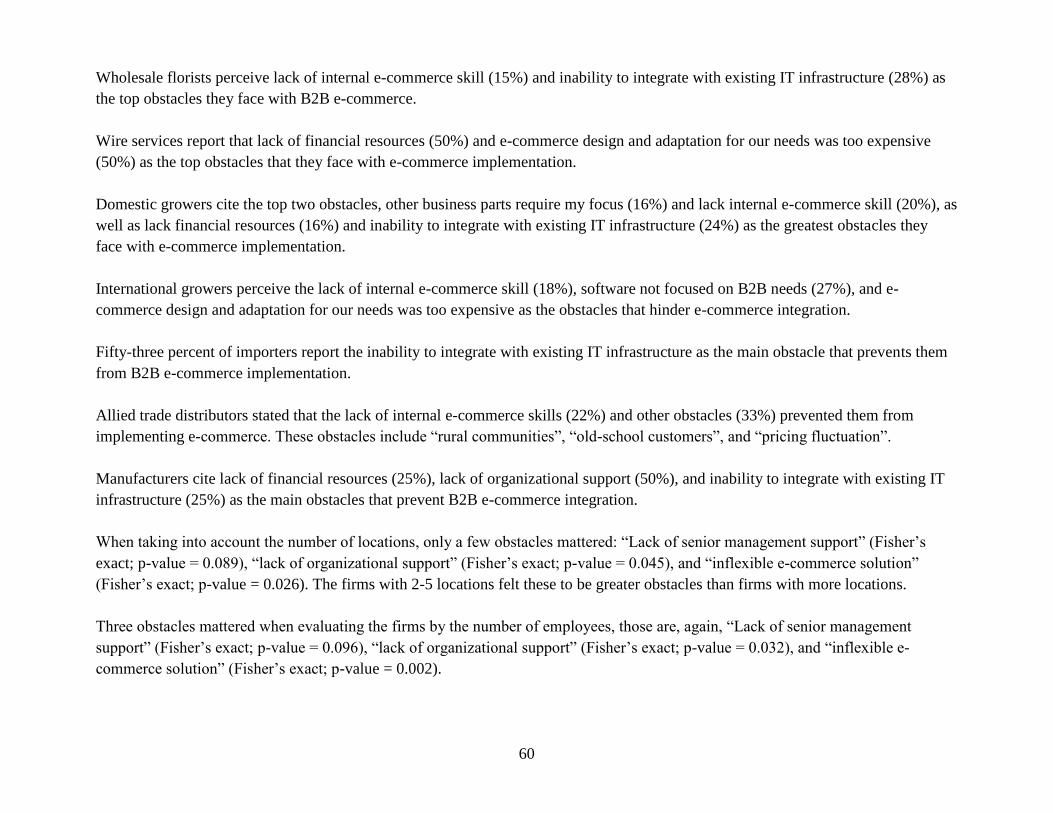
60
Wholesale florists perceive lack of internal e-commerce skill (15%) and inability to integrate with existing IT infrastructure (28%) as
the top obstacles they face with B2B e-commerce.
Wire services report that lack of financial resources (50%) and e-commerce design and adaptation for our needs was too expensive
(50%) as the top obstacles that they face with e-commerce implementation.
Domestic growers cite the top two obstacles, other business parts require my focus (16%) and lack internal e-commerce skill (20%), as
well as lack financial resources (16%) and inability to integrate with existing IT infrastructure (24%) as the greatest obstacles they
face with e-commerce implementation.
International growers perceive the lack of internal e-commerce skill (18%), software not focused on B2B needs (27%), and e-
commerce design and adaptation for our needs was too expensive as the obstacles that hinder e-commerce integration.
Fifty-three percent of importers report the inability to integrate with existing IT infrastructure as the main obstacle that prevents them
from B2B e-commerce implementation.
Allied trade distributors stated that the lack of internal e-commerce skills (22%) and other obstacles (33%) prevented them from
implementing e-commerce. These obstacles include “rural communities”, “old-school customers”, and “pricing fluctuation”.
Manufacturers cite lack of financial resources (25%), lack of organizational support (50%), and inability to integrate with existing IT
infrastructure (25%) as the main obstacles that prevent B2B e-commerce integration.
When taking into account the number of locations, only a few obstacles mattered: “Lack of senior management support” (Fisher’s
exact; p-value = 0.089), “lack of organizational support” (Fisher’s exact; p-value = 0.045), and “inflexible e-commerce solution”
(Fisher’s exact; p-value = 0.026). The firms with 2-5 locations felt these to be greater obstacles than firms with more locations.
Three obstacles mattered when evaluating the firms by the number of employees, those are, again, “Lack of senior management
support” (Fisher’s exact; p-value = 0.096), “lack of organizational support” (Fisher’s exact; p-value = 0.032), and “inflexible e-
commerce solution” (Fisher’s exact; p-value = 0.002).

61
Two obstacles mattered when evaluating the firms by the number of years they have been in business: “The marketplace is changing
too rapidly” (Fisher’s exact, p-value = 0.029) and “Lack of internal e-commerce skills or knowledge” (Fisher’s exact, p-value =
0.011).
To analyze all of the obstacles, they were broken up into the top obstacles, mid-level obstacles, and low-level obstacles that prevent
firms from implementing B2B e-commerce. The top two obstacles are “lack of internal e-commerce skill” and “inability to integrate e-
commerce into IT infrastructure”. Mid-level obstacles are “other parts of business have required my focus”, “lack of financial
resources”, “e-commerce software not focused on B2B needs”, “ill-defined strategy”, and “other”. Low-level obstacles included
“increased competition”, “challenging marketplace”, “marketplace changing too rapidly”, “ill-defined product rollout”, “lack senior
management support”, “lack organization support”, “unable to access skills outside organization”, “inflexible e-commerce solution”,
and “changing regulatory environment”. Here we will analyze the obstacles by firm type.
Although overall across the industry it is reported that lack of internal e-commerce skill and inability to integrate ecommerce into IT
infrastructure, brick and mortar florists see ecommerce software not focused on B2B needs and “other” as the top reasons why. Some
of these reasons include: “I really dislike the general attitude of most tech professionals As a group they are difficult to talk to. Kind
of the same criticism often heard about florists”, “Challenge to integrate with our ERP”, “Biggest issues is customers that end up on a
third party marketing site Google lets them use our business name as a keyword Wire services allow them to be send only members”,
and “Too many old school customers refuse to even email”.
Twenty percent of online florists view the top level obstacles as their greatest obstacles. Other obstacles that faced some online florists
(10%) were “other parts of business have required my attention”, “lack financial resources”, “e-commerce software not focused on
B2B needs”, “e-commerce design and adoption too expensive”, “ill-defined strategy”, and “lack organization support”.
Supermarkets see their greatest obstacle to be “unable to access skills outside of organization” (50%). Following that obstacle, the top
two obstacles of “lack internal e-commerce skill” and “inability to integrate e-commerce into IT infrastructure” tied for second (25%).
Wholesale florists viewed the top obstacles are their highest (16% and 28%) and followed the general trend with the mid-level
obstacles except for “e-commerce software not focused on B2B needs”. In the low-level category, “changing regulatory environment”
(6%) was seen as more mid-level.
Wire services had two main obstacles that they felt impeded their use of e-commerce: “lack financial resources” (50%) and “e-
commerce design and adoption too expensive” (50%).

62
Domestic growers felt that the top two obstacles were the greatest they faced (20% and 24%), but “other parts of business have
required my focus” (16%) and “lack of financial resources” (16%) were also seen as very important.
International growers felt three main obstacles affecting their implementation of e-commerce: “lack of internal e-commerce skill”
(18%), “e-commerce software not focused on B2B needs” (27%), and “e-commerce design and adoption too expensive” (18%).
Importers overwhelmingly felt that the “inability to integrate e-commerce into IT infrastructure” was their greatest challenge (53%).
Other challenges included “challenging marketplace” (13%) and “lack organization support” (13%).
Omnichannel
As a subset of information pertaining to B2B e-commerce, firms' approaches
to being omnichannel are important to consider. E-commerce could
potentially facilitate more omnichannel selling in the future.
Figure Q12.1. Do you consider your firm to be omnichannel?
First, we asked if firms consider themselves to be omnichannel. Historically,
there has been some negativity associated with selling omnichannel and
disrupting the traditional selling relationships. Yet, we see firms become
more and more omnichannel as technology allows them. As predicted by the
main report and interviews conducted, a great majority of the respondents
consider themselves to be omnichannel (82%).
Table Q12.1. By firm type: Do you consider your firm to be omnichannel?
Types of Businesses
B&M Florist Online Florist Supermarket
Wholesale
florists Wire Services
Domestic
Grower Intl. Grower Importer Distributor Manufacturer
Column %

63
Yes 95.2 88.9 0.0 75.8 100.0 70.8 50.0 76.9 77.8 66.7
No 4.8 11.1 100.0 24.2 0.0 29.2 50.0 23.1 22.2 33.3
Broken down by firm type, brick and mortar florists,
online florists, wholesale florists, wire services,
domestic growers, distributors, and manufacturers all
consider themselves to be omnichannel (range from
67% to 100%). The supermarkets who completed the
survey did not consider themselves to be omnichannel
(0%). Fifty percent of international growers felt they
were omnichannel.
Figure Q13.1. What are the components that make
up your omnichannel strategy?
To dive deeper into the aspects of omnichannel, we
wanted to know what components of the firm make up
the omnichannel strategy. Thirty-one percent of firms use their own webstore, 37% use social media, and 30% use their physical store
as part of their omnichannel strategy. Nineteen percent of firms use email marketing with buy buttons. Seventeen percent of firms use
call centers as part of their omnichannel strategy. Less than 15% of firms use a distributor’s webstore, a mobile app, B2B marketplace,
mail orders, faxing, and other components in their omnichannel strategy.
Table Q13.1. What are the components that make up your omnichannel strategy?
Do you consider your firm to be omnichannel?
Yes No
Column % Column %
Own webstore 60.1 3.7
Distributor webstore 12.8 0.0

64
Social Media 7.3 5.0
Mobile apps 24.8 0.9
Email marketing with buy buttons 37.6 1.8
B2B marketplace 20.6 0.9
Call center 32.6 3.2
Physical store 61.0 1.4
Mail order 11.5 1.8
Fax 23.9 1.4
Other 9.2 2.3
When comparing the firms that responded “Yes” or “No” to being omnichannel by the components identified as part of their
omnichannel strategy, 60% of firms who are omnichannel use their own webstore and 13% use a distributor’s webstore. For the sake
of reading the tables, any respondent who indicated they were omnichannel will be called an “omnichannel firm”. Seven percent of
omnichannel firms use social media as part of their strategy. Twenty-five percent of omnichannel firms use mobile apps and 38% use
email marketing with buy buttons. Twenty-one percent of firms use B2B marketplaces and 33% use call centers. Sixty-one percent of
omnichannel firms use their physical stores and, amazingly, 24% are still using fax machines as part of their strategy. Nine percent
indicated other services are part of their omnichannel approach. There is an overwhelming difference between the firms who consider
themselves to be omnichannel versus not and how they use components in their strategy. Only 4% of non-omnichannel firms indicated
that they use their own webstore, 5% use social media, and 3% use call centers. The rest of the components presented make up 2% or
less of non-omnichannel firms.
Table Q13.2. By firm type: “What are the components that make up your omnichannel strategy?”
Types of Businesses
B&M Florist Online Florist Supermarket
Wholesale
florists Wire Services
Domestic
Grower Intl. Grower Importer Distributor Manufacturer
Column %
Own
webstore 50.4 50.0 0.0 25.4 66.7 31.4 23.1 38.9 28.6 12.5

65
Distributor
webstore 5.2 12.5 0.0 10.2 0.0 2.9 0.0 5.6 28.6 12.5
Social Media 54.8 50.0 20.0 40.7 66.7 48.6 46.2 50.0 35.7 25.0
Mobile apps 20.0 12.5 0.0 11.9 0.0 5.7 15.4 16.7 28.6 0.0
marketing
with buy
buttons 34.1 37.5 0.0 15.3 33.3 14.3 7.7 22.2 14.3 0.0
B2B
marketplace 0.0 6.3 0.0 20.3 0.0 8.6 0.0 38.9 42.9 0.0
Call center 14.1 12.5 0.0 23.7 0.0 22.9 15.4 33.3 50.0 37.5
Physical store 55.6 43.8 0.0 35.6 66.7 22.9 0.0 22.2 21.4 0.0
Mail order 7.4 6.3 20.0 0.0 33.3 2.9 46.2 5.6 21.4 0.0
Fax 17.0 6.3 0.0 22.0 0.0 11.4 7.7 11.1 28.6 12.5
Other 4.4 6.3 0.0 8.5 0.0 11.4 0.0 5.6 14.3 12.5
When comparing components by firm, 51% of brick and mortar florists use their own webstore, 55% use social media, 56% use their
physical store as part of their omnichannel strategy. Twenty percent of firms use mobile apps, 34% use email marketing with buy
buttons, and 17% use faxing.
Online florists use the components of their own website (50%), social media (50%), email marketing with buy buttons (38%), and a
physical store (44%) as part of their omnichannel strategy. Less than 15% use a distributor’s webstore, mobile apps (13%), B2B
marketplace (6%), call centers (13%), mail order (6%), and faxing (6%).
Supermarkets use social media (20%) and mail orders (20%) as part of their omnichannel strategy.
Wholesale florists use the components of their own webstore (25%), social media (41%), B2B marketplace (20%), call centers (24%),
a physical store (36%), and faxing (22%) as part of their omnichannel strategy. Less than 15% of wholesale florists use a distributor’s
webstore, mobile apps, email marketing with buy buttons, and other services.
Wire Services use their own webstore (68%), social media (68%), email marketing with buy buttons (33%), a physical store (68%),
and mail ordering (33%).

66
Domestic growers use the components of their own webstore (31%), social media (49%), call centers (23%), and a physical store
(23%). Less than 15% of domestic growers use a distributor’s webstore (3%), mobile apps (6%), B2B marketplace (9%), mail
ordering (3%), faxing (11%), and other services (11%).
International growers use their own webstore (23%), social media (46%), and mail ordering (46%). Less than 15% of international
growers use mobile apps, email marketing with buy buttons, call centers, and faxing.
Importers use the components of their own webstore (39%), social media (50%), mobile apps (17%), email marketing with buy
buttons (22%), B2B marketplace (39%), call center (33%), and a physical store (22%). Less than 15% of importers use a distributor’s
webstore, mail ordering, faxing and other services.
Allied trade distributors use their own webstore (29%), distributor’s web stores (29%), social media (36%), mobile apps (29%), B2B
marketplace (43%), call centers (50%), physical store (21%), mail ordering (21%), and faxing (29%). Less than 15% of distributors
use email marketing with buy buttons and other services as part of their omnichannel strategy.
Manufacturers use social media (25%) and call centers (38%) as part of their omnichannel strategy. Less than 15% of manufacturers
use their own webstore, distributors’ web stores, faxing, and other services as part of their omnichannel strategy.

67
Figure Q14.1. After introducing your B2B e-commerce platform, what are you able to do now that previously you couldn’t?
Three key activities are able to be conducted by firms that previously they were not able to do without e-commerce: direct sales to
end-consumer, additional revenue, and expanding business (20-28% of firms). The activities of selling to the end-consumer via 3rd-
party (11%) and selling through wholesale florists and/or distributors (8%). Seven percent of firms are unsure if they are able to do
more activities with their B2B e-commerce platform.
Table Q14.1. By firm type: After introducing your B2B e-commerce platform, what are you able to do now that previously you
couldn’t?
Types of Businesses

68
B&M Florist Online Florist Supermarket
Wholesale
florists Wire Services
Domestic
Grower Intl. Grower Importer Distributor Manufacturer
Column %
Sell direct to
end-customer 17.8 37.5 0.0 8.5 33.3 28.6 46.2 27.8 14.3 12.5
Create add.
revenue
streams 22.2 18.8 0.0 18.6 66.7 20.0 30.8 44.4 21.4 12.5
Expand
business
model 24.4 25.0 20.0 16.9 33.3 25.7 30.8 55.6 35.7 12.5
Sell to end-
customer via
3rd party 6.7 12.5 20.0 8.5 0.0 8.6 23.1 44.4 14.3 0.0
Sell through
wholesale/dis
tributors 1.5 0.0 20.0 10.2 0.0 14.3 23.1 33.3 14.3 0.0
Not sure 11.1 0.0 0.0 3.4 0.0 2.9 0.0 0.0 7.1 0.0
Brick and Mortar florists highlight expanding the business model as the activity most have previously have not been about to do
(24%) followed by creating additional revenue streams (22%). Selling online seems to be helping the brick and mortar florists to sell
more.
Online florists report selling directly to the end consumer as the activity most have previously not been able to do (38%) followed by
expanding the business model (25%).
Supermarkets report expanding the business model, selling to the end consumer via 3rd party, and selling through wholesale
florists/distributors equally as activities they have not been able to do without their B2B e-commerce platform (20%).
wholesale florists do not report as highly as other categories but the top two activities that have improved are creating additional
revenue streams (19%) and expanding business models (17%).
Wire services highlight creating additional revenue (67%) as the activity improved with their B2B e-commerce platform. Two
activities that tie as secondary are selling directly to the end-customer and expanding the business model (33%).
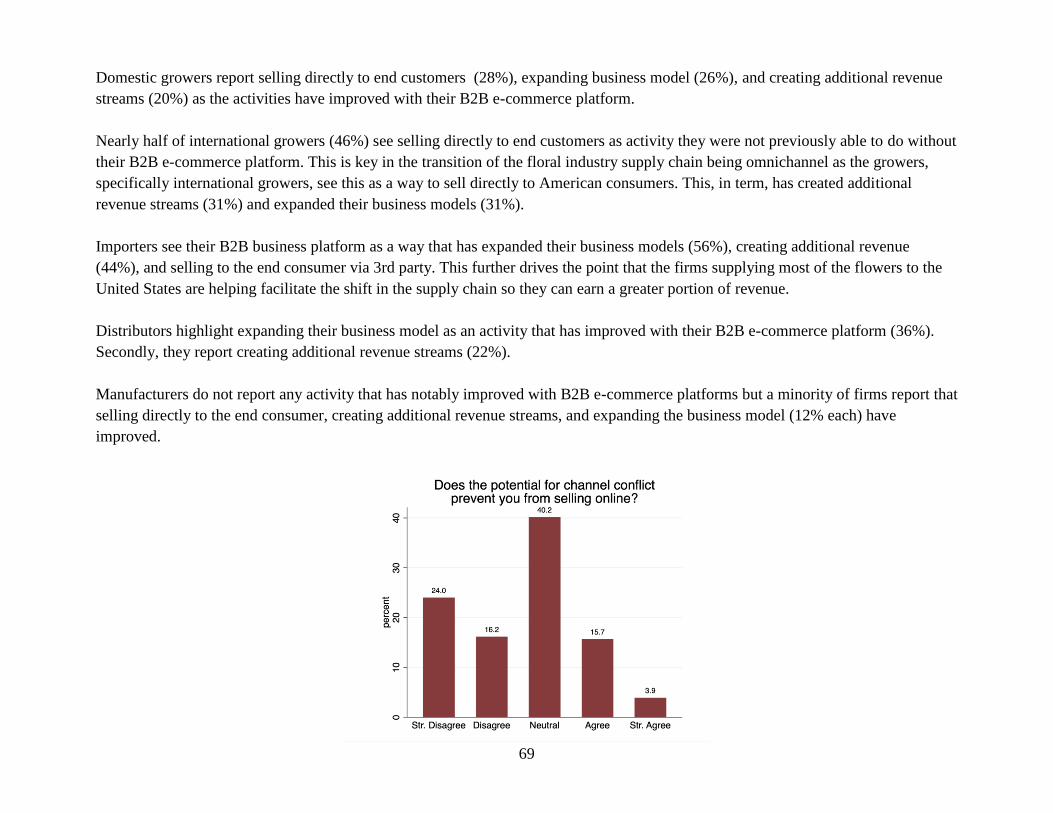
69
Domestic growers report selling directly to end customers (28%), expanding business model (26%), and creating additional revenue
streams (20%) as the activities have improved with their B2B e-commerce platform.
Nearly half of international growers (46%) see selling directly to end customers as activity they were not previously able to do without
their B2B e-commerce platform. This is key in the transition of the floral industry supply chain being omnichannel as the growers,
specifically international growers, see this as a way to sell directly to American consumers. This, in term, has created additional
revenue streams (31%) and expanded their business models (31%).
Importers see their B2B business platform as a way that has expanded their business models (56%), creating additional revenue
(44%), and selling to the end consumer via 3rd party. This further drives the point that the firms supplying most of the flowers to the
United States are helping facilitate the shift in the supply chain so they can earn a greater portion of revenue.
Distributors highlight expanding their business model as an activity that has improved with their B2B e-commerce platform (36%).
Secondly, they report creating additional revenue streams (22%).
Manufacturers do not report any activity that has notably improved with B2B e-commerce platforms but a minority of firms report that
selling directly to the end consumer, creating additional revenue streams, and expanding the business model (12% each) have
improved.

70
Figure Q15.1. Does the potential for channel conflict prevent you from selling online?
The chance for channel conflict overall is neutral but skewed slightly to disagree that channel conflict would prevent the firm from
selling online.
Table Q15.1. By firm type: Does the potential for channel conflict prevent you from selling online?
Types of Businesses
B&M
Florist
Online
Florist Supermarket
Wholesale
florists Wire Services
Domestic
Grower Intl. Grower Importer Distributor Manufacturer
Column %
Str. Disagree 20.0 75.0 0.0 33.3 0.0 22.7 10.0 25.0 37.5 0.0
Disagree 18.8 12.5 0.0 14.8 0.0 13.6 20.0 8.3 37.5 33.3
Neutral 55.0 12.5 0.0 25.9 50.0 36.4 30.0 16.7 25.0 0.0
Agree 5.0 0.0 100.0 18.5 50.0 27.3 30.0 33.3 0.0 33.3
Str. Agree 1.2 0.0 0.0 7.4 0.0 0.0 10.0 16.7 0.0 33.3
Breaking down by firm type, brick and mortar florists, online florists, wholesale florists, domestic growers, and distributors lean
towards disagree. Yet, there is still 19% of wholesale florists who do see selling online as a potential channel conflict. This makes
sense, as many of their customers are florists. Supermarkets, wire services, international growers, importers, and manufacturers lean
towards agreeing that selling online would cause channel conflict. This also makes sense, as many of these types of firms benefit from
the traditional cold chain model.
Table Q16.1. How strongly do you agree or disagree with the following statements regarding your likelihood to use artificial
intelligence technology in implementing your B2B e-commerce:
Strongly disagree Disagree
Somewhat
disagree
Neither agree nor
disagree Somewhat agree Agree Strongly agree
Column %
I will use AI to
make better
business decisions 8.3 8.3 7.8 35.0 19.9 12.6 8.3

71
in the next three
years
I will use AI to
replace human
workers in the next
three years 26.2 23.3 11.2 24.3 9.2 2.9 2.9
I will use AI for
product research
and development 11.7 9.7 8.7 34.5 18.9 10.2 6.3
Another aspect of e-commerce technology is artificial intelligence (AI). We anticipated that many users are not utilizing AI currently,
but a futuristic need may be fulfilled. Therefore, three scale questions were asked to understand the feelings behind the future of AI in
floral e-commerce. Overall, most firms were neutral to “using AI to make better business decisions in the next three years” and “using
AI for product research and development”. There was a significant disagreement for the question option“using AI to replace human
workers in the next three years”.
Table Q16.2. By the number of employees: How strongly do you agree or disagree with the following statements regarding
your likelihood to use artificial intelligence (AI) technology in implementing your B2B e-commerce?
Mean Value Coefficient GLM z-score
P-value
I will use AI to replace human workers
in the next three years
3.5 (Somewhat disagree) 0.2774 2.22
0.026
I will use AI for product research and
development
3.87 (Somewhat disagree) 0.2501 1.85
0.064
To test if there was a relationship with the number of employees a firm has and the degree to which each firm agreed or disagreed with
each statement about artificial intelligence, two of the three of the questions had correlations. This means that firms of different sizes
(categorized by number of employees) felt differently. In fact, the larger the firm the more likely they were to agree with the
statements of “using AI to replace human workers in the next three years” and “using AI for product research and development”. It is
important to bear in mind while viewing these results that the average value for “I will use AI to replace human workers in the next

72
three years” is 3.5 which equates to somewhat disagree. Therefore, the firms are disagreeing with doing this, but this could change in
the future for larger firms. The mean value for “using AI for product research and development” is 3.87 which equates to somewhat
disagree, but is closer to neutral. There is potential for larger firms to use AI if they deem it to be beneficial.
When comparing the number of years in business (Q7) to the perspectives on using AI in the future, there were no differences in views
on AI based on the number of years firms have been in business. Therefore, both starting and established businesses have the same
views on AI.
Figure Q17.1. What of the following features are you looking to introduce to help enhance your customers information
gathering and purchasing experience?
Overall, there wasn’t a large percentage of responses to what firms are looking to introduce to help enhance their customers
purchasing experiences. This could be because they feel as though they are adequately providing features or the firms are unable to
provide more features at the moment. Thirty percent of firms said they are looking to provide simpler ordering and payment followed
by 31% who said they want to provide easier navigation. Coming in third, approximately 20-25% of firms indicated they are looking

73
to provide better product images, more detailed production information, improve their webstore speed, and create custom customer
management. Seventeen percent of firms are looking to create customized products.
Table Q 17.1. By firm type: What of the following features are you looking to introduce to help enhance your customers
information gathering and purchasing experience?
Types of Businesses
B&M Florist Online Florist Supermarket
Wholesal
e florists
Wire
Service
Domestic
Grower Intl. Grower Importer Distributor Manufacturer
Column %
Simpler
ordering/paym
ent 42.2 43.8 40.0 37.3 33.3 42.9 46.2 50.0 42.9 25.0
Easier
navigation 39.3 43.8 40.0 32.2 33.3 28.6 53.8 61.1 50.0 37.5
Better product
images 35.6 50.0 20.0 28.8 0.0 34.3 38.5 50.0 28.6 12.5
Detailed
product info. 28.1 43.8 20.0 32.2 33.3 28.6 38.5 50.0 42.9 37.5
Improved
webstore
speed 26.7 31.3 40.0 18.6 33.3 40.0 61.5 27.8 28.6 12.5
Custom
customer
mgmt. 28.9 37.5 40.0 22 66.7 28.6 38.5 50.0 28.6 12.5
Customized
products 28.9 37.5 20.0 8.5 33.3 17.1 30.8 27.8 21.4 0.0
Other 3.7 0.0 0.0 0.0 0.0 0.0 0.0 11.1 0.0 0.0
Brick and mortar florists and wholesale florists follow the general trend of looking to provide simpler ordering and payment and easier
navigation followed by the rest of the features.
Online florists are looking to introduce better product images (50%) more than the other features of simpler ordering and payment
(44%) and easier navigation (44%).

74
Supermarkets are most interested in simpler ordering, easier navigation, improved webstore speed, and custom customer management
(40%).
Wire services want to create custom customer management (67%) followed by all of the other feature options: simpler ordering, easier
navigation, better product images, detailed product information, etc.
Domestic growers are most interested in applying the features of simpler order (43%) and payment and improved webstore speed
(40%) followed by better product images (34%).
International growers overwhelmingly want to introduce the features of improved customer management (62%) and easier navigation
(54%). Overall these firms are interested in including all of the features to a degree as none of the feature options had less than 30% of
the sample represented.
Importers want to improve the feature of easier navigation (61%), simpler ordering and payment (50%), better product images (50%),
detailed product information (50%), and custom customer management (50%).
Allied trade distributors are looking to improve the features of easier navigation (50%) followed by simpler ordering and payment
(43%) and detailed product information (43%).
Manufacturers are looking to introduce easier navigation (38%) and detailed product information (38%) followed by simpler ordering
and payment (25%).
Online Ordering
Another aspect of B2B e-commerce is online ordering. In this section, aspects of online ordering as a seller are discussed.

75
Figure Q18.1. Do you currently accept online orders?
Eighty percent of respondents said that they accept online orders, the other 20% do not.
Table Q18.1. By firm type: Do you currently accept online orders?
Types of Businesses
B&M Florist Online Florist Supermarket
Wholesale
florists Wire Services
Domestic
Grower Intl. Grower Importer Distributor Manufacturer
Column %
Yes 94.0 100.0 66.7 65.7 100.0 73.9 45.5 85.7 77.8 33.3
No 6.0 0.0 33.3 34.3 0.0 26.1 54.5 14.3 22.2 66.7
Ninety-four percent of brick and mortar florists accept online ordering. One hundred percent of online florists and wire services accept
online orders. Sixty-eight percent of supermarkets accept online orders. Seventy-three percent of domestic growers accept online
orders while 45% of international growers do. Eighty-six percent of importers accept online orders and 78% of distributors accept
online orders. Only 33% of manufacturers accept online orders.

76
Figure Q19.1. What portion of your company’s total revenue in 2018, 2019, and projected in 2020 was transacted online?
When assessing the portion of revenue that comes from online ordering, therefore B2B e-commerce, a dot plot was utilized to show
the progression. Each percentage reported by a firm is represented as a singular dot on the table. If there are multiple dots of the same
amount, they will build a line. As seen for the 2018 revenue, most firms report 0% revenue coming from online transactions.
Interestingly, the number of firms reporting 0% decreases into 2019 and projected 2020 revenue. Additionally, projected 2020 revenue
indicates that more firms will be transacting online than ever before. The mean amount of revenue transacted online went from
14.48% (SE=1.4%) to 17.94% in 2019 (SE=1.5%) to 24.45% in 2020 (SE=1.8%). This has been exaggerated by COVID-19 but it may
be sustained.

77
Figure Q20.1 How many SKUs do you have for sale online each month?
The number of SKUs offered online was very skewed to under 100. While 82 firms provide more than 100 SKUs online, only 40 of
228 firms said they have more than 500 online SKU’s with at most 60,000 available. Among these “outliers”, the average number of
SKUs provided online is 1,385, which is obviously not an accurate representation of the sample frame at large.
Table Q20.1. By firm type: How many SKUs do you have for sale online each month?
Types of Businesses
B&M Florist Online Florist
Wholesale
florists
Domestic
Grower Intl. Grower Importer Distributor Manufacturer
Column %

78
0 17.9 0.0 81.8 36.8 60.0 22.2 0.0 50.0
1-10 0.0 0.0 0.0 31.6 10.0 22.2 0.0 0.0
11-20 5.1 33.3 9.1 15.8 20.0 11.1 0.0 0.0
21-30 15.4 0.0 0.0 5.3 0.0 0.0 100.0 50.0
31-40 12.8 0.0 0.0 0.0 0.0 11.1 0.0 0.0
41-50 15.4 33.3 9.1 5.3 0.0 11.1 0.0 0.0
51-60 2.6 0.0 0.0 0.0 0.0 11.1 0.0 0.0
61-70 2.6 0.0 0.0 0.0 0.0 0.0 0.0 0.0
71-80 5.1 0.0 0.0 0.0 0.0 0.0 0.0 0.0
81-90 7.7 0.0 0.0 0.0 0.0 11.1 0.0 0.0
91-100 15.4 33.3 0.0 5.3 10.0 0.0 0.0 0.0
Mean 46.0 56.7 6.4 14.8 14.0 27.9 25.0 15.0
Supermarkets and wire services did not respond to this question. With the outliers removed, the average number of SKUs for sale
online by brick and mortar florists is 46 SKUs with a range from 0 to 100. Online florists have on average 57 SKUs with a range from
11 to 100. wholesale florists report an average of 6 SKUs with a range from 0 to 50. Domestic growers report an average of 15 SKUs
online with a range from 0 to 100. International growers have an average of 14 SKUs with a range from 0 to 100. Importers have an
average of 28 SKUs available online with a range from 0 to 90 SKUs.

79
Figure 21.1 How many online orders do you have each month?
With six outliers (who do over 500 online orders per month), the firms responding averaged 305 online orders per month. With the six
firms removed, the average number of online orders per month dropped to 73.
Table Q21.1. By firm type: How many online orders do you have each month?
Types of Businesses
B&M Florist Online Florist
Wholesale
florists
Domestic
Grower Intl. Grower Importer Distributor Manufacturer
Column %
0 5.6 0.0 72.7 31.6 66.7 25 0.0 50.0
1-10 2.8 0.0 9.1 15.8 11.1 12.5 0.0 0.0

80
11-20 5.6 0.0 0.0 10.6 11.1 12.5 100.0 0.0
21-30 16.6 0.0 9.1 0.0 0.0 12.5 0.0 50.0
31-40 8.4 0.0 0.0 5.3 0.0 0.0 0.0 0.0
41-50 2.8 0.0 0.0 15.8 0.0 0.0 0.0 0.0
51-60 2.8 0.0 0.0 0.0 0.0 0.0 0.0 0.0
61-70 2.8 33.3 0.0 0.0 0.0 0.0 0.0 0.0
71-80 5.6 0.0 9.1 0.0 0.0 0.0 0.0 0.0
81-90 5.6 0.0 0.0 0.0 0.0 0.0 0.0 0.0
91-100 11.1 0.0 0.0 5.3 11.1 12.5 0.0 0.0
101-150 5.6 0.0 0.0 0.0 0.0 12.5 0.0 0.0
151-200 2.8 0.0 0.0 0.0 0.0 0.0 0.0 0.0
201-250 2.8 33.3 0.0 5.3 0.0 0.0 0.0 0.0
251-300 8.8 0.0 0.0 5.3 0.0 0.0 0.0 0.0
301-400 5.6 0.0 0.0 0.0 0.0 0.0 0.0 0.0
401-500 0.0 33.3 0.0 5.3 0.0 12.5 0.0 0.0
Mean 98.8 273.3 10.9 73.6 13.3 99.5 15.0 12.5
Supermarkets and wire services do not report for this question. Brick and mortar florists have an average of 99 online orders each
month with a range from 0 to 400. Online florists have an average of 273 online orders each month with a range from 61 to 500.
wholesale florists have an average of 11 online orders each month with a range from 0 to 80. Domestic growers have an average of 74
online orders with a range from 0 to 500. International growers have an average of 13 and a range of online orders from 0 to 100.
Importers have an average of 100 online orders a month with a range from 0 to 500. Distributors have an average of 15 online orders
and a range from 11 to 20. Manufacturers have 13 online orders monthly and a range from 0 to 30 each month.

81
Figure Q22.1. How many online customers do you have each month?
Two firms had over 500 online customers per month, the rest of the firms had far less. On average, the firms had 61 online customers
each month.
Table Q22.1. By firm type: How many online customers do you have each month?
Types of Businesses
B&M Florist Online Florist
Wholesale
florists
Domestic
Grower Intl. Grower Importer Distributor Manufacturer

82
# Column %
0 5.9 0.0 72.7 31.6 62.5 25.0 0.0 50.0
1-10 12.0 0.0 18.2 36.9 25.0 25.0 0.0 0.0
11-20 6.0 0.0 0.0 5.3 0.0 12.5 100.0 0.0
21-30 6.0 0.0 0.0 5.3 0.0 12.5 0.0 50.0
31-40 9.0 0.0 0.0 5.3 12.5 0.0 0.0 0.0
41-50 2.9 0.0 0.0 0.0 0.0 0.0 0.0 0.0
51-60 2.9 0.0 0.0 0.0 0.0 0.0 0.0 0.0
61-70 2.9 33.3 0.0 0.0 0.0 0.0 0.0 0.0
71-80 2.9 0.0 0.0 5.3 0.0 0.0 0.0 0.0
81-90 5.9 0.0 0.0 0.0 0.0 12.5 0.0 0.0
91-100 20.6 0.0 9.1 0.0 0.0 0.0 0.0 0.0
101-150 12.0 0.0 0.0 0.0 0.0 0.0 0.0 0.0
151-200 2.9 0.0 0.0 0.0 0.0 12.5 0.0 0.0
201-250 2.9 33.3 0.0 0.0 0.0 0.0 0.0 0.0
251-300 6.0 0.0 0.0 5.3 0.0 0.0 0.0 0.0
301-400 0.0 0.0 0.0 5.3 0.0 0.0 0.0 0.0
401-500 0.0 33.3 0.0 0.0 0.0 0.0 0.0 0.0
Mean 86.0 266.7 10.9 48.1 6.5 42.4 15.0 15.0
Supermarkets and wire services did not report for this question. Brick and mortar florists have an average of 86 online customers a
month with a range from 0 to 250. Online florists have an average of 267 online customers per month with a range from 61-500.
Wholesale florists have an average of 11 online customers per month and the number of customers range from 0 to 100. Domestic
growers have an average of 48 online customers per month with a range of customers from 0 to 400. International growers average 7
online customers per month with a range of 0 to 40 customers. Importers have an average of 42 online customers per month with a
range from 0 to 200. Both distributors and manufacturers have an average of 15 customers per month. Distributors have 11-20 online
customers per month and manufacturers range from 0 to 30.

83
Preferences of respondents
Figure Q25.1. What are the challenges to the implementation of e-commerce in the floral industry?
When assessing what is the challenge of implementing e-commerce into the floral industry, over half of the responses were of low
customer awareness (36%) and 23% indicated that other factors than presented in the survey were of challenges. Firms also felt that
slow internet penetration (19%) and lack of trust (15%) had effects. Seven percent of firms felt that security concerns were a
challenge.

84
Figure Q25.2. By Firm Type: What are the challenges to implementing e-commerce?
Table Q25.1.By firm type: What are the challenges to the implementation of e-commerce in the floral industry?
Types of Businesses
B&M Florist Online Florist Supermarkets
Wholesale
florists Wire Services
Domestic
Grower Intl. Grower Importer Distributor Manufacturer
Column %

85
Slow Pen.
Internet 12.6 0.0 20.0 23.7 33.3 28.6 23.1 33.3 7.0 1.8
Security
Concerns 7.4 18.8 20.0 3.4 0.0 5.7 7.7 11.1 7.1 0.0
Trust Lacking 16.3 18.8 0.0 13.6 0.0 17.1 23.1 22.2 14.3 0.0
Low
Customer
Awareness 28.9 8.0 40.0 33.9 33.3 40.0 53.8 44.4 28.6 25.0
Other Factors 22.2 12.5 20.0 27.1 33.3 20.0 23.1 22.2 28.6 12.5
Evaluating by type of firm, brick and mortar florists, supermarkets, wholesale florists, domestic growers, international growers,
importers, and manufacturers follow the general trend reported above. A few differences exist with online florists, wire services, and
distributors.
Online florists see that security concerns and lacking trust are of the greater concern of the factors listed (19%). Thirteen percent
perceive other factors to contribute as challenges. They do not see slow penetration of the internet as an issue (0%).
Wire services perceive slow internet penetration (33%), low customer awareness (33%), and other factors (33%) as challenges to
implementing e-commerce. They do not perceive lack of trust or security concerns as issues.
Distributors see an equal challenge of low customer awareness and other factors (29%) followed by lack of trust (14%). Additionally,
they see slow internet penetration and security concerns as equally low concerns (7%).
Table Q26.1. Respondents were asked to rank on a seven point scale of how much they Strongly Agreed to Strongly Disagreed
each statement.
Strongly
disagree Disagree
Somewhat
disagree
Neither agree nor
disagree
Somewhat
agree Agree
Strongly
agree
Column %
B2B e-commerce is critical to developing a
competitive advantage.
2.2 0.0 5.4 17.2 24.7 30.1 20.4
My company wishes to be considered a
leader in digital selling within our market
or industry.
5.4 6.5 5.4 20.4 20.4 22.6 19.4

86
Accelerating B2B e-commerce is a
strategic priority of our company.
4.3 9.7 6.5 24.7 17.2 24.7 12.9
Our company is shifting to selling digitally
faster than our competitors.
12.0 17.4 7.6 33.7 12.0 12.0 5.4
B2B e-commerce is a threat to our sales
organization.
20.4 30.1 9.7 26.9 7.5 2.2 3.2
It is important to also assess respondent attitudes about e-commerce. Therefore, five Likert-scale questions were asked to understand
the feelings behind the future of e-commerce in the floral supply chain. Overall, most firms indicated that they somewhat agreed that
B2B e-commerce “is critical to developing a competitive advantage”. Firms felt neutral regarding their company “wishes to be
considered a leader in digital selling within our market/industry” and “accelerating B2B e-commerce is a strategic priority for our
company”. Firms disagree that they were “selling digitally faster than our competitors” and disagree that “B2B is a threat to our sales
organization”. Overall, firms seem optimistic that B2B e-commerce could assist in their business model but do not feel confident
where they stand versus their competitors in implementation. It is a positive note to see that firms do not see online selling as
competition with their sales force.

87
Figure Q27.1. Are you using data from your e-commerce platform to support or manage key business drivers?
Unsurprisingly, based on the number of services provided and challenges faced by firms, 63% of firms do not use their data from e-
commerce to support or help guide key business decisions. As a follow-up question, it would be interesting to know if the firms collect
data on their customers for future usage (if they choose to hire an e-commerce employee) or if they do not do that either.
Table Q27.1. By firm type: Are you using data from your e-commerce platform to support or manage key business drivers?
Types of Businesses
B&M Florist Online Florist
Wholesale
florists
Domestic
Grower Intl. Grower Importer Distributor Manufacturer
Column %
Yes 50.0 50.0 0.0 42.1 12.5 37.5 0.0 50.0
No 50.0 50.0 100.0 57.9 87.5 62.5 100.0 50.0
Brick and mortar and online florists and manufacturers are split 50/50 on if they use their online data. wholesale florists do not use
their online data. This would be important for them to consider, especially when many consider themselves to be in decline or unable
to identify their customers well (see discussion in Main Report on event/studio florists). Domestic growers are slightly more likely to
not use their online data (58%), and this is exaggerated more with international growers (88%) and importers (63%). Distributors do
not use their online data (100%).
Table Q27.2. By number of fully dedicated e-commerce employees: Are you using data from your e-commerce platform to
support or manage key business drivers?
Are you using data from your e-commerce platform?
Number of e-commerce employees Yes No
Number of firms
Part-time only 24 50
1-5 employees 11 7

88
Fisher’s Exact = 0.032, p-value = 0.025
Evaluating how data is used by how many e-commerce employees are working reveals that firms that have 1-5 employees use more of
their online data than firms employing only part-time employees. This seems intuitive to report, but additionally when comparing
firms in both categories of employees (part-time and 1-5 employees) both are more likely not to use their online data than use it. This
bears the question of how much more effective could firms be in their online, omnichannel presence if they used their customer’s
buying data?
Table Q27.3. By “Are you Omnichannel?”: Are you using data from your e-commerce platform to support or manage key
business drivers?
Are you using data from your e-commerce platform?
Number of firms
Are you omnichannel? Yes No
Yes 32 36
No 3 19
Fisher’s exact = 0.006; p-value = 0.005
More omnichannel firms do not use their e-commerce data than omnichannel firms that do (36 firms versus 32 firms. This is even
more pronounced among firms who do not consider themselves to be omnichannel (3 firms) who use their e-commerce data versus
non-omnichannel firms (19 firms) who do not use their online data.
B2B Buyers
Finally, we wanted to know what aspects of B2B e-commerce were wanted when firms were asked in a buyer role instead of a seller
role.

89
Figure Q28.1. How frequently do you place an online order with your top 10 suppliers?
The most common frequency of online ordering is weekly (33%) followed by daily (21%). Yearly was the third most frequent (14%).
Ordering bi-weekly and monthly were ordered at the same frequency (12%). Quarterly was the least frequent (8%).
Table Q28.1. By firm type: How frequently do you place an online order with your top 10 suppliers?
Types of Businesses
B&M Florist Online Florist
Wholesale
florists
Domestic
Grower Intl. Grower Importer Distributor Manufacturer
Column %
Daily 16.7 33.3 60.0 6.7 0.0 37.5 0.0 0.0

90
Weekly 33.3 66.7 20.0 26.7 33.3 25.0 0.0 50.0
Bi-weekly 13.3 0.0 10.0 6.7 0.0 12.5 0.0 50.0
Monthly 16.7 0.0 0.0 13.3 33.3 0.0 0.0 0.0
Quarterly 10.0 0.0 10.0 13.3 0.0 0.0 0.0 0.0
Yearly 10.0 0.0 0.0 33.3 33.3 25.0 100.0 0.0
Brick and mortar florists buy weekly (33%) most frequently, followed by daily or monthly (18%). Online florists order either daily
(33%) or weekly (67%). The majority of wholesale florists order daily (60%). Some order weekly (20%), biweekly (10%), or
quarterly (10%). Domestic growers buy weekly (28%) most frequently followed by monthly, quarterly, and yearly (13% each), and
lastly daily or bi-weekly (7% each). International growers order weekly, monthly, or yearly (33% each). Importers buy daily (38%)
most frequently. They also order weekly and yearly (25% each) followed lastly by bi-weekly (13%). Distributors order yearly (100%).
Manufacturers order weekly or bi-weekly (50% each).
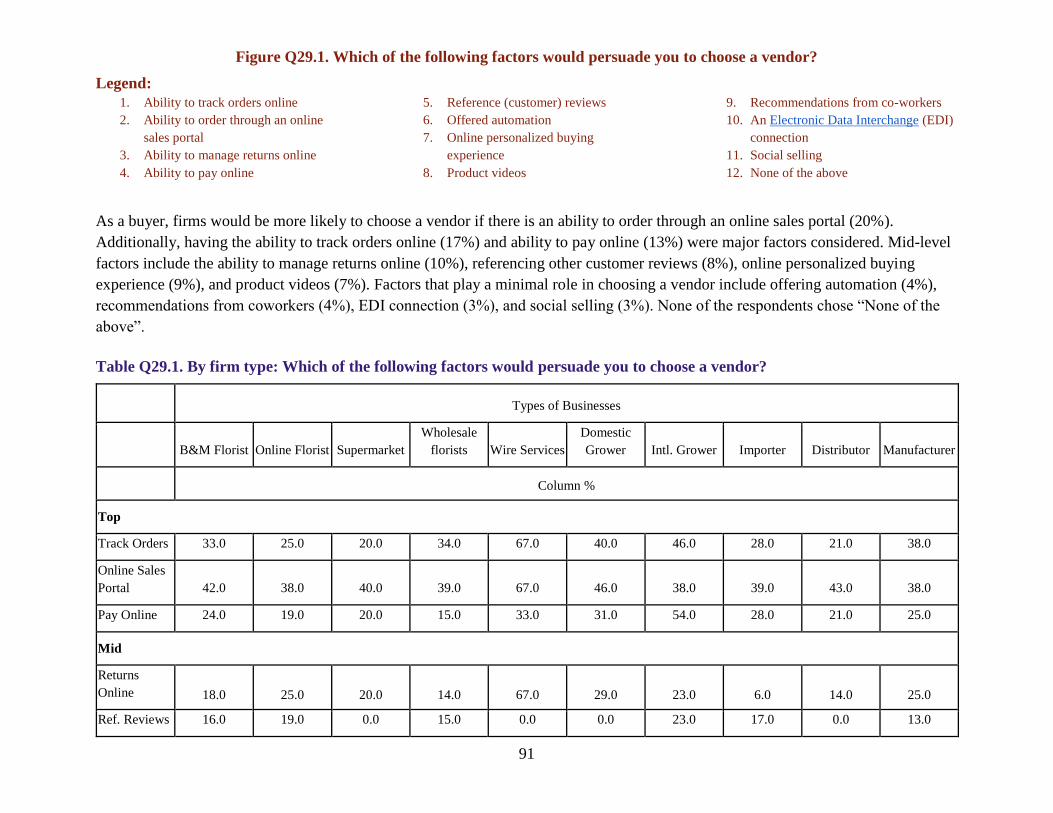
91
Figure Q29.1. Which of the following factors would persuade you to choose a vendor?
Legend:
1. Ability to track orders online
2. Ability to order through an online
sales portal
3. Ability to manage returns online
4. Ability to pay online
5. Reference (customer) reviews
6. Offered automation
7. Online personalized buying
experience
8. Product videos
9. Recommendations from co-workers
10. An Electronic Data Interchange (EDI)
connection
11. Social selling
12. None of the above
As a buyer, firms would be more likely to choose a vendor if there is an ability to order through an online sales portal (20%).
Additionally, having the ability to track orders online (17%) and ability to pay online (13%) were major factors considered. Mid-level
factors include the ability to manage returns online (10%), referencing other customer reviews (8%), online personalized buying
experience (9%), and product videos (7%). Factors that play a minimal role in choosing a vendor include offering automation (4%),
recommendations from coworkers (4%), EDI connection (3%), and social selling (3%). None of the respondents chose “None of the
above”.
Table Q29.1. By firm type: Which of the following factors would persuade you to choose a vendor?
Types of Businesses
B&M Florist Online Florist Supermarket
Wholesale
florists Wire Services
Domestic
Grower Intl. Grower Importer Distributor Manufacturer
Column %
Top
Track Orders 33.0 25.0 20.0 34.0 67.0 40.0 46.0 28.0 21.0 38.0
Online Sales
Portal 42.0 38.0 40.0 39.0 67.0 46.0 38.0 39.0 43.0 38.0
Pay Online 24.0 19.0 20.0 15.0 33.0 31.0 54.0 28.0 21.0 25.0
Mid
Returns
Online 18.0 25.0 20.0 14.0 67.0 29.0 23.0 6.0 14.0 25.0
Ref. Reviews 16.0 19.0 0.0 15.0 0.0 0.0 23.0 17.0 0.0 13.0

92
Personal. Buy
Experience 18.0 25.0 20.0 15.0 0.0 23.0 31.0 22.0 14.0 13.0
Product video 13.0 19.0 0.0 12.0 0.0 23.0 23.0 17.0 21.0 13.0
Low
Automation 5.0 6.0 40.0 8.0 0.0 14.0 31.0 0.0 14.0 0.0
Recommenda
tion from
coworker 4.0 6.0 20.0 7.0 0.0 14.0 0.0 6.0 14.0 13.0
EDI 1.0 6.0 0.0 10.0 0.0 11.0 0.0 22.0 14.0 0.0
Social selling 6.0 6.0 0.0 5.0 0.0 11.0 31.0 11.0 7.0 0.0
None of the
above 0.0 0.0 0.0 0.0 0.0 0.0 0.0 0.0 0.0 0.0
Brick and mortar florists, wholesale florists, domestic growers, importers, and manufacturers follow the overall trend where tracking
orders, online sales portal, and paying online are most important, while managing returns online, referencing reviews, having a
personalized buying experience, and product videos are secondary, and automation, recommendations from coworkers, EDI, and
social selling are not as important.
Online florists view tracking orders, online sales portal, managing returns online and a personalized buying experience as most
important, paying online, referencing customer reviews, and product videos as secondary, and automation, recommendations from
coworkers, EDI, and social selling as least important.
Supermarkets view online sales portals and automation as most important, tracking orders, paying online, returns online, a
personalized buying experience and recommendations from coworkers as secondary. They viewed referencing customer reviews,
product videos, EDI, and social selling as not important (0%).
Wire services see tracking orders, online sales portal, and returns online as important (67%) and paying online as secondary (33%).
International growers view tracking orders (46%), paying online, online sales portal (54%), automation (31%), and social selling
(31%) as most important. Managing returns online (31%), referencing customer reviews (31%), and product videos (31%) are viewed
as secondary lesser persuasions.

93
Distributors view an online sales portal as most important (43%). Less important, but contribute to 20% of the sample, are tracking
orders online, paying online, and product videos. Automation, recommendations from coworkers, and EDI are less important (14%).
Table Q29.2. By future e-commerce revenue: Which of the following factors would persuade you to choose a vendor?
Coefficient GLM z-score
P-value
Ability to track orders online
0.4129 2.76
0.006
Ability to order through an online sales
portal
0.1460 1.94
0.053
Ability to manage returns online 0.3893 2.13
0.033
Ability to pay online 0.4503 2.80
0.005
As before, a generalized linear model was developed to investigate the relationship between the predicted future e-commerce revenue
and the factors that would persuade a firm to choose a vendor in the future. As seen in Table Q29.2., the ability to track orders online,
ordering through an online sales portal, the ability to manage returns online, and the ability to pay online all have positive
relationships (as seen by the coefficient values) with the amount of predicted future e-commerce revenue. What this means is that the
greater the predicted future e-commerce revenue, the more that these factors matter. Therefore, paying online and tracking orders
online are very important whereas ordering through an online sales portal is impactful, but not as important as the other factors.
Table Q29.3. By number of firm locations: Which of the following factors would persuade you to choose a vendor?
Coefficient GLM z-score

94
P-value
An Electronic Data Interchange (EDI)
connection
0.2024 2.28
0.023
This generalized linear model looks at the relationship between the number of locations a firm has and the factors that would persuade
a firm to choose a vendor in the future. As seen in Table Q29.3., the factor “an EDI connection” has a relationship (as seen by the
coefficient value) with the number of locations a firm has. Therefore, a firm is more likely to choose a vendor that has the ability to
send information virtually, via an EDI connection, and if they have more locations. It was anticipated that the use of EDI tools would
be among larger-sized firms given that this technology has been around for a long time and used predominantly among bos stores,
supermarkets, and other larger-sized firms.
Table Q29.3. By the number of employees: Which of the following factors would persuade you to choose a vendor?
Coefficient GLM z-score
P-value
Offered automation 0.3845 2.48
0.013
Recommendations from co-workers 0.4044 1.82
0.069
An Electronic Data Interchange (EDI)
connection
0.4287 5.22
0.000
This generalized linear model was also used to look at the relationship between the number of employees a firm has and the factors
that would persuade a firm to choose a vendor in the future. As seen in Table Q29.4., offering automation, a recommendation from
coworkers, and “an EDI connection” have positive relationships (as seen by the coefficient values) with the number of employees a
firm has. Therefore, a firm with a greater number of employees is more likely to choose a vendor that has the ability to automate, send
information virtually, via an EDI connection.
We also looked at the relationship between the number of years in business and the factors that would persuade a firm to choose a
vendor. There were no significant relationships between the two questions. Therefore, we can conclude that being in business longer,
or less, does not affect the factors that would persuade a firm to choose a vendor.What’s wrong sweetie?

95
Table Q30.1. Do you prefer accessing the following information online or offline?
Online Offline No Preference
Column %
Products (and parts) information 77.5 8.2 14.2
Inventory availability 77.3 7.4 15.2
Delivery details 76.6 7.9 15.4
Pay invoices 57.0 22.4 20.5
Payment terms 52.8 19.3 27.8
Returns 50.7 20.8 28.4
Pricing and quotes 63.2 18.1 18.6
As a buyer, most firms want to be able to access as much information as possible online. A minority of individuals prefer viewing
information offline. Nearly the same percentage of firms have no preference if the information is online or offline to the percentage of
firms that would like their information offline.
Conclusion
Most firms that responded to the survey are not providing very many B2B e-commerce services or tools as sellers, yet as buyers, they
are interested in vendors providing the services for them. Overall, firms do not see B2B e-commerce as a deterrent to the growth of
their business, but an opportunity for their business to expand, earn additional revenue, and reach a new audience. This has in turn
expanded the omnichannel approach in the floral supply chain. Previously, being omnichannel was viewed cautiously, but based on
the attitudes and opinions expressed in the survey, firms are not as opposed to being omnichannel as previously thought. There seem
to be real barriers that prevent firms from implementing more B2B e-commerce. In the face of COVID, it is even more apparent that
firms should have an online presence in that it provides a safe way to interact with online-savvy customers.

96
Glossary
Affiliate Marketing: the process of earning a commission by promoting other people's (or company's products
Analytics: is the measurement, collection, analysis and reporting of web data for purposes of understanding and optimizing web
usage.
Artificial Intelligence (AI): sometimes called machine intelligence, is intelligence demonstrated by machines, unlike the natural
intelligence displayed by humans and animals.
Comparison Engine Feeds: listing a product on a search engine. Pay fee for each click to your shop (i.e. Google shopping,
Amazon Marketplace, Ebay Commerce Network))
Content Management: is a set of processes and technologies that supports the collection, managing, and publishing of information
in any form or medium. When stored and accessed via computers, this information may be more specifically referred to as digital
content, or simply as content.
Customer Relationship Management (CRM) software: refers to any tech solution that helps businesses manage
communication with current and potential clients.
Electronic Data Interchange (EDI): is the concept of businesses electronically communicating information that was traditionally
communicated on paper, such as purchase orders and invoices. Technical standards for EDI exist to facilitate parties transacting such
instruments without having to make special arrangements.
Enterprise Resource Planning (ERP) software: defined as the ability to deliver an integrated suite of business applications.
ERP tools share a common process and data model, covering broad and deep operational end-to-end processes, such as those found in
finance, HR, distribution, manufacturing, service and the supply chain.

97
Escrow: payment services like TraxPay, Syncada, and Basware
Native Mobile App: is one that is installed directly onto the smartphone and can work, in most cases, with no internet connectivity
depending on the nature of the app. Native apps are installed through an application store (such as Google Play or Apple's App
Store).
Omnichannel: integrating the different methods of shopping available to consumers (e.g., online, in a physical store, or by phone)
Personalized Customer Management: using data insights regarding customer purchasing history and recent orders
Rich Media: includes advanced features like video, audio, or other elements that encourage viewers to interact and engage with the
content
Search Engine Marketing: is a form of Internet marketing that involves the promotion of websites by increasing their visibility in
search engine results pages primarily through paid advertising.
Social Media Marketing: is the use of social media platforms and websites to promote a product or service. Although the terms e-
marketing and digital marketing are still dominant in academia, social media marketing is becoming more popular for both
practitioners and researchers.
Web Analytics: is the measurement, collection, analysis and reporting of web data for purposes of understanding and optimizing
web usage.
Web Hosting: is a type of Internet hosting service that allows individuals and organizations to make their website accessible via the
World Wide Web.
Web Performance Management: measurement of a website or web service's ability to respond efficiently to end-user interactions
Appendices

98
[Copy of PDF survey here]