Embed Size (px)
Citation preview

The U.S. Automotive Market
Gloria Bergquist Vice President, Alliance of Automobile Manufacturers

U.S. Sales: Recovered from Recession Lows
2,000,000
4,000,000
6,000,000
8,000,000
10,000,000
12,000,000
14,000,000
16,000,000
2007 2008 2009 2010 2011 2012 2013 2014
14.8 13.0
11.8 10.6
13.5
15.9 16.4 16.4
Projection
Source: Ward’s Automotive The record for U.S. auto sales was 17.8 million in 2000

2015 U.S. Sales Forecast Looks Higher
17.4 Million
17 Million
16.7 Million
With a forecast average of 17.03 million sales in the U.S., this will be the most autos sold since 2003 (16.96 million)

U.S. Market Share by Manufacturer
GM 17.97% Ford
15.76%
Toyota 14.46%
Chrysler 11.55%
Honda 9.84%
Nissan 8.03%
Hyundai 4.62%
Kia 3.41%
Subaru 2.71%
Volkswagen 2.61%
BMW 2.41% Daimler 2.21% Mazda 1.81% Audi 1.00%
Jaguar Land Rover 0.40%
Mitsubishi 0.40% Volvo
0.40% Porsche 0.30%
Tesla 0.10% Source: Ward’s Automotive, 2013 Sales

More Countries are Importing Auto Products from the U.S.
A decade ago, 68 countries imported substantial amounts of American auto products ($10 million or more). In 2013, 105 countries imported $10 million+ of auto goods from the U.S.

Auto Exports Have Doubled in Dollar Value
In 2013, exports of cars and parts valued at $100 billion were shipped from U.S. ports—almost double the $50.8 billion of auto products exported from the U.S. a decade earlier.

U.S. Auto & Parts Exports by Region

Green Cars

More High-Mileage Autos Available to Consumers Models Achieving 30 MPG or More (Highway): 2006-2014
Number of 30+ MPG models on sale
0
100
200
300
400
500
2006 2007 2008 2009 2010 2011 2012 2013 2014
552% 450
69
Source: FuelEconomy.gov
Mod
els o
n Sa
le

Crossover Utility
Vehicles
Pickups
SUV Van
U.S. Vehicle Sales By Segment (2013)
48.4% 51.6%
Source: Ward’s Automotive
Car
Gas is down from $4 a gallon to $3.25 a gallon
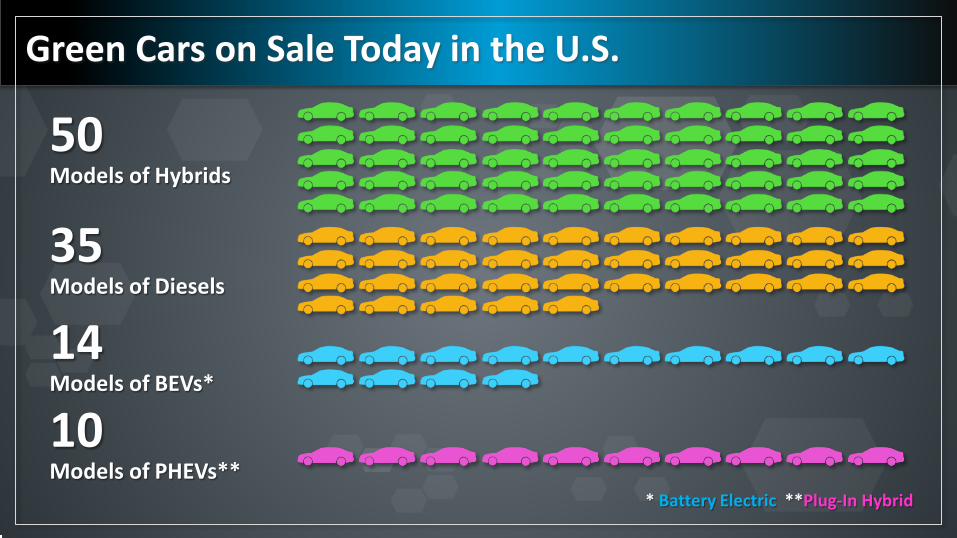
Green Cars on Sale Today in the U.S.
50 Models of Hybrids
35 Models of Diesels
14 Models of BEVs*
10 Models of PHEVs**
* Battery Electric **Plug-In Hybrid

Sales Rise: Hybrids, Diesels and Electric Vehicles
0
10
20
30
40
50
60
Num
ber O
f Mod
els A
vaila
ble
Increase in Alternative Fuel Models: 2006 - 2014
Hybrid Diesel
BEV
PHEV

Hybrid Sales Grow but Still Low
0100,000200,000300,000400,000500,000600,00020
0020
0120
0220
0320
0420
0520
0620
0720
0820
0920
1020
1120
1220
13
U.S. Hybrid Sales over 13 Years
Uni
ts S
old
1%
2%
3%
Hybrid Sales
Market Share
Source: Ward’s Automotive

2.80%
2.82%
2.84%
2.86%
2.88%
2.90%
380,000
390,000
400,000
410,000
420,000
430,000
440,000
450,000
460,000
2012 2013
Increase In Diesel Sales and Market Share: 2012-2013
Clean Diesel Vehicle Sales Grow but Still Low
Source: Ward’s Automotive Sales Market Share

Sales of EVs and PHEVs Grow but Still Low
0.00%
0.05%
0.10%
0.15%
0.20%
0.25%
0.30%
0.35%
0
10,000
20,000
30,000
40,000
50,000
60,000
2011 2012 2013
Plug-in HybridSales
Electric Sales
Plug-in HybridMarket Share
Electric MarketShare
Uni
ts S
old
Market Share
Source: Ward’s Automotive

The Gas Engine is Still the Top Choice
Source: Ward’s Automotive
Gas 94%
EV 0.3
PHEV 0.3
Hybrid 3.2
Diesel 2.1
Other 5.9
2013 U.S. Passenger Vehicles by % Power Type

Success with Gas Powertrains Inhibits Appetite to Switch
0%10%20%30%40%50%60%70%
May
'12
June
'12
July
'12
Aug
'12
Sept
'12
Oct
'12
Nov
'12
Dec
'12
Jan
'13
Feb
'13
Mar
'13
Apr '
13M
ay '1
3Ju
ne '1
3Ju
ly '1
3Au
g '1
3Se
pt '1
3O
ct '1
3N
ov '1
3De
c '1
3Ja
n '1
4Fe
b '1
4M
ar '1
4Ap
r '14
May
'14
June
'14
July
'14
Aug
'14
Sept
'14
What Type of Engine Will Your Next Vehicle Be Powered By?
Gasoline Hybrid Not Sure Diesel Electric
• Remarkable consistency over two years • Subtle increase in preference for gas • Subtle decrease in preference for hybrids
(37) (47)

MPG of New Passenger Vehicles By Vehicle Type
-
1,000,000
2,000,000
3,000,000
4,000,000
5,000,000
6,000,000
Passenger Vans
Pickups
Sport Utility
Passenger CarsTotal Over
30 Highway MPG Total Under
30 Highway MPG
52% of new vehicle sales get highway MPG of 30 miles+. Of the top body styles, 89% of passenger cars and 29% of SUVs sold this year get 30 highway MPG.
No pickups or passenger vans reach 30 highway MPG.

Making Autos Lighter: Aluminum
A recent study finds that every leading automaker will have numerous aluminum body and closure programs by 2025. As the material mix for body and closure parts continues to change dramatically in the years to come, use of aluminum sheet for vehicle bodies will increase to 4 billion pounds by 2025, from 200 million pounds in 2012.
2015 Ford F150 with Full Aluminum Body

Data Available to OICA Members
Access the 2014 Facts & Figures at www. wardsauto.com/autoalliance14
Use Promo Code: Facts14AA63