Embed Size (px)
Citation preview

1
The Urbanizing of Strategic GovernanceStrategic Governance
ComponentsSaskia Sassen
Columbia University.
• Openings:Th fi i l i iThe financial crisisScientific knowlege
• The urbanizing of economic activitiesCities are complex systems
• Mechanisms:
• From governmental to individual

2
Density- Mumbai
Density- NYC

3
Density- Shanghai
Density - London

4
Density- Mexico City
Density- Johannesburg

5
London (Population)
London (Workplace)

6
Sao Paulo (Population)
Sao Paulo (Workplace)

7
There is no perfect global city
• When firms go global they tend to locate operations in multiple cities that function asoperations in multiple cities that function as entry points into national economies.
• This bridging capacity is critical: the multiple circuits connecting major and minor global cities are the live infrastructure of the global economy. It indicates, again, that cities do not i l t ith h thsimply compete with each other.
• A global firm does not want one global city, even if it is the best in the world. Different groups of cities will be desirable to different types of firms, even if some of these cities may have some serious negatives. This helps
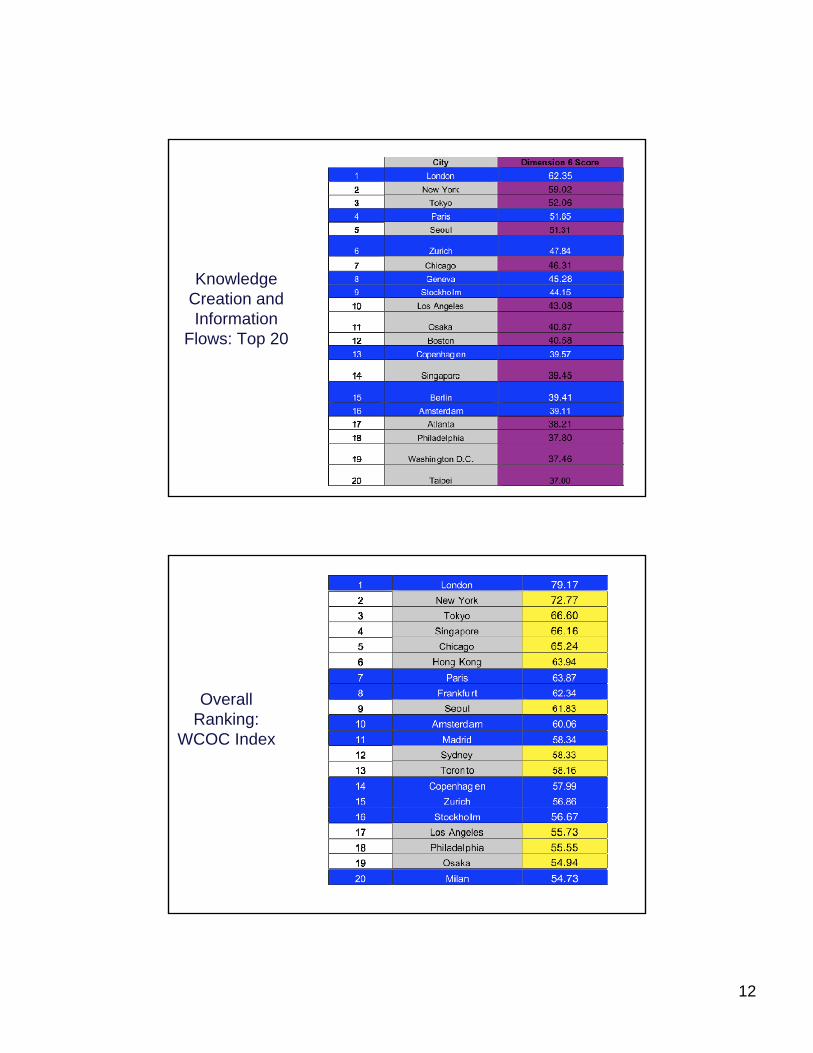
Overall Ranking:
WCOC Index, Top 20

8
None of the leading cities ranks at the top in everything.
• A large study of 75 cities rates the top cities for worldwide commerce. Not one of them ranks at the top in all of the 100 factors, and not one gets the perfect score of 100and not one gets the perfect score of 100.
• London and New York, the two leading global cities, rank low in several aspects – neither is in the top ten when it comes to starting a business, or closing a business.
• If we consider a critical variable in the ‘ease of doing business’ indicator, part of which is ‘ease of entry and exit’, London ranks 43rd and New York 56th London ranks 37th on ‘contract enforcement’and New York 56th. London ranks 37th on contract enforcement and 21st on ‘investor protection’.
• It is Singapore that ranks number one in relation to all three variables.
•
Indicator 3: Ease of Doing Business
• SubindicatorsSubindicators
• Starting a Business
• Employing Workers
• Getting Credit
• Closing a Business
Conventions/Exhibitions/MeetingsBanking ServicesEase of Entry and ExitInvestor Protection
• Conventions/Exhibitions/Meetings
Corporate Tax BurdenContract Enforcement

9
Ease of Doing
Business: Top 20
.
• In the global South, cities like Mumbai and Sã P l i th t f fi i lSão Paulo are in the top group for financial and economic services, but are brought down in their overall score by their low rankings in factors related to the ease of doing business and livability, given their especially low levels of well‐being for vast sectors of the population.

10
Indicator 4: Financial Dimension
• Subindicators• Financial Services Network:• Financial Services Network:
• Banking/Financial Services Companies
• Insurance Companies
• Investment/Securities Firms
• Total Value of Equities Trading
• Total Value of Bond Trading
• Total Number of Derivatives Contracts
• Total Number of Commodities Contracts
Financial Dimension:
Top 20

11
Indicator 5: Business Center Dimension
• Subindicators• Traffic Through City Ports
• Air Passenger and Aircraft Traffic Through City Airports
• Air Cargo Traffic Through City Airports
• International Air Passenger Traffic Through City Airports
• Volume of Commercial Real Estate Development
Business Center
Dimension: Top 20
12
Knowledge Creation and Information
Flows: Top 20
Overall Ranking:
WCOC Index

13
.
• Whether all of this is good or bad for the larger social fabric of these cities and theirlarger social fabric of these cities and their countries is a complex matter, and the subject of many debates.
• The fact that global firms need cities, and groups of cities, should enable the political, corporate and civic leadership in those citiescorporate and civic leadership in those cities to negotiate for more benefits for their cities from global firms.
.
• This could lead to overall positive outcomes if the governing classes can see that these globalgoverning classes can see that these global economic functions will grow better in a context of a strong and prosperous middle class rather than the sharp inequality and polarity that exists among a growing share of households.
• European global cities have done better than globalEuropean global cities have done better than global cities in the United States precisely for this reason.

14
.
• The trends in the new rising global cities of the South resemble trends of the North:the South resemble trends of the North: growing numbers of very rich and of very poor, and the impoverishment of the old middle classes.
• What there will be less of in these cities is the modest middle classes and the modest profitmodest middle classes and the modest‐profit making economic sectors that once were the major presence in these cities.
• Having a large middle sector is important for the urban economy because their earnings and profits are most likely to be fully spent in
New global frontiers for finance
• We should worry

15
When modest income neighborhoods become part of global finance
• 1. They key is that the source of profits for financial firms of sub‐prime and other mortgages for low‐ andfirms of sub prime and other mortgages for low and modest‐income households is NOT payment on the mortgage.
• The source of profits is the bundling of a large number of these mortgages to sell them on to investors, including banks and foreign investors. It worked because they were mixed up with highworked because they were mixed up with high quality debts of all sorts.
• Credit‐worthiness of
Table 1: Ratio Residential Mortgage Debt to GDP (Select countries/end 2006)
Source: http://www.germany‐re.com/files/00034800/MS%20Housing%20Report%202007.pdf

16
Table 2: Ratio Residential Mortgage Debt to GDP: Emerging Asia
Source: Warnock, Veronica Cacdac and Warnock, Francis E.,Markets and Housing Finance(February 2008). Available
at SSRN: http://ssrn.com/abstract=981641, retrieved 24 August 2008.
Table 8: Ratio of Household Credit to Personal Disposable Income (2000-05)2000 2001 2002 2003 2004 2005
Emerging Markets
Czech Republic 8.5 10.1 12.9 16.4 21.3 27.1
Hungary 11.2 14.4 20.9 29.5 33.9 39.3
Poland 10.1 10.3 10.9 12.6 14.5 18.2
India 4.7 5.4 6.4 7.4 9.7 …
Korea 33.0 43.9 57.3 62.6 64.5 68.9
Philippines 1.7 4.6 5.5 5.5 5.6 …
Taiwan 75.1 72.7 76.0 83.0 95.5 …
Thailand 26.0 25.6 28.6 34.3 36.4 …
Mature Markets
Australia 83.3 86.7 95.6 109.0 119.0 124.5
F 57 8 57 5 58 2 59 8 64 2 69 2France 57.8 57.5 58.2 59.8 64.2 69.2
Germany 70.4 70.1 69.1 70.3 70.5 70.0
Italy 25.0 25.8 27.0 28.7 31.8 34.8
Japan 73.6 75.7 77.6 77.3 77.9 77.8
Spain 65.2 70.4 76.9 86.4 98.8 112.7
United States 104.0 105.1 110.8 118.2 126.0 132.7
Source: IMF Staff estimates based on data from country authoriies, CEIC, OECD, and Bloomberg

17
Table 11: Share of Foreign‐Currency‐Denominated Household Credit, End‐2005 (In percent of total household credit)
Source: IMF 2006. “Global Financial Stability Report: Market Developments and Issues.” IMF: World Economic and Financial Surveys. September, 2006. Retrieved August 26, 2008. [http://www.imf.org/external/pubs/ft/GFSR/2006/02/pdf/chap2.pdf] p. 54
Table 13: Rate of Subprime Lending by Borough, 2002 - 2006
2002 2003 2004 2005 2006
Bronx 14.2% 19.7% 28.2% 34.4% 27.4%
Brooklyn 9.2% 13.9% 18.4% 26.1% 23.6%
Manhattan 1.3% 1.8% 0.6% 1.1% 0.8%
Queens 7.7% 12.6% 17.8% 28.2% 24.4%
Staten Island 7.2% 11.1% 13.9% 19.9% 17.1%
NYC Total 7.0% 10.8% 14.9% 22.9% 19.8%Source: Furman Center for Real Estate & Urban Policy, 2007

18
Table 15: Rate of Subprime Lending by Race in New York City, 2002 - 2006
2002 2003 2004 2005 2006
White 4.6% 6.2% 7.2% 11.2% 9.1%
Black 13.4% 20.5% 35.2% 47.1% 40.7%
Hispanic 11.9% 18.1% 27.6% 39.3% 28.6%
Asian 4.2% 6.2% 9.4% 18.3% 13.6%
Source: Furman Center for Real Estate & Urban Policy, 2007
Table 20
•*Income is defined as market income but excludes capital gains•Source: Mishel, L. 2004. “Unfettered Markets, Income Inequality, and Religious Values.” Viewpoints. May 19, 2004. Economic Policy Institute. Retrieved July 26, 2008 [ www.epi.org/content.cfm/webfeatures_viewpoints_moral_markets_presentation.] [kgb1]

19
Expeditie zuidas
Job cohenJob cohen
Harry starren
Burgemeester Amsterdam
???