Embed Size (px)
Citation preview

The upper mountain forest and tree responseto climate change in south Siberian Mountains
Vyacheslav I. Kharuk, and K. Jon Ransony ,
Forest Monitoring Lab,Sukachev Institute of Forest,Krasnoyarsk, RussiaNASA’s Goddard Space Flight CenterGreenbelt, MD 20771
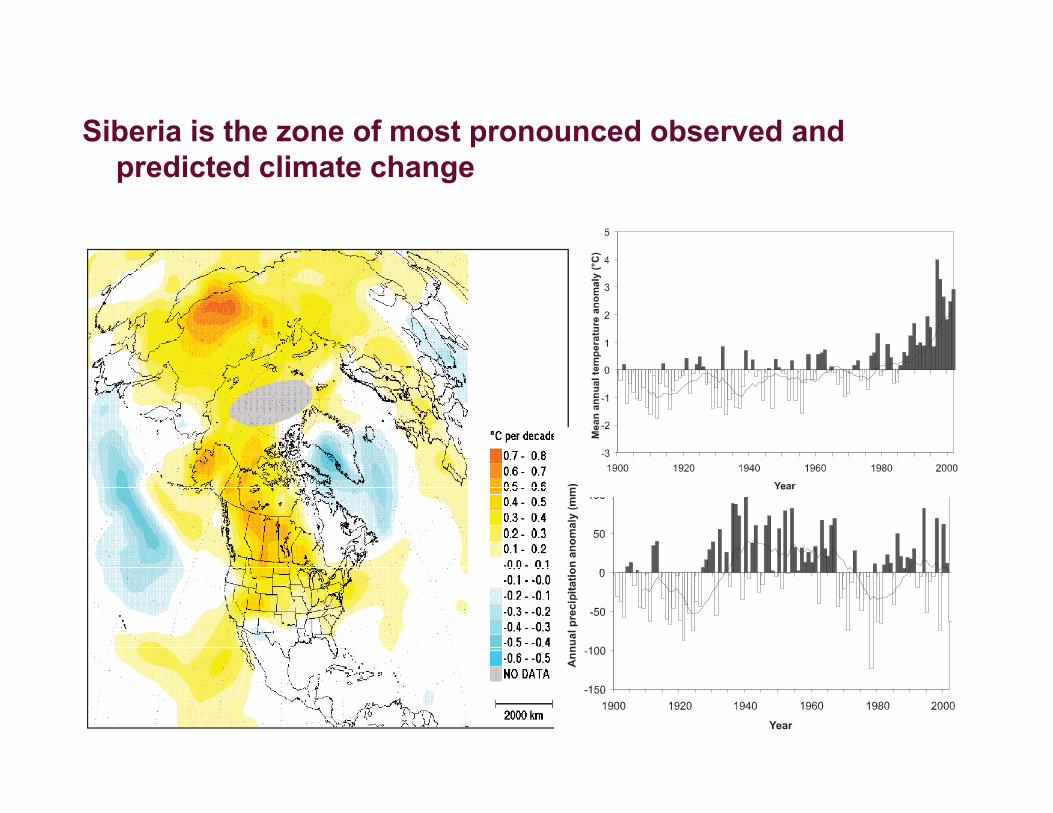
Siberia is the zone of most pronounced observed andpredicted climate change

Tree response to climate change is primarilyexpected in the areas where temperature andprecipitation limits growth, e.g., in alpine forest-tundra ecotone.

The area of investigationIs the upper elevation forests andforest-tundra ecotone ofAltai - Sayan Mountain country.This is the southern border ofSiberian taiga andMongolian steppes and deserts

The purpose of this report is to address thefollowing questions:1. How has tree line changed during the last millennium?2. How does forest response to climate variables depend on
topography?3. How do the main tree species (Larix sibirica and Pinus
sibirica) respond to climate change?

Study was based on in situ measurements withinelevation transects,time series of satellite data and forest maps,dendrochronology data,and DEM.The study parameters wereapical and radial increments,tree natality/mortality,tree physiognomy,regeneration abundanceand age structure.

The study area is a zone ofSiberian larch and
Siberian pine contact.
These species differ in precipitation sensitivity.Larch can survive at semi desert level ofprecipitation (~ 250 mm/yr), whereas Siberian pine isprecipitation sensitive and has optimal growth withprecipitation sensitive, and has optimal growth withprecipitation level >1000 mm/yr.Life span of Larix sibirica and Siberian pine withinstudy area is 600 -700 yr and 400 - 500 yr,respectively.

ResultsI. The tree line evolutionSeveral tree lines were defined and georeferenced.
1. The historical tree line(i.e., highest tree line during last millennium)was marked by subfossil trees.
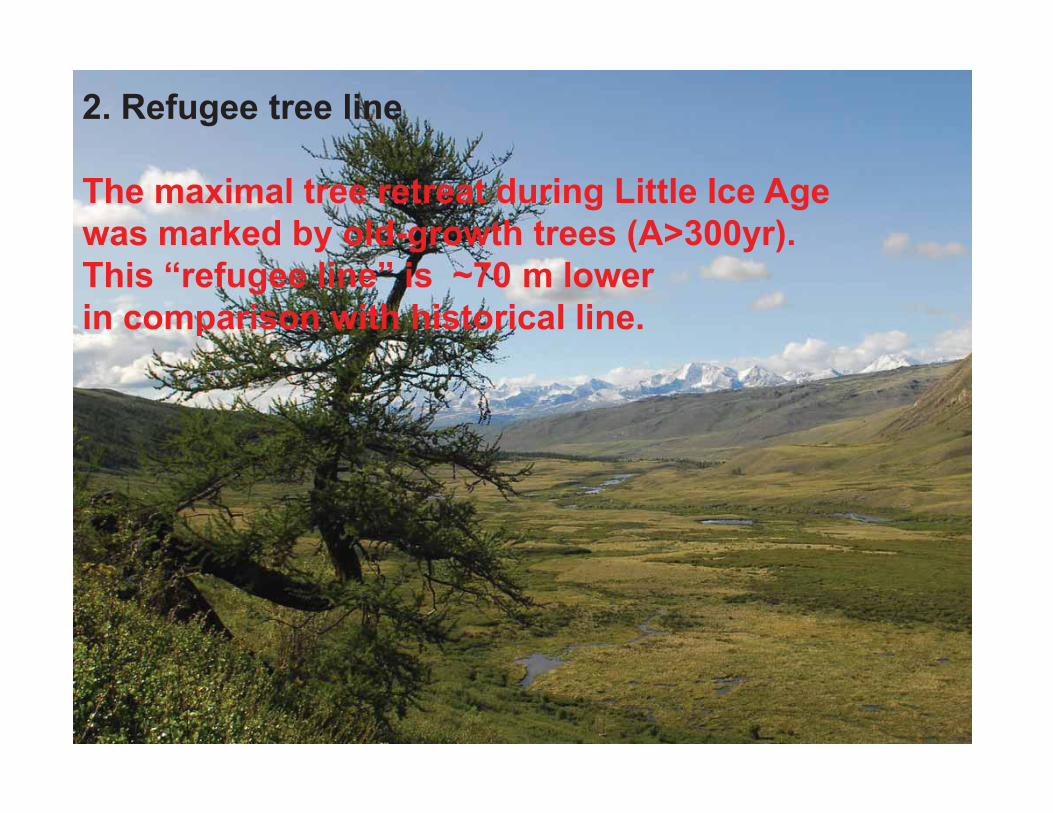
2. Refugee tree line
The maximal tree retreat during Little Ice Agewas marked by old-growth trees (A>300yr).This “refugee line” is ~70 m lowerin comparison with historical line.

3. A current tree line
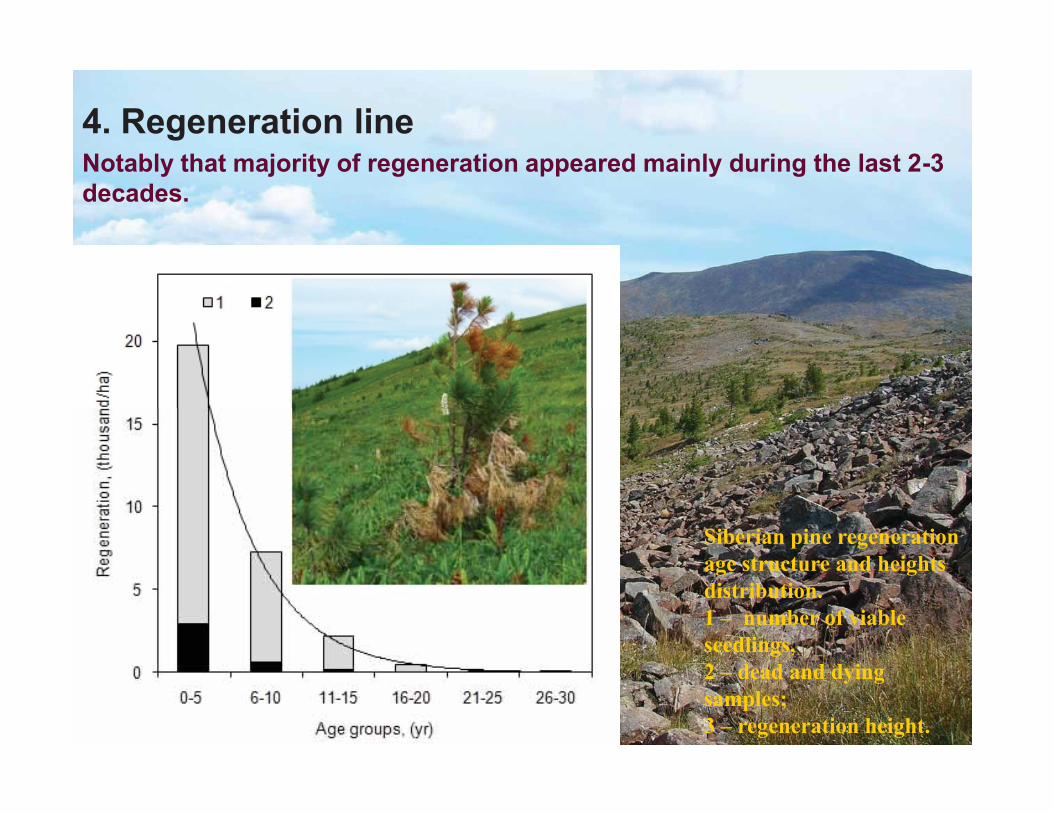
4. Regeneration lineNotably that majority of regeneration appeared mainly during the last 2-3decades.
Siberian pine regenerationage structure and heightsdistribution.1 – number of viableseedlings,2 – dead and dyingsamples;3 – regeneration height.

Tree line evolution during last millennium
Tree mortality was observed during Little Ice Age. The new treeestablishment wave Appeared at the end of the 19th century.

Since 19th century treeswere“diffusing” into tundraarea

A mean rate of tree line migration into the alpinetundra during the last century was about1.0 m/yr;
past three decades of warming increasedmigration rate to 2.5 m/yr.

In the beginning of 21st century tree line surpassedits historical record by 20 m; regeneration linesurpassed it by about 80-100 m

Siberian pine and larch now surviveat elevations up to 150 m higherin comparison with the maximumtree line retreat during Little IcePeriod.

Warming (+1.2ºC) was observed mainly during thewinter .
Winter temperatures increase promotesregeneration recruitment by reducing stem andneedles desiccation and snow abrasion.

II. Changes in tree physiognomy(prostrate vs. arboreal )
A wide-spread transformationof krummholz into arborealforms has been observed.The beginning of this processoccurred in the mid 1980s.

These changes intree morphologycoincide withsimilar events onthe western end ofEurasia,in Swedish Scandia(Kullman, 2007).
This indicates theEurasian scale ofthe phenomena,caused sometemperaturethreshold “trigger”effect.

III. Climate-driven forest response andtopography
1500
2000
2500
3000
3500
Elevation (m)
ain
crem
ent (
%)
40
50
60
70
80
90
100
ain
crem
ent (
ha)
2002 1983 1960
Year
0
500
1000
1800-1900
1900-2000
2000-2100
2100-2200
2200-2300
2300-2400
Elevation (m)
Are
a
0
10
20
30
40
Are
a 2002 1983 1960
Year
The forest area increment dependence on elevation. 1 – total areaincrement (ha) (2002 vs 1960 yr); 2, 3 – area increment in percents (2002 vs1960 yr and 2002 vs 1983 yr, respectively).

10
15
20
25
Elevation (m)
Slop
e (º
)
1960 1983 2002
0
5
1800-1900
1900-2000
2000-2100
2100-2200
2200-2300
2300-2400
2400-2500
Elevation (m)
Slop
e (º
)
Terrain
The dependence of “slope steepness medians” on elevation. Plotted values aremedian steepness values for forested slopes over a range of elevations for 1960,1983, and 2002. For comparison the median slope value for all terrain in thestudy area (i.e. forested and non-forested) is shown.

150
200
250
300
350
Slope (º)
ea in
crem
ent (
%)
1900-20002100-22002300-2400
Elevation (m)
0
50
100
0 5 10 15 20 25 30 35Slope (º)
Are
1900-20002100-22002300-2400
Elevation (m)
Forest area increment dependence on slope steepness (2002 vs. 1960 yrs.).

Winds impact at least asimportant
as temperature for treesurvival
at upper limit due todesiccation and snowabrasion
Distribution of forests with respect to azimuth. The radius-vector shows thedominant direction of forest distribution. Areas of forest for a given year areproportional to the areas within the boundaries.

Winds forms a “flag-like”Winds forms a flag likecrown shape, andcaused minimal radialincrement on the wind-ward side
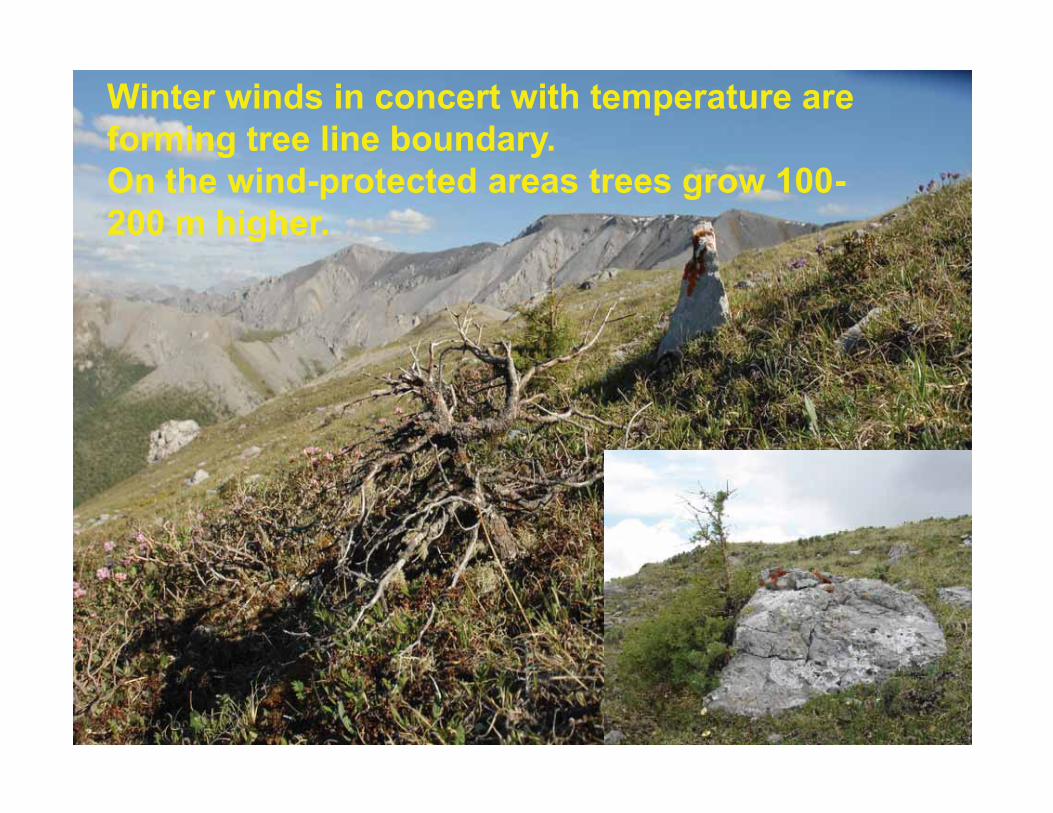
Winter winds in concert with temperature areforming tree line boundary.On the wind-protected areas trees grow 100-200 m higher.
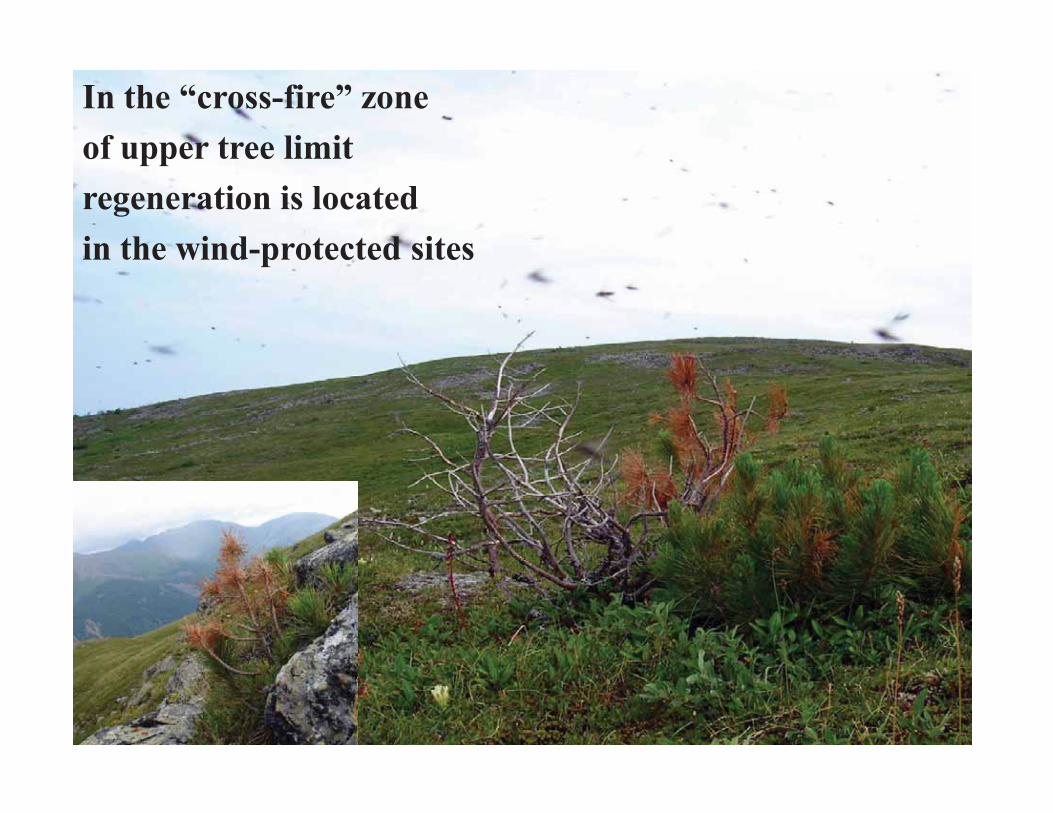
In the “cross-fire” zoneof upper tree limitregeneration is locatedin the wind-protected sites

IV. Larch vs Siberian pine reaction toclimate change
Larch surpasses Siberian pine in arid zone,
whereas withprecipitation increaseSiberian pine getscompetitiveadvantages

Larch surpasses Siberian pinein its cold and wind resistance,and is growing arboreal where pine is still prostrate

…whereas Siberian pineresponse to warming isstronger, than larch(as tree incrementdynamics showed).
Dynamics of apical and radial increments of Siberian pine and larch.Siberian pine: 1 –- apical increment, 2 -- radial increment.Larch: 4 –- radial increment.3, 5 –- pre-warming period.

With temperature and precipitation increaseSiberian pine is increasing its proportion withinupper elevation belt.
It is notable that similar changes are predicted in theEuropean Alps: increasing proportion of Pinus cembra(which is, like P. sibirica, is a five-needle pine)
vs. L. decidua at higher altitudes (Bugmann et al, 2005).

Conclusions1. A temperature increase of 1Сº allows regeneration
to occupy areas 10-- 40 m higher in elevation.Winter temperatures increase is essential forregeneration recruitment.

2. A mean rate of tree line migration into the alpinetundra during the last century was about 1.0 m/yr.Past three decades of warming increasedmigration rate to 2.5 m/yr.

3. Siberian pine and larch trees now survive atelevations up to 150 m higher in comparison withthe maximum observed tree line retreat during thelast millennium, and surpass the upper historicalline up to 80-100 m.

4. Forest response to warming strongly depends onelevation, azimuth, and slope steepness.Warming promotes tree migration to areas lessprotected from winter desiccation and snowabrasion.

5. A warming climate provides competitiveadvantages to Siberian pine in comparison withlarch in areas with sufficient precipitation.Increased Siberian pine proportion, as well as treegrowth and migration into alpine will also decreasealbedo, which may increase warming at the regionallevel.

6. Climate-induced forest responsesignificantly modified the spatial patterns ofhigh elevation forests in southern Siberiaduring the last four decades.

Thank you!