Embed Size (px)
Citation preview
The Unpaid Care Work and the Labour Market. An analysis of time use data based on the latest World Compilation of Time-use SurveysJacques Charmes
ILO
The
Unp
aid
Care
Wor
k an
d th
e La
bour
Mar
ket.
An a
naly
sis
of ti
me
use
data
bas
ed o
n th
e la
test
Wor
ld C
ompi
latio
n of
Tim
e-us
e Su
rvey
s
Gender, Equality and Diversity & ILOAIDS Branch
Copyright © International Labour Organization 2019 First published (2019) Publications of the International Labour Office enjoy copyright under Protocol 2 of the Universal Copyright Convention. Nevertheless, short excerpts from them may be reproduced without authorization, on condition that the source is indicated. For rights of reproduction or translation, application should be made to ILO Publications (Rights and Licensing), International Labour Office, CH-1211 Geneva 22, Switzerland, or by email: [email protected]. The International Labour Office welcomes such applications.
Libraries, institutions and other users registered with a reproduction rights organization may make copies in accordance with the licences issued to them for this purpose. Visit www.ifrro.org to find the reproduction rights organization in your country. The Unpaid Care Work and the Labour Market. An analysis of time use data based on the latest World Compilation of Time-use Surveys / Jacques Charmes; International Labour Office – Geneva: ILO, 2019. ISBN: 978-92-2-133516-0 (print); 978-92-2-133517-7 (web pdf) The designations employed in ILO publications, which are in conformity with United Nations practice, and the presentation of material therein do not imply the expression of any opinion whatsoever on the part of the International Labour Office concerning the legal status of any country, area or territory or of its authorities, or concerning the delimitation of its frontiers.
The responsibility for opinions expressed in signed articles, studies and other contributions rests solely with their authors, and publication does not constitute an endorsement by the International Labour Office of the opinions expressed in them.
Reference to names of firms and commercial products and processes does not imply their endorsement by the International Labour Office, and any failure to mention a particular firm, commercial product or process is not a sign of disapproval.
Information on ILO publications and digital products can be found at: www.ilo.org/publns.
Printed in Switzerland

2
The Unpaid Care Work and the Labour Market. An analysis of time use data based on the latest World
Compilation of Time-use Surveys Jacques Charmes
3
Preface
In the coming years, the need for care work is likely to increase due to demographic, socio-
economic and environmental transformations. Across the world, unpaid carers, especially
women, meet the large majority of care needs. For an analysis of unpaid care work, time-
use data are one of the most important data sources to look at, especially considering the
important gender dimension of its work. How much time do people spend on doing paid
and unpaid care work? How do women and men spend their time differently on unpaid
care work? Are there any differences in time use among the regions? How do socio-
economic factors influence people’s choices to do paid and unpaid care work?
To address these questions, the Unpaid Care Work and Labour Market: An Analysis of
Time Use Data on the Latest World Compilation of Time-use Surveys provides a
comprehensive overview of the extent, characteristics and historical trends of unpaid
care work based on the analysis of the most recent time-use surveys carried out at the
national level across the world. By discussing the concepts and methodological
approaches which underlie the analysis of time-use data, this research paper shows the
differences in time spent on unpaid care work between women and men and among
people with different socioeconomic characteristics: geographical location, age group,
educational level, activity status, employment status, income group, marital status and
presence and age of children in the household.
Through examining the trends in time spent on paid and unpaid care work over the last
twenty years, this paper shows that women have unequal accesses to the labour market
due to a significant extent to the disproportionate amount of time they spend on unpaid
care work. Across the world, without exception, women carry out three-quarters of
unpaid care work, or more than 75 per cent of the total hours provided. Women dedicate
on average 3.2 times more time than men to unpaid care work. There is no country where
women and men perform an equal share of unpaid care work. As a result, women are
constantly time poor, which constrains their participation in the labour market. The
paper highlights the importance of collecting and publishing sex-disaggregated data and
calls for more robust methodologies to harmonize and improve the comparability of time-
use survey data across countries.
The Unpaid Care Work and Labour Market: An Analysis of Time Use Data on the Latest
World Compilation of Time-use Surveys is part of a series of papers that was
commissioned as background research for the major ILO report Care work and care jobs
for the future of decent work. This major report and related research build a compelling
and evidence-based case for placing good quality care work as a priority in
macroeconomic, social protection, labour and migration policy agendas. These
publications represent an important contribution to the ILO’s women at work centenary
initiative, which has been examining why progress in closing the gender gaps in the world
of work has been so slow and what needs to be done for real transformation. It has also

4
been identifying innovative action to guide work on gender equality and non-
discrimination as the ILO enters its second centenary.
Shauna Olney Chief Gender, Equality and Diversity & ILOAIDS Branch Conditions of Work and Equality Department

5
Acknowledgements This research paper was authored by Jacques Charmes. Inputs were provided by Laura
Addati (GED&ILOAIDS), Umberto Cattaneo (GED&ILOAIDS), Valeria Esquivel (EMPLAB),
Monica Castillo (STATISTICS), Elisa Benes (STATISTICS), Kieran Walsh (STATISTICS). We
would like to thank Nancy Folbre for her kind review and valuable inputs. We are also
grateful to Mai Hattori (GED&ILOAIDS) for her support in the publication of this paper.
6
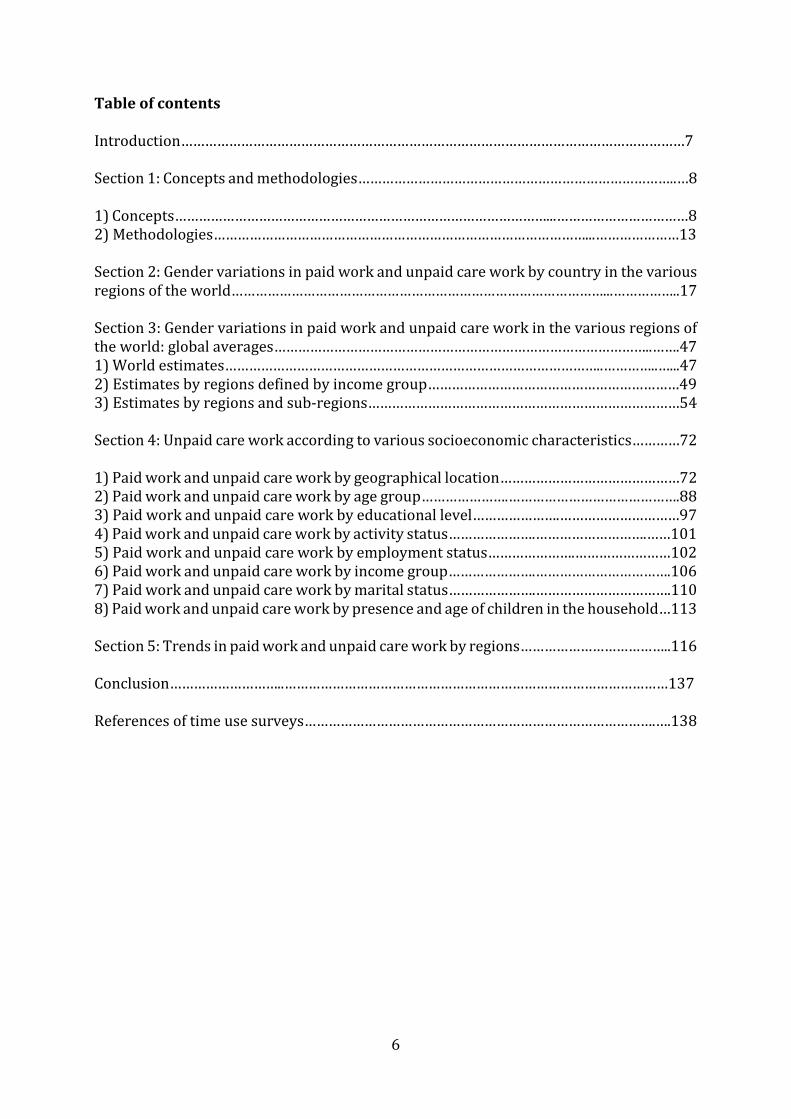
Table of contents Introduction………………………………………………………………………………………………………………7 Section 1: Concepts and methodologies……………………………………………………………………..…8 1) Concepts…………………………………………………………………………………...……………………………8 2) Methodologies…………………………………………………………………………………...…………………13 Section 2: Gender variations in paid work and unpaid care work by country in the various regions of the world…………………………………………………………………………………...……………..17 Section 3: Gender variations in paid work and unpaid care work in the various regions of the world: global averages…………………………………………………………………………………..…….47 1) World estimates…………………………………………………………………………………..…………..…...47 2) Estimates by regions defined by income group………………………………………………………49 3) Estimates by regions and sub-regions……………………………………………………………………54 Section 4: Unpaid care work according to various socioeconomic characteristics…………72 1) Paid work and unpaid care work by geographical location………………………………………72 2) Paid work and unpaid care work by age group………………….…………………………………….88 3) Paid work and unpaid care work by educational level………………….…………………………97 4) Paid work and unpaid care work by activity status………………….……………………….……101 5) Paid work and unpaid care work by employment status………………….……………………102 6) Paid work and unpaid care work by income group………………….…………………………….106 7) Paid work and unpaid care work by marital status………………….…………………………….110 8) Paid work and unpaid care work by presence and age of children in the household…113 Section 5: Trends in paid work and unpaid care work by regions………………………………..116 Conclusion………………………..……………………………………………………………………………………137 References of time use surveys…………………………………………………………………………….….138
7
Introduction The present exercise is a tentative compilation of data on unpaid work and more specifically on unpaid care work based on the systematic analysis of the most recent time-use surveys carried out at national level across the various regions of the world. It has not been attempted to gather micro data of all surveys – a too long-standing and lasting task ending with a too little number of countries – but rather to rely on existing official publications from the National Statistical Offices or Technical Departments, currently available on the websites of these institutions. While our previous work for the 2015 Human Development Report (Time use across the world. Findings of a world compilation of time-use surveys, Working paper for the Human Development report 2015, New York, UNDP-HDRO, 90p. http://www.hdr.undp.org/en/content/time-use-across-world-findings-world-compilation-time-use-surveys) focussed on unpaid care work analysed globally and by sex at national and regional levels, the present report attempts to analyse unpaid care work by sex and by socio-economic characteristics: geographical location (urban-rural), age groups, marital status, education level, activity status, employment status, income group, and presence and age of children in the household. It also attempts to analyse trends over time, as many countries have repeated their time-use surveys, sometimes on more than 5 decades. These are the main socio-economic characteristics that are the most significant for labour market analyses and that are the most widely available in the publications. There are many other characteristics that would be of interest for the analysis of unpaid care work. Yet, one of the findings of the present compilation is to highlight the fact that many countries have carried out such surveys without having the sense of the necessity of engendering time-use statistics: for example, the time-use tabulations are not systematically disaggregated by sex. Sex remains a variable like the others – one of many analytical dimensions – instead of being cross-tabulated with all other dimensions. The short list of variables selected for this report (geographical location, age group, educational level, marital status, activity status, employment status, income group, presence and age of children), was tentatively gathered. The number of countries varies depending on the variable. Still they are far from being easily comparable, because the harmonisation process seems to have not yet started, a supplementary evidence of the underutilisation of time-use data. The present work intends to be a step toward a better sensitisation of users as well as producers towards a more complete utilisation of time-use data. In a first section we will first recall the concepts and methodologies on which the analysis of time use is based. A second and third section will show the gender variations in paid and unpaid work in the various regions of the world and the global estimates. The fourth section will proceed to the analysis of unpaid work according to various socio-economic characteristics across regions. Finally, section five will present trends over the last twenty years.

8
Section 1: Concepts and methodologies 1) Concepts The present study measures the unpaid care work as captured by time-use surveys. The unpaid care work is based on the definition of the Non-SNA work in the System of National Accounts (SNA) in its 1993 and 2008 revisions. Work is a generic term covering all activities said to be productive and as such falling within the “general production boundary”. The productive activities satisfy the “third-party criterion” (or “third person criterion”) that was firstly defined by Alfred Marshall in its “Economics of Industry” in 1879 where he pointed out “all other services which one person may be hired to perform for another”, then put into discussion among the economists by Margaret Reid in her “Economics of Household Production” in 1934 where she states that “if an activity is of such character that it might be delegated to a paid worker, then that activity shall be deemed productive”. The SNA production boundary is more restrictive and includes “all production actually destined for the market, whether for sale or barter. It also includes all goods or services provided free to individual households or collectively to the community by government units or Non-Profit Institutions serving households. (…). The SNA therefore includes all production of goods for own use within its production boundary, as the decision whether goods are to be sold or retained for own use can be made even after they have been produced, but it excludes all production of services for own final consumption within households (except for the services produced by employing paid domestic staff and the own-account production of housing services by owner-occupiers).” (SNA, 2008, §§ 1.40-1.42). Therefore the unpaid care work includes all non-SNA productive activities falling within the general production boundary. Following the Guide to Producing Statistics on Time Use: Measuring Paid and Unpaid Work (United Nations Statistical Division, 2004)1 and the International Classification of Activities for Time-Use Statistics (ICATUS)2 unpaid care work and paid work can be defined as follows:
Unpaid care work (or non-SNA work activities) consists in the three categories of the classification: - Providing unpaid domestic services for own final use within households (06); - Providing unpaid caregiving services to household members (07); - Providing community services and help to other households (08).
Paid work (or SNA work activities) is defined as comprising:
1 https://unstats.un.org/unsd/publication/SeriesF/SeriesF_93E.pdf 2 The new ICATUS 2016 (https://unstats.un.org/unsd/demographic-social/time-use/icatus-2016/) now distinguishes, in accordance with the 19th ICLS : Unpaid domestic services for household and family members (3); Unpaid caregiving services for household and family members (4); Unpaid volunteer, trainee and other unpaid work (5). And for SNA work: employment and related activities (1); production of goods for own final use (2). However this new classification has not been applied yet
9
- Work for corporations/quasi-corporations, non-profit institutions and government (formal sector work) (01) - Work for household in primary production activities (02) - Work for household in non-primary production activities (03) - Work for household in construction activities (04) - Work for household providing services for income (05)
Reference to the SNA plays a major role in time-use statistics because one of the objectives of such data collection is to build satellite accounts of household production that come and complement the central framework of the national accounts. Reference to the labour force concepts is not less important as time-use surveys collect data on time spent in employment. Since their conception, there has been a close link between the concepts of labour force and employment on one hand, and the scope of production activities as measured by the National Accounts on the other. From 1982 to 2013, the "employed" was defined by international statistics standards adopted by the International Conference of Labour Statisticians (ICLS) as comprising all persons above a specified age who during a specified brief period were either in paid employment or in self-employment. Prior to 2013 there was a one-to-one correspondence between the productive activities of the employed and the production boundary as defined by the United Nations System of National Accounts (SNA). Currently, employment is a much narrower concept capturing work for pay or profit only, as per Resolution 1 of 19th ICLS in 2013. Yet, it should be noted that the definitions adopted in the TUS this report is based on in all cases utilize the pre-19th ICLS definition of employment. As a matter of fact, before the adoption of the new standards in 2013, measurement of employment was intended to include work for pay or profit as well as some forms of unpaid work (included in SNA work activities). However, the unpaid forms of work that were included as part of employment prior to 2013 such as own-use production of goods, where the production was intended for own use (e.g. subsistence farming), could be excluded from measurement if they were not deemed to represent an important contribution to household consumption. As a result, these activities were poorly captured or not at all measured to estimate employment in labour force surveys. This meant that workers engaged in subsistence farming were not well-identified or monitored for policy purposes. Attempts to use the results of time-use surveys for a better capture of women’s SNA activities in countries where female labour force participation rates are low have turned short. Similarly, until 2013 there were no international statistical standards to define work in own-use provision of services or volunteer work, so that work such as unpaid care work in one’s own household or volunteer care work for other households even when captured was not measured in any consistent way. And as the SNA (2008) puts it: “The location of the production boundary in the SNA is a compromise, but a deliberate one that takes account of the needs of most users. In this context it may be noted that in labour force statistics economically active persons are defined as those engaged in productive activities as defined in the SNA. If the production boundary were extended to include the production of personal and domestic services by members of households for their own
10
final consumption, all persons engaged in such activities would become self-employed, making unemployment virtually impossible by definition. This illustrates the need to confine the production boundary in the SNA and other related statistical systems to market activities or fairly close substitutes for market activities”. Although water and wood fetching have long been considered as production of goods by the System of National Accounts and thus an economic activity, most labour force surveys did not count them as part of the activities to identify the employed. The 2006 Integrated Labour Force Survey of the United Republic of Tanzania was one exception 3 . More common has been for countries to measure these activities separately from employment or to not measure them at all. In this report these activities - where measured - have been included in “paid work” as part of SNA productive activities. In an attempt to reconcile these various conceptions and definitions, the 19th International Conference of Labour Statisticians (ICLS 2013) recognised “the need to revise and broaden the existing standards in order to enable better statistical measurement of participation of all persons in all forms of work and in all sectors of the economy (…) in particular (…) to estimate volume of work or labour input for national production accounts, including existing ‘satellite’ accounts, and the contribution of all forms of work to economic development, to household livelihoods and to the well-being of individuals and society”. Resolution I adopted by the Conference identifies – for separate measurement- “five mutually exclusive forms of work:
(a) own-use production work comprising production of goods and services for
own final use;
(b) employment work comprising work performed for others in exchange for pay
or profit;
(c) unpaid trainee work comprising work performed for others without pay to
acquire workplace experience or skills;
(d) volunteer work comprising non-compulsory work performed for others
without pay;
(e) other work activities (not defined in this resolution)".
Chart 1 below presents the position of these various forms of work in relation with the
production boundaries of the System of National Accounts.
3 See section 5.7 of the national report of ILFS 2006, p.39: “As explained above, employment in the private sector was divided into four sub-sectors namely; agriculture, informal sector, household-related economic work and other private. Other household chores were excluded, but fetching water and collecting firewood activities were included in the category household-related economic work in line with the SNA.”
11
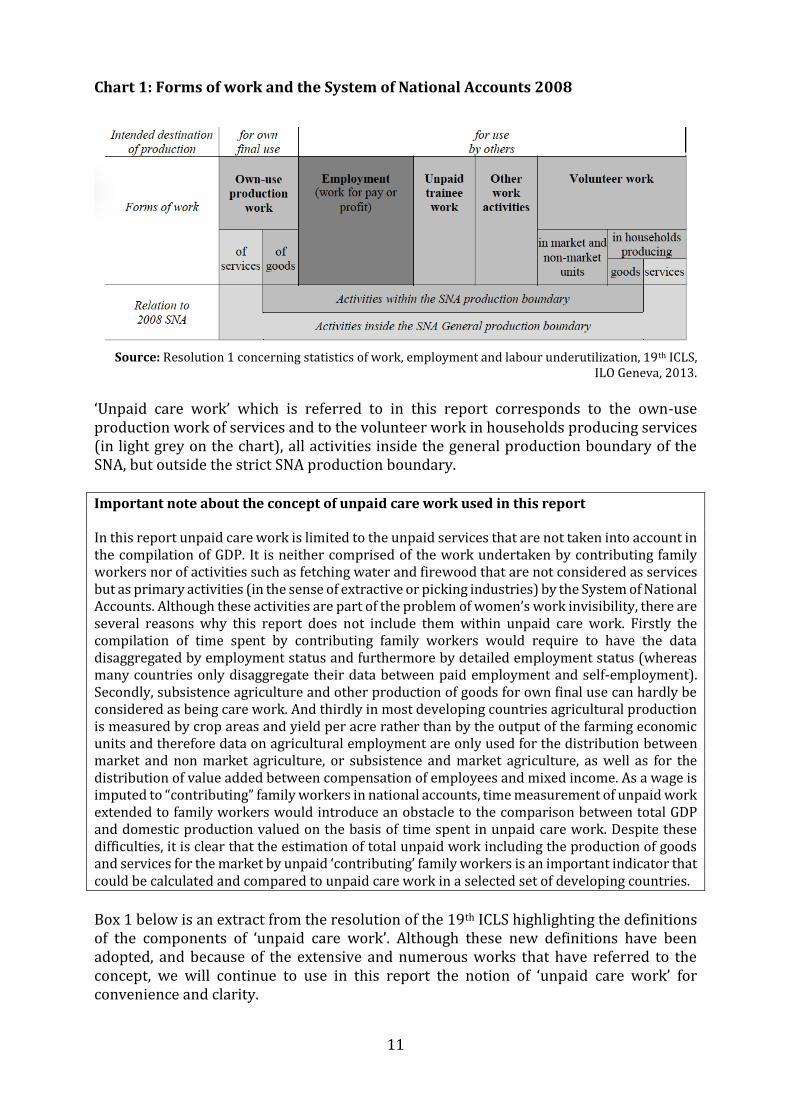
Chart 1: Forms of work and the System of National Accounts 2008
Source: Resolution 1 concerning statistics of work, employment and labour underutilization, 19th ICLS,
ILO Geneva, 2013.
‘Unpaid care work’ which is referred to in this report corresponds to the own-use production work of services and to the volunteer work in households producing services (in light grey on the chart), all activities inside the general production boundary of the SNA, but outside the strict SNA production boundary. Important note about the concept of unpaid care work used in this report In this report unpaid care work is limited to the unpaid services that are not taken into account in the compilation of GDP. It is neither comprised of the work undertaken by contributing family workers nor of activities such as fetching water and firewood that are not considered as services but as primary activities (in the sense of extractive or picking industries) by the System of National Accounts. Although these activities are part of the problem of women’s work invisibility, there are several reasons why this report does not include them within unpaid care work. Firstly the compilation of time spent by contributing family workers would require to have the data disaggregated by employment status and furthermore by detailed employment status (whereas many countries only disaggregate their data between paid employment and self-employment). Secondly, subsistence agriculture and other production of goods for own final use can hardly be considered as being care work. And thirdly in most developing countries agricultural production is measured by crop areas and yield per acre rather than by the output of the farming economic units and therefore data on agricultural employment are only used for the distribution between market and non market agriculture, or subsistence and market agriculture, as well as for the distribution of value added between compensation of employees and mixed income. As a wage is imputed to “contributing” family workers in national accounts, time measurement of unpaid work extended to family workers would introduce an obstacle to the comparison between total GDP and domestic production valued on the basis of time spent in unpaid care work. Despite these difficulties, it is clear that the estimation of total unpaid work including the production of goods and services for the market by unpaid ‘contributing’ family workers is an important indicator that could be calculated and compared to unpaid care work in a selected set of developing countries.
Box 1 below is an extract from the resolution of the 19th ICLS highlighting the definitions of the components of ‘unpaid care work’. Although these new definitions have been adopted, and because of the extensive and numerous works that have referred to the concept, we will continue to use in this report the notion of ‘unpaid care work’ for convenience and clarity.

12
Box 1: Definitions of the components of ‘unpaid care work’ by the Resolution concerning statistics of work, employment and labour utilization adopted by the 19th ICLS in 2013 Persons in own-use production work are defined as all those of working age who, during a short reference period, performed any activity to produce goods or provide services for own final use, where: (a) “any activity” refers to work performed in the various activities under paragraph 22(b) and (c) for a cumulative total of at least one hour; (b) production of “goods” (within the 2008 SNA production boundary) covers: (i) producing and/or processing for storage agricultural, fishing, hunting and gathering products; (ii) collecting and/or processing for storage mining and forestry products, including firewood and other fuels; (iii) fetching water from natural and other sources; (iv) manufacturing household goods (such as furniture, textiles, clothing, footwear, pottery or other durables, including boats and canoes); (v) building, or effecting major repairs to, one’s own dwelling, farm buildings, etc.; (c) provision of “services” (beyond the 2008 SNA production boundary but inside the General production boundary) covers: (i) household accounting and management, purchasing and/or transporting goods; (ii) preparing and/or serving meals, household waste disposal and recycling; (iii) cleaning, decorating and maintaining one’s own dwelling or premises, durables and other goods, and gardening; (iv) childcare and instruction, transporting and caring for elderly, dependent or other household members, etc.; (d) “for own final use” is interpreted as production where the intended destination of the output is mainly for final use by the producer in the form of capital formation, or final consumption by household members, or by family members living in other households: (i) the intended destination of the output is established in reference to the specific goods produced or services provided, as self-declared (i.e. mainly for own final use); (ii) in the case of agricultural, fishing, hunting or gathering goods intended mainly for own consumption, a part or surplus may nevertheless be sold or bartered. Persons in volunteer work are defined as all those of working age who, during a short reference period, performed any unpaid, non-compulsory activity to produce goods or provide services for others, where: (a) “any activity” refers to work for at least one hour; (b) “unpaid” is interpreted as the absence of remuneration in cash or in kind for work done or hours worked; nevertheless, volunteer workers may receive some small form of support or stipend in cash, when below one third of local market wages (e.g. for out-of-pocket expenses or to cover living expenses incurred for the activity), or in kind (e.g. meals, transportation, symbolic gifts); (c) “non-compulsory” is interpreted as work carried out without civil, legal or administrative requirement, that are different from the fulfilment of social responsibilities of a communal, cultural or religious nature; (d) production “for others” refers to work performed: (i) through, or for organizations comprising market and non-market units (i.e. organization- based volunteering) including through or for self-help, mutual aid or community-based groups of which the volunteer is a member; (ii) for households other than the household of the volunteer worker or of related family members (i.e. direct volunteering).
13
2) Methodologies Sources Time-use surveys are the main sources of data for the measurement of “unpaid care work”, comprised by own-use production work and volunteer work as defined above. Data collection on time spent in paid and unpaid work is still a challenge although the experience of time-use surveys is now rather long, especially in Europe. But the harmonisation of the methods of data collection is far from being achieved. Today, the most reliable and robust data on time-use are based on diaries (that is, the complete enumeration of activities during a 24-hour lapse time) and international classifications of time-use activities rather than on methodologies based on a set of various stylised questions on a reference period of a week. Recently, many household surveys have added short sections or modules on time-use that follow synthetic methodologies (short tasks surveys, stylized diaries) that are not 24-hour diaries. The present compilation relies on time-use surveys that were either stand-alone or full-fledged diaries as modules of regular household surveys. More specifically, this report is based on the compilation of a hundred and thirty three (133) time-use surveys carried out in 76 countries through diaries, and at national level (Table 1 hereafter). The compilation excludes the household surveys collecting time use data through a short list of stylised questions (for instance the Living Standards Measurement Study LSMS-type of surveys). The only exception to this rule is for Latin America where, in the absence of time-use surveys based on diaries, the method used was a long and detailed set of questions on a week reference period. In this respect, the comparison of the findings for Latin America with the other regions is highlighting and must be interpreted with caution in the sense that it shows the tendency of stylised questions to overestimate the time dedicated to unpaid activities, one of the reasons for that being that it mixes simultaneous activities. Cabo Verde in Africa has also used the same method. Several surveys used the technique of diaries in Latin America: Cuba in 2001 (but the results were only published by region), Argentina (for the city of Buenos Aires that was added to the compilation), Chile for Gran Santiago in 2008 (not added to this review because a national survey was carried out more recently, Brazil in 2010 and the Bolivarian Republic of Venezuela in 2012 (but no publications followed for these two countries, this is why they are not mentioned in this review)4. The list of surveys, publications and url links are provided in references and a summary of metadata is provided in Annex (Table A1).5
4 For more details, see : Esquivel, Valeria (2017), Time-use Surveys in Latin America : 2005-15, in : Hirway, Indira ed. (2017), Mainstreaming Unpaid Work, Time-use Data in Developing Countries, New Delhi, Oxford University Press. 5 The time-use survey of Cameroon (2015) is under print (but not yet official), the survey for the United Kingdom UK (2015) has not provided results yet, but the required indicators were kindly provided from the microdata base by Dr. Jooyeoun Suh, at the Centre for Time Use Research, Oxford University and the detailed results of the time use survey for China (2008) were kindly provided by Pr. Xiao-Yuan Dong from the University of Winnipeg because the official publication of the survey was out of print.

14
Table 1: List of time-use surveys by year and region
North Africa (3 countries /3 surveys)
Arab countries
(4 countries /5 surveys)
Sub-Saharan Africa
(10 countries /13 surveys)
Eastern Asia (5 countries /12 surveys)
South-Eastern Asia
and the Pacific
(4 countries /9 surveys)
Southern Asia
(3 countries /3 surveys)
Central and Western
Asia (5 countries /6 surveys)
Latin America
(12 countries /15 surveys)
Northern, Western and
Southern Europe (22 countries /42 surveys)
Eastern Europe (6 countries/7 surveys)
Northern America
(2 countries /19 surveys)
Algeria (2012) Iraq
(2007) Benin (1998)
(2015) China (2008)
Australia (1992) (1997) (2006)
India (1998-99) Armenia (2008) Argentina (Buenos
Aires) (2005) Albania
(2010-11) Belarus
(2014-15)
Canada (1992) (1998) (2005) (2010) (2015)
Morocco (2011-12)
Oman (2007-08)
Cameroon (2014) Japan (2001) (2006)
(2011) (2016) Cambodia (2004)
Iran, Islamic Republic of
(2009)
Azerbaijan (2008) (2012)
Chile (2015) Austria
(2008-09) Bulgaria
(2009-10) United States (2003) (2004) (2005) (2006) (2007) (2008) (2009) (2010) (2011) (2012)
(2013) (2014) (2015) (2016)
Tunisia (2005-06)
Occupied Palestinian Territory
(1999-2000) (2012-13)
Cabo Verde (2012)
Korea, Republic of (1999) (2004)
(2009) (2014)
New Zealand (1998-99) (2009-10)
Pakistan (2007) Kazakhstan
(2012) Colombia (2012-13)
Belgium (1999) (2005) (2013) Hungary
(1999-2000) (2009-10)
Denmark (2001) Estonia
(1999-2000) (2009-10)
Qatar
(2012-13) Ethiopia (2013)
Mongolia (2007) (2011)
Thailand (2004) (2009) (2014-15)
Kyrgyzstan (2010) Costa Rica (2004) Finland (1979) (1987)
(1999) (2009)
Moldova, Republic of (2011-12)
Ghana (2009) Taiwan, China
(2004)
Turkey (2006) (2014-15)
Cuba (2001) France (1974)
(1986) (1999) (2010) Poland
(2003-04)
Madagascar (2001) Ecuador (2012) Germany (2001-02)
(2012) Romania
(2011-12)
Mali (2008) El Salvador (2010) Greece (2013-14)
Mauritius
(2003)
Mexico (2002) (2009) (2014)
Ireland (2005)
Italy (1988-89)
(2002-03) (2008-09) (2013-14)
South Africa (2000)
(2010) Panama (2011) Latvia (2003)
Tanzania, United
Republic of (2006) (2014)
Paraguay (2016)
Lithuania (2003)
Macedonia, the Former
Yugoslav Republic of (2014-15)
Peru (2010) Netherlands (2005-06)
Uruguay (2007)
(2013) Norway (1970) (1980) (1990) (2000) (2010)
Portugal (1999) Serbia (2010-11)
Slovenia (2000-01)
Spain
(2002-03) (2009-10)
Sweden (2000-01)
(2010-11)
United Kingdom (2000)
(2005) (2015)
15
Classifications One of the difficulties in the international comparison of time use statistics is related to the absence of use of a system of harmonized classifications of time-use activities. A trial International Classification of Activities for Time Use Statistics (ICATUS) was published in 2005 by the United Nations, as part of the Guide to Producing Statistics on Time Use: Measuring Paid and Unpaid Work. This classification has been used in time-use surveys conducted in many developing countries. The Harmonized European Time-Use Survey (HETUS) classification is used in Europe including Eastern Europe as well as in North Africa and in some transition countries. In Latin America the Classification of activities for time-use for Latin America and the Caribbean (CAUTAL) 6 is used. In addition, many countries, for example, Australia, New Zealand and the United States have developed their own classifications for time-use statistics. Many countries still use classifications that do not distinguish child care from adult care, meaning that adult care is then captured through other household chores. Depending on the classification, volunteer work and help to other households is detailed in a specific digit of the classification or split between care-work and community services, and sometimes includes other activities (such as participating in meetings or religious activities). The last difficulty is due to the treatment of travel related to a given activity. In principle, related travel time should be added to each activity. For childcare, related travel is clearly part of the time dedicated to this activity. However in some surveys, travel is measured in a single separate indicator and cannot be imputed to any specific activity. A recent development which promises to improve international harmonization and comparison in time use statistics is the first non-trial version of the International Classification of Activities for Time Use Statistics (ICATUS 2016)7 which was adopted by the United Nations Statistical Commission at its 48th Session in 2017. This new classification was developed under the guidance of an Expert Group on Time Use Statistics whose members had experience in the use of the trial ICATUS, HETUS, CAUTAL and various national time use activity classifications. The purpose of ICATUS 2016 is to provide a framework that can be used to produce meaningful and comparable statistics on time use across countries and over time. Its categories are aligned with the 19th ICLS definition of work and forms of work as well as with the SNA production boundaries. A correspondence between the 2008 version of the HETUS activity coding list has been developed and is available as part of the published ICATUS 2008. With certain limitations this would make it possible to map data coded to HETUS to an aggregate level of ICATUS 2016. Over time it is to be hoped that countries will increasingly adopt ICATUS 2016 in their national time use surveys, or develop mappings to national and regional classifications so as allow statistics on time use to be compiled according to the new international standard. In summary, the comparability of data is not strictly respected, but at this stage of the harmonisation process of such types of surveys, it is a necessary requirement to accept a certain degree of uncertainty.
6 Clasificación de Actividades de Uso del Tiempo para América Latina y el Caribe 7 https://unstats.un.org/unsd/demographic-social/time-use/icatus-2016/

16
Indicators of time use There are three basic indicators for time use: time use for participants, participation rate and time use for total population (also called social time in some surveys). Except for physiological needs (sleeping, eating), not all the population is involved in the various activities: time use for participants is an approach of the reality experienced by the population, for instance a workday is approximately of 8 hours for a worker, and a care-work day is of 7 hours for a young mother, but all the population is not at work during the reference period and not all women are young mothers entirely dedicating their time to care. Participation rates indicate the proportion of population, of workers, of mothers, etc., who, during the period of reference, participate in a precise activity. And time use for total population in a given activity is the ratio of the total time recorded in the survey by the total population or also the multiplication of time use for participants by participation rates. Time use for total population is an indicator that allows reconstituting a complete 24-hour day (or 1440 minutes). The average time spent in the activity by the total covered population is the indicator used in this report: in order to compute an annual value, the simple multiplication by 365 is enough, provided that the survey methodologies take the weekly and the seasonal variations into account. However the published reports of time-use surveys across the world are not always clear about the indicators highlighted in the tables. In some countries, especially in Latin America, the indicator on time use for participants is privileged and the indicator on time use for total population cannot always be computed. Furthermore the published results emphasise the measurement of unpaid care work and do not always provide the data for paid work (and sometimes for personal activities). Many countries present tables with the three indicators, while others prefer tables with the sum at 1440 minutes. Another difficulty is that many published tables mix paid (SNA) work with learning activities so that where the detailed tables are not available, it has not been possible to compare time spent in unpaid care work with time spent in paid work. Finally a general remark must be made about the availability of data in the published reports: Although time-use surveys are – or should be – centered on gender, it is surprising to note that the variable ‘sex’ is often treated as any other socio-economic variable. In other words, not all the tables are disaggregated by sex, and many of the socio-economic characteristics sought for this report are available (for instance educational level, income groups, or activity status) but not disaggregated by sex.

17
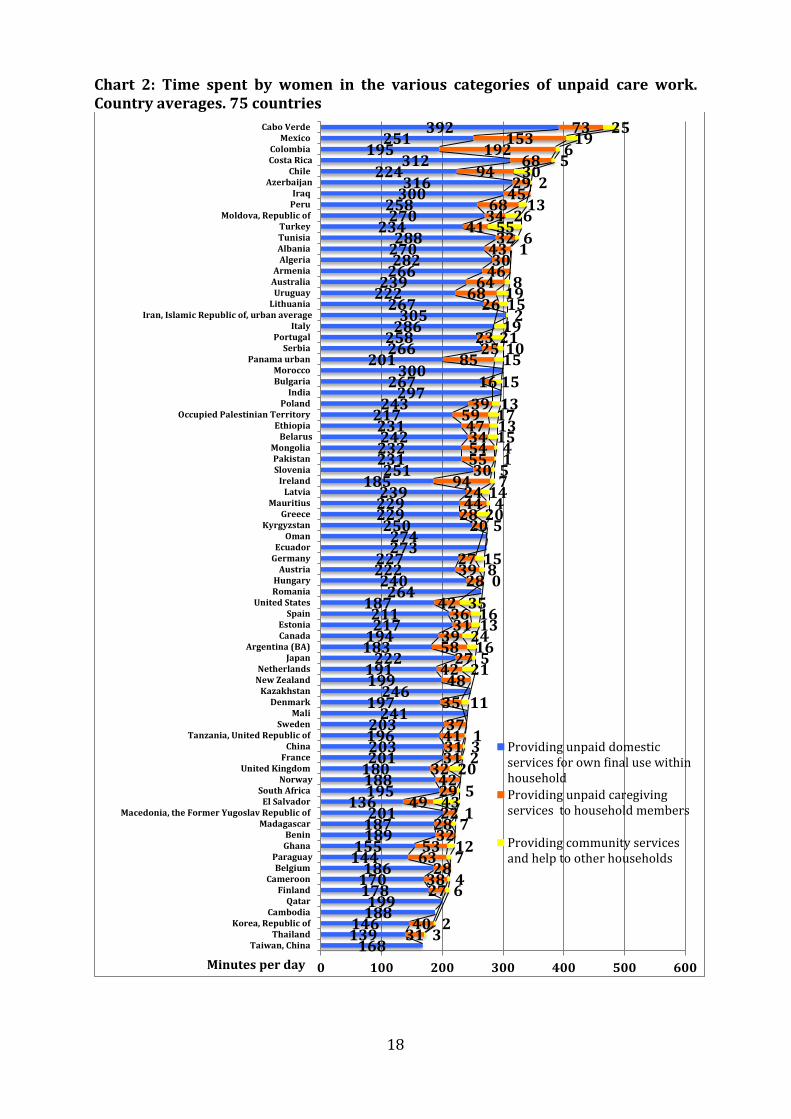
Section 2: Gender variations in paid work and unpaid care work by country in the various regions of the world Across the globe and with no exception, women dedicate more time than men to unpaid care work. Chart 2 hereafter shows the importance of time (in number of minutes per day) dedicated by women to the three forms of unpaid care work (domestic services, care services, and community services or volunteering 8) across the world. It can be noted that in countries where caregiving services are not distinguished, they are included in domestic services. Globally, women’s unpaid care work ranges from a maximum of 490 minutes (8 hours and 10 minutes or 34 per cent of a 24-hour day) in Cabo Verde (2012) to a minimum of 168 minutes (2 hours and 48 minutes or 11.7 per cent of a 24-hour day) in Taiwan, China (2004) and 178 minutes (2 hours and 58 minutes or 12.4 per cent of a day) in Thailand (2014)9. However we must keep in mind that the five countries at the top (4 Latin American countries and Cabo Verde, the only African country to have followed the same methodology) have not applied the diary data collection method, which explains the overestimation of time spent in these unpaid activities. This is because it includes simultaneous activities and because the total time cannot be checked against the total number of hours per day. If we don’t take these 5 countries in consideration, then time spent in unpaid care work ranges from the maximum of 345 minutes (5 hours and 45 minutes or 24 per cent of a 24-hour day) for Iraq (2007) to the minimum of 11.7 per cent in Taiwan, China. That means that depending on countries, time devoted to unpaid care work can vary from single to double. This is why a regional analysis is so important. The average time devoted to unpaid care work for women at the global level (including 75 countries) is 277 minutes (4 hours and 37 minutes or 19.7 per cent of a 24-hour day). The median value for 75 countries is represented by Ecuador (2012) with 273 minutes (4 hours and 33 minutes or 19.0 per cent of a 24-hour day). Looking now at men’s unpaid work (Chart 3), it ranges from a maximum of 246 minutes (4 hours and 6 minutes or 17.1 per cent of a 24-hour day) in Cabo Verde again to a minimum of 18 minutes in Cambodia (1.2 per cent). Here again the country (Cabo Verde) at the top is characterised by a difference in methodology. Without it, the maximum is at 200 minutes (3 hours and 20 minutes or 13.9 per cent of a 24-hour day) for the Republic of Moldova (2011-12), with a gap between the maximum and the minimum reaching a factor of 11. The world average is 111 minutes (1 hour and 51 minutes: 7.7 per cent of a 24-hour day) and the median value is represented by Kazakhstan (2012) with exactly the same value as the average.
8 The three categories of unpaid care work have been defined in section 1 above. 9 In this section average numbers are unweighted: each country has the same weight. Weighted averages will be calculated in section 3. Unweighted averages provide a general profile, avoiding giving too strong importance to the most populated countries.
18
Chart 2: Time spent by women in the various categories of unpaid care work. Country averages. 75 countries
168139146
188199
178170186
144155
189187201
136195188180201203196203
241197
246199191
222183194217211
187264
240222227
273274
250229229239
185251
231232242231
217243
297267
300201
266258
286305
267222239
266282
270288
234270
258300316
224312
195251
392
3140
273828
6353
322822
492942
3231314137
35
4842
275839
3136
42
283927
20284424
9430
55543447
5939
16
8525
23
2668
64463043
3241
3468
4529
9468
192153
73
32
64
712
71
435
20231
11
215
1624
1316
35
08
15
520
414
7514
15131713
15
1510
2119
21519
8
16
5526
13
230
56
1925
0 100 200 300 400 500 600
Taiwan, ChinaThailand
Korea, Republic ofCambodia
QatarFinland
CameroonBelgium
ParaguayGhanaBenin
MadagascarMacedonia, the Former Yugoslav Republic of
El SalvadorSouth Africa
NorwayUnited Kingdom
FranceChina
Tanzania, United Republic ofSweden
MaliDenmark
KazakhstanNew ZealandNetherlands
JapanArgentina (BA)
CanadaEstonia
SpainUnited States
RomaniaHungary
AustriaGermanyEcuador
OmanKyrgyzstan
GreeceMauritius
LatviaIreland
SloveniaPakistan
MongoliaBelarus
EthiopiaOccupied Palestinian Territory
PolandIndia
BulgariaMorocco
Panama urbanSerbia
PortugalItaly
Iran, Islamic Republic of, urban averageLithuania
UruguayAustraliaArmenia
AlgeriaAlbaniaTunisiaTurkey
Moldova, Republic ofPeruIraq
AzerbaijanChile
Costa RicaColombia
MexicoCabo Verde
Minutes per day
Providing unpaid domesticservices for own final use withinhousehold
Providing unpaid caregivingservices to household members
Providing community servicesand help to other households

19
Chart 3: Time spent by men in the various categories of unpaid care work. Country averages. 75 countries
182117
3127
4139
443
36454242
3544525452
3340
565361637578
7145
668088828281
97110111115
10351
87125
93114
9791101
1178895101111121122126
79118126130124
101127137142141145
122144
131130
149151
168169
204
9
10
311
85
128
910
499
2811
1314
68
85
2211
5919
14
1066
8
2112
232915
153519
262011195
58191014
1341
1510
6811
1911
1827
3120
268
22
2
2
28
72
411
2
33
17471062
637
5359
1211
33
30
121
89
15
1019
987
129912
4141315171617
1027
1421
15
15
2320
0 50 100 150 200 250 300
CambodiaMali
PakistanIndia
Korea, Republic ofTaiwan, China
BeninEl Salvador
MoroccoMadagascar
AlbaniaAlgeriaTunisia
Occupied Palestinian TerritoryThailand
IraqArmenia
Tanzania, United Republic ofParaguay
GhanaMauritius
CameroonPortugal
JapanIran, Islamic Republic of, urban average
EcuadorMacedonia, the Former Yugoslav Republic of
TurkeyArgentina (BA)
ChinaSouth AfricaKyrgyzstan
Costa RicaGreece
ItalyQatar
KazakhstanOman
AzerbaijanColombia
EthiopiaRomania
SpainHungary
Panama urbanIreland
United KingdomBelgiumUruguay
NetherlandsPeru
MongoliaFinland
New ZealandLatvia
MexicoAustria
SerbiaFranceBelarus
ChilePoland
GermanyBulgaria
LithuaniaSlovenia
United StatesEstoniaCanada
AustraliaNorway
DenmarkSweden
Moldova, Republic ofCabo Verde
Minutes per day
Providing unpaid domesticservices for own final use withinhousehold
Providing unpaid caregivingservices to household members
Providing community servicesand help to other households

20
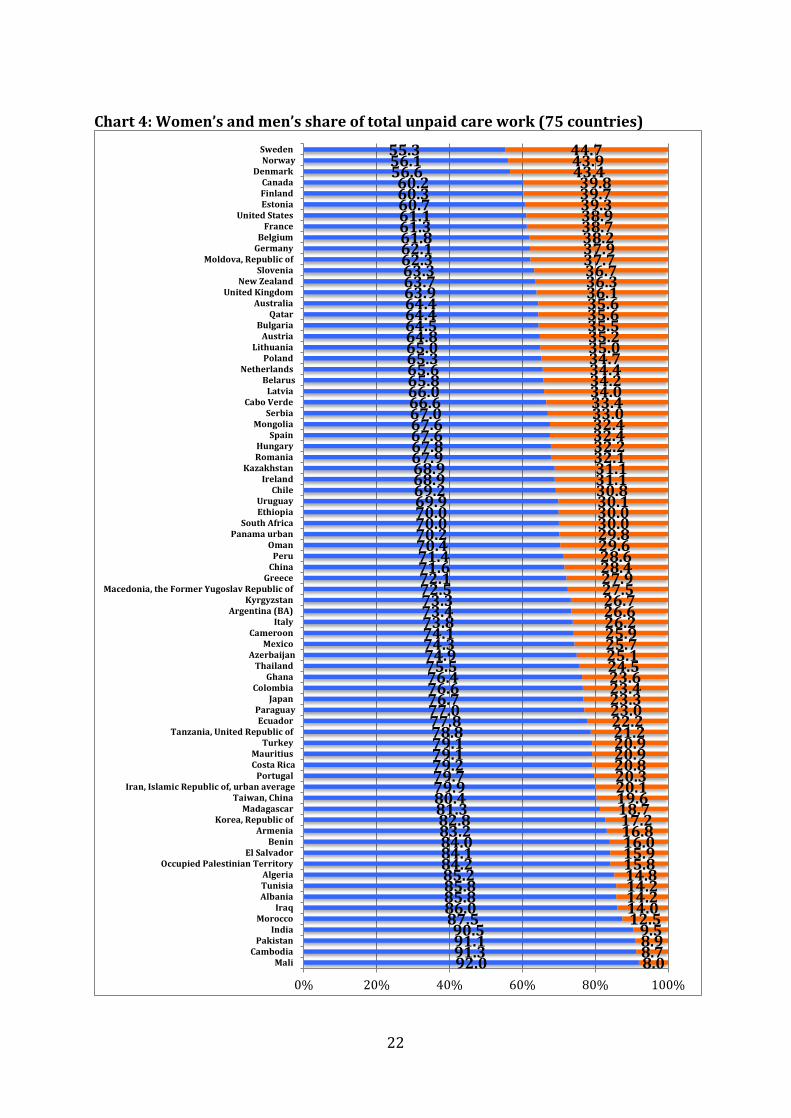
Chart 4 summarises the existing gaps in the relative contributions of women and men to unpaid care work making visible the remaining path to reach parity (when women and men share an equal part of the unpaid care work burden at 50 per cent). Women’s share is the complement to 100 per cent for this indicator. Countries are ranked by increasing share of women’s contribution to unpaid care work. None of the countries reaches parity (at 50 per cent) as regards men’s contribution to total unpaid care work. But as expected Northern European countries come close to it, with Sweden, Norway and Denmark above 40 per cent (respectively 44.7, 43.9 and 43.4 per cent), followed by Canada, Finland and Estonia (above 39 per cent). At the other extreme we find Mali, Cambodia, Pakistan and India with fewer than 10 per cent (respectively 8.0, 8.7, 8.9 and 9.5 per cent). The world average is 27.5 per cent (corresponding to the situation in the Former Yugoslav Republic of Macedonia 2014-15) and the median value is slightly higher, at 28.4 per cent (for China 2008). Thus in average at world level, men’s contribution to total unpaid care work hardly exceeds one fourth of the total burden. The series of Charts that follows (Charts 5 to 33) present time (in minutes per day) spent by women and men in unpaid care work and men’s share of total unpaid care work, for the various regions and sub-regions of the world according to the ILO regional, country groupings, as well as (charts 27 to 33) for the income groupings (developed-high income, emerging-middle income and developing-low income countries). On these Charts, countries are ranked by increasing order of women’s time spent in unpaid care work or by decreasing order of women’ s share of total unpaid care work. Charts show that there is no direct relationship between women and men’s allocations of time in unpaid care work: in other words, countries characterised by high levels of time allocated by women to domestic and care-work are not always simultaneously characterised by higher levels of time allocated by men to these tasks. As a matter of fact, it is the share of men (or of women) in the fulfilment of the burden of domestic work that reflects the relative status of women across the countries and better accounts for target 5.4 of the SDGs monitoring framework (proportion of time spent in unpaid domestic and care work by sex). In this regard, the ranking of countries within each region or sub-region according to this indicator is significant. Chart 24 for example shows that, in Northern, Southern and Western European countries, as expected, the countries that perform better (situated on the right-hand side of the Chart and highlighted in red) are the Northern European, with men contributing for more than 39 per cent of total unpaid care work whereas Southern European countries (highlighted in yellow) are clearly on the left-hand side with men’s shares below 30 per cent (Albania, Portugal, Italy, FYR of Macedonia, Greece) and Western European countries (highlighted in blue) in between. The same observations can be made for developed (high income) countries on Charts 27 and 28 where again the Northern European countries perform the best on the right-hand side, together with Canada (above 40 per cent), while Southern European countries share the left-hand side with the Republic of Korea, Taiwan China (below 20 per cent), Japan and Oman.
21
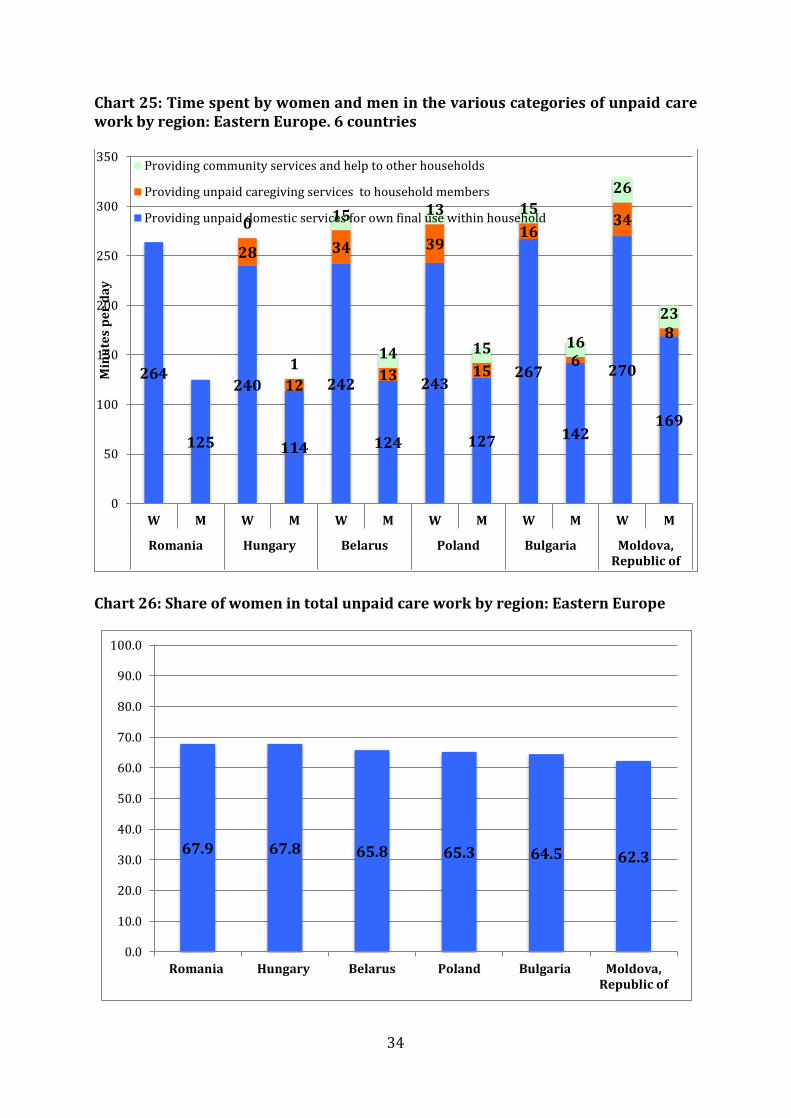
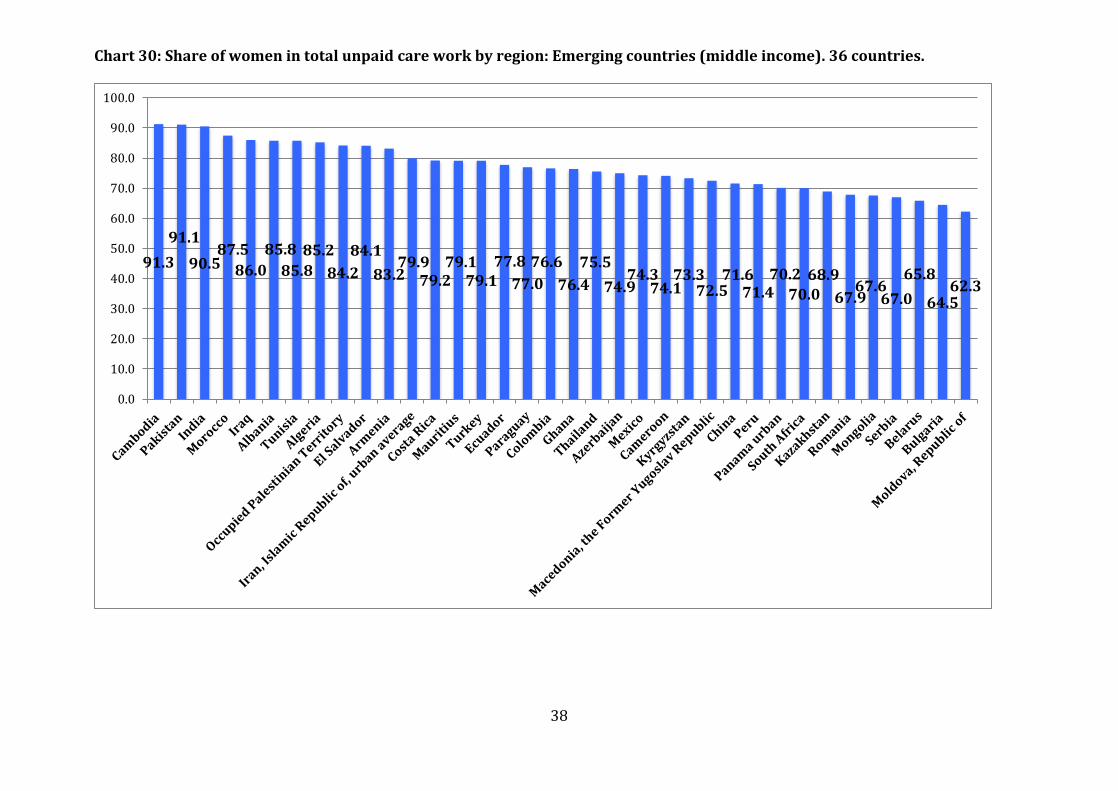
Eastern Europe (Charts 25 and 26) is the only region where the longer the time dedicated by women to unpaid care work, the longer is also the time dedicated by men to these tasks. In these countries, men’ share of total unpaid care work represents one third of the total (with the minimum in Romania: 32.1 per cent and the maximum in the Republic of Moldova: 37.7 per cent). In emerging (middle income) countries (Charts 29 and 30), Eastern European countries (Republic of Moldova, Bulgaria, Serbia, Romania) perform the better with men’s share of total unpaid care work higher than 30 per cent, together with one Latin American country (Chile), two Central Asian countries (Mongolia, Kazakhstan) and one African country (South Africa). At the other end with men’ share of total unpaid care work below 20 per cent, Asian countries (Cambodia, Pakistan, India) with a low share (less than 10 per cent), followed by Northern African countries (Morocco, Tunisia, Algeria), Arab countries (Iraq, Occupied Palestinian Territory) and also one country from Southern Europe (Albania), one Latin American country (El Salvador) and one Central Asian country (Armenia). Finally Chart 33 summarises the situation for the three categories of countries, on the same scale. It shows that the emerging countries (36 countries) are generally situated below the developed countries (33 countries) as regards the remaining distance to parity, and the developing countries below the emerging countries (although the number of developing countries remains small in the sample (6). Disparities between countries within each group are not very different between groups.
22
Chart 4: Women’s and men’s share of total unpaid care work (75 countries)
92.091.391.190.5
87.586.085.885.885.284.284.184.083.282.881.380.479.979.779.279.179.178.877.877.076.776.676.475.574.974.374.173.873.473.372.572.171.671.470.470.270.070.069.969.268.968.967.967.867.667.667.066.666.065.865.665.365.064.864.564.464.463.963.763.362.362.161.861.361.160.760.360.2
56.656.155.3
8.08.78.99.5
12.514.014.214.214.815.815.916.016.817.218.719.620.120.320.820.920.921.222.223.023.323.423.624.525.125.725.926.226.626.727.527.928.428.629.629.830.030.030.130.831.131.132.132.232.432.433.033.434.034.234.434.735.035.235.535.635.636.136.336.737.737.938.238.738.939.339.739.8
43.443.944.7
0% 20% 40% 60% 80% 100%
MaliCambodia
PakistanIndia
MoroccoIraq
AlbaniaTunisiaAlgeria
Occupied Palestinian TerritoryEl Salvador
BeninArmenia
Korea, Republic ofMadagascar
Taiwan, ChinaIran, Islamic Republic of, urban average
PortugalCosta RicaMauritius
TurkeyTanzania, United Republic of
EcuadorParaguay
JapanColombia
GhanaThailand
AzerbaijanMexico
CameroonItaly
Argentina (BA)Kyrgyzstan
Macedonia, the Former Yugoslav Republic ofGreece
ChinaPeru
OmanPanama urban
South AfricaEthiopiaUruguay
ChileIreland
KazakhstanRomaniaHungary
SpainMongolia
SerbiaCabo Verde
LatviaBelarus
NetherlandsPoland
LithuaniaAustria
BulgariaQatar
AustraliaUnited Kingdom
New ZealandSlovenia
Moldova, Republic ofGermanyBelgium
FranceUnited States
EstoniaFinlandCanada
DenmarkNorwaySweden
23
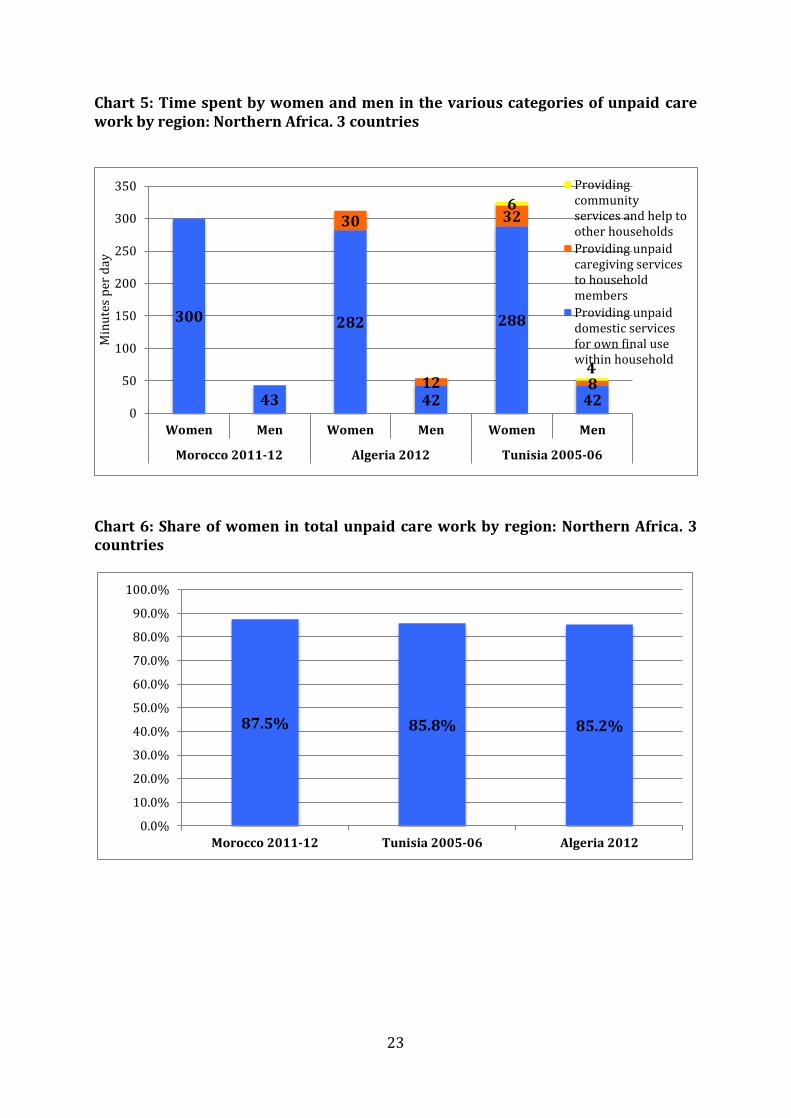
Chart 5: Time spent by women and men in the various categories of unpaid care work by region: Northern Africa. 3 countries
Chart 6: Share of women in total unpaid care work by region: Northern Africa. 3 countries
300
43
282
42
288
42
30
12
32
8
6
4
0
50
100
150
200
250
300
350
Women Men Women Men Women Men
Morocco 2011-12 Algeria 2012 Tunisia 2005-06
Min
ute
s p
er d
ay
Providingcommunityservices and help toother households
Providing unpaidcaregiving servicesto householdmembers
Providing unpaiddomestic servicesfor own final usewithin household
87.5% 85.8% 85.2%
0.0%
10.0%
20.0%
30.0%
40.0%
50.0%
60.0%
70.0%
80.0%
90.0%
100.0%
Morocco 2011-12 Tunisia 2005-06 Algeria 2012
24
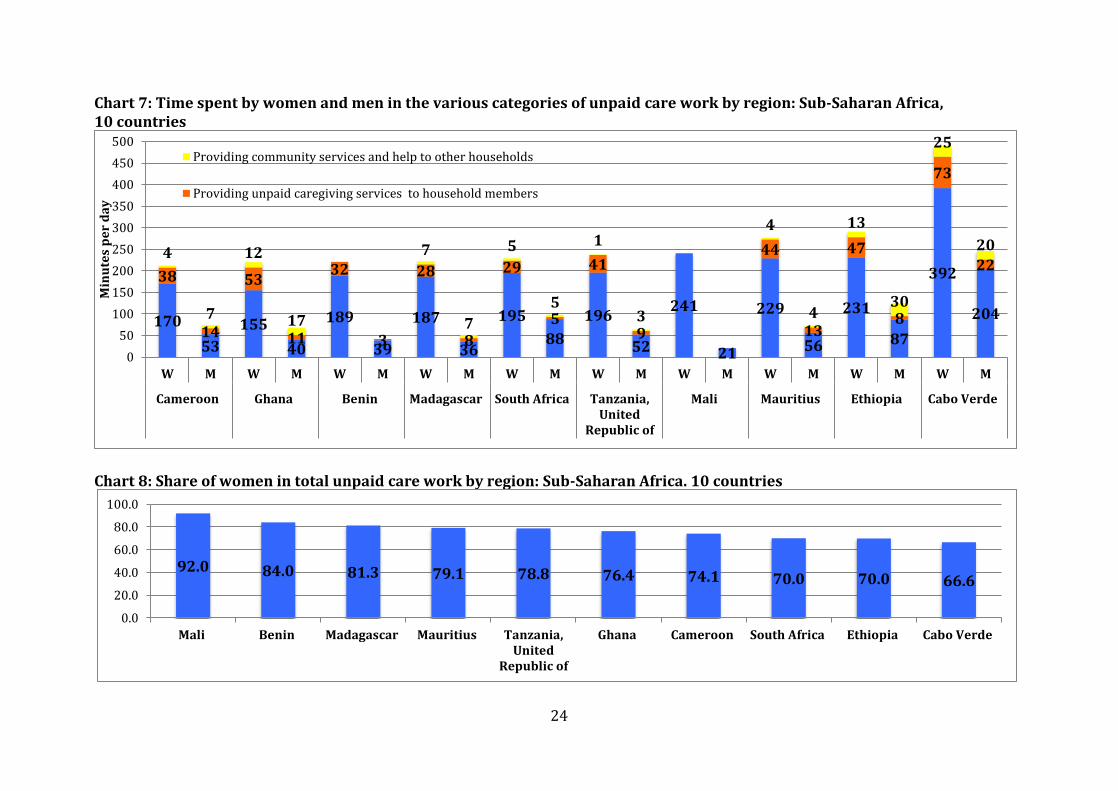
Chart 7: Time spent by women and men in the various categories of unpaid care work by region: Sub-Saharan Africa, 10 countries
Chart 8: Share of women in total unpaid care work by region: Sub-Saharan Africa. 10 countries
170
53
155
40
189
39
187
36
195
88
196
52
241
21
229
56
231
87
392
204
38
14
53
11
32
3
28
8
29
5
41
9
44
13
47
8
73
224
7
12
17
7
7
5
5
1
3
4
4
13
30
25
20
0
50
100
150
200
250
300
350
400
450
500
W M W M W M W M W M W M W M W M W M W M
Cameroon Ghana Benin Madagascar South Africa Tanzania,United
Republic of
Mali Mauritius Ethiopia Cabo Verde
Min
ute
s p
er
da
y
Providing community services and help to other households
Providing unpaid caregiving services to household members
92.0 84.0 81.3 79.1 78.8 76.4 74.1 70.0 70.0 66.6
0.0
20.0
40.0
60.0
80.0
100.0
Mali Benin Madagascar Mauritius Tanzania,United
Republic of
Ghana Cameroon South Africa Ethiopia Cabo Verde

25
Chart 9: Time spent by women and men in the various categories of unpaid care work by region: Northern America
Chart 10: Share of women in total unpaid care work by region: Northern America
194
131187
122
39
18
42
19
24
21
35
27
0
50
100
150
200
250
300
Women Men Women Men
Canada 2010 USA 2015
Providing communityservices and help to otherhouseholds
Providing unpaidcaregiving services tohousehold members
Providing unpaid domesticservices for own final usewithin household
61.1% 60.2%
0.0%
10.0%
20.0%
30.0%
40.0%
50.0%
60.0%
70.0%
80.0%
90.0%
100.0%
USA 2015 Canada 2010
26
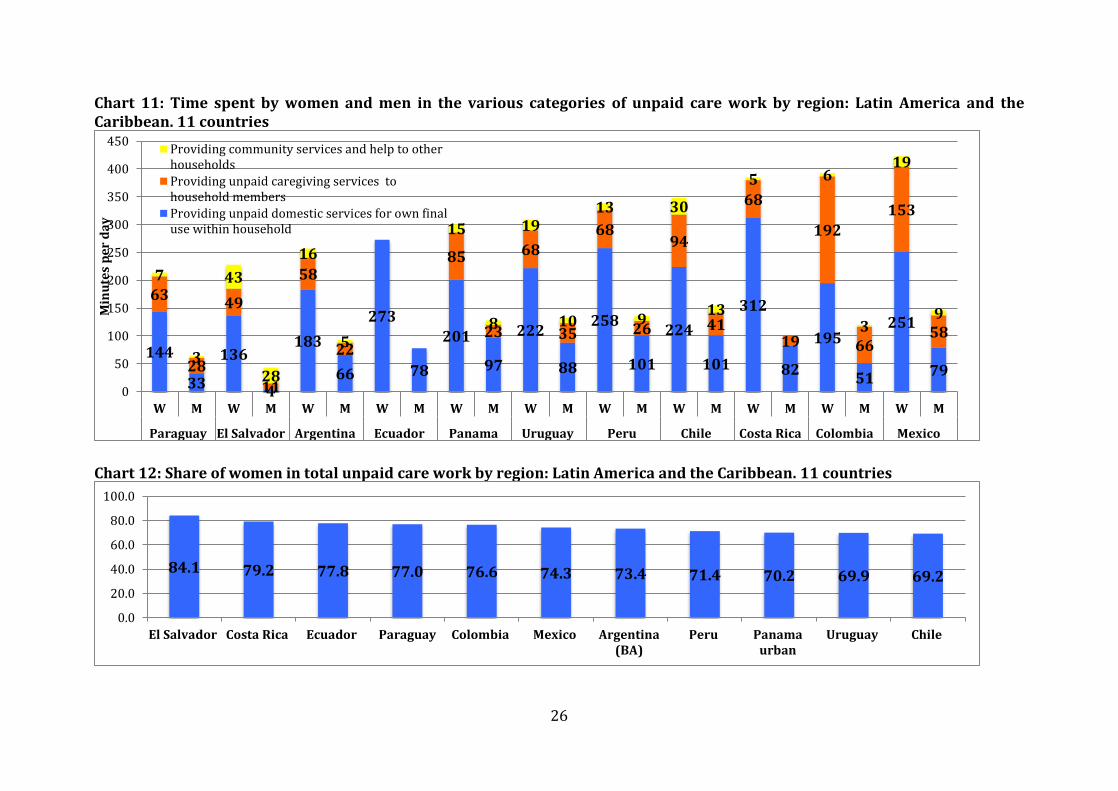
Chart 11: Time spent by women and men in the various categories of unpaid care work by region: Latin America and the Caribbean. 11 countries
Chart 12: Share of women in total unpaid care work by region: Latin America and the Caribbean. 11 countries
144
33
136
4
183
66
273
78
201
97
222
88
258
101
224
101
312
82
195
51
251
79
63
28
49
11
58
22
85
23
68
35
68
26
94
41
68
19
192
66
153
58
7
3
43
28
16
5
15
8
19
10
13
9
30
13
5 6
3
19
9
0
50
100
150
200
250
300
350
400
450
W M W M W M W M W M W M W M W M W M W M W M
Paraguay El Salvador Argentina(BA)
Ecuador Panamaurban
Uruguay Peru Chile Costa Rica Colombia Mexico
Min
ute
s p
er
da
y
Providing community services and help to otherhouseholds
Providing unpaid caregiving services tohousehold members
Providing unpaid domestic services for own finaluse within household
84.1 79.2 77.8 77.0 76.6 74.3 73.4 71.4 70.2 69.9 69.2
0.0
20.0
40.0
60.0
80.0
100.0
El Salvador Costa Rica Ecuador Paraguay Colombia Mexico Argentina(BA)
Peru Panamaurban
Uruguay Chile
27
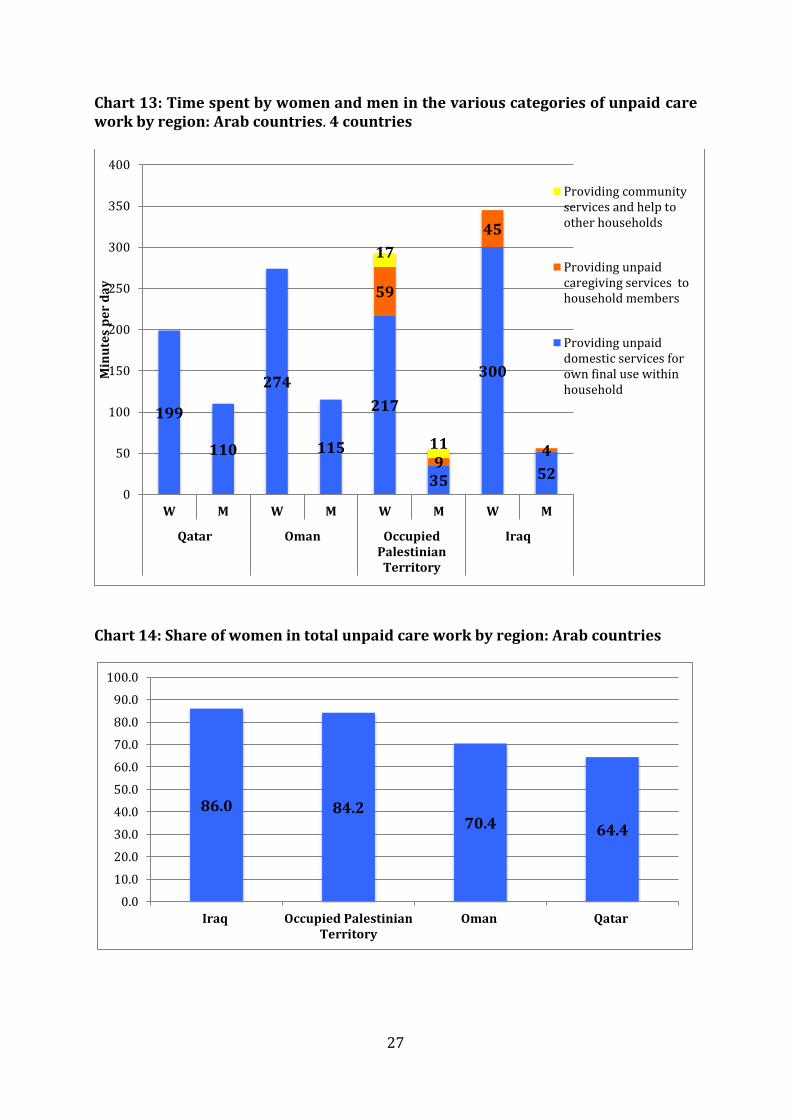
Chart 13: Time spent by women and men in the various categories of unpaid care work by region: Arab countries. 4 countries
Chart 14: Share of women in total unpaid care work by region: Arab countries
199
110
274
115
217
35
300
52
59
9
45
4
17
11
0
50
100
150
200
250
300
350
400
W M W M W M W M
Qatar Oman OccupiedPalestinianTerritory
Iraq
Min
ute
s p
er
da
y
Providing communityservices and help toother households
Providing unpaidcaregiving services tohousehold members
Providing unpaiddomestic services forown final use withinhousehold
86.0 84.270.4 64.4
0.0
10.0
20.0
30.0
40.0
50.0
60.0
70.0
80.0
90.0
100.0
Iraq Occupied PalestinianTerritory
Oman Qatar
28
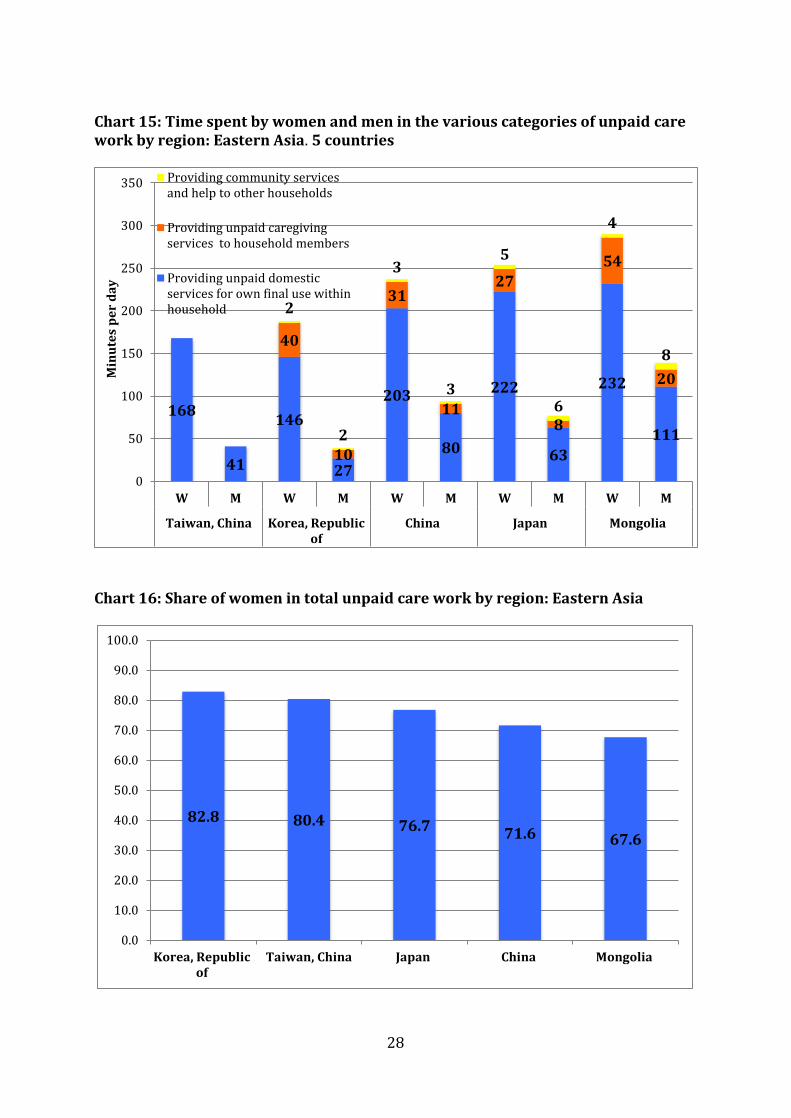
Chart 15: Time spent by women and men in the various categories of unpaid care work by region: Eastern Asia. 5 countries
Chart 16: Share of women in total unpaid care work by region: Eastern Asia
168
41
146
27
203
80
222
63
232
111
40
10
31
11
27
8
54
20
2
2
3
3
5
6
4
8
0
50
100
150
200
250
300
350
W M W M W M W M W M
Taiwan, China Korea, Republicof
China Japan Mongolia
Min
ute
s p
er
da
y
Providing community servicesand help to other households
Providing unpaid caregivingservices to household members
Providing unpaid domesticservices for own final use withinhousehold
82.8 80.4 76.7 71.6 67.6
0.0
10.0
20.0
30.0
40.0
50.0
60.0
70.0
80.0
90.0
100.0
Korea, Republicof
Taiwan, China Japan China Mongolia

29
Chart 17: Time spent by women and men in the various categories of unpaid care work by region: South-Eastern Asia and the Pacific. 4 countries
Chart 18: Share of women in total unpaid care work by region: South-Eastern Asia and the Pacific
139
44
188
18
199
122
239
130
31
10
48
19
64
27
3
2
8
15
0
50
100
150
200
250
300
350
W M W M W M W M
Thailand Cambodia New Zealand Australia
Min
ute
s p
er
da
y
Providing community services and help to otherhouseholds
Providing unpaid caregiving services tohousehold members
Providing unpaid domestic services for own finaluse within household
91.3
75.564.4 63.7
0.0
10.0
20.0
30.0
40.0
50.0
60.0
70.0
80.0
90.0
100.0
Cambodia Thailand Australia New Zealand
30
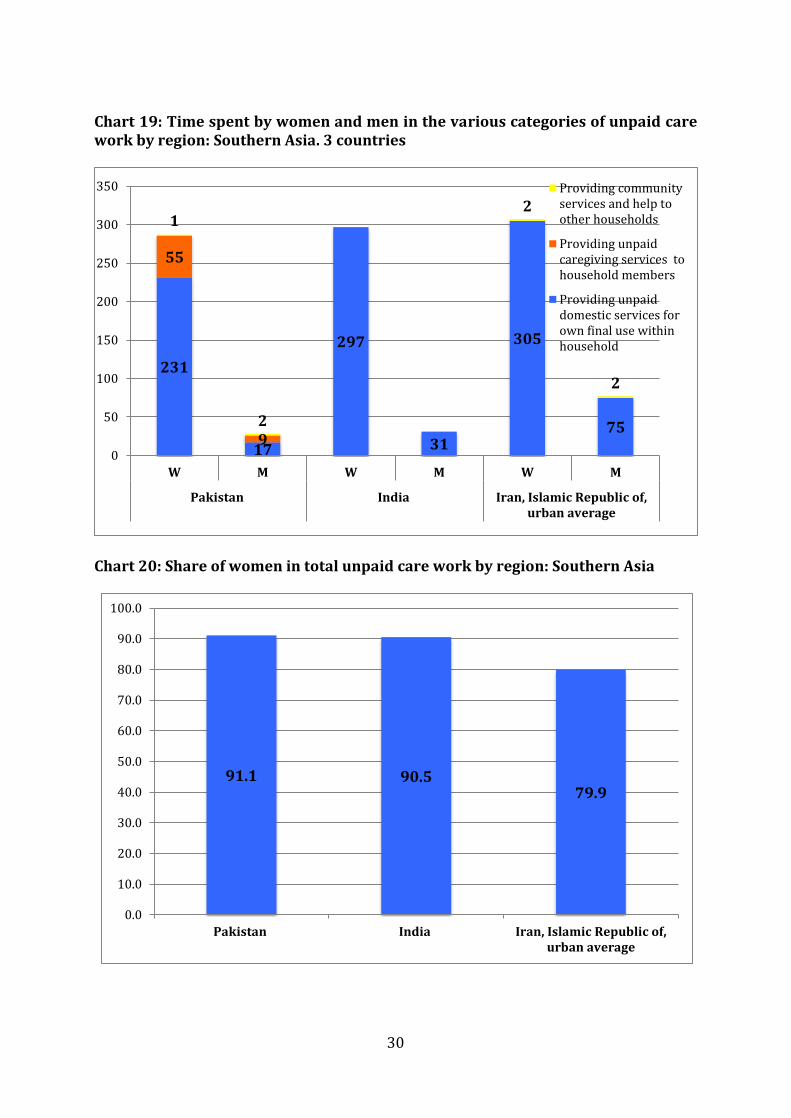
Chart 19: Time spent by women and men in the various categories of unpaid care work by region: Southern Asia. 3 countries
Chart 20: Share of women in total unpaid care work by region: Southern Asia
231
17
297
31
305
75
55
9
1
2
2
2
0
50
100
150
200
250
300
350
W M W M W M
Pakistan India Iran, Islamic Republic of,urban average
Providing communityservices and help toother households
Providing unpaidcaregiving services tohousehold members
Providing unpaiddomestic services forown final use withinhousehold
91.1 90.579.9
0.0
10.0
20.0
30.0
40.0
50.0
60.0
70.0
80.0
90.0
100.0
Pakistan India Iran, Islamic Republic of,urban average

31
Chart 21: Time spent by women and men in the various categories of unpaid care work by region: Central and Western Asia. 5 countries
Chart 22: Share of women in total unpaid care work by region: Central and Western Asia
246
111
250
82
266
54
234
45
316
103
20
9
46
9
41
5
29
10
5
9
55
37
2
3
0
50
100
150
200
250
300
350
400
W M W M W M W M W M
Kazakhstan Kyrgyzstan Armenia Turkey Azerbaijan
Providingcommunity servicesand help to otherhouseholds
Providing unpaidcaregiving servicesto householdmembers
Providing unpaiddomestic services forown final use withinhousehold
83.2 79.1 74.9 73.3 68.9
0.0
10.0
20.0
30.0
40.0
50.0
60.0
70.0
80.0
90.0
100.0
Armenia Turkey Azerbaijan Kyrgyzstan Kazakhstan

32
Chart 23: Time spent by women and men in the various categories of unpaid care work by region: Northern, Southern and Western Europe. 22 countries
178
121
186
117
201
71
188
149
201
130
203
168197
151180
101
191
95
217
144
211
93
222
118
227
137
229
81
239
126
185
91
251
145
266
126
258
61
286
97
267
141
270
45
27
11
28
15
22
8
42
31
31
14
37
26
35
20
40
15
42
19
31
11
36
21
39
19
27
10
28
14
24
5
94
29
30
11
25
10
23
6
26
8
43
5
6
7
1
6
2
4
11
15
32
15
21
19
13
14
16
12
8
9
15
17
20
12
14
12
7
9
5
10
10
12
21
10
19
11
15
17
1
2
0
50
100
150
200
250
300
350
W M W M W M W M W M W M W M W M W M W M W M W M W M W M W M W M W M W M W M W M W M W M
Finland Belgium Macedonia,the Former
YugoslavRepublic of
Norway France Sweden Denmark UnitedKingdom
Netherlands Estonia Spain Austria Germany Greece Latvia Ireland Slovenia Serbia Portugal Italy Lithuania Albania
Min
ute
s p
er
da
y
Providing community services and help to otherhouseholds
Providing unpaid caregiving services tohousehold members
Providing unpaid domestic services for own finaluse within household
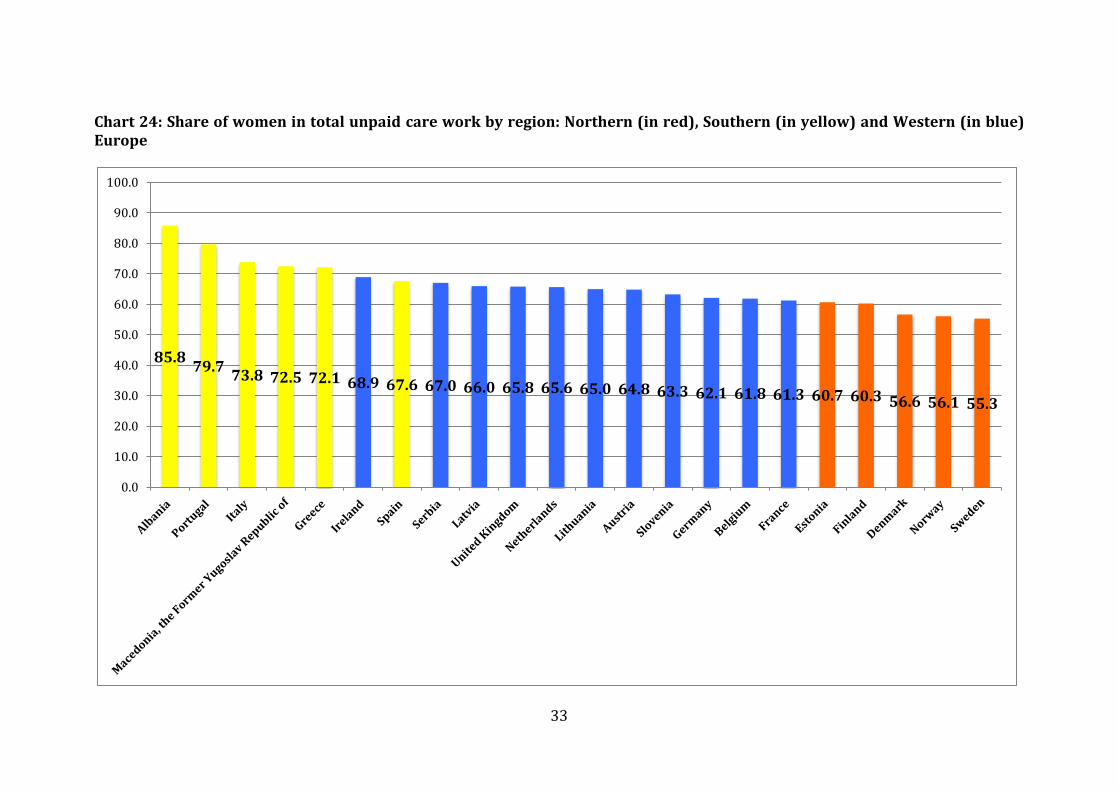
33
Chart 24: Share of women in total unpaid care work by region: Northern (in red), Southern (in yellow) and Western (in blue) Europe
85.879.7
73.8 72.5 72.1 68.9 67.6 67.0 66.0 65.8 65.6 65.0 64.8 63.3 62.1 61.8 61.3 60.7 60.3 56.6 56.1 55.3
0.0
10.0
20.0
30.0
40.0
50.0
60.0
70.0
80.0
90.0
100.0
34
Chart 25: Time spent by women and men in the various categories of unpaid care work by region: Eastern Europe. 6 countries
Chart 26: Share of women in total unpaid care work by region: Eastern Europe
264
125
240
114
242
124
243
127
267
142
270
169
28
12
34
13
39
15
16
6
34
8
0
1
15
14
13
15
15
16
26
23
0
50
100
150
200
250
300
350
W M W M W M W M W M W M
Romania Hungary Belarus Poland Bulgaria Moldova,Republic of
Min
ute
s p
er
da
y
Providing community services and help to other households
Providing unpaid caregiving services to household members
Providing unpaid domestic services for own final use within household
67.9 67.8 65.8 65.3 64.5 62.3
0.0
10.0
20.0
30.0
40.0
50.0
60.0
70.0
80.0
90.0
100.0
Romania Hungary Belarus Poland Bulgaria Moldova,Republic of

35
Chart 27: Time spent by women and men in the various categories of unpaid care work by region: Developed countries (high income). 33 countries

36
Chart 28: Share of women in total unpaid care work by region: Developed countries (high income). 33 countries
82.8
80.479.7
76.773.8
73.472.1
70.4
69.9
69.268.9
67.867.6
66.065.6
65.365.0
64.864.4
64.4
63.9
63.7
63.3
62.1
61.8
61.3
61.1
60.760.3
60.256.6
56.1
55.3
0.0
10.0
20.0
30.0
40.0
50.0
60.0
70.0
80.0
90.0
100.0

37
Chart 29: Time spent by women and men in the various categories of unpaid care work by region: Emerging countries (middle income). 36 countries
139
44
188
18
170
53
144
33
155
40
201
71
136
4
195
88
203
80
246
111
264
125
273
78
250
82
229
56
231
17
232
111
242
124
217
35
297
31
267
142
300
43
201
97
266
126
305
75
282
42
266
54
270
45
288
42
270
169
234
45
258
101
300
52
316
103
312
82
195
51
251
79
31
10
38
14
63
28
53
11
22
8
49
11
29
5
31
11
20
9
44
13
55
9
54
20
34
13
59
9
16
6
85
23
25
10
30
12
46
9
43
5
32
8
34
8
41
5
68
26
45
4
29
10
68
19
192
66
153
58
3
2
4
7
7
3
12
17
1
6
43
28
5
5
3
3
5
9
4
4
1
2
4
8
15
14
17
11
15
16
15
8
10
12
2
2
1
2
6
4
26
23
55
37
13
9
2
3
5 6
3
19
9
0
50
100
150
200
250
300
350
400
450
W M W M W M W M W M W M W M W M W M W M W M W M W M W M W M W M W M W M W M W M W M W M W M W M W M W M W M W M W M W M W M W M W M W M W M W M
ThailandCambodiaCameroonParaguayGhanaMacedoniaEl SalvadorSouth AfricaChinaKazakhstanRomaniaEcuadorKyrgyzstanMauritiusPakistanMongoliaBelarusOcc Palestinian Ter.India BulgariaMoroccoPanama urbanSerbia Iran AlgeriaArmeniaAlbaniaTunisiaMoldovaTurkey Peru IraqAzerbaijanCosta RicaColombiaMexico
Min
ute
s p
er
da
y
Providing community services and help to otherhouseholds
Providing unpaid caregiving services to householdmembers
Providing unpaid domestic services for own finaluse within household
38
Chart 30: Share of women in total unpaid care work by region: Emerging countries (middle income). 36 countries.
91.3
91.1
90.587.5
86.0
85.8
85.8
85.2
84.2
84.1
83.279.9
79.279.1
79.177.8
77.0
76.6
76.4
75.5
74.974.3
74.173.3
72.571.6
71.470.2
70.068.9
67.967.6
67.0
65.8
64.562.3
0.0
10.0
20.0
30.0
40.0
50.0
60.0
70.0
80.0
90.0
100.0

39
Chart 31: Time spent by women and men in the various categories of unpaid care work by region: Developing countries (low income). 6 countries
Chart 32: Share of women in total unpaid care work by region: Developing countries (low income). 6 countries
189
39
187
36
196
52
241
21
231
87
392
204
32
3
28
8
41
9
47
8
73
227
7
1
3
13
30
25
20
0
100
200
300
400
500
600
Wo
me
n
Me
n
Wo
me
n
Me
n
Wo
me
n
Me
n
Wo
me
n
Me
n
Wo
me
n
Me
n
Wo
me
n
Me
n
Benin Madagascar Tanzania,United
Mali Ethiopia Cabo Verde
Min
ute
s p
er
da
y
Providing community services and helpto other households
Providing unpaid caregiving servicesto household members
Providing unpaid domestic services forown final use within household
92.084.0 81.3 78.8
70.0 66.6
0.0
10.0
20.0
30.0
40.0
50.0
60.0
70.0
80.0
90.0
100.0
Mali Benin Madagascar Tanzania,United
Republic of
Ethiopia Cabo Verde

40
Charts 33: Share of women and men in total unpaid care work-Summary by region
55.3% Sweden
82.8 Korea, Rep of
44.7% Sweden 17.2 Korea,
Rep of
0.0
10.0
20.0
30.0
40.0
50.0
60.0
70.0
80.0
90.0
100.0
0 5 10 15 20 25 30 35
Developed countries
Share of women in total unpaidwork
Share of men
62.3 % Moldova,
Rep of
91.3% Cambodia
37.7% Moldova,
Rep of
8.7 % Cambodia0.0
10.0
20.0
30.0
40.0
50.0
60.0
70.0
80.0
90.0
100.0
0 5 10 15 20 25 30 35 40
Emerging countries
Share of women in total unpaidwork
Share of men
66.6% Cabo Verde
92.0% Mali
33.4% Cabo Verde 8.0%
Mali0.0
10.0
20.0
30.0
40.0
50.0
60.0
70.0
80.0
90.0
100.0
0 1 2 3 4 5 6 7
Developing countries
Share of women in total unpaidwork
Share of men
41
Looking now at the share of unpaid care work in total work (paid and unpaid), Chart 34 shows that for women this indicator ranges from a maximum of 91.8 per cent in Iraq (2007) to a minimum of 41 per cent in Cambodia (2004). Very high levels of this indicator (above 74 per cent) characterise Arab countries such as Iraq, the Occupied Palestinian Territory, Oman, Northern African countries (Algeria, Morocco, Tunisia), Central and Western Asia (Turkey, Armenia, Azerbaijan), Southern Asia (Iran, Pakistan), and also Greece and Italy, as well as Costa Rica. Most of these countries are known for their very low female labour force participation rates: women devote almost all their working time to household duties and care. At the bottom of the Chart, on the contrary, women dedicate more than half of their working time to paid work in Asian countries such as Cambodia, Thailand and China, and also in Sub-Saharan countries such as Madagascar and Ghana. Northern European countries that we have already pointed out for their high share of men’s contribution to unpaid care work are situated just above the 50 per cent line (with 54.4 per cent for Sweden, 56 per cent for Norway and 56.6 per cent for Finland). Three Latin American countries also belong to this category: Paraguay (48.3 per cent), Chile (51.9 per cent) and El Salvador (54.3 per cent). The world average is 65.0 per cent (represented by France) where women devote a little bit less than two thirds of their working time to household duties and care for a labour force participation rate of 51.2 per cent in 2014) and the median value is 63.3 per cent (represented by New Zealand where the female labour force participation rate reaches 63.4 per cent in 2014). As to men (Chart 35) the share of unpaid care work in their total work time is everywhere below 50 per cent. Minimums (less than 12 per cent) are observed in India (7.9 per cent), Pakistan (8 per cent), El Salvador (11.1 per cent), Mali (11.4 per cent) and Morocco (11.7 per cent), as well as Thailand and Taiwan China. Such cases reflect very different situations: Thailand and El Salvador, for example, are countries where women dedicate less than 50 per cent of their working time to household chores and care (and respectively 62.5 and 49.3 per cent for their participation to the labour force in 2013-14), whereas in Morocco and Pakistan they dedicate more than 78 per cent of their working time to unpaid care work (and respectively 25.2 and 23.2 per cent for their participation to the labour force in 2014). More generally in countries where women find obstacles to enter the labour market because of their status and the fact that their access to public space is limited by social or religious norms, their contribution to unpaid care work is the highest (top of Chart 34 and bottom of Chart 35) and it is exactly the reverse for countries where women are naturally and socially present on the labour market (bottom of Chart 34 and top of Chart 35). Countries where men devote the larger part of their working time to unpaid care work are the Republic of Moldova (48 per cent) and other Eastern European countries (such as Bulgaria and Romania) or Northern-Western European countries (Denmark, Estonia, Belgium, Sweden), with more than 43 per cent. For men, the world average and the median value are the same with 29.1 per cent (represented by the Former Yugoslav Republic of Macedonia).

42
Finally Charts 36 and 37 present the number of minutes per day women and men spend in unpaid care work and paid work (excluding Uruguay, Slovenia, Cape Verde for which time spent in paid work is not provided by the surveys). The maximum for women for Latin American countries that did not use the diaries in their surveys is observed in Chile (670 minutes or 11 hours and 10 minutes) and the minimum in Paraguay (373 minutes or 6 hours and 13 minutes) whereas the maximum for women for countries that used the diaries is observed in Lithuania (2003) where the total daily working time amounts to 539 minutes (or 8 hours and 59 minutes: 37.4 per cent of a 24-hour day), followed by Mongolia (2011). And the minimum is in Belgium (2013) where the daily working time amounts 313 minutes (or 5 hours and 13 minutes: 21.7 per cent of a 24-hour day). Other countries at the bottom are Arab countries (Qatar, the Occupied Palestinian Territory, Oman), as well as the Republic of Korea and Mali. The world average (including Latin American countries) is 425 minutes (or 7 hours and 5 minutes: 19.2 per cent of a 24-hour day, represented by Latvia 2003) and the median value is 420 minutes (for El Salvador 2010). As for men, again for countries that used the diaries, the maximum is observed in Mongolia with 487 minutes (or 8 hours and 7 minutes: 33.8 per cent of a 24-hour day), followed by Thailand, Latvia, Lithuania and China, and the minimum in the Occupied Palestinian Territory (with 143 minutes or 2 hours and 23 minutes: 9.9 per cent of a day), Mali (184 minutes) and Algeria (252 minutes). For countries that did not use the diaries, the maximum for men is observed in Chile (555 minutes or 9 hours and 15 minutes) and the minimum in Paraguay (373 minutes or 6 hours and 13 minutes). The average working day for men (including Latin America) amounts to 375 minutes (or 6 hours and 15 minutes: 26.0 per cent of a day) represented by Serbia (2010-11) while the median value is 373 minutes (Paraguay 2016). Women’s working time is therefore equivalent to 113 per cent of men’s total working time. Table 2 summarises the findings for world averages: Women devote 2.51 times more time to unpaid care work than men, a little bit more than half (0.57) the time men spend in paid work, and 1.13 more time than men in total work. Table 2: Average time spent by women and men in paid, unpaid and total work 75 countries
In minutes per day Average time of
unpaid work Average time of
paid work Average time of
total work Women 276 152 425
Men 110 266 375 Women/Men 2.51 0.57 1.13
Note: Unweighted averages. Three countries have not collected data on paid work in their time-use surveys: Cabo Verde, Slovenia, Uruguay
More detailed results at world and regional levels will be presented in section 3 below where countries are weighted according to their population.

43
Chart 34: Women’s share of unpaid care work in total women’s work. 72 countries
41.042.643.2
47.448.148.349.151.151.954.254.354.454.655.056.056.456.556.657.158.859.560.060.160.260.660.961.061.561.862.362.462.462.762.862.963.363.564.064.564.764.965.065.066.366.766.867.368.468.468.569.970.070.670.871.172.272.572.974.674.875.576.478.078.678.780.981.382.5
88.589.191.291.8
0.0 10.0 20.0 30.0 40.0 50.0 60.0 70.0 80.0 90.0 100.0
CambodiaThailand
Taiwan, ChinaChina
MadagascarParaguay
GhanaCameroon
ChileLatvia
El SalvadorSweden
MongoliaTanzania, United Republic of
NorwayBenin
Korea, Republic ofFinland
LithuaniaCanada
EthiopiaPanama urban
United StatesBelarus
JapanArgentina (BA)
HungaryUnited Kingdom
EstoniaDenmark
QatarMacedonia, the Former Yugoslav Republic of
AustriaKyrgyzstan
PortugalNew ZealandNetherlandsSouth Africa
EcuadorKazakhstan
PeruIndia
FranceMoldova, Republic of
GermanyIreland
SpainBelgium
PolandBulgaria
MauritiusSerbia
MexicoAustralia
MaliColombiaRomania
AlbaniaTunisia
ItalyArmenia
Costa RicaGreece
PakistanMorocco
AzerbaijanTurkey
OmanIran, Islamic Republic of, urban average
Occupied Palestinian TerritoryAlgeria
Iraq

44
Chart 35: Men’s share of unpaid care work in total men’s work. 72 countries
7.98.011.111.411.511.712.013.714.815.315.816.817.217.517.818.518.919.119.820.320.520.720.721.421.422.322.924.626.327.227.427.827.928.528.529.129.329.831.431.532.332.432.432.632.734.735.235.435.635.736.038.138.138.539.540.040.140.240.840.841.341.341.942.542.743.444.245.746.246.346.948.0
0.0 10.0 20.0 30.0 40.0 50.0 60.0
IndiaPakistan
El SalvadorMali
ThailandMorocco
Taiwan, ChinaKorea, Republic of
BeninTunisia
Tanzania, United Republic ofAlbania
ParaguayMadagascar
ArmeniaIraq
JapanGhana
MauritiusEcuadorPortugal
CameroonChina
Iran, Islamic Republic of, urban averageAlgeria
Costa RicaArgentina (BA)
TurkeyPanama urban
KyrgyzstanPeru
ColombiaChile
MexicoMongolia
Macedonia, the Former Yugoslav Republic ofEthiopia
LatviaSouth Africa
IrelandNetherlands
AzerbaijanQatar
ItalyHungary
LithuaniaBelarus
KazakhstanAustria
New ZealandUnited Kingdom
SpainOman
Occupied Palestinian TerritorySerbia
CanadaUnited States
PolandAustralia
FinlandSlovenia
GreeceNorway
GermanyFrance
RomaniaSweden
BelgiumEstonia
BulgariaDenmark
Moldova, Republic of

45
Chart 36: Time devoted by women to unpaid care work and paid work (in minutes per day), countries ranked by decreasing time devoted to total work. 72 countries
490286309
214199
293274
188241
312307
277229224234
264287
211345
232246
300168
243247263
221277
254269
173330
305230
312212
254228
257261273286
269347
301295314
238298
257326
275264268
311240
214220
297188
222302290291
330237
301385
277339
290308
393423
348
99120
3658
14598
3040
78129135126
10078
16231
145134
81221
147143128
171119
146134
23376
103181
101203
165192
165161150142
16082
129136117
195137
180111
163175171
128201
229228
160270
240178192198
168263
201119
234183
241231
151176322
0 100 200 300 400 500 600 700 800
Cabo VerdeSloveniaUruguayBelgium
QatarOccupied Palestinian Territory
OmanKorea, Republic of
MaliAlgeria
Iran, Islamic Republic of, urban averageGreece
South AfricaMacedonia, the Former Yugoslav Republic of
FranceRomaniaPakistan
FinlandIraq
United KingdomKazakhstan
MoroccoTaiwan, China
DenmarkNew Zealand
SpainBenin
MauritiusNetherlands
GermanyThailand
TurkeyItaly
NorwayArmenia
CameroonJapan
El SalvadorArgentina (BA)
EstoniaEcuadorIrelandAustria
AzerbaijanSerbia
PolandAlbania
Tanzania, United Republic ofBulgaria
CanadaTunisia
KyrgyzstanUnited States
HungaryAustralia
SwedenParaguay
GhanaIndia
CambodiaMadagascar
PortugalBelarus
EthiopiaMoldova, Republic of
ChinaPanama urban
Costa RicaLatvia
PeruMongoliaLithuaniaColombia
MexicoChile
Minutes per day
Unpaid care work
Paid work
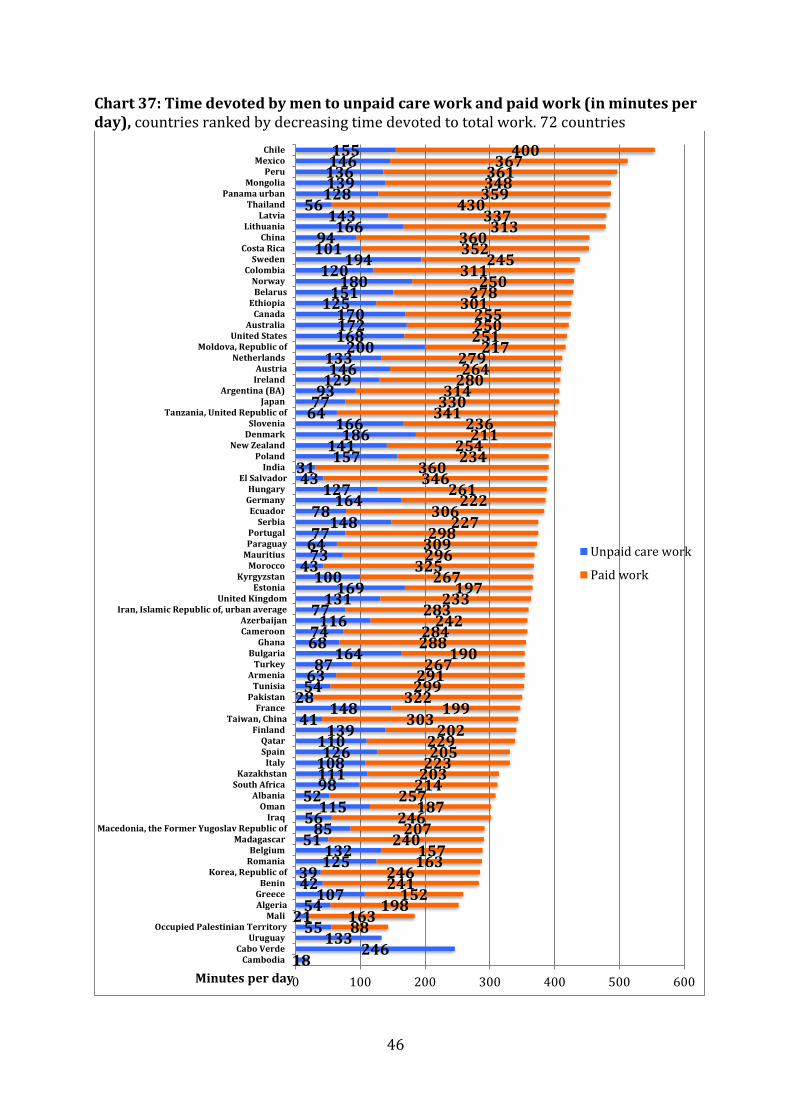
46
Chart 37: Time devoted by men to unpaid care work and paid work (in minutes per day), countries ranked by decreasing time devoted to total work. 72 countries
18246
13355
2154
1074239
125132
5185
56115
5298111108126
110139
41148
285463
87164
6874
11677
131169
10043
736477
14878
164127
4331
157141
186166
647793129146
133200
168172170
125151
180120
19410194
166143
56128139136146155
88163
198152
241246
163157
240207
246187
257214203223205229
202303
199322
299291
267190
288284
242283
233197
267325
296309298
227306
222261
346360
234254
211236
341330314
280264
279217
251250255
301278
250311
245352360
313337
430359348361
367400
0 100 200 300 400 500 600
CambodiaCabo Verde
UruguayOccupied Palestinian Territory
MaliAlgeriaGreece
BeninKorea, Republic of
RomaniaBelgium
MadagascarMacedonia, the Former Yugoslav Republic of
IraqOman
AlbaniaSouth Africa
KazakhstanItaly
SpainQatar
FinlandTaiwan, China
FrancePakistan
TunisiaArmenia
TurkeyBulgaria
GhanaCameroonAzerbaijan
Iran, Islamic Republic of, urban averageUnited Kingdom
EstoniaKyrgyzstan
MoroccoMauritiusParaguayPortugal
SerbiaEcuador
GermanyHungary
El SalvadorIndia
PolandNew Zealand
DenmarkSlovenia
Tanzania, United Republic ofJapan
Argentina (BA)IrelandAustria
NetherlandsMoldova, Republic of
United StatesAustralia
CanadaEthiopia
BelarusNorway
ColombiaSweden
Costa RicaChina
LithuaniaLatvia
ThailandPanama urban
MongoliaPeru
MexicoChile
Minutes per day
Unpaid care work
Paid work
47
Section 3: Gender variations in paid work and unpaid care work in the various regions of the world: global averages In Section 2, we presented the results on paid work and unpaid care work by country regrouped by regions. Global averages presented there were simple (unweighted) averages that provide a general profile by region (each country having the same weight). In this section, the global averages and the averages by countries grouped by income levels, and by region, are calculated using weighted averages. Each of the 75 countries we have data for (there is no national data for Cuba) is weighted by its population in 2015, as provided by the most recent revision of the World Population Prospects of the United Nations Population Division. The 75 countries represent 67.8% of world total population. Consequently, the world and regional averages presented in this section are impacted by the weight of two countries: China and India that represent more than 53.6 per cent of the population of the 75 countries with data on time-use. 1) World estimates Charts 38 show that at world level, women dedicate 3.2 times more time than men to unpaid care work: 4 hours and 32 minutes (272 minutes) per day against 1 hour and 24 minutes for men (84 minutes), or more than three-fourths (76.4 per cent) of the total amount of unpaid care work. On the contrary, women devote a little bit more than 1/3 (36.1 per cent) of the total amount of paid work, or 0.3 time the time dedicated by men: 3 hours and 1 minute (181 minutes) against 5 hours and 21 minutes (321 minutes) for men. As to total work obtained by adding up unpaid care work and paid work, it appears that the women’s burden is heavier than men’s by 5.8 percentage points (2.9 percentage point above parity): 7 hours and 33 minutes per day (453 minutes), against 6 hours and 44 minutes for men (404 minutes). But gender inequality mostly resides in the unequal distribution of roles between paid work and unpaid care work.

48
Charts 38: Gender distribution of paid work, unpaid care work and total work: world average, 75 countries
272181
453
84321
404
0
100
200
300
400
500
600
700
800
900
Unpaid care work Paid work Total work
Min
ute
s p
er
da
y
Men
Women
76.4
36.1
52.9
23.6
63.9
47.1
0%
10%
20%
30%
40%
50%
60%
70%
80%
90%
100%
Unpaid care work Paid work Total work
Men
Women
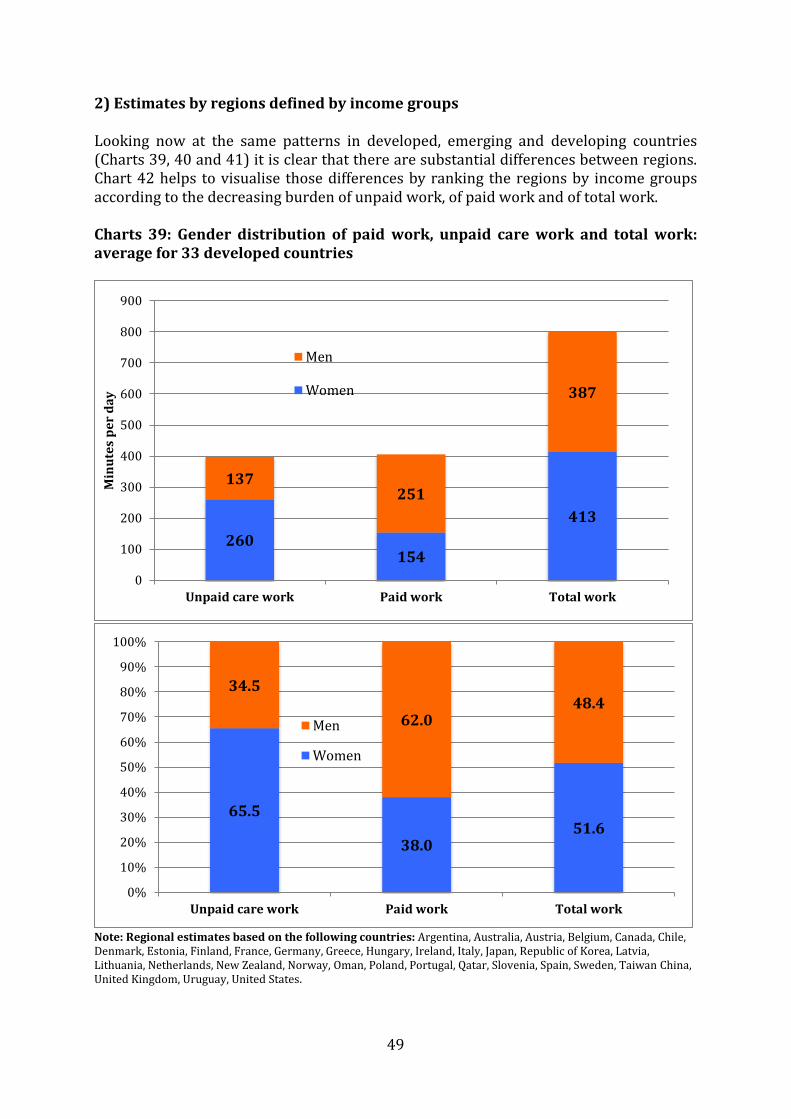
49
2) Estimates by regions defined by income groups Looking now at the same patterns in developed, emerging and developing countries (Charts 39, 40 and 41) it is clear that there are substantial differences between regions. Chart 42 helps to visualise those differences by ranking the regions by income groups according to the decreasing burden of unpaid work, of paid work and of total work. Charts 39: Gender distribution of paid work, unpaid care work and total work: average for 33 developed countries
Note: Regional estimates based on the following countries: Argentina, Australia, Austria, Belgium, Canada, Chile, Denmark, Estonia, Finland, France, Germany, Greece, Hungary, Ireland, Italy, Japan, Republic of Korea, Latvia, Lithuania, Netherlands, New Zealand, Norway, Oman, Poland, Portugal, Qatar, Slovenia, Spain, Sweden, Taiwan China, United Kingdom, Uruguay, United States.
260154
413
137251
387
0
100
200
300
400
500
600
700
800
900
Unpaid care work Paid work Total work
Min
ute
s p
er
da
y
Men
Women
65.5
38.051.6
34.5
62.048.4
0%
10%
20%
30%
40%
50%
60%
70%
80%
90%
100%
Unpaid care work Paid work Total work
Men
Women
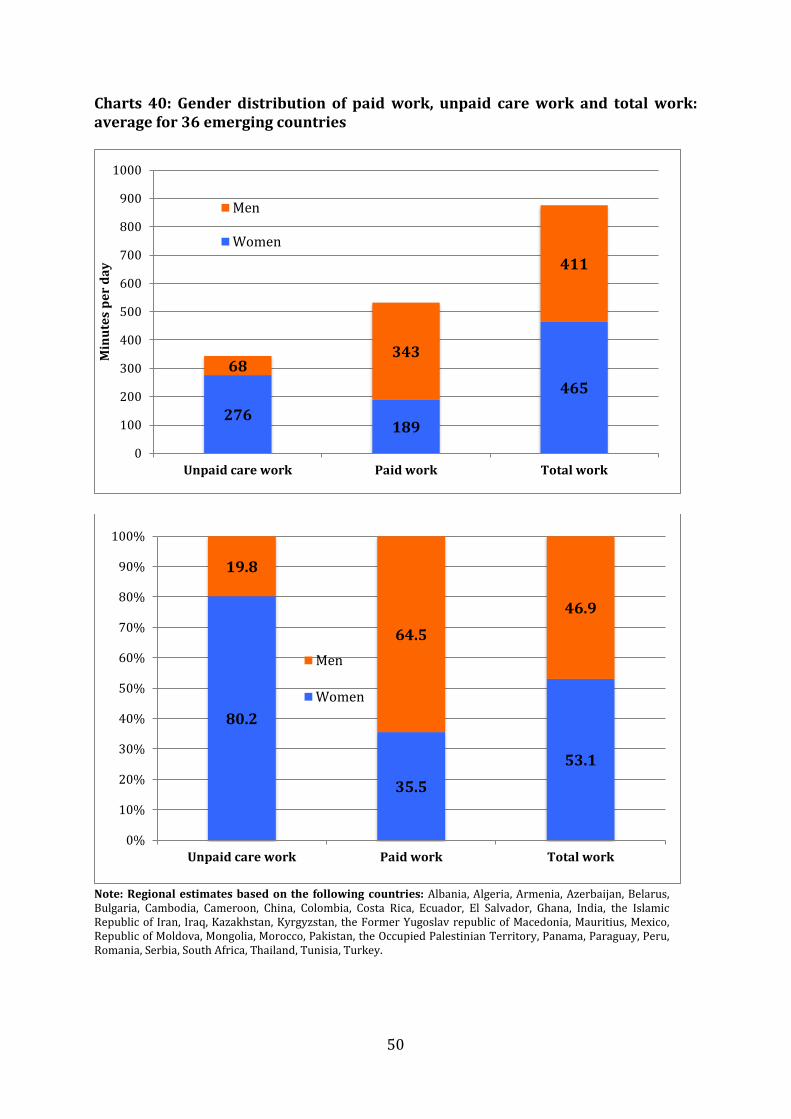
50
Charts 40: Gender distribution of paid work, unpaid care work and total work: average for 36 emerging countries
Note: Regional estimates based on the following countries: Albania, Algeria, Armenia, Azerbaijan, Belarus, Bulgaria, Cambodia, Cameroon, China, Colombia, Costa Rica, Ecuador, El Salvador, Ghana, India, the Islamic Republic of Iran, Iraq, Kazakhstan, Kyrgyzstan, the Former Yugoslav republic of Macedonia, Mauritius, Mexico, Republic of Moldova, Mongolia, Morocco, Pakistan, the Occupied Palestinian Territory, Panama, Paraguay, Peru, Romania, Serbia, South Africa, Thailand, Tunisia, Turkey.
276189
465
68343
411
0
100
200
300
400
500
600
700
800
900
1000
Unpaid care work Paid work Total work
Min
ute
s p
er
da
y
Men
Women
80.2
35.5
53.1
19.8
64.5
46.9
0%
10%
20%
30%
40%
50%
60%
70%
80%
90%
100%
Unpaid care work Paid work Total work
Men
Women

51
Charts 41: Gender distribution of paid work, unpaid care work and total work: average for 6 developing countries
Note: Regional estimates based on the following countries: Benin, Cabo Verde, Ethiopia, Madagascar, Mali, the United Republic of Tanzania.
262192
453
88289
376
0
100
200
300
400
500
600
700
800
900
Unpaid care work Paid work Total work
Min
ute
s p
er
da
y
Men
Women
74.9
39.9
54.6
25.1
60.1
45.4
0%
10%
20%
30%
40%
50%
60%
70%
80%
90%
100%
Unpaid care work Paid work Total work
Men
Women
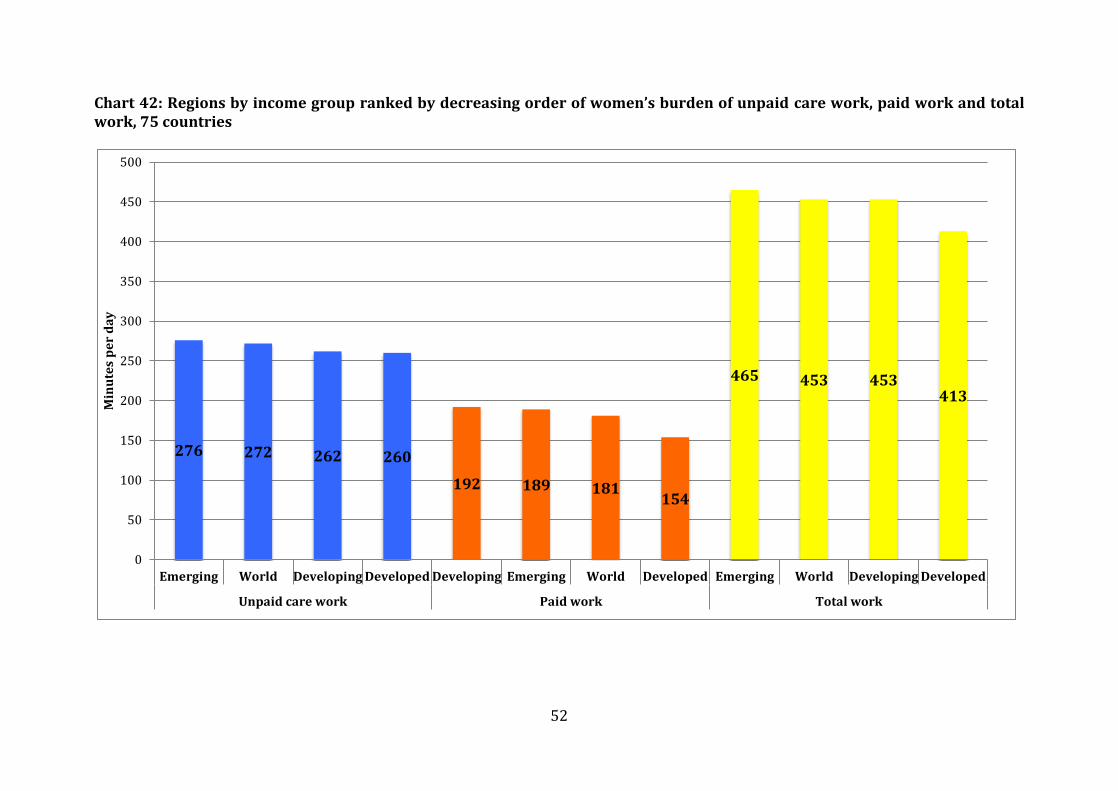
52
Chart 42: Regions by income group ranked by decreasing order of women’s burden of unpaid care work, paid work and total work, 75 countries
276 272 262 260
192 189 181154
465 453 453413
0
50
100
150
200
250
300
350
400
450
500
Emerging World Developing Developed Developing Emerging World Developed Emerging World Developing Developed
Unpaid care work Paid work Total work
Min
ute
s p
er
da
y
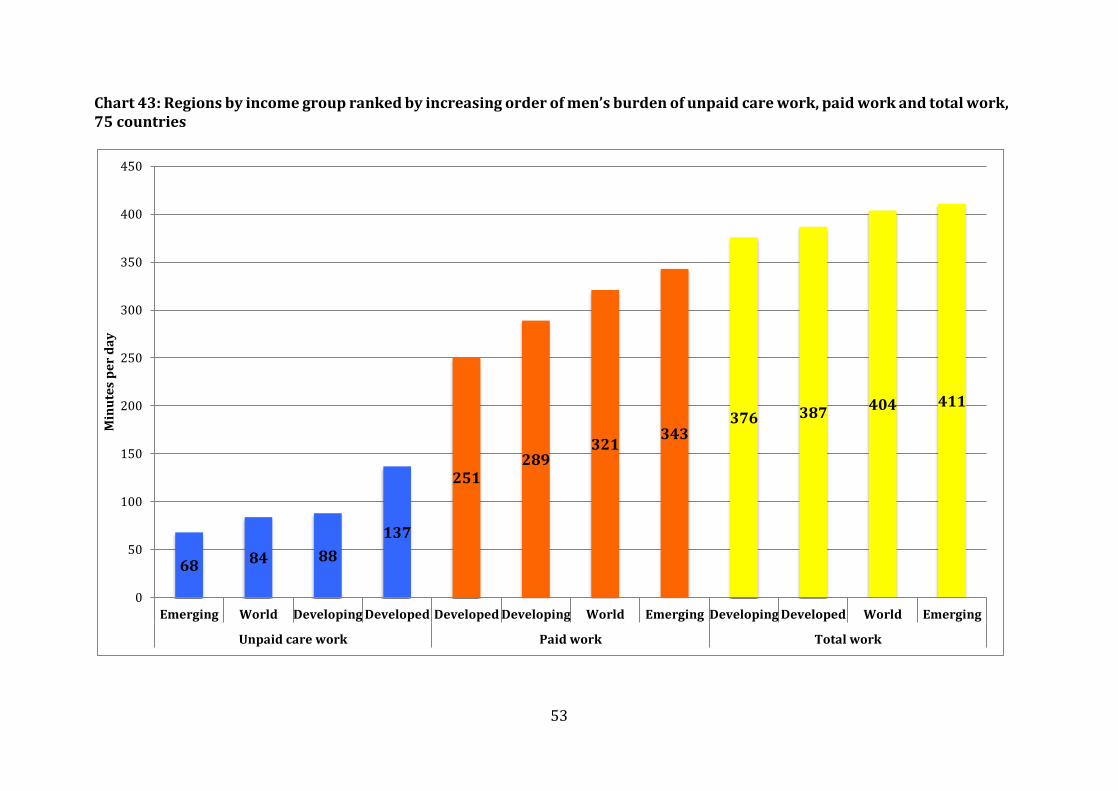
53
Chart 43: Regions by income group ranked by increasing order of men’s burden of unpaid care work, paid work and total work, 75 countries
68 84 88
137
251289
321343
376 387404 411
0
50
100
150
200
250
300
350
400
450
Emerging World Developing Developed Developed Developing World Emerging Developing Developed World Emerging
Unpaid care work Paid work Total work
Min
ute
s p
er
da
y
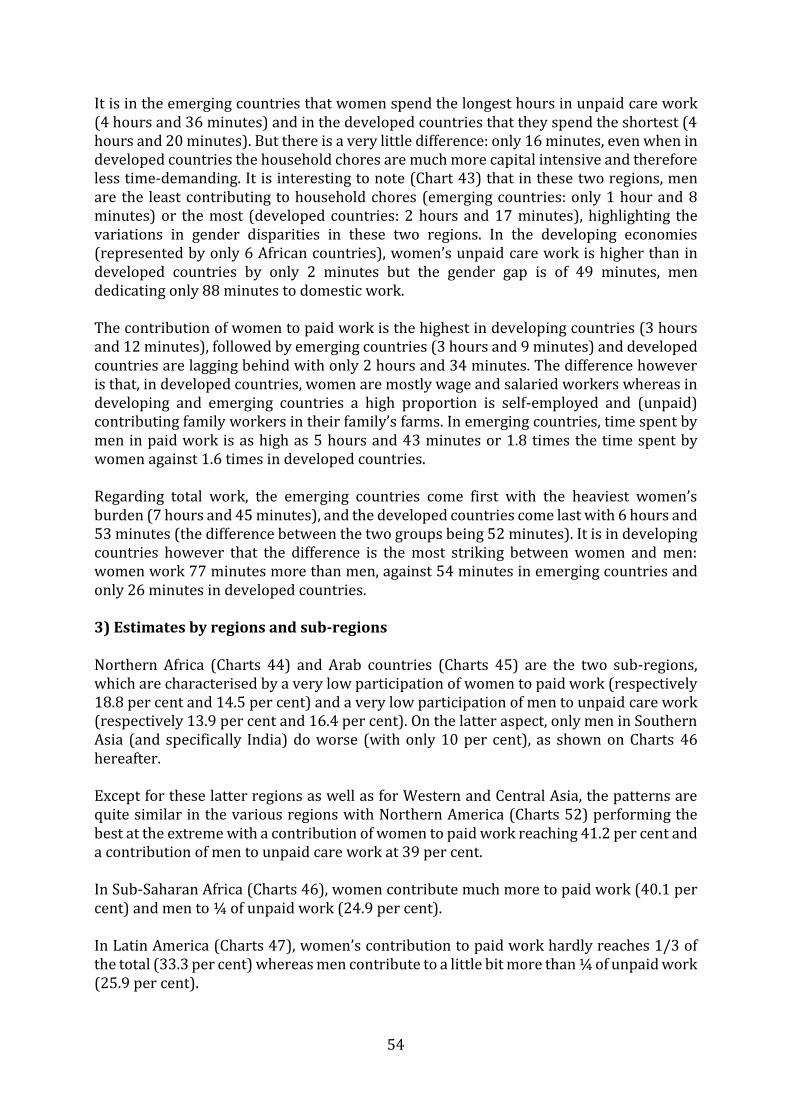
54
It is in the emerging countries that women spend the longest hours in unpaid care work (4 hours and 36 minutes) and in the developed countries that they spend the shortest (4 hours and 20 minutes). But there is a very little difference: only 16 minutes, even when in developed countries the household chores are much more capital intensive and therefore less time-demanding. It is interesting to note (Chart 43) that in these two regions, men are the least contributing to household chores (emerging countries: only 1 hour and 8 minutes) or the most (developed countries: 2 hours and 17 minutes), highlighting the variations in gender disparities in these two regions. In the developing economies (represented by only 6 African countries), women’s unpaid care work is higher than in developed countries by only 2 minutes but the gender gap is of 49 minutes, men dedicating only 88 minutes to domestic work. The contribution of women to paid work is the highest in developing countries (3 hours and 12 minutes), followed by emerging countries (3 hours and 9 minutes) and developed countries are lagging behind with only 2 hours and 34 minutes. The difference however is that, in developed countries, women are mostly wage and salaried workers whereas in developing and emerging countries a high proportion is self-employed and (unpaid) contributing family workers in their family’s farms. In emerging countries, time spent by men in paid work is as high as 5 hours and 43 minutes or 1.8 times the time spent by women against 1.6 times in developed countries. Regarding total work, the emerging countries come first with the heaviest women’s burden (7 hours and 45 minutes), and the developed countries come last with 6 hours and 53 minutes (the difference between the two groups being 52 minutes). It is in developing countries however that the difference is the most striking between women and men: women work 77 minutes more than men, against 54 minutes in emerging countries and only 26 minutes in developed countries. 3) Estimates by regions and sub-regions Northern Africa (Charts 44) and Arab countries (Charts 45) are the two sub-regions, which are characterised by a very low participation of women to paid work (respectively 18.8 per cent and 14.5 per cent) and a very low participation of men to unpaid care work (respectively 13.9 per cent and 16.4 per cent). On the latter aspect, only men in Southern Asia (and specifically India) do worse (with only 10 per cent), as shown on Charts 46 hereafter. Except for these latter regions as well as for Western and Central Asia, the patterns are quite similar in the various regions with Northern America (Charts 52) performing the best at the extreme with a contribution of women to paid work reaching 41.2 per cent and a contribution of men to unpaid care work at 39 per cent. In Sub-Saharan Africa (Charts 46), women contribute much more to paid work (40.1 per cent) and men to ¼ of unpaid work (24.9 per cent). In Latin America (Charts 47), women’s contribution to paid work hardly reaches 1/3 of the total (33.3 per cent) whereas men contribute to a little bit more than ¼ of unpaid work (25.9 per cent).
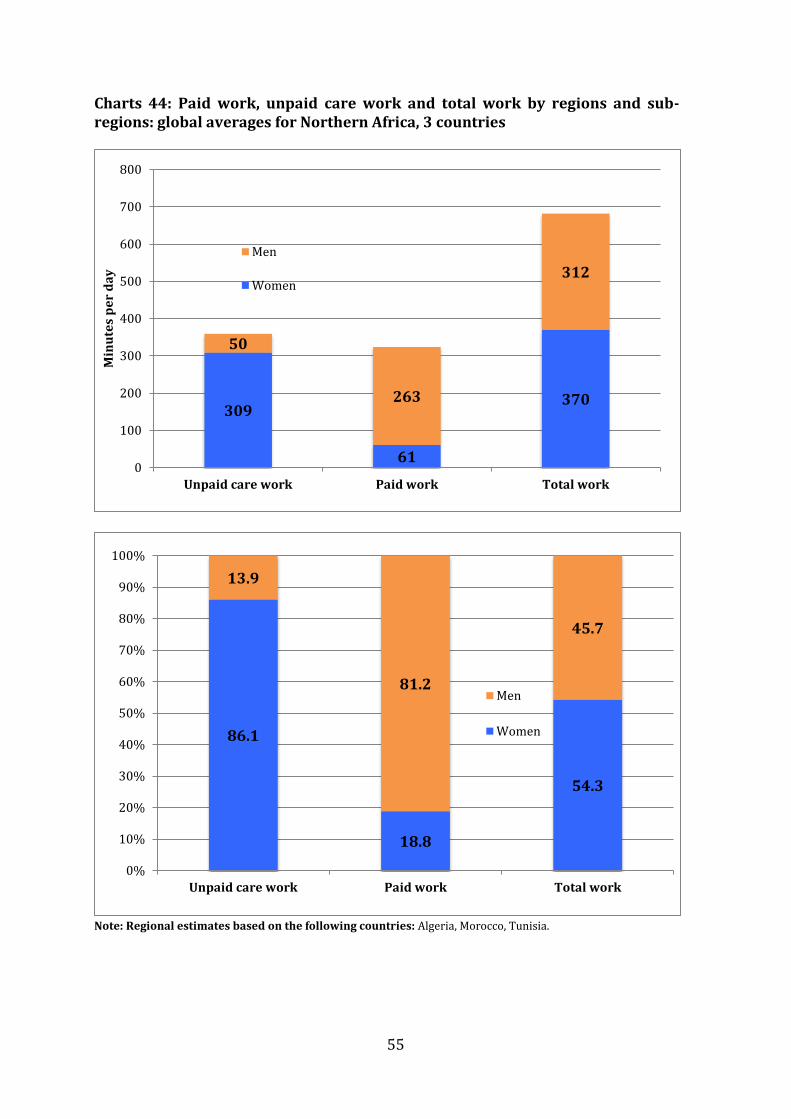
55
Charts 44: Paid work, unpaid care work and total work by regions and sub-regions: global averages for Northern Africa, 3 countries
Note: Regional estimates based on the following countries: Algeria, Morocco, Tunisia.
309
61
370
50
263
312
0
100
200
300
400
500
600
700
800
Unpaid care work Paid work Total work
Min
ute
s p
er
da
y
Men
Women
86.1
18.8
54.3
13.9
81.2
45.7
0%
10%
20%
30%
40%
50%
60%
70%
80%
90%
100%
Unpaid care work Paid work Total work
Men
Women

56
Charts 45: Paid work, unpaid care work and total work by regions and sub-regions: global averages for Arab countries, 4 countries
Note: Regional estimates based on the following countries: Iraq, Oman, Occupied Palestinian Territory, Qatar
326
38
365
64
224
288
0
100
200
300
400
500
600
700
800
Unpaid care work Paid work Total work
Min
ute
s p
er
da
y
Men
Women
83.6
14.5
55.9
16.4
85.5
44.1
0%
10%
20%
30%
40%
50%
60%
70%
80%
90%
100%
Unpaid care work Paid work Total work
Men
Women

57
Charts 46: Paid work, unpaid care work and total work by regions and sub-regions: global averages for Sub-Saharan Africa, 10 countries
Note: Regional estimates based on the following countries: Benin, Cameroon, Cabo Verde, Ethiopia, Ghana, Madagascar, Mali Mauritius, South Africa, United Republic of Tanzania.
249184
432
87275
361
0
100
200
300
400
500
600
700
800
900
Unpaid care work Paid work Total work
Min
ute
s p
er
da
y
Men
Women
74.1
40.1
54.5
25.9
59.9
45.5
0%
10%
20%
30%
40%
50%
60%
70%
80%
90%
100%
Unpaid care work Paid work Total work
Men
Women
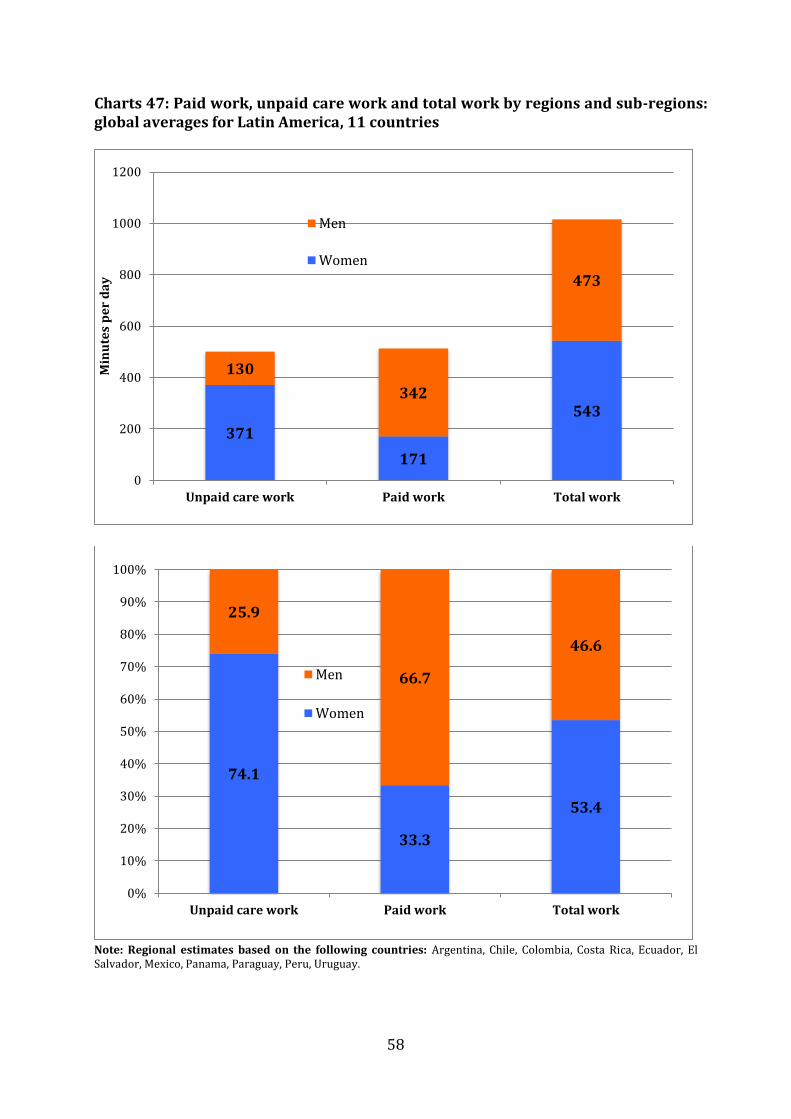
58
Charts 47: Paid work, unpaid care work and total work by regions and sub-regions: global averages for Latin America, 11 countries
Note: Regional estimates based on the following countries: Argentina, Chile, Colombia, Costa Rica, Ecuador, El Salvador, Mexico, Panama, Paraguay, Peru, Uruguay.
371
171
543
130
342
473
0
200
400
600
800
1000
1200
Unpaid care work Paid work Total work
Min
ute
s p
er
da
y
Men
Women
74.1
33.3
53.4
25.9
66.7
46.6
0%
10%
20%
30%
40%
50%
60%
70%
80%
90%
100%
Unpaid care work Paid work Total work
Men
Women

59
Charts 48: Paid work, unpaid care work and total work by regions and sub-regions: global averages for Eastern Asia, 5 countries
Note: Regional estimates based on the following countries: China, Japan, Republic of Korea, Mongolia, Taiwan China.
236 251
48790
353
443
0
100
200
300
400
500
600
700
800
900
1000
Unpaid care work Paid work Total work
Min
ute
s p
er
da
y
Men
Women
72.4
41.652.4
27.6
58.447.6
0%
10%
20%
30%
40%
50%
60%
70%
80%
90%
100%
Unpaid care work Paid work Total work
Men
Women

60
Charts 49: Paid work, unpaid care work and total work by regions and sub-regions: global averages for South-Eastern Asia and the Pacific, 4 countries
Note: Regional estimates based on the following countries: Australia, Cambodia, New Zealand, Thailand.
208 212
42079
325
401
0
100
200
300
400
500
600
700
800
900
Unpaid care work Paid work Total work
Min
ute
s p
er
da
y
Men
Women
72.5
39.551.2
27.5
60.548.8
0%
10%
20%
30%
40%
50%
60%
70%
80%
90%
100%
Unpaid care work Paid work Total work
Men
Women
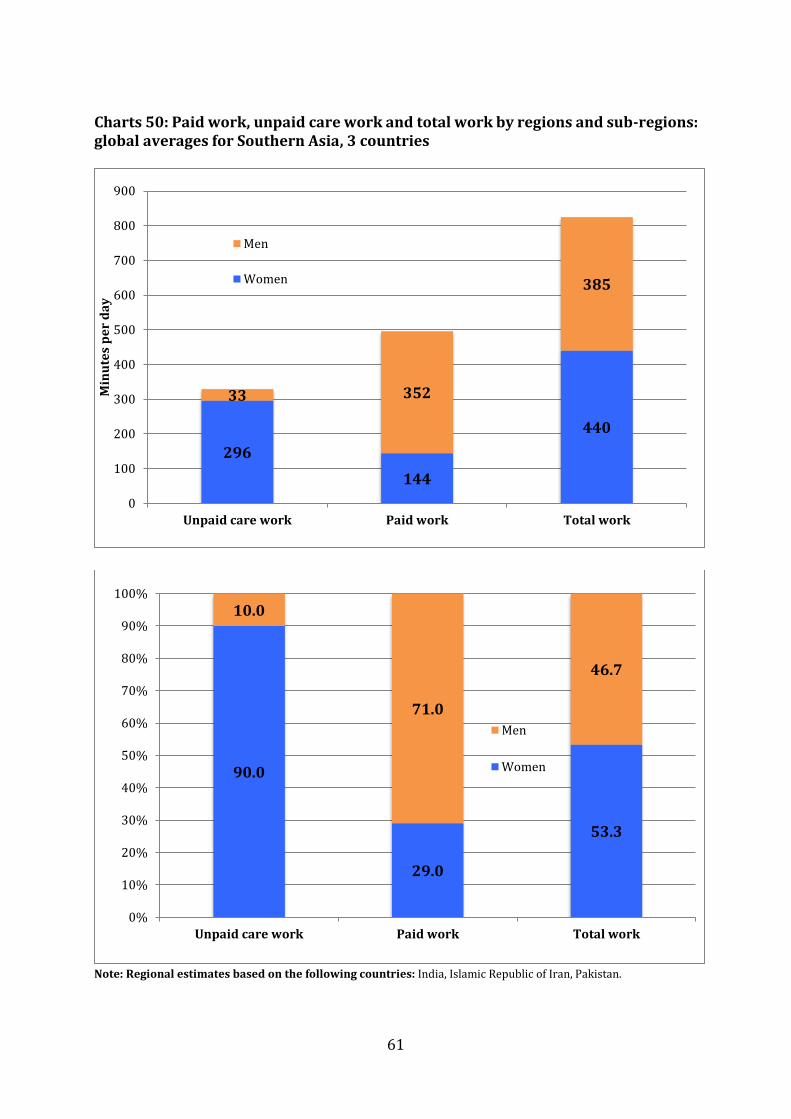
61
Charts 50: Paid work, unpaid care work and total work by regions and sub-regions: global averages for Southern Asia, 3 countries
Note: Regional estimates based on the following countries: India, Islamic Republic of Iran, Pakistan.
296
144
440
33 352
385
0
100
200
300
400
500
600
700
800
900
Unpaid care work Paid work Total work
Min
ute
s p
er
da
y
Men
Women
90.0
29.0
53.3
10.0
71.0
46.7
0%
10%
20%
30%
40%
50%
60%
70%
80%
90%
100%
Unpaid care work Paid work Total work
Men
Women

62
Charts 51: Paid work, unpaid care work and total work by regions and sub-regions: global averages for Central and Western Asia, 5 countries
Note: Regional estimates based on the following countries: Armenia, Azerbaijan, Kazakhstan, Kyrgyzstan, Turkey.
309
96
406
95
257
353
0
100
200
300
400
500
600
700
800
Unpaid care work Paid work Total work
Min
ute
s p
er
da
y
Men
Women
76.5
27.2
53.5
23.5
72.8
46.5
0%
10%
20%
30%
40%
50%
60%
70%
80%
90%
100%
Unpaid care work Paid work Total work
Men
Women
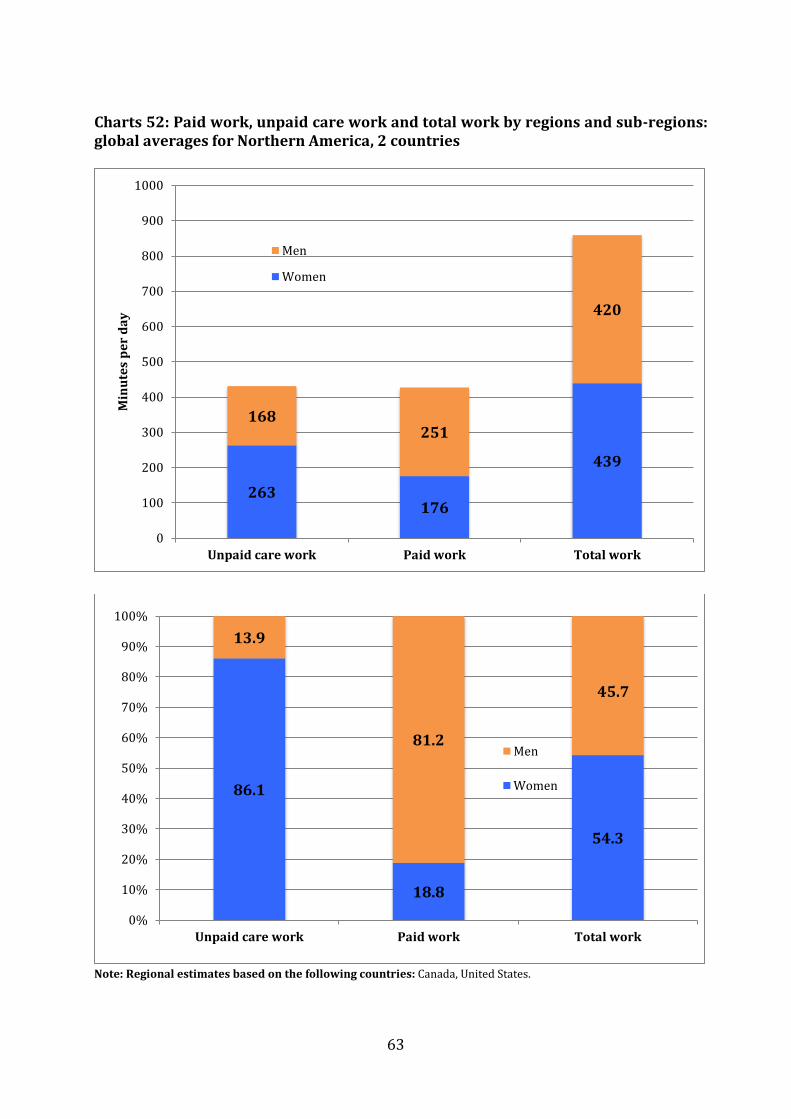
63
Charts 52: Paid work, unpaid care work and total work by regions and sub-regions: global averages for Northern America, 2 countries
Note: Regional estimates based on the following countries: Canada, United States.
263176
439
168251
420
0
100
200
300
400
500
600
700
800
900
1000
Unpaid care work Paid work Total work
Min
ute
s p
er
da
y
Men
Women
86.1
18.8
54.3
13.9
81.2
45.7
0%
10%
20%
30%
40%
50%
60%
70%
80%
90%
100%
Unpaid care work Paid work Total work
Men
Women

64
Charts 53: Paid work, unpaid care work and total work by regions and sub-regions: global averages for Northern, Southern and Western Europe, 22 countries
Note: Regional estimates based on the following countries: Albania, Austria, Belgium, Denmark, Estonia, Finland, France, Germany, Greece, Ireland, Italy, Latvia, Lithuania, the Former Yugoslav Republic of Macedonia, Netherlands, Norway, Portugal, Serbia, Slovenia, Spain, Sweden, United Kingdom
261
132
391
138
222
360
0
100
200
300
400
500
600
700
800
Unpaid care work Paid work Total work
Min
ute
s p
er
da
y
Men
Women
65.4
37.3
52.1
34.6
62.7
47.9
0%
10%
20%
30%
40%
50%
60%
70%
80%
90%
100%
Unpaid care work Paid work Total work
Men
Women
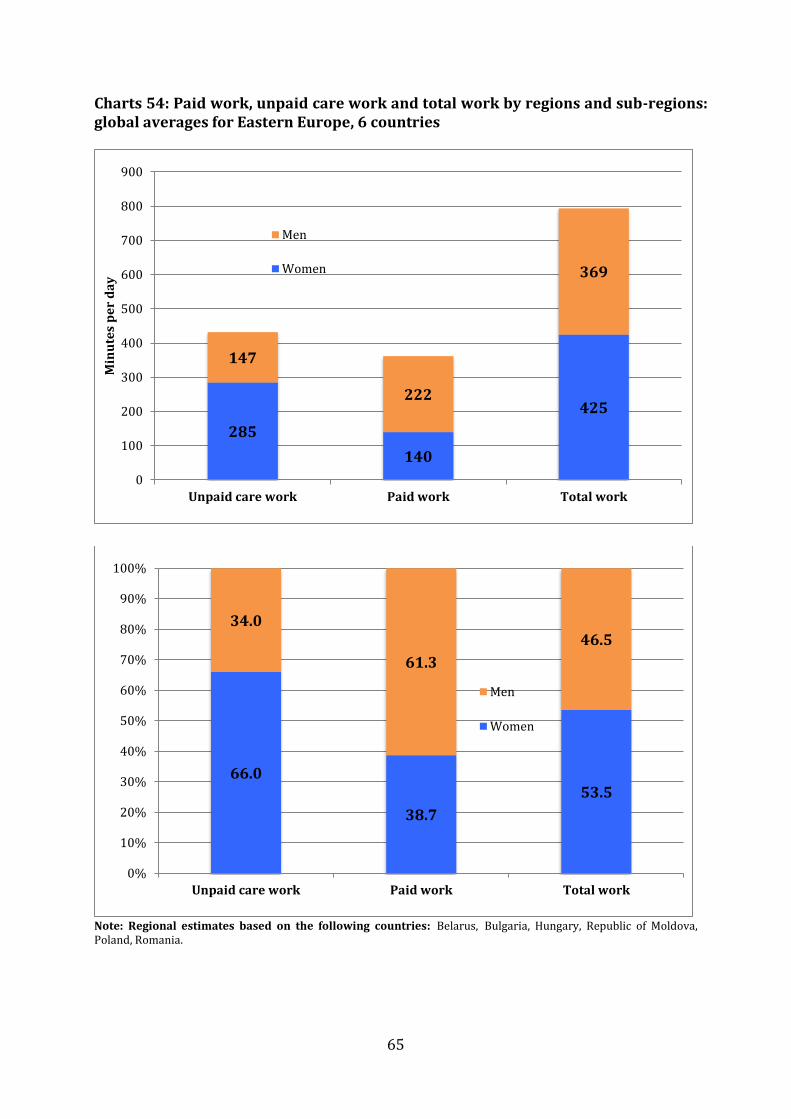
65
Charts 54: Paid work, unpaid care work and total work by regions and sub-regions: global averages for Eastern Europe, 6 countries
Note: Regional estimates based on the following countries: Belarus, Bulgaria, Hungary, Republic of Moldova, Poland, Romania.
285
140
425
147
222
369
0
100
200
300
400
500
600
700
800
900
Unpaid care work Paid work Total work
Min
ute
s p
er
da
y
Men
Women
66.0
38.7
53.5
34.0
61.3
46.5
0%
10%
20%
30%
40%
50%
60%
70%
80%
90%
100%
Unpaid care work Paid work Total work
Men
Women
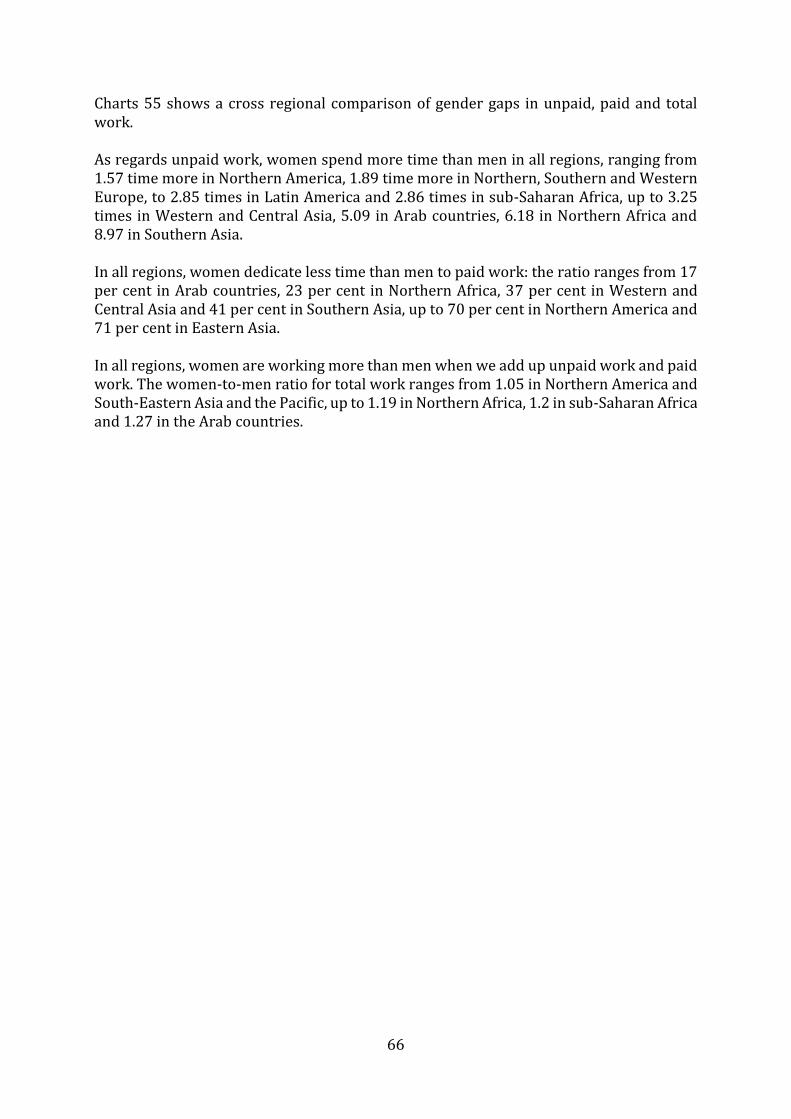
66
Charts 55 shows a cross regional comparison of gender gaps in unpaid, paid and total work. As regards unpaid work, women spend more time than men in all regions, ranging from 1.57 time more in Northern America, 1.89 time more in Northern, Southern and Western Europe, to 2.85 times in Latin America and 2.86 times in sub-Saharan Africa, up to 3.25 times in Western and Central Asia, 5.09 in Arab countries, 6.18 in Northern Africa and 8.97 in Southern Asia. In all regions, women dedicate less time than men to paid work: the ratio ranges from 17 per cent in Arab countries, 23 per cent in Northern Africa, 37 per cent in Western and Central Asia and 41 per cent in Southern Asia, up to 70 per cent in Northern America and 71 per cent in Eastern Asia. In all regions, women are working more than men when we add up unpaid work and paid work. The women-to-men ratio for total work ranges from 1.05 in Northern America and South-Eastern Asia and the Pacific, up to 1.19 in Northern Africa, 1.2 in sub-Saharan Africa and 1.27 in the Arab countries.
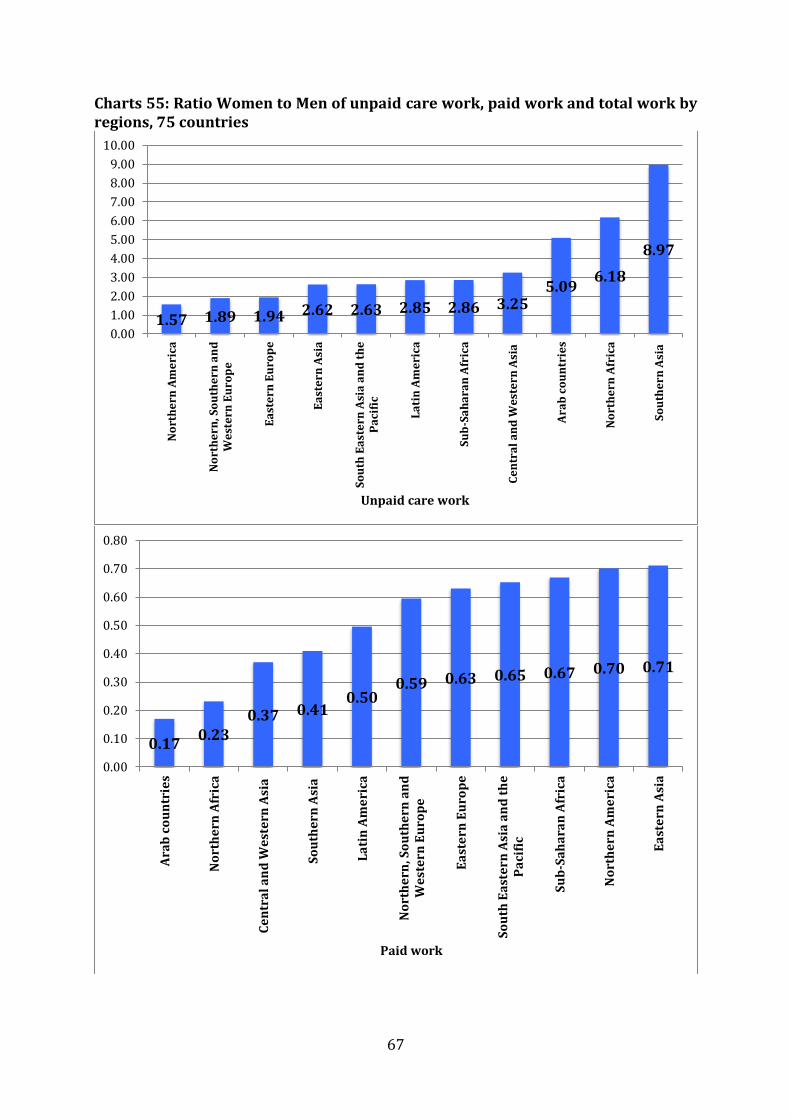
67
Charts 55: Ratio Women to Men of unpaid care work, paid work and total work by regions, 75 countries
1.57 1.89 1.94 2.62 2.63 2.85 2.86 3.255.09
6.18
8.97
0.00
1.00
2.00
3.00
4.00
5.00
6.00
7.00
8.00
9.00
10.00
No
rth
ern
Am
eri
ca
No
rth
ern
, So
uth
ern
an
dW
est
ern
Eu
rop
e
Ea
ste
rn E
uro
pe
Ea
ste
rn A
sia
So
uth
Ea
ste
rn A
sia
an
d t
he
Pa
cifi
c
La
tin
Am
eri
ca
Su
b-S
ah
ara
n A
fric
a
Ce
ntr
al
an
d W
est
ern
Asi
a
Ara
b c
ou
ntr
ies
No
rth
ern
Afr
ica
So
uth
ern
Asi
a
Unpaid care work
0.170.23
0.37 0.410.50
0.59 0.63 0.65 0.67 0.70 0.71
0.00
0.10
0.20
0.30
0.40
0.50
0.60
0.70
0.80
Ara
b c
ou
ntr
ies
No
rth
ern
Afr
ica
Ce
ntr
al
an
d W
est
ern
Asi
a
So
uth
ern
Asi
a
La
tin
Am
eri
ca
No
rth
ern
, So
uth
ern
an
dW
est
ern
Eu
rop
e
Ea
ste
rn E
uro
pe
So
uth
Ea
ste
rn A
sia
an
d t
he
Pa
cifi
c
Su
b-S
ah
ara
n A
fric
a
No
rth
ern
Am
eri
ca
Ea
ste
rn A
sia
Paid work
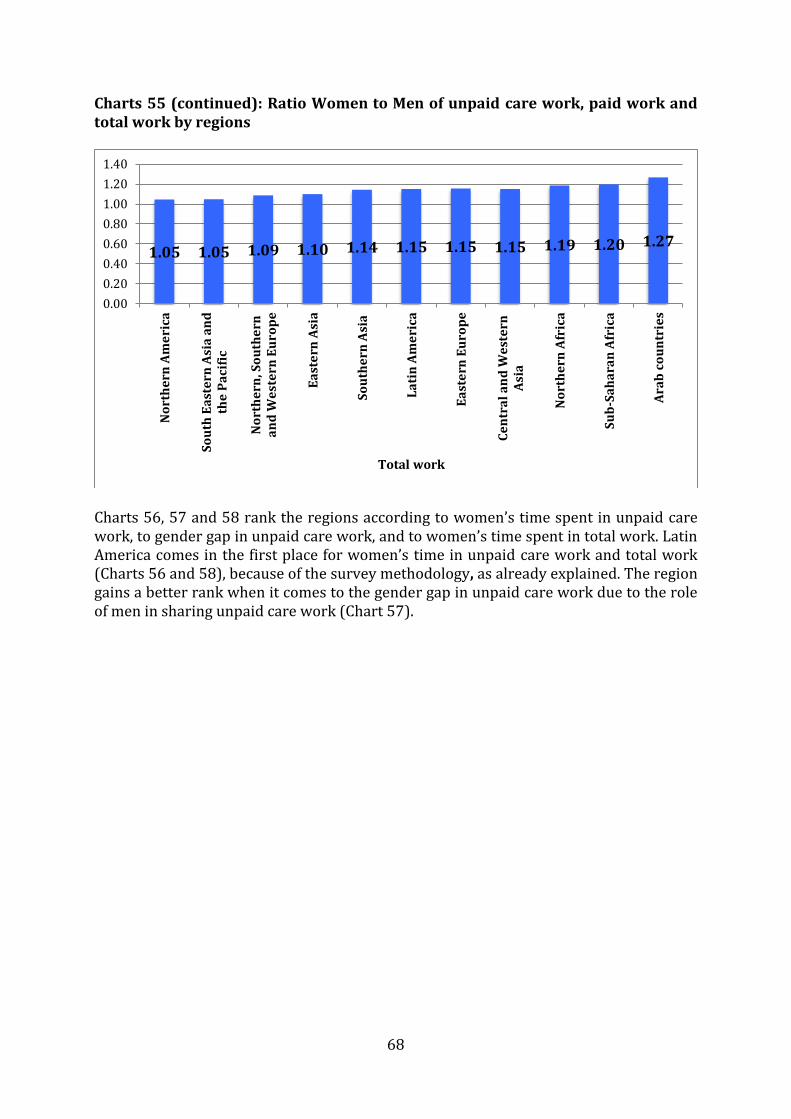
68
Charts 55 (continued): Ratio Women to Men of unpaid care work, paid work and total work by regions
Charts 56, 57 and 58 rank the regions according to women’s time spent in unpaid care work, to gender gap in unpaid care work, and to women’s time spent in total work. Latin America comes in the first place for women’s time in unpaid care work and total work (Charts 56 and 58), because of the survey methodology, as already explained. The region gains a better rank when it comes to the gender gap in unpaid care work due to the role of men in sharing unpaid care work (Chart 57).
1.05 1.05 1.09 1.10 1.14 1.15 1.15 1.15 1.19 1.20 1.27
0.00
0.20
0.40
0.60
0.80
1.00
1.20
1.40N
ort
he
rn A
me
rica
So
uth
Ea
ste
rn A
sia
an
dth
e P
aci
fic
No
rth
ern
, So
uth
ern
an
d W
est
ern
Eu
rop
e
Ea
ste
rn A
sia
So
uth
ern
Asi
a
La
tin
Am
eri
ca
Ea
ste
rn E
uro
pe
Ce
ntr
al
an
d W
est
ern
Asi
a
No
rth
ern
Afr
ica
Su
b-S
ah
ara
n A
fric
a
Ara
b c
ou
ntr
ies
Total work

69
Chart 56: Regions ranked by decreasing order of women's time in unpaid care work
0
100
200
300
400
500
600W
om
en
Men
Wo
men
Men
Wo
men
Men
Wo
men
Men
Wo
men
Men
Wo
men
Men
Wo
men
Men
Wo
men
Men
Wo
men
Men
Wo
men
Men
Wo
men
Men
LatinAmerica
Arabcountries
Central andWestern Asia
NorthernAfrica
SouthernAsia
EasternEurope
NorthernAmerica
Northern,Southern and
WesternEurope
Sub-SaharanAfrica
Eastern Asia SouthEastern Asia
and thePacific
Min
ute
s p
er
da
y
Unpaid carework
Paid work
Total work

70
Chart 57: Regions ranked by decreasing order of gender gap in unpaid care work
0
100
200
300
400
500
600W
om
en
Men
Wo
men
Men
Wo
men
Men
Wo
men
Men
Wo
men
Men
Wo
men
Men
Wo
men
Men
Wo
men
Men
Wo
men
Men
Wo
men
Men
Wo
men
Men
SouthernAsia
Arabcountries
NorthernAfrica
LatinAmerica
Central andWestern Asia
Sub-SaharanAfrica
Eastern Asia EasternEurope
SouthEastern Asia
and thePacific
Northern,Southern and
WesternEurope
NorthernAmerica
Min
ute
s p
er
da
y
Unpaid care work
Paid work
Total work
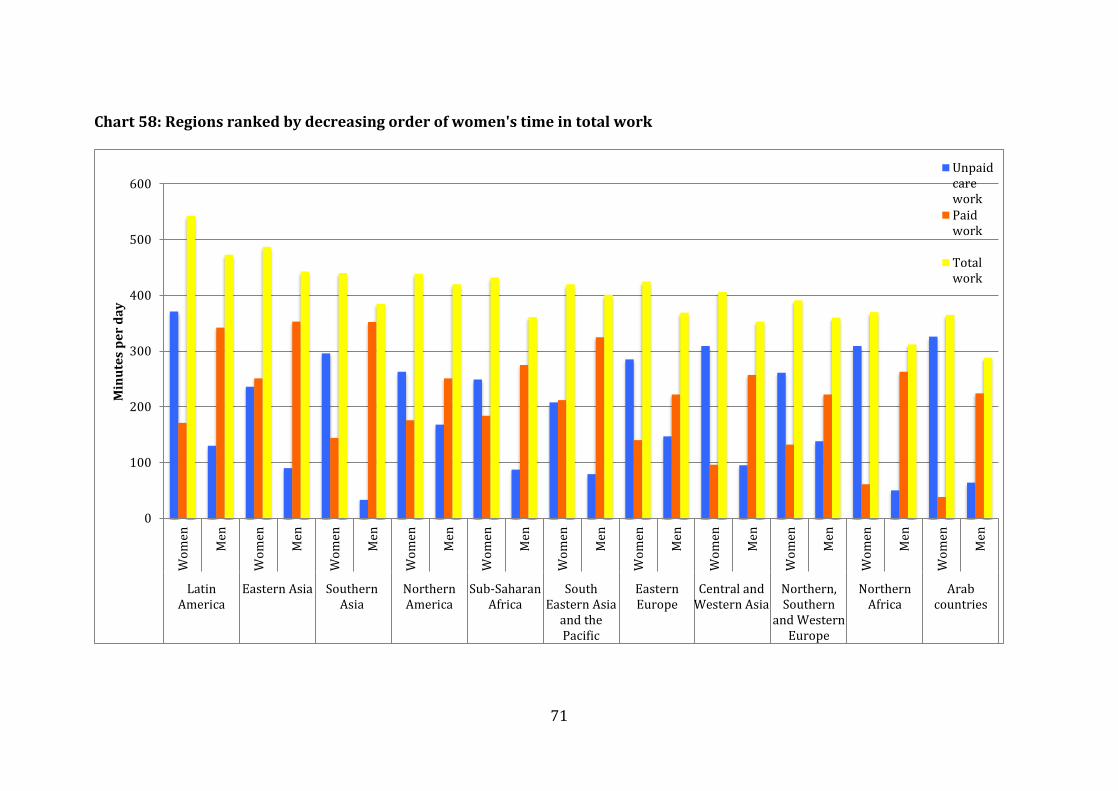
71
Chart 58: Regions ranked by decreasing order of women's time in total work
0
100
200
300
400
500
600W
om
en
Men
Wo
men
Men
Wo
men
Men
Wo
men
Men
Wo
men
Men
Wo
men
Men
Wo
men
Men
Wo
men
Men
Wo
men
Men
Wo
men
Men
Wo
men
Men
LatinAmerica
Eastern Asia SouthernAsia
NorthernAmerica
Sub-SaharanAfrica
SouthEastern Asia
and thePacific
EasternEurope
Central andWestern Asia
Northern,Southern
and WesternEurope
NorthernAfrica
Arabcountries
Min
ute
s p
er
da
y
UnpaidcareworkPaidwork
Totalwork

72
Section 4: Unpaid care work according to various socioeconomic characteristics The gaps and variations between women and men observed in time use across regions and countries can even be amplified depending on geographical location (urban or rural areas), age group, education level, activity status, employment status, income group, marital status and presence of children in the household. 1) Paid work and unpaid care work by geographical location Although the definition of urban and rural may vary from region to region and from country to country the main difficulty in the present comparative work has been that some surveys provide an excess of details without allowing aggregation: geographical areas may distinguish the capital city, another major city (the economic capital for instance), secondary urban areas, semi-urban areas and finally rural areas. For comparison purposes and in order to avoid very complex tables, only two areas per country were retained: rural and urban. The limited cases in which the urban areas were only represented by the capital city, and aggregation was not possible, were taken into account in the narrative. Charts 59 to 62 below present time spent by women and men in paid work and unpaid care work by urban and rural areas. Countries were ranked by increasing order of time spent in urban areas. The results show that two different categories of countries can be distinguished: a first category where women spend less time in paid (or unpaid care) work in rural areas, compared with urban areas, and a second category where it is exactly the reverse. Therefore, we tried to isolate each category of countries. Most of the 14 countries where time spent by women in paid work is longer in rural areas than in urban areas are characterised by a vast agricultural population and include: Mali, India, China, Madagascar, Ethiopia, Mongolia, Benin, Ghana (with rural populations ranging from 46 per cent in Ghana, up to 80 per cent in Ethiopia), and also Armenia, Albania. Tunisia, much more urbanised (with 66 per cent of urban population), looks like an exception in the group. On the other hand, the 10 countries where women spend more time in paid work in urban areas than in rural areas are Latin American countries, as well as South Africa (note that in South Africa, urban formal areas are opposed to tribal areas), Thailand, Belgium (Brussels as opposed to Wallonie), and Greece. A striking feature is that in almost all countries women dedicate more time to unpaid care work in rural areas than in urban areas. The reason is that unpaid care work is usually less time consuming in urban areas, because these types of unpaid activities may become more capital intensive, there is better access to basic infrastructure, labour-saving devices and processed food, whereas in rural areas lot of time can be devoted to the processing of food products (pounding of grains for example and also water and wood fetching). There are however three exceptions: India, Madagascar and China, where women’s unpaid care work is more time-consuming in urban areas than in rural areas. These three countries belong to the category where women spend more time in paid work in rural areas compared with urban areas.

73
Interestingly, the countries where men spend more time in unpaid care work in rural areas do not coincide with the countries where women dedicate less time to these activities in these same areas. In China and Madagascar, similar to women, men also devote less time to unpaid care work in rural areas than they do in urban areas, due to their higher engagement into paid work.

74
Chart 59: Time spent by women in paid work in urban and rural areas (countries ranked by increasing order of time in urban areas). 31 countries
Note: The surveys of Cabo Verde, El Salvador, Peru and Uruguay provide data only for unpaid care work, not for paid work
30 36 42 4272 79 92 96 108 116 133 136 138 144 145 146 152 162 165 166 168 177 184 192 197 214 217
239 246 254
337
30 40
9856
193155
114 12685
5988
262
9978 70
146180
214236
206
133 145
277320
272 254 270
216
0
50
100
150
200
250
300
350
400
450
500
Miu
tes
pe
r d
ay
Women
Urban
Rural

75
Chart 60: Time spent by women in unpaid care work in urban and rural areas (countries ranked by increasing order of time in urban areas). 35 countries
100158180189190203216217225225235237246252257257268272273275277282293299306312312322322330331349
380405476
104
186186
263225215226
247236211
245230
305301302324
295317
355322316
356363330315
291
382362
417
457458
505
0
100
200
300
400
500
600
Min
ute
s p
er
da
y
Urban Rural
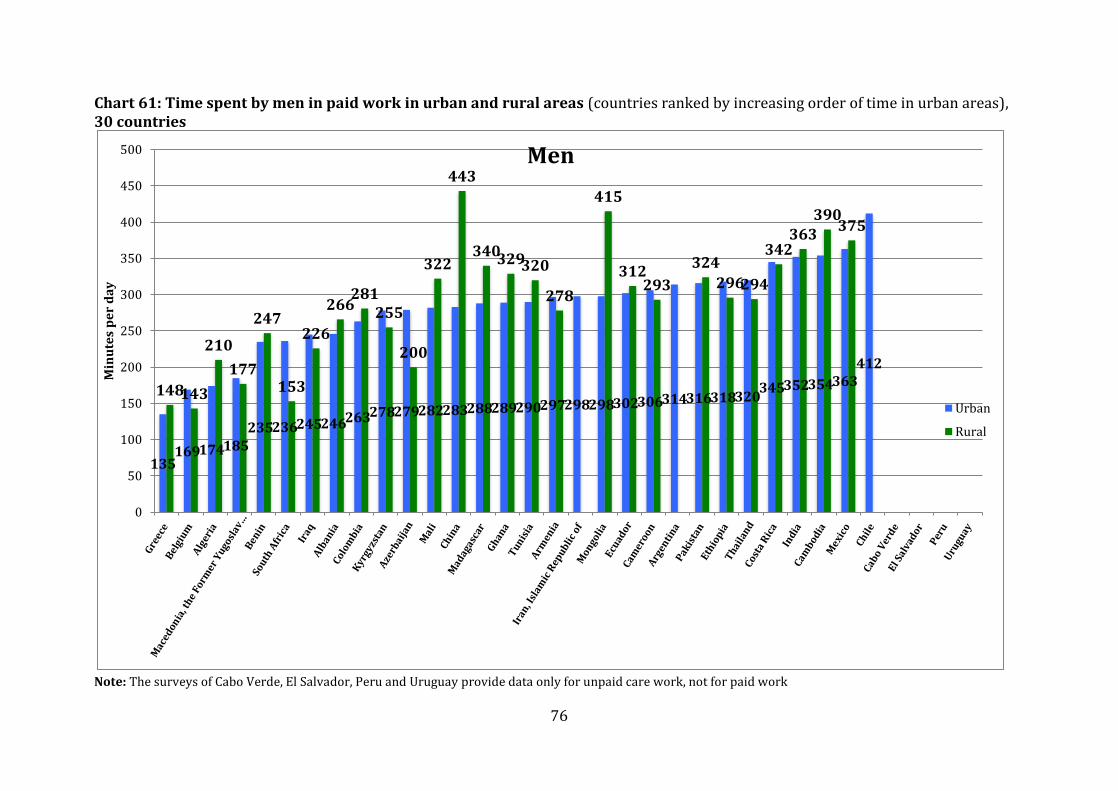
76
Chart 61: Time spent by men in paid work in urban and rural areas (countries ranked by increasing order of time in urban areas), 30 countries
Note: The surveys of Cabo Verde, El Salvador, Peru and Uruguay provide data only for unpaid care work, not for paid work
135169174185
235236245246263278279282283288289290297298298302306314316318320345352354363
412
148143
210
177
247
153
226
266281
255
200
322
443
340329320
278
415
312293
324
296294
342363
390375
0
50
100
150
200
250
300
350
400
450
500
Min
ute
s p
er
da
y
Men
Urban
Rural
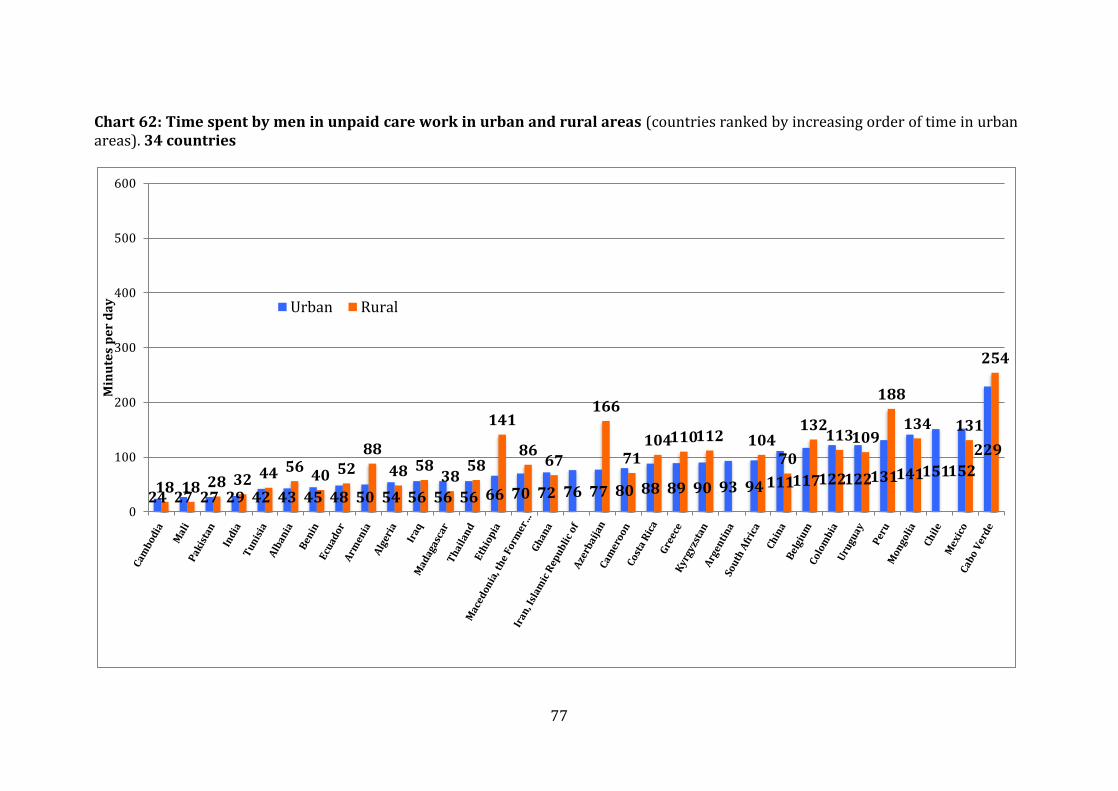
77
Chart 62: Time spent by men in unpaid care work in urban and rural areas (countries ranked by increasing order of time in urban areas). 34 countries
24 27 27 29 42 43 45 48 50 54 56 56 56 66 70 72 76 77 80 88 89 90 93 94 111117122122131141151152
229
18 18 28 32 44 5640 52
88
48 5838
58
141
8667
166
71104110112 104
70
132113109
188
134 131
254
0
100
200
300
400
500
600
Min
ute
s p
er
da
y Urban Rural

78
Charts 63 to 70 show the respective shares of women and men in paid work and in unpaid care work, in urban and rural areas, in absolute terms (number of minutes) and in relative terms (share of the total burden). As regards paid work in urban areas, women contribute from a minimum of 11-14 per cent of the total amount of paid work in Pakistan, Iran, Iraq or Algeria to a maximum of 42-45 per cent in China, Macedonia, Thailand and Ghana (Chart 64). Only in eight countries out of 28), including India and Tunisia, the share of women’s paid work in urban areas is below 30 per cent of the total. As regards rural paid work, women’s contribution ranges from 12-15 per cent in Algeria and Iraq up to 42-45 per cent in China, Benin, Thailand, Ghana and Mali. Again, eight countries (not the same as in urban paid work), including Pakistan and Mexico, are below 30 per cent. Chart 67 on unpaid care work in urban areas shows that women contributes from a minimum of 62 per cent of the total daily burden in Belgium to a maximum of 90-92 per cent in Mali, Pakistan and India. In rural areas (Chart 66), the distribution is approximately the same (from 62 up to 92 per cent) for the same countries.
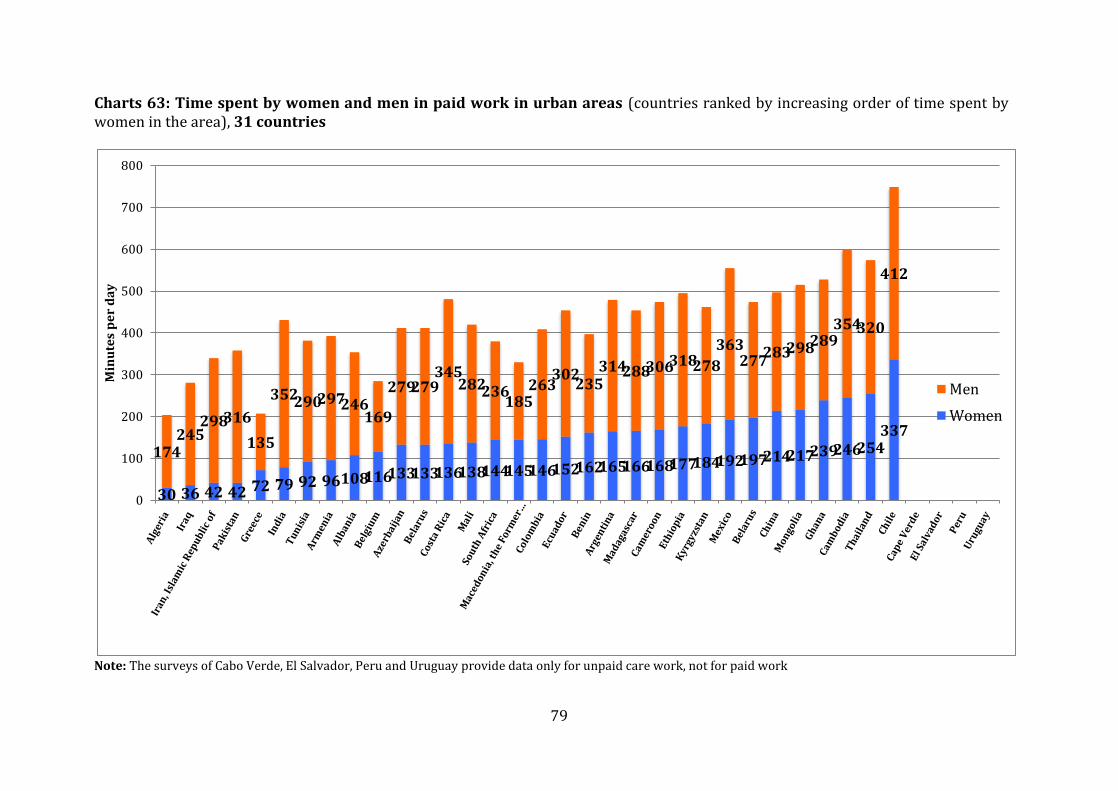
79
Charts 63: Time spent by women and men in paid work in urban areas (countries ranked by increasing order of time spent by women in the area), 31 countries
Note: The surveys of Cabo Verde, El Salvador, Peru and Uruguay provide data only for unpaid care work, not for paid work
30 36 42 42 72 79 92 96108116133133136138144145146152162165166168177184192197214217239246254337
174245
298316
135
352290297246169
279279345
282236185
263302
235314288306318278
363277
283298289354320
412
0
100
200
300
400
500
600
700
800
Min
ute
s p
er
da
y
Men
Women
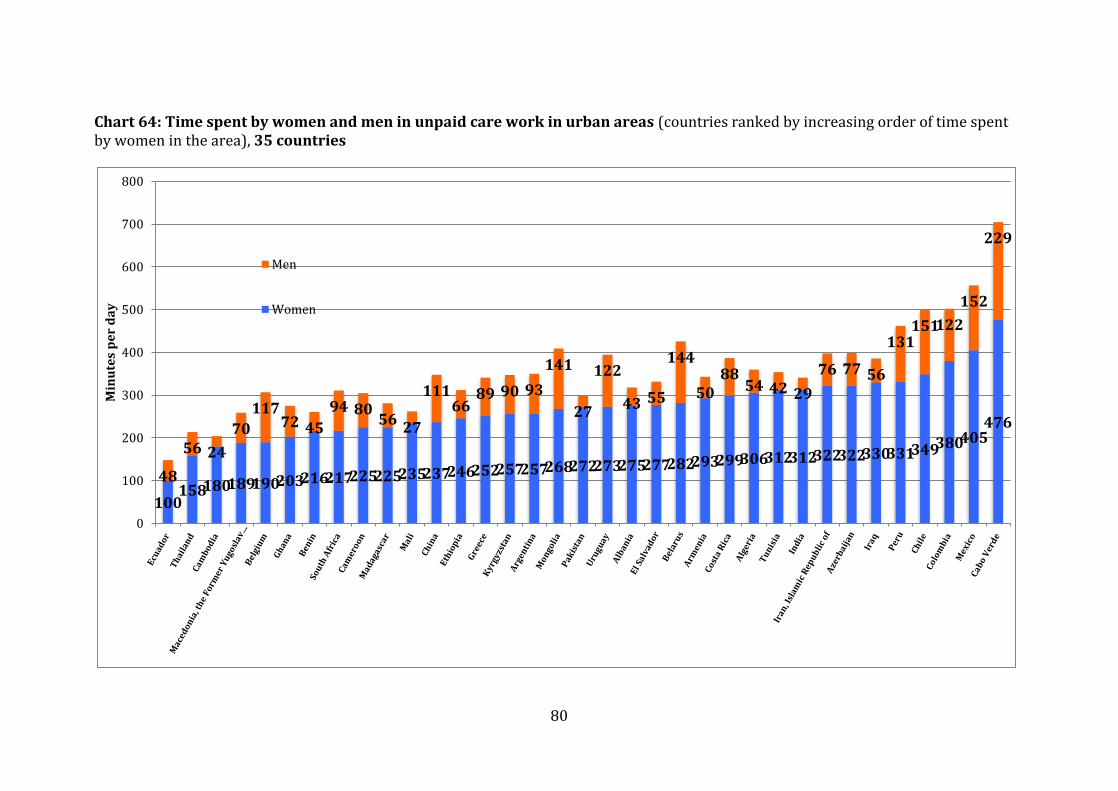
80
Chart 64: Time spent by women and men in unpaid care work in urban areas (countries ranked by increasing order of time spent by women in the area), 35 countries
100158180189190203216217225225235237246252257257268272273275277282293299306312312322322330331349380405
476
48
56 24
70
11772 45
94 8056
27
11166
89 90 93
141
27
122
43 55
144
5088
54 42 29
76 77 56
131151122
152
229
0
100
200
300
400
500
600
700
800
Min
ute
s p
er
da
y
Men
Women
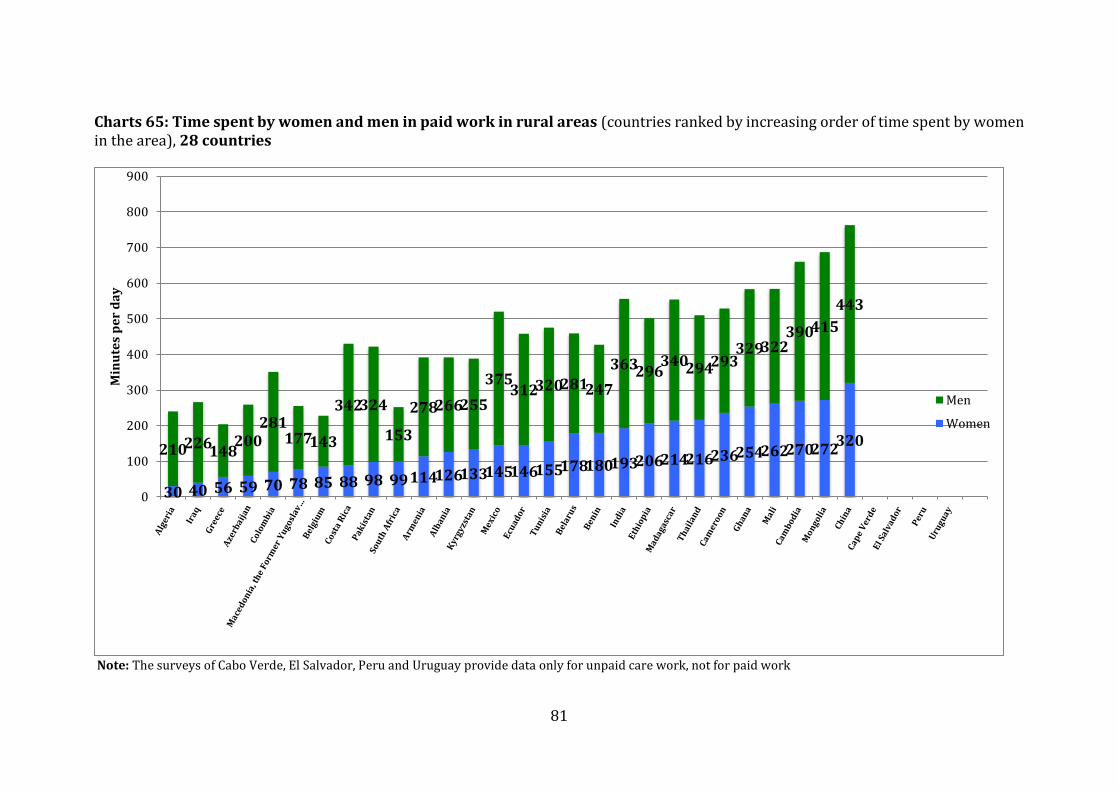
81
Charts 65: Time spent by women and men in paid work in rural areas (countries ranked by increasing order of time spent by women in the area), 28 countries
Note: The surveys of Cabo Verde, El Salvador, Peru and Uruguay provide data only for unpaid care work, not for paid work
30 40 56 59 70 78 85 88 98 99114126133145146155178180193206214216236254262270272320
210226148
200281
177143
342324
153
278266255
375312320281247
363296340294293
329322390415
443
0
100
200
300
400
500
600
700
800
900
Min
ute
s p
er
da
y
Men
Women
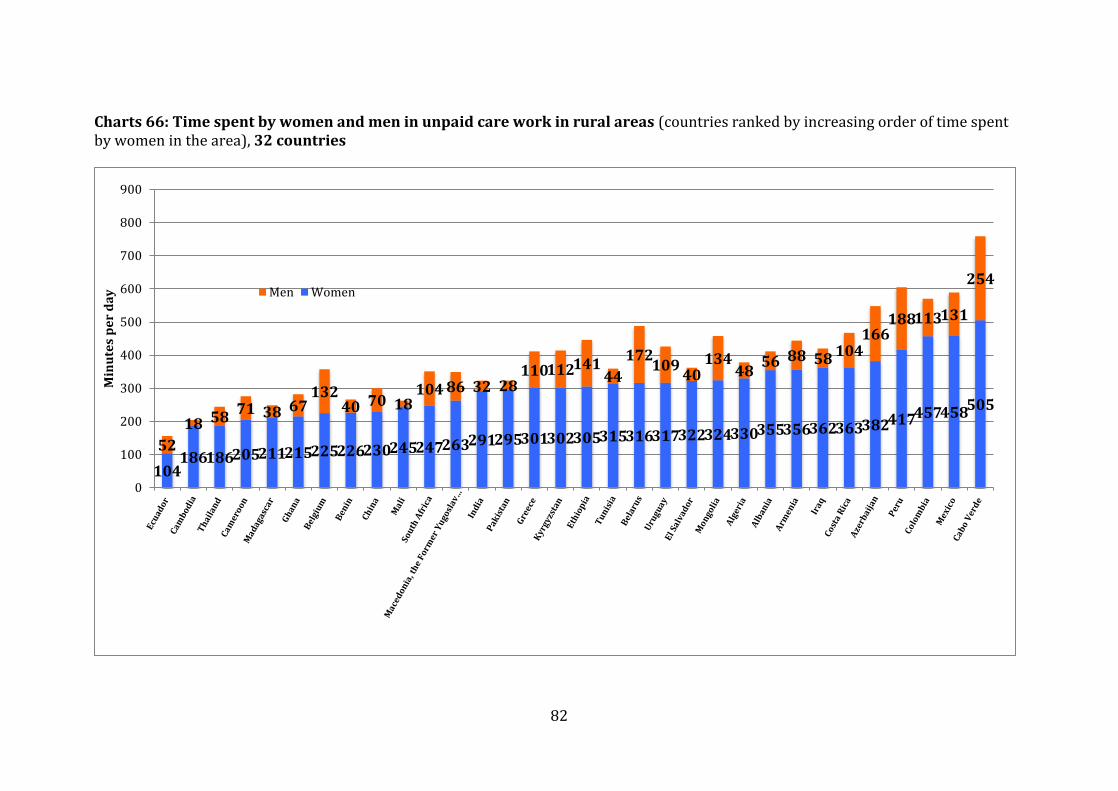
82
Charts 66: Time spent by women and men in unpaid care work in rural areas (countries ranked by increasing order of time spent by women in the area), 32 countries
104186186205211215225226230245247263291295301302305315316317322324330355356362363382417457458505
52
18 5871 38 67
13240 70 18
104 86 32 28110112141
44
172109
40134
4856 88 58 104
166188113131
254
0
100
200
300
400
500
600
700
800
900
Min
ute
s p
er
da
y Men Women
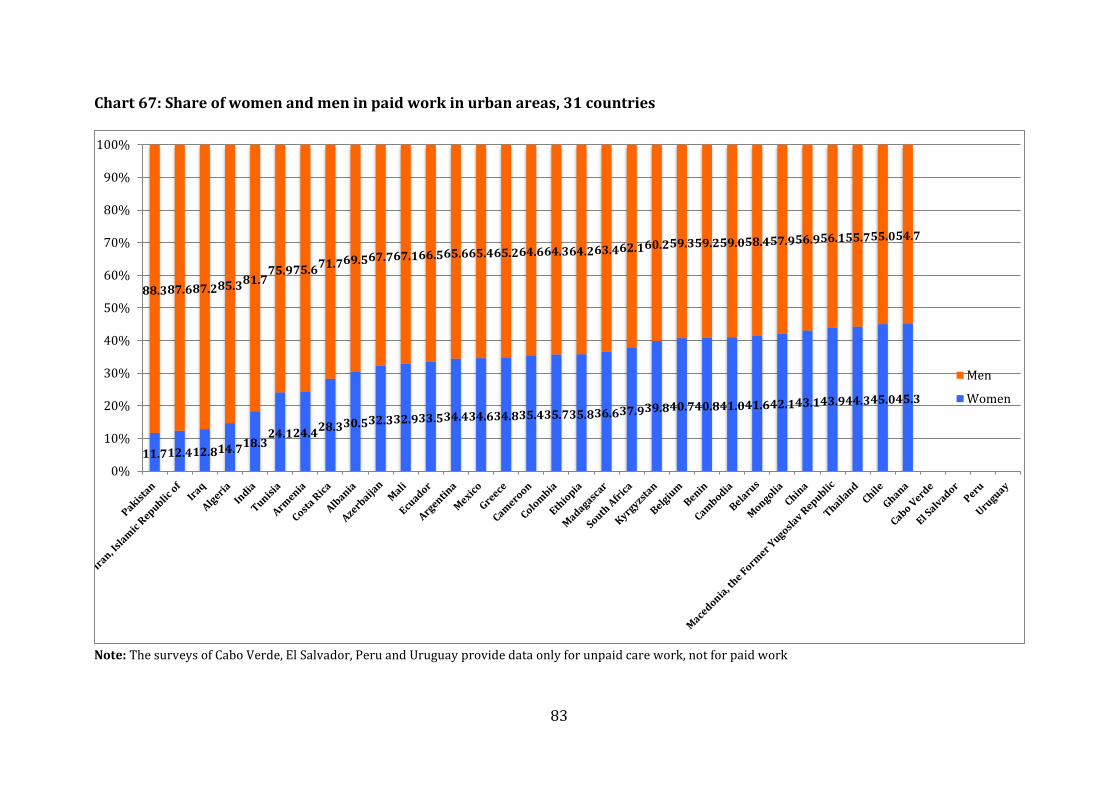
83
Chart 67: Share of women and men in paid work in urban areas, 31 countries
Note: The surveys of Cabo Verde, El Salvador, Peru and Uruguay provide data only for unpaid care work, not for paid work
11.712.412.814.718.324.124.4
28.330.532.332.933.534.434.634.835.435.735.836.637.939.840.740.841.041.642.143.143.944.345.045.3
88.387.687.285.381.775.975.6
71.769.567.767.166.565.665.465.264.664.364.263.462.160.259.359.259.058.457.956.956.155.755.054.7
0%
10%
20%
30%
40%
50%
60%
70%
80%
90%
100%
Men
Women

84
Chart 68: Share of women and men in paid work in rural areas, 28 countries
Note: The surveys of Cabo Verde, El Salvador, Peru and Uruguay provide data only for unpaid care work, not for paid work
12.5 15.019.9 20.5 22.8 23.2
27.5 27.9 29.1 30.6 31.9 32.1 32.6 34.3 34.7 37.3 38.6 38.8 39.3 39.6 40.9 41.0 41.9 42.2 42.4 43.6 44.6 44.9
87.5 85.080.1 79.5 77.2 76.8
72.5 72.1 70.9 69.4 68.1 67.9 67.4 65.7 65.3 62.7 61.4 61.2 60.7 60.4 59.1 59.0 58.1 57.8 57.6 56.4 55.4 55.1
0%
10%
20%
30%
40%
50%
60%
70%
80%
90%
100%
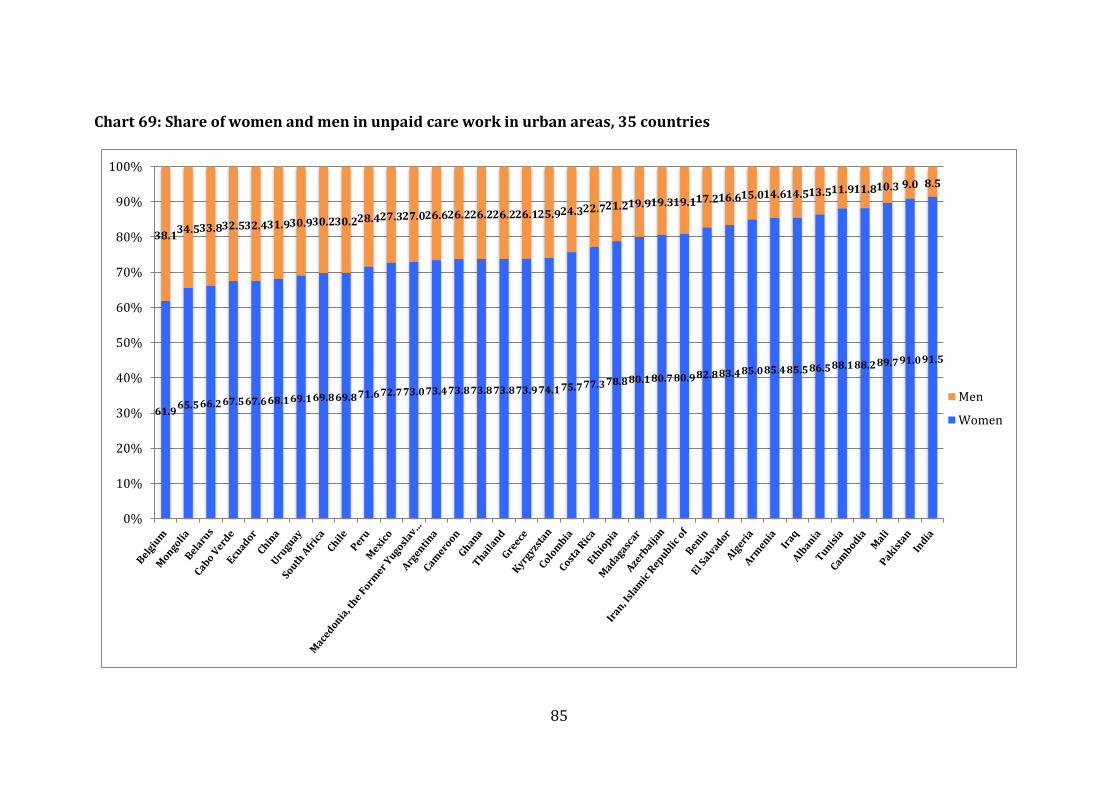
85
Chart 69: Share of women and men in unpaid care work in urban areas, 35 countries
61.965.566.267.567.668.169.169.869.871.672.773.073.473.873.873.873.974.175.777.378.880.180.780.982.883.485.085.485.586.588.188.289.791.091.5
38.134.533.832.532.431.930.930.230.228.427.327.026.626.226.226.226.125.924.322.721.219.919.319.117.216.615.014.614.513.511.911.810.3 9.0 8.5
0%
10%
20%
30%
40%
50%
60%
70%
80%
90%
100%
Men
Women
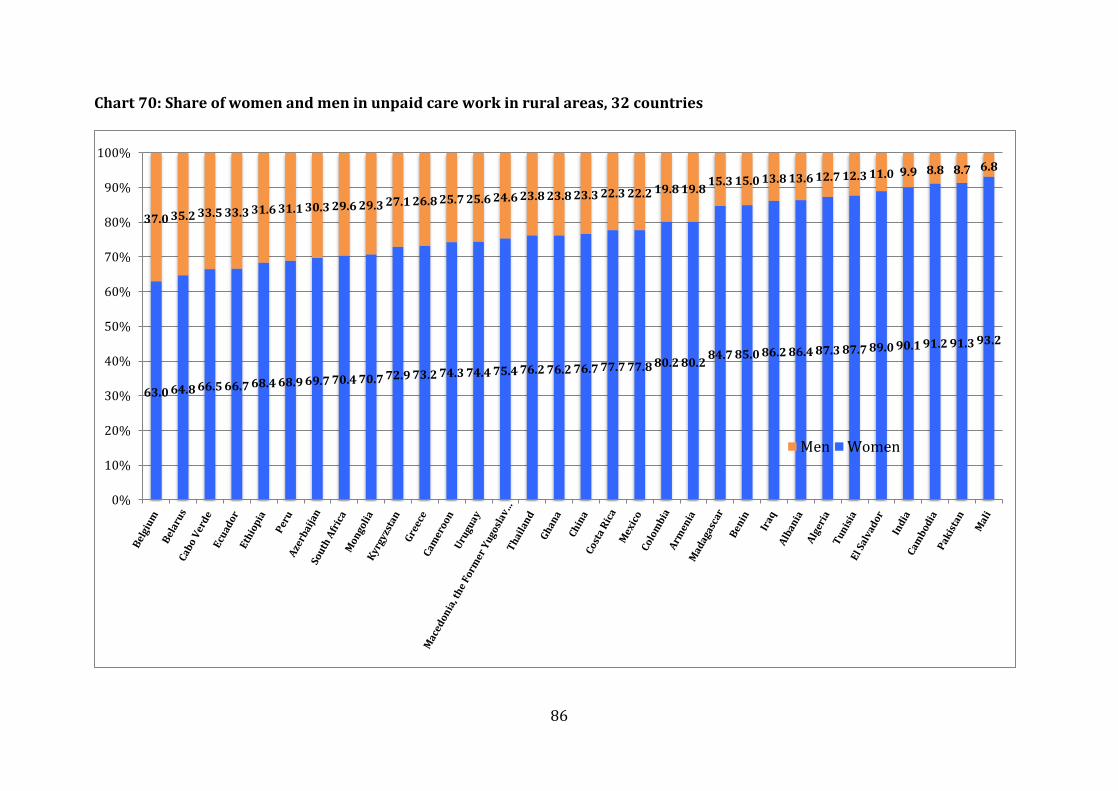
86
Chart 70: Share of women and men in unpaid care work in rural areas, 32 countries
63.0 64.8 66.5 66.7 68.4 68.9 69.7 70.4 70.7 72.9 73.2 74.3 74.4 75.4 76.2 76.2 76.7 77.7 77.8 80.2 80.284.7 85.0 86.2 86.4 87.3 87.7 89.0 90.1 91.2 91.3 93.2
37.0 35.2 33.5 33.3 31.6 31.1 30.3 29.6 29.3 27.1 26.8 25.7 25.6 24.6 23.8 23.8 23.3 22.3 22.2 19.8 19.815.3 15.0 13.8 13.6 12.7 12.3 11.0 9.9 8.8 8.7 6.8
0%
10%
20%
30%
40%
50%
60%
70%
80%
90%
100%
Men Women
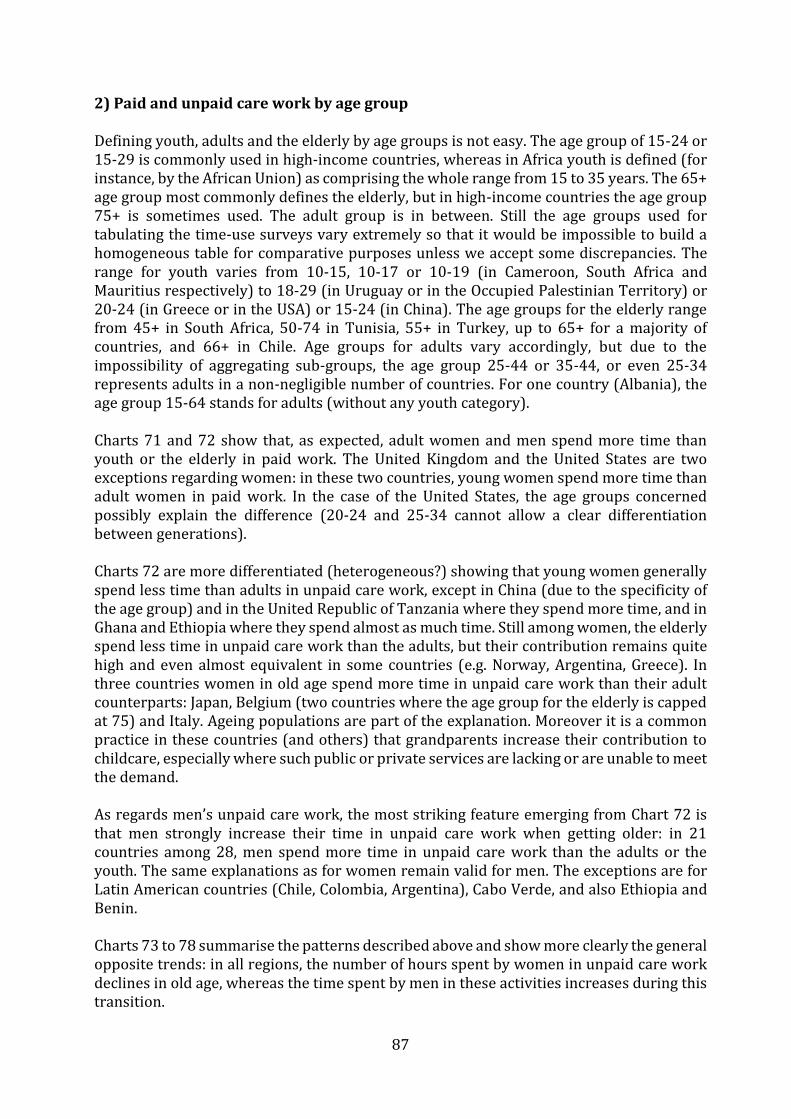
87
2) Paid and unpaid care work by age group Defining youth, adults and the elderly by age groups is not easy. The age group of 15-24 or 15-29 is commonly used in high-income countries, whereas in Africa youth is defined (for instance, by the African Union) as comprising the whole range from 15 to 35 years. The 65+ age group most commonly defines the elderly, but in high-income countries the age group 75+ is sometimes used. The adult group is in between. Still the age groups used for tabulating the time-use surveys vary extremely so that it would be impossible to build a homogeneous table for comparative purposes unless we accept some discrepancies. The range for youth varies from 10-15, 10-17 or 10-19 (in Cameroon, South Africa and Mauritius respectively) to 18-29 (in Uruguay or in the Occupied Palestinian Territory) or 20-24 (in Greece or in the USA) or 15-24 (in China). The age groups for the elderly range from 45+ in South Africa, 50-74 in Tunisia, 55+ in Turkey, up to 65+ for a majority of countries, and 66+ in Chile. Age groups for adults vary accordingly, but due to the impossibility of aggregating sub-groups, the age group 25-44 or 35-44, or even 25-34 represents adults in a non-negligible number of countries. For one country (Albania), the age group 15-64 stands for adults (without any youth category). Charts 71 and 72 show that, as expected, adult women and men spend more time than youth or the elderly in paid work. The United Kingdom and the United States are two exceptions regarding women: in these two countries, young women spend more time than adult women in paid work. In the case of the United States, the age groups concerned possibly explain the difference (20-24 and 25-34 cannot allow a clear differentiation between generations). Charts 72 are more differentiated (heterogeneous?) showing that young women generally spend less time than adults in unpaid care work, except in China (due to the specificity of the age group) and in the United Republic of Tanzania where they spend more time, and in Ghana and Ethiopia where they spend almost as much time. Still among women, the elderly spend less time in unpaid care work than the adults, but their contribution remains quite high and even almost equivalent in some countries (e.g. Norway, Argentina, Greece). In three countries women in old age spend more time in unpaid care work than their adult counterparts: Japan, Belgium (two countries where the age group for the elderly is capped at 75) and Italy. Ageing populations are part of the explanation. Moreover it is a common practice in these countries (and others) that grandparents increase their contribution to childcare, especially where such public or private services are lacking or are unable to meet the demand. As regards men’s unpaid care work, the most striking feature emerging from Chart 72 is that men strongly increase their time in unpaid care work when getting older: in 21 countries among 28, men spend more time in unpaid care work than the adults or the youth. The same explanations as for women remain valid for men. The exceptions are for Latin American countries (Chile, Colombia, Argentina), Cabo Verde, and also Ethiopia and Benin. Charts 73 to 78 summarise the patterns described above and show more clearly the general opposite trends: in all regions, the number of hours spent by women in unpaid care work declines in old age, whereas the time spent by men in these activities increases during this transition.
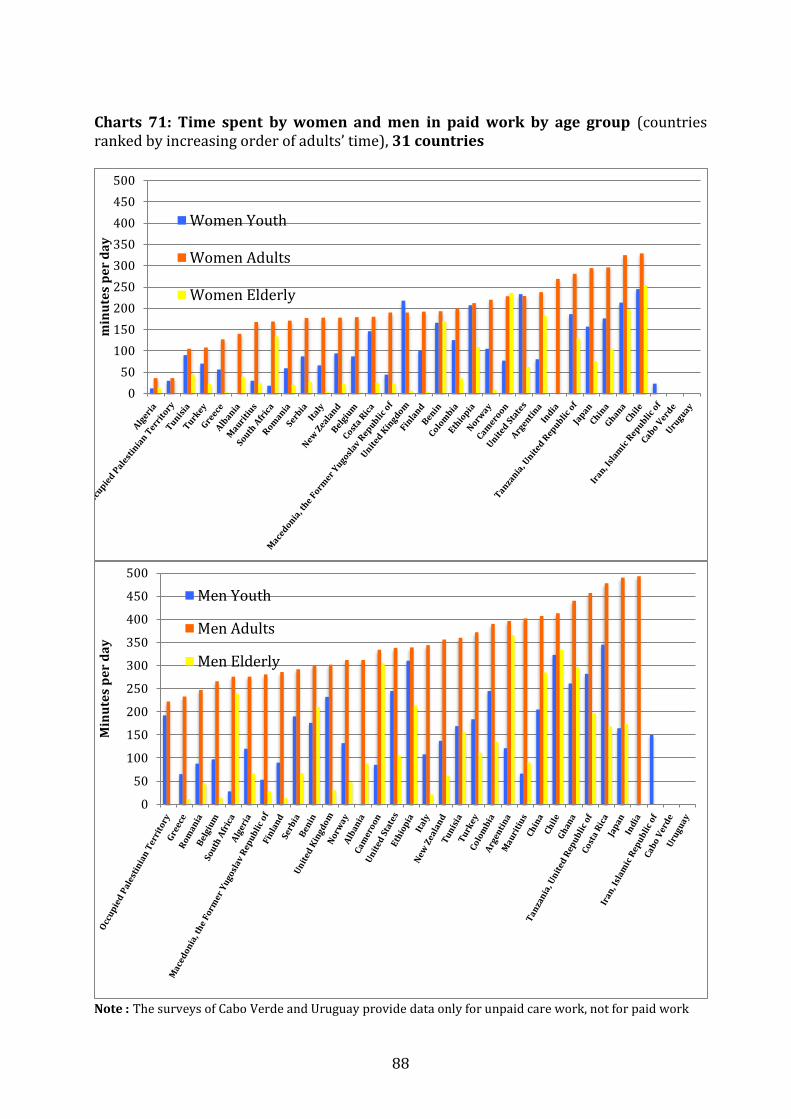
88
Charts 71: Time spent by women and men in paid work by age group (countries ranked by increasing order of adults’ time), 31 countries
Note : The surveys of Cabo Verde and Uruguay provide data only for unpaid care work, not for paid work
0
50
100
150
200
250
300
350
400
450
500
min
ute
s p
er
da
y
Women Youth
Women Adults
Women Elderly
0
50
100
150
200
250
300
350
400
450
500
Min
ute
s p
er
da
y
Men Youth
Men Adults
Men Elderly

89
Charts 72: Time spent in unpaid care work by age group (countries ranked by increasing order of adults’ time), 33 countries
0
100
200
300
400
500
600
Min
ute
s p
er
da
y
Women Youth
Women Adults
Women Elderly
0
100
200
300
400
500
600
Min
ute
s p
er
da
y
Men Youth
Men Adults
Men Elderly
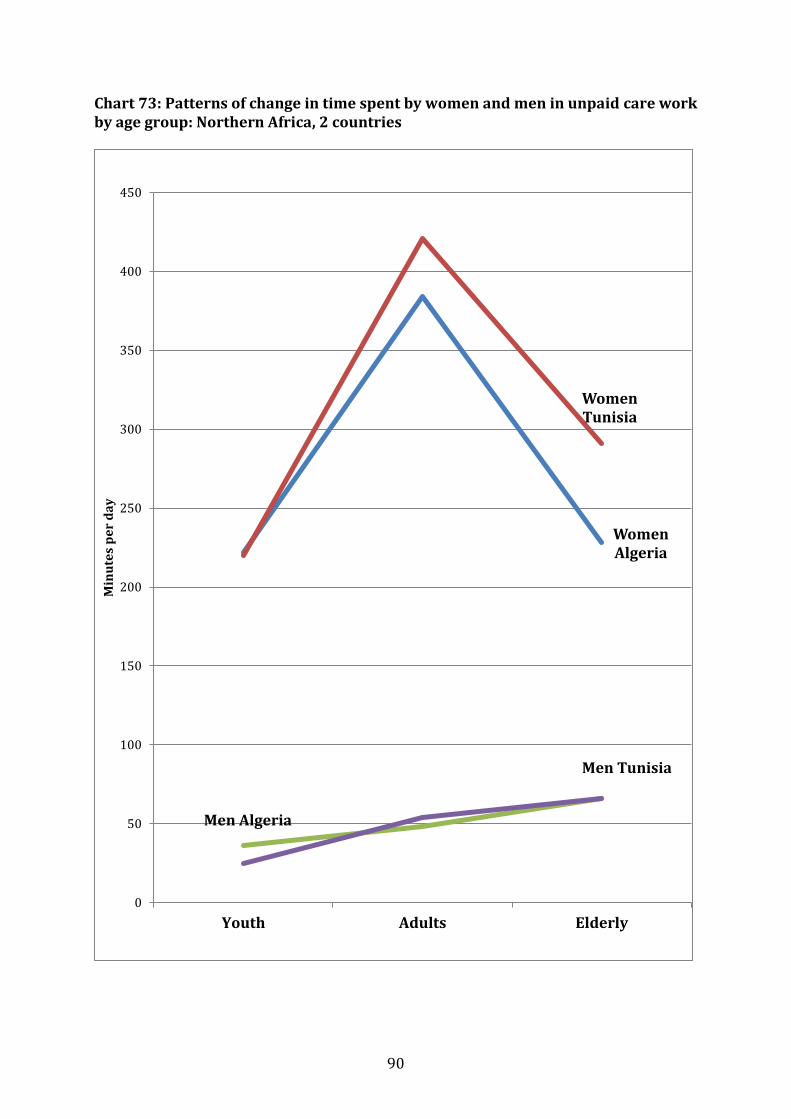
90
Chart 73: Patterns of change in time spent by women and men in unpaid care work by age group: Northern Africa, 2 countries
Women Algeria
Women Tunisia
Men Algeria
Men Tunisia
0
50
100
150
200
250
300
350
400
450
Youth Adults Elderly
Min
ute
s p
er
da
y

91
Charts 74: Patterns of change in time spent by women and men in unpaid care work by age group: Sub-Saharan Africa, 8 countries
Women Benin Women Cameroon
Women Cabo Verde
Women Ethiopia
Women Ghana
Women Mauritius
Women South Africa
Women Tanzania, United Rep. of
0
100
200
300
400
500
600
Youth Adults Elderly
Min
ute
s p
er
da
y
Men Benin
Men Cameroon
Men Cabo Verde
Men Ethiopia
Men Ghana
Men Mauritius
Men South Africa
Men Tanzania, United Rep. of
0
100
200
300
400
500
600
Youth Adults Elderly
Min
ute
s p
er
da
y
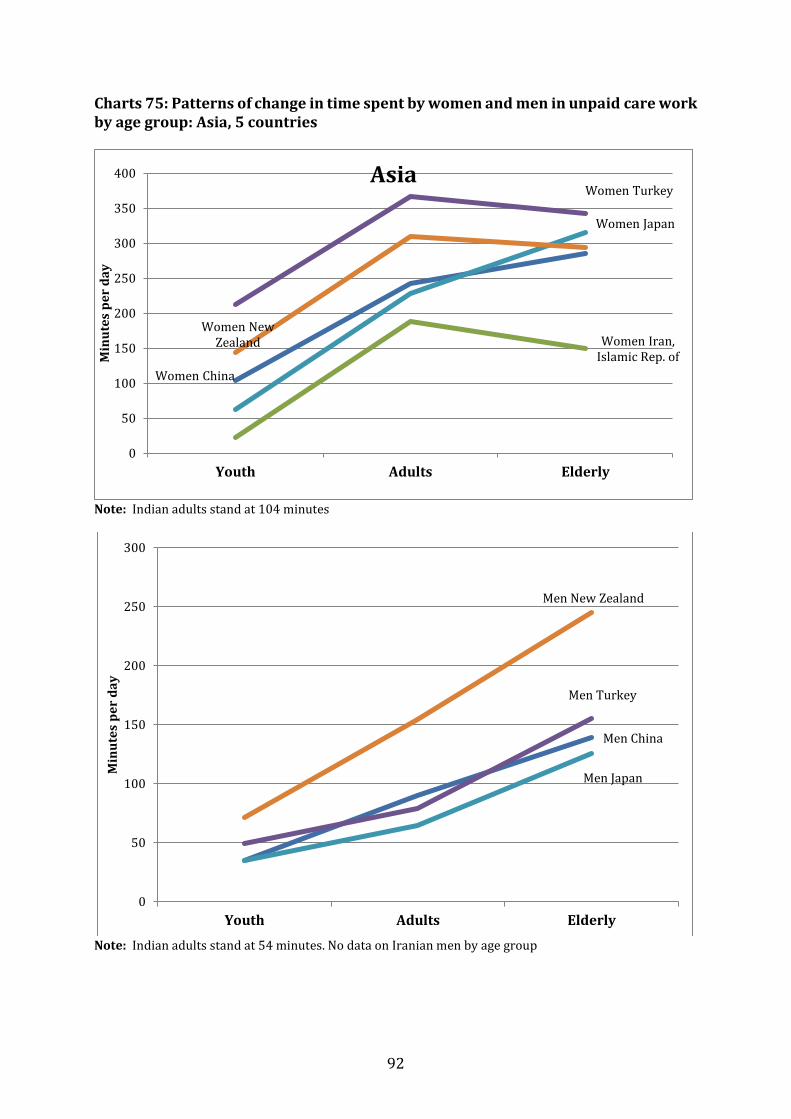
92
Charts 75: Patterns of change in time spent by women and men in unpaid care work by age group: Asia, 5 countries
Note: Indian adults stand at 104 minutes
Note: Indian adults stand at 54 minutes. No data on Iranian men by age group
Women China
Women Iran, Islamic Rep. of
Women Turkey
Women Japan
Women New Zealand
0
50
100
150
200
250
300
350
400
Youth Adults Elderly
Min
ute
s p
er
da
y
Asia
Men China
Men Turkey
Men Japan
Men New Zealand
0
50
100
150
200
250
300
Youth Adults Elderly
Min
ute
s p
er
da
y

93
Charts 76: Patterns of change in time spent by women and men in unpaid work by age group: Latin America, 5 countries
Women Argentina
Women Chile
Women Colombia
Women Costa RicaWomen Uruguay
0
100
200
300
400
500
600
Youth Adults Elderly
Min
ute
s p
er
da
y
Men Argentina
Men Chile
Men Colombia
Men Costa Rica
Men Uruguay
0
100
200
300
400
500
600
Youth Adults Elderly
Min
ute
s p
er
da
y

94
Charts 77: Patterns of change in time spent by women and men in unpaid care work by age group: Europe, 10 countries
0
50
100
150
200
250
300
350
400
Women Youth Women Adults Women Elderly
Min
ute
s p
er
da
y
Belgium 2013
Finland 2009-10
Greece 2013-14
Italy 2008-09
Norway 2010
UK 2005
Albania 2010-11
Macedonia 2014-15
Romania 2011-12
Serbia 2010-11
0
50
100
150
200
250
300
350
400
Men Youth Men Adults Men Elderly
Min
ute
s p
er
da
y
Belgium 2013
Finland 2009-10
Greece 2013-14
Italy 2008-09
Norway 2010
UK 2005
Albania 2010-11
Macedonia 2014-15
Romania 2011-12
Serbia 2010-11

95
Chart 78: Patterns of change in time spent by women and men in unpaid care work by age group: United States
Women United States
Men United States
0
50
100
150
200
250
300
Youth Adults Elderly
Min
ute
s p
er
da
y

96
3) Paid work and unpaid care work by educational level Classifications by educational level are also far from being harmonised. In some countries secondary education is split into lower and higher education levels. In such cases, we have opted for the higher level. Pre-schooling is sometimes included in primary education and finally some countries distinguish between university level and other post-secondary levels. In order to make comparisons possible, the university level was retained. Another type of classification includes the following categories: “secondary incomplete”, ”secondary complete + tertiary incomplete” and “tertiary complete”. Some discrepancies may be explained by the specificities of classifications used. However, and despite such heterogeneity in the categories, it is possible to identify some patterns. In Charts 79 and 80 below, countries have been classified by region and within regions, by increasing order of time spent by tertiary level educated women and men (whether in paid work or in unpaid care work). The general pattern that emerges from the Charts is that women dedicate more and more time to paid work as their educational level increases: in 14 countries out of 18, such as Turkey, Cambodia and Costa Rica, women with tertiary level spend more time in paid work than their counterparts with secondary level and primary level. Exceptions are Benin and Cameroon where the non-educated and the primary-level educated women are spending more time in paid work than their counterparts with secondary and tertiary levels of education. The same observation is valid in India and to a lesser extent in China. The European exception is Greece, which could be explained by the specificity of the classification used, namely the following three educational levels: “up to lower secondary”, “upper secondary and post secondary” and “tertiary”. More generally the explanation for this drop in paid work when the educational level increases could be that in the countries concerned, women strongly participate to the labour force, mainly in informal employment and therefore by necessity. When this necessity is lacking, in more well off households, women may prefer to dedicate more time to household care. The pattern for men in paid work is different: in 11 countries, men with tertiary level of education spend less time in paid work than their counterparts in secondary or primary levels. Three categories of countries emerge. In the first group, men’s time spent in paid work clearly declines with the increase in the educational level: India, China, Cameroon, Benin. Similar patterns are found in Algeria and Tunisia, which also stand out since men with no education spend less time in unpaid care work than those with higher levels of education. In the second category, the pattern is exactly the reverse: men’s time spent in unpaid care work increases with the level of education: South Africa, the United Republic of Tanzania, Ghana (in which non-educated men spend more time in paid work than each of the other categories), Argentina, Turkey, and Belgium. Finally, the third category includes countries in which the maximum of time spent by men in paid work is reached at secondary level and declines afterwards: Costa Rica, Serbia, Albania, Greece. Regarding the patterns of time use for unpaid care work, Charts 80 shows that in 14 countries out of 21, women’s time spent in unpaid care work declines with the increase in educational level. In some countries, such as the United Republic of Tanzania and Colombia, time spent by women in unpaid care work increases with the educational level up to the secondary level and then declines. And in other countries, for example Argentina
97
or India, the time dedicated to unpaid care work is nearly the same at all educational levels. As to the time spent in unpaid care work by men, the expected or desirable increase with the educational level is observed only in 6 countries: Benin, Cabo Verde, China, Colombia, Albania, Belgium. Costa Rica, Cameroon and Tunisia can be added to the list, if the non-educated (or those with primary level for Costa Rica) are not taken into account. In Ethiopia, Argentina, Uruguay, Greece and Serbia the reverse pattern can be observed: the more educated men are, the less time they devote to unpaid care work. Finally, in Algeria, Turkey, India, behaviours do not change with the level of education: these are countries where patriarchal attitudes remain widespread and strong.

98
Charts 79: Time spent in paid work by educational level (countries ranked by region and increasing order of time spent by tertiary educated women), 18 countries
0
100
200
300
400
500
600
Min
ute
s p
er
da
y
WOMEN
None
Primary
Secondary
Tertiary
0
100
200
300
400
500
600
Min
ute
s p
er
da
y
MEN
None
Primary
Secondary
Tertiary

99
Charts 80: Time spent in unpaid care work by educational level (countries ranked by region and increasing order of time spent by tertiary educated women), 21 countries
0
100
200
300
400
500
600
Min
ute
s p
er
da
y
WOMEN
None
Primary
Secondary
Tertiary
0
100
200
300
400
500
600
Min
ute
s p
er
da
y
MEN
None
Primary

100
4) Paid work and unpaid care work by activity status The activity status distinguishes between the active and the inactive, and among the active, the employed and the unemployed. Challenges to comparisons come from the fact that in many countries several categories of inactive are distinguished, mainly including the “female housekeepers”, the “male retirees”. In other cases, the divide is between those “working” and “not working” or the “employed” and the “not employed,” the latter category including the “unemployed”. In addition, among the “employed”, the employed “full-time” and “part-time” are sometimes distinguished. As published data do not make possible the aggregation of several sub-categories, we have opted for the most representative (and aggregated) categories in this report. On average (Charts 81), in the 24 countries with available data, employed women spend 5 hours per day in paid work. Although the unemployed and the inactive are not supposed (by definition) to work for pay or profit, as shown on Charts 55, non-employed women were respectively working for an average of 27 and 20 minutes per day: especially in Benin (89 minutes for the inactive), Ghana (69 minutes for the inactive) and Argentina (56 minutes for the unemployed)10. Employed men spend on average approximately 6 hours and 30 minutes per day in paid work, and the unemployed and the inactive respectively 49 and 26 minutes. The difference between employed men and employed women is 1 hour and 30 minutes, highlighting the fact that women are – more often than men - involved in part-time jobs. In three countries, Japan, the Islamic Republic of Iran and Pakistan, men spend more than 7 hours and 30 minutes in paid work. In Kazakhstan and Belgium, they spend less than 5 hours. In all countries but one (Cabo Verde), employed women dedicate less time to unpaid care work than their unemployed or inactive counterparts (Charts 82) – something that is expected given their different time availability. In the 27 countries for which data were gathered, the average time spent in unpaid care work by employed women is 4 hours per day, as compared with 5 hours and 9 minutes for the unemployed and 5 hours and 14 minutes for the inactive. In general, in Asia and the Pacific inactive women spend more time in unpaid care work than unemployed women, as well as in Northern Africa and in Europe, with exceptions for Finland, France, the Former Yugoslav Republic of Macedonia, and the United Kingdom. In Africa, the reverse pattern is observed as well as in Chile and Argentina: inactive women spend less time than unemployed women in unpaid care work, and most often more than the employed themselves. As to employed men, they spend an average of 1 hour 30 minutes per day in unpaid care work, against 2 hours and 11 minutes for the unemployed and 2 hours and 5 minutes for the inactive. In all countries (again with the exception of Cabo Verde), men increase their involvement in domestic work and care when they are unemployed or inactive. Similar to women, in many countries in all regions, including Argentina, France, Pakistan and South
10 Among the reasons of such a paradox, there is the difficulty for respondents of household’s surveys to understand the concept of economic activity and employment, a source of underestimation especially among women. Another reason is that the economic activity may be split into many episodes in a day or a week so that the question: “have you work for pay or profit at least one hour during the day or the week?” is not so easy to respond whereas the diary is an easier way of capture the activity without presuming whether this activity is productive or not in the sense of the SNA.
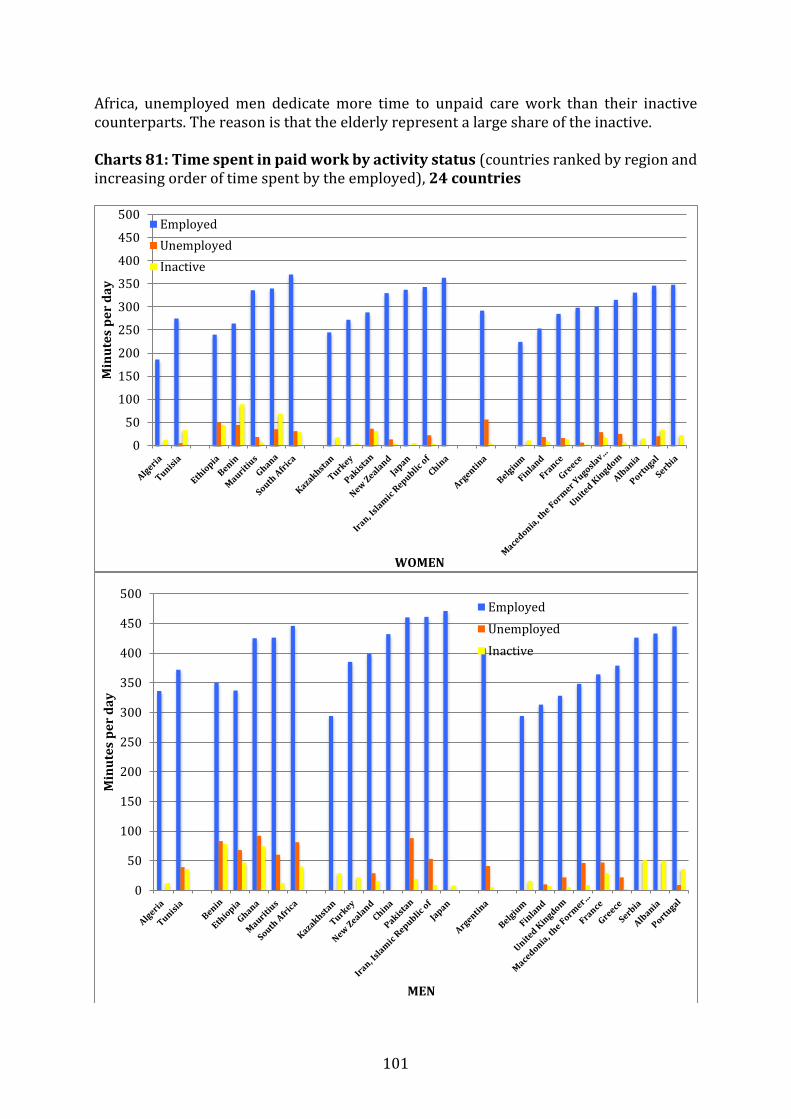
101
Africa, unemployed men dedicate more time to unpaid care work than their inactive counterparts. The reason is that the elderly represent a large share of the inactive. Charts 81: Time spent in paid work by activity status (countries ranked by region and increasing order of time spent by the employed), 24 countries
0
50
100
150
200
250
300
350
400
450
500
Min
ute
s p
er
da
y
WOMEN
Employed
Unemployed
Inactive
0
50
100
150
200
250
300
350
400
450
500
Min
ute
s p
er
da
y
MEN
Employed
Unemployed
Inactive
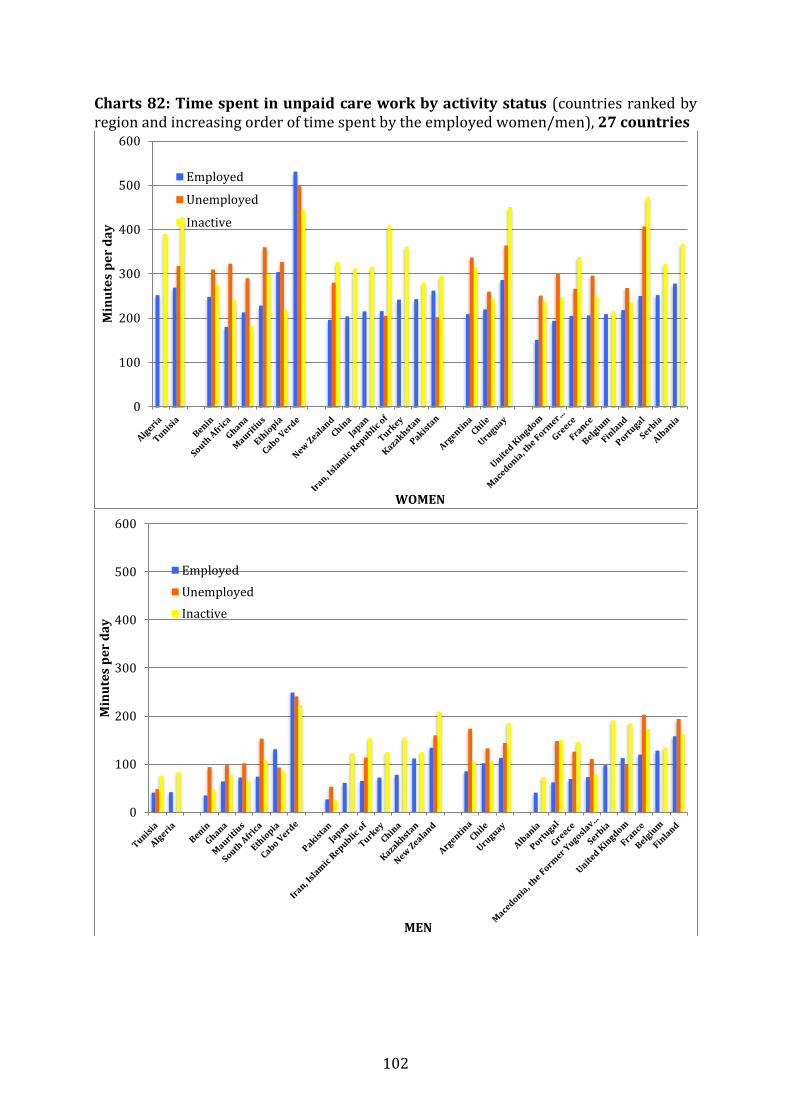
102
Charts 82: Time spent in unpaid care work by activity status (countries ranked by region and increasing order of time spent by the employed women/men), 27 countries
0
100
200
300
400
500
600
Min
ute
s p
er
da
y
WOMEN
Employed
Unemployed
Inactive
0
100
200
300
400
500
600
Min
ute
s p
er
da
y
MEN
Employed
Unemployed
Inactive
103
5) Paid work and unpaid care work by employment status Data on employment status disaggregated by sex were available only in 6 countries. In three countries, Tunisia, China and Finland, wage and salaried women spend more time in paid work than their self-employed counterparts (Charts 83). The time gap is more pronounced (75 minutes) in Tunisia where women’s labour force participation rate is low and the composition of female employment is dominated by wage and salaried employment in the formal economy. In China, Finland and to a lesser extent in France, women self-employed dedicate more time to paid work than wage and salaried women. As to men and except in Benin, those in self-employment generally spend more time in paid work than wage and salaried men, with important time differences in France, Finland and China. Charts 84 show that in all six countries wage and salaried women spend less time in unpaid care work than the self-employed, with important time differences, ranging from 164 minutes in Turkey and 102 minutes in Tunisia to 33 minutes in Benin, but only one minute in France. It is exactly the opposite as regards the time spent by men in unpaid care work: in four countries, except Tunisia, self-employed men dedicate more time to unpaid care work than the paid employed: the broader gap is observed in France (39 minutes). For women, as well as for men, self-employment makes it easier to conciliate paid work with household and care duties, because the place of work is often close to the place of living, if not the same; young children can play and prepare their homework in the next room, etc.

104
Charts 83: Time spent in paid work by employment status, 6 countries
0
50
100
150
200
250
300
350
400
450
500
Tunisia China France Finland Benin Turkey
Min
ute
s p
er
da
y
WOMEN
Paid employees
Self-employed
All employed
0
50
100
150
200
250
300
350
400
450
500
Tunisia China France Finland Benin Turkey
Min
ute
s p
er
da
y
MEN
Paid employees
Self-employed
All employed
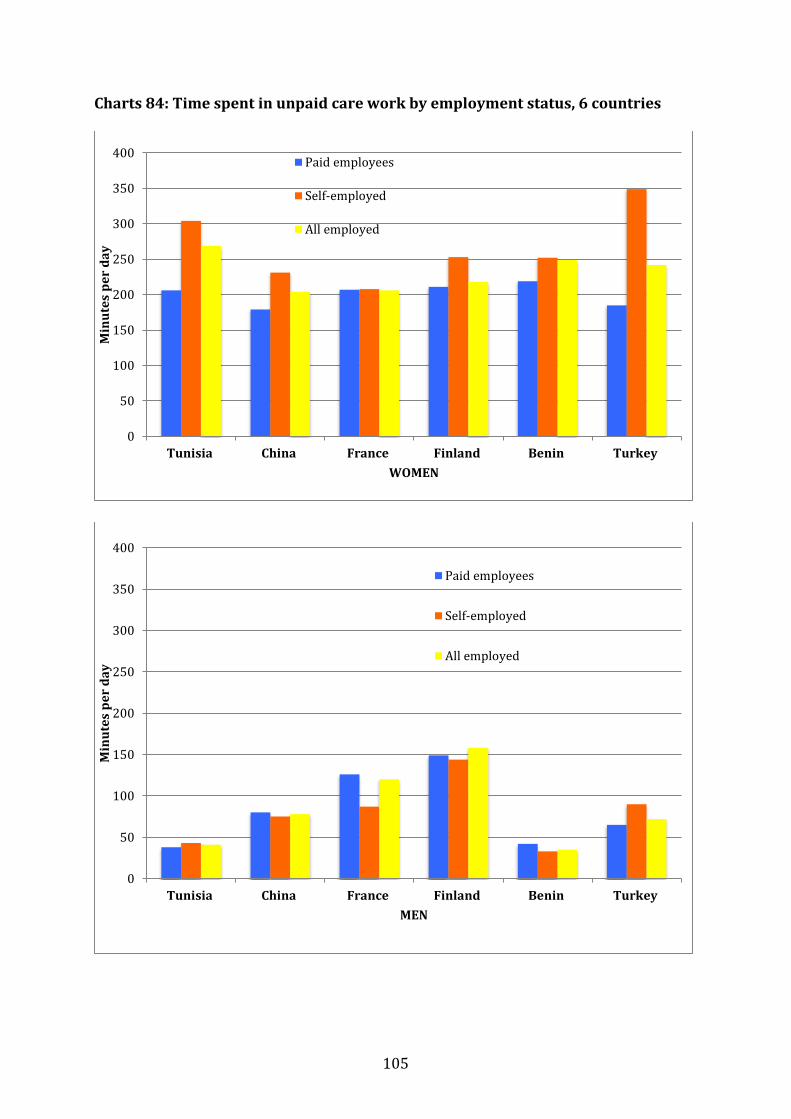
105
Charts 84: Time spent in unpaid care work by employment status, 6 countries
0
50
100
150
200
250
300
350
400
Tunisia China France Finland Benin Turkey
Min
ute
s p
er
da
y
WOMEN
Paid employees
Self-employed
All employed
0
50
100
150
200
250
300
350
400
Tunisia China France Finland Benin Turkey
Min
ute
s p
er
da
y
MEN
Paid employees
Self-employed
All employed

106
6) Paid work and unpaid care work by income groups Income groups may refer to household expenditures or to household income and therefore being classified by expenditures or income groups, or by quintiles, quartiles (such as in China) or in three income categories in South Africa. Charts 85 show that time devoted by women to paid work is clearly increasing with the income group in South Africa and Argentina. The more women work for pay or profit, the more the household income grows up. It means that women’s work is a determinant factor of the household’s standard of living and also that women’s work is more socially accepted in well-off households. China and Ghana show a different picture: women’s paid work seems to decline with the rise in income brackets. Men’s paid work follows the same trends, upwards oriented for South Africa, for Argentina (but only for the three first quintiles), and also for Ethiopia, and downward oriented for Ghana and China, and less clearly for Tunisia. Women’s unpaid care work (Charts 86) is obviously downward oriented in all countries except in Ghana where the decline is more pronounced for intermediary income groups. As to men’s unpaid care work, Charts 86 highlight two different patterns. In countries such as Ethiopia, South Africa and Argentina, men reduce their time dedicated to unpaid care work as the household progresses through the income brackets. Whereas the contrary occurs - though not regularly - in Tunisia, Ghana, China and Uruguay, showing slow changes in cultural habits among higher-income groups. Such findings do not imply that unpaid care work does not improve living standards, but simply mean that resorting to unpaid care work decreases as the households can access to these services through the market and dedicate more hours to paid work.

107
Charts 85: Time spent in paid work by income group, 6 countries
Note: No data available on paid work in Uruguay
0
50
100
150
200
250
300
350
400
450
Tunisia Ethiopia Ghana South Africa China Argentina
Min
ute
s p
er
da
y
WOMEN
1st quintile
2nd quintile
3rd quintile
4th quintile
5th quintile
0
50
100
150
200
250
300
350
400
450
Tunisia Ethiopia Ghana South Africa China Argentina
Min
ute
s p
er
da
y
MEN
1st quintile
2nd quintile
3rd quintile
4th quintile
5th quintile
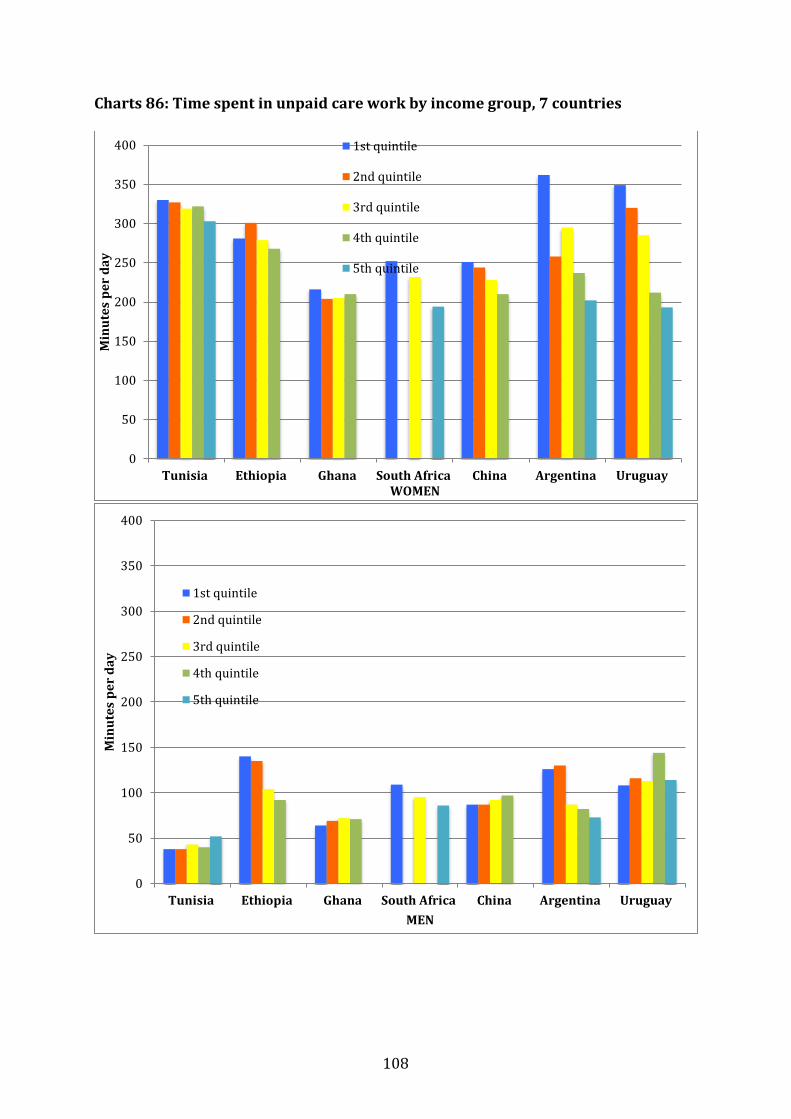
108
Charts 86: Time spent in unpaid care work by income group, 7 countries
0
50
100
150
200
250
300
350
400
Tunisia Ethiopia Ghana South Africa China Argentina Uruguay
Min
ute
s p
er
da
y
WOMEN
1st quintile
2nd quintile
3rd quintile
4th quintile
5th quintile
0
50
100
150
200
250
300
350
400
Tunisia Ethiopia Ghana South Africa China Argentina Uruguay
Min
ute
s p
er
da
y
MEN
1st quintile
2nd quintile
3rd quintile
4th quintile
5th quintile
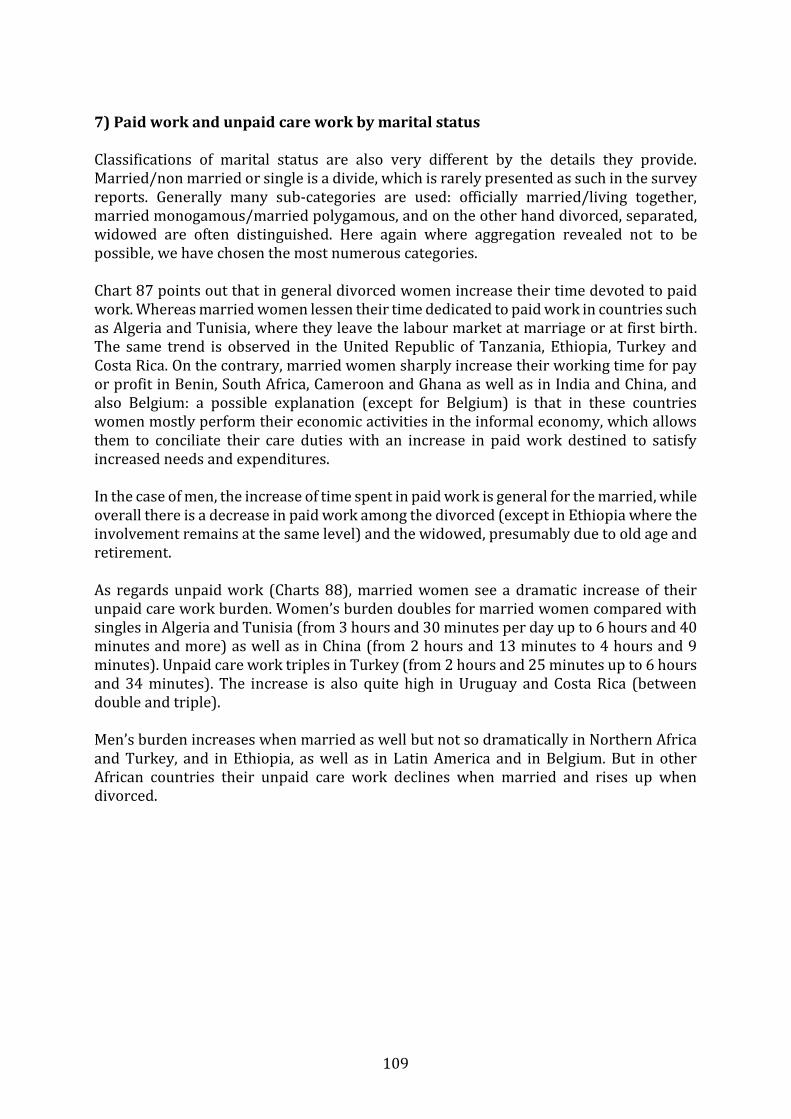
109
7) Paid work and unpaid care work by marital status Classifications of marital status are also very different by the details they provide. Married/non married or single is a divide, which is rarely presented as such in the survey reports. Generally many sub-categories are used: officially married/living together, married monogamous/married polygamous, and on the other hand divorced, separated, widowed are often distinguished. Here again where aggregation revealed not to be possible, we have chosen the most numerous categories. Chart 87 points out that in general divorced women increase their time devoted to paid work. Whereas married women lessen their time dedicated to paid work in countries such as Algeria and Tunisia, where they leave the labour market at marriage or at first birth. The same trend is observed in the United Republic of Tanzania, Ethiopia, Turkey and Costa Rica. On the contrary, married women sharply increase their working time for pay or profit in Benin, South Africa, Cameroon and Ghana as well as in India and China, and also Belgium: a possible explanation (except for Belgium) is that in these countries women mostly perform their economic activities in the informal economy, which allows them to conciliate their care duties with an increase in paid work destined to satisfy increased needs and expenditures. In the case of men, the increase of time spent in paid work is general for the married, while overall there is a decrease in paid work among the divorced (except in Ethiopia where the involvement remains at the same level) and the widowed, presumably due to old age and retirement. As regards unpaid work (Charts 88), married women see a dramatic increase of their unpaid care work burden. Women’s burden doubles for married women compared with singles in Algeria and Tunisia (from 3 hours and 30 minutes per day up to 6 hours and 40 minutes and more) as well as in China (from 2 hours and 13 minutes to 4 hours and 9 minutes). Unpaid care work triples in Turkey (from 2 hours and 25 minutes up to 6 hours and 34 minutes). The increase is also quite high in Uruguay and Costa Rica (between double and triple). Men’s burden increases when married as well but not so dramatically in Northern Africa and Turkey, and in Ethiopia, as well as in Latin America and in Belgium. But in other African countries their unpaid care work declines when married and rises up when divorced.
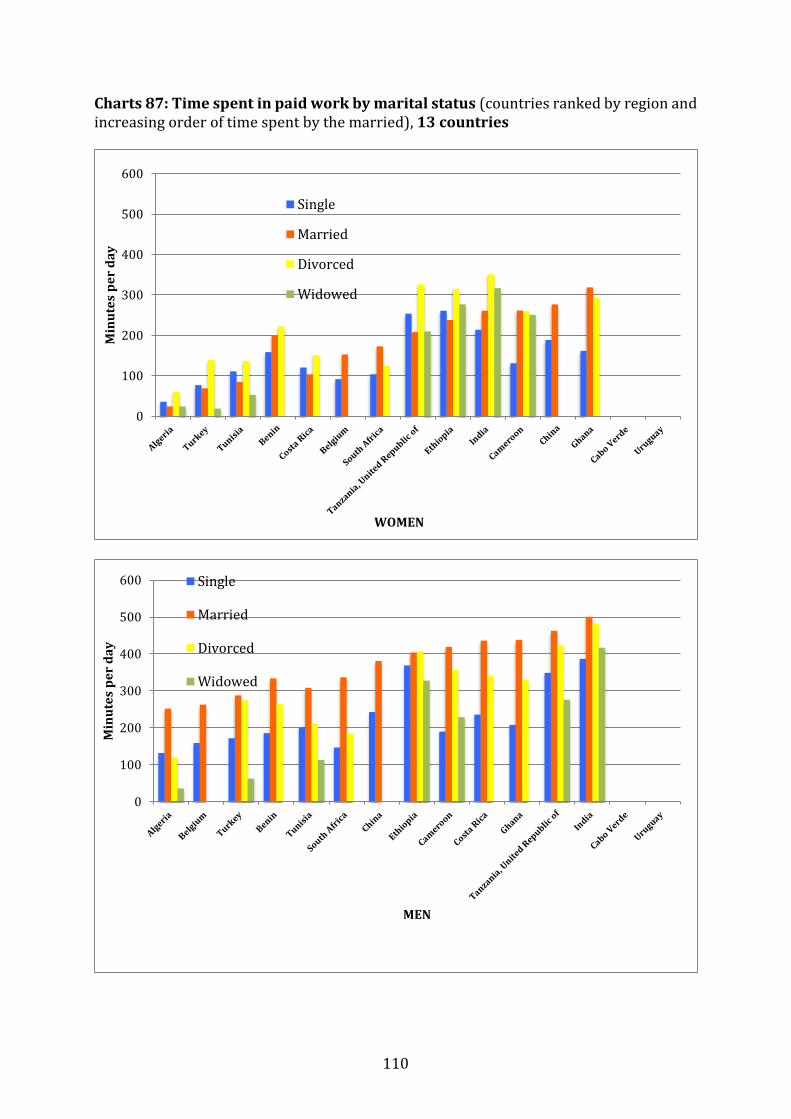
110
Charts 87: Time spent in paid work by marital status (countries ranked by region and increasing order of time spent by the married), 13 countries
0
100
200
300
400
500
600
Min
ute
s p
er
da
y
WOMEN
Single
Married
Divorced
Widowed
0
100
200
300
400
500
600
Min
ute
s p
er
da
y
MEN
Single
Married
Divorced
Widowed
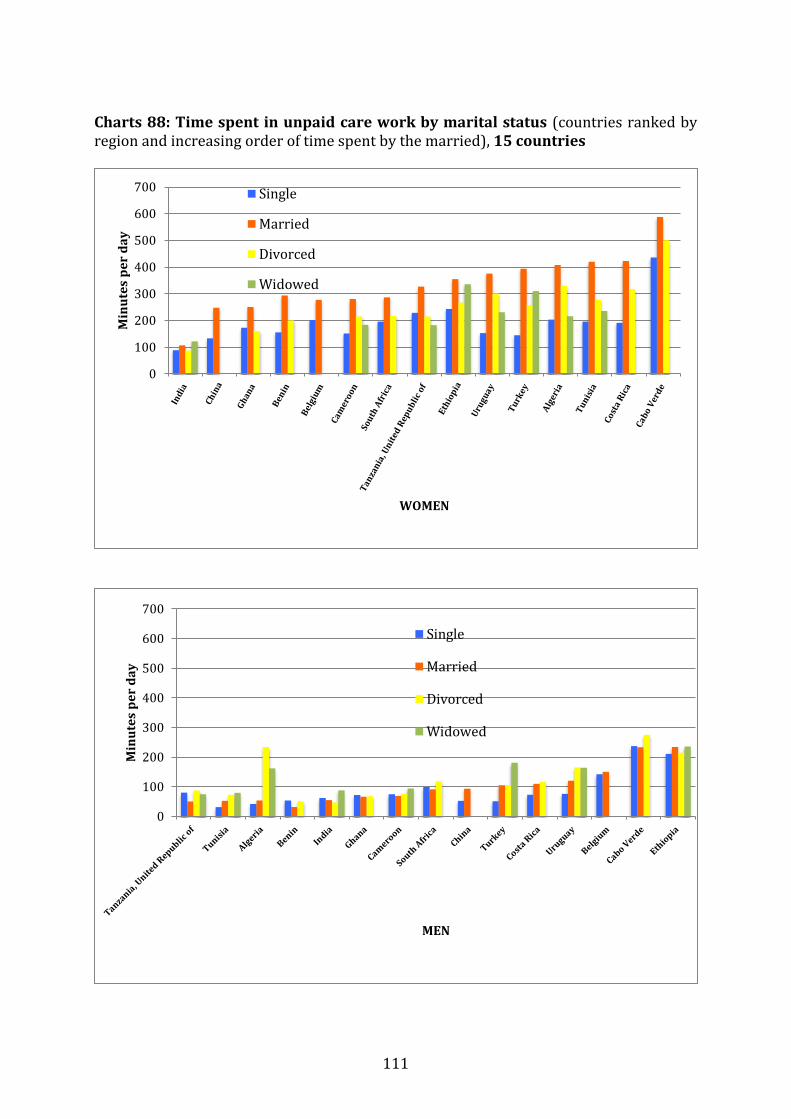
111
Charts 88: Time spent in unpaid care work by marital status (countries ranked by region and increasing order of time spent by the married), 15 countries
0
100
200
300
400
500
600
700
Min
ute
s p
er
da
y
WOMEN
Single
Married
Divorced
Widowed
0
100
200
300
400
500
600
700
Min
ute
s p
er
da
y
MEN
Single
Married
Divorced
Widowed
112
8) Paid work and unpaid care work by presence of children in the household and their age group Maternity and care of children are major determinants of the increase of time spent in unpaid care work within the household. In order to capture changes in time-use due to childcare, survey reports use different methodologies. They adjust for age (for instance, 25+ years in Algeria or less than 45 years in Finland) or categorise households in sub-groups depending on the presence or not of children under a certain age or within an age bracket. It should be noted that these types of classification are not harmonised, therefore the age groups and classifications used in our tabulations and figures are not homogeneous. Four categories have been defined: no children in the household; presence of children under 5 years of age; presence of children aged between 5 and 11 years; presence of children aged between 11 to 17 years. However, some countries use different age brackets, including 6 and 18 years (Ethiopia and Ghana, China); or 7 and 18 years (South Africa); 7 and 17 years (Belgium, Finland, Serbia, Albania), and 3, 6 and 12 (Uruguay). Sometimes, countries such as Ethiopia, Ghana, Uruguay include the precision: “at least one child aged less than…”. As expected (Charts 89), women’s time dedicated to paid work declines with the presence of a young child and increases when the child gets older: from 4 hours and 18 minutes down to 1 hour and 37 minutes in the United Kingdom (2005), or from 3 hours and 30 minutes down to 2 hours and 32 minutes in Finland (2009-10) or from 4 hours and 41 minutes down to 3 hours and 56 minutes in China (2008). There are exceptions however: time spent by women in paid work increases with the presence of a young child as if the latter required the mother to work for pay or profit in South Africa and in Belgium (respectively from 1 hour and 38 minutes up to 2 hours and 26 minutes, and from 1 hour and 15 minutes up to 2 hours and 24 minutes). Regarding men’s time in paid work, it substantially increases with the presence of children in most countries highlighting the transition from youth (or study) to work that corresponds to marriage and paternity, for instance from 1 hour and 55 minutes up to 4 hours and 25 minutes in Belgium (2013), or from 2 hours and 33 minutes up to 5 hours and 46 minutes in South Africa (2010), with the exception of Ghana where it declines (from 6 hours and 28 minutes down to 5 hours and 27 minutes). Time dedicated to unpaid care work noticeably increases with the presence of children, and in particular of children less than 5 years old, in all reviewed countries (Charts 90). It more than doubles in Finland and it triples in the United Kingdom. The overload ranges from 1 hour and 24 minutes in Belgium up to 3 hours and 30 minutes in Finland and even 4 hours and 6 minutes in the United Kingdom. In these two countries, men also dramatically increase their unpaid care work (by one hour and 39 or 41 minutes respectively). The increase is more modest in the other countries, from 0 minute in South Africa, 3 minutes in Ghana, 6 minutes in Algeria, up to 35 minutes in Ethiopia and 36 minutes in China. Men’s unpaid care work even declines in Albania with the presence of a young child.
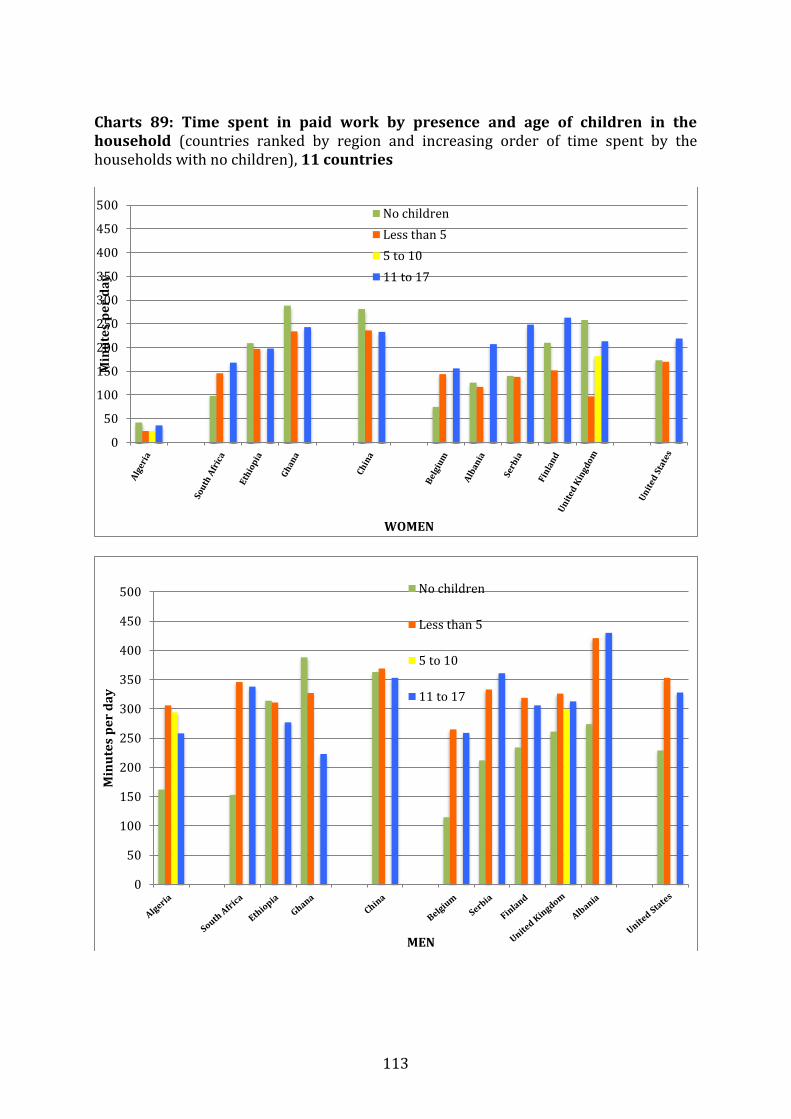
113
Charts 89: Time spent in paid work by presence and age of children in the household (countries ranked by region and increasing order of time spent by the households with no children), 11 countries
0
50
100
150
200
250
300
350
400
450
500
Min
ute
s p
er
da
y
WOMEN
No children
Less than 5
5 to 10
11 to 17
0
50
100
150
200
250
300
350
400
450
500
Min
ute
s p
er
da
y
MEN
No children
Less than 5
5 to 10
11 to 17
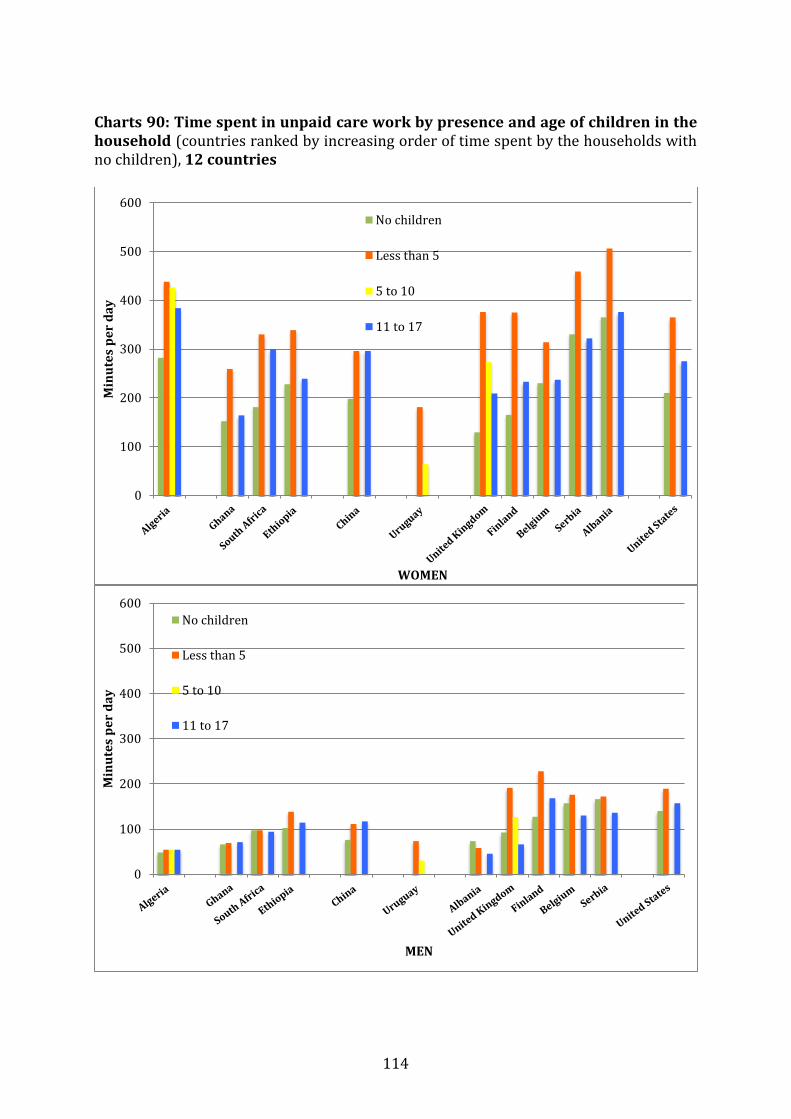
114
Charts 90: Time spent in unpaid care work by presence and age of children in the household (countries ranked by increasing order of time spent by the households with no children), 12 countries
0
100
200
300
400
500
600
Min
ute
s p
er
da
y
WOMEN
No children
Less than 5
5 to 10
11 to 17
0
100
200
300
400
500
600
Min
ute
s p
er
da
y
MEN
No children
Less than 5
5 to 10
11 to 17
115
Section 5: Trends in paid work and unpaid care work by regions Among the 75 countries having carried out a time-use survey, only 27 have repeated the survey at least once. The periodicity of time-use surveys is generally irregular. The United States is the only country that has carried out such a survey regularly on a yearly basis since 2003. Norway conducts a time-use survey every ten years since 1970. For most countries, only two points (or three points) in time are available. Assessing trends is therefore difficult. Charts 91 below clearly indicates that for the United States, trends in unpaid care work are downward oriented for women as well as for men, with a more rapid decline for women, so that in the country where the gender gap in unpaid care work is the least extended, it is still declining. Similarly trends in paid work are also downward oriented, less rapidly for women than for men. In terms of proportion of total work, the share of unpaid care work remained remarkably stable around 59 per cent for women, against 38 per cent for men. The trends in time spent in paid work clearly illustrate the impact of the financial crisis, showing a dramatic drop between 2008 and 2010 among men (from 271 minutes per day or 4 hours and 31 minutes down to 245 minutes or 4 hours and 5 minutes), a drop that is interestingly preceded by a similar pattern among women from 2007 to 2009 (from 188 minutes or 3 hours and 8 minutes down to 171 minutes or 2 hours and 51 minutes). In other words women were the first to be impacted and they were also the first to recover in 2010. A similar shifted drop is observed between 2012 and 2013 for women and 2014 and 2015 for men. It is also interesting to note that similar drops – though less marked and ahead of paid work – are observed for unpaid care work, especially among men, as if just before the crisis men (and women) tended to reduce their unpaid care work (due to more intensive paid work ?). In Canada (Charts 92), women and men’s unpaid care work is downward oriented (more rapidly for women, so that the gap is reducing) and dropped below the levels of the USA. Regarding paid work the trends are downward oriented, more rapidly for men compared with women. The impact of the 2008 financial crisis is again clearly visible: time spent by men in paid work is reduced by 27 minutes between 2005 and 2010 and by 60 minutes between 2005 and 2015. For women, the drop is less marked but still reduced by 6 minutes between 2005 and 2010, and by 24 minutes between 2005 and 2015. Interestingly an increase in unpaid care work is observed among women (+ 5 minutes) and especially among men (+ 14 minutes) between 2005 and 2010. Then after 2010, the downward trend in unpaid care work resumes even more strongly, especially among women.

116
Charts 91: Trends in unpaid care work and paid work in the USA
268 268262 263 263 259 258
252 249 249 252246
251251
168 165 163 164169
162 166 167 165156
163 159 158162
120
140
160
180
200
220
240
260
280
300
2003 2004 2005 2006 2007 2008 2009 2010 2011 2012 2013 2014 2015 2016
Min
ute
s p
er
da
y
USA
Women Unpaid care work
Men Unpaid care work
173178 180 181
188179
171176 177 176
166176 175 173
274265 266
272 271 271
256
245254 250 252
257251 253
120
140
160
180
200
220
240
260
280
300
2003 2004 2005 2006 2007 2008 2009 2010 2011 2012 2013 2014 2015 2016
Min
ute
s p
er
da
y Women Paid work
Men Paid work

117
Charts 92: Trends in unpaid care work and paid work in Canada
270264
252257
216
156162
156
170
144
120
140
160
180
200
220
240
260
280
300
1992 1998 2005 2010 2015
Min
ute
s p
er
da
y
Canada
Women Unpaid care work
Men Unpaid care work
162168
186180
162
270 270
282
255
222
120
140
160
180
200
220
240
260
280
300
1992 1998 2005 2010 2015
Min
ute
s p
er
da
y
Women Paid work
Men Paid work
118
Charts 93 and 94 highlight the trends in women and men’s unpaid care work in Northern, Western and Southern Europe. In all countries, time spent by women in unpaid work has rapidly declined since the 1970s, in most countries, especially where unpaid care work was taking longer hours. In the recent period six countries have come down from 6 or 5 hours per day under the limit of 4 hours per day (240 minutes). In three other countries (Italy, Spain and Estonia), unpaid care work is still above 4 hours, but they are rapidly re-joining the other group. Regarding men, the trends are unclear. While Norway and Sweden are characterised by an increased contribution of men to unpaid work (up to more than 3 hours per day), as well as Finland and Belgium (above two hours) but at a lower level, and also a very rapid increase in Spain (starting from a very low point), all the other countries have seen a recent decline of men’s contribution to unpaid work: the United Kingdom, Italy (after a very strong increase), Estonia, and more slowly: France. Simultaneously, Charts 95 and 96 show that the contribution of men to paid work has been on the decline in all countries (except Belgium) of Northern, Western and Southern Europe whereas the contribution of women was rather on the increase (except in Estonia, Finland and Italy for the most recent period). From these time-use data it is clear that women continue to bear the bulk of unpaid care work, while men’s participation to these activities has increased over time. These findings are in line with the conclusions of Oriel Sullivan (2000) and Man Yee Kan, Oriel Sullivan, Jonathan Gershuny (2011)11 who show that cross national trends over the last 40 years reveal a slow and incomplete convergence of women’s and men’s work patterns: beyond the trends, “gender segregation in domestic work is quite persistent over time. Women still do the bulk of routine housework and caring for family members while men have increased their contributions disproportionately to non-routine domestic work”. Charts 97 to 104 show the trends in the few countries in the other regions. In some regions, women’s unpaid work is still on the rise, whereas in other regions it is declining. And at the same time, men’s unpaid work is declining in some regions whereas it is increasing in other regions. However, Charts 105 to 110 summarize the global trends that emerge from our database by providing a general view for the 25 countries.
11 Oriel Sullivan (2000), The Division of Domestic Labour: Twenty Years of Change? Sociology, 34(3), 437-456. Man Yee Kan, Oriel Sullivan, Jonathan Gershuny (2011), Gender Convergence in Domestic Work: Discerning the Effects of Interactional and Institutional Barriers from Large-scale Data, in Sociology 45 (2), 234-251.

119
Chart 93: Trends in women’s unpaid care work in Northern, Western and Southern Europe, 10 countries
Table 3 : Time spent by women in unpaid care work in Northern, Western and Southern Europe (in minutes per day)
1970-74 1979-80 1987-90 1999-2000 2005 2009-2015
Belgium 224 214 214
Estonia 302 282 261
Finland 226 222 221 216 211
France 332 320 307 267 251 234
Germany 282 267 253
Italy 350 349 347 286
Norway 355 286 262 236 233 230
Spain 280 263
Sweden 254 247 240 United
Kingdom 261 232 229
Note : Figures in italics have been interpolated in order to show up on the chart
Belgium
Estonia
Finland
France
Germany
Italy
Norway
Spain
Sweden
United Kingdom
200
220
240
260
280
300
320
340
360
1970 1979-80 1987-90 1999-2000 2005 2009-2015
Min
ute
s p
er
da
y

120
Chart 94: Trends in men’s unpaid care work in Northern, Western and Southern Europe, 10 countries
Table 4: Time spent by men in unpaid care work in Northern, Western and Southern Europe (in minutes per day)
1970-74 1979-80 1987-90 1999-2000 2005 2009-2015
Belgium 128 128 132
Estonia 179 174 169
Finland 120 128 130 135 139
France 123 125 127 151 150 148
Germany 177 171 166
Italy 78 102 126 97
Norway 133 146 156 161 171 180
Spain 101 126
Sweden 183 189 194
United Kingdom
153 131 133
Note : Figures in italics have been interpolated in order to show up on the chart
Belgium
Estonia
FinlandFrance
Germany
Italy
Norway
Spain
Sweden
United Kingdom
70
90
110
130
150
170
190
210
1970-74 1979 1987 1999 2005 2009-2015
Min
tes
pe
r d
ay
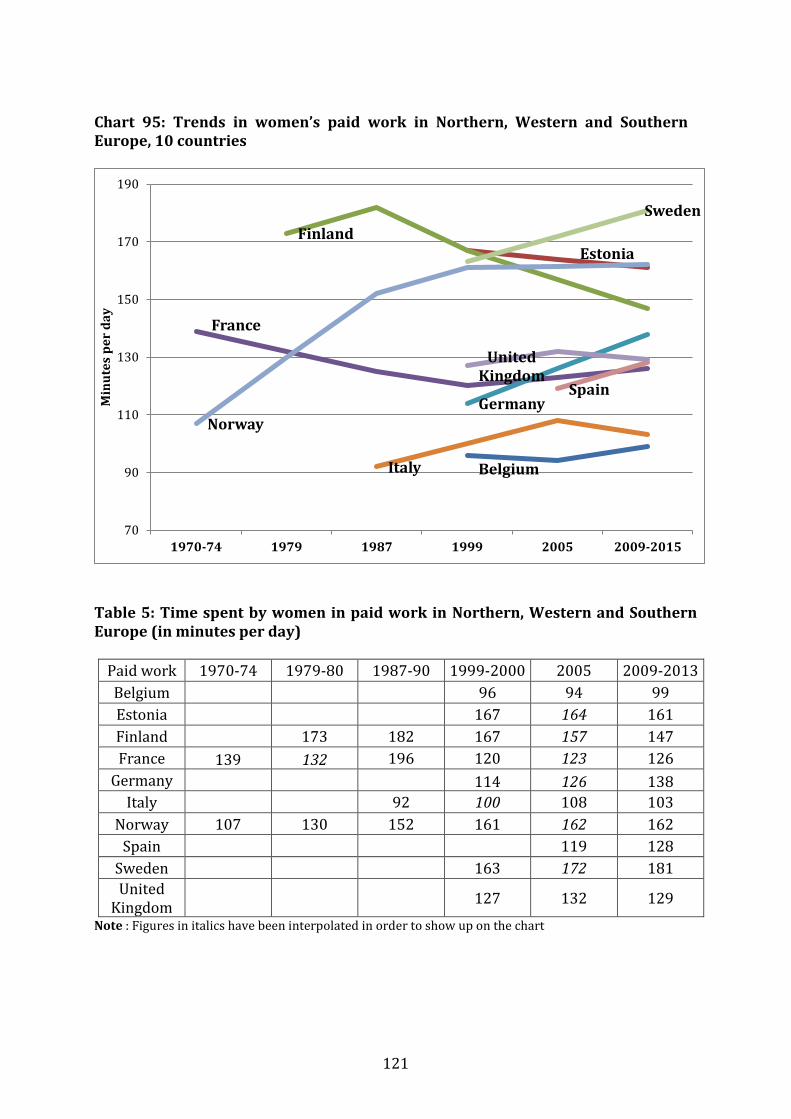
121
Chart 95: Trends in women’s paid work in Northern, Western and Southern Europe, 10 countries
Table 5: Time spent by women in paid work in Northern, Western and Southern Europe (in minutes per day)
Paid work 1970-74 1979-80 1987-90 1999-2000 2005 2009-2013
Belgium 96 94 99
Estonia 167 164 161
Finland 173 182 167 157 147
France 139 132 196 120 123 126
Germany 114 126 138
Italy 92 100 108 103
Norway 107 130 152 161 162 162
Spain 119 128
Sweden 163 172 181
United Kingdom
127 132 129
Note : Figures in italics have been interpolated in order to show up on the chart
Belgium
EstoniaFinland
France
Germany
Italy
Norway
Spain
Sweden
United Kingdom
70
90
110
130
150
170
190
1970-74 1979 1987 1999 2005 2009-2015
Min
ute
s p
er
da
y
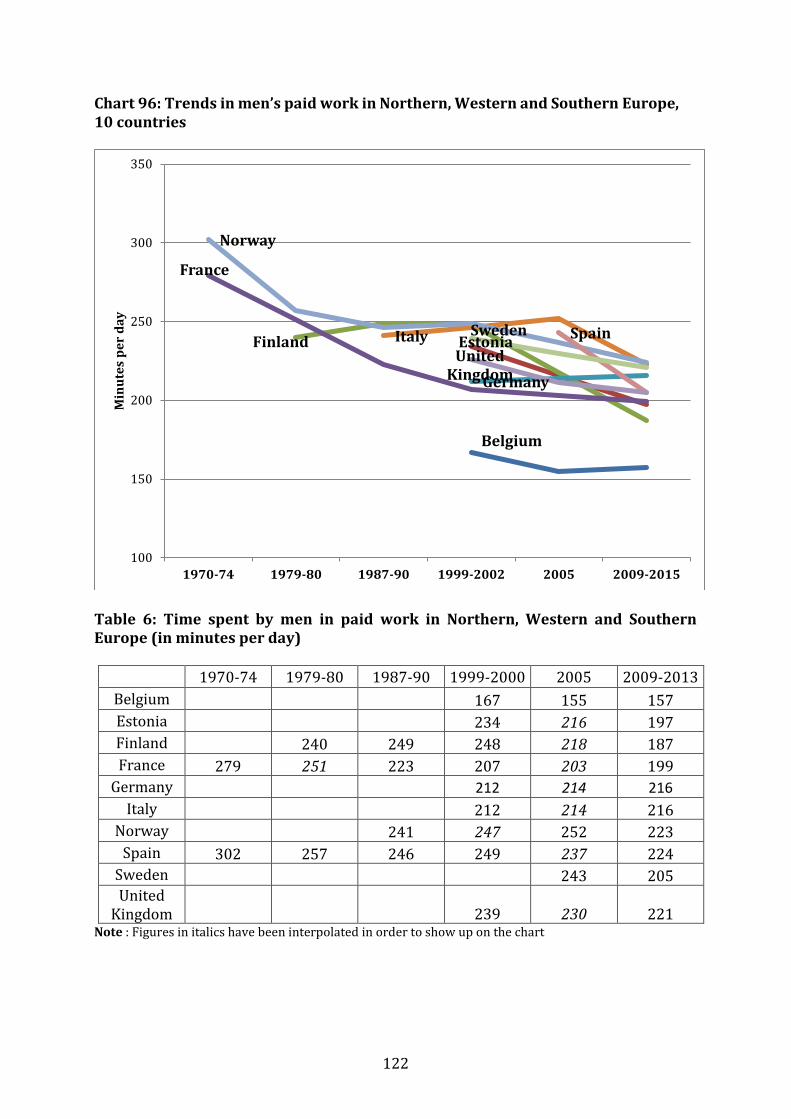
122
Chart 96: Trends in men’s paid work in Northern, Western and Southern Europe, 10 countries
Table 6: Time spent by men in paid work in Northern, Western and Southern Europe (in minutes per day)
1970-74 1979-80 1987-90 1999-2000 2005 2009-2013
Belgium 167 155 157
Estonia 234 216 197
Finland 240 249 248 218 187
France 279 251 223 207 203 199
Germany 212 214 216
Italy 212 214 216
Norway 241 247 252 223
Spain 302 257 246 249 237 224
Sweden 243 205 United
Kingdom 239 230 221 Note : Figures in italics have been interpolated in order to show up on the chart
Belgium
EstoniaFinland
France
Germany
Italy
Norway
SpainSweden
United Kingdom
100
150
200
250
300
350
1970-74 1979-80 1987-90 1999-2002 2005 2009-2015
Min
ute
s p
er
da
y

123
Charts 97: Trends in unpaid care work in sub-Saharan Africa, 3 countries
Benin
South Africa
Tanzania, United
Republic
190
200
210
220
230
240
250
1998-2000 2006 2010-15
Min
ute
s p
er
da
y
WOMEN
Benin
South AfricaTanzania,
United Republic
0
20
40
60
80
100
120
1998-2000 2006 2010-15
Min
ute
s p
erd
ay
MEN

124
Charts 98: Trends in paid work in sub-Saharan Africa, 3 countries
Benin
South Africa
Tanzania, United
Republic
0
50
100
150
200
250
300
1998-2000 2006 2010-15
Min
ute
s p
er
da
y
WOMEN
Benin
South Africa
Tanzania, United
Republic
0
50
100
150
200
250
300
350
400
1998-2000 2006 2010-15
Min
ute
s p
er
da
y
MEN
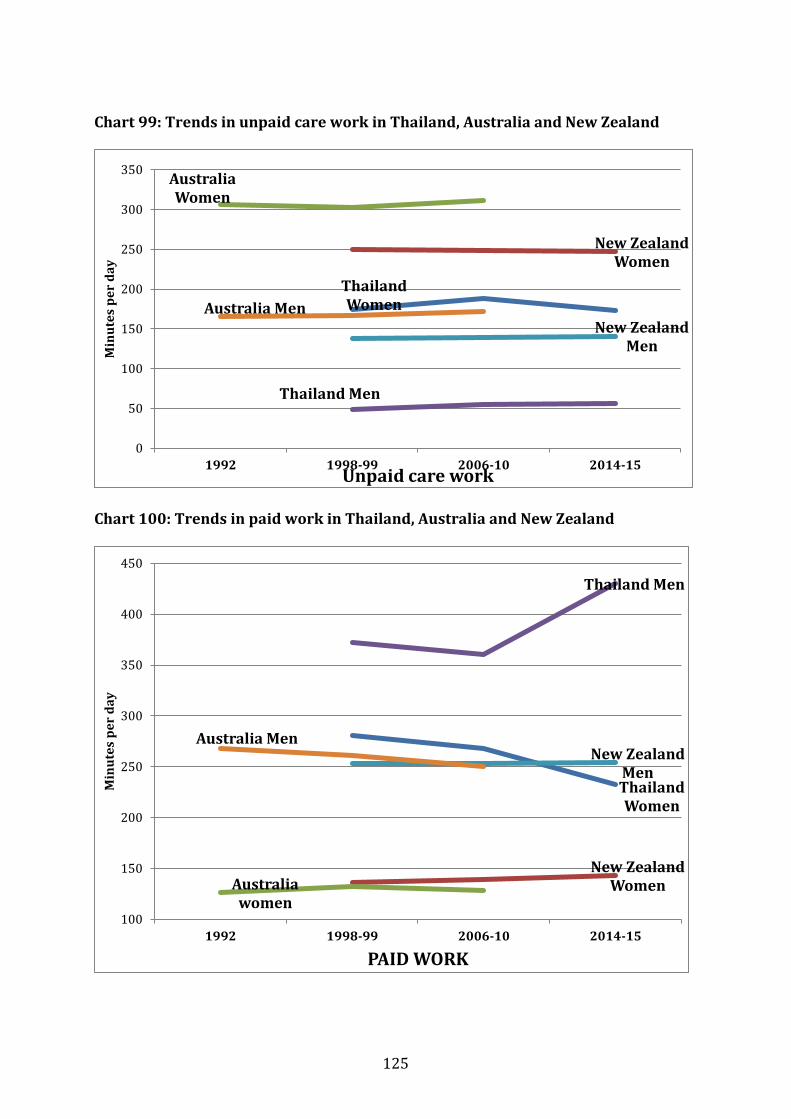
125
Chart 99: Trends in unpaid care work in Thailand, Australia and New Zealand
Chart 100: Trends in paid work in Thailand, Australia and New Zealand
Thailand Women
New Zealand Women
Australia Women
Thailand Men
New Zealand Men
Australia Men
0
50
100
150
200
250
300
350
1992 1998-99 2006-10 2014-15
Min
ute
s p
er
da
y
Unpaid care work
Thailand Women
New Zealand WomenAustralia
women
Thailand Men
New Zealand Men
Australia Men
100
150
200
250
300
350
400
450
1992 1998-99 2006-10 2014-15
Min
ute
s p
er
da
y
PAID WORK
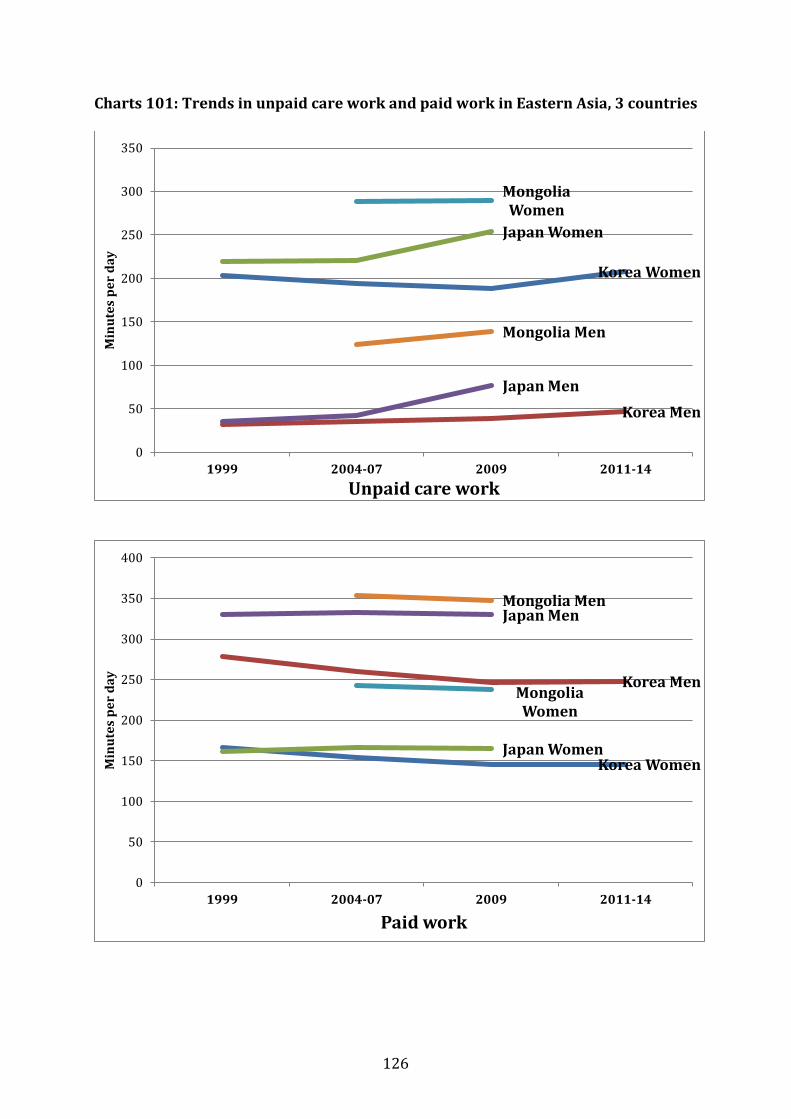
126
Charts 101: Trends in unpaid care work and paid work in Eastern Asia, 3 countries
Korea Women
Korea Men
Japan Women
Japan Men
Mongolia Women
Mongolia Men
0
50
100
150
200
250
300
350
1999 2004-07 2009 2011-14
Min
ute
s p
er
da
y
Unpaid care work
Korea Women
Korea Men
Japan Women
Japan Men
Mongolia Women
Mongolia Men
0
50
100
150
200
250
300
350
400
1999 2004-07 2009 2011-14
Min
ute
s p
er
da
y
Paid work
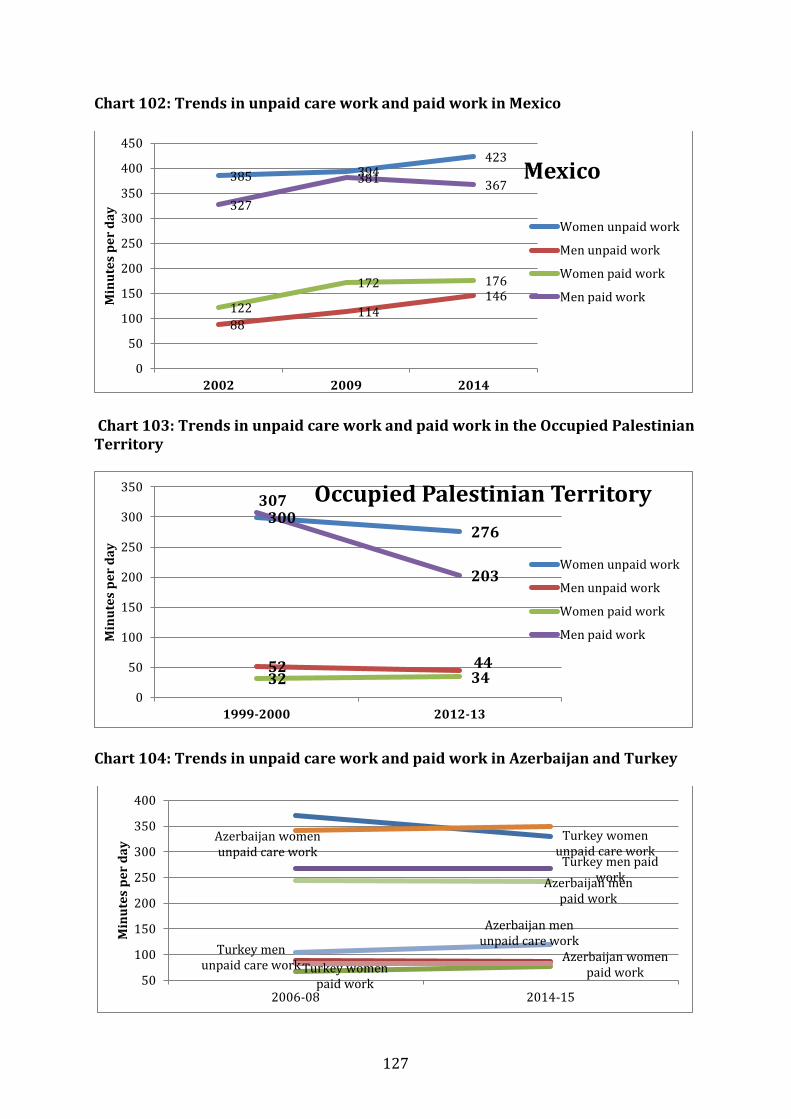
127
Chart 102: Trends in unpaid care work and paid work in Mexico
Chart 103: Trends in unpaid care work and paid work in the Occupied Palestinian Territory
Chart 104: Trends in unpaid care work and paid work in Azerbaijan and Turkey
385 394423
88114
146122
172 176
327
381367
0
50
100
150
200
250
300
350
400
450
2002 2009 2014
Min
ute
s p
er
da
y
Mexico
Women unpaid work
Men unpaid work
Women paid work
Men paid work
300276
52 4432 34
307
203
0
50
100
150
200
250
300
350
1999-2000 2012-13
Min
ute
s p
er
da
y
Occupied Palestinian Territory
Women unpaid work
Men unpaid work
Women paid work
Men paid work
Turkey women unpaid care work
Turkey men unpaid care workTurkey women
paid work
Turkey men paid work
Azerbaijan women unpaid care work
Azerbaijan men unpaid care work
Azerbaijan women paid work
Azerbaijan men paid work
50
100
150
200
250
300
350
400
2006-08 2014-15
Min
ute
s p
er
da
y

128
Charts 105 to 108 have selected for the 25 countries for which several observations over time are available, the earliest year and the latest. In all 4 charts the earliest year is green-coloured, and the latest is yellow-coloured whether the trend is upward-oriented, blue-coloured whether the trend is downward-oriented, and green in case of stability. In sixteen countries (out of 25) of Northern America, Northern-Southern-Western Europe, South-Eastern Asia and Pacific (except in New Zealand), Arab countries and Western Asia (Chart 105), time spent by women in unpaid care work has declined (more dramatically in Norway, France, Italy, Canada, Turkey and much less in Thailand, New Zealand, Belgium and Spain). In nine countries (out of 25) of Africa, Eastern Asia, Western Asia and Latin America, women’s unpaid care work has increased (especially in Japan and Mexico). As to men (Chart 106), progress is more mixed. During the same periods, men’s unpaid care work has increased in twelve countries (more dramatically in Norway and Mexico, and much less in Mexico, Japan, Belgium, United Kingdom) whereas it declined in eleven countries (more dramatically in France and Thailand and much less in Turkey, Germany and Estonia) and remained stable in two more countries (Canada and United States). In eighteen countries (out of 25) (Chart 107), women’s paid work has increased (more dramatically in Mexico, Norway, Japan and Spain), whereas it declined in six countries (more dramatically in Benin and United Kingdom) and remained stable in one country (Azerbaijan). In the mean time, men’s paid work (Chart 108) has increased in 7 countries (more dramatically in the United Republic of Tanzania, Thailand and Mexico), remained stable in two countries (Japan and Turkey) and declined in seventeen countries (more dramatically in France, the Occupied Palestinian Territory, Norway, Finland, Canada). Charts 109 and 110 summarize the global trends in unpaid care work and in paid work for the period. The average year for the earliest period is 1998 and for the latest 2012. For this set of 25 countries, weighed and unweighted averages are quite similar. The following charts present the weighted averages. Whereas women’s unpaid care work decreased from 276 minutes (4 hours and 36 minutes) down to 266 minutes (4 hours and 26 minutes) or 10 minutes in total over 15 years, men’s unpaid care work increased by 1 minute (from 115 minutes or 1 hour and 55 minutes, up to 128 minutes). In proportion the share of women in total unpaid work has dropped from 70.6 per cent down to 67.5 per cent (or 3.1 percentage points) in 15 years. During the same period, women’s paid work has decreased from 151 minutes down to 149 minutes (a drop of 2 minutes) whereas men lost 11 minutes (Charts 110). Proportionally in 2012 women contribute for 35.6 per cent of total paid work (a gain of 0.6 percentage points). Finally women reduced by 11 minutes their contribution to total work over the 15 years, while men increased theirs by 2 minutes. Women still contribute to 51.1 per cent of total work in 2012 against 51.9 per cent in 1998.

129
Chart 105: Trends in women’s unpaid work across regions (earliest and latest years). 25 countries
Note: Earliest year in green. Latest year in yellow (where increase) and in blue where decrease
0
50
100
150
200
250
300
350
400
450
19
98
20
15
20
00
20
10
20
06
20
14
19
92
20
15
20
03
20
16
20
04
20
14
-15
19
98
-99
20
09
-10
19
92
20
06
19
99
20
14
20
01
20
11
20
07
20
11
20
02
20
14
19
99
20
13
19
99
-20
00
20
09
-10
19
79
20
09
19
86
20
10
20
01
-02
20
12
19
88
-89
20
13
-14
19
70
20
10
20
02
-03
20
09
-10
20
00
-01
20
10
-11
20
00
20
15
19
99
-20
00
20
12
-13
20
06
20
14
-15
20
08
20
12
Benin SouthAfrica
Tanzania Canada US Thailand NewZealand
Australia Korea Japan Mongolia Mexico Belgium Estonia Finland France Germany Italy Norway Spain Sweden UK Palestinianter.
Turkey Azerbaijan
Sub-Saharan Africa Northern America South-Eastern Asia & Pacific Eastern Asia LatinAmerica
Europe Arabcountries
Western Asia
Min
ute
s p
er
da
y
Women Unpaid work

130
Chart 106: Trends in men’s unpaid work across regions (earliest and latest years). 25 countries
Note: Earliest year in green. Latest year in yellow (where increase), in blue where decrease, in green where stable
0
50
100
150
200
250
300
350
400
450
19
98
20
15
20
00
20
10
20
06
20
14
19
92
20
15
20
03
20
16
20
04
20
14
-15
19
98
-99
20
09
-10
19
92
20
06
19
99
20
14
20
01
20
11
20
07
20
11
20
02
20
14
19
99
20
13
19
99
-20
00
20
09
-10
19
79
20
09
19
86
20
10
20
01
-02
20
12
19
88
-89
20
13
-14
19
70
20
10
20
02
-03
20
09
-10
20
00
-01
20
10
-11
20
00
20
15
19
99
-20
00
20
12
-13
20
06
20
14
-15
20
08
20
12
Benin SouthAfrica
Tanzania Canada US Thailand NewZealand
Australia Korea Japan Mongolia Mexico Belgium Estonia Finland France Germany Italy Norway Spain Sweden UK Palestinianter.
Turkey Azerbaijan
Sub-Saharan Africa Northern America South-Eastern Asia & Pacific Eastern Asia LatinAmerica
Europe Arabcountries
Western Asia
Min
ute
s p
er
da
y
Men unpaid work

131
Chart 107: Trends in women’s paid work across regions (earliest and latest years). 25 countries
Note: Earliest year in green. Latest year in yellow (where increase), in blue where decrease, in green where stable
0
50
100
150
200
250
300
350
400
450
19
98
20
15
20
00
20
10
20
06
20
14
19
92
20
15
20
03
20
16
20
04
20
14
-15
19
98
-99
20
09
-10
19
92
20
06
19
99
20
14
20
01
20
11
20
07
20
11
20
02
20
14
19
99
20
13
19
99
-20
00
20
09
-10
19
79
20
09
19
86
20
10
20
01
-02
20
12
19
88
-89
20
13
-14
19
70
20
10
20
02
-03
20
09
-10
20
00
-01
20
10
-11
20
00
20
15
19
99
-20
00
20
12
-13
20
06
20
14
-15
20
08
20
12
Benin SouthAfrica
Tanzania Canada US Thailand NewZealand
Australia Korea Japan Mongolia Mexico Belgium Estonia Finland France Germany Italy Norway Spain Sweden UK Palestinianter.
Turkey Azerbaijan
Sub-Saharan Africa Northern America South-Eastern Asia & Pacific Eastern Asia LatinAmerica
Europe Arabcountries
Western Asia
Min
ute
s p
er
da
y
Women paid work
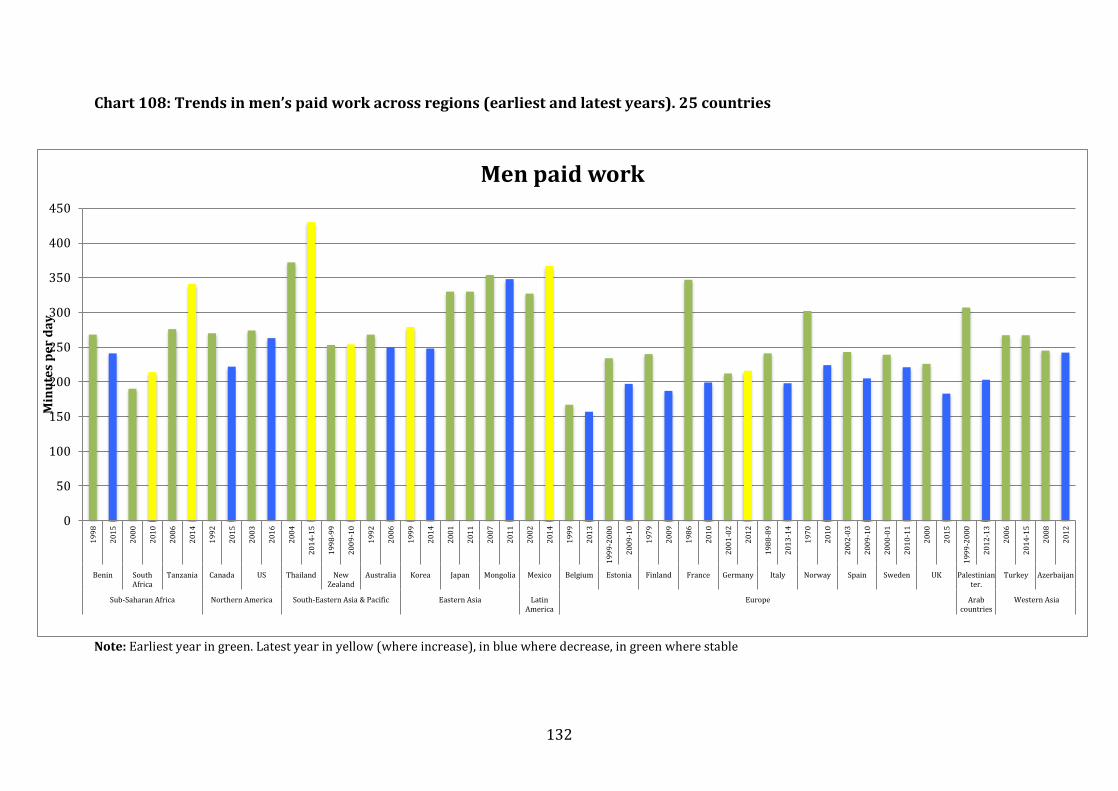
132
Chart 108: Trends in men’s paid work across regions (earliest and latest years). 25 countries
Note: Earliest year in green. Latest year in yellow (where increase), in blue where decrease, in green where stable
0
50
100
150
200
250
300
350
400
450
19
98
20
15
20
00
20
10
20
06
20
14
19
92
20
15
20
03
20
16
20
04
20
14
-15
19
98
-99
20
09
-10
19
92
20
06
19
99
20
14
20
01
20
11
20
07
20
11
20
02
20
14
19
99
20
13
19
99
-20
00
20
09
-10
19
79
20
09
19
86
20
10
20
01
-02
20
12
19
88
-89
20
13
-14
19
70
20
10
20
02
-03
20
09
-10
20
00
-01
20
10
-11
20
00
20
15
19
99
-20
00
20
12
-13
20
06
20
14
-15
20
08
20
12
Benin SouthAfrica
Tanzania Canada US Thailand NewZealand
Australia Korea Japan Mongolia Mexico Belgium Estonia Finland France Germany Italy Norway Spain Sweden UK Palestinianter.
Turkey Azerbaijan
Sub-Saharan Africa Northern America South-Eastern Asia & Pacific Eastern Asia LatinAmerica
Europe Arabcountries
Western Asia
Min
ute
s p
er
da
y
Men paid work
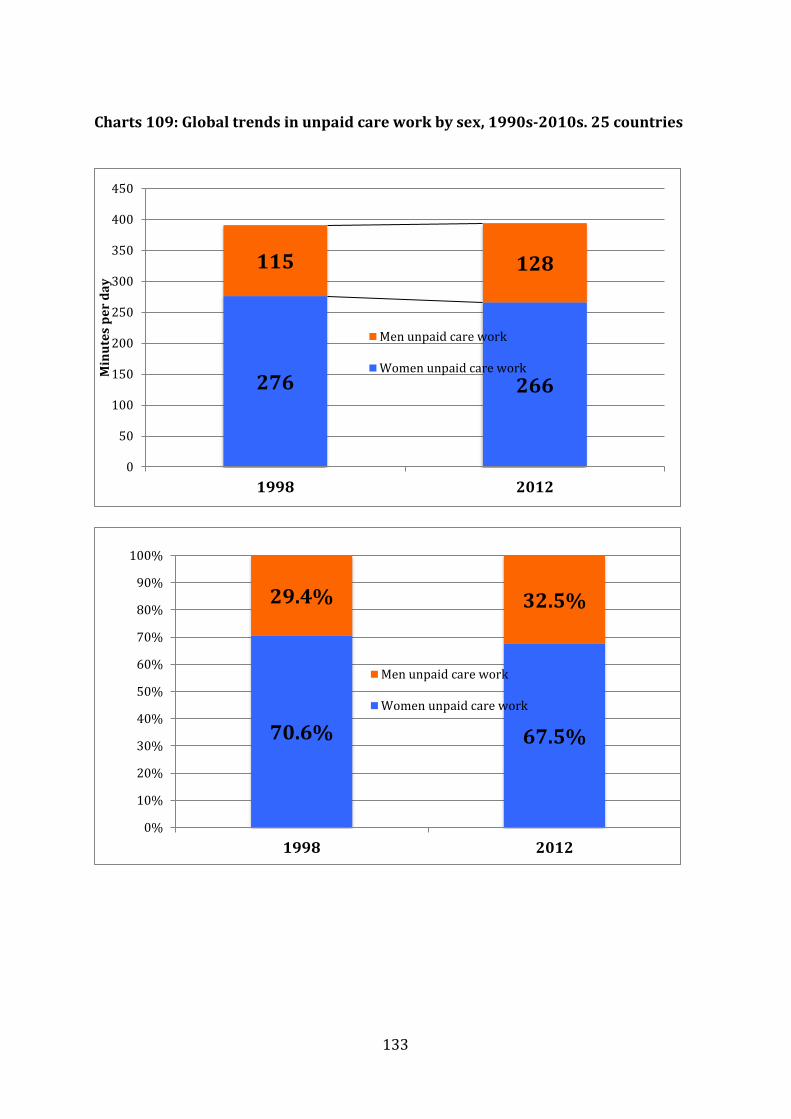
133
Charts 109: Global trends in unpaid care work by sex, 1990s-2010s. 25 countries
276 266
115 128
0
50
100
150
200
250
300
350
400
450
1998 2012
Min
ute
s p
er
da
y
Men unpaid care work
Women unpaid care work
70.6% 67.5%
29.4% 32.5%
0%
10%
20%
30%
40%
50%
60%
70%
80%
90%
100%
1998 2012
Men unpaid care work
Women unpaid care work

134
Charts 110: Global trends in paid work by sex, 1990s-2010s. 25 countries
151 149
281 270
0
50
100
150
200
250
300
350
400
450
500
1998 2012
Min
ute
s p
er
da
y
Men paid work
Women paid work
35.0% 35.6%
65.0% 64.4%
0%
10%
20%
30%
40%
50%
60%
70%
80%
90%
100%
1998 2012
Men paid work
Women paid work
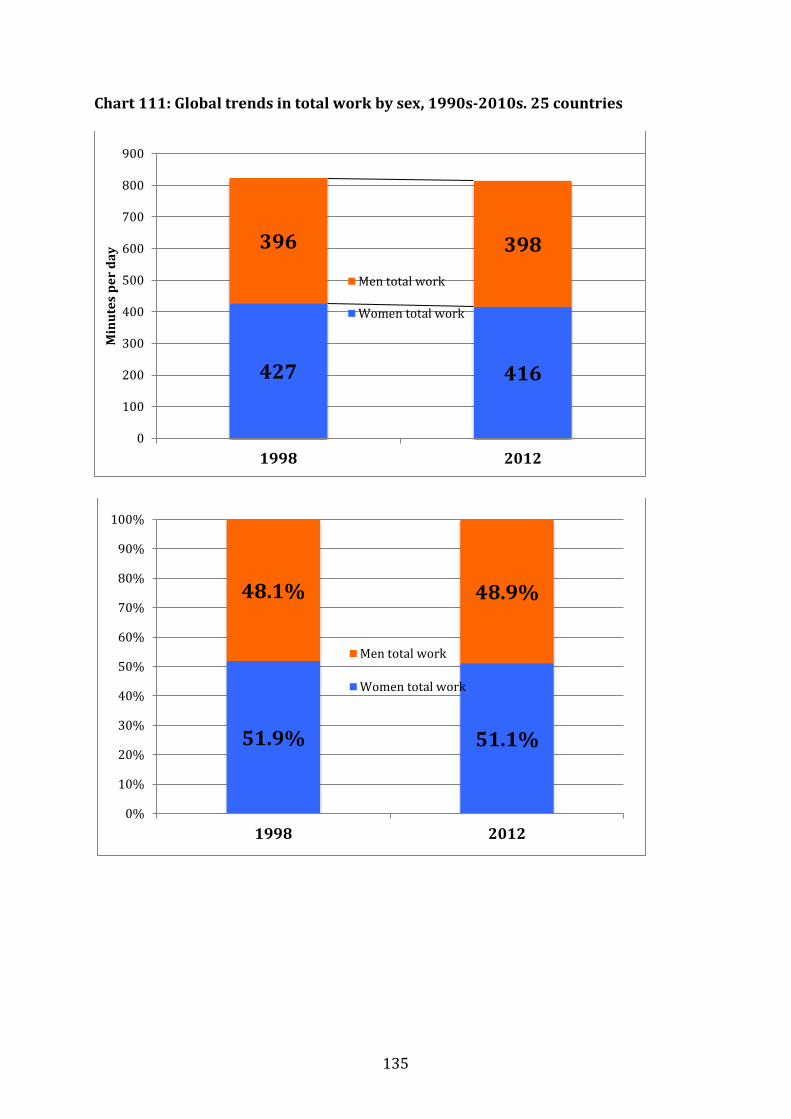
135
Chart 111: Global trends in total work by sex, 1990s-2010s. 25 countries
427 416
396 398
0
100
200
300
400
500
600
700
800
900
1998 2012
Min
ute
s p
er
da
y
Men total work
Women total work
51.9% 51.1%
48.1% 48.9%
0%
10%
20%
30%
40%
50%
60%
70%
80%
90%
100%
1998 2012
Men total work
Women total work

136
Conclusion One of the most striking conclusions of the attempted exercise is methodological: the lack of harmonisation in the most basic classifications used for categorising the population in time-use surveys. Efforts concentrate on the classification of time-use activities, which is of course a priority and on the recommended use of diaries rather than stylised questions, but this is not enough for allowing robust international comparisons. It is too often taken for granted that the generalisation of micro-data analyses makes it unnecessary to sensitise governments and statisticians about minimum standards in basic classifications. But this generalisation makes such an issue even more acute, because individual users may generate their own classifications and make international comparisons even more difficult. However worldwide comparisons cannot be done through micro-data analyses and the present exercise show that efforts in harmonisation would need to be strengthened. The major issue with national reports of time-use surveys (and this is also true for other types of surveys) is that the analysts in charge of these reports are not aware or have not been sensitised enough to understand that gender is not a variable like others (such as educational level, or activity status). All variables should be cross-classified by sex and gender should not be kept in a stand-alone chapter. It is amazing to note that among the number of time-use surveys collated for this work, only a few of them have produced Tables on activity and employment status disaggregated by sex, whereas this is a major dimension to understand the constraints women face on the labour market. Notwithstanding these difficulties and obstacles, the present work is an attempt to demonstrate the magnitude of unpaid work across the various regions and sub-regions of the world and of the share incumbent on women. Although more puzzling, the more detailed analyses by urban-rural location, age groups, educational levels, activity and employment status, income groups, marital status, and number of children clearly show the challenges that women face in their access to the labour market: their double burden is hardly alleviated by their male counterparts. In this respect, trends must be assessed that could highlight whether, over the past two decades, all the efforts towards raising awareness about the obstacle that unpaid care work represents for women’s participation to the economy and society have been successful. This report is a tentative contribution to this aim.
137
References of time use surveys
AFRICA Northern Africa Algeria Office National des Statistiques (2013), Enquête Nationale Emploi du Temps ENET 2012, Alger, 90p. Morocco Royaume du Maroc, Haut Commissariat au Plan (2014), Le Budget temps ou l’Enquête Nationale sur l’Emploi du Temps au Maroc 2011-12, Principaux résultats, Rabat, 44p. Royaume du Maroc, Haut Commissariat au Plan (2014), Le Budget temps ou l’Enquête Nationale sur l’Emploi du Temps au Maroc 2011-12, Presentation des premiers resultats par Monsieur Ahmed LAHLIMI ALAMI, Haut-Commissaire au Plan, Rabat, 10p. Royaume du Maroc, Haut Commissariat au Plan (2016), La Femme marocaine en chiffres. Tendances d’évolution des caractéristiques démographiques et socioprofessionnelles 2016, Rabat. Tunisia République Tunisienne, Ministère des Affaires de la Femme (2011), Budget temps des femmes et des hommes en Tunisie, 2005-06, Tunis, 189p.
Sub-Saharan Africa Benin INSAE/PNUD (1998), Enquête emploi du temps au Bénin, Méthodologie et résultats, Cotonou, 32p. + 156 p. annexes. INSAE (2017), Enquête Modulaire Intégrée sur les Conditions de Vie des Ménages 2ème edition (EMICoV-2015), Rapport d’analyse du volet emploi du temps, INSAE-GIZ. Cameroon INS (2017), Enquête sur l’emploi du temps au Cameroun en 2014, Rapport d’analyse, Yaoundé.
138
Cabo Verde Instituto Nacional de Estatística (2014), Inquérito Multi-objectivo Contínuo, Relatório do módulo uso do tempo e trabalho não remunerado em Cabo Verde (2012), Praia, 110p. Ethiopia Central Statistical Agency (2014), How Women and Men Spend Their Time, Ethiopian Time Use Survey 2013, Main Report, Addis Ababa, 104p. Ghana Ghana Statistical Service (2012), How Ghanaian women and men spend their time, Ghana Time-Use Survey 2009, Main Report, Accra, GSS-UNECA, 121p. Madagascar INSTAT (2001), EPM 2001- Module Emploi du Temps, Antananarivo, INSTAT-DSM/PNUD-MAG/97/007. Mali INSTAT (2009), Rapport de l’enquête malienne sur l’utilisation du temps (EMUT 2008), Bamako, 54p. Mauritius Republic of Mauritius, Central Statistics Office (2004), Continuous Multi-Purpose Household Survey 2003, Main results of the time-use study, 14p. South Africa Statistics South Africa (2001), How South African Women and Men spend their time, A survey of time use, Pretoria, 118p. Statistics South Africa (2013), A survey of time use 2010, Pretoria, 67p.+43p. Tanzania, United Republic of Fontana Marzia and Luisa Natali (2008), Gendered Patterns of Time Use in Tanzania: Public Investment in Infrastructure Can Help, Paper prepared for the IFPRI Project on ‘Evaluating the Long-Term Impact of Gender-focussed Policy Interventions’, December 2008, 53p.
United Republic of Tanzania, National Bureau of Statistics, (2007), Analytical Report for Integrated Labour Force Survey ILFS 2006, Dar es Salam, 124p. United Republic of Tanzania, National Bureau of Statistics, (2015), Analytical Report for Integrated Labour Force Survey 2014, Tanzania mainland, Dar es Salam, 152p.
139
AMERICAS Latin America Argentina Esquivel, Valeria (2009), Uso del tiempo en la Ciudad de Buenos Aires, Los Polvorines : Univ. Nacional de General Sarmiento, 126 p. Brazil IBGE (2014), First Results of the Brazilian Pilot Time Use Survey 2009, Presented at the 5th Forum on gender Statistics, Aguascalientes, Mexico 3-5 November 2014, 29p. Chile INE (2016), Encuesta Nacional Sobre Uso del Tiempo, Documento de Principales Resultados ENUT 2015, Santiago, 69p. Colombia DANE (2015), Investigas, Siete estudios realizados a partir de la encuest nacional de uso del tiempo, Colombia 2012-2013, DANE (2014), Medición de la Economía del Cuidado, Bogota, 32p. DANE (2013), Encuesta nacional de uso del tiempo (ENUT), Año 2012-2013 Datos definitivos, Diciembre 5 de 2013, Boletin de Prensa, Bogota, 15p.
Data available at : http://www.dane.gov.co/index.php/estadisticas-sociales/encuesta-nacional-del-uso-del-tiempo-enut Costa Rica Comisión Técnica Interinstitucional de Contabilización del Trabajo Femenino (2008), ¿2 + 2 = 6? El trabajo que hacen mujeres y hombres en Costa Rica no se cuenta igual. Principales Resultados del Módulo de Uso del Tiempo 2004, San José, 115p.
Cuba
Oficina Nacional de Estadísticas (2002), Encuesta sobre el uso del tiempo, La Habana, 106p.
Ecuador INEC (2014), Encuesta de Uso del Tiempo, Quito, 37p. INEC (2013), Metodologia de la Encuesta Especefica de Uso del Tiempo 2013, Quito, 53p.

140
INEC (2013), Plan de tabulados EUT, available at : http://www.ecuadorencifras.gob.ec/uso-del-tiempo-2/ El Salvador Dirección General de Estadística y Censos (2012), Principales Resultados de Encuesta del Uso del Tiempo, El Salvador, 76p.
Mexico INEGI (2010), Encuesta Nacional sobre el Uso del Tiempo ENUT 2009, Metodología y tabulados básicos, Aguascalientes, 264p. INEGI (2010), Clasificación mexicana de actividades de uso del tiempo CMAUT, Aguascalientes, 151p. INEGI (2005), Encuesta Nacional sobre el Uso del Tiempo ENUT 2002, Tabulados básicos definitivos, Aguascalientes, 71p. Tables available at : http://www3.inegi.org.mx/sistemas/tabuladosbasicos/tabgeneral.aspx?s=est&c=27602 Panama INEC (2013), Informe Sobre La Planificación Y Ejecución De La Encuesta De Uso Del Tiempo, 45p.
INEC (2013), Encuesta De Uso Del Tiempo, Commentarios, 16p.
INEC (2013), Encuesta De Uso Del Tiempo, Sintesis metodologica y indicadores generados, 40p.
Tables available at :
http://www.contraloria.gob.pa/INEC/Publicaciones/Publicaciones.aspx?ID_SUBCATEGORIA=63&ID_PUBLICACION=515&ID_IDIOMA=1&ID_CATEGORIA=5
Paraguay Direccion General de Estadistica, Encuestas y Censos (2017), Encuesta sobre actividades remuneradas y no remuneradas, EUT 2016, Fernando de la Mora 98p. Peru INEI (2011), Encuesta Nacional De Uso Del Tiempo 2010, Principales Resultados, Lima, 242p.

141
Uruguay INE (2014), Uso Del Tiempo Y TrabajoNo Remunerado En Uruguay 2013, 6p.
INE (2008), Uso del tiempo y trabajo no remunerado en el Uruguay, Módulo de la Encuesta Continua de Hogares, Septiembre 2007, Montevideo, 53p.
Northern America Canada Statistics Canada (2011), General Social Survey – 2010, Overview of theTime Use of Canadians, Ottawa, 31p.
http://www23.statcan.gc.ca/imdb/p2SV.pl?Function=getSurvey&SurvId=62269&InstaId=56441#a2
United States Bureau of Labor Statistics (2016), American time use survey - 2015 results, News Release, various years, 24p. www.bls.gov/tus
Bureau of Labor Statistics and US Census Bureau (2014), American time use survey user’s guide, 113p.
142
ARAB STATES Iraq Central Organization for Statistics and Information Technology (COSIT) of Iraq, Kurdistan Region Statistics Organization (KRSO), and World Bank (2008), Iraq Household Socio-Economic Survey IHSES 2007, COSIT, Baghdad, 986p. Volume I: Objectives, Methodology, and Highlights. Volume II: Data Tables. Volume III: Annexes. UNESCWA and Central Organization for Statistics and Information Technology (COSIT) (2010), Time use in gender statistics in Iraq, (in Arabic), Amman, 71p. http://www.escwa.un.org/divisions/projects/tus/main.asp?menuNum=5 Occupied Palestinian Territory Palestinian Bureau of Statistics (2014), Main Findings of Time Use Survey 2012/13, Ramallah, 51p. Palestinian Bureau of Statistics (2000), Time Use in the Palestinian Territory: Main Findings of Survey 1999-2000, Ramallah, 145p. Oman Sultanate of Oman (2011), Time use survey for the period 20/05/2007-19/05/2008, 15p. Presented at the Arab Time Use statistics workshop in Amman 25-28 April 2011.

143
ASIA AND THE PACIFIC Eastern Asia
China
Liu Wei (2010a), Unpaid Housework, Women Burden More, Global Forum on Gender Statistics, Manila, Philippines, 11-13 October 2010, 15p.
Liu Wei (2010b), 2008 Time use survey in China, International Workshop on Social Statistics, Beijing, China, 22-24 November 2010, 13p.
National Bureau of Statistics (2009), Time Use Patterns in China: Abstract of the 2008 Time Use Survey, China Statistics Press. Xiao-Yuan Dong and Xinli An (2012), Gender Patterns and Value of Unpaid Work, Findings from China’s First Large-Scale Time Use Survey, UNRISD Research Paper, Geneva, 22p. Japan http://www.stat.go.jp/english/data/shakai/index.htm http://www.stat.go.jp/english/data/shakai/2011/h23kekka.htm
Korea, Republic of
Jonghee Choi (2009), New approaches of the 2009 Korean Time Use Survey, Paper presented at the IATUR Conference, 31p.
Tables for TUS 2001, 2004 and 2009 available at : http://kosis.kr/statHtml/statHtml.do?orgId=101&tblId=DT_1TM1011Z&language=en&conn_path=I3 Mongolia
National Statistical Office of Mongolia (2009), Report of the time-use survey 2007, NSO, UNDP, Ulanbaatar, 96p.
National Statistical Office (2014), Time use survey Mongolia, presented at the « Time Use Survey data analysis workshop » 11-15 October 2014, Bangkok, 12p.

144
South-Eastern Asia and the Pacific Australia http://www.abs.gov.au/AUSSTATS/[email protected]/ViewContent?readform&view=ProductsbyTopic&Action=Expand&Num=5.6.16 Cambodia Hang Lina (2013), 2004 Time use survey in Cambodia, International seminar on gender statistics, Incheon, Republic of Korea, 12-14 November 2013, 19p.
Uy Bossadine (2005), Time Use Profile of Cambodia 2004, Workshop of final statistical analyses of CSES 2003-04, Phnom Penh Hotel, 16-17 June 2005, 14p.
New Zealand Statistics New Zealand (2011), Time Use Survey 2009/10, Wellington, 47p. Tables available at: http://www.stats.govt.nz/browse_for_stats/people_and_communities/time_use.aspx Thailand
National Statistical Office (2014), The time use survey in Thailand, presented at the « Time Use Survey data analysis workshop » 11-15 October 2014, Bangkok, 25p.
Tables for TUS 2001, 2004, 2009, 2015 available at : http://service.nso.go.th/nso/nso_center/project/search_center/23project-en.htm General references OECD (2012), “How do People in the Asia/Pacific Region Spend their Time?”, in Society at a Glance: Asia/Pacific 2011, OECD Publishing, Paris. http://dx.doi.org/10.1787/9789264106154-4-en
OECD Gender data portal (2014), Time use across the world, available at : www.oecd.org/gender/data/OECD_1564_TUSupdateportal.xls
145
Southern Asia
India
Gupta Pratima (2007), Time Use Survey in India, 15p.
Ministry Of Statistics and Programme Implementation (MOSPI)(2000), Report of the India Time use Survey 1998, New Delhi, 118p.
Narasimhan R. L. and R. N. Pandey (1999), Some main results of the pilot time use survey in India and their policy implications, New Delhi, 18p. Pandey R. N. (1999), Operational Issues in Conducting the Pilot Time Use Survey in India, Delhi, 7p.
Rajivan Anuradha Khati (1999), Policy Implication for Gender Equity : The India Time Use Survey 1998-1999, International Seminar on Time-use surveys 7-10 December 1999, Ahmedabad, 31p.
Iran, Islamic Republic of Statistical Centre of Iran (2012a), Summary findings of time use survey in urban areas, Autumn 2008 (23 September 2008-22 December 2008), 19p. Statistical Centre of Iran (2012b), Summary findings of time use survey in urban areas, Summer 2009 (22 June-22 September), 20p. Statistical Centre of Iran (2012c), Summary findings of time use survey in urban areas, Winter 2009 (22 December 2008-20 March 2009), 20p.
Pakistan
Federal Bureau of Statistics (2009), Time use Survey 2007, Islamabad, 180p.
146
EUROPE AND CENTRAL ASIA
Northern, Southern and Western Europe Several countries offer the opportunity for creating tables on their website (or give access to a list of downloadable tables). Below are the links for this service, as well as some other important links. CREATE TABLES Belgium : http://www.time-use.be/tostat/config.php?lang=fr&easy Estonia : http://www.stat.ee/66481 Finland : http://193.166.171.75/Dialog/varval.asp?ma=010_akay_tau_101&ti=Time+Use+%2826+categories%29+in+autumn+1979%2C+1987+1999+and+2009&path=../Database/StatFin/eli/akay/&lang=1&multilang=en Netherlands : http://statline.cbs.nl/Statweb/publication/?DM=SLEN&PA=37881eng&D1=0-3,28-29,31,35,37-38,69-70,72,76,78-79&D2=0&D3=a&D4=a&LA=EN&HDR=T&STB=G1,G2,G3&VW=T Norway : https://www.ssb.no/statistikkbanken/selecttable/hovedtabellHjem.asp?KortNavnWeb=tidsbruk&CMSSubjectArea=kultur-og-fritid&PLanguage=1&checked=true Portugal : http://www.ine.pt/xportal/xmain?xpid=INE&xpgid=ine_publicacoes&PUBLICACOESpub_boui=138463&PUBLICACOESmodo=2&xlang=en Spain : http://www.ine.es/jaxi/menu.do?type=pcaxis&path=%2Ft25/e447&file=inebase&L=1 Sweden : http://www.scb.se/en_/Finding-statistics/Publishing-calendar/Show-detailed-information/?publobjid=18561+
147
Albania Institute of Statistics (2011), Albania Time Use Survey 2010-2011, Tirana, 144p.
Austria Statistik Austria (2009), Zeitverwendung 2008/09, Ein Überblick über geschlechtsspezifische Unterschiede, Wien, 177p.
Belgium Glorieux I. Minnen J. and van Tienoven T.P. (2008), Une semaine en Belgique. Résultats de l’enquête 2005 sur l’emploi du temps en Belgique EET’05, Vrije Universiteit Brussels, 13p. Institut pour l’Egalité des Femmes et des Hommes (2009), Genre et Emploi du temps, Différences et évolution dans l’emploi du temps des femmes et des hommes belges (2005, 1999 et 1966), Bruxelles, 101p. Estonia CREATE TABLES: http://pub.stat.ee/px-web.2001/Dialog/varval.asp?ma=Ti011&ti=AVERAGE+TIME+USE+IN+A+DAY+BY+PRIMARY+ACTIVITY+AND+SEX&path=../I_Databas/Social_life/17Time_use/&lang=1 Finland Tables available at: http://pxnet2.stat.fi/PXWeb/pxweb/en/StatFin/StatFin__eli__akay/ France Ricroch Layla et Benoît Roumier (2011), Depuis 11 ans, moins de tâches ménagères, plus d’Internet, INSEE Première, N°1377, 4p.
Tables available at: https://www.insee.fr/fr/statistiques/2118047?sommaire=2118074
Dumontier F. et Pan Ké Shon J-L. (2000), Enquête emploi du temps 1998-99, Description des activités quotidiennes, INSEE Résultats, Paris, 324p. Germany Destatis (2015), Zeitverwendungserhebung Aktivitäten in Stunden und Minuten für ausgewählte Personengruppen 2012/2013, Statistisches Bundesamt, Wiesbaden, 162p. Destatis (2016), Wie die Zeit vergeht. Analysen zur Zeitverwendung in Deutschland, Beiträge zur Ergebniskonferenz der Zeitverwendungserhebung 2012/2013 am 5/6 Oktober 2016 in Wiesbaden, 400p.

148
Tables available at: https://www.destatis.de/DE/ZahlenFakten/GesellschaftStaat/EinkommenKonsumLebensbedingungen/Zeitverwendung/Zeitverwendung.html#Tabellen Greece ELSTAT (2014), Time Use Survey 2013-14, Press Release, Athens, 15p. Ireland Mc Ginnity Frances, Russell Helen, Williams James and Blackwell Sylvia (2005), Time Use in Ireland 2005, Survey Report, Dublin, 68p.
Italy
Istat (2007), L'uso del tempo, Indagine multiscopo sulle famiglie "Uso del tempo"Anni 2002-2003, 264p.
Tables and survey 2008-09 available at : http://www.istat.it/it/archivio/52079 Tables and survey 2013 at: http://dati.istat.it/?lang=en Select topic “Communication, Culture, Trips ad Time-use” Macedonia, the Former Yugoslav Republic of Државен завод за статистика - State Statistical Office (2015), АНКЕТА за користење на времето, 2014/2015 година = Time use survey, 2014/2015. – Скопје, Статистички преглед / Државен завод за статистика. Население и социјални статистики – Skopje, Statistical review / State statistical office, Population and social statistics. 118 стр, 118p. Netherlands
Cloïn Mariëlle (2012), A day with the Dutch, Time use in the Netherlands and fifteen other countries, The Netherlands Institute for Social Research/SCP, The Hague, 57p.
Norway
https://www.ssb.no/statistikkbanken/selecttable/hovedtabellHjem.asp?KortNavnWeb=tidsbruk&CMSSubjectArea=kultur-og-fritid&PLanguage=1&checked=true Portugal
Instituto National de Estatistica (2001), Inquérito à Ocupação do Tempo, Principais Resultados 1999, Lisboa, 175p.
Serbia Statistical Office of the Republic of Serbia (2012), Time Use in the Republic of Serbia 2010-11, Belgrad, 86p.

149
Spain
Instituto Nacional de Estadistica (2004), Encuesta de Empleo del Tiempo 2002-2003, Tomo I.Resultados Nacionales, Madrid, 378p.
Sweden
Statistics Sweden (2012), Nu för tiden, En undersökning om svenska folkets tidsanvändning år 2010/11, (Swedish Time Use Survey 2010/11), Living Conditions Report 123, 294p.
Statistics Sweden (2003), Tid förvardagsliv, Kvinnors och mäns tidsanvändning 1990/91 och 2000/01 (Time for everyday life,Women s and men s time use 1990/91 and 2000/01), Living Conditions, Report no 99, 223p.
United Kingdom
Lader Deborah, Short Sandra and Gershuny Jonathan (2006), The Time Use Survey 2000, How we spend our time, Office for National Statistics, London, 82p.
Centre for Time Use Research (2016),- United Kingdom Time Use Survey, 2014-2015, UK Data Archive Study Number 8128, University of Oxford, Oxford, 22p. www.timeuse.org Sarah Morris, Alun Humphrey, Pablo Cabrera Alvarez, Olivia D’Lima (2016), The UK Time Diary Study 2014 – 2015, Technical report, UK Data Archive Study Number 8128 - United Kingdom Time Use Survey, 2014-2015, University of Oxford, NatCen Social Research, London, 226p.
General EU, EUROSTAT (2004), How Europeans spend their time, Everyday life of women and men 1998-2002, Luxemburg, 132p.
150
Eastern Europe Belarus National Statistical Committee (2016) How we use our time, Minsk, 15p. Bulgaria National Statistical Institute (2011), 2009-2010 Time Use Survey, Basic Results, Sofia, 13p. Tables available at: http://www.nsi.bg/census2011/pageen2.php?p2=167&sp2=168 Moldova, Republic of Biroul Naţional de Statistică (2013), Utilizarea timpului în Republica Moldova, Sinteză, Chişinău, 2013, 43p. Statistica Moldovei (2013), Utilizarea timpului în Republica Moldova, Principalele rezultate ale cercetării „Utilizarea timpului” http://www.statistica.md/newsview.php?l=ro&idc=168&id=4055 Romania National Institute of Statistics (2013), Time use in Romania, Press Release No. 307 of December 20, 2013, Bucharest, 7p.
151
Central and Western Asia Armenia National Statistical Service of the Republic of Armenia (2005), Armenia time use pilot survey, 2004 July 1-31, Yerevan, 14p.
National Statistical Service of the Republic of Armenia (2009), Report on Time Use Sample Survey in the Republic of Armenia, 2008 October 1-31, Yerevan, 36p.
Azerbaijan
State Statistical Committee (2017), Women and Men in Azerbaijan, Statistical Yearbook 2016, Baku, 191p.
State Statistical Committee (2016?), Main Results of Time use survey of Azerbaijan, 2007-08, Statistical Bulletin, Baku, 62p.
Kazakhstan
Committee of Statistics of the Ministry of National Economy (sd), The experience of Kazakhstan in conducting time-use surveys,
Kyrgyzstan
National Statistics Committee (2014), Results of the time use survey in Kyrgyzstan, 2010, presented at the « Time Use Survey data analysis workshop » 11-15 October 2014, Bangkok, 5p.
Turkey Turkstat (2007), Results of the Time Use Survey 2006, Press Release N°119, July 25, 2007, Ankara, 3p. Tables available on http://www.turkstat.gov.tr/PreTablo.do?alt_id=1068 Turkstat (2016), Time Use Survey 2014-15, Press Release N°18627, December 4, 2015, Ankara, 2p. Tables available on http://www.turkstat.gov.tr/PreTablo.do?alt_id=1009

152
Other multinational websites Time use and lifestyle : http://www.timeuse.ase.ro/english/despre_proiect.php.htm HETUS : https://www.h2.scb.se/tus/tus/Statistics.html OECD http://www.oecd.org/social/family/database.htm OECD Gender data portal http://www.oecd.org/gender Centre for Time Use Research, University of Oxford http://www.timeuse.org/information/access-data
UN statistics division http://www.unstats.un.org/unsd/demographic/sconcerns/tuse/default.aspx

153
Table A 1: Overview of TUS main characteristics across regions and countries
AFRICA
Year Period Type of survey Minimum
age Sample size (individuals)
Type of sample
Survey instrument
Mode of data collection
Classification used
Northern Africa
Algeria 2012 2 months Stand alone 12+ 22,138 All eligible One diary Interview HETUS
Morocco 2011-
12 Year Stand alone 7+
9,200 households
Random selection One diary Mixed HETUS
Tunisia 2005-
06 Year
Stand alone, sub sample of household
survey 15+ 11,594 All eligible Two diaries Mixed HETUS
Sub-Saharan Africa
Benin 1998 2015
2 months 1 month
Module of household survey
6-65 6+
12,604 4,920hh, 13,026
individuals All eligible One diary Interview
Pre-listing (63 activities)
(84 activities)
Cameroon 2014 1 month Module of household
survey 10+
4,988 households
Household head, spouse, random
men/women among others aged
10-14 and 15+
One diary Interview ICATUS
Cabo Verde 2012 Module of household
survey 10+ Interview Ad-hoc detailed
Ethiopia 2013 One month Stand alone 10+ 52,262 All eligible One diary Interview ICATUS Ghana 2009 2 months Stand alone 10+ 9,297 All eligible One diary Interview ICATUS
Madagascar 2001 2 months Stand alone, sub
sample of household survey
6-65 7,749 All eligible One diary Interview Pre-listing (77 activities)
Mali 2008 2 months Stand alone 6-65 2,249 Random selection One diary Interview Pre-listing (63 activities)
Mauritius 2003 2 months Module of household
survey 10+
6,480 households
All eligible One diary Interview ICATUS
South Africa 2000 2010
3 rounds 4th quarter
Stand alone 10+ 14,553 30,897
Random selection One diary Interview ICATUS
Tanzania, United Republic of
2006 2014
4 quarters Module of household
survey 5+ 10,553 All eligible One diary Interview ICATUS

154
AMERICAS
Year Period Type of survey Mini-
mum age Sample size
(individuals) Type of sample
Survey instrument
Mode of data collection
Classification used
Latin America and the Caribbean
Argentina (Buenos Aires)
2005 1 month Module of
household survey 15-74 1,408 individuals All eligible Diary Interview ICATUS
Chile 2015 3 months 12+ 10,502
households All eligible
Weekday/weekend day on one
week Interview CAUTAL
Colombia 2012-13 Year Stand alone 10+ 148,492 All eligible Yesterday Interview Ad hoc detailed
Costa Rica 2004 One
month Module of
household survey 12+ 32,437 All eligible Yesterday Interview Ad hoc detailed
Cuba 2001
Ecuador 2012 2 months Stand alone 12+ 20,767
households All eligible Weekday/week
end day Interview CAUTAL
El Salvador 2010 Year Module of
household survey 10+ 3,305
households All eligible Interview Ad hoc detailed
Mexico 2002 2009 2014
One month
2 months 4th
quarter
Module of hh survey.
Stand alone 12+
5,445 hh 17,000 hh
18,996 households
All eligible Weekday/weekend day
Interview Ad hoc detailed
Panama 2011 One
month Stand alone 15+ 6,907 All eligible Weekday/week
end day Interview Ad hoc detailed
Paraguay 2016 One
quarter 14+ 4,272 hh
One able to respond for all
eligible Past week
Interview of one able to
respond for all CAUTAL
Peru 2010 Stand alone 12+ 4,580 hh All eligible Weekday/weekend day
Interview Ad hoc detailed
Uruguay 2007 2013
One quarter (May-
August)
Module of household survey
14+ 3,391
households, 7,447 individuals
All eligible Weekday/week
end day Interview Ad hoc detailed

155
Year Period Type of survey Mini-
mum age Sample size
(individuals) Type of sample
Survey instrument
Mode of data collection
Classification used
Northern America
Canada 1992 1998 2005 2010
2015 Year
Module of household survey
15+ 25,000 One diary Computer assisted
telephone interview
United States
2003 2004 2005 2006 2007 2008 2009 2010 2011 2012 2013 2014 2015 2016
Year Stand alone 15+
3,375 households per month in 2003 2,190 households per month since
2004
Random selection (one
person) One diary
Computer assisted
telephone interview
ATUS
ARAB STATES
Year Period Type of survey Minimum
age Sample size (individuals)
Type of sample
Survey instrument
Mode of data collection
Classification used
Arab States
Iraq 2007 2 months Module of household
survey 10+
6,048 households
All eligible One diary Interview Pre-listing (27
activities)
Oman 2007-08 Year Stand alone, sub
sample of household survey
15+ 9,063 One diary Pre-listing (23
activities)
Occupied Palestinian Territory
1999-2000 2012-13
Year Stand alone 10+ 8,038 4,605
Random selection One diary Interview ICATUS
Qatar 2012-13 Year 15+ 16,754 One diary Pre-listing
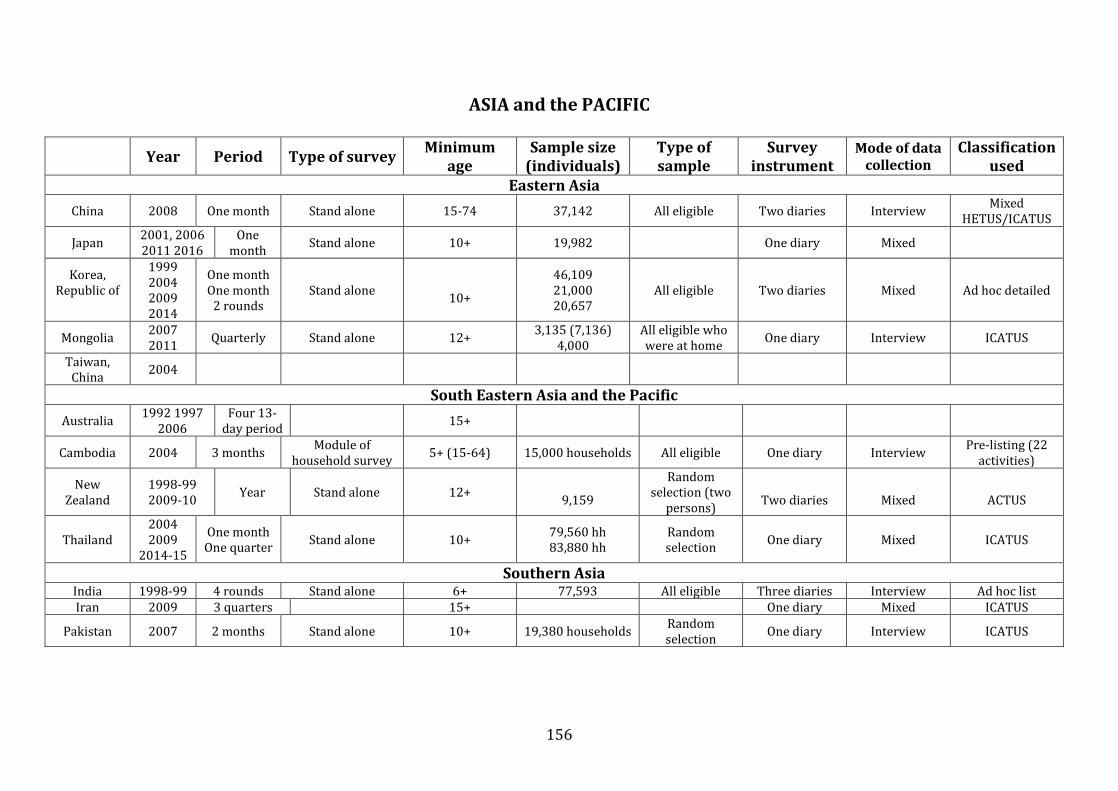
156
ASIA and the PACIFIC
Year Period Type of survey Minimum
age Sample size
(individuals) Type of sample
Survey instrument
Mode of data collection
Classification used
Eastern Asia
China 2008 One month Stand alone 15-74 37,142 All eligible Two diaries Interview Mixed HETUS/ICATUS
Japan 2001, 2006 2011 2016
One month
Stand alone 10+ 19,982 One diary Mixed
Korea, Republic of
1999 2004 2009 2014
One month One month
2 rounds Stand alone
10+
46,109 21,000 20,657
All eligible Two diaries Mixed Ad hoc detailed
Mongolia 2007 2011
Quarterly Stand alone 12+ 3,135 (7,136)
4,000 All eligible who were at home One diary Interview ICATUS
Taiwan, China
2004
South Eastern Asia and the Pacific
Australia 1992 1997
2006 Four 13-
day period 15+
Cambodia 2004 3 months Module of
household survey 5+ (15-64) 15,000 households All eligible One diary Interview Pre-listing (22
activities)
New Zealand
1998-99 2009-10
Year Stand alone 12+
9,159
Random selection (two
persons)
Two diaries
Mixed
ACTUS
Thailand 2004 2009
2014-15
One month One quarter
Stand alone 10+ 79,560 hh 83,880 hh
Random selection
One diary Mixed ICATUS
Southern Asia India 1998-99 4 rounds Stand alone 6+ 77,593 All eligible Three diaries Interview Ad hoc list Iran 2009 3 quarters 15+ One diary Mixed ICATUS
Pakistan 2007 2 months Stand alone 10+ 19,380 households Random selection
One diary Interview ICATUS

157
EUROPE and CENTRAL ASIA
Year Period Type of survey Minimum
age Sample size
(individuals) Type of sample
Survey instrument
Mode of data
collection
Classification used
Northern, Southern and Western Europe Albania 2010-11 Year Stand alone 10+ 10,333 diaries All eligible Two diaries HETUS Austria 2008-09 Year 10+ 8,200 All eligible One diary Mixed HETUS
Belgium 1999 2005 2013
Year Module of
household survey 12+
8,382 6,400
All eligible Two diaries Mixed Ad hoc detailed
Denmark 2001 All eligible Mixed Ad hoc detailed
Estonia 1999-2000
2009-10 Year
Stand alone 10+ 7,225 All eligible Two diaries Mixed HETUS
Finland
1979 1987 1999 2009
Year Stand alone 10+ 3,795 All eligible Two diaries Mixed Ad hoc detailed
France
1974 1986 1999 2010
Year Stand alone
15+ 11+ (15+)
15,441 17,383
All eligible Two diaries Mixed Ad hoc detailed
Germany 2001-02
2012 Year Stand alone 10+
12,655 5,000 households, 11,000 individuals
All eligible Three diaries Mixed Ad hoc detailed
Greece 2013-14 Year Stand alone 10+ All eligible Two diaries Mixed HETUS Ireland 2005 Stand alone 18+ 1,023 All eligible Two diaries Mixed Ad hoc detailed
Italy
1988-89 2002-03 2008-09 2013-14
Year Stand alone 3+ (15+)
50,968 All eligible One diary Mixed Ad hoc detailed
Latvia 2003 8 months Stand alone 10+ (20-74) 3,804 diaries All eligible Two diaries Mixed HETUS Lithuania 2003 Year Stand alone 10+ (20-74) 4,768 diaries All eligible Two diaries Mixed HETUS
Macedonia, the Former
Yugoslav Republic of
2014-15 Year Stand alone 10+ 2,080 households All eligible All eligible HETUS
Netherlands 2005-06 12+ All eligible Mixed Ad hoc detailed

158
Year Period Type of survey Minimum
age Sample size
(individuals) Type of sample
Survey instrument
Mode of data
collection
Classification used
Norway
1970 1980 1990 2000 2010
Year Stand alone
16-74 16-74 16-79 9-79 9-79
4,000 All eligible Diaries for two
consecutive days
Mixed Ad hoc detailed
Portugal 1999 2 months Stand alone 15+ 10,013 All eligible One diary Interview Ad hoc detailed Serbia 2010-11 Year Stand alone 15+ 2,340 households All eligible Two diaries Mixed HETUS
Slovenia 2000-01 Year Stand alone 10+ (20-74) 2,364 households All eligible Two diaries HETUS
Spain 2002-03 2009-10
Year Stand alone 10+
19,295 All eligible One diary Mixed HETUS
Sweden 2000-01 2010-11
Year Stand alone 20-84 7,955 diaries All eligible Two diaries Mixed Ad hoc detailed
United Kingdom
2000 2005 2015
Year 4 months over the
year Year
Stand alone Module of
household survey Stand alone
8+ 16+ 8+
21,000 diaries 5,000 diaries
9,388 individuals in 4,238
households provided 16,553
diary days
All eligible Random selection
All eligible
Two diaries Mixed
Interview Ad hoc detailed
Eastern Europe Belarus 2014-15 Year Stand alone 10+ 6,000 households Bulgaria 2009-10 Year Stand alone 10+ 5,503 All eligible Two diaries Mixed HETUS
Hungary 1999-2000
2009-10
Stand alone 15-74 15-84
HETUS
Moldova, Republic of
2011-12 Year Stand alone 10+ 10,642 households All eligible All eligible HETUS
Poland 2003-04 Stand alone 15-64 HETUS Romania 2011-12 Year Stand alone 10+ 18,720 households All eligible Two diaries Mixed HETUS
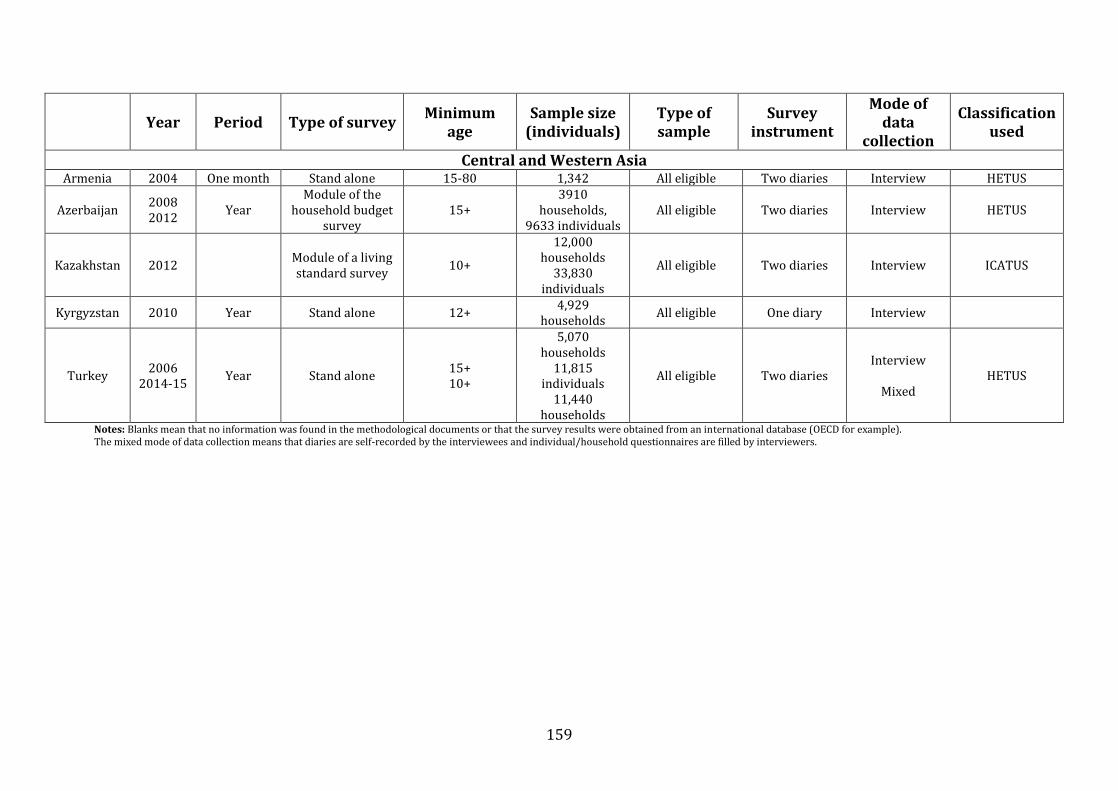
159
Year Period Type of survey Minimum
age Sample size
(individuals) Type of sample
Survey instrument
Mode of data
collection
Classification used
Central and Western Asia Armenia 2004 One month Stand alone 15-80 1,342 All eligible Two diaries Interview HETUS
Azerbaijan 2008 2012
Year Module of the
household budget survey
15+ 3910
households, 9633 individuals
All eligible Two diaries Interview HETUS
Kazakhstan 2012 Module of a living standard survey
10+
12,000 households
33,830 individuals
All eligible Two diaries Interview ICATUS
Kyrgyzstan 2010 Year Stand alone 12+ 4,929
households All eligible One diary Interview
Turkey 2006
2014-15 Year Stand alone 15+
10+
5,070 households
11,815 individuals
11,440 households
All eligible Two diaries Interview
Mixed
HETUS
Notes: Blanks mean that no information was found in the methodological documents or that the survey results were obtained from an international database (OECD for example). The mixed mode of data collection means that diaries are self-recorded by the interviewees and individual/household questionnaires are filled by interviewers.
ILO
The
Unp
aid
Care
Wor
k an
d th
e La
bour
Mar
ket.
An a
naly
sis
of ti
me
use
data
bas
ed o
n th
e la
test
Wor
ld C
ompi
latio
n of
Tim
e-us
e Su
rvey
s
Gender, Equality and Diversity & ILOAIDS BranchConditions of Work and Equality Department
International Labour Office (ILO)4, Route des MorillonsCH-1211 Geneva 22, Switzerlandtel. +41 22 799 [email protected]/ged


![British Columbia Labour Market Outlook 2010 - 2020 · Labour Market OutlookLabour Market Outlook British Columbia Labour Market Outlook: 2010-2020 [2] B.C. Labour Market Outlook,](https://img.dokumen.tips/doc/110x75/5e167e8e481eae63a43f8127/british-columbia-labour-market-outlook-2010-2020-labour-market-outlooklabour-market.jpg)


