Embed Size (px)
Citation preview
The (Un)known of Indian Economy
Dr Soumya Kanti GhoshGroup Chief Economic Adviser
State Bank of India
January 05, 2018

2State Bank of India
Macro Developments
3State Bank of India
GVA Accelerating…..Really???
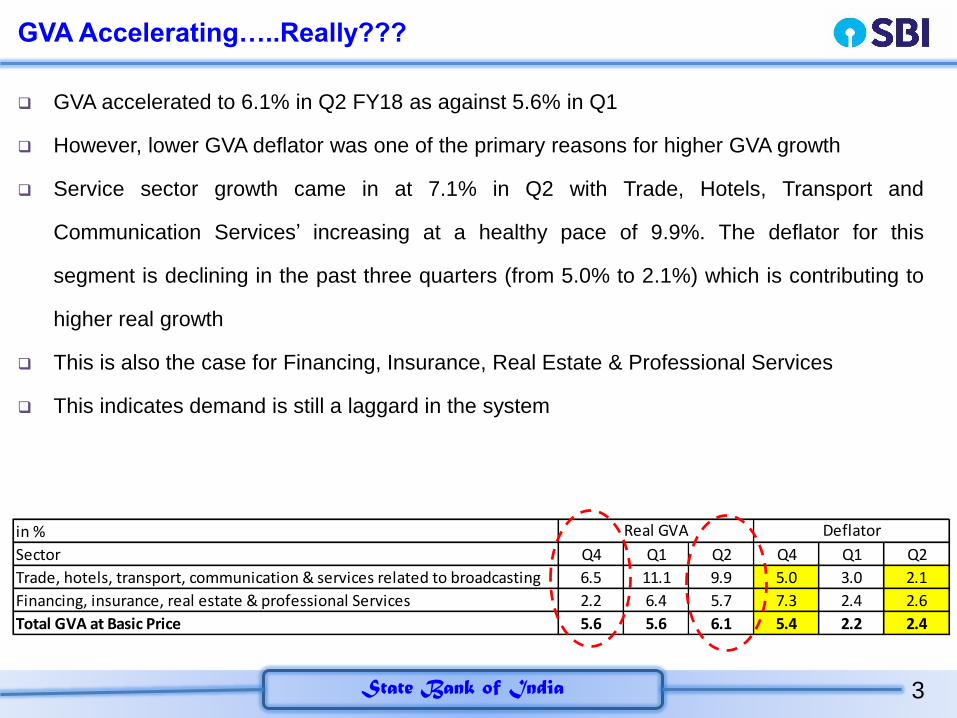
GVA accelerated to 6.1% in Q2 FY18 as against 5.6% in Q1
However, lower GVA deflator was one of the primary reasons for higher GVA growth
Service sector growth came in at 7.1% in Q2 with Trade, Hotels, Transport and
Communication Services’ increasing at a healthy pace of 9.9%. The deflator for this
segment is declining in the past three quarters (from 5.0% to 2.1%) which is contributing to
higher real growth
This is also the case for Financing, Insurance, Real Estate & Professional Services
This indicates demand is still a laggard in the system
in %
Sector Q4 Q1 Q2 Q4 Q1 Q2
Trade, hotels, transport, communication & services related to broadcasting 6.5 11.1 9.9 5.0 3.0 2.1
Financing, insurance, real estate & professional Services 2.2 6.4 5.7 7.3 2.4 2.6
Total GVA at Basic Price 5.6 5.6 6.1 5.4 2.2 2.4
Real GVA Deflator

4State Bank of India
Nominal GVA & Real Narrative
Real Core GVA (GVA ex agriculture & Public
administration, defence and Other Services)
which was declining in the entire FY17 is
showing upward trend in FY18 but this is
primarily due to decline in core GVA deflator
Nominal Core GVA not changed much and
remained in the range of 7.5%-9.5% since
Jun’16
5State Bank of India
Though GDP Growth Outlook for FY18 is modest…but…
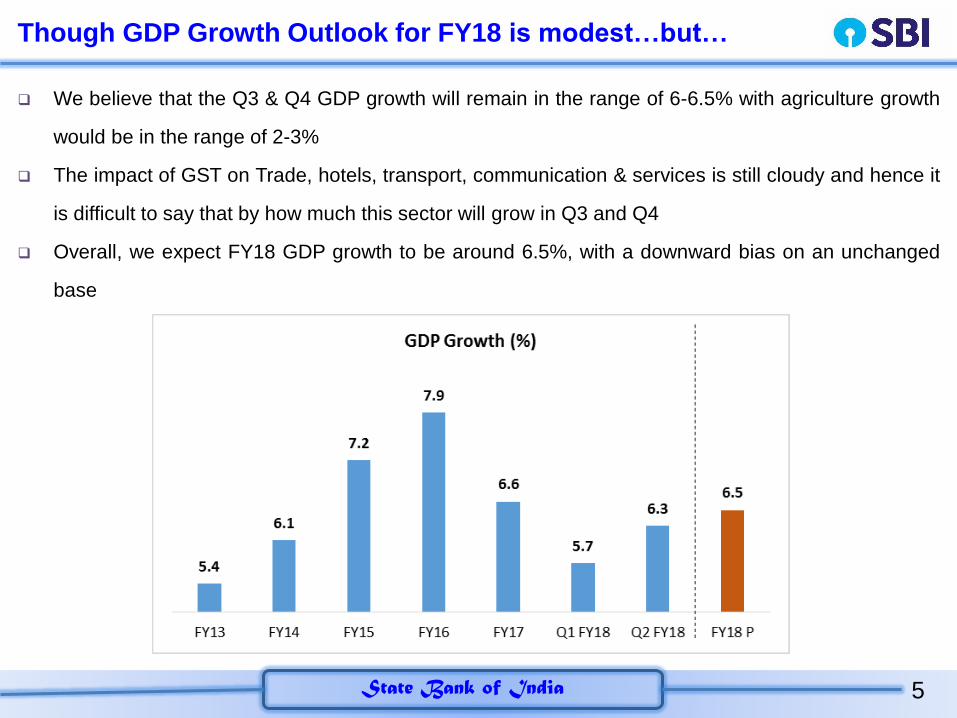
We believe that the Q3 & Q4 GDP growth will remain in the range of 6-6.5% with agriculture growth
would be in the range of 2-3%
The impact of GST on Trade, hotels, transport, communication & services is still cloudy and hence it
is difficult to say that by how much this sector will grow in Q3 and Q4
Overall, we expect FY18 GDP growth to be around 6.5%, with a downward bias on an unchanged
base

6State Bank of India
…Various Leading Indicators are in Green
Indicators Jan'17 Feb'17 Mar'17 Apr'17 May'17 Jun'17 Jul'17 Aug'17 Sep'17 Oct'17 Nov'17
Railway Freight 0.3 3.5 7.7 4.6 3.9 2.8 5.6 7.7 5.9 2.6 3.1
Commercial Vehicle Sales -2.4 5.7 6.7 -25.0 -9.3 -4.2 5.7 14.9 21.1 2.1 43.9
Cellular Mobile Subscribers 19.0 19.7 18.1 21.2 22.2 22.7 22.6 21.4 20.9 20.5 -
Foreign Exchange Earnings 18.0 15.6 15.4 27.8 20.9 22.6 4.9 10.9 19.1 18.6 16.7
Foreign Tourist Arrivals 16.4 12.7 11.8 25.0 19.5 22.5 7.4 11.0 18.9 18.1 14.4
Steel Output 11.2 8.6 11.0 9.0 3.9 6.0 9.2 2.1 3.7 8.4 16.7
Cement Output -13.3 -15.8 -6.8 -5.2 -1.4 -3.3 -2.0 0.7 0.1 -1.3 17.3
Core Sector 3.4 0.5 5.2 2.6 3.9 1.0 2.9 4.4 4.7 5.0 6.7
SBI Index (Yearly) 47.0 49.5 50.3 49.3 50.0 49.6 50.3 50.9 53.6 53.0 53.0
Source: SBI Research
Recovery in Economic Leading Indicators (% YoY)

7State Bank of India
Corruption and GDP Growth
In last two years, the number of punishment carried out by CVC though its own investigations has
increased significantly & the number of serious complaints out of total outside complaints received by
CVC is also declining
Empirical research suggests the direct link between corruption and GDP growth is difficult to assess
but it certainly have significant negative effects on investment (including FDI), competition,
entrepreneurship, government efficiency and human capital formation
Between 2011 and 2016, India, UK, Portugal and Italy have succeeded in reducing the corruption level by
improving their overall rank in corruption perception index and also achieved a positive GDP growth
Central Vigilance Commission Actions
Own Investigations Outside Complains
Year Prosecution PunishmentsYoY Gr%
YearComplaints
received
Of these considered
Serious
Of these considered Serious (%)
2008 138 2511 2008 10142 1147 11.31
2009 225 2204 -12.2 2009 14206 1714 12.07
2010 262 2720 23.4 2010 16260 945 5.81
2011 183 2312 -15.0 2011 16929 1023 6.04
2012 199 2507 8.4 2012 37039 913 2.46
2013 176 2680 6.9 2013 31432 1237 3.94
2014 133 2144 -20.0 2014 62362 1214 1.95
2015 132 3592 67.5 2015 29838 179 0.60
2016 154 3296 -8.2 2016 49847 86 0.17
Source: Central Vigilance commission
Changes in Corruption Rank and Economic Growth From 2011 to 2016
CountriesChange in Rank
(2016/2011)Change in GDP
(2016/2011)
Countries where Corruption
Decline/Growth increase
India -16 0.5
United Kingdom -6 0.3
Portugal -3 3.2
Italy -9 0.3
Countries where Corruption
increase/Growth decline
Singapore 2 -4.2
Hong Kong 3 -2.8
Mauritius 4 -0.4
Korea (South) 9 -0.9
Turkey 14 -8.2
Brazil 6 -7.6
China 4 -2.8
Source: SBI Research
8State Bank of India
Inflationary Pressure: Outlook still to remain modest
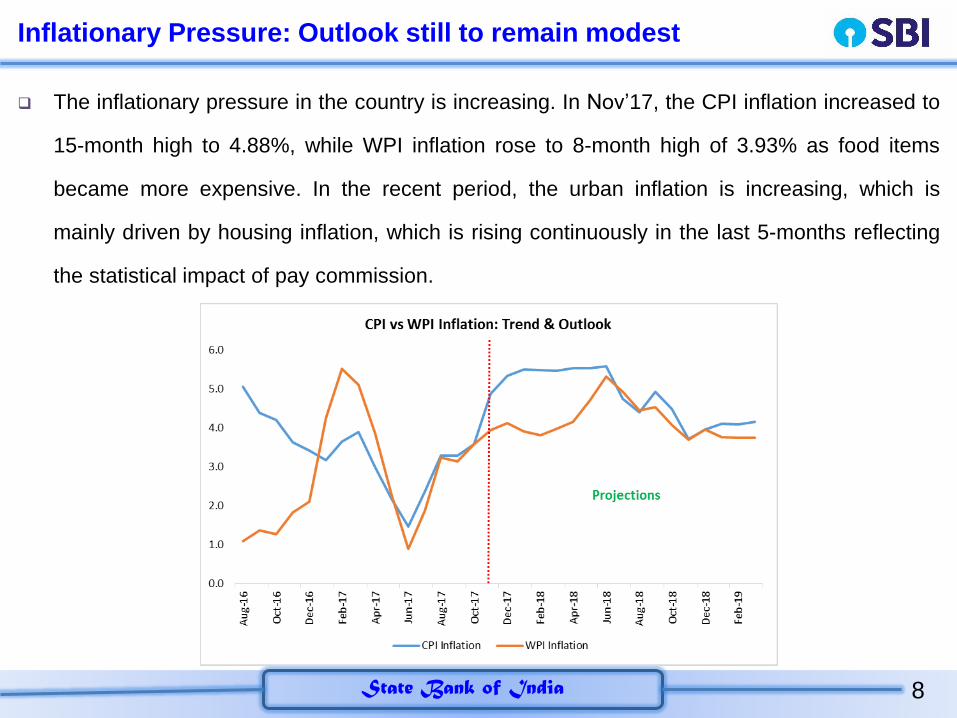
The inflationary pressure in the country is increasing. In Nov’17, the CPI inflation increased to
15-month high to 4.88%, while WPI inflation rose to 8-month high of 3.93% as food items
became more expensive. In the recent period, the urban inflation is increasing, which is
mainly driven by housing inflation, which is rising continuously in the last 5-months reflecting
the statistical impact of pay commission.
9State Bank of India
Impact of Jan Dhan on Inflation (1)
We also analysed the impact of state-wise PMJDY accounts on rural and urban CPI
inflation. The data shows that the States where more number of Jan Dhan accounts
were opened, there is a meaningful drop in rural inflation
This suggests that one of the common concerns - that the PMJDY program may have led to
substantially higher price level due to a higher circulation of money and creation of additional
demand - may be unwarranted
We observed that there is both statistically significant and economically meaningful drop in
consumption of intoxicants such as alcohol and tobacco products in states where more
PMJDY accounts were opened
This could be because of behavioural changes like less spending post demonetisation
Also, Jan Dhan-Aadhaar-Mobile (JAM) Trinity has helped in better channelizing Government
subsidies and helped in curbing expenditure on demerit goods such as alcohol and tobacco
in rural areas

10State Bank of India
Impact on Inflation (2)
We also observed an increase in household medical expenditure in more exposed states
like Bihar, West Bengal, Maharashtra, Rajasthan, etc. since Oct’16 due to changing
lifestyles and increased demand for medical services
Number of
A/Cs (in Crore)
Rural
Share (%)
Urban
Share (%)Rural CPI Urban CPI
Health CPI
(Combined)
Pan, Tobacco &
Intoxicants CPI
(Combined)
Uttar Pradesh 4.73 60% 40% -3.6 -0.3 -0.1 -2.3
Bihar 3.20 65% 35% -1.0 0.6 2.3 -0.9
West Bengal 2.89 69% 31% -5.0 -1.5 1.5 -4.6
Madhya Pradesh 2.73 48% 52% -0.9 0.6 -0.6 0.6
Maharashtra 2.12 50% 50% 0.0 0.0 3.4 3.9
Rajasthan 2.04 62% 38% -1.7 -0.2 1.5 -2.7
Chhattisgarh 1.31 67% 33% 0.3 -0.5 1.0 -0.2
Assam 1.27 75% 25% 1.8 1.1 3.2 0.4
Odisha 1.22 73% 27% -4.8 -0.4 -3.3 -6.7
Gujarat 1.15 52% 48% -2.8 -0.8 -2.1 -2.3
Jharkhand 1.09 74% 26% -4.7 -0.8 5.8 0.4
Karnataka 0.97 61% 39% -0.7 -1.4 2.2 2.1
Tamil Nadu 0.90 48% 52% 1.6 1.8 2.3 -2.7
Telangana 0.88 57% 43% -4.8 -1.7 -1.8 -1.0
Andhra pradesh 0.77 50% 50% -3.4 -1.3 -0.6 1.8
Haryana 0.62 54% 46% -1.1 1.9 -1.0 -0.9
Punjab 0.57 57% 43% -1.4 -0.7 -2.0 14.1
Kerala 0.42 44% 56% 3.2 0.7 2.0 5.8
All India 30.38 60% 40% -1.6 -0.1 0.8 -0.1
Source: MOSPI, SBI Research
Jan Dhan Accounts and CPI Inflation
PMJDY
States
Change in CPI Inflation (Sep'17 over Oct'16)
11State Bank of India
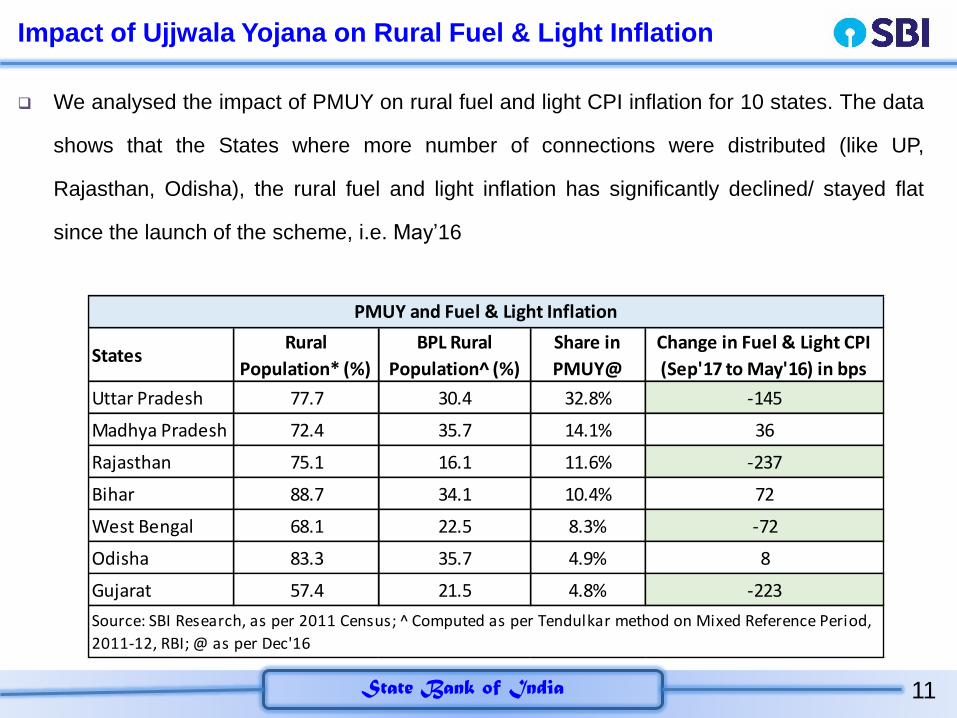
Impact of Ujjwala Yojana on Rural Fuel & Light Inflation
StatesRural
Population* (%)
BPL Rural
Population^ (%)
Share in
PMUY@
Change in Fuel & Light CPI
(Sep'17 to May'16) in bps
Uttar Pradesh 77.7 30.4 32.8% -145
Madhya Pradesh 72.4 35.7 14.1% 36
Rajasthan 75.1 16.1 11.6% -237
Bihar 88.7 34.1 10.4% 72
West Bengal 68.1 22.5 8.3% -72
Odisha 83.3 35.7 4.9% 8
Gujarat 57.4 21.5 4.8% -223
PMUY and Fuel & Light Inflation
Source: SBI Research, as per 2011 Census; ̂Computed as per Tendulkar method on Mixed Reference Period,
2011-12, RBI; @ as per Dec'16
We analysed the impact of PMUY on rural fuel and light CPI inflation for 10 states. The data
shows that the States where more number of connections were distributed (like UP,
Rajasthan, Odisha), the rural fuel and light inflation has significantly declined/ stayed flat
since the launch of the scheme, i.e. May’16
12State Bank of India
Banking the UnbankedHow PMJDY Changed Banking Behaviour

13State Bank of India
Overview
The Pradhan Mantri Jan Dhan Yojna (JDY from now) launched in India on August 14, 2014,
the world’s largest financial inclusion program with the aim to provide universal access to
banking services
As of November 2017, approximately 300 million accounts have been opened under this
program attracting total deposits approximately Rs 690,000 million ($11 billions), substantially
expanding access to banking services
Our empirical setting serves as a useful laboratory to study importance of access to basic
financial products for the poor
Our research throw some interesting findings
14State Bank of India
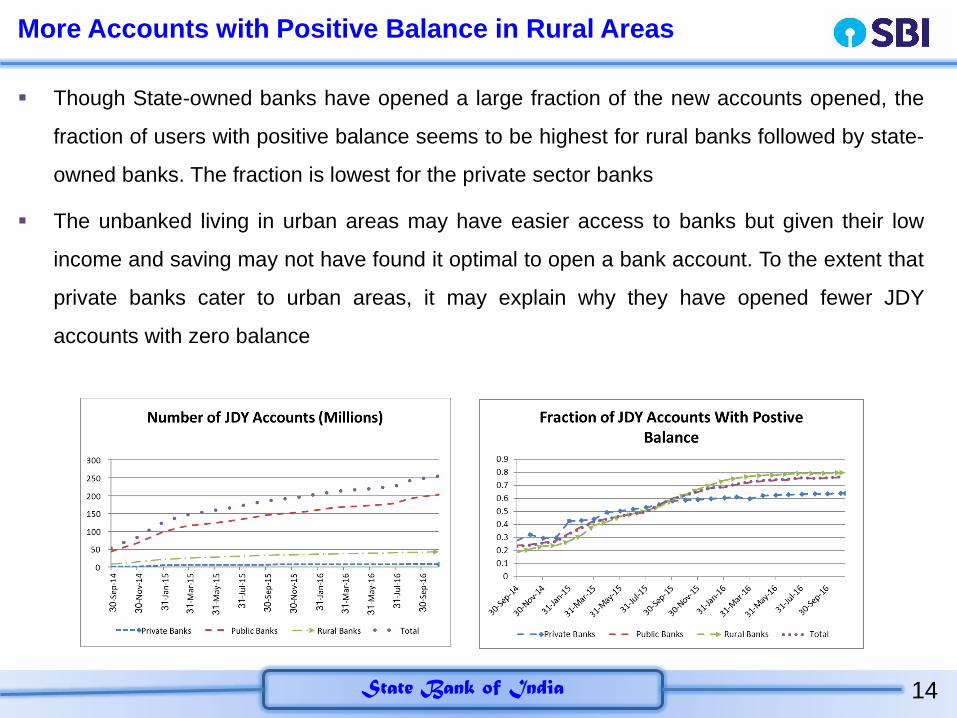
More Accounts with Positive Balance in Rural Areas
Though State-owned banks have opened a large fraction of the new accounts opened, the
fraction of users with positive balance seems to be highest for rural banks followed by state-
owned banks. The fraction is lowest for the private sector banks
The unbanked living in urban areas may have easier access to banks but given their low
income and saving may not have found it optimal to open a bank account. To the extent that
private banks cater to urban areas, it may explain why they have opened fewer JDY
accounts with zero balance
15State Bank of India
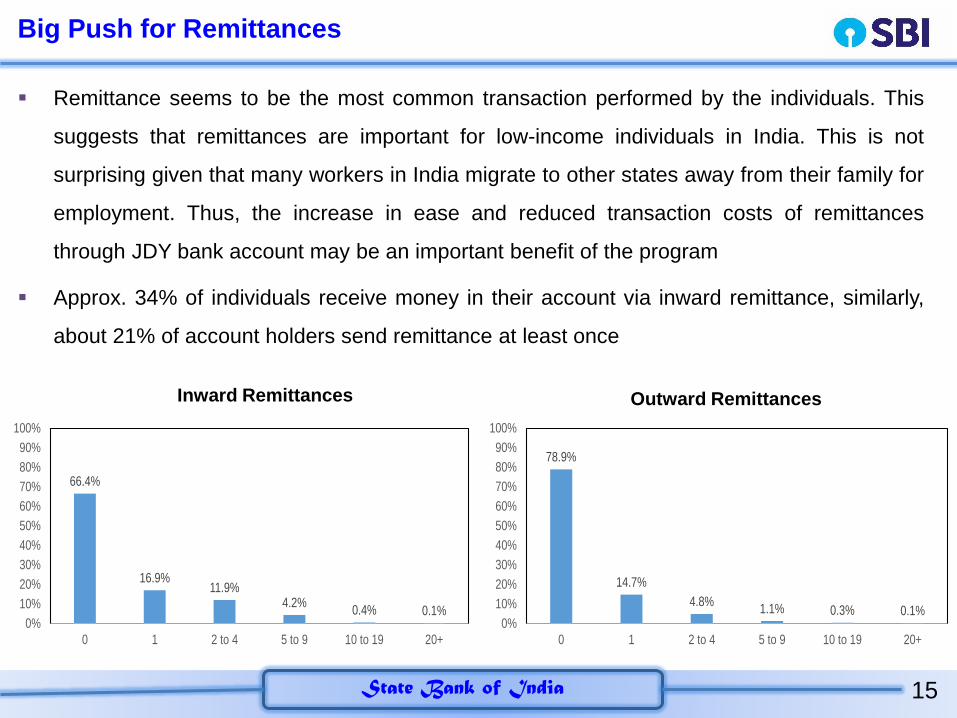
Big Push for Remittances
Remittance seems to be the most common transaction performed by the individuals. This
suggests that remittances are important for low-income individuals in India. This is not
surprising given that many workers in India migrate to other states away from their family for
employment. Thus, the increase in ease and reduced transaction costs of remittances
through JDY bank account may be an important benefit of the program
Approx. 34% of individuals receive money in their account via inward remittance, similarly,
about 21% of account holders send remittance at least once
66.4%
16.9%11.9%
4.2%0.4% 0.1%
0%
10%
20%
30%
40%
50%
60%
70%
80%
90%
100%
0 1 2 to 4 5 to 9 10 to 19 20+
78.9%
14.7%
4.8%1.1% 0.3% 0.1%
0%
10%
20%
30%
40%
50%
60%
70%
80%
90%
100%
0 1 2 to 4 5 to 9 10 to 19 20+
Inward Remittances Outward Remittances
16State Bank of India
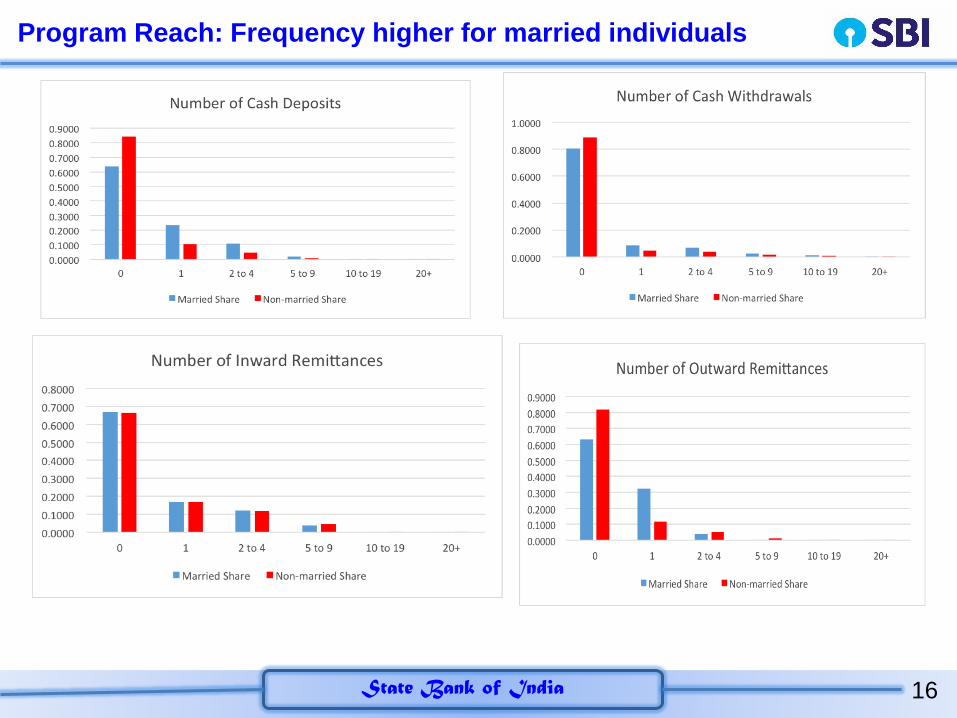
Program Reach: Frequency higher for married individuals
17State Bank of India
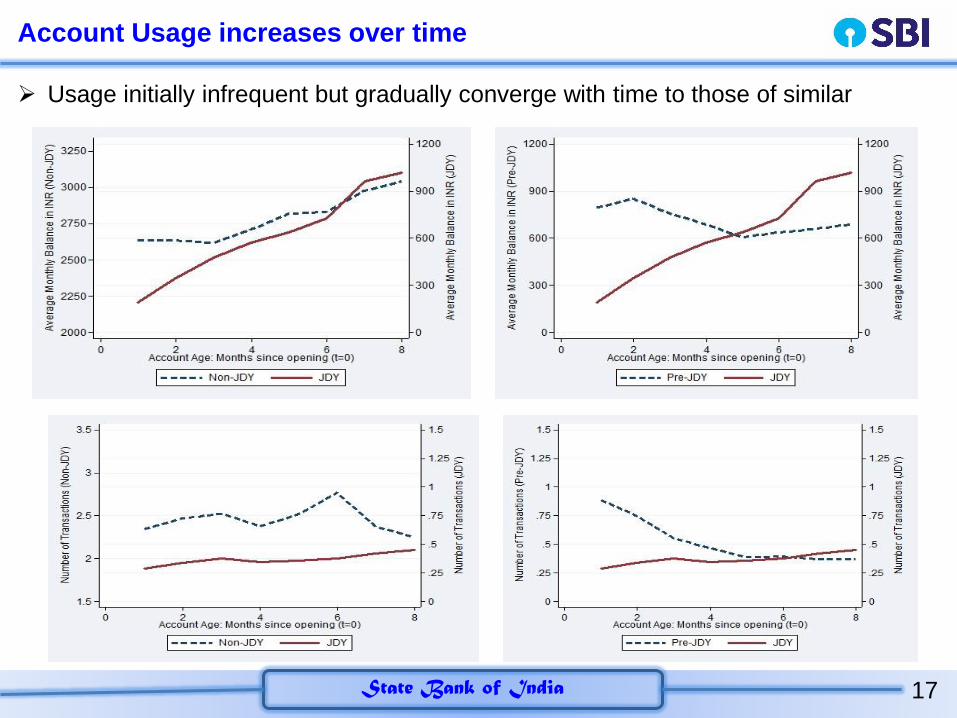
Account Usage increases over time
Usage initially infrequent but gradually converge with time to those of similar
18State Bank of India
PMJDY are silently making economic & social progress
Our findings suggest that JDY may have allowed banks to meet the unmet demand for
credit for some households that did not have prior access to formal banking products.
We observe an increase in the fraction of households borrowing from banks in regions
with greater ex-ante JDY exposure relative to regions with lower exposure
We observe a contemporaneous decrease in the fraction of households borrowing from
non-bank sources
We observe a significant decrease in the monthly volatility of consumption expenditure
We find some evidence suggesting that the program was associated with an increase in
investments
19State Bank of India
Fiscal Policy stance
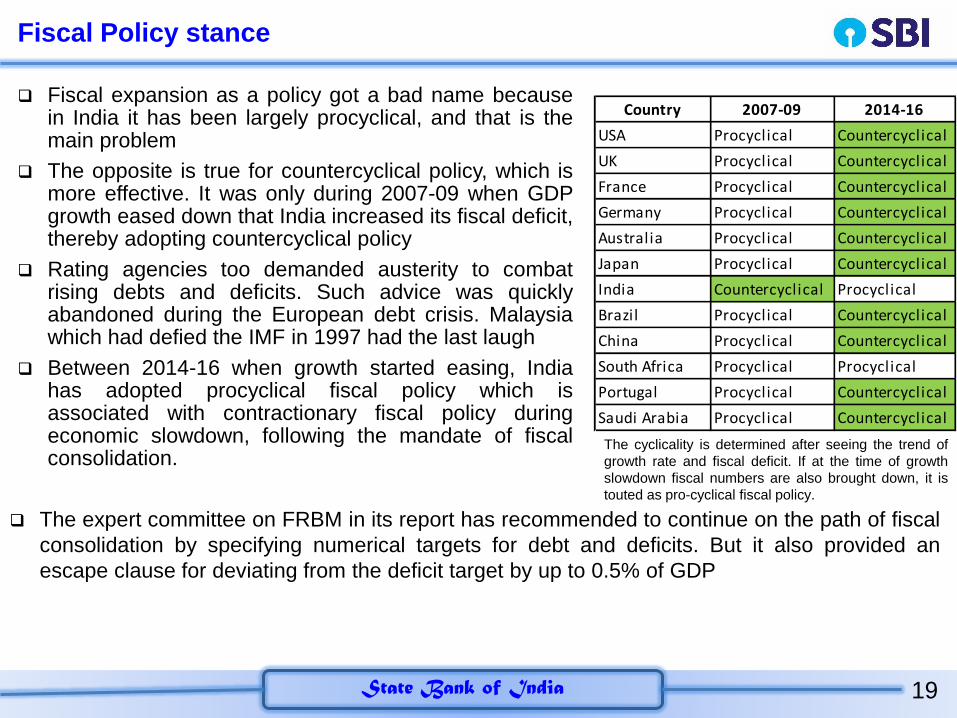
Fiscal expansion as a policy got a bad name becausein India it has been largely procyclical, and that is themain problem
The opposite is true for countercyclical policy, which ismore effective. It was only during 2007-09 when GDPgrowth eased down that India increased its fiscal deficit,thereby adopting countercyclical policy
Rating agencies too demanded austerity to combatrising debts and deficits. Such advice was quicklyabandoned during the European debt crisis. Malaysiawhich had defied the IMF in 1997 had the last laugh
Between 2014-16 when growth started easing, Indiahas adopted procyclical fiscal policy which isassociated with contractionary fiscal policy duringeconomic slowdown, following the mandate of fiscalconsolidation.
Country 2007-09 2014-16
USA Procyclical Countercyclical
UK Procyclical Countercyclical
France Procyclical Countercyclical
Germany Procyclical Countercyclical
Australia Procyclical Countercyclical
Japan Procyclical Countercyclical
India Countercyclical Procyclical
Brazil Procyclical Countercyclical
China Procyclical Countercyclical
South Africa Procyclical Procyclical
Portugal Procyclical Countercyclical
Saudi Arabia Procyclical Countercyclical
The expert committee on FRBM in its report has recommended to continue on the path of fiscal
consolidation by specifying numerical targets for debt and deficits. But it also provided an
escape clause for deviating from the deficit target by up to 0.5% of GDP
The cyclicality is determined after seeing the trend of
growth rate and fiscal deficit. If at the time of growth
slowdown fiscal numbers are also brought down, it is
touted as pro-cyclical fiscal policy.

20State Bank of India
Fiscal Policy & non-tax revenue
Increased fiscal prudence has brought the fiscal deficit to manageable levels. The
increased efforts of the Government to raise resources from non-tax sources have
also helped
However, this has put stress on other sectors like telecom which has seen increase
in leverage after the spectrum auctions
In the non-tax revenue, economic services alone accounted for close to 40% in
2016-17. Within this “other communication services” constituted 60%. For receipts
under 'Other Communication Services', the Department of Telecom collects
recurring license fees from Telecom Services Providers licensed by it
It also collects one time Entry fees from new operators. This also includes one-time
spectrum charges in the years in which auctions are held. These fees affect the
balance sheets of telecom companies

21State Bank of India
Fiscal Deficit for FY18: Though supposed to slip, there is a but..
On 27 Dec’17, Government reviewed the market borrowing programme
Government has budgeted only Rs 2002 crore of short-term borrowings but with
this new borrowing programme, Government will now do incremental short-term
borrowing of Rs 25,000 crore more, hence an extra borrowing of around Rs
23,000 crore (Rs 25,000 crore minus Rs 2,000 crore)
This along-with an additional market borrowing of Rs 50,000 crore through dated
Government securities leads to an aggregate additional borrowing of Rs 73,000
crore
The impact of this additional borrowing would be around 43 bps of GDP and
therefore the fiscal deficit target of 3.24% may shoot up to 3.5% of GDP, but….
Budget Revised Incremental
Short term Borrowing 2,002 25,000 22,998 -
Gross Market Borrowing 5,80,000 6,53,000 73,000 -
Fiscal Deficit 5,46,532 6,19,532 73,000 6,60,420
Fiscal Deficit (% of GDP) 3.24 3.67 0.43 3.50
FY18FY19 P
Fiscal Deficit Arithmetic
Item
Source: SBI Research; P: SBI Projections

22State Bank of India
Fiscal Deficit: Outlook for FY19
By assuming nominal GDP grow of 12% in FY19, if Government target fiscal
deficit of 3.5%, it will be stay on the path of fiscal consolidation and there will be
more fiscal space for the Government to spend in the election year ahead. This is
expected to augur well for the market.
23State Bank of India
Outlook on Monetary Policy: Global Economy
With the ongoing synchronized pick-up in global growth, central banks across countries would
likely to continue the normalization of monetary policy in FY19
The U.S. Federal Reserve has stopped its unconventional program of security purchases, hiked
rates four times and set out a plan for the gradual reduction of its balance sheet
The Bank of Japan will face mounting pressure to lift its foot off the stimulus accelerator. In addition
to this the bank would likely to moderate its asset purchase program in FY19
The ECB will try its utmost to stick to its recently announced plan of halving monthly purchases to
30 billion euros ($34 billion) until September- a prelude to ending the large-scale purchase
program altogether before taking policy interest rates out of negative territory
With growth prospects having been revised downward and with the inflation rate remaining well
above target, the Bank of England finds itself in an unwelcomed policy dilemma, particularly after
having been forced to hike this year for the first time in about 10 years
Putting all this together, there is good news for the global economy as the world’s most powerful
central bank - the Fed - faces the lowest relative degree of policy difficulty in compare to others

24State Bank of India
Monetary Policy: No Need for Coordination
Recently (in Dec) the Central banks of US and Mexico increased their benchmark policy rates by
25 bps while Brazil and Russia reduced their policy rates by 50 bps. Though most of the central
banks are exiting from their quantitative easing cycle yet there is no coordination among them,
which is quite obvious and necessary as every central bank is following its own pace for exit
depending upon the county-specific issues/challenges
Country Policy Rate Name
Recent
increase/decrease
(in BPS)
Policy Date
USA Funds Rate 25 Dec 13, 2017
South Korea Base Rate 50 Nov 30, 2017
Mexico Benchmark Rate 25 Dec 14, 2017
Georgia Refinancing Rate 25 Dec 13, 2017
UAE Repo Rate 25 Dec 13, 2017
Ukraine Discount Rate 100 Dec 14, 2017
Argentina Benchmark Rate 150 Nov 07, 2017
Czech Republic Repo Rate 25 Nov 02, 2017
UK Bank Rate 25 Nov 02, 2017
Brazil Selic Rate -50 Dec 06, 2017
Colombia Key Rate -25 Nov 24, 2017
Ghana Monetary Policy Rate -100 Nov 27, 2017
Peru Policy Interest Rate -25 Nov 09, 2017
Zambia Policy Rate -75 Nov 22, 2017
Russia Key Rate -50 Dec 15, 2017

25State Bank of India
Exports Growth
During Apr-Sep’17 period exports have shown growth of 12% compared to the same period
last year. Exports growth turned positive from Aug’16 after remaining negative for months.
However’ in Oct’17 the growth negative as GST implementation issues led to working capital
problem for exporters, due to which exports are expected to grow by 5% this fiscal. For the
next fiscal exports are expected to grow in double digits
-5.0
0.0
5.0
10.0
15.0
20.0
25.0
30.0
35.0
-
5,000
10,000
15,000
20,000
25,000
30,000
Ap
r-1
7
May
-17
Jun
-17
Jul-
17
Au
g-1
7
Sep
-17
Oct
-17
No
v-1
7
Exports (Rs million) Exports Growth Rate (RHS)

26State Bank of India
Exports Growth and Global Linkage
Historically, it can be seen that the positive movement of world exports has been mirrored by
Indian exports. With global trade recovering Indian exports have also recovered, save for the
issues arising out of GST implementation. Once the issues are resolved completely, Indian
exports are expected to grow robustly. The 30% growth witnessed in Nov’17 is a step in that
direction
-40.0
-30.0
-20.0
-10.0
0.0
10.0
20.0
30.0
40.0
50.0
60.0
20
06
Q1
20
06
Q3
20
07
Q1
20
07
Q3
20
08
Q1
20
08
Q3
20
09
Q1
20
09
Q3
20
10
Q1
20
10
Q3
20
11
Q1
20
11
Q3
20
12
Q1
20
12
Q3
20
13
Q1
20
13
Q3
20
14
Q1
20
14
Q3
20
15
Q1
20
15
Q3
20
16
Q1
20
16
Q3
20
17
Q1
20
17
Q3
Percentage change, year-on-year of Exports
World India
Source : WTO

27State Bank of India
Rupee Dollar Nominal Exchange Rate
Rupee has started appreciating after India’s rating upgrade. From the day of the
announcement till 1st Jan’18 rupee has appreciated by more than a rupee. Till March
Rupee is expected to stay in this range of 63.5-64.0 per dollar.
63.764.8
66.3
62.6
60.1
54.4
1-J
an-1
8
20
16
-17
20
15
-16
20
14
-15
20
13
-14
20
12
-13
Rupee Dollar Exchange Rate End Financial Year
28State Bank of India
Rupee Appreciation and Exports Growth?
Since Feb’17, Indian Rupees has appreciated by around 3.0% against US dollar. It
is widely believed that currency appreciation will lead to decline in Exports keeping
other things equal
However, our finding suggests something different. The estimated result shows that,
there is a positive and significant relationship between these two
During the period between Feb-Sep’17, when rupee appreciated by average 3.3%,
exports increased by on an average by 14.7%.The same has been validated by
other studies
Imports and the import tariffs are playing a major role in boosting exports growth,
thus indicating ‘import-led exports growth’ mechanism operates in India. So, at the
aggregate level, India’s exports are significantly more responsive to changes in
external demand than to price/exchange rate

29State Bank of India
Current Account Deficit Trends( as % of GDP)
After moderating continuously for 4 fiscals, CAD as % of GDP is expected to go up
in the next fiscal. This is due to higher trade deficit brought about by a larger
increase in merchandise imports relative to exports.
-2.5
-1.2
-4.8
-1.7-1.3
-1.1-0.7
-1.5 -1.5
Q1
FY1
8
Q2
FY1
8
FY1
3
FY1
4
FY1
5
FY1
6
FY1
7
FY1
8(P
)
FY1
9(P
)
30State Bank of India
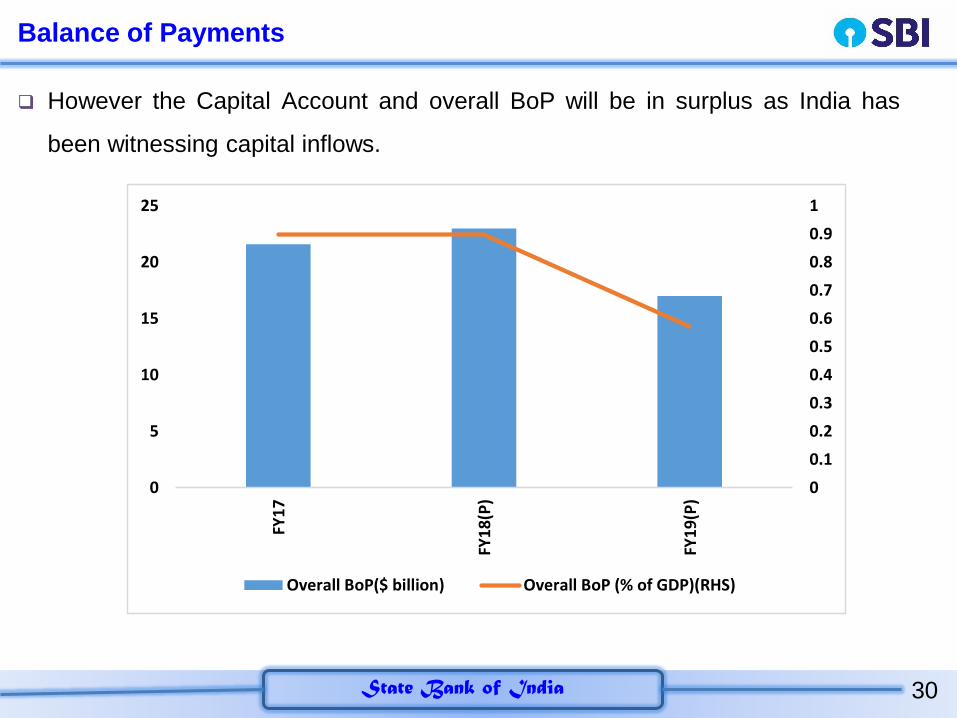
Balance of Payments
However the Capital Account and overall BoP will be in surplus as India has
been witnessing capital inflows.
0
0.1
0.2
0.3
0.4
0.5
0.6
0.7
0.8
0.9
1
0
5
10
15
20
25
FY1
7
FY1
8(P
)
FY1
9(P
)
Overall BoP($ billion) Overall BoP (% of GDP)(RHS)

31State Bank of India
Banking | Corporate Sector

32State Bank of India
Credit growth is showing an upward momentum
The fortnightly data of ASCB indicates that credit off-take (YoY) has been taking place but deposits
growth is declining, which is mainly due to base effect
In FY18 so far (till 22 Dec’17), ASCBs aggregate deposits YoY growth has declined to 4.0% (last
year 14.6%), while credit growth has improved to 10.7% (4.7%)
In FY18, credit may grow at 6.0-6.5%, while deposits growth may decline to 4.0-4.5%, due to base
effect

33State Bank of India
Credit Flows to Sectors
Sectoral deployment of credit for November 2017 indicates that credit to industry and
personal loans sector is slowly picking up
FY17 (Nov'16) FY18 (Nov'17) FY17 (Apr-Nov) FY18 (Apr-Nov)
Bank Credit 4.0 8.3 -0.8 0.2
NF Credit 4.8 8.8 -0.2 0.3
Agr. & Allied 10.3 8.4 3.2 -0.4
Industry -3.4 1.0 -5.5 -2.8
Services 7.1 14.0 0.1 -2.4
Personal Loans 15.2 17.3 8.0 8.8
Housing 15.6 13.1 9.2 7.2
Vehicle Loans 21.4 8.0 9.4 6.0
Source: SBI Research, RBI
YoY Growth (%) YTD Growth
Sectoral Deployment of Credit

34State Bank of India
Insolvency code to boost credit growth
T-3 T-2 T-1Year of
Implementation (T)T+1 T+2 T+3
Argentina 1995 23.2 20.5 11.1 5.3 6.6 15.7 8.7
Austria 2010 3.5 6.5 4.9 2.7 2.5 5.2 -2.0
Chi le 2014 17.4 13.3 11.4 10.8 11.3 6.0 -
China 2006 19.5 8.8 10.7 16.3 17.6 11.7 30.7
Colombia 2006 7.6 17.3 13.8 20.0 15.3 14.0 9.9
Czech Republ ic 2008 3.1 20.5 20.1 13.9 5.8 4.8 9.1
Egypt 1999 - 19.7 17.5 17.1 11.8 9.2 11.1
Germany 2010 -0.7 3.5 0.9 34.5 3.0 -1.1 -10.6
Hong Kong 1998 8.6 18.0 18.7 -15.0 -8.3 3.3 0.4
Kazakhstan 2014 15.5 12.8 13.1 5.7 20.9 -0.2 -
Poland 2003 8.0 11.8 2.3 7.6 2.1 8.6 21.2
Singapore 1999 17.2 19.5 18.2 -0.3 4.0 14.2 -16.1
Spain 2003 12.0 12.2 10.4 14.6 14.3 22.9 24.6
UAE 1993 -3.1 5.5 12.4 5.6 20.4 7.2 12.0
India 2016 13.9 9.0 10.9 4.5 6.3 - -
Source: CEIC, SBI Research, Credit growth as of end of year (Dec). For India: March end
Implementation of Bankruptcy/Solvency Code vs Credit Growth
Country
Bankruptcy/Solvency
Code Implementation
Year
Credit Growth (% YoY)
We find that in most of the countries the bank credit growth increased manifold post the
implementation of Insolvency and Bankruptcy Code
35State Bank of India
Recapitalisation of PSBs
The Government took a massive step to capitalise PSBs in a front-loaded manner, with a
view to support credit growth and job creation
The Rs 2.11 lakh crore over the next two years, through (i) budgetary provision Rs
18,139 crore; (ii) recapitalisation bond Rs 1.35 lakh crore; (iii) Raising of capital by banks
from the market while diluting non-Government equity (estimated Rs 58,000 crore)
India had used this tool before during 1985-86 to 2000-01, wherein the Government
recapitalised PSBs with the total amount of Rs 20,446 crore. The total, interest paid by
the Government to the nationalised banks on special securities works out to be Rs 7,888
crore / 0.07% of GDP per annum on average. While, the banks have paid Rs 15,222
crore as dividend to the government / 0.04% of GDP on average. So, the net impact was
only 0.03% of GDP. Also, coupon payments could improve profitability of the banks
The Rs 1.35 lakh crore package in itself seems largely adequate and sufficient for
tackling the problem of stressed assets. We believe, if the structure of 1990 would
adopted, it would not alter any fiscal math in current scenario
36State Bank of India
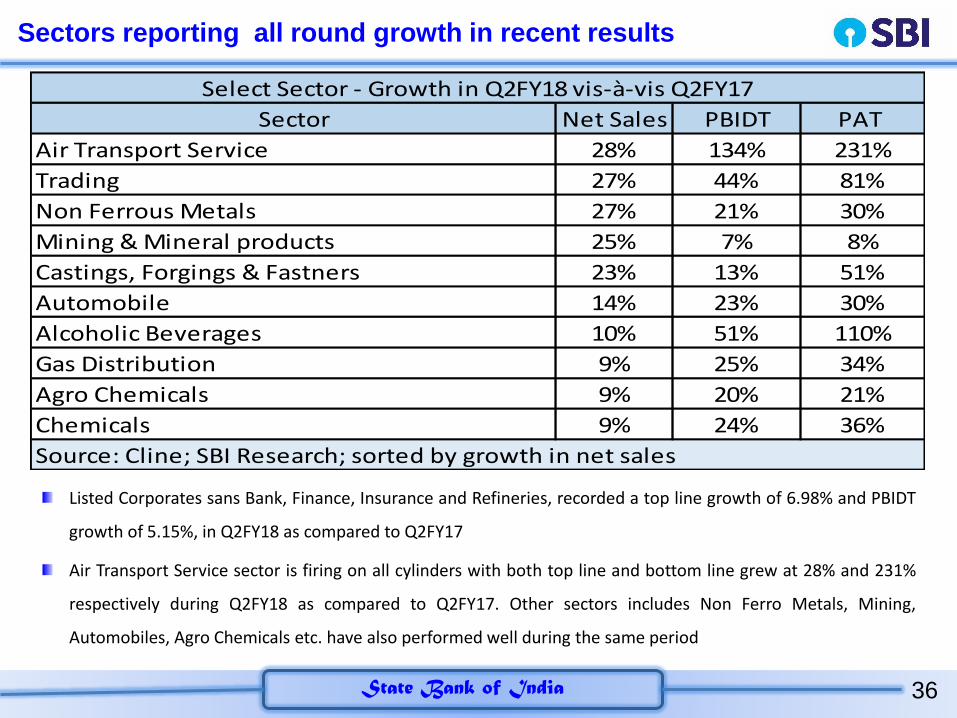
Sectors reporting all round growth in recent results
Sector Net Sales PBIDT PAT
Air Transport Service 28% 134% 231%
Trading 27% 44% 81%
Non Ferrous Metals 27% 21% 30%
Mining & Mineral products 25% 7% 8%
Castings, Forgings & Fastners 23% 13% 51%
Automobile 14% 23% 30%
Alcoholic Beverages 10% 51% 110%
Gas Distribution 9% 25% 34%
Agro Chemicals 9% 20% 21%
Chemicals 9% 24% 36%
Select Sector - Growth in Q2FY18 vis-à-vis Q2FY17
Source: Cline; SBI Research; sorted by growth in net sales
Listed Corporates sans Bank, Finance, Insurance and Refineries, recorded a top line growth of 6.98% and PBIDT
growth of 5.15%, in Q2FY18 as compared to Q2FY17
Air Transport Service sector is firing on all cylinders with both top line and bottom line grew at 28% and 231%
respectively during Q2FY18 as compared to Q2FY17. Other sectors includes Non Ferro Metals, Mining,
Automobiles, Agro Chemicals etc. have also performed well during the same period
37State Bank of India
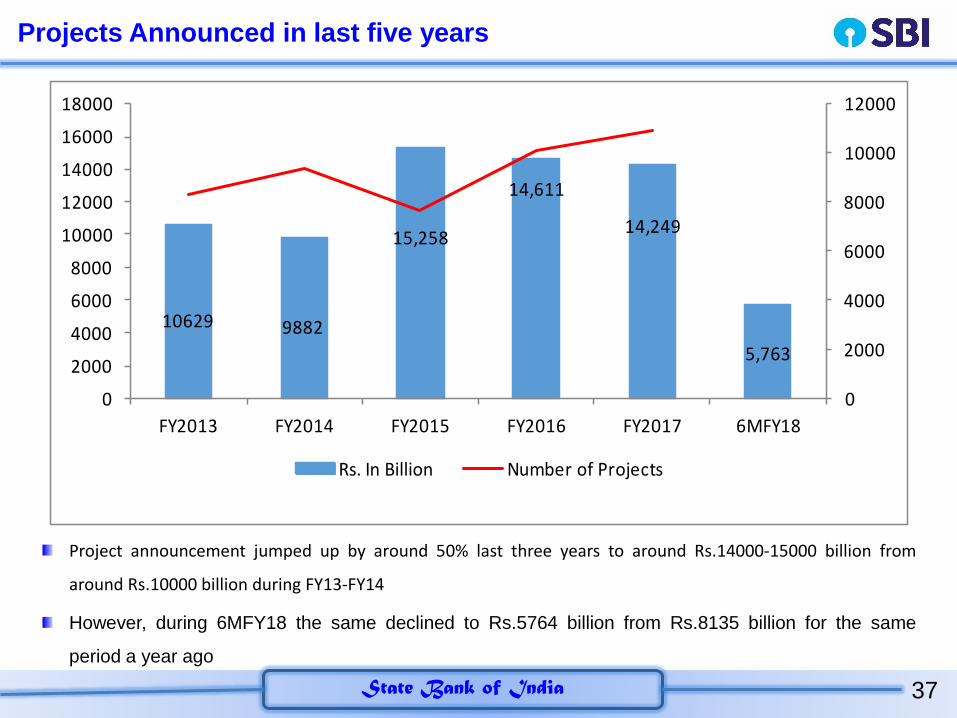
Projects Announced in last five years
10629 9882
15,258
14,611
14,249
5,763
0
2000
4000
6000
8000
10000
12000
0
2000
4000
6000
8000
10000
12000
14000
16000
18000
FY2013 FY2014 FY2015 FY2016 FY2017 6MFY18
Rs. In Billion Number of Projects
Project announcement jumped up by around 50% last three years to around Rs.14000-15000 billion from
around Rs.10000 billion during FY13-FY14
However, during 6MFY18 the same declined to Rs.5764 billion from Rs.8135 billion for the same
period a year ago

38State Bank of India
Project Announced by ownership
Ownership Share (%) FY13 FY14 FY15 FY16 FY17 H1FY18
Government 46.1 69.05 63 66.26 71.36 71.13
State Government 45.57 56.66 53.96 45.15 51.58 54.89
Central Government 54.43 43.34 46.04 54.85 48.42 45.11
Private Sector 53.9 30.95 37 33.74 28.64 28.87
Indian Private Sector 95.36 92.33 86.68 79.69 13.97 21.55
Foreign Private Sector 4.64 7.67 13.32 20.31 86.03 78.45
All Sectors 100 100 100 100 100 100
Source: Projects Today; SBI Research
Projects Announced by Ownership
Share of Project announcement by Government increased substantially from 46% in FY13 to
71% in FY17
Share of Investment from Private sector declined from around 50% in FY13 to 28% in FY17
It appears that Foreign Private sector have shown confidence in Indian growth story and
increased their share substantially to around 80% in project announcement last year and first
six months also

39State Bank of India
Sectors FY15 FY16 FY17Total in 3
yearsFY17/FY16 H1FY18
Roadways 1,713 2,160 2,835 6,708 31% 1,059
Railways 2,304 1,354 2,625 6,283 94% 636
Electricity 1,691 1,483 204 3,378 -86% 345
Basic Chemicals 757 1,333 1,109 3,199 -17% 332
Community Services 1,067 978 934 2,978 -5% 466
Basic Metals 1,093 853 496 2,442 -42% 355
Non Conventional Energy 677 799 873 2,350 9% 172
Irrigation 430 404 1,229 2,063 204% 388
Mining 536 926 343 1,806 -63% 188
Machinery 408 645 732 1,785 14% 71
Power Distribution 634 433 69 1,136 -84% 284
Storage & Distribution 230 325 83 638 -74% 48
Gas Pipeline 23 63 416 502 557% 25
Food Products 218 114 138 470 21% 20
Commercial Complexes 106 129 225 460 75% 32
Airways (Aviation Infrastructure) 18 119 189 327 58% 51
Source: Projects Today; SBI Research
Projects announced by Sectors (Rs. In Billion)
Hot Spot – Roadways, Railways, Non Conventional Energy, Irrigation, Gas Pipe Lines etc.
40State Bank of India
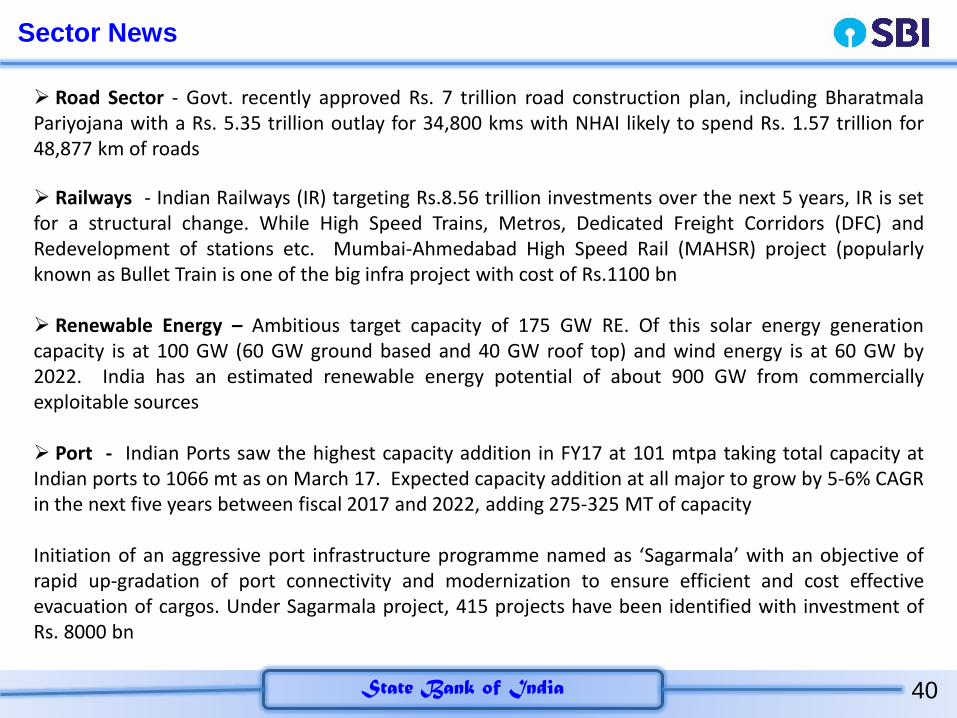
Sector News
Road Sector - Govt. recently approved Rs. 7 trillion road construction plan, including BharatmalaPariyojana with a Rs. 5.35 trillion outlay for 34,800 kms with NHAI likely to spend Rs. 1.57 trillion for48,877 km of roads
Railways - Indian Railways (IR) targeting Rs.8.56 trillion investments over the next 5 years, IR is setfor a structural change. While High Speed Trains, Metros, Dedicated Freight Corridors (DFC) andRedevelopment of stations etc. Mumbai-Ahmedabad High Speed Rail (MAHSR) project (popularlyknown as Bullet Train is one of the big infra project with cost of Rs.1100 bn
Renewable Energy – Ambitious target capacity of 175 GW RE. Of this solar energy generationcapacity is at 100 GW (60 GW ground based and 40 GW roof top) and wind energy is at 60 GW by2022. India has an estimated renewable energy potential of about 900 GW from commerciallyexploitable sources
Port - Indian Ports saw the highest capacity addition in FY17 at 101 mtpa taking total capacity atIndian ports to 1066 mt as on March 17. Expected capacity addition at all major to grow by 5-6% CAGRin the next five years between fiscal 2017 and 2022, adding 275-325 MT of capacity
Initiation of an aggressive port infrastructure programme named as ‘Sagarmala’ with an objective ofrapid up-gradation of port connectivity and modernization to ensure efficient and cost effectiveevacuation of cargos. Under Sagarmala project, 415 projects have been identified with investment ofRs. 8000 bn

41State Bank of India
Financial Inclusion
42State Bank of India
Financial Inclusion
There are two aspects to financial inclusion: one is bank accounts and the second
is access to credit. PMJDY addresses the first problem. The issue of making credit
available to small borrowers remains
A very shallow penetration of insurance (3.5%) and social security (8%) is
another major issue. Although the government has launched a number of schemes
to provide pension and insurance services to the poor and those working in the
unorganised sector, these efforts are mainly supply-driven and results will depend
upon efforts to improve financial awareness among the poor
Strengthening the BC/BF model, to promote digital financial inclusion in the country
Need to reduce the excess cash in the economy, by accepting and giving money
through mobile payments etc.
Making banking habit of the people

43State Bank of India
Formalization of Economy: Rs 84,000 crore & Counting …
Considering the avg. balance of Rs 3000 in Jan Dhan account, so Rs 84,000 crore has been formalized into the system, through 28 crore A/cs

44State Bank of India
Mudra surge
Till now, the average ticket size of 10.17 crore units of PMMY loans disbursed is
around Rs 43,000 and around 80% of these loans have been sanctioned to women
entrepreneurs
Loans under Pradhan Mantri Mudra Yojana (PMMY)
FY16 FY17 FY18 (29-Dec) Total
No. of PMMY Loans ( in crores) 3.49 3.97 2.71 10.17
Amount Disbursed (Rs lakh crore) 1.33 1.75 1.29 4.37
45State Bank of India
Traction between Jan Dhan accounts and Mudra
In an in-house study within SBI we have found that there is a traction across Jan
Dhan and Mudra accounts
23% of Mudra loan account holders are women with an average ticket size of around
Rs 55,000
Distribution of the women entrepreneurs across India, with 36% of the accounts coming
from southern India (Andhra Pradesh, Tamil Nadu and Telengana) and 16% from
eastern India (West Bengal, Odisha and Assam) – laggard states witnessing more
traction
The Government must think seriously of creating a database pool of women
entrepreneurs across India. This will create a successful Mudra-Bank linkage
The experience of successful SHG-Bank linkage is a case in point in the Indian context.
There is no harm in emulating this in the context of better Mudra loan targeting by using
Jan Dhan account interface

46State Bank of India
Way Forward
47State Bank of India
Budget 2018-19: Expectations
Fiscal Deficit: We expect the Government to continue on its fiscal consolidation
path. However, this may not be construed as the overarching criterion and should
not come in the way of growth
Agriculture: The MSP determination at central level should be abolished and it
should be made state specific
Job Creation: Employment generation needs a major push so as to absorb the
ever growing workforce. Issues of adequacy of the capacity relation of the existing
training institutions, standardization and quality of trainers available in the country
and agencies who can certify these trainees need to be addressed on a war footing
MSME: The Budget can initiate a process for definitional change of MSMEs to be
revisited based on turnover of the enterprise

48State Bank of India
Urgent Need for Agri Reforms
Examine the APMC Act, Land Tenancy Act, and any such legally created structures
whose provisions are restrictive and create barriers to free trade
Rigorously pursue alternate marketing initiatives, like direct marketing and contract
farming
Establish stable trade policy based on tariff interventions instead of non-tariff trade
barriers
Develop and initiate competition in the agro-processing sector
Price support programme
Abolish the MSP determination at central level and make it state specific
The Agriculture sector can be digitalised in such a way that farmer can get a
platform to get farm inputs through online like e-Commerce services (delivery can
be through Post, e-Logistics) and get a platform to sell his products through online

49State Bank of India