Embed Size (px)
Citation preview

The University of North Carolina at Chapel Hill 2009Climate Action Plan

“Th ere are no big problems; there are just a lot of little problems.” -Henry Ford
Climate change could be a very big problem. Globally
big. Trillions of individual deci-sions made by billions of people compounding into one gargantuan tangle that could take genera-tions to unravel. It’s impossible to fi nd all the loose ends — to know exactly where to begin. And yet begin we must.
When the University of North Carolina at Chapel Hill became a signatory of the Ameri-can College and University’s Cli-mate Commitment (ACUPCC), it pledged to untangle its own small part of a global issue. Th e ACUPCC is a pledge to achieve climate neutrality by reducing the campus carbon footprint and off setting all greenhouse gas emissions. A year after signing, the University published its fi rst comprehensive greenhouse gas emissions inventory, peeling back the layers of its ambitious goal to reveal the many small opportuni-ties for improve-ment.
A
LOTalong with development plans and growth estimates, to create a projection of how the campus carbon footprint will expand if we continue with business as usual. Finally, we present a comprehen-sive plan for achieving our goal of climate neutrality by mid-century. As our business and educational models work to internalize the cost of greenhouse gas emissions, we will confront and address the many small problems we encounter on the path to climate neutrality.
Th e importance of our task has not faded over the past year, but has become even more urgent as the implications of climate change expand beyond the bounds of scientifi c or social consider-ation into the business world. At this writing, the US House of Representatives narrowly passed a carbon cap-and-trade bill that would gradually lower greenhouse gas emissions from large industrial sources by levying fees on emis-sion permits. At the same time, the nation faces the most stifl ing economic depression in a genera-tion. Attaching a price to carbon presents the University with new opportunities and challenges as we make the business case for emissions reduc-tion.
In this, the University’s fi rst Climate Action Plan, we begin by presenting an update to the campus emis-sions inventory. We’ve used that historical data,
of littleSolutions
Learn more about the Climate Action Plan and UNC’s progress at
http://www.climate.unc.edu
es as ase
s
an he is-ory. hat
historical data,
1.
2000 2008 Change
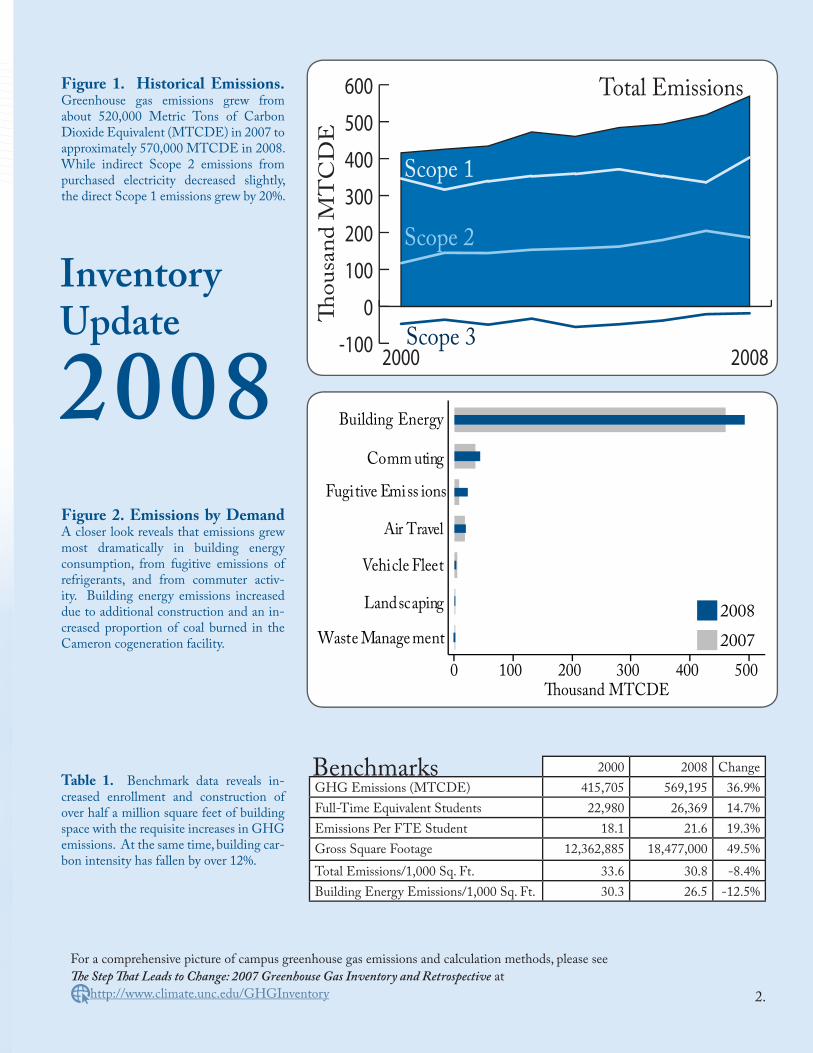
GHG Emissions (MTCDE) 415,705 569,195 36.9%
Full-Time Equivalent Students 22,980 26,369 14.7%
Emissions Per FTE Student 18.1 21.6 19.3%
Gross Square Footage 12,362,885 18,477,000 49.5%
Total Emissions/1,000 Sq. Ft. 33.6 30.8 -8.4%
Building Energy Emissions/1,000 Sq. Ft. 30.3 26.5 -12.5%
Benchmarks
Waste Manage ment
Landscaping
Vehicle Fleet
Air Travel
Fugitive Emiss ions
Comm uting
Building Energy
0 100 200 300 400 500
2008
2007
Total Emissions
Scope 3-100
0
100
200
300
400
500
600
20082000
Scope 1
Scope 2
Figure 1. Historical Emissions.Greenhouse gas emissions grew from about 520,000 Metric Tons of Carbon Dioxide Equivalent (MTCDE) in 2007 to approximately 570,000 MTCDE in 2008. While indirect Scope 2 emissions from purchased electricity decreased slightly, the direct Scope 1 emissions grew by 20%.
Figure 2. Emissions by DemandA closer look reveals that emissions grew most dramatically in building energy consumption, from fugitive emissions of refrigerants, and from commuter activ-ity. Building energy emissions increased due to additional construction and an in-creased proportion of coal burned in the Cameron cogeneration facility.
Table 1. Benchmark data reveals in-creased enrollment and construction of over half a million square feet of building space with the requisite increases in GHG emissions. At the same time, building car-bon intensity has fallen by over 12%.
InventoryUpdate2008
For a comprehensive picture of campus greenhouse gas emissions and calculation methods, please see
Th e Step Th at Leads to Change: 2007 Greenhouse Gas Inventory and Retrospective at
http://www.climate.unc.edu/GHGInventory 2.

Continued on page 5...
Technologies that were appealing but not yet commercially available were placed in the “bicycle rack” for future consideration, while others had to be scrapped in the “compost pile” because they failed some critical test.
Wedge Leaders and project man-agers held periodic meetings with the CAP Steering Committee to ensure that their progress and ideas aligned with University policy and mission.
Projections and Targets
Modeling
As the individual wedge groups met to identify mitigation strategies, the project team developed a spread-sheet model of campus greenhouse gas emissions.
Th e model considers myriad fac-tors, including campus population growth; construction, demolition, and renovation with energy intensity projections for each type; commodity pricing – with and without federal carbon regulation; and changes in on-site energy generation and from the local utility.
Using this model, the project team assessed the relative contribution of each endorsed alternative toward the goal of campus climate neutrality. By comparing each alternative on the basis of carbon abatement, cost, rate of return, and other metrics, the team selected a portfolio of projects that would serve to decrease carbon emis-sions in a fi scally responsible way.
Strategic Approach
Th e barriers to climate neutrality are substantial, owing to the sheer ubiquity of greenhouse gas emissions as a part of daily campus operations. Because energy and carbon aff ect everyone, development of a compre-hensive, long-range plan required the input and support of a diverse group of campus stakeholders. A steering committee composed of high-level administrators ensured that the proj-ect had the support and direction it needed for success.
In order to make the planning process more manageable, greenhouse gas emission sources were divided into a series of “Stabilization Wedg-es,” akin to those described by Pacala and Socolow (Science, 1994). Each wedge was assigned to an expert team leader who worked with other staff , students, and consultants to identify viable carbon abatement opportuni-ties.
To begin, “Wedge Groups” were asked to generate a comprehensive list of mitigation strategies and ideas. Each group took a unique approach to idea generation, looking to exist-ing departmental goals, published strategies, campus focus groups, brainstorming techniques, and cross-pollination between “wedges”. (See sidebar for a Lean approach).
Next, groups began to assess the viability of their project lists, develop-ing metrics to demonstrate the fea-sibility, carbon mitigation potential, and cost of each project. Th ey further refi ned their recommendations into a smaller set of “Endorsed Alter-natives,” identifying the strategies with a strong probability of success.
•Energy Supply -Strategies involving alternative fuels, re-newable energy, and the carbon intensity of grid electricity.
•Energy Conservation – Technical - Engineering changes to improve energy effi ciency. For example, building controls, light retrofi ts, variable air volume fume hoods, night or weekend setbacks.
•Energy Conservation – Behav-ior and Policy - Energy conser-vation measures that rely on a change in habit, or new policies that incentivize effi ciency.
•Green Development - Strate-gies to build energy effi ciency into new campus buildings and through retro-commissioning and space planning.
•Transportation - Programs to improve mass transit, modify commuter habits, and reduce emissions due to air travel.
•Purchasing and Recycling - Strategies to decrease the impact of the campus supply chain through source reduction, envi-ronmentally preferable purchas-ing, waste reduction, or recycling.
•Off sets - As a last resort, carbon off sets or RECs may be banked or purchased to meet emissions targets.
Stabilization Wedges
3.
Climate Action Plan

Leaning the Campus Supply Chain
Carbon reduction often seems to come with a trade-off : Should we expand our class off erings, or use less energy in the buildings? Should we encourage faculty travel for conferences and meetings, or reduce air travel emissions? Is it better to turn computers off at night, or allow the IT staff to run updates and patches? Without a framework and a common sense of purpose, the answers to these questions remain elusive and can some-times result in disagreement or confl ict.
What if we could fi nd common ground among diverse stakeholder needs, preserving the benefi ts of a program while eliminating its negative attributes? Th is is one of the goals of Lean, a busi-ness and improvement philosophy devel-oped by Toyota over the last 50 years. At its core, Lean strives to increase the value of the work we do, while eliminating any waste that doesn’t contribute to customer satisfaction.
A university has many customers, both internal and external, and each one has a diff erent set of values. Students may value education at an aff ordable price. Faculty may value top-notch research space or state of the art classroom equip-ment. Each person will be a customer to many others, and will serve many others in return – the trick is in knowing what the customer really wants, so we can deliver more value with less waste.
Th e University’s supply chain, from procurement through recycling, is an important part of the campus carbon footprint, but it is diffi cult to assess the
impact of carbon reduction programs as they fi lter through a population of 40,000 faculty, students and staff . Instead of simply mandating policies from the top, a team utilized a Lean rapid improvement workshop known as Kaizen to under-stand the supply chain from the bottom up. Th is workshop focuses a diverse stakeholder group on a single product or process, using their many eyes and minds to look for waste and opportunities for improvement.
But where to focus in a complex sup-ply chain? Th e EPA estimates that over two metric tons of CO2 are emitted in the harvesting, processing, and disposal of one ton of paper. UNC consumes an estimated 100,000,000 sheets per year, or roughly 500 tons – a meaningful target for emission reductions. Th e carbon emissions for a computer’s life cycle top 15 metric tons per ton of equipment, and with over 80,000 computers on campus, these also became a focus for reduction. As the team explored these two seem-ingly disparate parts of the supply chain, exciting synergies began to emerge.
Stakeholders representing the purchas-ing department, computer labs, students, the recycling offi ce, and others were invited for a two-day Kaizen workshop. Th e goal was to understand the true value of paper and computer use to the campus community, and to identify wasted time, resources, or energy that could be elimi-nated without reducing that value.
Th e group recognized that faculty, staff , students, vendors, and alumni are customers of the IT department. Th ese customers value reliability, information security, storage space, uptime, speed, sup-port, low cost, etc. Any carbon reduction
or sustainabil-ity goals must take these values into ac-count, so that the program doesn’t ac-cidentally de-crease quality or satisfaction. For instance, we could eliminate our backup fi le storage sys-
tem to save material, money, and energy, but this would violate the customer’s desire for reliability.
With a fi rm sense of customer value, the groups moved to an interactive Value Stream Mapping exercise. Th e value stream map describes the people, materi-als and activities involved at each phase of a process, from start to fi nish.
Once the entire process was visualized on the wall, it became easier to see the waste, errors, and problems. For example, the team members noticed that when placing an order from a local vendor, it automatically came with a copy of the vendor’s catalog – an unnecessary use of paper. At another step, the group realized that students choose to print more docu-ments because their laptops are cumber-some, or because some professors forbid laptops in class.
Each source of waste was addressed with ideas to solve the problem, and all told, the group came up with almost 100 improvement opportunities in just one afternoon. For example, paper-saving ideas ranged from the common (double-sided printing) to the unusual and unique (use the monitor settings employed by journalists to ease eye strain when reading from a screen). Th ese ideas were ranked by their impact on the campus carbon footprint, and on the diffi culty of imple-mentation, resulting in a helpful list of high-impact, low-diffi culty options for the Climate Action Plan.
By engaging a diverse group of stake-holders in the planning phase, each idea was reviewed with scrutiny and creativity, allowing only the viable options to sur-face. With such broad understanding and buy-in, these carbon abatement opportu-nities have a strong potential for adoption and success.
Only the highest impact solutions are described in this Climate Action Plan, but scores of others will allow for continuous improvement in a variety of UNC’s business processes. In the future, UNC can apply a Lean approach to other aspects of its operation to reduce waste and shrink the campus carbon footprint.
For more information, visit:
http://climate.unc.edu/leanTh e Kaizen team collaborates on a Value Stream Map for computers.4.

ized” cost per ton of carbon abatement. Levelized cost is the present value of any additional capital or operating costs re-quired by a project over its economic life, divided into equal payments for each ton of carbon that the project saves.
An abatement curve (Figure 4) can be used to visualize and compare both the levelized costs and carbon abatement of each option. Each project is represented by a rectangle: the height shows the level-ized cost (expressed as dollars per ton of carbon savings) while the width shows the average annual carbon savings over a project’s life (expressed as thousands of tons of carbon equivalent). Items extend-ing below zero on the levelized cost axis represent an opportunity for both carbon mitigation and cost savings. Note that the calculation of levelized costs in Figure 4 do not take into account the eff ect that greenhouse gas regulation or a cap and trade market may have on the University’s operating costs. Th ese additional costs or savings are shown in Figure 6.
Near-Term Portfolio
Wedge groups identifi ed seventeen carbon abatement measures that could be implemented in the near-term. Fifteen of these measures result in savings or cost-avoidance without attributing any cost to greenhouse gases resulting from carbon regulation. Th ese include projects like PC power management, chiller effi ciency improvements, and improved teleconfer-encing facilities to reduce the need for air travel (Table 2).
Two additional strategies were selected to fi ll out the near-term portfolio based on the University’s expectation that federal climate change legislation will place an economy-wide price on greenhouse gas emissions.
Th e fi rst is a landfi ll gas (LFG) capture and destruction project. Th e University
MTCDE per year. Th is exceeds the IPCC’s Category I scenario and ensures that the University is playing its part in the global eff ort to mitigate the eff ects of climate change. Cli-mate action planning and portfolio optimization focused on meeting these reduction goals and ensuring that the suite of projects held emis-sions below the emission target line.
If the University achieves its target reductions, emissions should decrease to year 2000 levels by 2020, a mean-ingful milestone goal, and a savings of over 300,000 metric tons com-pared to the business as usual case. Coupled with further construction, building emissions intensity will drop to 18 MTCDE/1,000 Square Feet, a reduction of over 45 percent.
Project Selection One way to prioritize alternative carbon abatement projects is to rank them based on the cost per ton of carbon reduction, giving priority to projects that off er the best value. Th is approach re-quires a method for assuring comparabil-ity among projects over long and varying time frames.
A widely used approach for compari-son is to calculate each project’s “level-
Projection
Campus greenhouse gas emissions will grow dramatically over the next 40 years if the University continues with business-as-usual (Figure 3).
Emissions are expected to remain under 600,000 MTCDE until 2012, when the University begins construc-tion of Carolina North, a new satellite campus located just over a mile north of the main campus. Th is construc-tion pushes the carbon footprint past 700,000 MTCDE, where it continues to increase over the duration of the time frame.
Target and Milestones
Th e Intergovernmental Panel on Climate Change (IPCC) established a series of stabilization scenarios, describing the long-term equilibrium of global temperature that result from carbon mitigation programs. Cat-egory I, their most aggressive scenario, calls for CO
2 emissions that peak by
2015 and decrease by 50-80 percent of 2000 levels by mid century.
Th e black dotted line on the pro-jection shows the University’s target for GHG reductions – a straight line to carbon neutrality in 2050, repre-senting a reduction of almost 15,000
Figure 3. GHG EmissionsProjection and Target
Emissions will rise if the University con-tinues with business as usual, but achiev-ing climate neutrality by 2050 sets a path to reach year 2000 emissions by 2020.
5.
1,000
600
800
400
200
2000 2010 2020 2030 2040 2050
Year 2000 Emissions
Business as Usual
Emissions Target

Lev
eliz
ed C
ost
(Sav
ings
) p
er M
TC
DE
<($200)
($100)
$0
0 100 200
Reduced Business TravelDuplex Printing
20% Coal Substitute
Heat Recovery ChillersPhases 1 & 2
Behavioral Initiatives
Green Building:Main Campus
Low-Cost EnergyConservationMeasures
Commuter ProgramCommercial Mail Management
Computer Standby
Gre
en B
uild
ing:
C
arol
ina N
orth
Cam
pus F
leet
Figure 4. Near-Term Abatement OpportunitiesRanking projects based on levelized cost of each ton of carbon reduc-tion shows that energy and operational effi ciency are fi nancially sound opportunities for carbon abatement.
Table 2. Near-Term PortfolioSeventeen strategies can be implemented in the near-term to help UNC meet its GHG reduction targets.
Th in Clients Utilize low-energy, longer lasting web-based computers for libraries and other applications
Business Travel Improve teleconferencing facilities to decrease air travel
Duplex Printing Make double-sided printing the default for campus printers
Behavioral Initiatives Outreach and training to encourage occupants in energy savings
Computer Standby Manage computer sleep and standby modes for campus computers
Low-Cost ECMs Improve energy effi ciency in existing buildings using low-cost Energy Conservation Measures
Commuter Travel Avoided parking construction and increased public transportation (light rail)
Commercial Mail Reduce the amount of junk mail or undeliverable mail sent to campus
Green Building Adhere to NC Senate Bill 668 energy effi ciency requirements (30% below ASHRAE standards)
Vehicle Fleet Increase fuel effi ciency of campus fl eet based on CAFÉ standards
Composting Extend composting to additional campus dining facilities
Chiller Effi ciency Th ree projects to replace or upgrade chillers to more effi cient models
Heat Recovery Chillers Capture heat from chiller condensing unit for HVAC use, rather than venting to a cooling tower
Landfi ll Gas Capture and combust landfi ll methane
20% Coal Substitute Replace 20% of coal with torrefi ed wood in cogeneration boilers
6.

has entered into a contract with Orange County to purchase all the gas from the landfi ll that serves the region, slated to close in 2011. Th e LFG project will provide carbon off sets through methane destruction in its early years, to be fol-lowed by electricity generation during the development of Carolina North.
Th e second additional strategy in the base portfolio is a fuel switching op-portunity. Th e cogeneration facility on Cameron Avenue utilizes two circulat-ing fl uidized bed boilers, fi red primar-ily with bituminous coal. As part of a comprehensive study of renewable energy opportunities, the Energy Services De-partment has identifi ed torrefi ed wood, a charcoal-like biomass, as an alternative to off set the use of coal in these boilers. Commercial sources for torrefi ed wood are currently under development, and the University is beginning tests to ensure compatibility with existing equipment. Th e proposed strategy involves co-fi ring coal with torrefi ed wood or another coal substitute in an 80:20 percent ratio.
A time-series, or “Wedge Diagram” (Figure 5), shows how each project impacts the university’s carbon footprint over its lifetime. Each strategy, when overlaid on carbon emissions growth, carves a stabilization wedge and moves the University toward its goal of climate neutrality. Of particular note is a large wedge labeled “Electrical Grid” which represents Duke Energy’s work to reduce the emissions intensity of grid-connected power plants. As the utility expands the proportion of nuclear and renewable energy sources, the campus’s Scope 2 emissions are decreased in turn.
Th e landfi ll methane capture and destruction project, slated to come online in 2011, will generate registered carbon off sets that the university may retire or bank depending on their fi nancial value or regulatory requirements under a carbon cap-and-trade program. In Figure 5, the model shows a scenario in which the off sets are banked and saved until they can be applied to achieve the University’s carbon reduction goals.
Figure 5. Near-term Wedge Diagram
A portfolio of 17 projects may be imple-mented in the near term to reduce UNC’s carbon footprint to year 2000 levels by 2020. Further carbon abatement will come from additional projects to be de-veloped in the future. As a last resort, carbon off sets may be used to achieve the goal of climate neutrality. An interac-tive version of this chart may be found at http://climate.unc.edu/portfolio.
7.
200
400
600
800
1,000
205020402030202020102000
Electrical Grid
Low Cost ECMs
Green Building: Main Campus
20 Percent Coal SubstituteHeat Recovery Chillers
Gas
Neutrality by 2050
2000 Emissions by 2020
Future Projects

Figure 6. Long-term Abatement Opportunities
To learn more about individual carbon reduction projects, or to see alternative portfolios, visit
http://climate.unc.edu/Portfolio
A. Biomass Gasifi cation at Carolina North (CN)B. 100% Coal SubstituteC. 50% Coal SubstituteD. Plasma Gasifi cation of MSW - SyngasE. Shops and Informal Contract RecyclingF. 50% Natural Gas, 50% Coal SubstituteG. Plasma Gasifi cation of MSW: Syngas + Natural GasH. 50% Natural Gas
Figure 6. Long-term Abatement Opportunities
Near-term project allow the University to meet its climate goals through 2025. After that, additional opportunities for fuel switching and energy effi ciency will be options for a long-term portfolio. Th ough there is a substantial cost for many of these strategies, carbon cap and trade may provide the incentive to meet aggressive reduction targets. Project price under cap and trade is indicated by the grey dashed line.
Mid- to Long-term Portfolio
Th e near-term alternatives will allow the University to meet its interim mile-stones through about 2025, after which additional projects will be required. Due to the uncertain nature of technology and fi nancing twenty years in the future, the project team developed a number of alternative scenarios for additional carbon abatement.
In the mid- to long-term time frame, solar thermal panels, heat recovery chill-ers and a biomass gasifi cation plant are options for the Carolina North campus to ensure further campus development does not defeat the University’s carbon
abatement goals. In addition, a group of energy conservation measures with higher capital costs will become fi nancially viable as energy and carbon prices rise. Th ese strategies form a basis (called Long-Term Common in Figure 7) for four alternative energy scenarios.
Th e fi rst scenario replaces coal genera-tion with a mixture of natural gas and a biogenic coal substitute. Th is strategy is appealing due to its reliance on existing technology, but it maintains the use of a fossil fuel with the associated carbon emissions.
Th e second scenario replaces coal entirely with torrefi ed wood or some
I. Biomass Gasifi cation w/ Biochar Production (CN)J.Energy Conservation (Mid-High Investment)K. Large Scale BiomassL. Biomass Gasifi cation at CN (Phase II)M.Solar Th ermal (CN)N. Solar Th ermal to Electricity (Troughs) (CN)O. Solar Th ermal to Electricity (Dish Sterling) (CN)P. Demo Scale Concentrating Solar PV (CN)
8.
Lev
eliz
ed C
ost
(Sav
ings
) p
er M
TC
DE
ANear-Term Portfolio
B CD
FG
HI J
K
L
MNOP
E
$0
$100
>$150
$50
($50)
($100)
($150)
<($200)
Levelized CostUnder CarbonCap and Trade
Scale
100,000MTCDE

other substitute. While using a biomass is carbon neutral, there is signifi cant un-certainty surrounding the availability and pricing of these fuels.
Th e third scenario implements a tech-nology known as plasma gasifi cation that uses an electrical arc to literally vaporize municipal solid waste, releasing a combus-tible hydrocarbon gas. Th is biogas would then be blended with natural gas for use in a boiler. Th e added benefi t of plasma gasifi cation is its ability to deal with solid waste management in an age of overfl ow-ing landfi lls.
Th e fourth, and fi nal, scenario proposes the construction of a large-scale biomass gasifi cation plant to replace the cogenera-tion facility at the end of its useful life. Boilers at the Cameron plant are expected to last another 30 years, placing construc-tion of the biomass plant in the 2040 time frame. While it would make a signifi cant impact on the campus carbon footprint at inception, it leaves a gap both before and after construction in which the University would exceed its interim abatement goals.
In the scenarios above, carbon off sets generated by the University’s landfi ll gas project are saved until they can be applied toward a target shortfall (dark grey). Any remaining emissions (light grey) must be abated with additional projects, or be covered by carbon off sets. Th ese off sets could either be purchased on the mar-ket, or be developed through renewable energy or methane destruction projects in the region.
Th ese strategies demonstrate that it is possible to achieve climate neutrality through the use of existing technologies, but they will require further study. Th eir feasibility will be evaluated against newly emerged technologies every fi ve years as part of the CAP process to ensure that the best alternatives are chosen at every step.
Outreach
Th e University’s responsibility for understanding and mitigating climate change cannot be confi ned by campus
boundaries, but extends to the commu-nity, the state, and beyond. Th erefore, our advances and understanding of climate issues must be shared widely through outreach, curriculum, and research.
Off erings like the Climate Leader-ship and Energy Awareness Program (Climate LEAP) seek to engage young people in an interactive dialogue about climate change. High school students spend a week exploring the science and solutions of climate change through hands-on activities like energy monitor-ing and climate portfolio optimization, preparing them for careers in science, mathematics, and policy. (See sidebar for links to further information.)
For many years, the towns of Cha-pel Hill, Carrboro and the University have partnered on climate-conscious endeavors. Th e three share the cost of a regional mass-transit system, and off er fare-free rides across the community. Th ey also maintain a system of park-and-ride lots that reduce congestion downtown. Chapel Hill and UNC have
50% Natural Gas50% Coal Substitute 100% Coal Substitute
Plasma Gasifi cationof Municipal Solid Waste
Large ScaleBiomass Plant
Figure 7. Long-term Alternative Wedge Diagram
Four alternative scenarios build on the near-term portfolio to further reduce greenhouse gas emissions. Th e diff erence between emission reductions and the 2050 goal may be met with carbon off sets.
9.
Near-Term Portfolio Long-Term CommonLong-Term Alternative
LFG Banked Off setsAdditional Projects
0
200
400
600
800
1,000
205020402030202020100
200
400
600
800
1,000
20502040203020202010
0
200
400
600
800
1,000
205020402030202020100
200
400
600
800
1,000
20502040203020202010

both committed to a path of carbon reduction, and work toward that end through operational improvements, outreach, and community education events. Recently, a joint town and Uni-versity working group has developed an innovative new development agreement for the Carolina North campus. Th is agreement includes standards for energy use, water consumption, transportation, and GHG emission targets.
Curriculum A study of UNC’s class off erings re-cently identifi ed more than 300 sus-tainability-related courses. Conducted by capstone students in environmental studies, the eff ort included surveys of academic departments and searches of the course bulletin and departmental websites. Classes off ered were primar-ily in the College of Arts and Sciences, though several graduate and professional schools, including Business, Journal-ism and Mass Communications, Public Health, and Social Work have also introduced sustainability into their cur-ricula.
A new sustainability minor, intro-duced in 2008, off ers courses in environ-mental science, business, public policy, and planning.
Local businesses partner with students from the UNC Institute for the Envi-ronment through senior capstone proj-ects. Clients begin by posing a ques-tion: “Is my product packaging carbon intensive?” or, “How can I communicate energy use to apartment dwellers?” Businesses get the answers they need to understand complex environmental topics, while students get real-world experience in project management, carbon accounting, and working with a client. Recent capstones have explored the carbon intensity of the local transit system, University air travel, and campus dining services.
Research Th e University remains a source for scholarship and advanced research. A study recently requested by the NC General Assembly explored the feasibil-ity of installing off shore wind power in North Carolina waters. Th e study
examined the impacts of power gen-eration on fi sh and wildlife, cultural sites, and military airspace, pinpointing the areas with strong wind resources and stable geological structure. Th e General Assembly has appropriated additional funds to continue the study, and requested a contract for three pilot turbines that can be installed off the North Carolina coast.
In 2008, the Solar Energy Research Center was launched by the Chemistry Department and in fall 2009, it became one of 46 Energy Frontier Research Centers funded by the U.S. Department of Energy and American Recovery and Reinvestment Act. $17.5 million over fi ve years will support 30 postdoctoral fellows and graduate students. Research will focus on solar fuels catalysis, de-velopment of hybrid materials, organic photovoltaics, and advanced spectros-copy and theory.
UNC’s Institute for the Environment serves as a hub for multidisciplinary environmental research across campus. Faculty and staff in the Institute’s fi ve research centers partner with others at UNC to fi nd comprehensive solutions to pressing environmental problems. For example, Th e Center for Sustainable Energy, Environment and Economic Development explores energy issues facing the state, nation, and world. Researchers examine the rationale and consequences of various energy choices and the feasibility of alternative and nuclear energy sources.
Many more examples of UNC’s climate-focused outreach, curriculum, and research off erings can be found in the University’s Sustainability Report at:
http://sustainability.unc.edu
Tracking
Because carbon emissions are spread throughout the University, abatement opportunities are distributed among the various departments and academic units, each reporting along a separate chain of command. To manage a project of this scale and diversity without direct mana-gerial control requires a tracking mecha-nism with both clarity and transparency.
A3, a strategic tool named for its
ClimateLEAP
http://climateleap.unc.edu/
Chapel Hill Transit
http://tinyurl.com/CHTransit
Commuter Alternatives Program
http://tinyurl.com/UNCcommute
Carolina North
http://cn.unc.edu/
UNC’s Sustainability Classes
http://tinyurl.com/UNCClass
UNC Sustainability Minor
http://cf.unc.edu/ecology/sustainability_minor.cfm
Environmental Capstones
http://www.ie.unc.edu/content/education/courses/capstone.cfm
Institute for the Environment
http://www.ie.unc.edu/
NC Coastal Wind Study
http://www.climate.unc.edu/coastal-wind
Solar Energy Research Center
http://www.serc.unc.edu/
On the Web
10.

ing the current state of the organization. For UNC, the climate action plan is a response to our commitment as outlined in the ACUPCC, as well as a recogni-tion that carbon legislation will aff ect our business in profound ways. We are developing the plan to prepare for those changes.
We recognized that emissions have grown by an average of four percent per year, culminating in the most recent car-bon footprint of 570,000 MTCDE in the 2008 calendar year. At the same time, we
are setting the goal of achieving climate neutrality, and will target emissions reduc-tions of almost 15,000 MTCDE per year.
Th e A3 process includes some analysis about our largest emission sources, serving to focus our eff orts on the high-impact targets for GHG reduction. Each of our projects should address these emission sources in some measurable way.
Countermeasures describe the proj-ects and programs we will implement to achieve our goal of carbon reduction. Each countermeasure must address a
Emissions Analysis
Version:
By Building TypeAdmin/Class2.9M GSF
Lab/Mix4.1M GSF
Residence3.2M GSF
Support6.8M GSF
Heating Cooling Electricity
Goal
2009-2012
By Demand By Top 3 Energy Sources
Fiscal Year
Prepared by: Arneman
0
50,000
100,000
150,000
7 8 9 7 8 9 7 8 9 7 8 9
MTC
DE
570,000 MTCDE
0
300
600
0
20
40
60
80
100
% C
hang
e
Thou
sand
MTC
DE
200820062004200220001998
540,000 MTCDE in 2012
0
200
400
600
800
Goal
Business As Usual
202520202015201020052000
0 250 500Waste Management
Landscaping
Vehicle Fleet
Air Travel
Fugitive Emissions
Commuting
Building Energy
0
100
200
300
400
kWh
Gasoline
Coal
200820062004200220001998
Thou
sand
MTC
DE
Building energy accounts for 90% of campus carbon emissions.
In 2008, 63% of emissions were due to coal combus-tion. Another 25% came from electricity purchases.
Though only a fraction of the total space, laboratory buildings account for a growing proportion of energy use and carbon emissions
Thousand MTCDE
August 2009
Figure 8.
Climate Action Plan A3 ReportTh is simple report gives stakeholders a quick understanding of the project back-ground, goals, plans and results - all in a single page.
use of A3 sized paper, provides a helpful framework for planning, communicating, and implementing a strategy or improve-ment program. It focuses on telling a project’s story in a single page, which helps to promote a fundamental understand-ing of the project outcomes and methods. Th rough collaboration on the A3 process, team members work to build consensus, aligning eff orts and resources toward a common goal.
A3 begins by exploring the reasons for embarking on the project and by identify-

Leading Indicators
Unresolved Issues OwnerD ue
Energy Sales2009 Sales2008 Trend
Solid Waste
Countermea suresIssue Countermeasure Outcome Owner DueBuilding Energy Decreased Energy Sales 09-2009
Create monthly carbon emission report Feedback D. Arneman 10-2009
Monitor and record CO2 emissions at stack Feedback T. Aucoin 01-2010
Waste Management P. Barner 03-2010
Energy Source: Coal Decreased Emissions P. Barner 05-2010
Energy Source: kWh Electricity Savings J. McAdam 2012
Plan
ExecuteVerify
Complete
Chilled Water
Electricity
LP SteamDecJulJan
0
100000
200000
300000
400000
DecAugJan
DecAugJan
Fuel Use
MM
BTU
Estimated GHG Emissions
20082009
MTC
DE
0 1000 2000 3000 4000 5000 6000
YTD Tons (Jun-FY09)
Chiller Refrigerant Use
Legend
Last YearTo Date
Last YearTotal
CurrentYear To Date
0 500 1,000 1,500 2,000
R-11
YTD Lbs (Aug-CY09)05 ,000 10,000 15,000 20,000
R-134A
0 250 500 750 1000
Etc.....
R-22
30%
-30%
Recycled
stated need or emission source, and the A3 report identifi es an individual who will be accountable for its progress and sets a deadline for completion. Th e status of each project will be updated monthly so that stakeholders can mark progress and respond to delays or mitigating circum-stances.
Under the countermeasures lies a series of “leading indicators.” Th ese metrics were designed by the group to provide frequent feedback on the university’s progress as each countermeasure is implemented,
rather than waiting for a single, yearly carbon inventory update. By designing in-dicators with suffi cient granularity, we will be able to measure and verify the eff ects of each countermeasure as it is implemented.
Finally, the A3 process includes a plan for dealing with outstanding issues. If project managers encounter problems or changing circumstances, they will be documented in this area for escalation or further study.
Th e sample report below describes a three year period, recognizing that many
projects would not fi t within a shorter time frame, and that longer time periods add uncertainty to the number and types of projects the University can complete. Th e A3 process ensures that this will be a living document, as the background, conditions, and goals will be reassessed periodically to identify new countermea-sures over time. In this way, the Climate Action Plan can adapt to changing condi-tions, allowing it to meet the demands of accountability and transparency over the life of a forty-year project.

Project Team
Steering Committee
Carolyn Elfl andAssociate Vice Chancellor, Campus Services
Van DobsonAssistant Vice Chancellor, Facilities Services
Ray DuBoseDirector, Energy Services
Mary Beth KozaDirector, Environment, Health & Safety
Anna WuDirector, Facilities Planning and University Architect
Project Managers
Daniel ArnemanEnvironmental Specialist,Energy Services
Jerry SchuettAffi liated Engineers, Inc.
Consultants
Affi liated Engineers, Inc.
Energy Strategies, LLC
Haley & Aldrich, Inc.
Martin / Alexiou /Bryson, PLLC
Wedge Group Leaders
Phil BarnerManager, Cogeneration SystemsEnergy Supply
Diane GillisArchitect, Facilities PlanningGreen Building
Claire KaneTransportation Demand ManagerTransportation
Christopher MartinDirector, Energy ManagementEnergy Conservation - Technical
Cindy SheaDirector, Sustainability Offi ceEnergy Conservation - Behavior
B.J. Tipton and Sarah MyersOffi ce of Waste Reduction and RecyclingPurchasing-Recycling
Team Members and ContributorsGeorge Alexiou
Sue Boyle
Jeff Burks
Brian Cain
John Carter
Raymond Decristofaro
Kimberly Eke
Mike Emrick
Paul Erickson
Justin Farr
Nathaniel Grier
Nate Haines
Lea Holt
Warren Jochem
Aidan Kostenko
John Laetz
Bernard Law
Chris Lazinski
William Lowery
Steve MacIntyre
Joseph Marranca
Emily Martin
John Masson
James McAdam
Melissa McEwen
Robert McKenna
Kelly Meade
Mary Jane Nirdlinger
Jessica O’Hara
Martha Pendergrass
Matt Peretin
Amy Preble
Dustin Schubert
Nick Travis
Stan Wrzeski
Written by: Daniel Arneman
Graphs and Images by: Robert McKenna and Daniel Arneman
Cover Design: Rex Zachary
Cover Images:
“Old Well” by Dan Sears
“Student Bicycling Across Campus” by Dan Sears
“Sarah Stoneking Holds a Fabricated Solar Cell” by Dan Sears
“Campus Recycle Bins” by Steve Exum