Embed Size (px)
Citation preview

Prepared by Quantum Market Research for the Insurance Council of Australia
October 2013
The Understand Insurance Research Report

Background to this report
Page 2
The Understand Insurance Research Report October 2013
To better understand consumer attitudes around general insurance, the Insurance Council of Australia (ICA) commissioned Quantum Market Research to conduct a
national online survey of more than 900 people.
The results of the survey form a key part of Understand Insurance, the ICA’s national consumer campaign aimed at empowering consumers to make better,
more informed decisions by demystifying insurance.
The research project focussed on uncovering attitudes towards insurance, underinsurance and non-insurance.

Research methodology & sampling
Page 3
The Understand Insurance Research Report October 2013
• n=917 Homeowners & Renters appropriate for contents insurance.
• n=657 Homeowners appropriate for building insurance.
• Homeowners/renters were screened to ensure the sample included:
• A nationally representative split of different age groups.
• A nationally representative split of different regions around Australia.
• Respondents were asked to complete a short (10–12 minute) online survey. They were sourced from lists of Australians who have agreed to take part in online market research. These lists undergo careful quality control to ensure participants represent the wider community.
N.b. building & contents combined insurance is denoted using this icon.

Sections of this report
Page 4
The Understand Insurance Research Report October 2013
Underinsurance
Non-insurance
Understanding of insurance
Additional data
Summary of key findings
Summary of key findings
Page 5

Top 10 findings from this research:
Page 6
The Understand Insurance Research Report October 2013
1. More than four in five Australian homeowners and renters (83%) are underinsured for their home and contents.
2. One in 25 Australian homeowners has an uninsured property.
3. 7% of homeowners and 63% of renters do not have contents insurance.
4. A third of Australians risk underinsurance by not updating their contents policy to cover new possessions.
5. Up to a quarter of Australians are knowingly unsure about what’s covered under their home insurance.
6. 18% of men think not having contents insurance wouldn’t affect them at all (compared with 8% of women).
7. Australians risk underinsurance by consistently selecting their policy based on low cost rather than adequate
coverage.
8. In most cases, buildings (40%) and contents (68%) are insured according to householder evaluations.
9. Of homeowners who live in an area known for high fire danger, 14% are unsure whether their building insurance
covers them against bushfires.
10. Of homeowners who live in an area with known flood risk, 23% are unsure whether their building insurance covers
them against flooding.

Underinsurance
Page 7

The overall prevalence of underinsurance
Page 8
The Understand Insurance Research Report October 2013
19% Be much worse
off and really suffer
Q16 Base: n=917 Homeowners/Renters
“In a total loss scenario*, where I had to claim back my property and possessions from insurance, I would...”
34% Be worse off and suffer quite a bit
30% Be worse off but not really suffer
17% Resume at least
the same standard of living I have
now
83% of homeowners/renters are underinsured
*n.b. Respondents were asked to exclude sentimental items and only consider their change in standard of living as a consequence of losing uninsured property/possessions.
• If we define underinsurance as ‘any person who cannot resume their same standard of living in the event of a crisis’, then 83% of homeowners/renters could be considered underinsured.
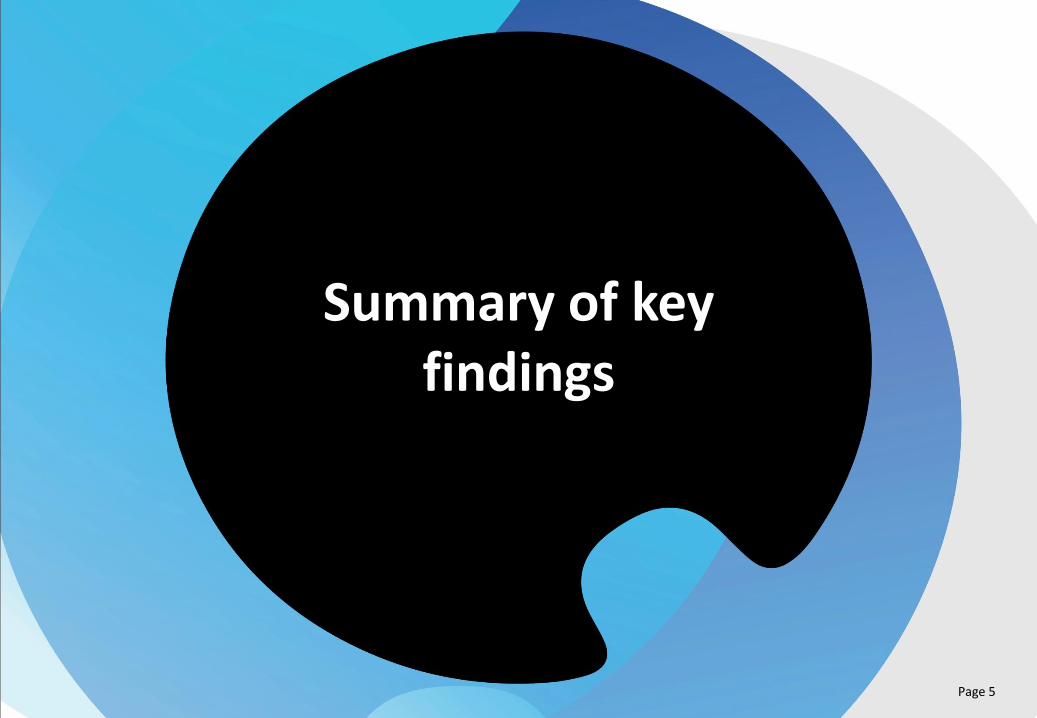
In most cases, buildings and contents are insured according to the householder’s evaluations
Page 9
The Understand Insurance Research Report October 2013
40%
24% 20%
10%
Own estimate
Insurer's guidance
Professional valuation
Purchase price
Q14a Base: n=606 Homeowners with building insurance
Q14b Base: n=694 Homeowners/Renters with contents insurance
68%
17% 9%
4%
Own estimate
Insurer's guidance
Professional valuation
Purchase price
10% Deliberately
underestimated the value to lower their premium
9% Deliberately
underestimated the value to lower their premium
Q14aa Base: n=241 Those who estimated their own building valuation
Q14ba Base: n=465 Those who estimated their own
contents valuation
Source of building insurance valuation: Source of contents insurance valuation:

In a high proportion of cases, insurance customers are neglecting important criteria when selecting their policy
Page 10
The Understand Insurance Research Report October 2013
Q15ax – Q15ab Base: Those with insurance
Factors which weren’t considered at all:
(% of cases)
33% 39% 35%
36% 42% 34%
46% 52% 51%
55% 59% 54%
n=494 n=112 n=200
Excess
Insurer’s reputation
Exclusions
T & Cs (PDS)
• Older Australians (mature singles/couples) are more likely than younger (young singles/couples/young families) to consider ‘excess’ among the decision criteria.

Rather, at the expense of practical implications (such as policy exclusions), cost is driving choice of insurance
Page 11
The Understand Insurance Research Report October 2013
Q15ax – Q15ab Base: Those with insurance who had at least one decision criteria
Primary deciding factor: (% of cases)
Price (36%)
Exclusions (22%)
Insurer’s reputation (15%)
Price (34%)
Insurer’s reputation (20%)
Exclusions (20%)
Price (33%)
Exclusions (21%)
Insurer’s reputation (20%)
n=483 n=104 n=192
• Price is consistently ranked highest across all demographics, however:
– The poorest (lowest value household assets) are significantly more likely to rank ‘price’ highest.
– The oldest generation (65+) is significantly more likely to consider ‘insurer’s reputation’ as the primary deciding factor.
– This could be because they were more likely to have made a claim/had a bad experience during their lives. Or because they tend to be cynical toward gimmicks.

Non-insurance
Page 12

4%
Of homeowners don’t have building insurance
Non-insurance is worryingly common among Australian homeowners/renters
Page 13
The Understand Insurance Research Report October 2013
Note: n=23 homeowners who said they are ‘covered by body corporate’ for building cover are not shown here.
7%
Of homeowners don’t have contents insurance
63%
Of renters don’t have contents insurance
Homeowners: n=657 Renters: n=260

Understanding of insurance
Page 14

A third of Australians risk underinsurance by not updating their contents policy to cover new possessions
Page 15
The Understand Insurance Research Report October 2013
15% 19%
44% 49%
37% 29%
4% 3%
Strongly agree
Somewhat agree
Whenever I buy something new of value, I ensure it’s covered by my contents policy:
n=494 n=200
Somewhat disagree
Strongly disagree
Q18x/b Base: Those with insurance
• Neglecting to ensure contents insurance is kept up to date is consistently prevalent across all demographics.
– However, the oldest generation (65+) is somewhat more likely to be on top of things.

In many cases, across the board, policy documents are not read in detail
Page 16
The Understand Insurance Research Report October 2013
9% 12% 14%
46% 43% 45%
37% 36% 35%
8% 9% 6%
I read every detail of the policy document:
n=494 n=112 n=200 Q18x-b Base: Those with insurance
• Surprisingly, all demographics, both young and old, are equally likely not to read their insurance policy in detail.
Strongly agree
Somewhat agree
Somewhat disagree
Strongly disagree

As many as one in five Australians don’t seek clarity when their policy is unclear
Page 17
The Understand Insurance Research Report October 2013
22% 28% 29%
59% 56% 57%
16% 13% 12% 3% 3% 2%
When in doubt, I clarify policy details:
n=494 n=112 n=200 Q18x-b Base: Those with insurance
• Older Australians and those who live regionally are more likely to seek clarity than the younger generation and urban dwellers.
• Failing to seek clarity is fairly consistent across all types of insurance, suggesting some people aren’t seeking clarity no matter what’s at stake.
Strongly agree
Somewhat agree
Somewhat disagree
Strongly disagree

Up to a quarter of Australians are knowingly unsure about what’s covered under their home insurance
Page 18
The Understand Insurance Research Report October 2013
14% 26% 25%
60%
51% 55%
22% 20% 18%
4% 3% 2%
I’m clear on what’s covered by my insurance:
n=494 n=112 n=200 Q18x-b Base: Those with insurance
• When building and contents are combined in one policy, Australians are less likely to be clear on what’s covered than if they’re covered by separate policies.
– By increasing complexity, Australians increase their risk of being unknowingly underinsured.
Strongly agree
Somewhat agree
Somewhat disagree
Strongly disagree
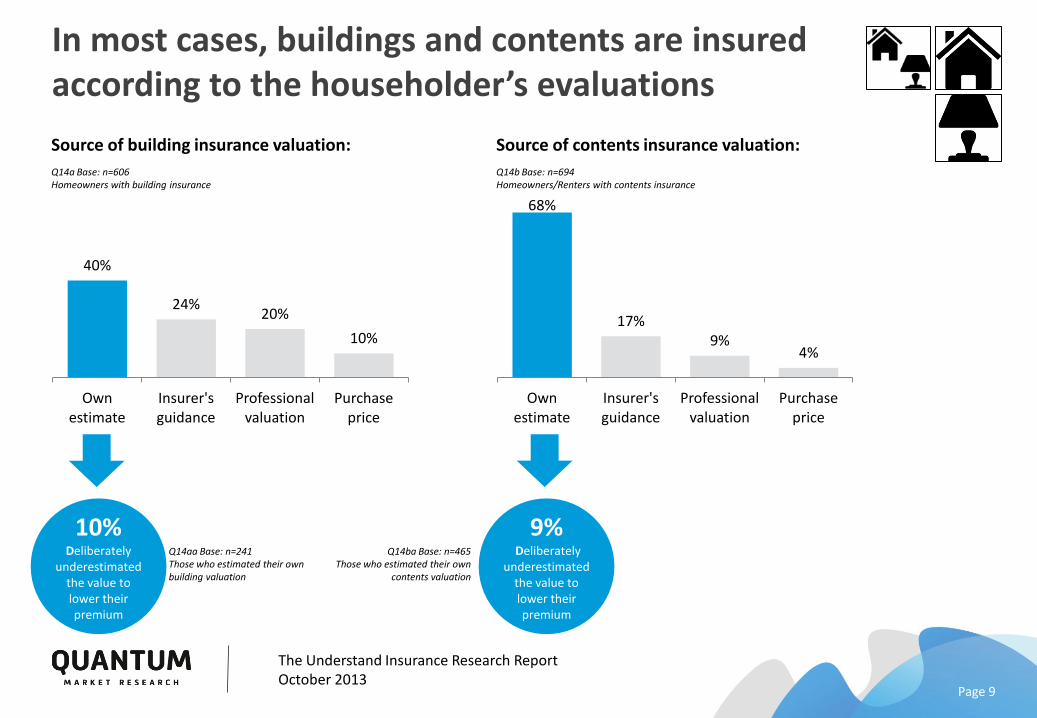
Many Australians are uncertain about specific exclusions from their building insurance policy
Page 19
The Understand Insurance Research Report October 2013
Which damages are covered by your building insurance?
Q19 Base: n=606 Those with building insurance
58%
45%
37%
35%
29%
27%
26%
26%
22%
22%
Terrorism
Earthquake
Flooding
Lightning strike
Fixtures and fittings
Vandalism
Bushfire
Accidental water damage
Cyclones/storms
Accidental fire
• Natural hazards cause the most confusion. More than a third of Australians are uncertain whether they’re covered against flooding/lightning strike.
• About a quarter of Australians are unsure whether their building is covered against water/storm/fire damage.
• Regional Australians tend to have fewer uncertainties about their insurance coverage than do urban dwellers.
% who are ‘unsure’

Queenslanders significantly more likely to be sure what is covered by their building insurance
Page 20
The Understand Insurance Research Report October 2013
Which damages are covered by your building insurance?
Q19 Base: Those with building insurance
NSW (%)
(n=184)
VIC (%)
(n=157)
QLD (%)
(n=118)
WA (%)
(n=61)
SA (%)
(n=54)
Terrorism 61 61 53 62 59
Earthquake 47 48 48 44 28
Flooding 36 46 18 33 39
Lightning strike 39 42 30 30 44
Fixtures and fittings 29 34 22 13 30
Vandalism 30 34 30 23 20
Bushfire 29 33 19 21 24
Accidental water damage 26 31 25 25 20
Cyclones/storms 27 29 13 16 22
Accidental fire 22 24 24 13 17
Indicates significantly less likely than other states to be unsure about coverage.

Summary of at-risk homeowners/renters
Page 21

Australians who live in at-risk areas ...
Page 22
The Understand Insurance Research Report October 2013
Q19 Base: n=65 Homeowners with building insurance who live in fire risk
Of homeowners who live in an area known
for high fire danger, 14% are unsure whether their building insurance covers them against
bushfires.
Q19 Base: n=40 Homeowners with building insurance who live in flood risk
Of homeowners who live in an area with
known flood risks, 23% are unsure whether their building insurance covers them against
flooding.
Q19 Base: n=71 Homeowners with building insurance who live in crime risk
Of homeowners who live in an area with high crime rates, 30% are unsure whether
their building insurance covers them against vandalism.
Q8 Base: n=71 Homeowners/Renters who live in crime risk
23% of homeowners/renters who live in an
area with high crime rates do not have contents insurance.
• Q20: Those who live in an area with ‘known fire risks’/‘known flood risks’/‘high crime rate’.

Financially insecure Australians...
Page 23
The Understand Insurance Research Report October 2013
Q15ax Base: n=136 Insecure homeowners with building/contents combined insurance
Are significantly more likely than average to select
their building/contents insurance based primarily on price – 44% chose their policy this way.
Q16 Base: Insecure homeowners (n=184)/renters (n=127)
Are somewhat less likely to believe they are adequately insured – only 16% of insecure
homeowners/13% of insecure renters perceive they could resume their standard of living in the event of
a crisis.
• Q20: Those who have ‘less than two months pay in savings’ and/or ‘Credit card debt more than two months pay’.

Young Australians (aged 18-29)...
Page 24
The Understand Insurance Research Report October 2013
• Q2: Those who are 18-29 years old.
Q17 Base: n=213 Young Australians (18-29) n=817 Older Australians (30+)
Young Australians are significantly more likely to feel non-insurance is acceptable:
• 28% think contents insurance is unnecessary if their home is safe from crime (vs. 13% of those 30+).
• 21% believe it’s acceptable to go without building insurance if in an area without natural disasters (vs. 9% of those 30+).

Additional data
Page 25

Uncertainty about what is/isn’t covered under building insurance
Page 26
The Understand Insurance Research Report October 2013
Which damages are covered by your building insurance?
Q19 Base: n=606 Those with building insurance
15%
45%
52%
60%
67%
68%
69%
71%
75%
77%
58%
45%
35%
37%
27%
29%
26%
26%
22%
22%
27%
10%
13%
3%
6%
3%
5%
3%
3%
1%
Definitely covered Unsure Definitely not covered
Terrorism
Earthquake
Flooding
Lightning strike
Fixtures and fittings
Vandalism
Bushfire
Accidental water damage
Cyclones/storms
Accidental fire

Significant differences by gender
Page 27
The Understand Insurance Research Report October 2013
Q11b & Q13 (Bases vary)
Men are significantly more likely to play down the worst case scenario of non-insurance.
• 18% think not having contents insurance ‘wouldn’t affect them at all’, (compared with 8% of women).
Q16 Base: n=398 Men n=632 Women
Women are significantly more likely to be financially
insecure. Almost a third (31%) of women have less than two months pay in savings, vs. Less than a quarter of men (24%).
Q17 Base: n=398 Men n=632 Women
Men are significantly more likely to feel non-insurance is acceptable:
• 22% think contents insurance is unnecessary if their home is safe from crime (vs. 13% of women).
• 16% believe it’s acceptable to go without building insurance if in an area without natural disasters (vs. 9% of women).