Embed Size (px)
Citation preview

The UK’s approach to Climate Change
AAAS, Seattle, 13 February 2004
David A Warrilow
Head of Science Policy, Department for Environment, Food and Rural
Affairs, UK
Overview
• Policy based on sound science
• UK Response –Mitigation and Adaptation
• Strategic Aspirations
• Challenges

Policy based on sound science
• Look to scientific evidence and risks - ensure it underpins policy
• Accept conclusions of IPCC
• Support research to reduce uncertainties
• Uncertainties no reason to defer actions
• Aim for international consensus view of problem

Evidence for climate change
• Observations- 0.6C warming over century- Cooling of stratosphere- 20 cm sea level rise- Glacial retreat, ecosystem effects
• Models show warming cannot be explained by natural causes
• Understanding of process• Physically based modelling predictions

GLOBAL TEMPERATURES 1861-2003

Human signal seen in climate change over North America, Asia and Europe (HC)
1900 20002000 19001900 2000Year Year Year

PATTERNS OF CHANGE IN SURFACE PRESSURE 1950-2000
Jamie Kettleborough, RAL, and Peter Stott, Hadley Centre

Heat-wave deaths in France,
August 2003 (SINERM 2003)
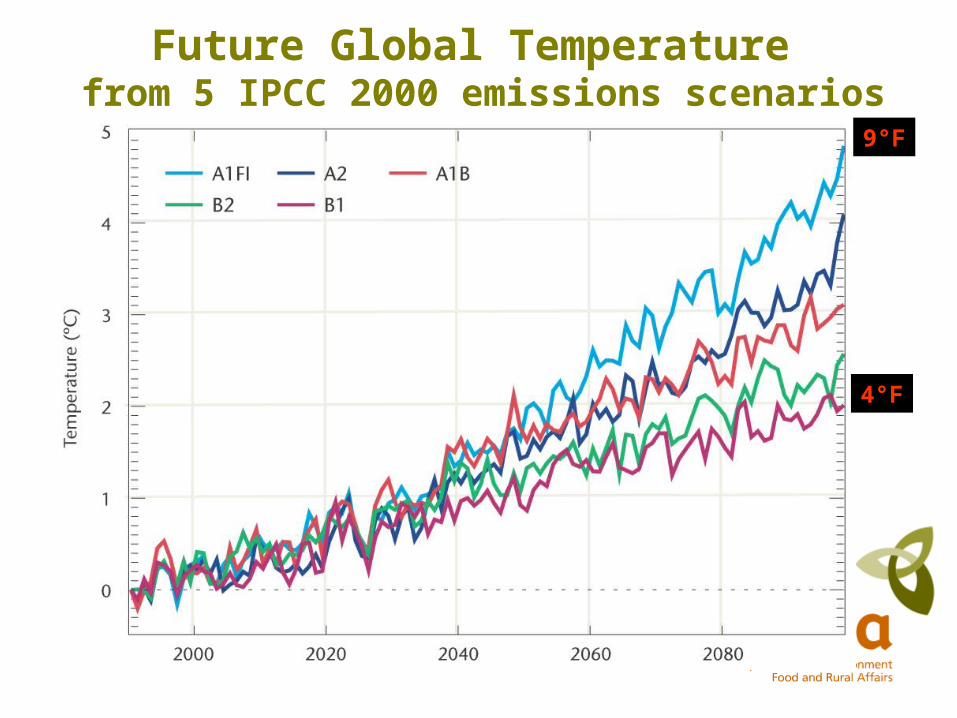
Future Global Temperature from 5 IPCC 2000 emissions scenarios
4°F
9°F

Increase in annual average temperature (IPCCA2) by the 2080s

Impacts on global agriculture by the 2080s

GLOBAL SEA LEVEL RISEfollowing stabilisation of greenhouse gas concentrations by 2100
Jason Lowe, Hadley Centre

Number of people at risk from coastal flooding by the 2080s

Responses – mitigation and adaptation
• Unrestrained climate change presents unacceptable risks
• Global control of greenhouse gas emissions essential to stabilise concentrations at a safe level
• Kyoto the first step• But some climate change is unavoidable
so essential to develop adaptation strategies (local)

Impacts and adaptation in the UK
• UK Climate Impacts Programme
• Development of adaptation strategies by Government Departments
• Case Studies
• Working with developing countries
• Assessment of global impacts and dangerous levels

Change in annual average daily temperature under a medium-high emissions scenario
0.0 1.0 4.02.0 3.0 °C
2020s 2050s 2080s

ScotlandLoss of biodiversityPoor housing stock
South West Tourism, water & fisheries
West MidlandsEffect on regenerationTransport disruption
North EastCoastal flooding
East of EnglandCoastal flooding Water shortages
Yorkshire & HumberCoastal flooding
East MidlandsRiver flooding followed by reduced river flows
South EastFlood risk & water resources
Northern IrelandSea routesMore arable farming?
WalesHeritage & agriculture
North WestUpland biodiversityIndustry
Greater stress on water resources by 2050

Probabilistic climate predictions
current position required position

Temperature change by 2070: Hadley Centre PRECIS model results for southern Asia
IPCC SRES A2 Scenario
Krishna Kumar,IndianInstitute ofTropicalMeteorology,Pune, India

Mitigation in the UK
• UK on track to meet Kyoto commitments and a domestic 20% target for CO2
• Comprehensive programme of policies and measures, including emissions trading
• Energy White Paper – long term view

UK GHG emissions 1990 – 2002
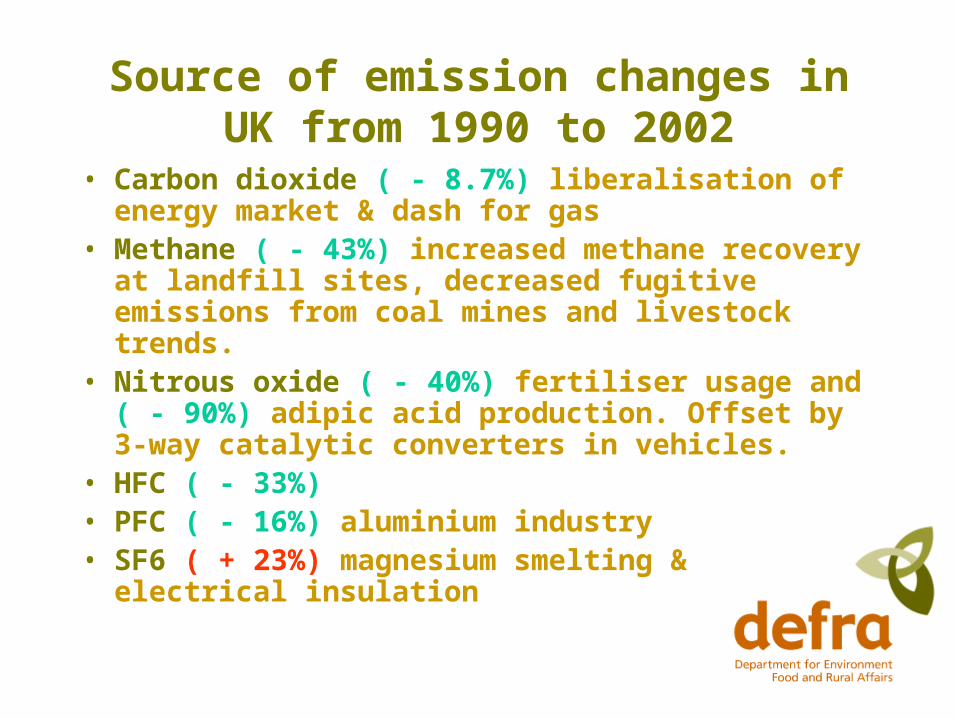
Source of emission changes in UK from 1990 to 2002
• Carbon dioxide ( - 8.7%) liberalisation of energy market & dash for gas
• Methane ( - 43%) increased methane recovery at landfill sites, decreased fugitive emissions from coal mines and livestock trends.
• Nitrous oxide ( - 40%) fertiliser usage and ( - 90%) adipic acid production. Offset by 3-way catalytic converters in vehicles.
• HFC ( - 33%) • PFC ( - 16%) aluminium industry • SF6 ( + 23%) magnesium smelting & electrical
insulation

Latest UK CO2 trends
100
110
120
130
140
150
160
170
1980 1990 2000 2010 2020 2030
MtC
/yr

Summary and prospects to 2010
• Annual UK emissions down 13.2% and CO2 down 7.5% by 2000 from 1990 levels
• All greenhouse gas emissions expected to be down by 23% and CO2 by 20%, by 2010.
• The economy grew by 49% between 1990 and 1999.
• GHG emission intensity fell by about 30%.

UK Strategic approach
• Stabilisation framework needed
• Energy White Paper

Objective: stabilisation at safe levels
• The ultimate objective of the UNFCCC is to stabilise greenhouse gases in the atmosphere at levels which avoids dangerous anthropogenic change to the climate system

Defining dangerous levels
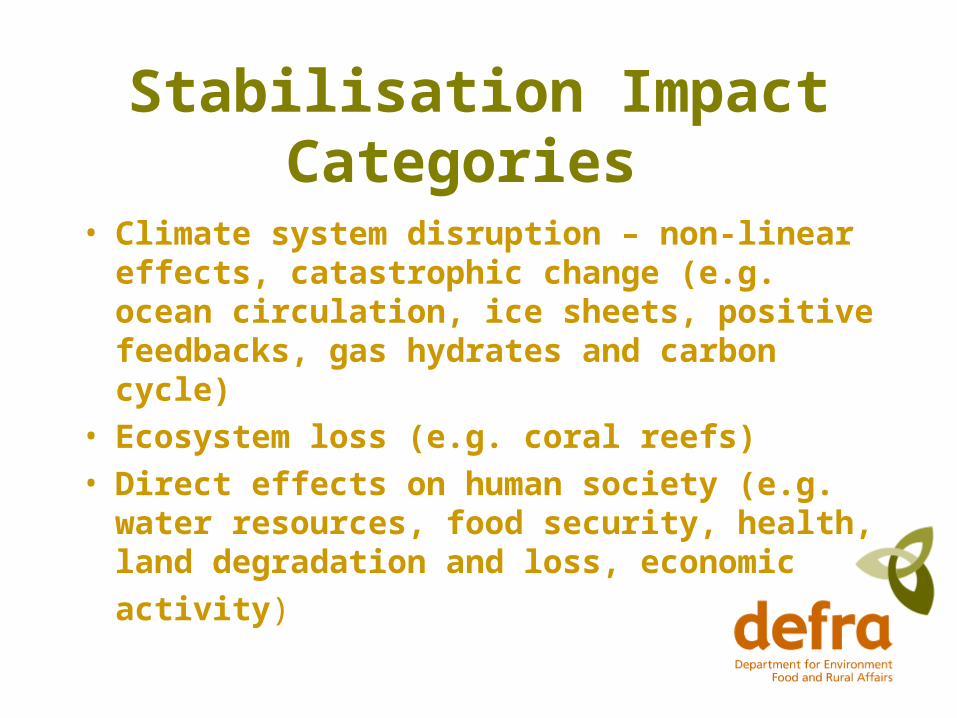
Stabilisation Impact Categories
• Climate system disruption – non-linear effects, catastrophic change (e.g. ocean circulation, ice sheets, positive feedbacks, gas hydrates and carbon cycle)
• Ecosystem loss (e.g. coral reefs)
• Direct effects on human society (e.g. water resources, food security, health, land degradation and loss, economic
activity)

Surface temperature change if THC collapses whilst world warms (Hadley
Centre)

Ecological thresholds
More than a million species committed to extinction by 2050?
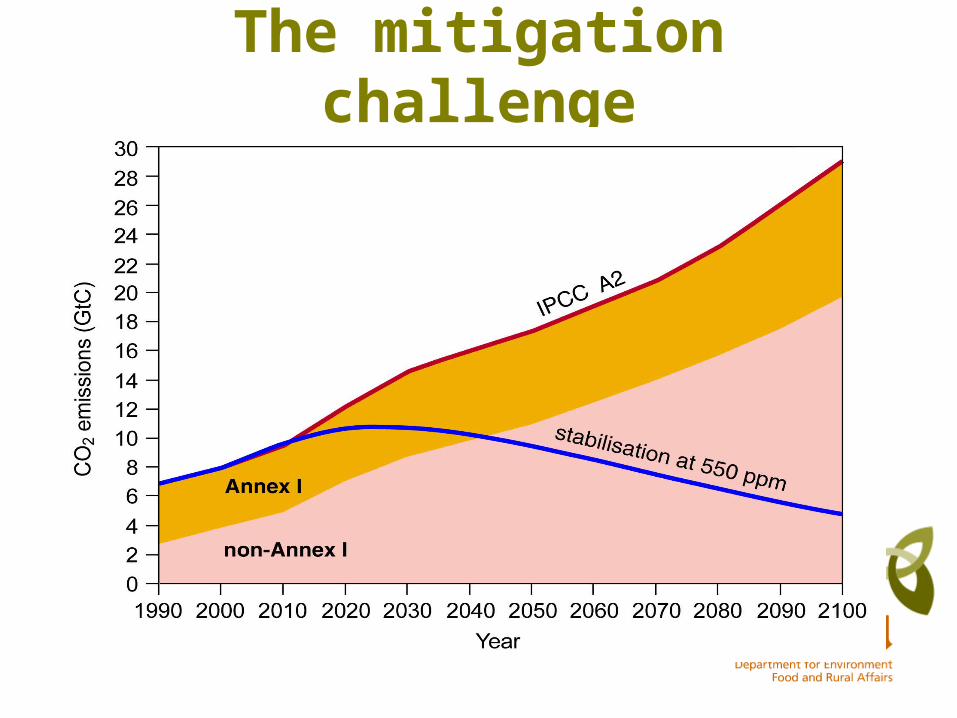
The mitigation challenge

How do we get to stabilisation?
• All stabilisation levels require deep cuts in global emissions.
• The stabilisation level attained is dependent on how fast reductions are put in place.
• Some climate change will be inevitable so we will need to adapt.
• Less action on emissions = more damage and adaptation required.
• Q What is acceptable?
Our energy future: creating a low carbon economy
www.dti.gov.uk/energy/whitepaper
• “The UK should put itself on a path towards a reduction in carbon dioxide emissions of some 60% from current levels by 2050”
• “Our new energy policy will ensure that energy, the environment and economic growth are properly and sustainably integrated”

The carbon challenge
P r o je c te d U K c a r b o n e m is s io n s 1 9 9 7 -2 0 5 0
0 .0
2 0 .0
4 0 .0
6 0 .0
8 0 .0
1 0 0 .0
1 2 0 .0
1 4 0 .0
1 6 0 .0
1 8 0 .0
Y e a r
Carb
on em
ission
s (mt
C)
B us ines s as U s ua l
G radua ted R C E P ta rge t

Overall Strategy
• Strong emphasis on renewables and energy efficiency
• Coal has a future, if clean
• No commitment to new nuclear build now, but don’t rule it out later if necessary to meet our carbon goals

Why 60% ?
• Assumes CO2 stabilisation at 550ppm
• Assumes similar action by all Annex-1
• Requires some developing country action in 2020 – 2030 timeframe
• Accepted the RCEP recommendation

Costs of 60% CO2 reduction
• provided wider international engagement, costs of order of ½ - 2 % of GDP in 2050
• approximately 0.01-0.02 percentage points reduction on assumed GDP growth rate of 2.25% a year

Stabilisation Summary
• Safe level to avoid dangerous change is uncertain
• Even 550ppm may carry large risks.• Stabilisation requires deep global
emission reductions - Annex-1 some 60% by 2050 needed.
• Developing countries need to curb emissions by around 2010 to 2030.
• Review actions frequently as science and and technology develops

Science-Policy Issues
• Climate system uncertainties • Global air pollution and climate• Impact assessment / risk analysis• Cost of damage and responses• Safe limits to climate change• Pathways to stabilisation • Aviation (50% of emissions - 2050?)• Hydrogen and new technologies
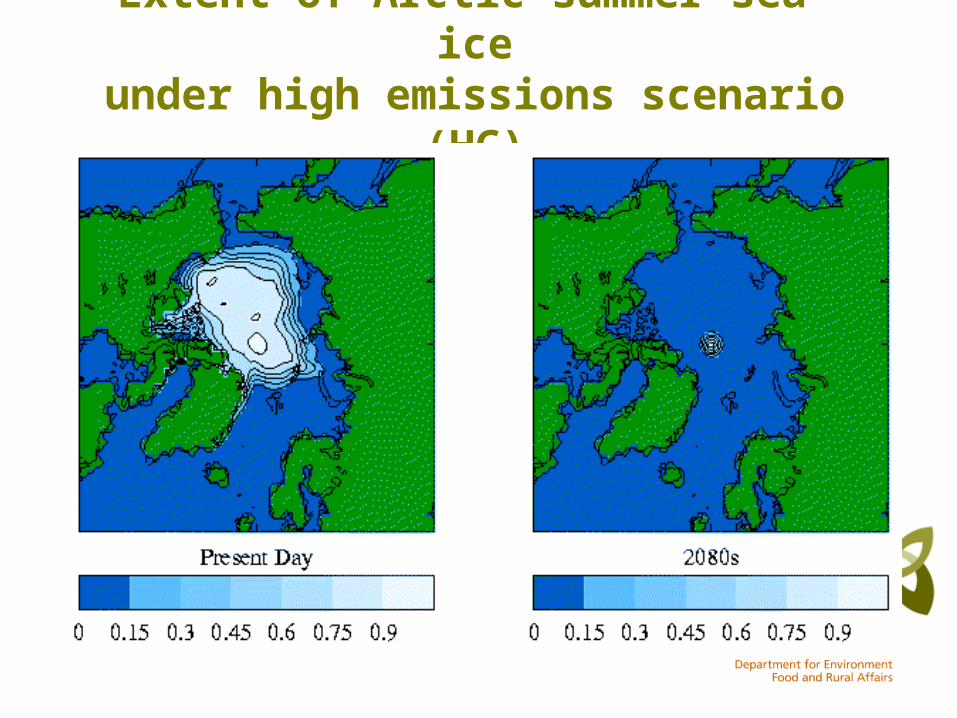
Extent of Arctic summer sea-iceunder high emissions scenario (HC)