Embed Size (px)
Citation preview

THE TYCHE AND SAFE MODELS: COMPARING TWO MILITARY
FORCE STRUCTURE ANALYSIS SIMULATIONS
Cheryl Eisler and Slawomir Wesolkowski Daniel T. Wojtaszek
Centre for Operational Research and Analysis Atomic Energy of Canada Ltd.
Defence Research and Development Canada Chalk River Laboratories
101 Colonel By Drive, Ottawa, ON K1A 0K2 Canada 1 Plant Road, Chalk River, ON K0J 1J0 Canada
Email: [email protected]
Email: [email protected]
Email: [email protected]
KEYWORDS
Force Structure Analysis, Fleet mix analysis, Capability-
Based Planning, Discrete Event Simulation, Multi-
Objective Optimization, Scheduling.
ABSTRACT
In the past, several force structure analyses have been
conducted for the Canadian Armed Forces using
moderate fidelity (e.g., Tyche) and low-fidelity (e.g.
Stochastic Fleet Estimation or SaFE) simulation models
within optimization frameworks. Monte Carlo discrete
event simulations like Tyche are computationally
expensive and can only be used in optimizations that
require few force structure evaluations. The SaFE model
acts as a simple surrogate model that can be utilized by
more global optimization techniques. SaFE, originally
developed to study air mobility fleets, was adapted to
accommodate a larger set of capabilities and more
scheduling heuristics so that the performance of many
force structures can be quickly assessed while
minimizing a set of objectives. The amount of time
required to find the SaFE optimal force structures is
significantly less than using Tyche. This indicates that
SaFE could be an important tool for discovering pareto-
optimal force structures (within the space of all possible
mixes) that would represent practical lower bounds on
the force structure requirements for accomplishing
expected future scenarios. The purpose of this paper is
to compare and contrast the use of Tyche and SaFE
through simulation optimizations on a given dataset.
INTRODUCTION
Determining the best future military force structure,
comprised of a set of assets, to accomplish a set of
defence and security tasks is a challenging undertaking.
The set of tasks must be thoroughly investigated;
requirements, frequencies, and durations for each task
require definition. Potential assets must be identified
and their abilities to meet task requirements assessed.
Besides the necessity for accurate data from which to
model, the force structure problem is further
complicated by the deep uncertainty (Bui et al. 2009)
inherent in modelling future environments. Thus, a force
structure must be capable of addressing many possible
combinations of future operational tasks. Furthermore,
assets are large capital investments; accordingly, the
goal is not only to find the appropriate force structure
size and mix with respect to the devised future
scenarios, but also the most capable structure at the
lowest cost (Wojtaszek and Wesolkowski 2012).
Since large capital procurement projects undergo
significant internal and external scrutiny, it is incumbent
upon decision-makers to balance many conflicting
objectives, justifying investments with anticipated
needs. Due to the non-linear nature of the performance
objective functions, as well as the length of
computational time required to evaluate individual force
structures, it is often not realistic to find a globally
optimal structure in the time normally given to complete
such studies. The computational complexity is
exacerbated when searching for the pareto-optimal set of
structures with respect to multiple objectives (Wojtaszek
and Wesolkowski 2013). It is, therefore, critical that
methodologies for quickly identifying optimal future
force structures be investigated.
Two optimization-simulation approaches to force
structure analysis used within the Defence Research and
Development Canada’s Centre for Operational Research
and Analysis (DRDC CORA) are examined. The first
approach uses a computationally intensive, Monte Carlo
discrete event simulation model known as Tyche (Eisler
and Allen 2012) within a direct search optimization
framework. The model takes a top-down approach to
test force structures, mimicing the decision of a military
scheduler by assigning assets within a given force
structure to scenarios as they arise. A single simulation
run often requires hours to complete, and an
optimization search can take weeks or months on
today’s desktop computers; necessitating an
optimization procedure that requires relatively few steps
to converge to the optimal force structure composition.
An alternative to the moderate-fidelity approach based
on Tyche is the low-fidelity approach of DRDC
CORA’s Stochastic Fleet Estimation (SaFE) model
(Wojtaszek and Wesolkowski 2013). SaFE is also a
Monte-Carlo based simulation, which generates average
yearly requirements from a dataset with frequency,
duration, and capacity requirements for tasks (scenarios
Proceedings 28th European Conference on Modelling and Simulation ©ECMS Flaminio Squazzoni, Fabio Baronio, Claudia Archetti, Marco Castellani (Editors) ISBN: 978-0-9564944-8-1 / ISBN: 978-0-9564944-9-8 (CD)
without a stochastic location element) and assets.
However, the total force structure requirements are
estimated from the bottom up, through a fixed matching
of assets to scenarios, and no attempt is made to account
for scheduling constraints (e.g., start and end dates).
Given SaFE’s relatively quick run time (approximately
one millisecond on the same data run through Tyche),
optimization is carried out over the solution space of all
possible task to asset assignments, not just all of the
force structure compositions.
Both models will be described subsequently in further
detail. The optimization results of the Tyche and SaFE
models will be compared, and their roles for military
force structure analysis contrasted.
THE TYCHE MODEL
Tyche schedules the deployment of assets within a force
structure to address a set of missions (Eisler and Allen
2012). Figure 1 illustrates the implementation of the
Tyche model. On the top right, a fixed set of demands is
created: missions to which a military force structure
should endeavour to respond. These missions are
created as scenarios, and may be broken down into one
or more phases. Each phase may be random or
scheduled, with its own frequency, duration (and
associated probability distribution) and possible theatre
locations, as well as a set of capability demands.
Figure 1: Tyche Model
Tyche can model a number of asset types, each
supplying different capabilities. Force structures are
constructed out of these asset types by specifying a
quantity for each type and a physical location where
they are based. To run a Tyche simulation, one force
structure is selected to test a capability supply from the
set of assets against demand requested from the given
scenarios. Demand is constructed stochastically from the
scenarios for frequency, start date, and duration in the
schedules. Scenarios can be randomly generated using a
Poisson process or scheduled at known intervals;
durations are generated using uniform or triangular
distributions. Assets within a force structure are then
assigned to the schedule chronologically utilizing the
policy to meet a single requirement by selecting from a
list of available assets based on information that is
known and actionable at the moment a mission occurs
(Wu et al. 2009). The available assets within the force
structure are assessed a numerical score for the
capability used in the scenario and optional penalties for
excess capability supply, timeliness into theatre, and
scheduling conflicts. The scoring algorithm (Eisler and
Allen 2012) factors in the quality, quantity, and
subjective weighting of importance of capabilities
matched between the supply and demand for a specific
combination of assets. The combination of assets with
the highest score is then assigned to the scenario in the
operational schedule.
This process is repeated for all simulation iterations in a
Monte Carlo approach (Robert and Casella 2004), and
force structure performance is evaluated based on how
well and how often the scenario’s capability
requirements are met. This is done in the form of
statistics gathered from the collection of operational
schedules on unmet capability demand per scenario, and
by factoring in the frequency of scenario occurrence and
political impact of failure to meet such requirements, to
form a metric of political risk.
Performance Metric
The average yearly political risk R for a set of scenarios
is defined as
s
sss PIfR (1)
where the risk for a given scenario s is defined as the
product of the annual frequency of occurrence fs, the
political impact Is of scenario failure, and the percentage
of time the capability supply deployed by the scheduler
is inadequate Ps. The first factor is assessed by
averaging the number of times the scenario occurs
yearly across all schedules. The second factor, impact
score, is provided by subject matter experts (SME) into
the calculation. Each scenario is assigned to an impact
category with an associated impact score. The third
factor in the risk calculation is defined as a weighted
calculation of the percentage of time that capability
requirements are not met at various levels for the
scenario (Eisler and Allen 2012).

Optimization Framework
Tyche was designed as a tool to evaluate and compare
individual force structures. There is no optimization
built in to drive the search for better force structure
compositions. However, Tyche can be used inside an
optimization framework, provided that the algorithm
does not require a significant number of force structure
evaluations due to the computational cost associated
with each simulation run. An optimization is conducted
within the solution space of all possible force structure
compositions, with Tyche evaluating the performance of
each feasible structure.
A force structure analysis study conducted internally by
DRDC CORA used the Hooke-Jeeves algorithm (Hooke
and Jeeves 1961), modified to combine a local
exploratory search with a global pattern search, to
perform the optimization procedure. Starting from an
initial force structure composition, the exploratory
search makes cumulative incremental changes to each
asset type to determine if the objective value improved.
The best combination of local improvements is used to
drive the pattern search for larger step sizes. Although
this algorithm can easily get trapped in local optima, it
has two major advantages for application with Tyche.
First, it requires few function evaluations, which are
computationally costly. Second, it is simple enough not
to require automation, given that manual input is
required to set up force structures within Tyche.
Two primary objectives were defined to determine
optimal force structures: minimizing total force structure
risk and size. Due to the discrete political impact
categories, the risk minimization was then defined in
two ways, each used to drive separate optimizations.
The first optimization minimized total risk and structure
size, where a change in force structure was retained if
the total risk decrease was deemed statistically
significant. Noting that the standard error SE was
estimated using the sample variance of the risk
distribution divided by the square root of the number of
schedule realizations and, assuming that the distribution
can be normally approximated, the statistical
significance was calculated in pairwise comparisons
where the ±2 SE intervals did not overlap (Payton et al.
2003).
A second optimization minimized risk per impact
category until a threshold of acceptable risk (as defined
by military SMEs) was reached. That is, a change in
force structure was retained if the risk in any impact
categories showed a statistically significantly decrease.
Again, the number of assets in the force structure was
minimized by rejecting changes (i.e., with asset
additions) that showed no statistically significant
improvements. The search was terminated once the risk
in each impact category met the given threshold within
the bounds of the statistical significance. The procedure
is illustrated by the following pseudo code on the force
structure of composition x
, a vector count of each asset
type, α as the pattern search acceleration factor and
as the pattern search step vector:
procedure modifiedHJ( x
, ,
) with
DO WHILE termination criterion not met
// Exploratory search
step size, initially as vector of zeros for
total number of asset types
FOR i = 1 to number of asset types
iii xxnew
Evaluate simulation at newx
IF )()( 2)(2)( xRxRnew SExRSExRnew
ii
ENDIF
NEXT
// Pattern search
DO WHILE newxx
xxnew
Evaluate simulation at newx
IF )()( 2)(2)( xRxRnew SExRSExRnew
5.0 , as acceleration factor
new , where all i values must be
integers and 1)( iMIN
ENDIF
LOOP
LOOP
A subsequent a greedy search is then applied to trim the
solution. Trimming is carried out only if the modified
Hooke-Jeeves algorithm is successful at either
minimising the total risk to zero or the risk per category
under the specified threshold. This trimming step is
necessary since the pattern search can add several assets
from different types at the same time, leading to a larger
structure than necessary to achieve the specified
objective. The trim procedure is illustrated by the
following pseudo code on the force structure of
composition x
:
procedure Trim( x
)
DO WHILE termination criterion met
FOR i = 1 to number of asset types
1 ii xxnew
Evaluate simulation at newx
IF termination criterion NOT met
ii xxnew
ENDIF
NEXT
Evaluate simulation at newx

DO WHILE termination criterion NOT met
FOR all reductions to x
Select i with the maximum reduction of
)( newxR
and reverse change by
1 ii xxnew
NEXT
Evaluate simulation at newx
LOOP
LOOP
The results of the optimizations of the Tyche runs will
be discussed in comparison with the results of the SaFE
simulation optimization (as conducted on the same input
data set) after a description of the SaFE model and its
optimization framework is given.
THE SAFE MODEL
Like Tyche, SaFE is also a capability-based model that
uses a Monte-Carlo approach to determine possible
force structures based on the tasks that must be
performed. It uses a dataset of task frequency, asset- and
task-specific durations, and capability (in the case of air
mobility (Wojtaszek and Wesolkowski 2013), these
were passenger and freight capacities) requirements to
derive demand over a stochastically generated number
of tasks. The force structure is built from the bottom up,
where its composition is computed such that there are
sufficient assets to accomplish an average set of tasks.
Since assets are matched to tasks via capabilities, there
can be many assignment combinations. Force structures
generated by SaFE are input into an (usually multi-
objective) optimization procedure so that assets can be
traded off against each other based on common
capability. Given that SaFE is a bottom-up task-driven
model, if in one solution the number of assets of a
particular type increases (in comparison to another
solution), then the number of assets of a different type
which has similar capability will usually decrease.
To illustrate the differences between SaFE and Tyche,
consider Figure 2. Instead of building a force structure
out of a variety of asset types at a number of bases to
test during a simulation, SaFE exhaustively matches
each task to a specific asset or groups of assets. This
asset to task assignment is done in a capability-based
manner ahead of the optimization proper in order to
limit the solution space to all feasible asset assignments.
Each individual asset to task assignment is known as a
configuration.
On the top right of Figure 2, demand is generated
stochastically from a set of tasks, using frequencies and
durations derived from triangular distributions. Asset-
specific duration distributions (uniform) are also defined
for completion of each task, and computed based on the
configuration in use. For each iteration, the total demand
can be calculated as time required for each asset type.
The total time for each asset type is then averaged over
all iterations to form the average annual demand. The
number of assets required in the force structure to satisfy
this average level of demand is computed simply as the
whole number of assets that can provide such time (for
example, 2.6 years of average annual demand requires 3
assets within the force structure). The sample variance
of these durations is also computed to determine how
much the demand varies across all of the scenarios.
Figure 2: SaFE Model
Essentially, SaFE assumes a much simplified world
where only total time on task for each asset type is
needed to compute force structure requirements. It does
not take into consideration event scheduling, such as
task start and end times, task cancellation or
prioritization, or other assignment constraints. SaFE
yields the best possible representation of task
requirements and, thus, underestimates realistic task
requirements to produce a lower bound on a required
force structure. Due to this simplification, SaFE can be
used in an optimization framework to generate and
evaluate force structures much more quickly than even
the most efficient Monte Carlo discrete event
simulation. This improved speed is vital when searching
for optimal structures, a process that requires many
force structures to be evaluated.
For analyses where higher fidelity is required, the SaFE
model could be exploited as a preprocessing tool. It may
reduce the problem space by eliminating large number

of inefficient options and, thus, reduce the cost of using
higher fidelity tools such as Tyche.
Adaptation to New Data
In Figure 2, there are several objects indicated with
dashed lines, such as bases, theatres, and scenarios.
These are common concepts between Tyche and SaFE;
however, SaFE does not provide direct support for such
data entry. To accommodate these concepts, the
following adaptations were made:
Multiple bases: assets of the same type defined at
different locations and with different transit times to
theatre (as asset-specific task completion durations).
Scenarios with a probability of occurring at more
than one theatre and/or more than one phase per
scenario: handled through data manipulation to obtain a
suitable equivalent of multiple tasks in SaFE.
Asset assignment dependent upon availability at the
time a scenario arises in the simulation: Tyche would
send the same unique set of assets to a scenario every
time if there were no limits on the number of assets
available, but to enable the SaFE model to use an
optimization mechanism for configuration generation,
possible asset to task assignments are calculated as those
that provide all the capabilities at the required level
while also providing a minimum of excess capability.
The effect of asset types that act as force multipliers:
captured by modelling a single additional asset type with
enhanced capabilities.
Performance Metric
The objective of the optimization is to search for force
structures that are capable of fulfilling the average
requirements and are minimal with respect to size,
scenario duration, and risk of failure.
The force structure size objective (Esize) is an evaluation
of the number of assets resulting from the chosen
configuration and identifies structures which require
minimal resources but are still capable of accomplishing
the average scenario. The size objective is defined as
mFwaFEma
size
(3)
the summation of the number (F) in each asset type (a)
plus a small weighted (w=0.01) total to account for the
number of a single type of relatively low-value force
multiplier assets (m).
The scenario duration objective function evaluates the
average time it takes to accomplish a scenario. The
duration objective (Etime) is defined as
s
time sE , where )(max)( ads sa (4)
where ds(a) is the time it takes one asset of type a to
accomplish its portion of all instances of scenario s, and
δ(s) is the maximum time it would take any of the
assigned assets to complete the scenario (thus the
duration of the asset that travels furthest to the theatre is
the one that defines the duration for the whole
configuration). This assumes that all assets travel at the
same speed, and that all assets must arrive at the theatre
before the scenario can commence.
The force structure size and scenario duration objectives
are evaluated using the average duration output from
SaFE. However, the requirements of any iteration may
vary from that of the average iteration. To mitigate the
effects of this uncertainty, a risk-based objective is used,
which is an evaluation of the ability of a configuration to
accomplish all iterations. The risk objective (Erisk) is
computed by
a
risk aE )(1 (5)
as the probability that at least one asset will not be able
to accomplish its requirements. The probability that an
asset will be able to fulfill its requirements is given as
π(a) (Willick et al. 2010).
Optimization Framework
A single simulation run in SaFE is conducted for a given
asset to task assignment configuration over 104 iterations
(typically) of one year in duration each. An average
force structure can then be calculated to meet the
average set of demand over all iterations. The space of
all possible configurations is very large (Wojtaszek and
Wesolkowski 2013) – significantly larger than the force
structure composition solution space. Since this large
configuration space cannot be exhaustively searched in a
practical amount of time, a metaheuristic is required.
Given that multiple objectives are considered, a multi-
objective optimization algorithm needs to be used to
provide a set of non-dominated solutions with respect to
these objectives. Among the multi-objective algorithms
that exist (Deb 2005), a well-studied one that has been
utilized previously with Safe is the Non-Dominated
Sorting Genetic Algorithm-II (NSGA-II). NSGA-II is an
elitist evolutionary algorithm that groups individual
solutions into non-dominated fronts, and uses a
crowding-distance operator to preserve diversity of
solutions (Deb et al. 2002). Each solution comprises a
configuration of asset to task assignments, and a base
distribution for each asset. The NGSA-II pseudo code is
not provided here, as it is adequately given in a variety
of references, including (Deb et al. 2002).
RESULTS
The study dataset included 164 scenarios and 28
theatres. There were 14 asset types modeled, each at two

possible bases. The results of the asset to task
assignment algorithm generates 7.4 x 1062
possible
configurations over all scenarios.
The NSGA II was run 50 times with 1 000 individuals
(configurations) for 10 000 generations each with a
mutation rate of 20%. Multiple runs were used to ensure
the repeatability of the results obtained with respect to
quality. The quality of the results was assessed using a
hyper-volume measure (Fleischer 2003). The non-
dominated fronts of the last generation over each run
were combined into a single set of individuals, and then
the non-dominated sorting algorithm was performed on
this set to give the combined non-dominated front over
the solutions from the 50 runs. The hyper-volume of the
last generation of each run was then computed and
compared to the hyper-volume of the combined non-
dominated front. The hyper-volume average and
standard deviation over all the runs corresponded to
96%±3% with respect to the combined best non-
dominated front. Therefore, the quality of the results
from each run can be considered to be similar to the
others, and, therefore, analysis in the remainder of this
section is carried out on the results of one of the runs.
Figure 3 shows a plot of Etime versus Esize for the 81
configurations in the non-dominated front, with the
colour of each point representing the value of Erisk. This
figure shows the trade-off between the size of the force
structure and the risk of not being able to fulfill all of the
demand in an iteration.
When looking at configurations with the same value of
Esize, configurations with lower Etime have higher Erisk,
thus demonstrating that there is a risk of not being able
to assign assets from the closest base to theatre. The
lowest value of Erisk over the non-dominated
configurations is 0.27, indicating that the duration of
asset use in an iteration may deviate significantly from
the average. Recall that Erisk does not take into account
the timing of scenarios within an iteration and the
requirement that scenarios must be performed within
time windows. Therefore, the risk of a force structure
produced by optimizing SaFE not being able to satisfy
all of the demand in a given iteration may be greater
than Erisk.
Figure 3: Plot of Objective Values for Configurations in
the Non-Dominated Front
As mentioned previously, the same force structure can
be computed from different configurations. For
example, configurations A and B shown in Figure 3 both
result in the same force structure, but configuration A
has lower Erisk (0.27 vs. 0.36) and higher Etime (7.06 vs.
7.05). These differences are due to differences in the
assets assigned to each scenario and the base from which
the assets are assigned.
Within the 81 non-dominated configurations, there are
24 distinct force structures. The ranges of number of
each asset type over these structures are shown in Table
1. When compared to the force structures run through
Tyche (three distinct force structures were used to seed
the initial values for two separate optimizations to
produce six final structures), the upper bounds on these
ranges are similar to or slightly less than the SME force
structures for most assets. This result indicates that the
SME force structures could theoretically satisfy the
average iteration requirements with respect to the
duration of asset usage with some unused asset capacity.
The force structures from the optimization conducted
using Tyche are much larger in number for most asset
types than the upper bound on the range of non-
dominated structures, indicating that they could
theoretically satisfy the average iteration requirements
with a large amount of unused asset capacity (which
may be necessary to meet scheduling constraints).
Comparison of Suggested Force Structures
The force structure compositions produced using the
SaFE model were run back through the Tyche
Table 1: Range of Number of Assets in Recommended Force Structures
Type 1 Type 2 Type 3 Type 4 Type 5 Type 6 Type 7 Type 8
Base A B A B A B A B A B A B A B A B
SaFE 3-4 2-3 2 2 1-2 2 2-4 4-7 0-1 1 1 1 1-2 3-5 2-3 4-5
SME 3-6 3-6 2 2 2 2 5-6 6-7 1 2 0-1 0-1 3 5 7 8
Tyche 10-14 10-14 5-6 5-6 3-4 4 10-14 11-14 1-2 2-3 1-2 2-3 1-3 1-5 6-8 7-8
simulation in order to compare results with common
metrics. Each force structure was run for 1 000
iterations. Of the three SaFE objectives, only Esize, a
good indicator of force structure size, is independent of
the model. Etime and Erisk are associated with specific
asset to scenario assignment configurations, of which
there may be multiple for the same force structure
composition, and cannot readily be generated for the
SME or Tyche recommended force structures. As a
result, comparisons will primarily be made on
correlations between Esize, political risk, and Erisk. The
set of force structures chosen for this comparison
comprise all of the force structures from the final
generation of the NSGA-II, not just the 24 in the non-
dominated front. This set comprises 274 distinct
structures, and was chosen to provide a better statistical
analysis. In the amount of time it took to run an
evolutionary optimization procedure to find 24 non-
dominated force structures (less than 24 hours), the
Tyche simulation was only able to evaluate
approximately 77 force structures (2.5 hours per force
structure, running 8 simulations in parallel).
Performance evaluations using SaFE are not as precise
when compared to Tyche because the SaFE evaluations
are based on average requirements. In addition, the risk
measures used are not directly comparable, since the
political risk objective is a weighted sum of stochastic
scenario performance, where each scenario is weighed
according to the political impact of not being able to
provide its required capability. The Erisk objective, on
the other hand, does not distinguish between the
importance of different scenarios.
Another issue with comparing Erisk and the political risk
for a force structure is that there may be multiple values
of Erisk for a given structure due to the possibility of
multiple configurations for the asset to task assignment.
In order to determine which value of Erisk to use for each
force structure, the correlation coefficient is computed
between the structure’s political risk and each of the
minimum, mean, and maximum values of Erisk. The
resulting correlation coefficient values are 0.62, 0.63,
and 0.63, respectively; thus indicating that there is very
little difference among these values. All that can be said
here is that the higher values of Erisk for a force structure
may be slightly more reflective of the political risk
computed using Tyche than the lower values. The mean
value of Erisk will be used for the remainder of this
section with the assumption that using either of the other
values will not significantly change the analysis. The
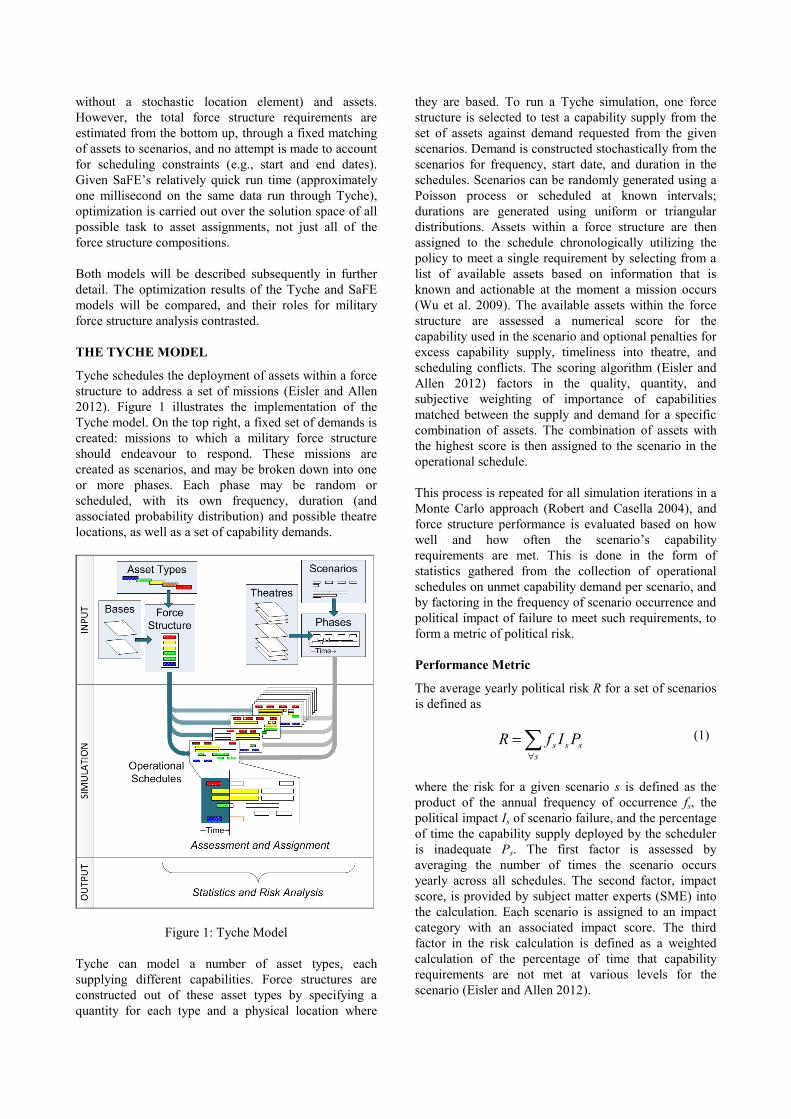
positive correlation obtained here shows that there is
some potential in using SaFE to estimate the risk of a
force structure, although Figure 4 shows that there are
force structures with lower total political risk but larger
Erisk than other structures; therefore, more work would
be required to formulate a risk measure usable with
SaFE that is more reflective of the political risk
measure.
Figure 4: Erisk vs. Total Political Risk for the SaFE-
produced Force Structures
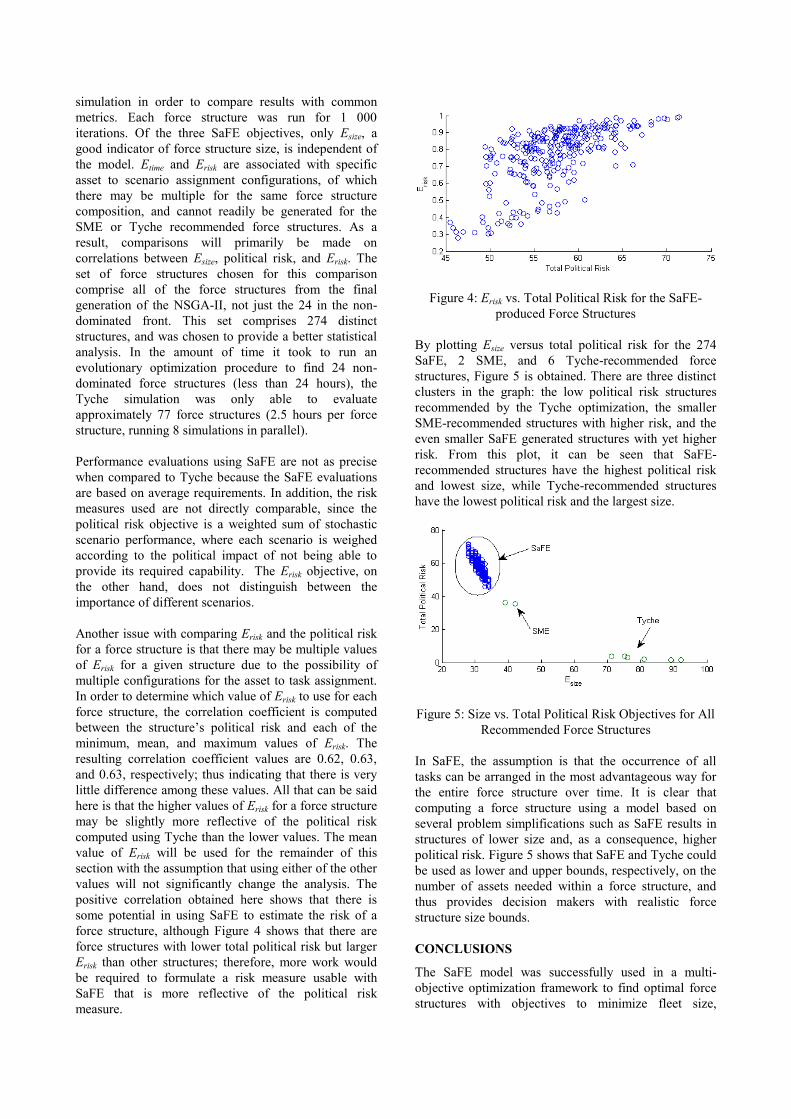
By plotting Esize versus total political risk for the 274
SaFE, 2 SME, and 6 Tyche-recommended force
structures, Figure 5 is obtained. There are three distinct
clusters in the graph: the low political risk structures
recommended by the Tyche optimization, the smaller
SME-recommended structures with higher risk, and the
even smaller SaFE generated structures with yet higher
risk. From this plot, it can be seen that SaFE-
recommended structures have the highest political risk
and lowest size, while Tyche-recommended structures
have the lowest political risk and the largest size.
Figure 5: Size vs. Total Political Risk Objectives for All
Recommended Force Structures
In SaFE, the assumption is that the occurrence of all
tasks can be arranged in the most advantageous way for
the entire force structure over time. It is clear that
computing a force structure using a model based on
several problem simplifications such as SaFE results in
structures of lower size and, as a consequence, higher
political risk. Figure 5 shows that SaFE and Tyche could
be used as lower and upper bounds, respectively, on the
number of assets needed within a force structure, and
thus provides decision makers with realistic force
structure size bounds.
CONCLUSIONS
The SaFE model was successfully used in a multi-
objective optimization framework to find optimal force
structures with objectives to minimize fleet size,

scenario duration, and risk of failure. A set of SaFE-
derived force structures was then evaluated using the
Tyche simulator in order to assess their political risk.
The results showed that SaFE-recommended force
structures have the highest political risk and lowest size,
while the Tyche-recommended force structures have the
lowest political risk and the largest size. Thus, results
from SaFE and Tyche could be used respectively as
lower and upper bounds on the number of assets
required within a force structure, and provide decision
makers with more realistic bounds on the political risk
objective. SaFE appears to provide a lower bound on the
force structure size since it is a model based on several
constraint relaxations. In addition, there is some
correlation between total political risk and Erisk although
Erisk was not designed to estimate political risk.
The amount of time required to find the SaFE non-
dominated configurations was less than 24 hours,
whereas running a Tyche simulation required 2.5 hours
per force structure; therefore, SaFE should be
investigated further as a quick preprocessing tool that
can sort through vast numbers of structures which can
then be analyzed in more detail in Tyche. Furthermore,
SaFE can also be modified to compute force structures
that are capable of satisfying different levels of iteration
requirements. For example, instead of using mean asset
durations, the asset durations could be chosen such that
they are greater than those of a user-specified percentage
of iterations.
ACKNOWLEDGEMENTS
Dr. Wojtaszek’s contribution to the work reported on in
this publication was performed while he was employed
at DRDC CORA. The authors would like to thank
Leanne Stuive, a co-operative education student from
the University of Waterloo, who assisted in the initial
application of SaFE to the dataset discussed herein.
REFERENCES
Bui, L.T.; M. Barlow; and H. Abbass. 2009. "A Multi-
Objective Risk-Based Framework for Mission Capability
Planning." New Mathematics and Natural Computation
(NMNC), No.5 (2), 459-485.
Deb, K. 2005. "Multi-Objective Optimization." In Search
Methodologies, Burke, E.K. and G. Kendall (Eds.). USA,
Springer, 273-316.
Deb, K.; A. Pratab; S. Agarwal; and T. Meyarivan. 2002. "A
Fast and Elitist Multiobjective Genetic Algorithm: NSGA-
II." IEEE Transactions on Evolutionary Computation,
No.6 (2), 182-197.
Eisler, C. and D. Allen. 2012. "A Strategic Simulation Tool
for Capability-Based Joint Force Structure Analysis." In
Proceedings of the International Conference on
Operations Research and Enterprise Systems (Vilamoura,
Portugal, Feb. 4-6) INSTICC, 21-30.
Fleischer, M. 2003. "The Measure of Pareto Optima:
Applications to Multi-Objective Metaheuristics." In
Evolutionary Multi-Criterion Optimization, Fonseca, C.;
P. Fleming; E. Zitzler; L. Thiele; and K. Deb (Eds.).
Springer Berlin / Heidelberg, 519-533.
Hooke, R. and T.A. Jeeves. 1961. ""Direct Search" Solution of
Numerical and Statistical Problems." J. Assoc. for
Computing Machinery, No.8 (2), 212-229.
Payton, M.E.; M.H. Greenstone; and N. Schenker. 2003.
"Overlapping Confidence Intervals or Standard Error
Intervals: What Do They Mean in Terms of Statistical
Significance?" Journal of Insect Science, No.3 (34), 1-6.
Robert, C.P. and G. Casella. 2004. Monte Carlo Statistical
Methods. Springer-Verlag, New York, NY.
Willick, K.; S. Wesolkowski; and M. Mazurek. 2010.
"Multiobjective Evolutionary Algorithm with Risk
Minimization Applied to a Fleet Mix Problem." In
Proceedings of the IEEE Congress on Evolutionary
Computation (Barcelona, Spain, Jul. 18-23).
Wojtaszek, D. and S. Wesolkowski. 2012. "Military Fleet Mix
Computation and Analysis." IEEE Computational
Intelligence Magazine, (Aug), 53-61.
Wojtaszek, D. and S. Wesolkowski. 2013. "Evaluating the
Flexibility of Military Air Mobility Fleets." Systems, Man,
and Cybernetics: Systems, IEEE Transactions on, No.44
(4), 435-445.
Wu, T.T.; W.B. Powell; and A. Whisman. 2009. "The
Optimizing-Simulator: An Illustration Using the Military
Airlift Problem." ACM Transactions on Modeling and
Computer Simulation, No.19 (3), 1-31.
AUTHOR BIOGRAPHIES
MS. CHERYL EISLER obtained her M.A.Sc. from
Carleton University in aerospace engineering. She works
for DRDC CORA, where she leads research in the field
of simulation for force structure analysis.
DR. SLAWOMIR WESOLKOWSKI is a scientist
with DRDC CORA. He is also an Adjunct Professor
with the University of Waterloo, where he obtained his
Ph.D. in systems design engineering. He is interested in
operations research problems and risk analysis.
DR. DANIEL WOJTASZEK received a Ph.D. degree
in electrical engineering and joined DRDC CORA for
two years as Post-Doctoral fellow, before taking a full
time position as an Operations Research Analyst with
Atomic Energy of Canada Ltd.
COPYRIGHT NOTICE
The authors of this paper (hereinafter “the Work”)
carried out research on behalf of Her Majesty the Queen
in right of Canada. Despite any statements to the
contrary in the conference proceedings, the copyright for
the Work belongs to the Crown. ECMS 2014 was
granted a non-exclusive license to translate and
reproduce this Work. Further reproduction without
written consent is not permitted.