Embed Size (px)
Citation preview

kpmg.com/onlineconsumers
The truth about online consumers2017 Global Online Consumer Report

In this reportHow do companies target Millennials who no longer trust traditional advertising? How important are payment options in India? Which countries are most likely to buy from foreign websites? Where are consumers willing to buy groceries online? In this report we answer these and other questions that can help inform an online strategy that is more targeted, effective and customer-centric.
ForewordEnabled by technology, the continued year over year growth in online shopping has been fueled by a new generation of consumers who want greater convenience, value and options. For consumer businesses, this trend poses both challenges and significant opportunities.
Competition is no longer limited to local shops during business hours. Consumers today are shopping all the time and everywhere; and in a truly global online marketplace, products can easily be purchased from retailers and manufacturers located anywhere in the world—or from those with no physical retail locations at all.
Consumer demand for richer experiences and greater convenience means that retailers need to rethink their strategy, both online and in stores. Having the right product mix is no longer sufficient to attract the new wave of consumers including Millennials, who are entirely focused on one transaction—theirs. Creating an online shopping experience enhanced by technology such as augmented and virtual reality or 3D is becoming at least as important as providing convenient and personalized ordering, payment and delivery options.
However, despite the rise of online shopping, ecommerce still makes up a relatively small percentage of total retail spending. Retailers’ brick and mortar strategies also need to evolve to continue to draw customers into their stores, and to compete with the online retailers opening their own physical outlets. Increasingly, we are seeing innovative marketing strategies, as well as new technologies such as smart shelves, robots, self-checkout, and interactive and virtual reality, being deployed in stores as retailers strive to compete on all fronts.
Finding the ‘right’ strategy starts with one question: Given your brand promise, where do you want to compete? Only once a company understands their goals, customers and those customers’ needs can an appropriate strategy be designed. And the key to a sustainable strategy is being able to understand and meet customer needs both today and tomorrow, across geographies, and across generations.
In this report, we aim to raise and answer some questions about your company’s approach to ecommerce. Our global research on online consumer behaviors, preferences and attitudes can be leveraged by consumer companies seeking to improve their approach towards winning and retaining customers online.
I hope you find this report interesting and insightful. I would like to thank the survey respondents, company executives, and KPMG professionals who invested their time and insights to make this study possible.
To learn more about this research, please visit kpmg.com/onlineconsumers or contact a member of KPMG directly.
Sincerely,
Willy KruhGlobal Chair, Consumer MarketsKPMG International
©2017 KPMG International Cooperative (“KPMG International”). KPMG International provides no client services and is a Swiss entity with which the independent member firms of the KPMG network are affiliated.

2017 Global Online Consumer Report 1
ContentsWhat do consumers really want? ......................................................2 The dilemma .....................................................................................2 What 18,430 consumers told us .......................................................3Online purchase behavior ...................................................................4 Online shopping as a rising trend ......................................................4 Product category trends....................................................................6 Rise of international trade and e-tailers.............................................8 Device preference trends ................................................................12The path to purchase journey ...........................................................14 Stage 1 — Awareness: triggers and influencers .............................15 Stage 2 — Consideration: product and company research .............16 Stage 3 — Conversion: deciding where and when to buy ..............20 Stage 4 — Evaluation: experience and feedback ............................22 Cycle duration .................................................................................24Understanding consumer attitudes and motivations ....................27 What’s driving the shift to online? ...................................................27 Overcoming the hurdles to selling online........................................28 Winning the online consumer .........................................................29 Payment options need to be regionally tailored ..............................30 Building consumer trust ..................................................................33 Are experience and trust enough to earn consumer loyalty? ..........34How KPMG can help .........................................................................35About KPMG ......................................................................................36Contact us ......................................................................................Back
©2017 KPMG International Cooperative (“KPMG International”). KPMG International provides no client services and is a Swiss entity with which the independent member firms of the KPMG network are affiliated.

2 2017 Global Online Consumer Report
What do consumers really want?Advances in technology, logistics, payments and trust — coupled with increasing internet and mobile access and consumer demand for convenience —have created a US$1.9 trillion global online shopping arena, where millions of consumers no longer ‘go’ shopping, but literally ‘are’ shopping — at every moment and everywhere.
A recent report by KPMG International titled ‘Seeking customer centricity through omni business models’1, looked at how consumer and retail businesses are transforming to adapt to the shift from traditional shop-centric business models to a new world where the customer is increasingly at the center of a perpetual shopping experience. In this ‘customer-centric’ reality, retailers need to be exceptionally sensitive and responsive to when and where their potential customers are making purchase decisions (both consciously and subconsciously) throughout their ‘always on’ shopping journey.
The dilemmaThe burning question is, how can consumer and retail companies achieve this nirvana of consumer mindreading? How can they identify and keep pace with the behaviors and preferences of customers today and tomorrow? How can they ensure their online strategy is acutely tailored to attract and win the diverse and dynamic customer segments they serve?
1 https://www.kpmg.com/cmsurvey
©2017 KPMG International Cooperative (“KPMG International”). KPMG International provides no client services and is a Swiss entity with which the independent member firms of the KPMG network are affiliated.

2017 Global Online Consumer Report 3
What 18,430 consumers told usDuring 2016, KPMG conducted an international study on consumer behaviors and preferences related to online shopping. The research was largely based on an online survey of 18,430 consumers living in more than 50 countries. The respondents were between the ages of 15 and 70, each having purchased at least one consumer product online in the past 12 months.
In addition to scrutinizing their online shopping behaviors, preferences, and decision processes, the study also explored consumers’ plans for future online purchases, factors affecting trust and loyalty towards certain brands, and their sentiments and attitudes towards the companies that they do, or don’t, choose to buy from.
The ultimate purpose of this research was to provide consumer goods and retail companies with the global and local insights into the specific behaviors and preferences of the customers they want to target. By understanding the uniqueness of different customer segments, companies can tailor their online strategies for maximum success.
The depth of the data collected for this study makes it possible for companies to analyze and forecast the behaviors and preferences of their customers by geography, generation (Millennials, Generation X or Baby Boomers) and/or product category. The number of
ways to filter and classify the data is too copious to summarize in a single report, so in the following sections we provide an overview of the global results, highlighting the most significant or interesting trends and comparisons among the major demographic groups and product categories.
Executives interested in receiving more detailed insights are invited to contact KPMG to have a member of our team filter and analyze the full set of data according to your specific requirements or target markets.
Baby BoomersBorn 1946-1965
Generation XBorn 1966-1981
MillennialsBorn 1982-2001
©2017 KPMG International Cooperative (“KPMG International”). KPMG International provides no client services and is a Swiss entity with which the independent member firms of the KPMG network are affiliated.

4 2017 Global Online Consumer Report
Online purchase behaviorThe digital age and rise of online shopping have driven an unprecedented business model shift for consumer product manufacturers and retailers. Many traditional consumer businesses and new start-ups alike are moving away from models that are shop-centric or geographically-focused, to ones that are customer-centric and virtually borderless. To help inform companies tackling this transformation, KPMG International’s recent survey of 18,430 consumers provides a unique, comprehensive index of consumer online shopping behaviors and sentiments across countries, products and generations.
Online shopping as a rising trendThe frequency of online purchases varies considerably by geography. Consumers in Asia, North America and Western Europe are most likely to shop online, while per capita online purchases
in Eastern Europe and Russia, Latin America, and the Middle East and Africa are less frequent (Figure 1.0).
Generation X are the most active online shoppers Among the different age groups, Generation X consumers (born between 1966 and 1981) made more online purchases last year than any other age group, averaging nearly 19 transactions per year. Interestingly, despite the common belief that the upswing in online shopping is largely driven by the younger and more ’tech-savvy‘ Millennials (born between 1982 and 2001), Generation X consumers in fact made 20 percent more purchases last year than their younger counterparts.
Stage of life and income levels are certainly primary factors driving both online and offline shopping, and Generation X consumers, many of which are more established in their careers and building homes
Survey respondents were required to have purchased at least one consumer product online in the past 12 months.
“There is a little Millennial in each of us. A number of Baby Boomers are starting to understand and appreciate the technology that is out there. They’re also trying to appreciate and experience the convenience of buying online.”
— Mark Larson, Head of Consumer and Retail, KPMG in the US
©2017 KPMG International Cooperative (“KPMG International”). KPMG International provides no client services and is a Swiss entity with which the independent member firms of the KPMG network are affiliated.

2017 Global Online Consumer Report 5
0
5
10
15
20
25
19
9.2
18.4
11.9
22.1
16.111N
orth
Am
eric
a
Lati
n A
mer
ica
Wes
tern
Eur
ope
Afr
ica
& M
iddl
e Ea
st
East
ern
Euro
pe &
Rus
sia
Asi
a
Aus
tral
ia &
New
Zea
land
$203$190
$173
Baby Boomers
Generation X Millennials
and families, are likely buying more consumer goods than the younger Millennials overall. As Millennials continue to enter the workforce and adopt new lifestyle priorities, however, their online shopping activity is expected to surge and even far surpass levels currently exhibited by older generations.
Don’t underestimate the Baby BoomersCompared to the digital-first Millennial generation, it is reasonable to presume that Baby Boomers (born between 1946 and 1965) are less inclined to shop online. However, the Baby Boomers surveyed in fact shopped online just as frequently as the Millennials. Furthermore, the Baby Boomers on average spent more per transaction than either of the two other younger generation groups (Figure 1.1). This
Figure 1.0 Average number of online transactions (per person per year)
Figure 1.1 Average amount spent per transaction (USD)
generation was more likely to buy healthcare products, wine, household goods and appliances, categories which tend to have higher price points.
Men spend more online than womenWhile men and women shopped with about equal frequencies, on average, the men spent more per transaction—US$220 vs. US$151 for women—on their most recent purchase. This can largely be attributed to the fact that the male consumers were more likely to buy items in higher priced categories such as luxury goods (55 percent of luxury transactions were by men) or electronics (72 percent of electronics transactions were by men), while women were more likely to buy in lower-priced categories such as cosmetics or food.
15.1
18.6
15.6
Baby Boomers
Generation X Millennials
Sou
rce:
Glo
bal O
nlin
e C
onsu
mer
R
epor
t, K
PM
G In
tern
atio
nal,
2017
Sou
rce:
Glo
bal O
nlin
e C
onsu
mer
R
epor
t, K
PM
G In
tern
atio
nal,
2017
©2017 KPMG International Cooperative (“KPMG International”). KPMG International provides no client services and is a Swiss entity with which the independent member firms of the KPMG network are affiliated.

6 2017 Global Online Consumer Report
Top online products by geographyIn most countries, media, electronics, and apparel are among the 5 products most often purchased online.
Product category trends The online shopping landscape is gradually changing in terms of the types of products being bought online. Generally, consumers’ planned online purchases indicated a year over year increase for most product categories (Figure 1.2). These results signal a higher willingness to buy new product categories online, particularly those more traditionally sold in shops. For example, greater options for shipping and delivery have made it easier and more common to buy bulkier products online—including furniture, appliances and even vehicles. Meanwhile, although ‘easier to ship’ products such as books, music, electronics, accessories and apparel remain the most popular online categories, relative growth in these segments is expected to be minimal.
In fact, we see a possible downward trend for books and music, currently the number one online category, as Millennials purchase these items online less often than the older generations. It will be worth watching this particular category over the next few years to see if Millennials’
preference for streaming2 vs buying media continues to put downward pressure on online sales of books and music, since even as Millennials get older this is one area where buying habits are unlikely to change.
On the other hand, bigger items such as household goods and appliances, furniture, home décor and sporting goods show some of the highest growth potential. According to respondents’ planned online purchases for the coming year, online sales of household goods and appliances are expected to increase by 3.5 percentage points, furniture and home décor by 4.3 points and sporting goods and equipment by 4.4 points. Telecom products and fragrances are categories that are also expected to grow, by 4.5 and 2.8 percentage points respectively, as are wine, liquor and art.
In general, growth categories tend to be those which do not need trial and/or where consumers can have relatively more faith in product quality.
Books and music
Electronics
Apparel
Apparel
2 https://www.purposegeneration.com/buzz/article/streaming-the-future-millennials-and-media
“Clearly, ecommerce has been growing globally across many ‘usual suspect’ categories like apparel, books, and music. But what we are now starting to see, and where we expect more growth, is from categories where showrooming often occurs, such as mobile phones and laptops, as well as furniture and decoration items. Even in the grocery retail market we see opportunities. Very few retailers get their online grocery model right, but when they do, it can be very successful. Winning companies in this segment have focused on Millennials and young professionals, where the focus on prepared fresh meals has been a growth driver.”
— Willy Kruh, Global Chair, Consumer Markets, KPMG International
©2017 KPMG International Cooperative (“KPMG International”). KPMG International provides no client services and is a Swiss entity with which the independent member firms of the KPMG network are affiliated.

2017 Global Online Consumer Report 7
Apparel
53 0.5
(0.6)
1.0
3.5
(1.0)
2.3
1.4
1.7
0.8
4.3
4.4
2.0
4.5
2.2
544747
4041
3639
4039
3436
3334
2931
3031
2631
2630
2729
2327
2527
Books/Music
Growth in % points
Electronics/computers/peripherals
Apparel – women
Household goodsand appliances
Accessories
Apparel – men
Food/groceries
Toys/games/video games
Cosmetics/skin care
Furniture/home décor
Sporting goods/equipment
Shoes – women
Telecommunications/phones
Shoes – men
2223
2021
1821
2021
1517
1315
121314
131212
1112
911
1010
56
Apparel – children
0.8
1.5
2.8
1.6
2.7
1.3
0.7
(1.0)
0.8
1.0
1.5
0.8
1.1
Bags/leather goods
Perfume/cologne
Pharmacy/healthcare
Wine
Shoes – children
Fine jewelry/watches
Babyproducts
Eyewear
Pet foodand supplies
Liquor
Beer
Artwork
Figure 1.2
Actual vs planned online purchases: Last year vs next year
Percentage that purchased the product in the past 12 months
Percentage planning to purchase the product in the next 12 months
Wine Australia and Belgium
Accessories US, Indonesia and Turkey
Telecom products and men’s footwear India, Russia, and the UAE
Cosmetics Asia-Pacific, Russia and CEE
Pharmacy and healthcare products Brazil and Greece
Household goods Africa and the Middle East
Groceries UK and China
Sporting goods Finland
Children’s clothing, toys and games France
The following products were also among the top 5 in these geographies:
Sou
rce:
Glo
bal O
nlin
e C
onsu
mer
R
epor
t, K
PM
G In
tern
atio
nal,
2017
©2017 KPMG International Cooperative (“KPMG International”). KPMG International provides no client services and is a Swiss entity with which the independent member firms of the KPMG network are affiliated.

8 2017 Global Online Consumer Report
Generational trends — a closer lookWhen looking at differences by age group to spot trends, further analysis is required to determine when an apparent trend indicates sustainable future behavior, versus when it is simply due to a difference in age or income.
For example, contrary to the earlier example suggesting that media sales may continue to decline even as Millennials mature, the interpretation of this generation’s similar lower tendency
Figure 1.3
Expected category growth by generation: Percentage point difference between last year and next year
to buy a category such as household goods (Figure 1.3) is different. In this case, fewer household goods purchases by younger age groups is more likely due to the ‘age effect’ or ‘cohort effect’3, where behaviors are tied to age or stage of life rather than to lasting attitudes. In fact, as Millennials grow older, the potential for buying household goods online is probably quite strong.
Artwork is a small category in terms of the percentage of total consumers buying it online, however this category’s online sales seem to be growing quickly
among Millennials. As Millennials’ interest in art, comfort with buying art online, and disposable incomes all grow, we see this as another category showing solid potential.
Rise of international trade and e-tailersCross-border shopping is on the rise globally, driving international retail trade. As part of this study we looked at the level and nature of online purchases made outside consumers’ own countries.
1.11.5
Baby Boomers Generation X Millennials
Eyewear
–.7
.5
1.9
Fine jewelry/ watches
–2.1
.9
2
Pharmacy /healthcare
2.52.1
.6
Perfume/cologne
1.8
3.1 3.1
Bags/leather goods
–.7
1.4
2.8
Furniture/ home décor
2.6
4.8 4.7
1.5
1
.3 .4
2.22.6
5.9
3.6
2
Cosmetics/ skin care
Shoes — women
Household goods and applicances
.7
–.6 –2.2
Acces-sories
1.6
.8
–.3
Books/music
Artwork
3 https://en.onpage.org/wiki/Cohort_Analysis
“Much of the future growth in ecommerce will be millennial-driven. In 2 or 3 years, Millennials are forecasted to be the largest demographic in North America. As Millennials delay leaving their parents’ house and delay getting married, they spend their money on other things. Brands like Uber and Apple, and the craft beer industry have all to some degree been ignited by Millennials. Grocery spending, on the other hand, has been eclipsed by restaurant spend. Millennials like to share meals with friends—it’s all about shared experiences.”
— Willy Kruh, Global Chair, Consumer Markets, KPMG International
Sou
rce:
Glo
bal O
nlin
e C
onsu
mer
R
epor
t, K
PM
G In
tern
atio
nal,
2017
©2017 KPMG International Cooperative (“KPMG International”). KPMG International provides no client services and is a Swiss entity with which the independent member firms of the KPMG network are affiliated.

2017 Global Online Consumer Report 9
0
10
20
30
40
50
1444 15
43
21
35
50
Nor
th A
mer
ica
Lati
n A
mer
ica
Wes
tern
Eur
ope
Afr
ica
& M
iddl
e Ea
st
East
ern
Euro
pe &
Rus
sia
Asi
a
Aus
tral
ia &
New
Zea
land
Figure 1.4
Percentage of online purchases imported from other regions
Figure 1.4 shows the percentage of online purchases that consumers made outside their own region. North American and European consumers made the fewest international purchases,14 and 15 percent respectively of their total online purchases—not surprising given the maturity of these markets, where the most popular products can already be sourced domestically at competitive prices.
Asian consumers’ imports averaged 21 percent—although it varied significantly by country. While Hong Kong, Singapore and Vietnam had significant imports at 31, 43 and 55 percent, respectively, of their online purchases, other countries such as Indonesia, Japan and India each imported only 12 percent or less of their online buys outside Asia. China, with 20 percent imports from outside Asia, lay somewhere in the middle.
In Australia and New Zealand, the percentage of online purchases imported from outside this region was 35 percent, with 25 percent of those imports from North America and Europe. The geographically more remote location of these countries is likely one of the key drivers.
The bottom three regions in Figure 1.4 are the markets most likely to make international purchases online. In Eastern Europe and Russia, 43 percent of all online purchases were imported, mainly from Asia (15 percent), Western Europe (13 percent) and North America (8 percent). In Latin America, 44 percent of online purchases were imported, with nearly 60 percent of those imports from North America. African and Middle Eastern consumers were the most likely to import consumer products bought
online (50 percent of purchases). This is particularly true in the UAE, where 58 percent of online purchases were imported—with 80 percent coming from Asia, North America and Western Europe.
In many countries, the tendency to buy internationally is highest among Millennials. This could indicate potential growth for cross-border online shopping as consumers increasingly seek unique or specialized products from other countries. In the US, for example, 15 percent of Millennials’ recent purchases were imported, compared to 9 percent for Generation X and just 3 percent for Baby Boomers. It will be interesting to see how the new US administration’s proposed focus on domestic protectionism might affect the trend for younger US consumers to shop outside the country.
Sou
rce:
Glo
bal O
nlin
e C
onsu
mer
R
epor
t, K
PM
G In
tern
atio
nal,
2017
©2017 KPMG International Cooperative (“KPMG International”). KPMG International provides no client services and is a Swiss entity with which the independent member firms of the KPMG network are affiliated.

10 2017 Global Online Consumer Report
Case study
10 2017 Global Online Consumer Report
Nespresso Roger Staeheli, Country Manager, Hong Kong
Nespresso SA was founded by Nestlé 30 years ago, to introduce a revolutionary system of coffee machines and portioned encapsulated coffee. Initially in 1986, the company focused on the corporate offices market, and a few years later expanded to sellingdirect to consumers. Today, Nespresso’s 450 retail boutiques can be found in 64 countries throughout the world. Nespresso’s boutiques are an important branding and sales channel for the company, although the fastest-growing part of their business in some countries such as Hong Kong, is online.
Nespresso’s omni-channel evolution
Roger Staeheli, Nespresso’s Country Manager for Hong Kong, explains that Nespresso operates autonomously from Nestlé, due to its unique direct-to-consumer (B2C) model that requires the company to have their own sales channels. The company’s four B2C channels include: retail boutiques, an online boutique, coffee machine trade points, and call centers called CustomerRelationship Centers, where more than 1,000 coffee specialists offer support toNespresso Club members.
Nespresso’s sales channel evolution evolved in the opposite way than that of many similar long-standing retailers. After initially selling through its Customer Relationship Centers, Nespresso launched its Nespresso website in 1996, began to take orders online in 1998, and opened its first retailboutique in 2000 in the city of Paris.
According to Staeheli, this progression from online to retail shops was born out of necessity, rather than choice. “Thirty years ago, coffee that was sold at retailers was instant coffee. So we decided to retail our own products ourselves. We first established the call centers then evolved into different channels from there.”
Staeheli says the goal today is to offer a consistent experience to customers across all channels, both offline and online. “It’s about consistency in the product, price and promotion.”
©2017 KPMG International Cooperative (“KPMG International”). KPMG International provides no client services and is a Swiss entity with which the independent member firms of the KPMG network are affiliated.
Integrated channels and customer relationships
The company is very clear on the role of each of its channels, he says. “Retail is very much about delivering the brand experience. Online is about Nespresso ‘anytime, anywhere’. Trade is focused on machine sales and is a channel through which we can recruit new members. The Customer Relationship Center, which used to be a transactional channel, today is about building relationships.”
Typically, new customers that are initially recruited through a Nespresso boutique, then become online customers. Subsequently, these customers are regularly invited back into the boutique or shop to try new coffee innovations to enable Nespresso to engage directly with them. Since in most cases, customers are also members of the Nespresso Club, the company is able to gain a good understanding of their individual customers’ behaviors and preferences, therefore enabling them to tailor their marketing campaigns or offer customers personalized experiences.
Offline vs. online in Hong Kong
Despite the fast growth of Nespresso’s online channel, Staeheli highlights the two main challenges to ecommerce in Hong Kong. “We want to offer our online customers greater convenience, but going out to the shops in Hong Kong is already very convenient, since most households are within five to ten minutes of a mall. So to better serve our online customers, we offer same-day delivery during a certain period of the day. The other challenge for Hong Kong then becomes the high cost of distribution.”

2017 Global Online Consumer Report 11
“ Overseas born Australians have been a contributing factor to ecommerce growth. In cities like Sydney, Melbourne and Brisbane with large percentages of overseas born nationals, consumers have always been comfortable buying goods online as it was often the only way to get the products they liked.”
— Trent Duvall, Head of Consumer Markets, KPMG in Australia
E-tailers dominate the online marketplaceThe rising power of e-tailers such as Taobao, Alibaba or Amazon, to name a few, is apparent around the world. Their dominance is particularly evident in China and India—where over 80 percent of online purchases were from e-tailers—as well as in Japan
(69 percent), Italy (68 percent) and South Africa (65 percent). The share for e-tailers in these countries is far above the global average of 50 percent.
A trend of younger consumers being less likely than Baby Boomers to buy from e-tailers could indicate a future slowdown in this platform’s growth. Fifty-four percent of Baby Boomers,
who are less prone to shop around for price and who prefer to buy from familiar websites, made their most recent purchase from an e-tailer, compared to Millennials with e-tailer purchases at 48 percent. Conversely, Millennials were 30 percent more likely than the Baby Boomers to buy directly from a retail shop’s website (Figure 1.5).
Figure 1.5
Where most recent purchase was made (%)
An online-only retailer
0
20
40
60
80
100
120
0
20
40
60
80
100
120
Retailer’s website
Manufacturer or brand’s website
Other
58
10
5
11
34
12
10
33
57
18
42
46
5
11
10
11
43
4516
29
5128
56
4570
36
6
13
27
54
7
10
34
50
6
10
35
48
Baby Boomers
Generation X Millennials
6
13
27
54
7
10
34
50
6
10
35
48
Baby Boomers
Generation X Millennials
Nor
th A
mer
ica
Lati
n A
mer
ica
Wes
tern
Eur
ope
Afr
ica
& M
iddl
e Ea
st
East
ern
Euro
pe &
Rus
sia
Asi
a
Aus
tral
ia &
New
Zea
land
Sou
rce:
Glo
bal O
nlin
e C
onsu
mer
R
epor
t, K
PM
G In
tern
atio
nal,
2017
©2017 KPMG International Cooperative (“KPMG International”). KPMG International provides no client services and is a Swiss entity with which the independent member firms of the KPMG network are affiliated.

12 2017 Global Online Consumer Report
Figure 1.6
Preferred device for shopping online (%)
0
20
40
60
80
100
120
0
20
40
60
80
100
120
29
29
6659
6560
24
76
63
7156
18
595
10
27
48
198
25
5458
33
Nor
th A
mer
ica
Lati
n A
mer
ica
Wes
tern
Eur
ope
Afr
ica
& M
iddl
e Ea
st
East
ern
Euro
pe &
Rus
sia
Asi
a
Aus
tral
ia &
New
Zea
land
54
116
29
5589
28
67410
20
Laptop or PC
Smartphone
Tablet
No preference
Baby Boomers
Generation X Millennials
or laptops, while 17 percent said they preferred to use a mobile device and 27 percent had no preference (Figure 1.6).
Device preferences varied significantly by region, with Asian consumers being more than twice as likely (19 percent) as the global average (8 percent) to shop on a smart phone. This was particularly
Device preference trendsDespite the global proliferation of mobile smart phones and tablets, the majority of consumers still prefer traditional desktop PCs or laptops when shopping online. More than half (57 percent) of online purchasers globally said they prefer to use desktop PCs
evident in China, where 26 percent favored a mobile device. As expected, Millennials were the generation most likely to use a smartphone for shopping (11 percent of recent purchases) although 54 percent of them still used a laptop or desktop PC for their most recent online purchase.
“One of the reasons that China is so mobile-centric is because third-party payment systems using mobile apps are widely accepted in China both online and in shops. Chinese consumers are unique in their high confidence in third-party payment systems. Another reason is the high penetration of smartphones—largely due to the number of local manufacturers and competitive prices. Lastly, a lot of people have leapfrogged to ecommerce because of the lack of shops or brands available to them. The smartphone literally brings shops to rural consumers for the first time.”
— Jessie Qian, Head of Consumer Markets, KPMG in China
Sou
rce:
Glo
bal O
nlin
e C
onsu
mer
R
epor
t, K
PM
G In
tern
atio
nal,
2017
©2017 KPMG International Cooperative (“KPMG International”). KPMG International provides no client services and is a Swiss entity with which the independent member firms of the KPMG network are affiliated.

2017 Global Online Consumer Report 13
Smart phones keep offline shoppers connectedWhile mobile may not be the most preferred online sales channel, over two-thirds of the consumers said they had used a smartphone for product research while in a physical shop (Figure 1.7).
This was particularly common in Singapore (83 percent), Brazil
(79 percent), CEE (78 percent) and the US (77 percent), whiles many European consumers are about 10 to 15 percent less likely than average to look up products online while out shopping.
Millennials in all regions were more likely than their older counterparts to look up information on a smartphone while out shopping (77 percent). However, even half of the oldest
generation of respondents said they had checked their mobile devices while in a shop.
What were consumers looking up? Comparing prices was the main reason for doing online research while out shopping, followed by looking up product information and checking online reviews (Figure 1.8).
“Companies should be channel agnostic, meaning it does not matter if they start with online or offline, what matters is that all channels are interlinked to give consumers the convenience they need. Online plays a major part in the customer journey or ROPO (research online, purchase offline). The most successful multi-channel companies established their online channels as early as the late nineties, went on to establish ‘click and collect’, eradicated silos across the entire organization and established a channel agnostic incentive program so retail staff do not consider online as a separate business.”
— Paul Martin, UK Head of Retail, KPMG in the UK
50%
70%
77%
Baby Boomers
Generation X Millennials
Figure 1.7 Percentage of consumers that have used their smartphone to look up a product while in a shop
Figure 1.8
Percentage of consumers that looked up the following information about a product while in a shop
Price comparison with other retailers
65%
Product information/ specifcations
61%
Onlinereviews
49%
Product options (e.g. color, size, style, etc.)
35%
Store inventory/availability
16%
Sou
rce:
Glo
bal O
nlin
e C
onsu
mer
R
epor
t, K
PM
G In
tern
atio
nal,
2017
Sou
rce:
Glo
bal O
nlin
e C
onsu
mer
R
epor
t, K
PM
G In
tern
atio
nal,
2017
©2017 KPMG International Cooperative (“KPMG International”). KPMG International provides no client services and is a Swiss entity with which the independent member firms of the KPMG network are affiliated.

14 2017 Global Online Consumer Report
The path to purchase journeyThe ‘path to purchase’ is a traditional shopping concept that has evolved significantly over the past decade due to the internet, digital innovation and the subsequent rise of online shopping. Although the digital revolution hasn’t altered the fact that consumers still experience the same stages of awareness, consideration, conversion and evaluation, the journey itself has changed. Instead of a path to purchase that is traditionally linear, it has become more of a cycle or even a web. Consumers move through and back and forth between the stages, influenced by a myriad of both offline and online factors at every stage.
In order to investigate the drivers, motivators and inhibitors affecting
consumers’ decisions during a typical online transaction, a simplified cyclical path to purchase model was used for this study (Figure 2.0). Respondents were asked to describe their behavior during their most recent online transaction at each of four stages:
Awareness When they first became aware of or had a desire for the product
Consideration When they were researching the product online or offline
Conversion When they were deciding where and when to buy the product
Evaluation After they made the purchase
“To create loyalty with Millennials, brands need to first cover the basics—that means top notch customer service and quick, individualized responses, through the channels they use such as social media and messaging. But beyond that, brands need the right content strategy. They need to engage Millennials with communications that are both entertaining and informative. Elements of gamification or exclusivity can work well. Some of the footwear brands that are popular with Millennials use limited editions to create product and brand buzz. Millennials will line up physically and digitally to get their hands on these exclusive products.”
— Joel Benzimra, Global Advisory Lead for Consumer Markets, KPMG International
©2017 KPMG International Cooperative (“KPMG International”). KPMG International provides no client services and is a Swiss entity with which the independent member firms of the KPMG network are affiliated.

2017 Global Online Consumer Report 15
In an online shop
16.7
30 Online: 59% Offline: 52%
1515
10
7
10
22
15
13
98
12
In an advertisement
In an online review
In a social media post or blog
In an email promotion
In an online article or magazine
In a physical shop
Talking with my friends
Talking with my family
I saw a friend with it
in a print magazine or newspaper
I saw it on TV or in a movie
Online shop
30%
Any online channel: 59%
Any offline channel: 52%
15%15%
10%
7%
10%
22%
15%13%
9% 8%
12%
Online advertisementOnline review
Social media post or blogEmail promotionOnline article or magazine
Physical shopTalking to friendsTalking to family
Saw a friend with itPrint magazine or newspaperOn TV or in a movie
Stage 1 — Awareness: triggers and influencersWhen comparing the impact of online versus offline touchpoints in creating the first trigger moment, it is interesting to observe that 52 percent of consumers cited at least one offline channel as a source of initial awareness, and 59 percent cited one or more online channels (Figure 2.1).
Using a multi-channel strategy to create awarenessRetail websites or online shops were the most common source of initial product awareness, cited by nearly a third of consumers, and online advertisements were cited by 15 percent. At the same time, physical shops were the second most popular source of awareness, cited by 22 percent of consumers.
Ecommerce is clearly far from being an online-only affair. Both online and
Figure 2.0 Simplified path to purchase Stages of the online purchase journey
Figure 2.1 Channels where consumers saw the product before purchasing
offline channels are effective in creating consumer awareness and demand, especially when they are used together.
This is true for both corporate-controlled channels (shops, websites, advertising), as well as third-party sources of information. After websites, shops or online advertising, the most common sources of product awareness were online reviews (cited by 15 percent), talking with friends (15 percent), social media (13 percent) or seeing a friend with it (12 percent).
Consideration:product and
company research
Conversion:deciding where and
when to buy
Awareness:triggers and influencers
Evaluation:experience
andfeedback
Awareness:triggers and influencers1.
Conversion:where and when to buy3.
Evaluation:experience and feedback4. Consideration:
product and company research2.
Sou
rce:
Glo
bal O
nlin
e C
onsu
mer
R
epor
t, K
PM
G In
tern
atio
nal,
2017
©2017 KPMG International Cooperative (“KPMG International”). KPMG International provides no client services and is a Swiss entity with which the independent member firms of the KPMG network are affiliated.

16 2017 Global Online Consumer Report
Consumers’ increasing reliance on peers or ambassadors means that customers are among the most influential promotional conduits for companies. Both online and offline, the frequency of peer opinions as top awareness influencers highlights the significance of creating brand ambassadors and delivering a positive customer experience.
Awareness triggers by generationMillennials are not only more likely than the older generations to be influenced
by online sources such as social media or peer reviews—they are also more likely to be influenced by offline channels. Millennials were 25 percent more likely than Baby Boomers to have seen their most recent purchase in a shop, nearly 50 percent more likely to have talked to a friend about it, and more than twice as likely to say they saw a friend with it (Figure 2.2).
Although Millennials are certainly digital natives first, they are also at least as active and influenced as their parents are beyond the digital world.
Stage 2 — Consideration: product and company researchDuring the consideration stage, the importance of online channels continues to prevail, with the top two channels for research being online reviews (cited by 55 percent of respondents) and company websites (47 percent) (Figure 2.3).
Offline channels are also a significant source of information, with 26 percent of consumers saying they visited a physical shop during the research stage and 23 percent saying they spoke to friends or family about the product.Figure 2.2
Offline channels where consumers saw the product before purchasing, by generation
Figure 2.3 Percentage of consumers using the following channels to research products they bought online
Online search for reviews and recommendations
Visited thecompany website
Visited physical storesto see, try or fit the product
Spoke with my friendsor family about it
23%
55% 47%
26%
18%
22%24%
Baby Boomers
12%13%
17%
8%
11%
17%
Physical shop Talking with friends Saw a friend with it
Generation X Millennials
Sou
rce:
Glo
bal O
nlin
e C
onsu
mer
R
epor
t, K
PM
G In
tern
atio
nal,
2017
Sou
rce:
Glo
bal O
nlin
e C
onsu
mer
R
epor
t, K
PM
G In
tern
atio
nal,
2017
©2017 KPMG International Cooperative (“KPMG International”). KPMG International provides no client services and is a Swiss entity with which the independent member firms of the KPMG network are affiliated.

2017 Global Online Consumer Report 17
Case study
Ryohin Keikaku (Muji)Kenji Takeuchi — Executive Officer
©2017 KPMG International Cooperative (“KPMG International”). KPMG International provides no client services and is a Swiss entity with which the independent member firms of the KPMG network are affiliated.
Muji, founded in the 1980s, is a globally renowned Japanese retail brand selling more than 7,000 household goods, apparel and food items. Their products are sold both through their online store, and in over 700 shops around the world—mainly in Japan, as well as in over 26 other countries. As an Executive Officer at Ryohin Keikaku (RKJ), Kenji Takeuchi is in chargeof Muji’s corporate planning, finance and IT.
Japan business leads in ecommerce
Ecommerce is a key part of Muji’s business, although there is still room for growth in their online sales, especially outside of Japan. According to Takeuchi-san, “In Japan, Muji’s online transactions account for around 10 percent of total sales, whereas in other countries it is lower; in Germany and China for example, only about 4 percent of sales come from online.”
Targeting different segments
Muji’s target market is not based solely on demographics, but on market size and respective consumer behaviors. “We target customers who are trend-conscious and are leading total consumer spending in each region. For example, Generation X are the main target in Japan because they have a highinterest in shopping, and also have the disposable income.”
In China, on the other hand, “Millennials are the main target because we regard them as the most up-to-date on trends and they are highly engaged digitally”, says Takeuchi-san. He also notes that, “In Japan, where the retail market is very mature, there are not many differences between generations in terms of online shopping. The only difference Muji sees is that Millennials contribute to information diffusion, while Generation X consumers lead in consumption.
Muji is a true omni-channel retailer
Muji actively pursues synergies between its offline and online channels, and they have formal key performance indicators (KPIs) in place that ensure these synergies are maximized. According to Takeuchi-san, “The number of customers that visit our shops is a KPI for our ecommerce division. One of the objectives of that group is to direct consumers shopping online to come into our physical locations.”
In addition to online to offline, Takeuchi-san discusses how their customers also go from shopping offline to online. “Furniture is a category that people often prefer to shop for in person, so they can see and touch the products. However, the final purchase decision may not be made until the consumer
goes home and is able to measure and see if it will fit in their space. To allow customers to then purchase the items online, we ensure that they can be easily ordered and quickly delivered.”
Communicating content instead of specific products
Muji does not advertise their specific products but instead relies on consumers seeking new trends, styles, and information. According to Takeuchi-san, “Our advertising style is focused on the communication of a concept. We use our online asset ‘MUJI.net community’ and online loyalty program ‘MUJI passport’ to communicate concepts and provide information that can be shared on Facebook or Instagram, to entice consumers to visit our website or stores.”
Muji uses its loyalty program to encourage customers to provide feedback and promote the company’s products online. Members receive ‘MUJI Miles’ not only for making purchases, but also for checking into stores, posting product comments or participating in other promotions.
Online community is a point of differentiation
The MUJI.net community is considered to be an area of differentiation for Muji. The brand has developed a loyal member base through this community, with which they regularly communicate regarding trends and products. Takeuchi-san explains, “We provide interactive content, and columns to publish our views on social issues, and we engage customers in product development by asking for their ideas and opinions. This contributes to building loyalty among our customers.”

18 2017 Global Online Consumer Report
“Consumers are firmly in charge today and they are looking at personalization of services. Today’s consumer is more similar to the 1920’s consumer with a personal relationship with shopkeepers. Therefore, big data is important – retailers should understand what individual consumers buy and what they do. They should cater to consumers as individuals.”
— Paul Martin, UK Head of Retail, KPMG in the UK
Millennials are 50 percent more likely than Baby Boomers to visit a store As in the awareness stage, Millennials are more likely than both Generation X and Baby Boomer consumers to use offline channels during the consideration stage. While online reviews and product websites are most frequently consulted, Millennials were also nearly 50 percent more likely than Baby Boomers to research a product by visiting a store or talking to friends and family (Figure 2.4).
Trust in online reviews vs company websites varies by region
In Asia, Eastern Europe and Russia, consumers seem to put a much heavier
reliance on online reviews vs corporate websites than other regions (Figure 2.5). This comparatively lower trust in corporate content can be a risk for companies in these regions since they lack control over messaging and product information contained in consumer reviews. In addition to having informative websites, these companies need to pay particular attention to ensuring that have favorable reviews on social media and other third party forums.
Factors driving final product decisionsOverall, price or promotions (identified by 27 percent of respondents) were the factors most likely to influence consumers’ decision regarding which product or brand to buy online. After
price and promotions, product features (23 percent) or brand reputation (22 percent) were also commonly identified as the top considerations when making a final product choice (Figure 2.6).
Product decision factors varied by category. For fashion, food and luxury items, brand reputation was a particularly important consideration, although price was still the top decision factor (especially for luxury items, cited by 33 percent). For cosmetics, however, brand reputation and online reviews were the leading considerations (27 and 21 percent respectively), and for electronics, product features were most important (25 percent), closely followed by price, brand reputation and online reviews (each cited by one-fifth of the electronics buyers).
Figure 2.4
Channels used to research online purchases — by generation
Baby Boomers
Did online search for reviews & recommendations
Visited thecompany website
Online channels Offline channels
Generation X Millennials
52%56%56%
45%48%48%
Visited physical stores to see, try or fit the product
Spoke with my friends orfamily about it
20%
30%26%
19%
27%
20%
Sou
rce:
Glo
bal O
nlin
e C
onsu
mer
R
epor
t, K
PM
G In
tern
atio
nal,
2017
©2017 KPMG International Cooperative (“KPMG International”). KPMG International provides no client services and is a Swiss entity with which the independent member firms of the KPMG network are affiliated.

2017 Global Online Consumer Report 19
Did online search for reviews & recommendations
Online channels
Offline channels
Visited thecompany website
Visited physical stores to see, try or fit the product
Spoke with friends orfamily about it
42
44
52
32
25
55
49
28
20
55
50
2222
5048
2219
4953
2016
66
42
3131
5
11
64
44
30
25
Nor
th A
mer
ica
Lati
n A
mer
ica
Wes
tern
Eur
ope
Afr
ica
& M
iddl
e Ea
st
East
ern
Euro
pe &
Rus
sia
Asi
a
Aus
tral
ia &
New
Zea
land
Figure 2.5
Percentage of consumers using the following channels to research online purchases — by region
Figure 2.6 Factors driving purchase decisions
27% Price/promotions
23% Product features
22% Brand
17% Online reviews
5% Newest trends or arrivals
4% Peer influences/ recommendations
2% Complementary products
Decision factors by regionConsumers in Australia, New Zealand, Canada, France, Belgium and South Africa were most likely to be influenced by price or promotions. In these countries, more than 38 percent of consumers said price and promotions were the factors that drove their most recent product choice.
In Asia, on the other hand, brand was typically more important than price, particularly in China and India, where brand reputation was cited twice as often as price (31 percent vs 15 percent). Asian consumers, especially in China, Japan, Hong Kong and India, were also more likely than consumers in any other country to base their final product decision on online reviews (Figure 2.7).
Figure 2.7 Factors driving purchase decisions — by region
Australia orNew Zealand
Price/promotions
Product features
Brand
Online reviews
Other
Asia North America Eastern Europeor Russia
Latin AmericaWestern Europe Africa and Middle East
19%
23%
24%
22%
12%
30%
25%18%
16%
11%29%
25%24%
13%
9%
34%
17%24%
16%
9%
9%
38%
19%
22%
12%15%
27%
15%26%
17%
13% 22%
29%17%
19%
Sou
rce:
Glo
bal O
nlin
e C
onsu
mer
R
epor
t, K
PM
G In
tern
atio
nal,
2017
Sou
rce:
Glo
bal O
nlin
e C
onsu
mer
R
epor
t, K
PM
G In
tern
atio
nal,
2017
Sou
rce:
Glo
bal O
nlin
e C
onsu
mer
R
epor
t, K
PM
G In
tern
atio
nal,
2017
©2017 KPMG International Cooperative (“KPMG International”). KPMG International provides no client services and is a Swiss entity with which the independent member firms of the KPMG network are affiliated.

20 2017 Global Online Consumer Report
Stage 3 — Conversion: deciding where and when to buyIn the conversion stage of the online purchase journey, the consumer exercises two decisions: where, and when, to buy a product. In the online shopping arena, however, successfully engaging consumers during the first two stages of the purchase journey far from guarantees success in the third stage.
Informed online consumers will not hesitate to glean their inspiration and information from one or more sources, only to buy from another. Understanding the priorities of different types of consumers during this critical stage can give companies the advantage they need to win the coveted final sale.
Deciding where to buyAs during the final product decision stage, price remains as the most common consideration when consumers are deciding where to buy (Figure 2.8), particularly in certain categories such as electronics. Having a website that consumers like and/or trust is also important, especially in Asia, where consumers said buying from a preferred website was more important than price.
In developed nations such as North America, Australia, New Zealand, and Western Europe, stock availability was a higher priority than in it was for consumers in other countries, particularly when buying fashion or luxury items. Consumers buying fashion items were also on average three times more likely to choose a vendor based on their returns policy.
Generally speaking, the decision factors most often considered by consumers choosing vendors were consistent across age groups, although Millennials were considerably more likely than the older generations to choose a vendor based on price than website preference (Figure 2.9). This could partly be due to Millennials’ lower disposable incomes,
or being relatively more online savvy or comfortable with online shopping in general.
Having a trusted website will always be important, but even as Millennials’ incomes grow, competitive pricing is expected to continue to rise in importance during vendor selection.
Figure 2.8
Most important attributes when deciding where to buy
Best price
Preferred website
Best deliveryoptions/price
Stockavailability
Peer advice
Returnspolicy
36%
30%
17%
14%
2%
1%
Figure 2.9
Top attributes when deciding where to buy — by generation
Best pricePreferred website
Preferred website
Bestprice
Preferred website
Bestprice
32% 31%
35%
27%
Baby Boomers
Generation X Millennials
40%
33%31%
27%
Baby Boomers
Generation X Millennials
33%31%
27%
Sou
rce:
Glo
bal O
nlin
e C
onsu
mer
R
epor
t, K
PM
G In
tern
atio
nal,
2017
Source: Global Online Consumer Report, KPMG International, 2017
©2017 KPMG International Cooperative (“KPMG International”). KPMG International provides no client services and is a Swiss entity with which the independent member firms of the KPMG network are affiliated.

2017 Global Online Consumer Report 21
Case study
Grana Luke Grana, CEO
Luke Grana is CEO and Co-Founder of the innovative online fashion retailer, GRANA. He, along with Pieter Paul Wittgen (COO and Co-Founder), have overseen the company’s growth from a small startup just two years ago to an international brand, now shipping to twelve countries. GRANA’s core aim is to manufacture and sell high-quality clothing at affordable prices, by cutting the costs associated with most traditional sales and distribution channels.
Winning and creating loyal online customers
GRANA’s ‘fun and cheeky’ social media presence boosts rapport and in turn, brand loyalty, with their customers. They boast over 23,000 ‘likes’ on Facebook, as well as over 24,000 followers on Instagram. It is on these social media platforms where they interact with their core market of Millennials, in a way that goes beyond just showcasing their fashions.
Never having invested in traditional advertising or promotion methods, GRANA instead relies on social media, digital campaigns and word-of-mouth recommendations to build brand awareness and drive online conversion. To support their ecommerce platform, GRANA has also created over twelve pop-up stores in Australia, Hong Kong, Singapore and the US, in addition to a flagship showroom called ‘The Fitting Room by GRANA’, located in Sheung Wan, Hong Kong.
These physical locations serve a dual purpose: they introduce the brand to those who have not already encountered it online, and they allow both new and existing customers to feel the fabrics and try on clothing to find the right fit. Although The Fitting Room and pop-ups carry no inventory, the buying experience is easy for those unaccustomed to online shopping, as staff are at hand to help customers order items online, on the spot, for delivery to customers’ homes.
Returning customers comprise 50 percent of GRANA’s sales. Luke attributes this loyalty to quality, pricing, swift delivery and attention to customer service—such as the personalized handwritten thank you cards that are included with each delivery, or the real-time live chat option available on their website.
Looking at the future
Initially, GRANA experienced most of their sales in Hong Kong where it is still strategically headquartered. However, their highest growth market is now the US. The company is planning to open their next pop-up showroom experience in New York City, in an effort to increase their US customer base even further. The startup also recently attracted Alibaba’s Entrepreneur Fund as a new investor, and with their support, GRANA plans to enter the mainland China market in 2017, complete with a Chinese language website.
“We’re really excited to have investment support from Alibaba, and we’re looking forward to working closely with their team to enter the mainland market,” says Luke. “Chinese consumers have already matured when it comes to the adoption of online shopping, and we see tremendous potential there in the medium-to-long-term.”
©2017 KPMG International Cooperative (“KPMG International”). KPMG International provides no client services and is a Swiss entity with which the independent member firms of the KPMG network are affiliated.

22 2017 Global Online Consumer Report
0
9
18
27
36
45
0
5
10
15
20
25
30
35
43
35
32
30
26
22
14
Nor
th A
mer
ica
Lati
n A
mer
ica
Wes
tern
Eur
ope
Afr
ica
& M
iddl
e Ea
st
East
ern
Euro
pe &
Rus
sia
Asi
a
Aus
tral
ia &
New
Zea
land
2829
34
Baby Boomers
Generation X Millennials
Stage 4 — Evaluation: experience and feedbackIn a circular or web path to purchase model, the evaluation stage is at least as important as, and inextricably linked with, the awareness and consideration stages. Positive customer experiences are critical in generating loyalty and repeat purchases, and in an era of social media and increasingly trusted peer reviews, voicing customer experiences can significantly influence future buying decisions—both positively and negatively.
The rise of online feedbackAround 30 percent of online consumers said they posted product feedback online and, in Asia, consumers were nearly 50 percent more likely than average to post a review (Figure 2.10). Consumers in the US, Turkey and Latin
America (Brazil to a lesser extent) were also more likely than average to share feedback online. On the other end of the scale, consumers in Australia, Japan and many Western European countries were the least likely to post a review.
Younger consumers were more likely to post a review online, a consumer behavior trend that will likely continue even as they get older. This means that as the more vocal and digitally engaged younger consumers comprise an increasingly larger portion of the consumer base, online feedback will become a more frequent and influential part of the marketing mix.
Reviews are generally positive A significant majority (92 percent) of the reviews that consumers across all age groups shared online were positive (Figure 2.11). The growing tendency for
consumers to post positive reviews is driven by many trends, including the rise of social media, where consumers subtly compete with their peers by publicly sharing their latest purchases and experiences; the rise of bloggers whose business models are based on providing product reviews that drive affiliate clicks; and sellers who proactively solicit ratings from happy customers.
Figure 2.10
Percentage of respondents who shared product feedback online
Figure 2.11 Type of feedback most recently shared online
92% Positive
2% Negative
6% Neutral
Sou
rce:
Glo
bal O
nlin
e C
onsu
mer
R
epor
t, K
PM
G In
tern
atio
nal,
2017
Source: Global Online Consumer Report, KPMG International, 2017
©2017 KPMG International Cooperative (“KPMG International”). KPMG International provides no client services and is a Swiss entity with which the independent member firms of the KPMG network are affiliated.

2017 Global Online Consumer Report 23
“The older consumers are very concerned about data privacy and hence trust in the companies they buy from and share information with is important. On the other hand, younger consumers are less concerned about privacy. As long as they can gain a benefit from sharing their information, they will do it. This trait will become mainstream in the future.”— Stephan Fetsch, Head of Retail, KPMG in Germany
Figure 2.12
Sites where consumers shared feedback (%)
47
31
18
17
12
11
11
10
9
4
3
3
21
Seller’s website
Manufacturer or brand website
Online forum
Blogs
YouTube
Snapchat
Other
4731
1817
121111
10
10
94
33
21
Seller’s website
FacebookManufacturer or
brand websiteWhatsApp
Online forum
Blogs
YouTube
Snapchat
Other
mastered this approach, but most brands have yet to fully do so.
Regionally, there is variation in the most popular social media platforms (Figure 2.14). Although Facebook is the most common platform in nearly all regions, it is by far the preferred choice in North America and Australia. Instagram and Twitter are predominantly North American channels, and WhatsApp is particularly popular in Hong Kong, India, Africa, and Latin America. In China, where many US-based social media channels are not available, WeChat dominates, although its use is virtually exclusive to that country.
Increasing influence of social media Understanding where consumers are posting feedback can help companies become more proactively engaged in monitoring, managing and fostering positive online customer reviews.
Currently, consumers are most likely to post directly to seller websites (Figure 2.12). Many popular online sellers have feedback mechanisms built in to solicit comments from customers shortly after their purchase has been received. By waiting a few days for unhappy customers to register a complaint or return a product, savvy sellers can selectively reach out to those
customers who are likely satisfied and willing to post a positive review.
Generational trends indicate an increasing use of social media sites such as Facebook, WhatsApp, Instagram, blogs and Twitter for posting and reviewing feedback (Figure 2.13). The implication for companies is that user-generated reviews are being posted on sites that are increasingly beyond their sphere of control or influence. Companies will need to actively integrate these social media sites into their marketing and customer strategies. Many digitally innovative retailers and brands have already
Figure 2.13
Sites where consumers shared feedback (%) — by generation
Seller’swebsite
43
4946
2529
34
2218 17
3
9
18
4
911 12
10 11
16 16 17
610
12 1310 10
3 35
1 25
13 4
Facebook Manufacturer or brand website
Instagram Twitter Onlineforum
WhatsApp Blogs WeChat YouTube Snapchat Pinterest
Baby Boomers Generation X Millennials
Sou
rce:
Glo
bal O
nlin
e C
onsu
mer
R
epor
t, K
PM
G In
tern
atio
nal,
2017
Source: Global Online Consumer Report, KPMG International, 2017
©2017 KPMG International Cooperative (“KPMG International”). KPMG International provides no client services and is a Swiss entity with which the independent member firms of the KPMG network are affiliated.

24 2017 Global Online Consumer Report
Figure 2.15 Length of purchase cycle by region and generation (%)
Cycle durationShort decision cycles leave little time to influence potential customersFor the majority of online transactions, the path from awareness to conversion is very short—71 percent of consumers
surveyed made their purchase within a week of awareness or desire. Nearly one-third of the respondents said they purchased the item on the same day. This brief window for brands to influence potential customers makes it critical for them to understand what drives consumer behavior and decisions at every stage.
Although the survey results revealed that some consumer segments such as Millennials or Eastern Europeans and Russians, seem to take comparatively longer to make purchases, in general, there was little variation in the length of time spent in each stage based on age or geography (Figure 2.15).
Nor
th A
mer
ica
Lati
n A
mer
ica
Wes
tern
Eur
ope
Afr
ica
& M
iddl
e Ea
st
East
ern
Euro
pe &
Rus
sia
Asi
a
Aus
tral
ia &
New
Zea
land
The same day
0
20
40
60
80
100
120
0
20
40
60
80
100
120
Less than 1 week1-2 weeks
2-4 weeks
1-3 months
More than 3 months
39
34
15
642
27
40
20
832
32
39
16
742
29
43
16
65
3
25
38
19
77
3
32
44
15
531
35
36
15
752
1
36
41
13
63
2
33
40
16
64
2
27
41
19
74
Baby Boomers
Generation X Millennials
WeChatBlogsWhatsAppTwitter
6
17
2529
40
62
6
26
1010
38
Nor
th A
mer
ica
Lati
n A
mer
ica
Wes
tern
Eur
ope
Afr
ica
& M
iddl
e Ea
st
East
ern
Euro
pe &
Rus
sia
Asi
a
Aus
tral
ia &
New
Zea
land
26
23
1012
29
1
8
15
58
25
510
1
8
1527
1410
6 8
21
25
83
16
42
Figure 2.14
Most popular social media sites for feedback (%) — by region
Sou
rce:
Glo
bal O
nlin
e C
onsu
mer
R
epor
t, K
PM
G In
tern
atio
nal,
2017
Sou
rce:
Glo
bal O
nlin
e C
onsu
mer
R
epor
t, K
PM
G In
tern
atio
nal,
2017
©2017 KPMG International Cooperative (“KPMG International”). KPMG International provides no client services and is a Swiss entity with which the independent member firms of the KPMG network are affiliated.

2017 Global Online Consumer Report 25
Case study
TFG Group Robyn Cooke — Head of ecommerce
©2017 KPMG International Cooperative (“KPMG International”). KPMG International provides no client services and is a Swiss entity with which the independent member firms of the KPMG network are affiliated.
TFG is one of the leading independent retail groups in South Africa. It has grown to 22 different retail brands, with 3 operating internationally and the rest in South Africa. Robyn Cooke heads the ecommerce division for TFG globally and as she previously served in ecommerce roles in other regions she has a uniquely global perspective on what makes ecommerce in South Africa different.
TFG: aiming to grow e-commerce business by 30-40 percent
While currently 11 of its 22 brands are trading online, TFG is on a 5-year trajectory to get all 22 brands trading online.
According to Cooke, the average contribution of online sales for businesses in Africa is just around 1 percent today. She says that this puts South Africa still in an earlier stage of ecommerce adoption: “If we would say the US is in year 17 or 18 of ecommerce adoption, then comparatively South Africa would be in year 5 or 6. It’s a young and nascent market, but strategically very important”. For TFG, a
higher than average 1.5 to 2 percent of all sales is transacted online, well ahead of the market, and Cooke expects this to grow to 5 percent in the next few years based on an annual growth rate of 30 to 40 percent.
Replenishment buying – not all fashion purchases require touch and trial
Cooke agrees with the finding in this report on the importance of allowing customers to touch and feel products, and that it can be a barrier for online sales. However, as per Cooke, about 60% of TFG’s online sales are for replenishing products; items that consumers purchased previously and where they like to buy another color or type. As there is less of a need for touching and trying the product for these scenarios they are excellent ecommerce growth opportunities. In addition, within TFG’s segment of disposable fashion the need to touch, feel and try fashion is less important than in other fashion segments.
Online-only retailers limit customers’ choice
When talking about online to offline conversion and vice versa, Cooke fully agrees to the advantages of having a multi-channel online and offline retail platform. Consumers are neither online or offline, they just choose what fits them best each time. Says Cooke: “Within our platform, customers are able to check store stock levels online so they can pick-up their desired item in a store. In terms of returns, they can choose to return items to physical stores if that is easier for them. I feel that online-only retailers limit consumer choice as they can’t offer these types of benefits.”
Offline shops are here to stay
Connected to the above, Cooke believes that offline retail is not at all under threat with the proliferation of online retailers. She comments: “Online only retailer businesses in South Africa are difficult to sustain because most are working on funding, and there is a lot of pressure to get to a profitable level. It is still questionable how this will pan out for the pure e-tailer players in the market”.
Future developments in fashion retailing
TFG foresees that in the future they will offer more trendy shopping micro sites, driven by shoppers’ need for convenience. This can be in the form of ‘event categories’ such as weddings or music festivals, or it can be in the form of lifestyle trends such as ‘nesting’. TFG believes they can leverage their diversity by providing all the products within these categories on one platform.
On developments in payment methods, WeChat’s global expansion
South Africa has been a credit-driven market, through private label credit offered through stores. However, this is becoming more balanced with cash payments increasing in recent years, which are managed through mobile payments or electronic fund transfers. Furthermore, WeChat, in combination with ‘SnapScan’ offer South Africans in-store mobile payments.
Innovative solution for secure and convenient delivery
Unique challenges in South Africa drove TFG to find an innovative delivery solution. Most consumers in South Africa are not at home during regular hours to receive packages, and there is a high crime rate. To meet the need to provide a secure and convenient delivery option, TFG collaborated with a start-up company that works with a network of video stores and 24-hour petrol stations to provide secure locations where customers can pick up their packages at any time.

26 2017 Global Online Consumer Report
While the tendency for Millennials to be more ‘time-rich’ and ‘cash-poor’ than older generations can help explain why they might spend more time doing research, the average time that online consumers took to make a purchase was more related to the type and value of product being bought.
Electronics, especially telecommunication devices, had the longest purchase journey, due to more time typically being spent comparing product features, researching the latest trends and innovations, or finding the best price or promotion. Luxury products also had relatively longer sales cycles, although 70 percent of luxury purchases were still made within a week (Figure 2.16).
While consumers are less likely to purchase electronics, luxury goods, household furniture or appliances on impulse, food and other consumables such as beer, medicine, alcohol and pet food were frequently purchased on the same day. Books and music also often fell into the impulse category (Figure 2.17).
For products of relatively lower value, and where consumers are already familiar with the products on offer (often regular purchases), the evaluation stage is often skipped completely as consumers move straight from awareness to conversion.
In general, sales cycles are longer for higher-priced items and products that consumers typically buy less often. Brands and retailers selling products
with longer cycles have more time and opportunity to influence buying decisions during the consideration process—provided they know when potential customers are in this stage, and what sources they are using to do their research.
Impulse categories present another type of challenge for consumer companies. Consumables are usually products that consumers buy repeatedly, or sometimes buy impulsively on trial. While it’s important for brands selling consumables to have positive online reviews and informative websites, marketing to consumers before they even reach the awareness stage, or promoting relevant products right at the time of purchase, is going to have the most impact.
Figure 2.16
Purchase duration by product category and price (%)
ElectronicsCosmetics Fashion Food
41
29
46
15
5 6 417
4121
11
31
32
42
5
17
21
47
37
94
Below US$100Luxury US$100-$500 Over US$500
5 1
31
39
17
7 53
36
41
14
5 21
25
40
8
20
83
20
34
14
21
The same dayLess than 1 week
1-2 weeks
2-4 weeks
1-3 months
More than 3 months
Figure 2.17
Impulse vs longer cycle categories
Most impulsive Percentage of purchases categories made same day
Food/groceries 51%Beer 49%Pharmacy/healthcare 46%Wine 44%Books/music 43%Pet food and supplies 41%Liquor 36%
Least impulsive Percentage of purchases categories made same day
Telecommunications/phones 10%Furniture/home decor 14%Electronics/computers/peripherals 15%Household goods and appliances 18%Fine jewelry/watches 18%Sporting goods/equipment 18%
Source: Global Online Consumer Report, KPMG International, 2017
©2017 KPMG International Cooperative (“KPMG International”). KPMG International provides no client services and is a Swiss entity with which the independent member firms of the KPMG network are affiliated.

2017 Global Online Consumer Report 27
Understanding consumer attitudes and motivations
What drives a customer to buy online or offline in the first place? Why do they trust some companies or websites over others? And what motivates someone to become a repeat customer or loyal ambassador? Understanding these consumer sentiments is critical for companies when formulating their brand, market positioning and overall experience offering.
What’s driving the shift to online?When consumers were asked what factors motivated them to buy online instead of going to a shop, the top reasons were time flexibility and cost savings (Figure 3.0).
Consumers also said they preferred shopping online to avoid the negative experiences associated with going out to shops—these consumers in
Figure 3.0
Reasons consumers shop online instead of in stores
Ability to shop 24/7
Ability to compare prices
Online sale/better prices
To save time
Convenience of not going to shops
Greater variety/selection
Free shipping offers
Convenience of everything in once place
To locate hard to find items
To avoid crowds
Products are not sold in my city/country
To avoid checkout lines
ConveniencePrice-related
Push from offline
Ease of selection
Free shipping
Only option to buy
58%
54%
46%
40%
39%
29%
29%
27%
20%
15%
15%
11%Source: Global Online Consumer Report, KPMG International, 2017
©2017 KPMG International Cooperative (“KPMG International”). KPMG International provides no client services and is a Swiss entity with which the independent member firms of the KPMG network are affiliated.

28 2017 Global Online Consumer Report
Figure 3.1 Percentage of consumers who shop online to avoid crowds — by country
a way are ‘pushed’ online by the inconveniences of traveling to a shop, being in a crowd, or standing in checkout lines. This was particularly evident in some countries with densely populated cities. Consumers in China, India and Singapore (Figure 3.1), for example, were the most likely to say crowd avoidance was a top motivator to shop online.
Another key driver for some who are buying online is access to products not otherwise available in local shops. Although on average this was one of the least common reasons for shopping online, in certain regions such as Latin America and Asia-Pacific, it was cited as a top reason by a quarter to nearly half of all consumers surveyed.
The countries where consumers were most likely to shop online out of necessity tend to be those where
product availability or selection is limited, or where much of the population lives in remote areas with limited access to shops or certain goods.
Overcoming the hurdles to selling onlineAlthough the percentage of total retail sales made online is unquestionably growing, on average, the majority of consumer purchases are still made in shops (Figure 3.2).
Figure 3.2 Online retail sales as a percentage of total retail sales (US$ trillions) 2015-2020
Ecommerce sales
Sou
rce:
eM
arke
ter,
Aug
201
6
2015 2016 2017 2018 2019 2020
$1.9$1.5
$3.4
$2.4
$2.9
7
$4.1
Ecommerce as a percentage of total retail sales
0
10
20
30
0
10
20
30
7.4%
8.7%
10.0%
11.5%
13.0%
14.6%
“ As more advances in technology such as blockchain or payment apps emerge, the move to cashless societies will create new ways for retailers and online brands to offer benefits to customers. Banks and other payment technology providers, including credit card companies, need to be aware of these changes and join the game, or risk losing their leading positions.”
— Willy Kruh, Global Chair, Consumer Markets, KPMG International
Sou
rce:
Glo
bal O
nlin
e C
onsu
mer
R
epor
t, K
PM
G In
tern
atio
nal,
2017
©2017 KPMG International Cooperative (“KPMG International”). KPMG International provides no client services and is a Swiss entity with which the independent member firms of the KPMG network are affiliated.

2017 Global Online Consumer Report 29
Figure 3.3
Reasons consumers shop in stores instead of online
I want to see/touch item first
I want to try the item on
Concerned products look different
Delivery takes too long
Shipping costs are too high
Product is too valuable to buy online
Enjoy the experience of going to the shopsI have to go to the
shop anywayI want to verify
the authenticityReturn process is
too complicatedDo not trust
online security
I want to talk to a salesperson
Touch/try productShipping
Enjoy experience
Other
56%
55%
41%
34%
25%
24%
23%
16%
15%
14%
13%
11%
“ As part of an integrated customer-centric business model, customers expect that goods can be delivered or picked up wherever they are located. They want their orders consolidated, they want shipping bundled with service, and they want to be able to return things easily. In order to meet these growing demands, companies need either better distribution systems or partners that can do it better for them.”
— Julio Hernandez, Global Customer Lead, KPMG International
Only 23 percent of consumers said they prefer visiting shops to enjoy the shopping experience. Most often, it is because they want to see, touch, try on, or verify the appearance or features of a product before buying (Figure 3.3). Retailers looking to drive online sales of products that consumers are less willing to buy sight unseen may use strategies to persuade them to shop online. These might include providing comprehensive sizing and measuring charts, detailed
photographs with 360° and zoom viewing, free fabric swatches by mail, satisfaction guarantees, or easy returns, to name a few.
As consumers continue to shift their shopping to online, retailers who understand the factors motivating them to shop online or in-store will be better positioned to create sales channels that meet their customers’ evolving needs and preferences.
Winning the online consumerAs explained in the previous chapter, during the conversion stage, having the most competitive price won’t guarantee a sale. Although price was cited by 57 percent of consumers as a top factor in deciding which website to buy from, the next key attributes were enhanced delivery options and easy return policies (Figure 3.4).
Figure 3.4
Most important company attributes when deciding where to buy
The lowest price I can find
Enhanced delivery options
Easy return policy
Payment options
Ability to see if the product is in stock
Information about product ingredients/sources
Consistent & seamless shopping experience across channels
Incentive program or reward for new customers
A promotion that is tailored for me
Ability to buy online and pick up
A limited time promotion
Social media presence
57%
43%
40%
34%
33%
26%
23%
21%
21%
20%
16%
10%
Source: Global Online Consumer Report, KPMG International, 2017
Sou
rce:
Glo
bal O
nlin
e C
onsu
mer
R
epor
t, K
PM
G In
tern
atio
nal,
2017
©2017 KPMG International Cooperative (“KPMG International”). KPMG International provides no client services and is a Swiss entity with which the independent member firms of the KPMG network are affiliated.

30 2017 Global Online Consumer Report
In China, delivery options ranked even higher than price, and in India and Turkey, easy return policies was the most commonly cited attribute.
Millennials less willing to wait for delivery Millennials have a much higher demand for instant gratification than older generations. Although younger consumers are increasingly comfortable
Figure 3.5 Reasons consumers shop in stores instead of online — by generation
Delivery takes too longI want to see/touch the item first
Baby Boomers
Generation X Millennials
62%57%
53%
Baby Boomers
Generation X Millennials
23%
33%39%
with buying products online without seeing them first, they are almost twice as likely to say they’d rather visit shops to get their product right away, rather than buy online and await delivery (Figure 3.5).
Companies will need to continually innovate to shorten delivery times and satisfy increasingly demanding consumer expectations.
“ The majority of payments for online purchases in India at the moment are cash on delivery (COD). This is driven by the high proportion of unbanked population, and the low credit card penetration. However, there has been an increase in use of credit cards, debit cards and e-wallets in the past one and a half years since the government has announced the demonetization move, a big push to curb black money in India. The banks as well are educating their customers and driving them to use other methods of payment. Still though there is a long way to go because the online payment systems are not yet well developed.”
— Rajat Wahi, Head of Consumer & Retail, KPMG in India
Payment options need to be regionally tailoredPayment options ranked fourth (by one third of consumers) among key consideration when selecting a vendor. Consumers in Eastern Europe and certain Western European countries such as Germany, Belgium and Greece, as well as in Russia, India and Latin America, were especially likely to say a company’s payment options are important, and in many cases even more important than their options for delivery or returns.
Sou
rce:
Glo
bal O
nlin
e C
onsu
mer
R
epor
t, K
PM
G In
tern
atio
nal,
2017
©2017 KPMG International Cooperative (“KPMG International”). KPMG International provides no client services and is a Swiss entity with which the independent member firms of the KPMG network are affiliated.
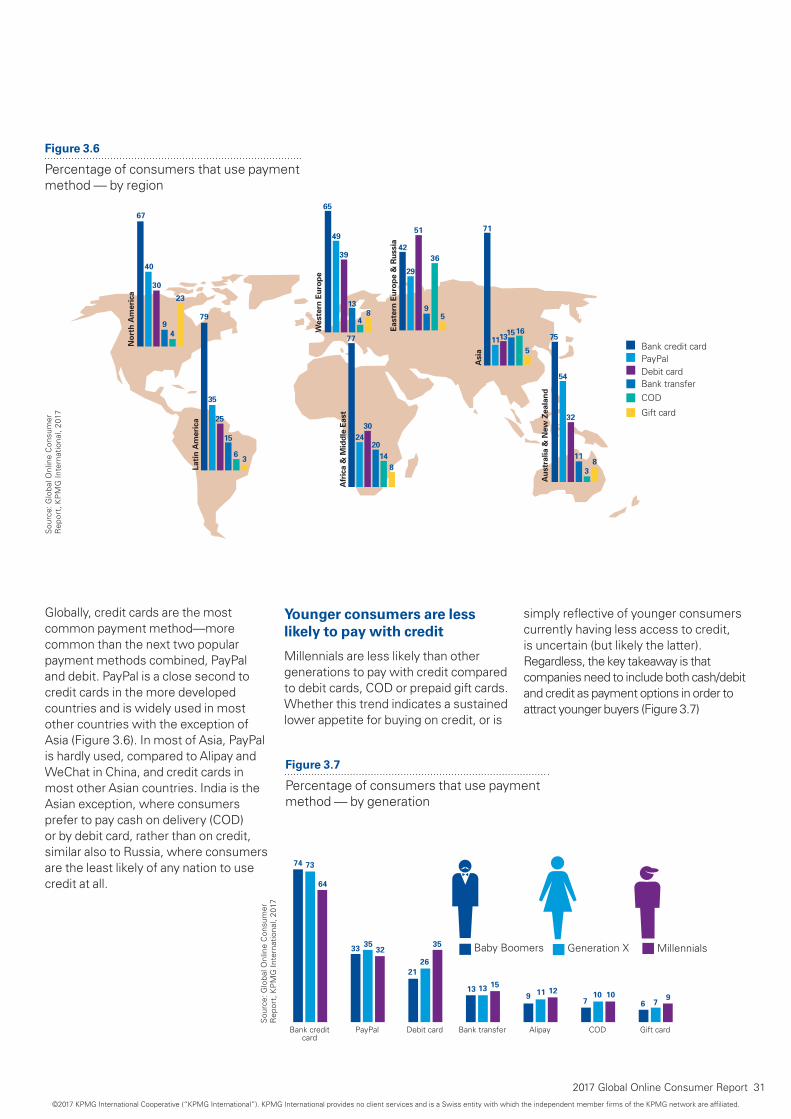
2017 Global Online Consumer Report 31
10
Bank credit cardPayPalDebit cardBank transfer
COD
Gift card
58
5
11 57
10
11
43
42
6
67
40
23
30
94
36
15
25
35
79
814
20
3024
77
42
7151
59
29
36
1615
51113
3
32
11
54
75
8
Afr
ica
& M
iddl
e Ea
st
Nor
th A
mer
ica
Lati
n A
mer
ica
East
ern
Euro
pe &
Rus
sia
Asi
a
Aus
tral
ia &
New
Zea
land
Wes
tern
Eur
ope
65
49
39
4
138
Globally, credit cards are the most common payment method—more common than the next two popular payment methods combined, PayPal and debit. PayPal is a close second to credit cards in the more developed countries and is widely used in most other countries with the exception of Asia (Figure 3.6). In most of Asia, PayPal is hardly used, compared to Alipay and WeChat in China, and credit cards in most other Asian countries. India is the Asian exception, where consumers prefer to pay cash on delivery (COD) or by debit card, rather than on credit, similar also to Russia, where consumers are the least likely of any nation to use credit at all.
Younger consumers are less likely to pay with credit
Millennials are less likely than other generations to pay with credit compared to debit cards, COD or prepaid gift cards. Whether this trend indicates a sustained lower appetite for buying on credit, or is
simply reflective of younger consumers currently having less access to credit, is uncertain (but likely the latter). Regardless, the key takeaway is that companies need to include both cash/debit and credit as payment options in order to attract younger buyers (Figure 3.7)
Figure 3.7
Percentage of consumers that use payment method — by generation
Bank credit card
74 73
64
Baby Boomers Generation X Millennials
PayPal
33 3532
Debit card
2126
35
Bank transfer
13 13 15
Alipay
9 11 12
COD
710 10
Gift card
6 79
Sou
rce:
Glo
bal O
nlin
e C
onsu
mer
R
epor
t, K
PM
G In
tern
atio
nal,
2017
Sou
rce:
Glo
bal O
nlin
e C
onsu
mer
R
epor
t, K
PM
G In
tern
atio
nal,
2017
Figure 3.6
Percentage of consumers that use payment method — by region
©2017 KPMG International Cooperative (“KPMG International”). KPMG International provides no client services and is a Swiss entity with which the independent member firms of the KPMG network are affiliated.

32 2017 Global Online Consumer Report
Case study
ZALORA Tito Costa, Managing Director
Founded in 2012, ZALORA is a leading fashion ecommerce company in Southeast Asia, with presence in Singapore, Indonesia, Malaysia, The Philippines, Hong Kong and Taiwan. Tito Costa is ZALORA’s Managing Director, who joined the company after launching several internet businesses in Europe and Asia when he was with Rocket Internet—one of the early investors in ZALORA’s parent company Global Fashion Group.
Southeast Asia growth
Costa is very optimistic about growth in his region: “Ecommerce in Southeast Asia is still at an infancy stage with online retail accounting for roughly 1-2 percent of total retail sales. Given a lack of traditional retail infrastructure outside of the tier one cities, we expect that over time ecommerce will comprise an even larger share of retail sales when
compared to the US or Europe. We also believe that customer experience, breadth of higher quality assortment and relevant content will play an increasingly important role. Deal-seeking behavior or discount-focused discovery will only be one of many drivers of ecommerce’s future potential.”
Leveraging both online and offline channels
As an online retailer, ZALORA sees offline channels as important for acquiring customers and building brand trust, says Costa, “We have been experimenting with offline retail through pop-up stores since late 2014. Customers at our pop-up stores are able to see our products, try them on and then scan the barcode in order to process their purchase at the self-serve checkout. Not carrying inventory in the store (the stores have samples in each size only) frees our shop assistants from managing inventory in favor of spending time advising customers.”
In addition, Costa explains how pop-up stores help the brand connect with customers emotionally: “Trust has always been a big challenge for online fashion retailers, since customers want to touch and try on products before they make their first purchase. Having physical locations helps us address this issue and engage with our customers in a deeper and more emotional way.”
Offline to online conversion examples
Costa gives two examples of leveraging more traditional marketing channels: “We have used out of home (OOH) advertising in the past where we put a voucher code on billboards in a few prime locations. This code serves as a tracking tool and allows us to monitor the conversion from offline to online during the campaign.
Another example is when we open a pop-up store in Singapore, we partner with transportation apps like Grab (an online car hailing service in Southeast Asia) where we leverage geo-fencing technology to drive footfall to our store. During a promotion, customers using Grab to commute to an area near our pop-up store will receive an automated push notification with a voucher code from ZALORA inviting them to come to the store and make a purchase.”
Localized delivery options crucial in Southeast Asia
“We have invested heavily in logistics and in our own warehouse and delivery fleet in most of our markets. Additionally, we have a strong partnership with convenience store chains like 7-Eleven, where customers can pick-up their orders. This allows us to boost customers’ confidence in online shopping and make it a more viable alternative to brick-and-mortar stores.”
Customer engagement and loyalty
ZALORA’s target customers are 25 to 35-year-old young professionals. Costa explains how they build loyalty with this group: “The way we are engaging with them is mainly through mobile and social media. Since mid-2014 until now we’ve seen a very dramatic shift in traffic from desktop browsing to the mobile app, which now makes up more than 50 percent of our business. More than just a singular channel, we have found social media to be an important branding tool where we can have a two-way conversation with our customers, which is on one hand, providing customers with fresh, highly relevant content about our offerings, and at the same time, receiving feedback from customers in real-time and being able to quickly act on it.”
©2017 KPMG International Cooperative (“KPMG International”). KPMG International provides no client services and is a Swiss entity with which the independent member firms of the KPMG network are affiliated.

2017 Global Online Consumer Report 33
Building consumer trustGiven the nature of online shopping, where consumers are buying products sight unseen, providing personal data online, and often paying in advance, having a brand and website that consumers trust is critical. Competitive prices or delivery options can be a deciding factor when potential customers are choosing a vendor, but at the end of the day consumers will only buy from websites they trust.
When we asked consumers about the attributes of the companies or websites they trusted most, over 50 percent cited websites that make it easy for customers to contact people
at the company (Figure 3.8). This was especially true in Canada, the UK and South Africa, where as many as 64 percent of consumers said it was a top trust factor.
Being open and honest about negative news and events ranked second among trust enablers, especially in China and Japan, where consumers were likely to say it was even more important than being able to contact people at the company. Having control over how their personal data is used was next most important to consumers, especially in North America, Europe and South Africa. Consumers in the BRIC (Brazil, Russia, India and China) countries were 25 to 50 percent more likely than the global
average to say they trusted companies that educated consumers about their products.
While most of these attributes are well within a company’s ability to offer and manage, some of the most significant threats to maintaining customer trust come from outside of the organization. Regardless of how many attributes a company has that will earn the trust of their customers, not having the right systems in place to protect that trust can be catastrophical. At the top of that list, companies need to sufficiently protect consumer data and ensure the quality and safety of the products they manufacture or sell.
“ CEOs are aware that providing a positive and unique experience is one of the biggest bases of competition that they can deploy. However, their greatest concern is around customer loyalty. Customers compare companies and expect the same level of experience from one to another, resulting in a perpetual increase in expectations. Companies want to provide relevant and meaningful experiences, but how to do that in a profitable way is the challenge.”
— Julio Hernandez, Global Customer Lead, KPMG International
Figure 3.8
What do the companies that consumers trust most have in common?
Make it easy to contact people at the company
Are open and honest about negative news or events
Let consumers control how their data is used
Educate consumers about their products
Ask consumers how to communicate with them
Are transparent about the use of consumers’ info
Are socially responsible
Send personalized communications
Are transparent about subsidiaries/affiliations
Have credible spokespeople
51%
43%
41%
41%
39%
35%
27%
23%
17%
17%
16
10
Source: Global Online Consumer Report, KPMG International, 2017
©2017 KPMG International Cooperative (“KPMG International”). KPMG International provides no client services and is a Swiss entity with which the independent member firms of the KPMG network are affiliated.

34 2017 Global Online Consumer Report
A breach in either of these areas can have serious and long-lasting consequences in terms of consumer trust. Particularly in an age of prolific mainstream and social media, news of a data breach or production quality issue can quickly spread out of control. Companies not aptly prepared to prevent or manage these risks can see their hard-earned trust and brand reputation extinguished overnight—sometimes beyond repair.
Are experience and trust enough to earn consumer loyalty?While consumer trust can be the key to a company’s success, the coveted prize is to win customer loyalty. Ideally, these customers not only develop an allegiance to a company, but they also become brand ambassadors, encouraging others to follow suit.
What makes consumers loyal to one company over another? Is a good experience and company trust enough to ensure they will return? When consumers were asked about the attributes of the companies they were most likely to be loyal to, by far the leading response (by 65 percent of respondents) was ‘provides excellent customer support’.
When shopping in-store, people have certain service level expectations of staff attentiveness or product knowledge. In an online environment, however, most transactions are conducted with no personal contact or service at all. So when online retailers go the extra mile by reaching out to their customers—with an unexpected personal note or an extraordinary issue resolution, for example—it gets noticed.
Finding ways to provide exceptional customer support online can lead to customer loyalty in an online environment, where it can be difficult to stand out or be remembered.
Younger consumers are looking for more engagement Younger consumers, looking to be treated as unique individuals, tend to be less impressed than the older consumers by excellent customer support, and slightly more impressed than their older counterparts with company offers that have a personal element, such as customized promotions, recognition across channels or an ability to anticipate needs (Figure 3.9).
Providing excellent consumer support, loyalty programs and benefits, and a forum for feedback, will all remain vital to earning the loyalty of customers across generations. However, in order to attract the younger consumers, companies need to offer more personalized interactions, more customized experiences and one-on-one engagement.
As Millennials become a larger proportion of the total consumer market, excellent customer support and loyalty benefits will become minimum expectations. Loyalty will be granted to those companies that make their customers feel like they are part of a community, and one where they feel important, unique and valued.
The bottom line is that to win and retain online customers, companies need to find cost-effective ways of providing the service and quality that customers expect, while keeping prices competitive. Consumers, depending largely on their country, culture or age, as well as on the type of product being purchased, will each be more or less willing to trade-off service or quality for price.
The companies that are able to identify and segment their target customers based on these factors, and develop product offerings and online strategies that are distinctly tailored for each unique market, will be truly poised to succeed in the online revolution.
Figure 3.9
Top ten attributes that drive customer loyalty — by generation (%)
74
66
59 Baby Boomers Generation X Millennials
Exclusive offers for members
45 4743
Has a loyalty program
3539 37
Listens to customer feedback
36 36 35
Customized promotions
25 28 29
Easy to make repeat
purchases
29 2621
Suggests products based on purchase history
20 20 19 21 19 18 17 18 18 16 16 17
Is socially and community conscious
Recognises customers
across channels
Anticipates needs based on customer
profile
Provides excellent customer support
Sou
rce:
Glo
bal O
nlin
e C
onsu
mer
R
epor
t, K
PM
G In
tern
atio
nal,
2017
©2017 KPMG International Cooperative (“KPMG International”). KPMG International provides no client services and is a Swiss entity with which the independent member firms of the KPMG network are affiliated.

2017 Global Online Consumer Report 35
How KPMG can helpKPMG’s Global Consumer Markets practice and Global Customer Center of Excellence work together to uncover the latest insights regarding the issues that consumer and retail businesses face, and the customers they serve. Our specialized industry teams have developed leading and innovative business strategies and solutions which are tailored to individual client needs. Utilizing these insights and solutions, KPMG member firm professionals leverage their deep consumer and retail experience to help companies achieve and maintain the competitive edge they need to succeed.
Customer strategy and digital innovationWe want to help you reduce costs and grow your enterprise. We’ll work integrally with your business to define which innovative customer and digital propositions will drive enterprise value and optimum customer engagement.
Customer experienceWe bring an outside-in perspective to help you understand what your customers are experiencing. By spotlighting your most critical customer journeys, underpinned by customer insights, we’ll help you define relevant and engaging customer experiences to drive customer retention, positive word of mouth, services and, ultimately, sales.
Marketing sales and service transformationThe front office is being revolutionized by digital disruption and rising customer expectations. We can help you envision the ecosystems and platforms you can leverage and design customer-centric service processes.
Customer data and analyticsUnderstanding and leveraging your customer data is vital to business transformation. This starts with a master data management strategy which we’ll help you define, alongside the governance and tools you’ll need to manage data securely across your enterprise.
Customer technology solutionsThe ecosystems of technology that are the backbone of your business are more important than ever. We can help you source, develop and integrate technology solutions to complement existing business capabilities and create commercial value.
A customer-centric organizationThe edges of the organization are blurring and digital is revitalizing the way we want to engage in the workplace. We can help you create a modern, digitally enabled organization structured around your key customer journeys.
©2017 KPMG International Cooperative (“KPMG International”). KPMG International provides no client services and is a Swiss entity with which the independent member firms of the KPMG network are affiliated.

36 2017 Global Online Consumer Report
About the surveyKPMG International commissioned Intuit Research to conduct a survey of global online shoppers regarding their purchase behavior, purchase drivers, and perceptions and attitudes towards online shopping.
The sample consisted of consumers aged 15 to 70 years old who had made at least one online purchase in the past 12 months, and who were within the top 65 percent of income-earners in their country.
The survey was conducted using an online questionnaire. A total of 18,430 qualified responses were received from 51 different countries. Within each country, the sample was weighted to the same age distribution to ensure that country comparisons showed behavioral differences rather than those caused by differences in demographic make-up of the population surveyed in each country.
The full report can be downloaded online at www.kpmg.com/onlineconsumers.
About KPMGKPMG is a global network of professional services firms providing Audit, Tax and Advisory services. We operate in 152 countries and have 189,000 people working in member firms around the world.
KPMG is organized by industry sector across our member firms. The Consumer Markets practice comprises an international network of professionals with deep industry experience. This industry-focused network enables KPMG member firm professionals to provide consistent services and thought leadership to clients globally, while maintaining a strong knowledge of local issues and markets.
We work with consumer and retail clients to help them succeed in the face of a rapidly changing business environment. KPMG’s customer, digital strategy, data analytics, cyber security, supply chain management, operations modeling and business transformation practices are a few of the areas in which we have industry-leading expertise and experience, which can help meet the most pressing needs of clients.
For more information, please visit kpmg.com.
About Intuit ResearchIntuit Research is a market research consultancy that provides high quality research, business insights, and thought leadership services to clients in the financial, high tech, and consumer industries. The company operates from offices in Hong Kong and Singapore and has a team of highly experienced researchers that take a hands-on approach to design, execution, and interpretation of market research, bringing to clients the insights they require to make business decisions.
For more information, please visit www.intuit-research.com.
©2017 KPMG International Cooperative (“KPMG International”). KPMG International provides no client services and is a Swiss entity with which the independent member firms of the KPMG network are affiliated.

©2017 KPMG International Cooperative (“KPMG International”). KPMG International provides no client services and is a Swiss entity with which the independent member firms of the KPMG network are affiliated.

Contact us
Some or all of the services described herein may not be permissible for KPMG audit clients and their affiliates.
The information contained herein is of a general nature and is not intended to address the circumstances of any particular individual or entity. Although we endeavor to provide accurate and timely information, there can be no guarantee that such information is accurate as of the date it is received or that it will continue to be accurate in the future. No one should act on such information without appropriate professional advice after a thorough examination of the particular situation.
© 2017 KPMG Services Pte. Ltd. (Registration No: 200003956G), a Singapore incorporated company and a member firm of the KPMG network of independent member firms affiliated with KPMG International Cooperative ("KPMG International"), a Swiss entity. All rights reserved. Printed in Singapore.
The KPMG name and logo are registered trademarks or trademarks of KPMG International.
Publication name: The truth about online consumers Publication number: 201701TW-G Publication date: January 2017
Philip LeeHead of Consumer MarketsKPMG in [email protected]
Craig RawlingsPartner, Management ConsultingKPMG in [email protected]
Karen LeePartner, AuditKPMG in Singapore [email protected]
Gan Kwee LianPartner, TaxKPMG in [email protected]
Michael HabboushDirector, Management ConsultingKPMG in [email protected]
kpmg.com.sg/socialmedia kpmg.com/app