Embed Size (px)
Citation preview

The Transmission of Monetary PolicyThrough Conventional and Islamic Banks∗
Sajjad Zaheer,a Steven Ongena,b andSweder J.G. van Wijnbergenc
aUniversity of Amsterdam and State Bank of PakistanbUniversity of Zurich
cUniversity of Amsterdam and Tinbergen Institute
We investigate the differences in banks’ responses to mon-etary policy shocks across bank size, liquidity, and type—i.e.,conventional versus Islamic—in Pakistan between 2002:Q2 and2010:Q1. We find that following a monetary contraction, smallbanks with liquid balance sheets cut their lending less thanother small banks. In contrast, large banks maintain theirlending irrespective of their liquidity positions. Islamic banks,though similar in size to small banks, respond to monetarypolicy shocks as large banks. Hence, ceteris paribus, the creditchannel of monetary policy may weaken when Islamic bankinggrows in relative importance.
JEL Codes: E5, G2.
1. Introduction
Islamic banking is one of the fastest growing segments of the globalfinancial sector. It is currently expanding at a rate of approximately20 percent annually. In some countries the share of the Islamic finan-cial sector has now reached a size and a level of development suchthat the financial arrangements it offers are a full-fledged alternativeto those in the conventional financial sector. The countries wherethis has happened include Malaysia, Iran, and the Gulf Coopera-tion Council countries, i.e., Bahrain, Kuwait, Oman, Qatar, Saudi
∗We are grateful to Harrison Hong (the editor), an anonymous referee, MauriceBun, Massimo Giuliodori, Franc Klaassen, and the participants of the EighthInternational Conference on Islamic Economics and Finance (Doha) for usefulcomments. We thank the State Bank of Pakistan for providing the data. Theviews expressed here are those of the authors and do not necessarily representor reflect the views of State Bank of Pakistan or its subsidiaries. Correspondingauthor’s (Zaheer) e-mail: [email protected]. and [email protected].
175

176 International Journal of Central Banking December 2013
Arabia, and the United Arab Emirates. Some Asian countries likeBangladesh, Pakistan, and Indonesia are also experiencing a phe-nomenal increase in Islamic finance. Moreover, a number of Westerncountries are now facilitating Islamic banking. To tap into this grow-ing market, large conventional banks that have opened Islamic win-dows include Barclays, BNP Paribus, Citi Group, Deutsche Bank,Standard Chartered, and the Royal Bank of Scotland.
The total volume of Islamic finance was estimated to roughlyequal $1 trillion in 2010 (Standard & Poor’s 2010). Commercialbanking comprised the largest share, i.e., 74 percent (InternationalFinancial Services London 2010). Investment banking accounted for10 percent. The remaining part consists of sukuk (Islamic bonds)and takaful (Islamic insurance). Assets of the largest 500 Islamicbanks increased by 29 percent to $822 billion in 2009. Around thesame time, the rest of the world’s financial system contracted, andmany of the financial institutions deleveraged their positions. Thereason for this starkly different development resides in the fact thatIslamic banking tenets do not allow the banks to charge interest andto be involved in the sales of debt instruments. Therefore, Islamicbanks did not invest in the kind of instruments that were badlyaffected during the financial crises, namely derivatives, conventionalsecurities, and toxic assets. Banning short-selling of shares after thecrisis is a further reflection of Islamic finance, as it stops dealersfrom selling assets which they do not own. A key question this briskgrowth poses to academics and policymakers alike is whether thetransmission of monetary policy through the so-called bank lend-ing channel will be altered in strength when the Islamic segmentof the banking sector becomes even more important.1 Indeed, the
1This bank balance sheet channel may be operational because of agency prob-lems between banks and their providers of funds, depositors, other debt holders,and equity holders (Bernanke 2007). Gertler and Kiyotaki (2011) formalize thischannel, modeling financial intermediation as in Gertler and Karadi (2011) butincluding liquidity risk as in Kiyotaki and Moore (2012). Similarly, the agencyproblems between banks and their borrowers (firms and households) give riseto the firm balance sheet channel (Lang and Nakamura 1995; Bernanke, Gertler,and Gilchrist 1996, 1999). Gertler and Gilchrist (1993) and Oliner and Rudebusch(1996), for example, find that, following the dates of monetary contractions iden-tified in Romer and Romer (1989), the ratio of bank loans to small versus largemanufacturing firms falls. Gertler and Gilchrist (1994) show that, even after con-trolling for differences in sales between these firms, the differences in the behaviorof small and large firm debt remain there. If bank loans are imperfectly substi-tutable with public financing for firms, and prices adjust imperfectly, monetarypolicy affects real activity through the so-called credit channel.

Vol. 9 No. 4 The Transmission of Monetary Policy 177
potency of the bank lending channel crucially depends on the abilityof the central bank to affect bank loan supply, i.e., whether bankscannot attract (time) deposits perfectly elastically or they do notconsider the loans granted and securities held in portfolio as perfectsubstitutes.
Islamic banks may be, on the one hand, unable or unwilling to“buy” wholesale time deposits at a fixed rate and—a la sociallyresponsible investors—may not consider their Islamic loans substi-tutable for any securities they would hold in their portfolio. This maymake the transmission of monetary policy shocks through the Islamicsegment of the banking sector more potent. On the other hand,Islamic banks singularly attract deposits and lend under interest-freearrangements, likely entered into for religious reasons by depositorsand borrowers (Baele, Farooq, and Ongena 2012; Khan and Khanna2012). These contractual and motivational features, on both theirliability and asset sides, may allow Islamic banks to shield them-selves from monetary policy shocks (see section 3). Consequently,whether Islamic banks transmit monetary policy differently thanconventional banks is an empirical question, which we aim to addressin this paper.
Following Bernanke and Blinder (1992), who find that a mone-tary contraction is followed by a significant decline in aggregate banklending, Kashyap and Stein (2000) analyze if there are importantcross-sectional differences in the way that banks respond to mone-tary policy shocks. In this way, controlling for loan demand, they findthat following a monetary contraction, small banks with liquid bal-ance sheets cut their lending less than other small banks. Brissimis,Kamberoglou, and Simigiannis (2003), de Haan (2003), Kaufmann(2003), Loupias, Savignac, and Sevestre (2003), Worms (2003), andGambacorta (2005), for example, also find that liquidity positionsof banks play a significant role in banks’ response to a monetaryshock in various European countries. Jayaratne and Morgan (2000),Kishan and Opiela (2000), Ashcraft (2006), and Black, Hancock,and Passmore (2009) similarly examine the differentiation acrossbank capitalization, core deposits, bank holding company status,and bank business strategies.
We follow the seminal paper by Kashyap and Stein (2000) andinvestigate the cross-sectional differences in the way that banksrespond to monetary policy shocks, not only across bank size

178 International Journal of Central Banking December 2013
and liquidity but also across bank type—i.e., conventional versusIslamic—in Pakistan between 2002:Q2 and 2010:Q1.2 The countryand sample period provide a unique setting to analyze this differen-tial response. Pakistan may be one of the few countries where bothwell-developed conventional and Islamic banking sectors have co-existed for a considerable period, formally since 2002 when Islamicbanking was reintroduced in Pakistan. Out of forty banks that grantbusiness loans, six banks are licensed by the Banking Policy andRegulation Department of the State Bank of Pakistan as shariah-compliant full-fledged Islamic banks.
As in Kashyap and Stein (2000), we find that following a mon-etary contraction, small banks with liquid balance sheets cut theirlending less than other small banks, and large banks maintain theirlending irrespective of their liquidity positions. The main contri-bution of our paper is to show that Islamic banks, though similarin size to small banks, respond to monetary policy shocks muchlike large banks. Hence, ceteris paribus, the expected growth in theIslamic segment of the banking sector in many countries may lead toa weakening in the potency of the credit channel of monetary policy.
In this respect, our paper contributes to the rapidly growingliterature on socially responsible investment that shows that fundportfolio allocation and the resultant firms’ cost of capital, and ulti-mately their performance, may be affected by the pursuit of socialor ethical objectives by decision makers—in particular, by investors(Renneboog, Ter Horst, and Zhang 2008; Hong and Kacperczyk2009; Hong and Kostovetsky 2012). Our results show that even thetransmission of monetary policy may be affected by the religion-inspired objectives pursued by a set of bank managers and theirclients.
2Khwaja and Mian (2008) also analyze lending by banks in Pakistan. Theyexamine the drop in lending by different banks to similar firms following shocks tobanks’ liquidity induced by unanticipated nuclear tests that took place in 1998in Pakistan. They find that banks pass their liquidity shortages to firms, butfirms with strong business or political ties can turn to alternative sources in thecredit market. In contrast, we focus on the monetary policy shocks responding toforeign capital inflows that followed this period and assess the differential trans-mission through the conventional and Islamic segments of the banking sector.Other studies that focus on the banking sector in Pakistan include Khwaja andMian (2005), Mian (2006), Zia (2008), and Baele, Farooq, and Ongena (2012),for example.

Vol. 9 No. 4 The Transmission of Monetary Policy 179
The remainder of this paper is organized as follows. Section 2discusses the institutional framework in Pakistan after 2001 and itsrelevance for the lending channel. Section 3 describes the data andintroduces the econometric specification, and section 4 discusses theresults. Section 5 concludes.
2. Pakistan after 2001
2.1 Monetary Conditions
Following 9/11 there was a substantial inflow of capital in Pakistan.Workers’ remittances, especially from the United States, the UnitedKingdom, the United Arab Emirates, and Saudi Arabia, increasedtremendously. Spurred by the privatization of major public-sectorcorporations by the Government of Pakistan, foreign direct invest-ment (FDI) also boomed.
The growing inflow of remittances and FDI caused an apprecia-tion in the local currency, the Pakistan rupee (PKR), against mostother currencies. Prior to 2001, Pakistan had faced severe shortagesin foreign reserves because of the nuclear tests in 1998 (Khwaja andMian 2008). The inflow of foreign capital was therefore welcomed ini-tially. The State Bank of Pakistan (SBP), the nation’s central bank,reacted to the inflow of foreign funds by purchasing U.S. dollars andby increasingly accumulating these and other foreign reserves. Itsaim was also to curb the appreciation of the rupee against most othercurrencies to safeguard the competitiveness of Pakistan’s exports.The purchase of dollars by the central bank almost inevitably causedthe money supply to expand, despite the attempts to sterilize theincrease in money supply through open-market sales of governmentsecurities.
As a result, the financial markets in Pakistan became saturatedwith excess liquidity, and in August 2003 the interest rate on gov-ernment securities dropped to as low as 1.27 percent. It is only after2005 that monetary policy started to tighten in response to infla-tion, inexorably following the relentless monetary expansion duringthe preceding years.
Since monetary policy during most of the analyzed time periodsimply responded to this unique and large external shock—i.e., theconcurrent inflow of remittances and FDI—our analysis will rely

180 International Journal of Central Banking December 2013
on the changes in the three-month Treasury-bill rate as the moststraightforward indicator of monetary policy. The use of variationsin the short-term interest rate as a measure that proxies the changein the stance of monetary policy is fully in line with the litera-ture analyzing the credit channel at the micro level.3 The use of athree-month interest rate was followed by many articles in Angeloni,Kashyap, and Mojon (2003), for example, that analyze Europeandata. Replacing the changes in the three-month interest rate with thechanges in the overnight interbank interest rate or with the changesin the six-month Treasury-bill rate yields very similar results, maybenot surprisingly, as the correlation between all interest rate series isvery high.
2.2 Islamic Banks
In principle, Islamic banking is equity, rather than fixed-interest,based on profit and loss sharing on both the liability and assetsides of a bank’s balance sheet. Depositors in Islamic banks are,for all practical purposes, shareholders that receive no guaranteewith respect to the face value of their “deposits.” In principle, theyfully share in the profits and losses of the bank in which they havetheir deposits. Similarly, on their asset side, Islamic banks deployan array of deferred sales, operational leases, and profit-and-loss-sharing arrangements to finance household consumption or firminvestment. In many respects, Islamic banks are not unlike conven-tional mutual fund banks (e.g., Cowen and Kroszner 1990).
Islamic banks seek funding through transaction deposits andinvestment accounts. Transaction deposits are similar to conven-tional banks’ demand deposits; i.e., cash can be withdrawn at anytime by writing a check or by accessing an automated teller machine(ATM), and the bank guarantees the nominal value of the deposit.However, Islamic banks cannot lend the funds to projects that are
3See Jayaratne and Morgan (2000), Kashyap and Stein (2000), Kishan andOpiela (2000), Ashcraft (2006), and Black, Hancock, and Passmore (2009), amongothers. On the other hand, Bernanke and Blinder (1992) and Christiano, Eichen-baum, and Evans (1996) use vector autoregressions to identify monetary policyshocks. However, Kashyap and Stein (2000) find very similar results using eitherthe variation in the federal funds rate, the Boschen and Mills (1995) index, orthe Bernanke and Mihov (1998) measure.

Vol. 9 No. 4 The Transmission of Monetary Policy 181
haram—i.e., not permissible under Islamic jurisprudence (Shariah)and related to alcohol, pork, sex, etc.—or that deal with interestpayments (riba), gambling (maysar), or excessive uncertainty (gar-rar). In general, Islamic banks aspire to be more conservative inlending.
Investment accounts are the equivalent of the conventional sav-ings accounts plus time deposits. However, these accounts do notoffer a fixed interest rate, but rather involve profit and loss sharingbetween bank and depositors. Although consequently the face valueof the investment deposits is not ensured, Islamic banks invariablyobserve due diligence in financing various projects.
Joint venture financing arrangements constitute the most prin-cipled form of financing households and firms. However, in the earlystages of their development, Islamic banks often adopt asset-backedfixed-return arrangements, mainly deferred payment sales (muraba-hah) and operational leases (ijarah), to finance household consump-tion, car purchases, and real estate. In Pakistan these two typescover approximately 80 percent of the total financing provided byIslamic banks (as of December 2004), which has decreased to about60 percent over time (as of December 2009).4
2.3 Monetary Conditions and Islamic Banks
The first Islamic bank in Pakistan was established in 2002 as aresponse to the—until then—unmet market demand for Islamicfinancial products (State Bank of Pakistan 2004). Islamic bank-ing quickly observed a sharp growth, as new and established banksentered the market by designing and offering suitable contracts tocollect deposits from and extend credit to households and enter-prises.
The main problem immediately faced by the Islamic banks wasthe absence of a government security designed in accordance withIslamic principles, for use as a safe investment or to fulfill the liquid-ity requirements set by the SBP. In the absence of such an Islamicgovernment security, Islamic banks had no immediate base rate to
4These two products are mainly replaced by another fixed-return scheme calleddiminishing musharikah (i.e., “diminishing partnership”), in which the partnerin an asset (a house, for example) not only pays rental payments to the bank butover time also buys the share owned by the bank.

182 International Journal of Central Banking December 2013
price their murabahah and ijarah contracts. Instead, they used theKarachi Interbank Offered Rate (KIBOR) (State Bank of Pakistan2009). However, the KIBOR is largely determined by the rate onshort-term government securities such as the three-month Treasurybill, which is set in fortnightly auctions. Because fixed-return modescover a large part of the total financing that is provided by Islamicbanks, for the estimation of the strength of a lending channel thethree-month Treasury bill rate can also be used as an indicator ofthe monetary policy stance.
The balance sheet data in table 1 provide a first glimpse of thecrucial differences between small and large conventional banks andIslamic banks in terms of liquidity. A large bank is defined as a bankwith more than 200 billion PKR (around 2.5 billion U.S. dollars; 80PKR = 1 USD) in assets. According to this definition there are sixlarge banks, representing around 60 percent of all banking assets.We label the remaining banks as small banks. By assets, all Islamicbanks are small banks.
Liquidity is defined as the sum of cash, balances with Treasurybanks, and balances with other banks (as in Loupias, Savignac, andSevestre 2003, for example). Although the cash reserve requirementfor both conventional and Islamic banks remained the same through-out the entire sample period, liquidity varies noticeably across banktype. On average, small conventional banks were more liquid thanlarge conventional banks during the period of easy monetary pol-icy in 2003. However, the situation is reversed during the periodof tight monetary policy after 2005. Hence, contractionary mone-tary policy creates more liquidity problems for small banks than forlarge banks. This is due to the fact that the large banks have rela-tively more options for non-reversible financing like debt or equityinstruments.
In comparison with conventional banks, Islamic banks have thehigher fraction of their assets in cash and balances with Treasury andother banks. This is also the case in many other countries whereIslamic banks are present (Beck, Demirguc-Kunt, and Merrouche2013). The explanation may be straightforward: In the early stagesof their existence, Islamic banks had fewer immediate investmentopportunities in comparison with their conventional counterparts.
Most of their liquidity remained in the form of cash and balanceswith other financial institutions. This is mainly due to the absence

Vol. 9 No. 4 The Transmission of Monetary Policy 183
Table 1. Balance Sheet Items for Conventional Banks andIslamic Banks (as percentage of assets and liabilities,
and indicated items)
IslamicConventional Banks Banks
Small Banks Large Banks
2003 2009 2003 2009 2003 2009
AssetsCash and Balances with
Treasury Banks9 6 10 10 12 8
Balances with Other Banks 4 2 4 3 12 7Lending to Financial
Institutions11 4 7 3 0 16
Call Money 14 13 8 11 0 0Repurchase Agreements 75 66 86 84 0 2Other 11 21 6 6 0 98
Investments—Net 22 31 36 25 7 16Market Treasury Bills 49 67 69 51 0 5Pakistan Investment Bonds 43 14 19 9 0 2Other 8 19 12 40 100 93
Advances—Net 50 45 37 52 64 44Other Assets 5 12 6 8 4 9LiabilitiesBorrowing from Financial
Institutions22 17 5 6 12 4
Deposits and Other Accounts 66 64 84 78 69 80Time Deposits 23 38 18 28 42 42Saving Deposits 54 33 50 36 46 31Current Accounts 23 28 31 36 12 26
Subordinated Loans 1 1 0 1 0 0Other Liabilities 6 7 5 4 4 5Equity 6 10 5 10 15 10
Source: Annual audited bank accounts.
of a shariah-compliant instrument called sukuk (Islamic bond).Islamic banks initially did not have any alternative investmentoption in securities. This is evident from the low fraction of theirassets in investments in 2003 (table 1). The first shariah-compliantinstrument was issued by a public-sector enterprise only in 2005, but

184 International Journal of Central Banking December 2013
Table 2. Statutory Cash and Liquidity ReserveRequirements (as percentage of time and
demand deposits)
Cash LiquidityRequirements Requirements
Conventional IslamicDates All Banks Banks Banks
Until 2006 5 15 6Feb. 15, 2006 5 15 8July 18, 2006 5 15 8July 18, 2006 7 18 8June 31, 2008 8 18 8May 22, 2008 9 19 9Oct. 17, 2008 6 19 9Nov. 1, 2008 5 19 9
it could not fulfill the large investment appetite of Islamic banks. Sountil 2008, in the absence of any Islamic government security, Islamicbanks held cash to fulfill the statutory liquidity requirement (SLR)and cash reserve requirements (CRRs).
Holding only cash resulted in higher opportunity costs for Islamicbanks than for conventional banks. Realizing that Islamic bankswere at a cost disadvantage compared with conventional banks inmeeting the SLR, the SBP relaxed it for Islamic banks. While theirCRRs are the same, Islamic banks, on average, have been requiredto hold 10 percent less in SLR than conventional banks. During theperiod under study, Islamic banks need to hold 9 percent of the totaldemand and time deposits for SLR purposes, whereas conventionalbanks are liable to maintain 19 percent of demand and time deposits(table 2). Therefore, and in order to make our analysis comparableacross bank type, we take the liquidity variable equal to the firsttwo liquidity items—i.e., cash and balances with Treasury and otherbanks—for which the requirements and the opportunities are mostlikely similar for conventional and Islamic banks.
In the absence of a risk-free Islamic instrument, Islamic banksalso benchmarked their fixed-return contracts, murabahah and

Vol. 9 No. 4 The Transmission of Monetary Policy 185
ijarah, to the conventional interest rate charged in the interbankmarket, which is usually based on the Treasury-bill rate. However,the loan supply of Islamic banks is less likely to react to changesin monetary policy because, as mentioned earlier, they have fewerinvestment opportunities and are more likely to sit on a lot of spareliquidity. In addition, since Islamic banks assets are only indirectlylinked to the policy rate, Islamic banks may be less affected by thechanges in monetary policy.
2.4 Bank Lending Channel in Pakistan
The structure of a country’s banking system is likely to determinethe strength of the banks’ lending response to monetary policyshocks. The size of the banking sector and its market concentra-tion, the fraction of banking assets that are liquid, and the banks’capitalization could be crucial in establishing the potency of thebank lending channel.
State and foreign ownership of domestically operating banks willalso be important in determining the impact of domestic monetarypolicy on the banks’ loan supply. State-owned banks, which aremostly publicly guaranteed, likely attract new funds elastically tooffset the impact of monetary contractions, for example (Ehrmannet al. 2003). Similarly, foreign banks with close links to their parentinstitutions and global bank networks are likely to absorb the impactof domestic monetary policy without altering their domestic loansupply (foreign banks with most of their funding in their home coun-try may contract lending relatively more following contractionarymonetary policy in their home country).
This section presents salient features of the banking system inPakistan, such as the importance of banks within the financial sys-tem and corporate finance, the market structure, the heterogeneityof the banks, their overall performance, and the role of the statein the banking system. Each of these features may determine thepotency of the bank lending channel. Tables 3 and 4 provide, forconventional and Islamic banks, many of the statistics we now dis-cuss, while table 5 summarizes how the various characteristics wediscuss determine the potency of the bank lending channel in Pak-istan through the conventional and Islamic segment of the bankingsector, respectively.

186 International Journal of Central Banking December 2013
Tab
le3.
Fin
anci
alIn
term
edia
tion
inPak
ista
nin
2002
–09
Yea
r:20
0220
0320
0420
0520
0620
0720
0820
09
As
Per
cent
ofTot
alA
sset
sof
the
Fin
anci
alSec
tor
Mic
rofin
ance
Inst
itut
ions
0.1
0.1
0.1
0.2
0.2
0.2
0.2
0.2
Non
-Ban
kFin
anci
alIn
stit
utio
ns6.
26.
67.
07.
67.
88.
07.
65.
3In
sura
nce
3.8
3.8
3.8
3.9
4.1
4.6
4.4
4.4
Cen
tral
Dir
ecto
rate
ofN
atio
nalSa
ving
sIn
stit
utio
ns24
.925
.021
.718
.016
.114
.614
.816
.6A
llB
anks
65.0
64.5
67.3
70.4
71.9
72.7
73.0
73.5
As
Per
cent
ofG
ross
Dom
esti
cP
roduct
Mic
rofin
ance
Inst
itut
ions
0.1
0.1
0.1
0.1
0.1
0.1
0.1
0.1
Non
-Ban
kFin
anci
alIn
stit
utio
ns4.
64.
95.
25.
65.
75.
95.
03.
4In
sura
nce
2.8
2.9
2.8
2.9
3.0
3.4
2.9
2.8
Cen
tral
Dir
ecto
rate
ofN
atio
nalSa
ving
sIn
stit
utio
ns18
.218
.816
.113
.311
.710
.89.
810
.8A
llB
anks
47.7
48.3
50.1
51.8
52.4
53.9
48.1
47.6
As
Per
cent
ofTot
alA
sset
sof
All
Ban
ks
All
73.3
75.0
74.4
73.7
72.9
74.1
66.0
64.7
Pri
vate
-Sec
tor
Cre
dit
18.0
19.9
22.6
26.3
27.8
28.5
27.6
22.8
Sourc
e:St
ate
Ban
kof
Pak
ista
n.

Vol. 9 No. 4 The Transmission of Monetary Policy 187
Tab
le4.
Ban
kin
gStr
uct
ure
inPak
ista
nin
2002
–09
Yea
r:20
0220
0320
0420
0520
0620
0720
0820
09
Public
Deb
tan
dSto
ckM
arke
tFin
anci
ng
Dom
esti
cD
ebt
Secu
riti
esIs
sued
byth
eC
orpo
rate
Sect
or,in
%of
GD
P0.
190.
050.
080.
160.
040.
070.
250.
02
Dom
esti
cD
ebt
Secu
riti
esIs
sued
byth
eC
orpo
rate
Sect
or,in
%of
Ban
kLoa
nsto
Cor
pora
teSe
ctor
1.5
0.3
0.4
0.6
0.2
0.3
0.9
0.1
Stoc
kM
arke
tC
apit
aliz
atio
n,in
%of
GD
P14
2030
4236
4914
20M
easu
res
ofB
ankin
g-Sec
tor
Con
centr
atio
nH
erfin
dahl
-Hir
schm
anIn
dex
973
912
850
762
745
739
736
712
Coe
ffici
ent
ofV
aria
tion
1.7
1.6
1.5
1.4
1.4
1.4
1.4
1.4
Ass
ets
ofFiv
eLar
gest
Ban
ks,in
%of
Tot
alB
ank
Ass
ets
6159
5654
5252
5251
Ass
ets
ofLar
geB
anks
(Ass
ets
>20
0bi
llion
PK
R),
in%
ofTot
alB
ank
Ass
ets
n/a
n/a
6564
6058
5957
Sta
teO
wner
ship
Ass
ets
ofth
eP
ublic
-Sec
tor
Ban
ks,in
%of
Tot
alB
ank
Ass
ets
5249
2726
2627
2526
(con
tinu
ed)

188 International Journal of Central Banking December 2013
Tab
le4.
(Con
tinued
)
Yea
r:20
0220
0320
0420
0520
0620
0720
0820
09
Ban
kPer
form
ance
,C
onve
nti
onal
Ban
ks
(all
valu
esar
ein
%)
Cap
ital
Ass
etR
atio
6.3
5.8
6.3
3.8
6.7
5.5
−0.
1−
2.5
Fix
edA
sset
toTot
alA
sset
1.6
2.0
1.8
1.9
3.0
3.1
4.6
4.4
Len
ding
Rat
e8.
05.
14.
46.
87.
58.
49.
710
.2N
on-D
epos
itFu
ndin
gto
Tot
alFu
ndin
g25
.324
.927
.326
.524
.822
.320
.922
.2N
on-L
oan
Ear
ning
Ass
ets
toTot
alE
arni
ngA
sset
s50
.551
.145
.744
.140
.641
.335
.045
.0N
on-P
erfo
rmin
gLoa
nsto
Tot
alA
sset
s13
.112
.311
.811
.78.
59.
312
.013
.8R
OA
0.6
0.9
1.4
1.0
1.0
0.3
0.1
1.0
Isla
mic
Ban
ks
Cap
ital
Ass
etR
atio
19.0
14.7
12.7
13.0
28.4
27.2
21.2
17.0
Cos
tIn
com
eR
atio
69.2
66.2
69.4
63.6
179.
499
.910
1.4
101.
0Fix
edA
sset
toTot
alA
sset
0.4
0.5
0.7
0.7
5.1
5.0
5.6
4.7
Len
ding
Rat
e7.
14.
53.
86.
56.
27.
110
.010
.7N
on-D
epos
itFu
ndin
gto
Tot
alFu
ndin
g11
.816
.417
.912
.88.
83.
85.
36.
4N
on-L
oan
Ear
ning
Ass
ets
toTot
alE
arni
ngA
sset
s30
.522
.823
.527
.043
.643
.635
.444
.9N
on-P
erfo
rmin
glo
ans
toTot
alA
sset
s2.
51.
41.
01.
30.
50.
31.
13.
8R
OA
2.4
1.5
1.1
1.9
−1.
00.
0−
0.3
−1.
1
Sourc
e:St
ate
Ban
kof
Pak
ista
n.

Vol. 9 No. 4 The Transmission of Monetary Policy 189
Tab
le5.
Fac
tors
Det
erm
inin
gth
ePot
ency
ofth
eB
ank
Len
din
gC
han
nel
Thi
sta
ble
prov
ides
the
fact
ors
that
dete
rmin
eth
epot
ency
ofth
eba
nkle
ndin
gch
anne
lan
dth
edi
rect
ion
ofth
eir
impa
ctin
gene
ralan
dw
ith
resp
ect
toth
esp
ecifi
cst
atus
ofco
nven
tion
alan
dIs
lam
icba
nks
inPak
ista
n.A
pos
itiv
esi
gn(+
)m
eans
that
ther
eis
apos
itiv
eim
pact
ofth
atfa
ctor
onth
epot
ency
ofth
eba
nkle
ndin
gch
anne
l,an
dvi
ceve
rsa
ifth
esi
gnis
nega
tive
(–).
The
last
four
colu
mns
stat
eth
ere
leva
nce
ofth
ese
fact
ors
wit
hre
spec
tto
stat
usof
bot
hth
eco
nven
tion
alba
nks
and
Isla
mic
bank
sin
Pak
ista
n.Fo
rex
ampl
e,bor
-ro
win
g/fin
anci
ngfr
omco
nven
tion
alba
nks
isve
ryhi
ghin
Pak
ista
n,so
itst
reng
then
sth
ele
ndin
gch
anne
lth
roug
hth
ese
bank
s,w
here
asfo
rIs
lam
icba
nks
the
shar
eis
muc
hsm
alle
r,so
the
fact
orw
eake
nsth
ech
anne
lth
roug
hIs
lam
icba
nks
(see
sect
ion
2.4)
.
Rel
evan
cyfo
rSta
tus
Ban
kin
gSyst
emin
Pak
ista
n
Impac
ton
Pote
ncy
of
Conven
tional
Ban
ks
Isla
mic
Ban
ks
Fac
tor
Ban
kLen
din
gC
han
nel
Str
ength
enin
gW
eaken
ing
Str
ength
enin
gW
eaken
ing
Impor
tanc
eof
the
Ban
king
Sect
orIm
por
tanc
eof
Ban
kFin
anci
ng+
√√
Inve
stor
sP
rote
ctio
nan
dC
apit
alM
arke
ts–
√√
Ban
kD
epen
denc
e+
√√
Stru
ctur
eof
the
Ban
king
Syst
emC
once
ntra
tion
and
Size
–√
√
Fin
anci
alSt
reng
th–
√√
Stat
eIn
fluen
ce–
√√
Fore
ign
Ow
ners
hip
and
Ban
kN
etw
orks
–√
√
Reg
ulat
ory
Req
uire
men
tsC
apit
alA
dequ
acy
–√
√
Dep
osit
Insu
ranc
e–
√√
Ban
kFa
ilure
s+
√√

190 International Journal of Central Banking December 2013
2.4.1 Importance of Banks within the Financial System
Banks play a central and still expanding role in the financial sys-tem of Pakistan. In the wake of reforms that started during the1990s—such as bank privatizations and interest rate liberalization,for example—the total assets of the banking system increased duringthe last decade, both in absolute value and as a share of the totalassets of the financial system, from 65 percent in 2002 to 74 percentin 2009.5
In contrast, the share of non-bank financial institutions and theCentral Directorate of National Savings decreased from 6.2 to 5.6and from 25 to 17 percent, respectively. The latter category of finan-cial institutions comprises various national saving schemes throughwhich the government mobilizes household savings by offering vari-ous debt instruments at varying maturities and constitutes a majorsource of non-bank borrowing for the government. The minute shareof microfinance and insurance institutions increased slightly.
In general, global macroeconomic and political developmentsremain favorable to the Pakistani banking sector. Yet, total private-sector credit granted by banks over gross domestic product (GDP)expanded briskly until 2005, then leveled off and, for the first time,dropped in 2007, corresponding to the tightening of monetary con-ditions. This fact is suggestive of the existence of a lending channelin Pakistan. The share of Islamic banks’ assets in total assets of thebanking sector is still small, though increasing over time.
2.4.2 Importance of Banks for the Financing of Corporations
Banks around the world are very important in fulfilling the financingneeds of the corporate sector. For most firms and even in financiallywell-developed countries, public debt and equity play only a minorrole in financing corporate activities.
Debt and equity markets are often found to be less developed andsubject to more intense market imperfections in emerging economies.This is also the case in Pakistan. The issuance of public debt is verylimited, and small firms especially rely heavily on bank debt. Bond
5The banks also own shares in non-bank financial institutions, insurance com-panies, brokerage houses, and financial advisory services, further underlining theircentral role in the financial system (State Bank of Pakistan 2007–08).
Vol. 9 No. 4 The Transmission of Monetary Policy 191
market capitalization has even decreased over time in nominal terms.Stock markets continue to play a modest role in corporate-sectorfunding. Stock market capitalization has shown an upward trend,but still the market is relatively thin, dominated by a handful ofcommercial banks’ stocks and mainly driven by the demand fromforeign investors.
In sum, banks play a dominant role as financial intermediariesin Pakistan. If the supply of bank loans to firms changes followingchanges in monetary policy, firms will likely be affected, as financingalternatives are not readily available for most firms.
2.4.3 Performance of the Banking Sector
The transmission of monetary policy also depends on the perfor-mance of the banks. A stronger banking sector results in a weakereffect of monetary policy on the loan supply (Cecchetti 1999). Thefinancial strength of the banking system can be measured throughasset quality, capital adequacy, liquidity, and the earnings of thebanking system.
The first half of the sample period is characterized by an increasein the stability and expansion of the banking system. Banking busi-ness remained profitable and return on equity (ROE), for example,grew until 2006. Similarly, the cost-income ratio dropped until thesame year.
However, after the tightening of monetary policy started in 2005,performance of the banking sector weakened, and in subsequentyears there was a rise in non-performing loans and a resultant erosionof capital. The banking sector in Pakistan is clearly not immune tocontractionary monetary policy shocks, as bank balance sheets areaffected by the increasing interest rates.
2.4.4 Relationship Lending
A strong relationship with a bank may insulate an individual firmto some extent from the cut in bank lending that follows a con-tractionary monetary policy. This shielding may not only be cross-sectional—i.e., vis-a-vis other firms that have no relationship—butalso across time if banks would intertemporally “subsidize.”
If firms engage multiple banks, firms can switch if one bank isaffected more by contractionary monetary policy than the others

192 International Journal of Central Banking December 2013
(Detragiache, Garella, and Guiso 2000). Large firms are mostlyimmune from any type of financing shortage by switching amongbanks when needed (Khwaja and Mian 2008). Small firms, however,are often unable to substitute between banks, or between bank andother types of financing.
2.4.5 Market Concentration and Size Structure
Informational frictions in the banking sector are important for thelending channel to operate. If market players in the interbank mar-kets are facing significant informational asymmetries, then distribu-tional effects are likely to occur between banks that are confrontedwith informational issues to various degrees. Size criterion is usedas standard in literature as a proxy to measure the opaque informa-tional situation of the banks. Small banks, in general, are consid-ered to be more exposed to informational frictions than large banks.Therefore, the external finance premium for the former category isprobably higher than for the latter group.
The banking market in Pakistan is characterized by a steadilydecreasing concentration during the sample period. The Herfindahl-Hirschman Index (i.e., the sum of market shares squared) decreasedfrom 973 in 2002 to 736 in 2008, while the group of the largestbanks (with total assets more than 200 billion PKR) slipped from65 percent in 2004 to 52 percent in 2008. As concentration dropped,competition may have intensified, possibly making the bank lendingchannel more potent, particularly for small banks.
2.4.6 State Influence in the Banking Sector
Before the financial reforms in the 1990s, the Pakistani financial sys-tem was mainly characterized by high government borrowing, bank-level credit ceilings, directly controlled interest rates, and directedand subsidized loan supply.
Public ownership of banks was introduced in the 1970s and lasteduntil the early 1990s, making the state dominant in the bankingsector. In 1990 there was not a single domestic private bank. How-ever, due to additional privatization of state-owned banks duringthe sample period studied, the influence of the state remained wan-ing. The fraction of assets of state-owned banks over total assets

Vol. 9 No. 4 The Transmission of Monetary Policy 193
of the banking system halved from 52 percent in 2002 to 26 per-cent in 2009, potentially strengthening the bank lending channel ofmonetary policy transmission.
2.4.7 Deposit Insurance
There is no deposit insurance in Pakistan. Rather, deposits are inprinciple indirectly insured only by the continuous supervision bythe regulatory authority. Detailed prudential regulations have beenissued to avoid different types of risks a bank could be exposed to.Moreover, stringent liquidity requirements are in place to restrainbanks from taking excess leverage.
Therefore, in absence of explicit deposit insurance, the lendingchannel may be more potent, because the lack of certainty aboutthe nominal value of deposits makes depositors feel unsafe abouttheir money. Consequently, following a tightening of monetary pol-icy, deposits may be withdrawn and banks compelled to cut lending.
2.4.8 Bank Failures
There were few bank failures in Pakistan during the 1990s. Someinstitutions became involved in scandals and failed due to impru-dent banking. The Mehran Bank scandal is well known, for example.Some banks were involved in a few scandals, causing depositors tofeel insecure. Furthermore, some cooperative societies also collecteddeposits from the people with a promise of higher returns than theongoing market rates. These societies inevitably failed and caused aloss to their depositors.
Due to these incidents in the past, there may be a higher occur-rence of rumors and an abrupt contraction in deposits following atighter monetary policy. Furthermore, fraud and forgeries indepen-dently affect deposits, which in turn affect lending of the banks.Data related to such cases indicate a significant increase in suchcases during the last few years (State Bank of Pakistan 2008–09).
2.4.9 Foreign Banks and Bank Networks
In case any liquidity problem arises, due to a decrease in demand-able deposits, foreign banks and banks in networks can resort totheir head office or holding company to cover the liquidity shortage.

194 International Journal of Central Banking December 2013
Under this scenario, the potency of the bank lending channel ofdomestic monetary policy transmission becomes weaker. The role offoreign banks has been limited in Pakistan, as they account for only10 percent of total banking-sector assets. There are some implicitbank networks in Pakistan in that ownership of some banks is com-mon. There is also foreign ownership in some large banks. However,evidence strongly suggests that the banks in Pakistan do pass shocksto their borrowers subject to their liquidity position (Khwaja andMian 2008). This evidence, combined with the weak role of foreignbanks and bank networks, makes it more likely that tight monetarypolicy eventually leads to the loss of deposits by all the banks anda contraction in lending.
3. Data and Econometric Specification
The main source of data is the Quarterly Report of Condition (QRC)of all banks submitted to the State Bank of Pakistan (SBP). Thedata set covers the whole population of banking institutions thatare operational in the financial system and incorporates their QRCs’figures. The time period is from 2002:Q2 to 2010:Q1 at a quarterlybasis. There are forty banks, of which six are Islamic banks.
We lose observations because (i) some banks start operating after2002:Q2; (i) we employ up to four lags of quarterly growth rates;(iii) some banks merge and, following Kashyap and Stein (2000), weremove banks’ observations in any quarter in which they are involvedin a merger; (iv) we remove observations for which the loan growthrate is more than three standard deviations from its sample mean;and (v) there are missing values in the data set. We are left with 756bank year:quarter observations that can be used in the estimations.See table 6.
For our analysis of the bank lending channel, we use the theo-retical model of Ehrmann et al. (2001), which is for our purposes arelevant version of the Bernanke and Blinder (1988) model. Thereis no fundamental change in the model when it is applied to Islamicbanks. We explain the model with respect to conventional bankscompared with Islamic banks. The money-market equilibrium canbe described as follows:
M = D = −ψr + χ, (1)

Vol. 9 No. 4 The Transmission of Monetary Policy 195
Tab
le6.
Des
crip
tive
Sta
tist
ics
Thi
sta
ble
prov
ides
the
defin
itio
ns,
mea
ns,
stan
dard
devi
atio
ns,
min
imum
,an
dm
axim
umof
all
vari
able
sus
edin
the
esti
mat
ions
.A
llva
riab
les
are
expr
esse
din
perc
ent.
The
num
ber
ofba
nkye
ar:q
uart
erob
serv
atio
nseq
uals
756.
80P
KR
=1
USD
.
Num
ber
ofSta
ndar
dV
aria
ble
Nam
eD
efinit
ion
Ban
ks
Mea
nD
evia
tion
Min
.M
ax.
Smal
lB
ank
=1
ifth
eba
nkha
sav
erag
eto
talas
sets
belo
w20
0bi
llion
PK
Ran
dis
aco
nven
tion
alba
nk,=
0ot
herw
ise
280.
700.
460
1
Lar
geB
ank
=1
ifth
eba
nkha
sav
erag
eto
talas
sets
exce
edin
g20
0bi
llion
PK
Ran
dis
aco
nven
tion
alba
nk,=
0ot
herw
ise
60.
150.
360
1
Isla
mic
Ban
k=
1if
the
bank
iscl
assi
fied
asan
Isla
mic
bank
,=
0ot
herw
ise
60.
150.
360
1
Isla
mic
Shar
e=
100
ifth
eba
nkis
clas
sifie
das
anIs
lam
icba
nk,=
0if
the
bank
isa
pure
conv
enti
onal
bank
,an
dva
ries
betw
een
0an
d10
0(b
yas
set
shar
e)if
the
bank
isa
mix
edba
nkSm
allB
anks
Six
are
Isla
mic
,fif
teen
are
pure
conv
enti
onal
,an
dth
irte
enar
em
ixed
3418
.19
37.9
70
100
Lar
geB
anks
One
ispu
reco
nven
tion
alan
dfiv
ear
em
ixed
61.
333.
040
13.3
8
(con
tinu
ed)

196 International Journal of Central Banking December 2013
Tab
le6.
(Con
tinued
)
Sta
ndar
dV
aria
ble
Nam
eD
efinit
ion
Ban
kT
ype
Mea
nD
evia
tion
Min
.M
ax.
Δlo
g(L
it)
Cha
nge
inth
elo
gof
priv
ate-
sect
orlo
ans
All
Ban
ks4.
212
.6−
57.7
140.
8Sm
allB
anks
17.4
14.3
−23
.655
.3Lar
geB
anks
22.5
10.6
7.0
48.0
Isla
mic
Ban
ks4.
013
.8−
57.7
140.
84 ∑ j=
1
Δlo
g(L
it−
j)
Cha
nge
inth
elo
gof
priv
ate-
sect
orlo
ans,
All
Ban
ks20
.436
.0−
95.7
280.
6su
mof
last
four
quar
ters
Smal
lB
anks
18.5
38.0
−95
.728
0.6
Lar
geB
anks
3.8
7.7
−10
.731
.1Is
lam
icB
anks
5.9
10.7
−12
.463
.0X
it−
1Liq
uid
asse
tsto
tota
las
sets
All
Ban
ks16
.014
.83.
092
.2Sm
allB
anks
16.1
16.7
3.0
92.0
Lar
geB
anks
12.3
3.3
5.8
25.5
Isla
mic
Ban
ks22
.510
.67.
048
.0Δ
Rt−
jC
hang
ein
thre
e-m
onth
Tre
asur
y-bi
llra
te0.
40.
7−
0.7
2.5
4 ∑ j=
0
ΔR
t−j
Cha
nge
inth
ree-
mon
thTre
asur
y-bi
llra
te,
1.7
2.0
−4.
45.
5su
mof
last
four
quar
ters
ΔL
SM
tC
hang
ein
the
larg
e-sc
ale
man
ufac
turi
ngin
dex
3.0
15.3
−30
.733
.6
4 ∑ j=
0
ΔL
SM
t−j
Cha
nge
inth
ela
rge-
scal
em
anuf
actu
ring
inde
x,su
mof
last
four
quar
ters
11.9
15.3
−27
.640
.0

Vol. 9 No. 4 The Transmission of Monetary Policy 197
where deposits (D), considered as money (M), depend negativelyon the risk-free government bonds’ interest rate being the opportu-nity cost of holding money. Due to the religious motivations, ψ isexpected to be much lower for Islamic banks than for conventionalbanks (Khan and Khanna 2012).
The demand for loans (Ldi ) which a bank faces is assumed to
depend on the interest rate on loans (rl):
Ldi = ϕ1rl. (2)
Equation (2) can also apply to Islamic banks, as Islamic banksindirectly use the government Treasury-bill rate as a benchmark fortheir products for financing (State Bank of Pakistan 2009).6
The supply of bank loans (Lsi ) depends on the amount of money
(or deposits) available and interest rate on loans. Lsi also depends
(negatively) on the monetary policy rate directly, as the same isconsidered to be the opportunity cost of bank loans on their assetsside as well as the cost of interbank financing on the liability side ofthe banks’ balance sheet. The function remains the same, as Islamicbanks are expected to behave like conventional banks—i.e., loans arepositively related to the markup/profit rate and negatively relatedto conventional policy rate:
Lsi = μiDi + ϕ2rl − ϕ3r. (3)
It is also assumed that the impact of change of monetary policythrough deposits is lower, the higher the bank liquidity (xi) is:
μi = μ0 − μ1xi. (4)
In comparison with conventional banks, Islamic banks are moreliquid because of the limited financing avenues in the initial stage oftheir operations.
Inserting (1) and (4) into (3), we get
Lsi = (μ0 − μ1xi)(−ψr + χ) + ϕ2rl − ϕ3r. (3a)
6In our specifications and to control for demand-side effects, we also includethe large-scale manufacturing index as a proxy for GDP.

198 International Journal of Central Banking December 2013
Also from (2), we get rl:
rl =−Ld
i
ϕ1. (2a)
We substitute (2a) into (3a) to get
Lsi = (μ0 − μ1xi)(−ψr + χ) +
ϕ2(−Ldi )
ϕ1− ϕ3r. (3b)
Since in equilibrium Ldi = Ls
i = Li, we replace the values accord-ingly and solve for Li:
Li = (μ0 − μ1xi)(−ψr + χ) +ϕ2(−Li)
ϕ1− ϕ3r (3c)
L =−(μ0ψ + ϕ3)ϕ1r + ϕ1μ1ψxir − ϕ1μ1χxi + ϕ1μ0χ
ϕ1 + ϕ2. (3d)
Hence,
Li = constant + c0r + c1rxi + dxi, (3e)
where c1 = ϕ1μ1ψ
ϕ1+ϕ2is the coefficient on the interaction term of liquid-
ity and the policy rate, and it captures the banks’ response to a mon-etary shock depending upon their liquidity position. A statisticallysignificant and economically relevant c1 implies that monetary pol-icy does affect the loan supply.7 The identification requires that theinterest rate sensitivity of loan demand observed by a bank is uncor-related with its liquidity (xi), i.e., ϕ1 is the same for all banks. How-ever, in our robust estimation we control for the demand-side impactas well by including the large-scale manufacturing index (LSM) andinteracting the same with liquidity. This is equivalent to allowingfor different values of ϕ1 across various bank sizes and types withdifferent liquidity. A priori, large banks are less likely to react to a
7We also replace the large bank dummy with “size” (total assets) and interactit with liquidity and the monetary policy measure, as robustness of the baselinespecification (in which small and large bank dummies are interacted with liquidityand the monetary policy measure). The premise is that large banks, regardless oftheir liquidity position, can insulate themselves from a monetary shock throughfunding from capital markets and issuance of wholesale deposits.

Vol. 9 No. 4 The Transmission of Monetary Policy 199
monetary impulse, as these banks face fewer informational problemsand resultant market frictions. Therefore, due to easier access to cap-ital market and the issuance of wholesale deposits, large banks areless likely to cut their lending, irrespective of their liquidity position.Similarly, Islamic banks will not be responsive to monetary policyconditions because of (i) the religiosity of their depositors, and (ii)their strong liquidity position. For estimation, we introduce somedynamics in the final equation and closely follow Kashyap and Stein(2000). The methodology, in general, is based on an assessment ofthe differences in the response of individual banks to a monetarypolicy shock according to their liquidity positions.
In sum, we estimate the following equation (5):
Δ log(Lit) = ci +m∑
j=1
αjΔ log(Lit−j) +m∑
j=0
μjΔRt−j + ΘTt
+m∑
k=1
ρkQuarterkt + Xit−1
⎛⎝η +
m∑j=0
ϕjΔRt−j
⎞⎠ + εit,
(5)
where ci is the bank i specific fixed effect;8 Δ log(Lit−j) is thequarterly change in the logarithm of the total amount of the loansgranted to the private sector by bank i in year:quarter t − j; ΔRt−j
is the quarterly change in the three-month Treasury-bill rate inyear:quarter t − j; Tt is the time trend; Quarterkt is the dummy forquarter k in year:quarter t; and Xit−1 is liquid assets (i.e., cash andbalances with the banks) over total assets of bank i in year:quarter t.m is set to equal four, i.e., one calendar year. This corresponds tothe number of lags used in other papers assessing the potency of thecredit channel in other countries.
The cross-sectional and time-series derivatives of equation (5)explain the correspondence we assess in the data. The cross-sectionalderivative, ∂Lit
∂Xit−1, determines the sensitivity of bank i’s lending to
its liquidity position in the last quarter. The time-series derivative,∂Lit
∂Rt, captures the sensitivity of lending of bank i to monetary
impulses. This derivative establishes the direct responsiveness of
8Our main results are unaffected if we exclude the set of bank fixed effects.

200 International Journal of Central Banking December 2013
bank lending to monetary policy on average, irrespective of indi-vidual bank characteristics.
We want to test how the sensitivity of bank lending to mone-tary policy of an individual bank depends on its liquidity position,which can be captured through a second cross partial derivative,
∂2Lit
∂Xit−1·∂Rt. Instead, the second cross partial derivative, ∂2Lit
∂Rt·∂Xit−1,
measures the sensitivity of bank credit to monetary policy, and thehypothesis is that this sensitivity is higher for banks with weakliquidity positions. Both these derivatives use the cross-sectional andthe time-series properties of the data.
The main hypothesis is that contractionary monetary policyaffects the small illiquid banks more than the liquid banks, as the lat-ter can offset any decrease in deposits by reducing their liquid assets.Consequently, our main coefficient of interest is the sum of inter-action terms of liquidity Xit−1 with the monetary policy measureΔRt−j , i.e.,
∑ϕ. The correctness of the aforementioned hypothesis
requires this coefficient to be positive and statistically significant,i.e., lending by small liquid banks is less sensitive to a monetaryshock than lending by other small banks.9
Equation (5) is first estimated for the entire banking sector toevaluate the potency of the aggregate bank lending channel. Largebanks are possibly less influenced than small banks by monetaryshocks because of their ability to raise funds from capital marketsand issue wholesale deposits, which—irrespective of their internalliquidity positions—would make their lending less dependent onmonetary policy shocks. Islamic banks may also be less affected.Therefore, we also estimate equation (5) including dummies bothfor large banks and Islamic banks. Both dummies are interactedthen with all coefficients, except the trend, quarter, and provinceshares. We also replace the bank-specific effects with these provinceshares, which are constructed by calculating for each bank the rela-tive number of branches it has in each province.
9For large banks, the interaction term is equivalent to evaluating the hypothe-sis ∂3Lit
∂Xit−1∂Rt∂Sizeit−1< 0, i.e., the impact that more-liquid banks decrease their
lending less than other banks decreases as the size of the banks increases. Thismeans that the liquidity constraint is not effective for the largest banks, as theycan easily raise funds from capital markets and issue wholesale deposits. There-fore, these banks are more likely to maintain their lending after a monetary shock,regardless of their liquidity positions.

Vol. 9 No. 4 The Transmission of Monetary Policy 201
In robustness, and to further control for the business cycle andloan demand, we also include change in the large-scale manufactur-ing index (LSM). Equation (6) equals
Δ log(Lit) = ci +m∑
j=1
αjΔ log(Lit−j) +m∑
j=0
μjΔRt−j
+m∑
j=0
πjLSMt−j + ΘTt +3∑
k=1
ρkQuarterkt
+ Xit−1
⎛⎝η +
m∑j=0
ϕjΔRt−j +m∑
j=0
γjLSMt−j
⎞⎠ + εit.
(6)
4. Results
4.1 All Banks
Table 7 presents the results of the preliminary regression—i.e., equa-tion (5)—estimated using the observations for all banks. The pur-pose is to assess the potency of the bank lending channel for theoverall banking sector. The table shows the sum of the estimatedcoefficients. The coefficients for provinces, quarter dummies, indi-vidual liquidity, and time trend are not shown. All estimates arein percentage terms and we report White (1980) heteroskedasticity-consistent standard errors that are clustered at the year:quarter level(we also check estimates when standard errors are clustered at thebank level, but the significance levels are mostly unaffected).
The estimated coefficients confirm that the bank lending chan-nel is operational in Pakistan. The sum of the estimated coeffi-cients on the changes in the three-month Treasury-bill rate equals−5.83∗∗∗.10 Hence, an increase in the interest rate by 1 percentagepoint decreases loan growth by 5.83 percentage points.
To identify that this decrease in loan growth actually represents acontraction in the supply of credit and not a reduction in the demandfor credit, we interact the measure for bank-specific liquidity with
10As in the tables, we star (the sum of) the estimated coefficients according totheir significance levels. *** denotes significance at 1 percent, ** significance at5 percent, and * significance at 10 percent.

202 International Journal of Central Banking December 2013Tab
le7.
Loa
nG
row
th,A
llB
anks
Thi
sta
ble
repo
rts
the
sum
ofth
ees
tim
ated
coeffi
cien
tsfo
rsp
ecifi
cati
ons
wit
hth
ede
pend
ent
vari
able
Δlo
g(L
it),
whi
chis
the
quar
terl
ych
ange
inth
elo
gari
thm
ofth
eto
tal
amou
ntof
the
loan
sgr
ante
dto
the
priv
ate
sect
orby
bank
iin
year
:qua
rter
t.T
hein
depe
nden
tva
riab
les
are
Δlo
g(L
it−
j),
whi
char
ej
lags
ofth
ede
pend
ent
vari
able
,Δ
Rt−
jis
the
quar
terl
ych
ange
inth
eth
ree-
mon
thTre
asur
y-bi
llra
tein
year
:qua
rter
t−
j,X
it−
1is
the
liqui
das
sets
(i.e
.,ca
shan
dba
lanc
esw
ith
the
bank
s)ov
erto
talas
sets
ofba
nki
inye
ar:q
uart
ert,
and
ΔL
SM
t−j
isth
equ
arte
rly
chan
gein
the
larg
e-sc
ale
man
ufac
turi
ngin
dex
inye
ar:q
uart
ert−
j.T
hees
tim
atio
nsus
e75
6ba
nkye
ar:q
uart
erob
serv
atio
ns.St
anda
rder
rors
are
hete
rosk
edas
tici
tyco
nsis
tent
and
clus
tere
dat
the
year
:qua
rter
leve
l.**
*de
note
ssi
gnifi
canc
eat
1pe
rcen
t,**
sign
ifica
nce
at5
perc
ent,
and
*si
gnifi
canc
eat
10pe
rcen
t.
Wit
hLar
ge-
Wit
hB
ank
Sca
leP
rovin
ceM
anufa
cturi
ng
Pre
lim
inar
yG
MM
/2SLS
R=
KIB
OR
Shar
esIn
dex
(Sum
of)
Est
imat
edC
oeffi
cien
ts(1
)(2
)(3
)(4
)(5
)4 ∑ j=
1
Δlo
g(L
it−
j)
0.34
∗∗∗
0.25
∗0.
36∗∗
∗0.
40∗∗
∗0.
35∗∗
∗
4 ∑ j=
0
ΔR
t−j
−5.
83∗∗
∗−
5.8∗∗
∗−
3.69
∗∗∗
−5.
95∗∗
∗−
5.56
∗∗∗
Xit
−1
∗4 ∑ j=
0
ΔR
t−j
20.7
1∗21
.72
15.0
119
.22
25.4
2
4 ∑ j=
0
ΔL
SM
t−j
0.32
∗
Qua
rter
Dum
mie
s,Tre
ndY
esY
esY
esY
esY
esB
ank
Fix
edE
ffect
sY
esY
esY
esN
oY
esB
ank
Pro
vinc
eSh
ares
No
No
No
Yes
No

Vol. 9 No. 4 The Transmission of Monetary Policy 203
the interest rate (as in Kashyap and Stein 2000).11 The sum of theestimated coefficients on this interaction term equals 20.71*. Conse-quently, banks with a higher level of liquidity contract lending lessfollowing a monetary shock (we discuss the economic relevancy ofsimilar estimates in the next table).
A fixed-effects model may create a correlation between laggeddependent variable ΔLit−1 and the error term, causing the “Nickelbias” as described, for example, in Verbeek (2008). However, thisbias is expected to be negligible if the time period is substantial(Judson and Owen 1999). In our case it is thirty-two quarters, whichis sufficiently large. Nevertheless, to ensure the validity of our resultswe also estimate equation (5) using a two-stage least-squares method(first-stage GMM). Specifically, we employ in model (2) the Arellanoand Bover (1995) approach (with the second lag of the dependentvariable in level as an instrument, which is valid according to aSargan 1958 test). There is only a very small change in results.
To further check the robustness of these estimates, we replacethe three-month Treasury-bill rate with the KIBOR in model (3)and the six-month Treasury bill (results not shown). The sum of theestimated coefficients on the changes in the interest rates equals−3.69*** and −5.12***, respectively, while the sum of the esti-mated coefficients on the interaction term with liquidity equals 20.71and 15.42. Individual liquidity coefficients are insignificant for allspecifications.
To control better for regional effects, model (4) replaces thebank fixed effects with bank province shares—i.e., for each bank,the number of branches it has in each province divided by the totalnumber of branches it has. To control better for business cycle andloan demand, model (5) includes the change in LSM. Estimates aremostly unaffected.
4.2 Large and Islamic Banks
We now assess the role played by large and small (conventional)banks and Islamic banks in the bank lending channel. We interact
11We also use liquid assets to deposits as a liquidity measure instead of liquidassets to total assets. This measure incorporates the changes in the deposits asa result of monetary policy impulses. The new estimates corroborate the earlierfindings.

204 International Journal of Central Banking December 2013
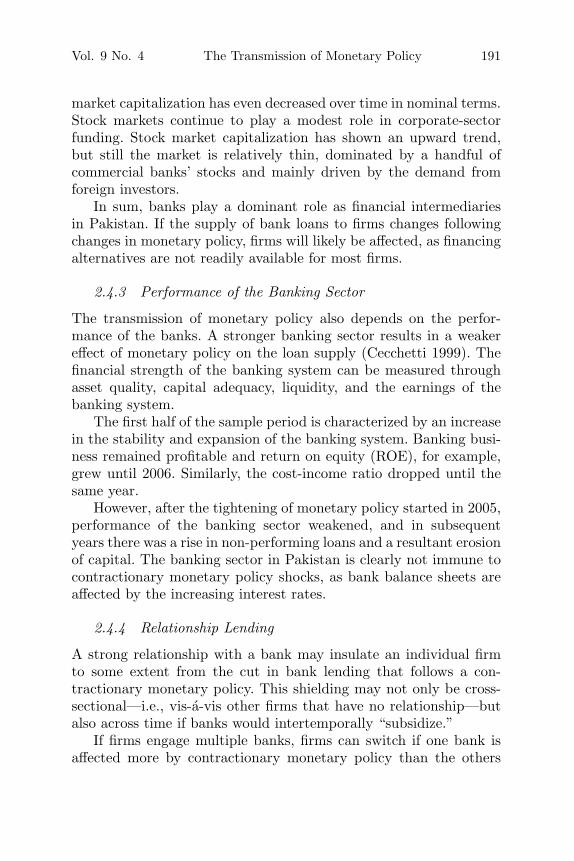
dummies for large and Islamic banks with all independent variables(except with the trend, season, and province shares). Table 8 exhibitsthe results for various specifications. Panel A provides the sum ofthe estimated coefficients, while panel B provides for the baselinemodel (1) the estimated individual coefficients for the included lags(which are, as in Kashyap and Stein 2000, broadly in line with thesums).
The baseline model (1) indicates that the small banks especiallymake the bank lending channel operational, a finding also present inKashyap and Stein (2000). An increase in the three-month Treasury-bill rate of 1 percentage point decreases the loan growth of smallbanks by 7.17*** percentage points in a year. The sum of the esti-mated coefficients on the interaction terms of liquidity and interestrates equals 25.06**.
To assess if the estimated coefficients also have economically rel-evant implications, we need to calculate the response in lending bysimilar-sized banks, but with different liquidity positions, to a mon-etary policy shock. Using the liquidity distribution of small banksin 2010:Q1, we consider a bank at the ninth decile a “liquid” bankand at the first decile an “illiquid” bank. The liquidity ratios accord-ing to this criterion are 24 and 5 percent, respectively. Under thisscenario, a 1-percentage-point increase in the interest rate reducesthe lending by an illiquid bank 4.5 percentage points more than thelending by a liquid bank over a one-year time period. This is cal-culated through multiplying
∑ϕ by the liquidity differential of the
liquid and illiquid banks, i.e., 25.06 × (0.24 − 0.05).The estimated results for the large banks are different. The
sum of the estimated coefficients on the change in interest rate ispositive—i.e., 7.06*—but only marginally significant. Hence, largebanks are not sensitive to changes in monetary policy due to theirability to fund their lending from the capital market (other thanfrom demand deposits). The sum of the interaction terms of liquid-ity and the interest rate is now negative, as in Kashyap and Stein(2000), but insignificant. Using the difference between small banks’and large banks’ coefficients, there is a 12.2 percent gap in the levelof lending across liquid and illiquid small banks one year after amonetary shock.
All in all, these findings are very similar to those in Kashyap andStein (1995), i.e., tight monetary policy decreases the loan growthof small banks but may actually increase credit granted by large
Vol. 9 No. 4 The Transmission of Monetary Policy 205Tab
le8.
Loa
nG
row
th,A
cros
sB
ank
Type
Thi
sta
ble
repo
rts
the
sum
ofth
ees
tim
ated
coeffi
cien
tsfo
rsp
ecifi
cati
ons
wit
hth
ede
pend
ent
vari
able
Δlo
g(L
it),
whi
chis
the
quar
terl
ych
ange
inth
elo
gari
thm
ofth
eto
tal
amou
ntof
the
loan
sgr
ante
dto
the
priv
ate
sect
orby
bank
iin
year
:qua
rter
t.T
hein
depe
nden
tva
riab
les
are
Δlo
g(L
it−
j),
whi
char
ej
lags
ofth
ede
pend
ent
vari
able
,Δ
Rt−
jis
the
quar
terl
ych
ange
inth
eth
ree-
mon
thTre
asur
y-bi
llra
tein
year
:qua
rter
t−
j,Δ
LS
Mt−
jis
the
quar
terl
ych
ange
inth
ela
rge-
scal
em
anuf
actu
ring
inde
xin
year
:qua
rter
t−
j,an
dX
it−
1is
the
liqui
das
sets
(i.e
.,ca
shan
dba
lanc
esw
ith
the
bank
s)ov
erto
talas
sets
ofba
nki
inye
ar:q
uart
ert.
The
esti
mat
ions
use
756
bank
year
:qua
rter
obse
rvat
ions
.St
anda
rder
rors
are
hete
rosk
edas
tici
tyco
nsis
tent
and
clus
tere
dat
the
year
:qua
rter
leve
l.**
*de
note
ssi
gnifi
canc
eat
1pe
rcen
t,**
sign
ifica
nce
at5
perc
ent,
and
*si
gnifi
canc
eat
10pe
rcen
t.
A.Su
mof
Est
imat
edC
oeffi
cien
ts
Wit
hLar
ge-
Wit
hB
ank
Sca
leP
rovin
ceM
anufa
cturi
ng
(Sum
of)
Est
imat
edB
asel
ine
GM
M/2
SLS
R=
KIB
OR
Shar
esIn
dex
Coeffi
cien
tsB
ank
Type
(1)
(2)
(3)
(4)
(5)
4 ∑ j=
1
Δlo
g(L
it−
j)
Smal
l0.
36∗∗
∗0.
26∗∗
0.39
∗∗∗
0.43
∗∗∗
0.37
∗∗∗
Lar
ge0.
15−
0.03
0.29
∗∗0.
150.
09D
iffer
ence
from
Isla
mic
0.08
0.10
0.06
0.21
∗∗∗
0.06
Smal
lBan
ksLa
rge
−0.2
1−
0.29
−0.1
0−
0.2
8∗∗
−0.
28Is
lam
ic−
0.2
8∗
−0.
15−
0.3
3∗∗
−0.2
3−
0.30
∗
4 ∑ j=
0
ΔR
t−j
Smal
l−
7.17
∗∗∗
−7.
33∗∗
∗−
4.26
∗∗∗
−7.
12∗∗
∗−
7.21
∗∗∗
Lar
ge7.
06∗
7.97
4.99
4.43
11.1
3∗∗∗
Diff
eren
cefrom
Isla
mic
2.05
3.91
∗3.
85−
2.95
−3.
38Sm
allBan
ksLa
rge
14.2
3∗∗
∗15
.30∗∗
∗−
9.2
5∗∗
−11
.60
∗∗∗
18.3
4∗∗∗
Isla
mic
9.2
2∗
11.2
4∗−
8.1
2∗∗
4.17
3.83 (c
ontinu
ed)

206 International Journal of Central Banking December 2013Tab
le8.
(Con
tinued
)
A.Su
mof
Est
imat
edC
oeffi
cien
ts
Wit
hLar
ge-
Wit
hB
ank
Sca
leP
rovin
ceM
anufa
cturi
ng
(Sum
of)
Est
imat
edB
asel
ine
GM
M/2
SLS
R=
KIB
OR
Shar
esIn
dex
Coeffi
cien
tsB
ank
Type
(1)
(2)
(3)
(4)
(5)
Xit
−1
∗4 ∑ j=
0
ΔR
t−j
Smal
l25
.06∗∗
26.9
0∗18
.24∗
22.8
8∗31
.05∗
Lar
ge−
39.2
0−
41.3
5−
28.8
3−
17.4
0−
62.2
4∗∗∗
Diff
eren
cefrom
Isla
mic
−31
.83
−36
.32
−27
.29∗
−19
.90
−0.
42Sm
allBan
ksLa
rge
−64
.26
∗∗−
68.2
5∗∗−
47.0
8−
40.2
8∗
−93
.28∗∗
∗
Isla
mic
−56
.90
∗∗∗
−63
.22∗∗
−45
.54
∗∗−
42.7
8∗∗
−31
.47
4 ∑ j=
0
ΔL
SM
t−j
Smal
l0.
20Lar
ge0.
87∗∗
Diff
eren
cefrom
Isla
mic
0.99
Smal
lBan
ksLa
rge
0.67
Isla
mic
0.79
Xit
−1
∗4 ∑ j=
0
ΔL
SM
t−j
Smal
l−
0.81
Lar
ge−
5.17
∗∗
Diff
eren
cefrom
Isla
mic
−4.
35∗
Smal
lBan
ksLa
rge
−4.
36Is
lam
ic−
3.54
Qua
rter
Dum
mie
s,Tre
ndY
esY
esY
esY
esY
esB
ank
Fix
edE
ffect
sY
esY
esY
esN
oY
esB
ank
Pro
vinc
eSh
ares
No
No
No
Yes
No
(con
tinu
ed)

Vol. 9 No. 4 The Transmission of Monetary Policy 207
Tab
le8.
(Con
tinued
)
B.Bas
elin
eSp
ecifi
cation
(1)
(Sum
of)
Est
imat
edC
oeffi
cien
tsB
ank
Type
Lag
s:j=
0j=
1j=
2j=
3j=
4
Δlo
g(L
it−
j)
Smal
l−
0.05
0.23
∗∗∗
0.22
∗∗∗
−0.
04La
rge
−0.
03−
0.25
∗∗∗
−0.
25∗∗
∗0.
33∗∗
∗
Diff
eren
cefrom
Isla
mic
−0.
11−
0.01
−0.
21∗∗
∗0.
04Sm
allBan
ks
ΔR
t−j
Smal
l−
1.16
−3.
86∗∗
∗−
0.03
−0.
81−
1.31
∗∗∗
Larg
e6.
04∗∗
∗8.
59∗∗
∗−
2.67
0.58
1.69
Diff
eren
cefrom
Isla
mic
7.19
∗∗1.
55−
4.18
∗6.
39∗∗
−1.
72Sm
allBan
ks
Xit
−1
∗Δ
Rt−
jSm
all
18.1
8∗∗5.
57−
17.7
410
.29∗∗
∗8.
76∗
Larg
e−
32.9
4∗∗−
42.1
3∗∗28
.76
−11
.52
−6.
44D
iffer
ence
from
Isla
mic
−33
.39∗∗
−16
.71
36.5
4∗∗−
40.8
6∗∗−
2.48
Smal
lBan
ks

208 International Journal of Central Banking December 2013
banks in the short run. Romer and Romer (1990), Bernanke andBlinder (1992), and Christiano, Eichenbaum and Evans (1996) alsoshow that credit reacts sluggishly or initially even expands followinga monetary tightening. In Pakistan this effect is also present due tothe response of the large banks.
Islamic banks are equivalent to small banks in terms of assetsize, and as Islamic banks use the conventional interest rate as akey benchmark, one can expect that the bank lending channel willalso operate through Islamic banks. However, since Islamic bankswere expanding during the sample period, their deposit growth mayhave been less affected by tight monetary policy. Also, their shareof fixed deposits to total deposits is higher than that of conven-tional banks. Using panel data of bank deposits across all commer-cial banks in Pakistan, Khan (2010) also found that Islamic banksenjoy substantially higher deposit growth rates than other banks,including the crises period of 2008. Moreover, the liquidity positionof Islamic banks makes them less susceptible to a change in theinterest rate.
The results indeed show that the loan growth of Islamic banks isnot affected by changes in the interest rate. The sum of the estimatedcoefficients equals 2.05, positive but not statistically significant. Sim-ilarly, the sum of the estimated coefficients on the interaction termsof bank liquidity and changes in the interest rate equals −31.83,negative and insignificant. In both cases, Islamic banks are statisti-cally different from small banks—with an estimated difference thatequals 9.22* for the changes in the interest rate and 56.90*** for theinteraction term—but similar to the large banks.
As before, and to check the robustness of these estimates, we useArellano and Bover (1995) in model (2), replace the three-monthTreasury-bill rate with the KIBOR in model (3) and the six-monthTreasury-bill rate (results not shown), and introduce bank provinceshares and the change in large-scale manufacturing in models (4)and (5). Results are mostly unaffected and show that even thoughIslamic banks are small (in terms of asset size), their response inlending to a monetary policy shock is similar to that of the largebanks in the sample. We further test whether there is any signifi-cant difference in lending response of banks to contractionary andexpansionary monetary policy. The unreported results show that thedifference in banks’ lending response to both phases of monetarypolicy is insignificant.

Vol. 9 No. 4 The Transmission of Monetary Policy 209
4.3 Robustness
Clienteles and their demand could still differ between bank types—i.e., small and large conventional and Islamic—in a way that is notidentifiable by the strategy in Kashyap and Stein (2000). In table 9we therefore “horserace” other bank characteristics capturing spe-cific clientele demand with bank type. In particular, the followingbank characteristics are introduced “side by side” with bank typedummies in all relevant terms in the baseline model (i.e., model (1)from table 8): (i) Non-Performing Loans (non-performing loans overtotal assets), (ii) Non-Lending Business (non-lending-based earningassets over total earning assets), (iii) Non-Deposit Funding (fund-ing by other than deposits over total funding), (iv) Lending Rate(interest income on loans granted to the private sector over averageloans granted to the private sector), (v) ROA (return on assets), and(vi) Fixed Assets (fixed assets over total assets). Results are mostlyunaffected, suggesting that it is bank type per se and not clienteleand/or other bank characteristics that determines our findings.
In addition to the six banks (out of forty) that are licensed bythe Banking Policy and Regulation Department of the State Bankof Pakistan as (shariah-compliant) full-fledged Islamic banks, fivelarge and eight small banks are licensed to operate Islamic branchesas well as conventional ones. These so-called “mixed” banks actuallykeep two separate balance sheets for their conventional and Islamicbranches, respectively. In table 10 we therefore also study the impactthrough the Islamic share (by assets) of the banks in panel A andthrough the Islamic branches of the large and small mixed banks(adding their conventional branches to the set of small and largeconventional banks) in panel B. We again turn to the baseline model(i.e., model (1) from table 8) augmented by the respective additionalvariables.
In panel A of table 10, the results confirm our findings so far.Indeed, take the interaction terms of bank liquidity and changes inthe interest rate for the pure conventional small banks. The esti-mated coefficient equals 25.16∗∗. For the (pure) Islamic small banks,the estimated coefficient then equals 25.16∗∗ + (100 × −0.61∗∗∗) =−35.84, which is not different from the estimated coefficient for thepure conventional large banks, which equals −55.84∗∗∗.
In panel B the estimates on the coefficients for Islamic banksremain similar, even though now the benchmark category is

210 International Journal of Central Banking December 2013Tab
le9.
Loa
nG
row
th,A
cros
sB
ank
Type:
Bas
elin
eSpec
ifica
tion
Augm
ente
dw
ith
Additio
nal
Ban
kC
har
acte
rist
ics
Thi
sta
ble
repo
rts
the
sum
ofth
ees
tim
ated
coeffi
cien
tsfo
rba
selin
esp
ecifi
cati
ons
wit
hth
ede
pend
ent
vari
able
Δlo
g(L
it),
whi
chis
the
quar
terl
ych
ange
inth
elo
gari
thm
ofth
eto
tal
amou
ntof
the
loan
sgr
ante
dto
the
priv
ate
sect
orby
bank
iin
year
:qua
rter
t.T
hein
depe
nden
tva
riab
les
are
Δlo
g(L
it−
j),
whi
char
ej
lags
ofth
ede
pend
ent
vari
able
,ΔR
t−j
isth
equ
arte
rly
chan
gein
the
thre
e-m
onth
Tre
asur
y-bi
llra
tein
year
:qua
rter
t−
j,X
it−
1is
the
liqui
das
sets
(i.e
.,ca
shan
dba
lanc
esw
ith
the
bank
s)ov
erto
talas
sets
ofba
nki
inye
ar:q
uart
ert,
and
Bit
−1
isth
ead
diti
onal
bank
char
acte
rist
icw
hich
vari
esby
colu
mn:
Non
-Per
form
ing
Loa
nsis
the
amou
ntof
non-
perf
orm
ing
loan
sov
erto
tal
asse
ts,
Non
-Len
ding
Bus
ines
sis
the
non-
lend
ing-
base
dea
rnin
gas
sets
over
tota
lear
ning
asse
ts,N
on-D
epos
itFu
ndin
gis
the
fund
ing
othe
rth
ande
posi
tsov
erto
talf
undi
ng,t
heLen
ding
Rat
eis
the
inte
rest
inco
me
onlo
ans
gran
ted
toth
epr
ivat
e-se
ctor
over
aver
age
loan
sgr
ante
dto
the
priv
ate
sect
or,
RO
Ais
retu
rnon
asse
ts,
and
Fix
edA
sset
sis
the
fixed
asse
tsov
erto
tal
asse
ts.
The
esti
mat
ions
use
756
bank
year
:qua
rter
obse
rvat
ions
.Sta
ndar
der
rors
are
hete
rosk
edas
tici
tyco
nsis
tent
and
clus
tere
dat
the
year
:qua
rter
leve
l.**
*de
note
ssi
gnifi
canc
eat
1pe
rcen
t,**
sign
ifica
nce
at5
perc
ent,
and
*si
gnifi
canc
eat
10pe
rcen
t.
Non
-N
on-
Non
-A
ddit
ional
Ban
kPer
form
ing
Len
din
gD
epos
itLen
din
gFix
ed(S
um
of)
Est
imat
edC
har
acte
rist
ic/
Loa
ns
Busi
nes
sFundin
gR
ate
RO
AA
sset
sC
oeffi
cien
tsB
ank
Type
(1)
(2)
(3)
(4)
(5)
(6)
4 ∑ j=
1
Δlo
g(L
it−
j)
Smal
l0.
33∗∗
∗0.
42∗∗
∗0.
32∗∗
∗0.
39∗∗
∗0.
39∗∗
∗0.
35∗∗
∗
Lar
ge0.
150.
140.
150.
080.
200.
16D
iffer
ence
from
Isla
mic
0.05
0.15
0.10
0.06
0.06
0.13
Smal
lBan
ksLa
rge
−0.
18−
0.28
∗−
0.16
−0.
31∗∗
−0.
19−
0.19
Isla
mic
−0.
28∗
−0.
27∗
−0.
22−
0.33
∗∗−
0.33
∗−
0.21
4 ∑ j=
0
ΔR
t−j
Smal
l−
8.03
∗∗∗
−8.
62∗∗
∗−
10.6
5∗∗∗
−5.
04∗
−6.
61∗∗
∗−
6.27
∗∗∗
Lar
ge5.
423.
616.
299.
59∗
5.05
8.07
Diff
eren
cefrom
Isla
mic
2.03
−0.
750.
465.
121.
531.
95Sm
allBan
ksLa
rge
13.4
5∗∗∗
12.2
3∗∗∗
16.9
4∗∗∗
14.6
3∗∗∗
11.6
6∗∗∗
14.3
5∗∗∗
Isla
mic
10.0
6∗∗7.
8811
.10∗∗
10.1
5∗∗8.
148.
22∗∗
(con
tinu
ed)
Vol. 9 No. 4 The Transmission of Monetary Policy 211
Tab
le9.
(Con
tinued
)
Non
-N
on-
Non
-A
ddit
ional
Ban
kPer
form
ing
Len
din
gD
epos
itLen
din
gFix
ed(S
um
of)
Est
imat
edC
har
acte
rist
ic/
Loa
ns
Busi
nes
sFundin
gR
ate
RO
AA
sset
sC
oeffi
cien
tsB
ank
Type
(1)
(2)
(3)
(4)
(5)
(6)
Xit
−1
∗4 ∑ j=
0
ΔR
t−j
Smal
l28
.42∗∗
78.6
9∗∗∗
44.8
9∗17
.75
20.8
924
.22∗
Lar
ge−
27.7
528
.73
−36
.58
−46
.92
−23
.03
−44
.61
Diff
eren
cefrom
Isla
mic
−32
.33
33.7
3−
21.9
5−
39.1
3−
27.3
0−
29.4
2∗
Smal
lBan
ksLa
rge
−56
.17
−49
.96
−81
.46∗∗
∗−
64.6
7∗∗−
43.9
2−
68.8
3∗∗
Isla
mic
−60
.75∗∗
∗−
44.9
6∗−
66.8
3∗∗∗
−56
.87∗∗
∗−
48.1
9∗−
53.6
4∗∗∗
Bit
−1
−0.
070.
00−
0.21
∗∗∗
0.09
−0.
25−
0.05
Bit
−1
∗X
it−
1∗
4 ∑ j=
0
ΔR
t−j
−0.
78−
1.79
∗∗∗
−0.
702.
21−
10.0
31.
18
Bit
−1
∗4 ∑ j=
0
ΔR
t−j
0.12
∗0.
120.
14∗∗
−0.
621.
27−
0.33
Bit
−1
∗X
it−
1−
0.87
1.54
∗∗∗
0.41
−0.
035.
953.
28
Qua
rter
Dum
mie
s,Tre
ndY
esY
esY
esY
esY
esY
esB
ank
Fix
edE
ffect
sY
esY
esY
esY
esY
esY
es

212 International Journal of Central Banking December 2013Tab
le10
.Loa
nG
row
th,A
cros
sB
ank
Bra
nch
Type:
Augm
ente
dB
asel
ine
Thi
sta
ble
repo
rts
the
sum
ofth
ees
tim
ated
coeffi
cien
tsfo
ra
base
line
spec
ifica
tion
wit
hth
ede
pend
ent
vari
able
Δlo
g(L
it),
whi
chis
the
quar
terl
ych
ange
inth
elo
gari
thm
ofth
eto
tal
amou
ntof
the
loan
sgr
ante
dto
the
priv
ate
sect
orby
bank
iin
year
:qua
rter
t.T
hein
depe
nden
tva
riab
les
are
Δlo
g(L
it−
j),
whi
char
ej
lags
ofth
ede
pend
ent
vari
able
,ΔR
t−j
isth
equ
arte
rly
chan
gein
the
thre
e-m
onth
Tre
asur
y-bi
llra
tein
year
:qua
rter
t−
j,an
dX
it−
1is
the
liqui
das
sets
(i.e
.,ca
shan
dba
lanc
esw
ith
the
bank
s)ov
erto
talas
sets
ofba
nki
inye
ar:q
uart
ert.
Inpa
nelA
,w
eal
sope
rfor
man
exer
cise
whe
rew
eus
ea
cont
inuo
usm
easu
reof
Isla
mic
shar
e.Fo
rpu
reIs
lam
icba
nks,
the
valu
e“I
slam
icSh
are”
is10
0,fo
rpu
reco
nven
tion
alba
nks
this
is0,
and
for
mix
edba
nks
the
mea
sure
vari
esbe
twee
n0
and
100.
Inpa
nelB
,w
esp
litth
eba
lanc
esh
eet
ofth
eth
irte
enm
ixed
bank
s,fiv
eof
whi
char
ela
rge
and
eigh
tof
whi
char
esm
all,
into
thei
rco
nven
tion
alan
dIs
lam
icbr
anch
es.T
hees
tim
atio
nsth
eref
ore
use
982
bank
(bra
nch
type
)ye
ar:q
uart
erob
serv
atio
ns.St
anda
rder
rors
are
hete
rosk
edas
tici
tyco
nsis
tent
and
clus
tere
dat
the
year
:qu
arte
rle
vel.
***
deno
tes
sign
ifica
nce
at1
perc
ent,
**si
gnifi
canc
eat
5pe
rcen
t,an
d*
sign
ifica
nce
at10
perc
ent.
A.Bas
elin
eSp
ecifi
cation
Aug
men
ted
byIs
lam
icSh
are
(Sum
of)
Est
imat
edA
ugm
ente
dB
asel
ine
Coeffi
cien
tsB
ank
Type
Con
venti
onal
Isla
mic
Shar
e4 ∑ j=
1
Δlo
g(L
it−
j)
Smal
lB
anks
0.36
∗∗∗
0.00
3∗∗∗
Lar
geB
anks
−0.
06∗∗
∗−
0.03
Diff
eren
cefrom
Smal
lLa
rge
Ban
ks−
0.4
2∗∗
∗
Con
vent
iona
lBan
ks4 ∑ j=
0
ΔR
t−j
Smal
lB
anks
−7.
23∗∗
∗0.
10∗∗
Lar
geB
anks
11.7
3∗∗∗
−17
.42∗∗
∗
Diff
eren
cefrom
Smal
lLa
rge
Ban
ks18
.96
∗∗∗
Con
vent
iona
lBan
ks
Xit
−1
∗4 ∑ j=
0
ΔR
t−j
Smal
lB
anks
25.1
6∗∗−
0.61
∗∗∗
Lar
geB
anks
−55
.84∗∗
∗11
3.60
∗∗∗
Diff
eren
cefrom
Smal
lLa
rge
Ban
ks−
81.0
0∗∗
∗
Con
vent
iona
lBan
ks
(con
tinu
ed)

Vol. 9 No. 4 The Transmission of Monetary Policy 213
Tab
le10
.(C
ontinued
)
B.Bas
elin
eSp
ecifi
cation
Aug
men
ted
byIs
lam
icBra
nche
s
(Sum
of)
Est
imat
edA
ugm
ente
dB
asel
ine
Coeffi
cien
tsB
ank
Type
Sm
all
Lar
ge4 ∑ j=
1
Δlo
g(L
it−
j)
Con
vent
iona
lB
anks
and
0.35
∗∗∗
0.08
Con
vent
iona
lB
ranc
hes
ofM
ixed
Ban
ksD
iffer
ence
from
Smal
lIs
lam
icB
ranc
hes
ofM
ixed
Ban
ks−
0.22
0.71
∗∗∗
Con
vent
iona
lBan
ksan
dIs
lam
icB
anks
0.06
Con
vent
iona
lBra
nche
sC
onve
ntio
nalBan
ksan
d−
0.28
∗∗
ofSm
allM
ixed
Ban
ksC
onve
ntio
nalBra
nche
sof
Mix
edBan
ksIs
lam
icBra
nche
sof
Mix
edBan
ks−
0.58
∗∗∗
0.36
∗
Isla
mic
Ban
ks−
0.29
∗
4 ∑ j=
0
ΔR
t−j
Con
vent
iona
lB
anks
and
−6.
43∗∗
∗3.
40∗
Con
vent
iona
lB
ranc
hes
ofM
ixed
Ban
ksD
iffer
ence
from
Smal
lIs
lam
icB
ranc
hes
ofM
ixed
Ban
ks−
3.91
0.11
Con
vent
iona
lBan
ksan
dIs
lam
icB
anks
1.54
Con
vent
iona
lBra
nche
sC
onve
ntio
nalBan
ksan
d9.
83∗∗
∗
ofSm
allM
ixed
Ban
ksC
onve
ntio
nalBra
nche
sof
Mix
edBan
ksIs
lam
icBra
nche
sof
Mix
edBan
ks2.
526.
54∗∗
Isla
mic
Ban
ks7.
96∗
(con
tinu
ed)
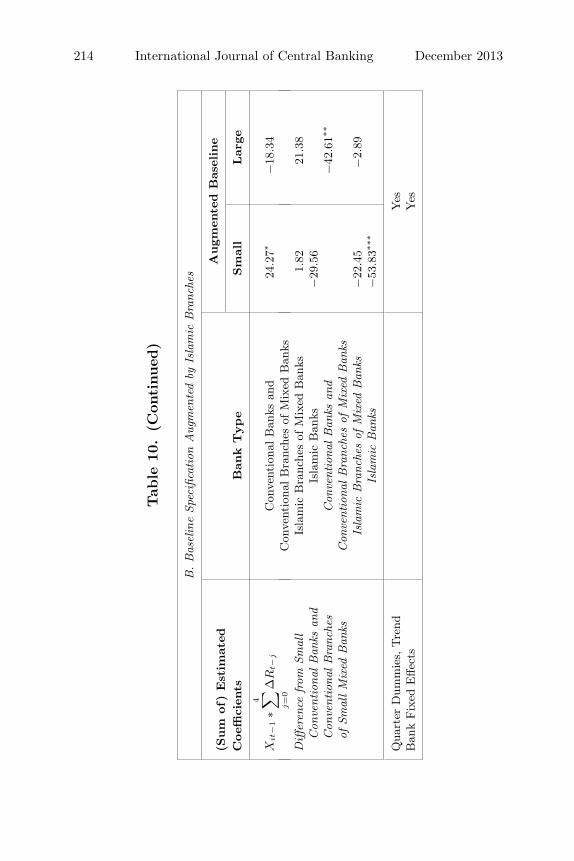
214 International Journal of Central Banking December 2013
Tab
le10
.(C
ontinued
)
B.Bas
elin
eSp
ecifi
cation
Aug
men
ted
byIs
lam
icBra
nche
s
(Sum
of)
Est
imat
edA
ugm
ente
dB
asel
ine
Coeffi
cien
tsB
ank
Type
Sm
all
Lar
ge
Xit
−1
∗4 ∑ j=
0
ΔR
t−j
Con
vent
iona
lB
anks
and
24.2
7∗−
18.3
4C
onve
ntio
nalB
ranc
hes
ofM
ixed
Ban
ksD
iffer
ence
from
Smal
lIs
lam
icB
ranc
hes
ofM
ixed
Ban
ks1.
8221
.38
Con
vent
iona
lBan
ksan
dIs
lam
icB
anks
−29
.56
Con
vent
iona
lBra
nche
sC
onve
ntio
nalBan
ksan
d−
42.6
1∗∗
ofSm
allM
ixed
Ban
ksC
onve
ntio
nalBra
nche
sof
Mix
edBan
ksIs
lam
icBra
nche
sof
Mix
edBan
ks−
22.4
5−
2.89
Isla
mic
Ban
ks−
53.8
3∗∗∗
Qua
rter
Dum
mie
s,Tre
ndY
esB
ank
Fix
edE
ffect
sY
es

Vol. 9 No. 4 The Transmission of Monetary Policy 215
somewhat altered (i.e., it no longer comprises the Islamic branchesof the small mixed banks). The estimates on the coefficients of theIslamic branches of large mixed banks and the Islamic branches ofsmall mixed banks, and their difference from the benchmark cate-gory of small conventional banks and conventional branches of smallmixed banks, are also very interesting. The estimates suggest a sim-ilar though more muted reaction from Islamic branches (of mixedbanks) than from Islamic banks, even though the estimates (andtheir differences from the benchmark category) are not always sta-tistically significant. There is one mixed bank that is public; it isalso small. So in unreported regressions we further split the Islamicbranches of the small mixed banks into private and public but findno further differences.
Next we investigate the results for different levels of interestrates, i.e., to assess across bank type the existence of any non-linearity in the impact of monetary conditions (e.g., Thoma 1994;Weise 1999). In table 11 we show the estimates for the baselinemodel ((1) in table 8) that also includes dummies for high and lowTreasury-bill rates (above and below median). The table reportsthe sum of the estimated coefficients from this one specificationin the first two adjacent columns, while the third column reportsthe difference and its statistical significance based on a Wald testof the High – Low = 0 equality restriction. The estimates suggestthat there are statistically no differences in the reaction to mone-tary conditions for small banks between periods with high and lowTreasury-bill rates. However, the differential impact of liquidity isstronger for these banks during the time of low interest rates thanin the period of high interest rates. The potential explanation forthis difference is that when the interest rates are low, the changes(increase) in interest rates are more consistent and higher than wheninterest rates are high. Also, reactions of the large Islamic banks intimes of low interest rates are stronger than when interest rates arehigh.
Finally, we investigate the impact of monetary conditions on theinterest rate charged by banks (lending rate). We calculate the lend-ing rate as the interest income on loans granted to the private sectorover average loans granted to the private sector. In table 12 we intro-duce (the quarterly change of) this new dependent variable in thebaseline model (i.e., model (1) from table 8). Recall that in prin-ciple Islamic banks do not charge any interest, so for these banks

216 International Journal of Central Banking December 2013
Tab
le11
.Loa
nG
row
th,A
cros
sB
ank
Type:
For
the
Bas
elin
eR
egre
ssio
nB
anks’
Res
pon
seat
Hig
han
dLow
Lev
elof
the
Pol
icy
Rat
e
Thi
sta
ble
repo
rts
the
sum
ofth
ees
tim
ated
coeffi
cien
tsfo
rth
eba
selin
esp
ecifi
cati
onw
ith
the
depe
nden
tva
riab
leΔ
log(
Lit),
whi
chis
the
quar
terl
ych
ange
inth
elo
gari
thm
ofth
eto
talam
ount
ofth
elo
ans
gran
ted
toth
epr
ivat
ese
ctor
byba
nki
inye
ar:q
uart
ert.
The
spec
ifica
tion
also
incl
udes
dum
mie
sfo
rhi
ghan
dlo
wTre
asur
y-bi
llra
tes
(abo
vean
dbe
low
med
ian)
.The
tabl
ere
port
sth
esu
mof
the
esti
mat
edco
effici
ents
from
this
one
spec
ifica
tion
intw
oad
jace
ntco
lum
ns.C
olum
n3
repo
rts
the
diffe
renc
ean
dit
sst
atis
tica
lsig
nific
ance
base
don
aW
ald
test
ofth
eH
igh
–Low
=0
equa
lity
rest
rict
ion.
The
inde
pend
ent
vari
able
sar
eΔ
log(
Lit
−j),
whi
char
ej
lags
ofth
ede
pend
ent
vari
able
,Δ
Rt−
jis
the
quar
terl
ych
ange
inth
eth
ree-
mon
thTre
asur
y-bi
llra
tein
year
:qua
rter
t−
j,an
dX
it−
1is
the
liqui
das
sets
(i.e
.,ca
shan
dba
lanc
esw
ith
the
bank
s)ov
erto
tala
sset
sof
bank
iin
year
:qua
rter
t.T
hees
tim
atio
nsus
e75
6ba
nkye
ar:q
uart
erob
serv
atio
ns.St
anda
rder
rors
are
hete
rosk
edas
tici
tyco
nsis
tent
and
clus
tere
dat
the
year
:qua
rter
leve
l.**
*de
note
ssi
gnifi
canc
eat
1pe
rcen
t,**
sign
ifica
nce
at5
perc
ent,
and
*si
gnifi
canc
eat
10pe
rcen
t.
(Sum
of)
Est
imat
edH
igh
Tre
asury
-Low
Tre
asury
-W
ald
Tes
t:C
oeffi
cien
tsB
ank
Type
BillR
ate
BillR
ate
Hig
h–
Low
=0
4 ∑ j=
1
Δlo
g(L
it−
j)
Smal
l0.
37∗∗
∗
Lar
ge0.
28∗
Diff
eren
cefrom
Smal
lBan
ksIs
lam
ic0.
07La
rge
−0.
10Is
lam
ic−
0.30
∗∗
(con
tinu
ed)

Vol. 9 No. 4 The Transmission of Monetary Policy 217
Tab
le11
.(C
ontinued
)
(Sum
of)
Est
imat
edH
igh
Tre
asury
-Low
Tre
asury
-W
ald
Tes
t:C
oeffi
cien
tsB
ank
Type
BillR
ate
BillR
ate
Hig
h–
Low
=0
4 ∑ j=
0
ΔR
t−j
Smal
l−
8.52
∗∗∗
−8.
53∗∗
∗0.
01Lar
ge3.
068.
09∗∗
−5.
03∗∗
∗
Diff
eren
cefrom
Smal
lBan
ksIs
lam
ic1.
017.
861.
01∗
Larg
e11
.58∗
∗∗16
.62∗
∗∗−
5.04
∗∗∗
Isla
mic
9.53
∗∗∗
16.3
9∗∗∗
−6.
86∗∗
∗
Xit
−1
∗4 ∑ j=
0
ΔR
t−j
Smal
l18
.73
29.0
2∗∗
−10
.29∗
∗
Lar
ge−
19.2
5−
51.9
9∗32
.74∗
∗∗
Diff
eren
cefrom
Smal
lBan
ksIs
lam
ic−
46.6
1∗∗
−55
.02∗
∗8.
41La
rge
−37
.97
−81
.01∗
∗∗43
.03∗
∗∗
Isla
mic
−65
.33∗
∗∗−
84.0
3∗∗∗
18.7
0∗
Qua
rter
Dum
mie
s,Tre
ndY
esY
esY
esB
ank
Fix
edE
ffect
sY
esY
esY
es

218 International Journal of Central Banking December 2013
Table 12. Change in the Lending Rate, Across Bank Type
This table reports the sum of the estimated coefficients for the baselinespecification with the alternative dependent variable ΔLRATEit, which isthe quarterly change in the net interest income on loans granted to theprivate sector over total loans granted to the private sector by bank i inyear:quarter t. The independent variables are Δ log(LRATEit−j), whichare j lags of the dependent variable, ΔRt−j is the quarterly change inthe three-month Treasury-bill rate in year:quarter t − j, Xit−1 is the liquidassets (i.e., cash and balances with the banks) over total assets of bank i inyear:quarter t, and Bit−1 is the bank characteristics, which varies in eachcolumn and mentioned in the first row of the table. The estimations use756 bank year:quarter observations. Standard errors are heteroskedasticityconsistent and clustered at the year:quarter level. *** denotes significanceat 1 percent, ** significance at 5 percent, and * significance at 10 percent.
Without With(Sum of) Estimated Liquidity LiquidityCoefficients Bank Type Interaction Interaction
4∑j=1
Δ log(LRATEit−j) Small −1.69∗∗∗ −1.73∗∗∗
Large −2.04∗∗∗ −2.04∗∗∗
Difference from Small Banks Islamic −1.50∗∗∗ −1.51∗∗∗
Large −0.35 −0.31Islamic 0.19 0.22
4∑j=0
ΔRt−j Small 1.02∗∗∗ 0.95∗∗∗
Large 1.40∗∗∗ 1.53∗
Difference from Small Banks Islamic 1.38∗∗∗ 1.75∗∗
Large 0.38 0.58Islamic 0.35∗∗ 0.81
Xit−1 ∗4∑
j=0
ΔRt−j Small 0.96Large −2.01
Difference from Small Banks Islamic −2.08Large −2.97Islamic −3.04
Quarter Dummies, Trend Yes YesBank Fixed Effects Yes Yes

Vol. 9 No. 4 The Transmission of Monetary Policy 219
the interest income is a markup which has to be calculated on thebasis of all outstanding contracts (that may often have equity-likefeatures). Despite the difficulties of the comparison involved, theestimates (though not always statistically significant) are consistentwith those on the quantity side.
5. Conclusion
The fast growth of Islamic banking and finance across the worldraises an important question to academics and policymakers alike:Will the transmission of monetary policy through the bank lendingchannel be altered when the Islamic segment of the banking sectorbecomes significantly larger? The bank lending channel importantlydepends on the ability of the central bank to affect bank loan sup-ply. For that it matters whether banks can or cannot attract (time)deposits perfectly elastically at interest rates outside the control ofthe central bank and whether they consider the loans granted andsecurities held in portfolio as perfect substitutes.
Islamic banks may, on the one hand, be unable or unwilling toissue wholesale time deposits at a fixed rate and may not considertheir Islamic loans substitutable for any of the securities they wouldalternatively hold in their portfolio. This may make the transmis-sion of monetary policy shocks through the Islamic segment of thebanking sector more potent. On the other hand, Islamic banks sin-gularly attract deposits and lend under interest-free arrangements,likely entered into for religious reasons by depositors and borrowers(Baele, Farooq, and Ongena 2012; Khan and Khanna 2012). Thesecontractual and motivational features on both their liability andasset sides may allow Islamic banks to shield themselves from mone-tary policy shocks. Thus, in the end, whether Islamic banks transmitmonetary policy differently than conventional banks is an empiricalquestion, which we address in this paper.
We investigate the differences in banks’ responses to monetarypolicy shocks across bank size, liquidity, and type—i.e., conventionalversus Islamic—in Pakistan between 2002:Q2 and 2010:Q1. We findthat following a monetary contraction, small banks with liquid bal-ance sheets cut their lending less than other small banks. In contrast,large banks maintain their lending irrespective of their liquidity posi-tions. Islamic banks, though similar in size to small banks, respond

220 International Journal of Central Banking December 2013
to monetary policy shocks like large banks. Hence the credit channelof monetary policy is likely to weaken when Islamic banking growsin relative importance, assuming of course that the characteristicsof Islamic banks will not change as the sector grows larger.
References
Angeloni, I., A. K. Kashyap, and B. Mojon, eds. 2003. MonetaryPolicy Transmission in the Euro Area. Cambridge: CambridgeUniversity Press.
Arellano, M., and O. Bover. 1995. “Another Look at the Instrumen-tal Variable Estimation of Error-Components Models.” Journalof Econometrics 68 (1): 29–51.
Ashcraft, A. 2006. “New Evidence on the Lending Channel.” Journalof Money, Credit and Banking 38 (3): 751–75.
Baele, L., M. Farooq, and S. Ongena. 2012. “Of Religion andRedemption: Evidence from Default on Islamic Loans.” Mimeo,CentER – Tilburg University.
Beck, T., A. Demirguc-Kunt, and O. Merrouche. 2013. “Islamic vs.Conventional Banking: Business Model, Efficiency and Stability.”Journal of Banking and Finance 37 (2): 433–47.
Bernanke, B. S. 2007. “The Financial Accelerator and the CreditChannel.” Remarks presented at the Credit Channel of Mone-tary Policy in the Twenty-first Century Conference, Board ofGovernors of the Federal Reserve System, Atlanta, Georgia, June15.
Bernanke, B. S., and A. S. Blinder. 1988. “Money, Credit and Aggre-gate Demand.” American Economic Review 78 (2): 435–39.
———. 1992. “The Federal Funds Rate and the Channels of Mone-tary Transmission.” American Economic Review 82 (4): 901–21.
Bernanke, B. S., M. Gertler, and S. Gilchrist. 1996. “The FinancialAccelerator and the Flight to Quality.” Review of Economics andStatistics 78 (1): 1–15.
———. 1999. “The Financial Accelerator in a Quantitative BusinessCycle Framework.” In Handbook of Macroeconomics, Vol. 1C, ed.J. Taylor and M. Woodford. Amsterdam: Elsevier.
Bernanke, B. S., and I. Mihov. 1998. “Measuring Monetary Policy.”Quarterly Journal of Economics 113 (3): 869–902.

Vol. 9 No. 4 The Transmission of Monetary Policy 221
Black, L. K., D. Hancock, and W. Passmore. 2009. “Core DepositFunding of Subprime Mortgages and the Effect of Monetary Pol-icy.” Mimeo, Board of Governors of the Federal Reserve System.
Boschen, J. F., and L. O. Mills. 1995. “The Relation between Nar-rative and Money Market Indicators of Monetary Policy.” Eco-nomic Inquiry 33 (1): 24–44.
Brissimis, S. N., N. C. Kamberoglou, and G. T. Simigiannis. 2003. “IsThere a Bank-Lending Channel of Monetary Policy in Greece?Evidence from Bank-Level Data.” In Monetary Policy Trans-mission in the Euro Area, ed I. Angeloni, A. K. Kashyap, and B.Mojon, 309–22. Cambridge: Cambridge University Press.
Cecchetti, S. 1999. “Legal Structure, Financial Structure, and theMonetary Policy Transmission Mechanism.” Economic PolicyReview (Federal Reserve Bank of New York) 5 (3): 9–28.
Christiano, L. J., M. Eichenbaum, and C. Evans. 1996. “The Effectsof Monetary Policy Shocks: Evidence from the Flow of Funds.”Review of Economics and Statistics 78 (1): 16–34.
Cowen, T., and R. S. Kroszner. 1990. “Mutual Fund Bank-ing: A Market Approach.” Cato Journal 10 (Spring/Summer):223–37.
de Haan, L. 2003. “The Impact of Monetary Policy on Bank Lend-ing in the Netherlands.” In Monetary Policy Transmission inthe Euro Area, ed. I. Angeloni, A. K. Kashyap, and B. Mojon,335–46. Cambridge: Cambridge University Press.
Detragiache, E., P. G. Garella, and L. Guiso. 2000. “Multiple versusSingle Banking Relationships: Theory and Evidence.” Journal ofFinance 55 (3): 1133–61.
Ehrmann, M., L. Gambacorta, J. Martinez-Pages, P. Sevestre, andA. Worms. 2001. “Financial Systems and the Role of Banks inMonetary Policy Transmission in the Euro Area.” ECB WorkingPaper No. 105.
———. 2003. “The Effects of Monetary Policy in the Euro Area.”Oxford Review of Economic Policy 19 (1): 58–72.
Gambacorta, L. 2005. “Inside the Bank Lending Channel.” EuropeanEconomic Review 49 (7): 1737–59.
Gertler, M., and S. Gilchrist. 1993. “The Role of Credit MarketImperfections in the Monetary Transmission Mechanism: Argu-ments and Evidence.” Scandinavian Journal of Economics 95(1): 43–64.

222 International Journal of Central Banking December 2013
———. 1994. “Monetary Policy, Business Cycles, and the Behaviorof Small Manufacturing Firms.” Quarterly Journal of Economics109 (2): 309–40.
Gertler, M., and P. Karadi. 2011. “A Model of Unconventional Mon-etary Policy.” Journal of Monetary Economics 58 (1): 17–34.
Gertler, M., and N. Kiyotaki. 2011. “Financial Intermediation andCredit Policy in Business Cycle Analysis.” In Handbook of Mone-tary Economics, Vol. 3A, ed. B. M. Friedman and M. Woodford,547–600. New York, NY: Elsevier.
Hong, H., and M. Kacperczyk. 2009. “The Price of Sin: The Effectsof Social Norms on Markets.” Journal of Financial Economics93 (1): 15–26.
Hong, H., and L. Kostovetsky. 2012. “Red and Blue Investing: Valuesand Finance.” Journal of Financial Economics 103 (1): 1–19.
International Financial Services London. 2010. Islamic FinanceReport 2010.
Jayaratne, J., and D. P. Morgan. 2000. “Capital Market Frictionsand Deposit Constraints at Banks.” Journal of Money, Creditand Banking 32 (1): 74–92.
Judson, R. A., and A. L. Owen. 1999. “Estimating Dynamic PanelData Models: A Guide for Macroeconomists.” Economics Letters65 (1): 9–15.
Kashyap, A. K., and J. C. Stein. 1995. “The Impact of MonetaryPolicy on Bank Balance Sheets.” Carnegie-Rochester ConferenceSeries on Public Policy 42: 151–95.
———. 2000. “What Do a Million Observations on Banks Sayabout the Transmission of Monetary Policy?” American Eco-nomic Review 90 (3): 407–28.
Kaufmann, S. 2003. “The Cross-Sectional and the Time Dimensionof the Bank-Lending Channel: The Austrian Case.” In Mon-etary Policy Transmission in the Euro Area, ed. I. Angeloni,A. K. Kashyap, and B. Mojon, 347–58. Cambridge: CambridgeUniversity Press.
Khan, A. K. 2010. “God, Government and Outsiders: The Influ-ence of Religious Beliefs on Depositor Behavior in an EmergingMarket.” Mimeo, Harvard.
Khan, A. K., and T. Khanna. 2012. “Is Faith a Luxury for theRich? Examining the Influence of Religious Beliefs on IndividualFinancial Choices.” In Building Bridges Across Financial Com-munities: The Global Financial Crisis, Social Responsibility, and

Vol. 9 No. 4 The Transmission of Monetary Policy 223
Faith-Based Finance, ed. S. N. Ali. Cambridge, MA: HarvardLaw School.
Khwaja, A. I., and A. Mian. 2005. “Do Lenders Favor PoliticallyConnected Firms? Rent Provision in an Emerging Financial Mar-ket.” Quarterly Journal of Economics 120 (4): 1371–1411.
———. 2008. “Tracing the Impact of Bank Liquidity Shocks: Evi-dence from an Emerging Market.” American Economic Review98 (4): 1413–42.
Kishan, R. P., and T. P. Opiela. 2000. “Bank Size, Bank Capital,and the Bank Lending Channel.” Journal of Money, Credit andBanking 32 (1): 121–41.
Kiyotaki, N., and J. Moore. 2012. “Liquidity, Business Cycles andMonetary Policy.” Mimeo, Princeton University.
Lang, W. W., and L. I. Nakamura. 1995. “‘Flight to Quality’ inBanking and Economic Activity.” Journal of Monetary Econom-ics 36 (1): 145–64.
Loupias, C., F. Savignac, and P. Sevestre. 2003. “Is There a BankLending Channel in France? Evidence from Bank Panel Data.” InMonetary Policy Transmission in the Euro Area, ed. I. Angeloni,A. K. Kashyap, and B. Mojon, 297–308. Cambridge: CambridgeUniversity Press.
Mian, A. 2006. “Distance Constraints: The Limits of Foreign Lend-ing in Poor Economies.” Journal of Finance 61 (3): 1465–1505.
Oliner, S., and G. Rudebusch. 1996. “Monetary Policy and CreditConditions: Evidence from the Composition of External Finance:Comment.” American Economic Review 86 (1): 300–309.
Renneboog, L., J. Ter Horst, and C. Zhang. 2008. “SociallyResponsible Investments: Institutional Aspects, Performance,and Investor Behavior.” Journal of Banking and Finance 32 (9):1723–42.
Romer, C. D., and D. H. Romer. 1989. “Does Monetary PolicyMatter? A New Test in the Spirit of Friedman and Schwartz.”In Macroeconomics Annual, Vol. 4, ed. O. J. Blanchard and S.Fischer, 121–84. Cambridge, MA: National Bureau of EconomicResearch.
———. 1990. “New Evidence on the Monetary Transmission Mech-anism.” Brookings Papers on Economic Activity 1: 149–213.
Sargan, J. D. 1958. “The Estimation of Economic RelationshipsUsing Instrumental Variables.” Econometrica 26 (3): 393–415.

224 International Journal of Central Banking December 2013
Standard & Poor’s. 2010. Islamic Finance Outlook 2010.State Bank of Pakistan. 2004. Financial Sector Assessment. Karachi:
State Bank of Pakistan.———. 2007–08. Financial Stability Review. Karachi: State Bank of
Pakistan.———. 2008–09. Financial Stability Review. Karachi: State Bank of
Pakistan.———. 2009. Handbook of Islamic Products & Services. Karachi:
State Bank of Pakistan.Thoma, M. A. 1994. “Subsample Instability and Asymmetries in
Money-Income Causality.” Journal of Econometrics 64 (1–2):279–306.
Verbeek, M. 2008. A Guide to Modern Econometrics. 3rd ed. Hobo-ken NJ: John Wiley & Sons.
Weise, C. L. 1999. “The Asymmetric Effects of Monetary Policy: ANonlinear Vector Autoregression Approach.” Journal of Money,Credit and Banking 31 (1): 85–108.
White, H. L. 1980. “A Heteroskedasticity-Consistent CovarianceMatrix Estimator and a Direct Test for Heteroskedasticity.”Econometrica 48 (4): 817–38.
Worms, A. 2003. “The Reaction of Bank Lending to Monetary Pol-icy Measures in Germany.” In Monetary Policy Transmission inthe Euro Area, ed. I. Angeloni, A. K. Kashyap, and B. Mojon,270–83. Cambridge: Cambridge University Press.
Zia, B. H. 2008. “Export Incentives, Financial Constraints, and the(Mis)allocation of Credit: Micro-level Evidence from SubsidizedExport Loans.” Journal of Financial Economics 87 (2): 498–527.