Embed Size (px)
Citation preview

A Forrester Total Economic Impact™
Study Commissioned By Microsoft
October 2018
The Total Economic Impact™ Of The Microsoft 365 E5 Solutions
The Value Of Creating The Modern Workplace

Table Of Contents Executive Summary 1
Key Findings 1 TEI Framework And Methodology 6
The Microsoft 365 E5 Solutions Customer Journey 7 Creating The Modern Workplace 7 Interviewed And Surveyed Organizations 7 Key Challenges 8 Key Results 9 Composite Organization 11
Analysis Of Benefits 12 Improved Collaboration And Information Sharing Across Information Workers 13 Improved Firstline Worker Performance 14 Improved Business Processes And Outcomes 16 Efficient And Effective Online Meetings 18 Secure Access To Work From Anywhere 19 Reduced User Downtime 21 Faster Time-To-Decision 22 Reduction In Overnight Trips 24 Improved Security And Compliance Benefits 25 Device Provisioning IT Time Savings 32 Application Provisioning And Testing Savings 33 Reduced Help Desk Calls 36 Reduced Security Solution Costs 36 Eliminated Collaboration Solution Costs 38 Technology Cost Reductions 39 Flexibility 41
Analysis Of Costs 43 Planning, Implementation, And Ongoing Support 43 Deployment And Managed Services 44 Training 45 Licensing Costs 46 Additional Technology Costs 46
Financial Summary 48 Microsoft 365 Enterprise E5 solutions: Overview 49 Appendix A: Total Economic Impact 50 Appendix B: Supplemental Material 51 Appendix C: Endnotes 52
Project Director:
Jonathan Lipsitz
Project Contributor:
Adrienne Capaldo
ABOUT FORRESTER CONSULTING
Forrester Consulting provides independent and objective research-based
consulting to help leaders succeed in their organizations. Ranging in scope from a
short strategy session to custom projects, Forrester’s Consulting services connect
you directly with research analysts who apply expert insight to your specific
business challenges. For more information, visit forrester.com/consulting.
© 2018, Forrester Research, Inc. All rights reserved. Unauthorized reproduction
is strictly prohibited. Information is based on best available resources.
Opinions reflect judgment at the time and are subject to change. Forrester®,
Technographics®, Forrester Wave, RoleView, TechRadar, and Total Economic
Impact are trademarks of Forrester Research, Inc. All other trademarks are the
property of their respective companies. For additional information, go to
forrester.com.

1 | The Total Economic Impact™ Of The Microsoft 365 E5 Solutions
Executive Summary
Microsoft provides a wide range of cloud-based solutions to create and
empower the modern workplace. Microsoft 365 Enterprise E5 (Microsoft
365) solutions support many key needs of today’s enterprises, such as 1)
unlocking creativity through new user interfaces across any device and all
platforms to empower employees; 2) collaborating through teamwork
solutions that give people the right tools for the task at hand; 3)
streamlining IT operations with management tools and automation; and 4)
protecting end users, information, and cloud-based solutions with built-in,
platform-wide security solutions and signaling.
Microsoft 365 Enterprise E5 is the most feature-rich version of Microsoft
365 and consists of Office 365, Windows 10, and Enterprise Mobility +
Security (EMS). It provides the collaboration, productivity, automation, and
security features an enterprise customer may need to support its digital
business transformation initiatives in a single stock keeping unit (SKU),
which streamlines its deployment and utilization. For companies that do
not need the full feature set, Microsoft offers different versions, such as the
E3 SKU at a lower price point and F1 for firstline workers.
Microsoft commissioned Forrester Consulting to conduct a Total Economic
Impact™ (TEI) study and examine the potential return on investment (ROI)
that enterprises may realize by adopting Microsoft 365. The purpose of
this study is to provide readers with a framework to evaluate the potential
financial impact of Microsoft 365 on their organizations. To better
understand the benefits, costs, and risks associated with this investment,
Forrester interviewed four customers currently using Microsoft 365
Enterprise E5 and incorporated information from 41 other customers
interviewed from other TEI studies using either Microsoft 365 or some of
its underlying solutions. We also included data points from another 200
Microsoft 365 Enterprise E5 customers surveyed in 2017 and 101 Office
365 E5 customers surveyed in 2018.
Prior to moving to Microsoft 365, customers typically had a mix of
Microsoft and other vendor solutions that were primarily on-premises. This
led to disjointed processes, inefficient work practices, and fragmented
technology experiences that hampered performance and employee
productivity. Users found it difficult to collaborate both inside and outside
the four walls of the organization, organizations were still at risk of costly
and embarrassing breaches, and IT had difficulty providing business users
with the tools that they required.
Key Findings
Quantified benefits. The following risk-adjusted present value (PV)
quantified benefits are representative of those experienced by the
organizations interviewed and surveyed. Forrester has applied those
benefits to a composite organization with 5,000 Microsoft 365 users,
discussed in greater detail later in the study:
› Information workers save 100 minutes per week due to improved
collaboration and information sharing, specifically around
coauthoring and reviewing documents. The tightly integrated
Microsoft 365 solutions enable these information workers to effectively
and efficiently collaborate in real time, saving more than $6.30 million
over the three years analyzed.
Benefits And Costs
Total time saved in Year 3 from improved collaboration, business processes, reduced downtime, and access to information across 5,000 total users:
335,000 hours
Total TCO reduction for IT hardware, software, and effort:
$8,641,351
NPV per user:
$4,689

2 | The Total Economic Impact™ Of The Microsoft 365 E5 Solutions
› Firstline workers save 140 minutes per week from improved tools
and information. Better teamwork, communication, and management of
daily activities, including schedule and task management, save firstline
workers time, equating to more than $3.29 million over the three years
analyzed.
› Streamlined business processes reduce the time it takes to
develop a new product by 14.18 days and save 12,500 hours per
year in distribution activities. Microsoft 365 enables organizations to
streamline and transform business processes, leading to an overall
improvement in business outcomes. SharePoint, Teams, Skype for
Business, and Power BI Pro improve efforts via better collaboration,
decreased time spent on key tasks, improved effectiveness, and
improved efficiency. Microsoft 365 also enables firstline workers to
provide a unique point of view based on customer feedback. Specifically,
Forrester studied the reduction in product development cost and time
and distribution efficiencies, which yields a savings of more than $1.97
million over the three years analyzed.
› Information workers save 104 minutes each week with improved
online meetings. Intuitive solutions like Teams and Skype for Business
are more effective in their ability to start meetings on time, to share
documents and screens, and to allow participants to engage with one
another face-to-face. Respondents report that, with Microsoft 365, they
can better achieve the desired outcomes of their meetings, resulting in a
total savings of $6.56 million over the three years analyzed.
› The secure remote access features mean highly-mobile workers
save 24 minutes per day accessing systems and information. Of the
5,000 users at the composite organization, 700 fall into this highly-
mobile worker category. These employees are typically high-value
contributors, such as salespeople and senior managers. The time
savings represents a $4.81 million opportunity to deliver more value to
the organization.
› Microsoft 365 reduces downtime by an average of 15.75 hours
annually for each user. With secure access to information, systems,
and people from any device, whenever and wherever as needed, each
of the 5,000 Microsoft 365 users (across both information workers and
firstline workers) can reduce the impact of downtime due to a crashed
device. The time savings over three years are worth $1.86 million.
› Decision makers improve their time-to-decision by 15.6%. Microsoft
365 solutions like Power BI Pro and MyAnalytics enable executives and
key decision makers to quickly discover important trends and valuable
insights that directly impact the decisions they make. Microsoft 365
creates better access and visibility into data and helps decision makers
collaborate with stakeholders more easily. With Microsoft 365, users can
find what they need more easily, collaborate with their peers more
efficiently, and make more informed decisions faster than before,
resulting in a total savings of $581,806 over the three years analyzed.
› By Year 3, online meetings replace 350 overnight trips. Before their
investments in Microsoft 365, companies spent a large amount of their
budget on travel for face-to-face meetings that they felt would not be
effective otherwise. However, with the use of Microsoft 365’s
collaboration solutions, respondents can use Skype for Business and
Teams for meetings across geographies, ranging from small to large
groups, with no travel involved. The total savings over three years are
worth $524,887.
ROI 123%
Benefits PV $42.5 million
NPV $23.4 million
Payback 10 months after “go-live”

3 | The Total Economic Impact™ Of The Microsoft 365 E5 Solutions
› The number and severity of security events are greatly reduced,
and compliance is improved. The identity and access management
(IDAM), information protection, threat protection, and security
management features in Microsoft 365 reduce the number of successful
external and internal security attacks, including security attacks on
firstline workers who handle sensitive customer information. This
delivers several security-related benefits:
› The business impact of a breach in terms of lost customers and the
cost of communicating with outside parties is worth $408,531 over
three years.
› The number and severity of breaches are reduced, which means less
IT security remediation effort, resulting in a three-year savings of $4.00
million.
› Fewer successful security attacks also mean less user downtime,
reducing from 5 hours to 1. This is a three-year savings of $245,787.
› Compliance with many regulations such as GDPR and HIPPA is better
and easier because of the solutions included in Microsoft 365.
Additionally, companies save money by not having to build out
compliance solutions such as eDiscovery and see lower ongoing
compliance-related costs. The three-year savings is $220,170.
› The time it takes IT to provision a new device is reduced by 75%.
Using Intune and EMS makes it possible to streamline and automate
1,633 device provisioning events per year. The three-year savings is
$663,225.
› Automated application and resource provisioning solutions save
135 minutes per request, and application testing is reduced by
75%. On average, each information and firstline worker application
provisioning request at the composite organization is reduced from 150
minutes down to 15 minutes. Additionally, the IT organization can reduce
testing on 50% of the apps in its portfolio by 75%. This results in a
combined savings of $2.27 million.
› Self-help tools replace 75% of the 7,500 password reset calls to the
help desk. Automation tools within EMS empower employees to
complete their own password resets, reducing the number of password
reset calls to the help desk by 75%. This frees up help desk time and
also saves on employee downtime. At $20 per help desk ticket, the help
desk savings total $186,048.
› Third-party security solutions can be replaced with those built into
EMS, Windows 10, and Office 365. Antispam, encryption, mobile
device management, and other security solutions are included in EMS,
Windows 10, and Office 365 Advanced Security workloads. The
reduction in third-party security solutions represents a PV total savings
of $1.05 million.
› With Microsoft 365 solutions, organizations can reduce costs
associated with other collaboration software and hardware
solutions. Interviewed and surveyed companies reduced a combination
of webconferencing, long-distance, mobile phone, and on-premises
technology and support costs by switching to Microsoft 365. Over three
years, the total cost reduction is $648,727.
“We used to think of enhanced
security and enhanced
collaboration as independent.
With Microsoft 365, we can
gain the collaboration without
compromising security.”
Director of classified operations,
aerospace

4 | The Total Economic Impact™ Of The Microsoft 365 E5 Solutions
› On-premises hardware can be retired, and the associated IT
deployment and support costs are reduced. With Microsoft 365, the
composite organization can remove $500,000 of on-premises hardware.
In addition, six full-time equivalents (FTEs) who previously supported the
on-premises hardware and software can be redeployed to higher-value
activities. Additionally, Microsoft 365 licenses cost less than the various
licenses that would be required for a comparable on-premises Microsoft-
based solution. Lastly, the deployment time and costs are less than they
are for a comparable on-premises deployment because hardware and
software do not need to be installed and because Microsoft’s FastTrack
services reduce migration time and effort. The three-year savings is
$6.94 million.
Costs. The organizations experienced the following risk-adjusted PV
costs:
› Internal planning, implementation, and ongoing support costs total
$3.83 million. For the composite organization, the initial planning and
deployment takes 11 months and includes 10 FTE resources to support
the project. In the following year, four FTEs continue deployment efforts,
primarily SharePoint migrations. Ongoing management requires five
FTEs in Year 1 and six in the following years.
› Deployment and managed services total $6.33 million over the
three years analyzed. Professional services partners help stand up and
configure the solutions and then integrate them with other systems.
There are also ongoing deployment services to migrate SharePoint
sites. Additionally, a managed services contract includes managing
SharePoint sites from the partner’s offshore support center, security
monitoring, and help desk activities.
› IT and end user training costs an additional $692,597. An outside
professional services organization provides IT training at an average
cost of $300 per day of training. Two internal FTEs create end user
training; they are responsible for creating company-specific training
content, setting up a learning portal in SharePoint, and providing
“training the trainer” training to local champions.
› Licenses are allocated to a total of 5,000 information workers and
firstline workers, totaling $7.60 million over three years. These
represent costs paid to Microsoft for the use of the Microsoft 365
solutions. The 3,500 information workers receive Microsoft 365
Enterprise E5 licenses at a cost of $57/month per user — these costs
kick in when the solutions start being used in the Initial period. The 1,500
firstline workers receive Microsoft 365 F1 licenses at a cost of
$10/month per user.
› Additional technology costs to support Microsoft 365 totals
$635,805. This includes: replacing 400 computers out of the normal
refresh schedule; incremental bandwidth to handle increased voice,
video, and document traffic; and active directory federation services
(ADFS) servers.
“Modern communication and
collaboration tools like Office
365 are essential for new
working relationships and
models.”
VP, banking and capital markets

5 | The Total Economic Impact™ Of The Microsoft 365 E5 Solutions
Forrester’s synthesis of 41 customer interviews and two surveys totaling
301 companies, and subsequent financial analysis, found that an
organization based on these customers experiences benefits of $42.5M
over three years versus costs of $19.1M, adding up to a net present value
(NPV) of $23.4M, an ROI of 123%, and an internal rate of return (IRR) of
227%.
Total benefits PV, $42.5M
Total costs PV, $19.1M
Initial Year 1 Year 2 Year 3
Financial Summary
Payback:10 months after
"go-live"
$6.3M
$3.3M
$2.0M
$6.6M
$4.8M
$1.9M
$581.8K
$524.9K
$408.5K
$4.0M
$245.8K
$220.2K
$663.2K
$2.3M
$186.0K
$1.1M
$648.7K
$6.9M
Improved Collaboration and Information Sharing Across Information Workers
Improved firstline worker performance
Improved business processes
Efficient and effective online meetings
Secure access to work from anywhere
Reduced user downtime
Faster time to decision
Reduction in overnight trips
Reduced risk of a security breach - business impact
Recued risk of a security breach - faster time-to-remediate
Reduced risk of a security breach - end user impact
Reduced compliance costs
Device provisioning IT time savings
Application provisioning and testing savings
Reduced help desk calls
Reduced security solution costs
Eliminated collaboration solution costs
Technology cost reductions
Benefits (Three-Year)
6 | The Total Economic Impact™ Of The Microsoft 365 E5 Solutions
TEI Framework And Methodology
From the information provided in the interviews and survey, Forrester has
constructed a Total Economic Impact™ (TEI) framework for those
organizations considering implementing Microsoft 365 E5 solutions.
The objective of the framework is to identify the cost, benefit, flexibility, and
risk factors that affect the investment decision. Forrester took a multistep
approach to evaluate the impact that Microsoft 365 Enterprise E5 solutions
can have on an organization:
DUE DILIGENCE Interviewed Microsoft stakeholders and Forrester analysts to gather data relative to Microsoft 365 Enterprise E5 solutions.
CUSTOMER INTERVIEWS AND SURVEY Interviewed 45 organizations and surveyed 301 organizations using Microsoft 365 Enterprise E5 solutions (or some of its underlying components) to obtain data with respect to costs, benefits, and risks.
COMPOSITE ORGANIZATION Designed a composite organization based on characteristics of the interviewed and surveyed organizations.
FINANCIAL MODEL FRAMEWORK Constructed a financial model representative of the interviews and survey using the TEI methodology and risk-adjusted the financial model based on issues and concerns of the interviewed organizations.
CASE STUDY Employed four fundamental elements of TEI in modeling Microsoft 365 Enterprise E5’s impact: benefits, costs, flexibility, and risks. Given the increasing sophistication that enterprises have regarding ROI analyses related to IT investments, Forrester’s TEI methodology serves to provide a complete picture of the total economic impact of purchase decisions. Please see Appendix A for additional information on the TEI methodology.
The TEI methodology
helps companies
demonstrate, justify,
and realize the
tangible value of IT
initiatives to both
senior management
and other key
business
stakeholders.
DISCLOSURES
Readers should be aware of the following:
This study is commissioned by Microsoft and delivered by Forrester Consulting.
It is not meant to be used as a competitive analysis.
Forrester makes no assumptions as to the potential ROI that other
organizations will receive. Forrester strongly advises that readers use their own
estimates within the framework provided in the report to determine the
appropriateness of an investment in the Microsoft 365 Enterprise E5 solutions.
Microsoft reviewed and provided feedback to Forrester, but Forrester maintains
editorial control over the study and its findings and does not accept changes to
the study that contradict Forrester’s findings or obscure the meaning of the
study.
Microsoft did not participate in the interviews.

7 | The Total Economic Impact™ Of The Microsoft 365 E5 Solutions
The Microsoft 365 E5 Solutions Customer Journey
Creating The Modern Workplace
In interviews with Microsoft 365 customers, Forrester learned that digital
business transformation and creating the modern workplace — for both
information and firstline workers — is a top
priority. Furthermore, a 2017 Forrester
Research report found that increasing
innovation is the top priority for both
technology and business leaders.1
Interviewed customers reported that their
most desired business outcomes, as part of
creating the modern workplace, include:
› Generating urgency and reducing time-to-
market.
› Increasing agility.
› Empowering both information workers and
firstline workers to achieve more through
better collaboration and communication —
both internally and with customers and
partners.
› Supporting different working styles, which often vary by generation,
e.g., new ways in which Millennials prefer to work, to make all
employees more effective and improve collaboration.
› Generating better intelligence and analytics with a single view into
corporate information.
› Moving the needle on whatever matters the most — revenues,
profitability, customer growth, and/or stock price.
› Achieving all of these goals while improving security and compliance.
Increasing mobility and collaboration are two of the driving factors
behind this effort, according to a Forrester Research survey of 7,249
global information workers.2 From a mobility perspective, 42% of
respondents work from home and 32% work from client sites or during
travel. In regard to collaboration, 98% of information workers collaborate
or communicate with someone else at work on a weekly basis, and 79%
report working with customers, clients, or patients each week.
This means that now, more than ever, the technology solutions that
workers have must empower them to work smarter and more
collaboratively, but in a way that ensures security and compliance. The
companies interviewed and surveyed for this study have told Forrester
that this is what Microsoft 365 Enterprise E5 enables them to do.
Interviewed And Surveyed Organizations
For this study, Forrester aggregated findings from 41 customer
interviews across eight other TEI studies (see Appendix B) that looked at
the value of Microsoft 365 and its underlying solutions. We interviewed
four additional companies that are using Microsoft 365, bringing the total
number of customer interviews to 45.
› Size ranged from 1,500 to 230,000 employees; the most common
ranged from 4,000 to 15,000 employees.
“Every company has a digital
transformation initiative. For
us, [Microsoft 365 Enterprise]
drives our digital
transformation.”
CTO, financial services

8 | The Total Economic Impact™ Of The Microsoft 365 E5 Solutions
› Geographically, most companies were headquartered in Europe or
North America. Several were headquartered in Asia, and many of them
had a global presence.
› More than 20 industries are represented. The most common ones
were financial services, manufacturing, education, construction, and
consumer products.
› The most common roles interviewed were CIO and CTO.
In 2017, Forrester conducted an online survey of companies using
Microsoft 365 Enterprise E5 and its underlying components. Survey
respondents had the following characteristics:
› The 200 respondents were from North America and UK.
› The average number of Microsoft 365 Enterprise E5 users was 6,890.
› On average, 41% of those were mobile users.
In 2018, Forrester conducted a survey that focused on Office 365
Enterprise E5 customers, which is incorporated into this study. This
survey featured 101 respondents who met the following selection criteria:
› All used Office 365 E5 solutions.
› They were headquartered in either North America or the UK.
› They had 2,000 or more employees.
› Respondents were either business or IT decision makers who were
directly involved with or supported technology decisions within their
organizations.
Key Challenges
The interviewed and surveyed organizations shared several challenges
they faced with their previous on-premises solutions that drove them to
investigate Microsoft 365 solutions:
› Organizations wanted to provide users with improved real-time
access to their work. Interviewed and surveyed organizations shared
that they struggled to meet their employees’ expectations of anytime,
anywhere access to information and IT resources. This greatly
impacted their information and firstline workers’ productivity, creating
unnecessary downtime and negatively impacting employees’ morale.
The organizations sought a solution to provide their employees with
the collaboration tools they required to make them more efficient in
their day-to-day tasks.
› The companies wanted to enable and foster innovation. Many of
the interviewed and surveyed organizations needed to drive innovation
to improve the bottom line. Yet existing IT infrastructure hampered
these organizations. They wanted to make better, faster decisions and
drive improvements and innovation in activities like product
development. They also wanted to innovate based on direct customer
feedback that often resided with firstline workers. However, they
struggled to meet these objectives with their existing infrastructure.
These organizations understood that, to support business
improvements, they needed to invest in technology to support an
improved collaborative environment.
“What we have won from this
migration was being able to
support growth without
jeopardizing infrastructure
because Microsoft takes care
of it.”
CIO, construction

9 | The Total Economic Impact™ Of The Microsoft 365 E5 Solutions
› Global growth created a complex and costly IT environment. As
these organizations grew, collaborated with remote locations, and
entered new global markets, they faced an influx of different software
solutions and IT infrastructure that was time-consuming and costly to
support. These complex IT environments prevented employees across
locations from easily collaborating with one another. The organizations
required a solution that provided a homogeneous IT landscape that
both supported the line of business’ needs while creating an easy-to-
support IT environment. Organizations saw moving to Windows 10 as
part of the modern desktop as a key component of this new, modern IT
landscape.
› Security threats were becoming more frequent and more
challenging to contain from C-suite to firstline workers. IT
organizations found it increasingly difficult to identify and contain
security breaches. They could not respond to many of the attacks, and
once an intruder got into the systems, it could go unnoticed for months.
Companies responded by implementing many different security
solutions to identify and contain threats faster. This resulted in higher
IT costs and an added level of complexity without fundamentally fixing
many of the IT security threats.
Key Results
The interviews and survey data revealed several key results from the
Microsoft 365 Enterprise E5 solutions investment:
› Through improved collaboration and communication, all
employees — from the C-suite to firstline workers — were
empowered to productively and innovatively do their jobs. In the
2017 survey, Forrester asked respondents if they agreed that Microsoft
365 Enterprise E5 has empowered workers. The results showed that:
• Eighty percent agreed that Microsoft 365 Enterprise E5
empowered mobile workers.
• Seventy-nine percent agreed that Microsoft 365 Enterprise E5
empowered information workers.
• Seventy-one percent agreed that Microsoft 365 Enterprise E5
empowered firstline workers.
Organizations achieved this empowerment through 1) real-time
communication tools such as Skype for Business, Teams, Yammer,
and IM; 2) real-time coauthoring with Word, Excel, PowerPoint, and
OneNote in Office ProPlus — also played a large role in how
individuals worked better together; and 3) better content sharing with
SharePoint, Teams, and OneDrive.
“The security piece was a
driving factor and what really
differentiated Microsoft.”
CTO, financial services
“Microsoft has more capabilities
for firstline workers than I’ve
seen anyplace else. Microsoft
is committed to improving it
because these workers are
such a big part of businesses
everywhere.”
CTO, media and publishing

10 | The Total Economic Impact™ Of The Microsoft 365 E5 Solutions
› Organizations fostered a collaborative culture among globally
dispersed workforces. With employees dispersed across different
international offices, organizations found that using Microsoft 365
created a cohesive culture, where, regardless of location, employees
felt empowered and included in business decisions. Organizations
understood that, to succeed, each employee needed to buy into the
company goals. A major way Office 365 creates a collaborative culture
is by giving executives better tools to inform and empower all
employees regardless of role or location. Organizations also
understood that by providing their employees with real-time
communication abilities like Yammer, they could create a singular
organization, regardless of employee location. One respondent noted
that “being able to speak to a colleague in another region with a click of
a button” greatly benefited the organization. As the companies grew
and brought on new employees, or involved more teams across
geographical boundaries, Microsoft 365 played a key role in building
team morale.
› Security and compliance were greatly improved, marking a top
goal and a large benefit for companies. The Microsoft 365
Enterprise E5 SKU, specifically, brings together a broad set of security
and compliance tools that make it easier for companies to properly
deploy and manage their new Microsoft endpoint security solutions.
These solutions cover identity and access management, information
protection, threat protection, and security management. The result is
fewer breaches, reduced effort to manage security solutions, lower
overall remediation costs, and better compliance.
› Data democratization improved analytics and insight. Power BI
Pro is used to visualize data faster and in different ways, which
improves business analysis and outcomes and empowers employees
to make better decisions. Sixty-six percent of 2017 Microsoft 365
Enterprise survey respondents reported that the democratization of
data helped their organizations.
› Microsoft 365 tools improved business outcomes. Affecting
business outcomes is the main reason companies spend money on
technology solutions. Companies felt that Microsoft 365 had a real,
positive impact on their organizations. A big contributor was reduced
time-to-market because of process efficiencies and better
collaboration. For example, within healthcare, organizations could
improve the responsiveness and quality of patient care. Within
manufacturing, organizations used improved collaboration to drive
better innovation throughout the supply chain management process.
Within the financial services sector, organizations could improve
customer retention rate by creating a more agile environment to react
to changing customer requirements.
› Cost reductions. By consolidating on one platform, organizations can
reduce costs by retiring or reducing the licenses required for other
third-party solutions, such as those associated with other
communication and security tools. In addition, organizations can save
on capex costs that are no longer needed to support on-premises
hardware. Finally, the level of effort to deploy and manage the various
solutions is greatly reduced, lowering internal and professional service
expenses.
“It used to take us a couple of
months to analyze a new
offering. With the new
collaboration tools, we can do
it in half the time. Reduced
time-to-market brings big
financial benefits.”
VP, financial services
“We have given the analytics
tools to everyone — analysts,
developers, business owners
— and they are using it a lot.
This saves time and creates
valuable insights.”
VP, financial services
“Office 365 has led us to
reexamine all our business
practices, to see where we
can gain greater efficiencies.”
Corporate VP, IT, financial
services

11 | The Total Economic Impact™ Of The Microsoft 365 E5 Solutions
Composite Organization
Based on the interviews and survey, Forrester constructed a TEI
framework, a composite company, and an associated ROI analysis that
illustrates the areas financially affected. The composite organization is
used to present the aggregate financial analysis in the next section. The
composite organization that Forrester synthesized from the customer
data has the following characteristics:
Description of composite. The composite organization is a global
organization with most of its operations in North America and Europe
and some offices in Asia Pacific and South America. The organization
has 7,000 employees, 5,000 of whom use Microsoft 365 solutions.
These include 3,500 information workers and 1,500 firstline workers.
The remaining 2,000 employees do not require access to Microsoft
365.
Deployment characteristics. The organization rolled out Microsoft
365 E5 solutions to the 5,000 users in two phases. Phase 1 of the
deployment focused on migrating information workers to Windows 10
with EMS to provide a modern desktop with Exchange Online
migration. The organization also deployed other security solutions
such as Windows Defender Advanced Threat Protection (WDATP).
The organization also began to roll out Office 365 solutions, including
Word, Excel, OneNote, PowerPoint, Microsoft Teams, Skype for
Business, OneDrive, and Yammer. Further, the organization rolled out
scheduling and task management, PowerApps and Flow, Power BI Pro,
and MyAnalytics for the subset of users who needed them. In addition,
the organization deployed SharePoint and began the migration of data
and workflows.
Phase 2 of deployment consisted primarily of expanding SharePoint,
integrating Power BI Pro into more back-end systems, and expanding
the use of security solutions. Remaining firstline workers were moved
onto Microsoft 365 too.
Key assumptions:
• 3,500 information workers
• 1,500 firstline workers
• Global offices, a majority of
which are in North America and
Europe

12 | The Total Economic Impact™ Of The Microsoft 365 E5 Solutions
Analysis Of Benefits
QUANTIFIED BENEFIT DATA AS APPLIED TO THE COMPOSITE
Total Benefits
Ref. Benefit Initial Year 1 Year 2 Year 3 Total Present Value
Atr
Improved collaboration and information sharing across information workers
$1,550,895 $3,101,791 $3,101,791 $7,754,476 $6,303,789
Btr Improved firstline worker performance
$808,834 $1,617,668 $1,617,668 $4,044,169 $3,287,597
Ctr Improved business processes
$134,710 $1,043,148 $1,312,568 $2,490,425 $1,970,720
Dtr Efficient and effective online meetings
$1,606,952 $3,232,589 $3,232,589 $8,072,130 $6,561,118
Etr Secure access to work from anywhere
$1,183,414 $2,366,828 $2,366,828 $5,917,070 $4,810,120
Ftr Reduced user downtime
$748,125 $748,125 $748,125 $2,244,375 $1,860,476
Gtr Faster time-to-decision $76,922 $219,777 $439,554 $736,253 $581,806
Htr Reduction in overnight trips
$112,500 $225,000 $315,000 $652,500 $524,887
Itr Reduced risk of a security breach — business impact
$124,714 $187,071 $187,071 $498,857 $408,531
Jtr
Recued risk of a security breach — faster time-to-remediate
$1,328,089 $1,770,785 $1,770,785 $4,869,659 $4,001,229
Ktr Reduced risk of a security breach — end user impact
$98,835 $98,835 $98,835 $296,504 $245,787
Ltr Reduced compliance costs
$130,071 $64,600 $64,600 $259,271 $220,170
Mtr Device provisioning IT time savings
$266,693 $266,693 $266,693 $800,078 $663,225
Ntr Application provisioning and testing savings
$573,882 $976,319 $1,256,838 $2,807,040 $2,272,868
Otr Reduced help desk calls
$74,813 $74,813 $74,813 $224,438 $186,048
Ptr Reduced security solution costs
$350,158 $466,878 $466,878 $1,283,913 $1,054,947
Qtr Eliminated collaboration solution costs
$323,000 $213,750 $237,500 $774,250 $648,727
Rtr Technology cost reductions
$2,812,896 $1,423,575 $1,794,075 $1,794,075 $7,824,621 $6,937,677
Total benefits (risk-adjusted)
$2,812,896 $10,916,181 $18,468,743 $19,352,209 $51,550,029 $42,539,722

13 | The Total Economic Impact™ Of The Microsoft 365 E5 Solutions
The table above shows the total of all benefits across the areas listed below, as well as present values (PVs) discounted at 10%. Over three years, the composite organization expects risk-adjusted total benefits to be a PV of more than $42.5 million.
Improved Collaboration And Information Sharing
Across Information Workers
Companies reported significant time savings in collaboration activities
through better interactions using Skype for Business, Teams, and
Yammer. In addition, SharePoint helps respondents quickly access
documents without disturbing other individuals. With Office ProPlus
solutions like Word, Excel, and PowerPoint, interviewed users can
eliminate version control issues and coauthor documents. Users also
noted that these solutions help them avoid rework concerns from
accessing older versions of a document. Users can also utilize Teams,
Outlook, and Yammer to easily create Groups (as opposed to relying on
IT to provide this access), enabling faster access to key collaboration
and information sharing features. Respondents noted that anytime,
anywhere access across any device (whether a mobile device, desktop,
laptop, etc.) increases user efficiency and improves user satisfaction.
This benefit was realized by all information workers from the C-suite on
down.
From the survey, Forrester learned that:
› Real-time collaboration on document development and review
impacted the efficiency and productivity of 80% of respondents.
› Seventy-eight percent of respondents found mobile connection to any
email account impactful.
› The consistent look and feel across devices impacted productivity for
73% of respondents.
› Sixty-nine percent found launching Skype for Business/Teams directly
from their calendar impacted their productivity.
From our interviews and surveys, Forrester heard the following:
› “These solutions encourage people to communicate more. People
were hesitant to collaborate before because it was difficult. Skype for
Business becomes a system of engagement in which people are
willing and want to use the tools to work better together.
› “Employees are able to collaborate much easier from any location.”
› “The Microsoft Teams platform with messaging can keep a thread
going. Persistent chat is so much better than email threads. It means I
can find the required information without disturbing them with a phone
call or email.”
› “[Microsoft 365] has helped speed up collaboration immensely by
giving people the ability to share ongoing works instantly with each
other.”
› “Streamlining the document review process has greatly improved our
purchase ordering process.”
› “It is much easier to find information when it is in the collaboration
platform. Each person on my team saves 2 to 3 hours per week. I can
also see what other people are working on, which is very useful.”
From the survey, Forrester found that respondents previously spent 13.3
hours on real-time coauthoring, development, and review of documents;
Microsoft 365 reduced this by 12.5%. For the composite organization,
Forrester assumes that:
Weekly time savings due
to improved collaboration
and information sharing:
100 minutes per user
“One of the key things we
wanted to do was deliver a
great end user experience,
and I think by and large, we
have achieved that.”
Architect, professional services

14 | The Total Economic Impact™ Of The Microsoft 365 E5 Solutions
Impact risk is the risk that the business or technology needs of the organization may not be met by the investment, resulting in lower overall total benefits. The greater the uncertainty, the wider the potential range of outcomes for benefit estimates.
› Improved collaboration and information sharing, specifically around
coauthoring and reviewing documents, impacts 3,500 information
workers.
› Half of this benefit is realized in Year 1 as workers get used to
distributed real-time coauthoring.
› The average information worker fully burdened cost (including all
benefits and taxes) is $45.63 per hour, or $94,940 annually.
› As not all time saved translates into additional, value-add work, only
25% of this benefit is realized.
The time savings associated with collaboration and information sharing
may vary with:
› The number of employees involved.
› The length of time previously spent.
› The hourly salary of employees involved.
To account for these risks, Forrester adjusted this benefit downward by
10%, yielding a three-year risk-adjusted total PV of $6.30 million.
Improved Firstline Worker Performance
By moving to Microsoft 365, firstline workers are both more effective and
efficient. They have the tools and information required to do their jobs
better, and they also reduce the time spent on low-value tasks such as
shift scheduling. Additionally, using locked down Windows 10S
workstations and kiosks reduces distraction and improves device
reliability and uptime.
A survey of 92 companies using the F1 SKU revealed the following time
savings on common tasks:
Firstline worker activities Average time per week Average percent decrease with Microsoft 365 F1
View and check schedule 1.2 hours (73 min) 15.6%
Improved Collaboration And Information Sharing Across Information Workers: Calculation Table
Ref. Metric Calculation Year 1 Year 2 Year 3
A1 Number of information workers affected
3,500 3,500 3,500
A2 Weekly time savings (hours) 13.3 hours previously*12.5%
improvement (rounded) [50% in Year 1]
0.83 1.66 1.66
A3 Total savings from improved collaboration
A1*A2*52 weeks*$45.63 (information worker hourly
salary) [50% in Year 1]
$6,892,868 $13,785,736 $13,785,736
A4 Productivity capture 25% 25% 25%
At Improved collaboration and information sharing across information workers
A3*A4 $1,723,216 $3,446,433 $3,446,433
Risk adjustment ↓10%
Atr
Improved collaboration and information sharing across information workers (risk-adjusted)
$1,550,895 $3,101,791 $3,101,791

15 | The Total Economic Impact™ Of The Microsoft 365 E5 Solutions
Change or adjust schedule with a coworker
1 hour (60 min) 16.8%
View or check assigned tasks 1.2 hours (69 min) 16.6%
Communicate with manager 1.5 hours (87 min) 15.2%
Review company updates, information
1.6 hours (96 min) 16.5%
Peer communication within immediate team
2.5 hours (152 min) 14.6%
Peer communication outside immediate team
2.4 hours (143 min) 16.2%
Participate in training or onboarding activities
.9 hours (57 min) 19.2%
Base: 92 US and UK respondents Source: A commissioned study conducted by Forrester Consulting on behalf of Microsoft, March 2017
From the interviews, Forrester heard:
› “Our previous on-premises solution only provided operating manuals.
Adding the collaboration piece with the rest of the organization was a
big deal.”
› “I would tell someone to just do it and make firstline workers more a
part of the business.”
› “I thought the real benefit was going to be email; instead, it turned out
to be all the other productivity components. For example, if you have a
quality control meeting, it is important to have the firstline workers
involved since they actually do the work, not just manage it. They can
now share information, show presentations, and be more creative.”
› “I would have thought some of our old timers would have retired after
we introduced [Microsoft 365]. Instead, they did a bit more training and
are now using it. Our union employees got on board right away too.”
› “From an old-world stability standpoint, less time is spent in manual
effort when things go down. That equates to cost savings, for example,
someone waiting to get their schedule. [These solutions] enable them
to do their jobs more efficiently and reduces costs.”
› “Employees do a lot of self-training. Now they have access to the
content whether in the office or not. How often in the past did we get
shop-level employees doing anything more than when on their shift?
Now it happens all the time.”
› “Previously, up to 40% of their time was spent on administrative
activities.”
For the financial analysis, Forrester made the following assumptions:
› Fifteen hundred employees are firstline workers who are using
Microsoft 365 F1 SKU on Windows 10S devices. They are primarily
in call centers and distribution facilities.
› Based on the survey results, each firstline worker saves 28
minutes per day across the activities shown in the table above.
Fifty percent of this is achieved in Year 1 as firstline workers
become familiar with the tools.
› The average fully burdened cost (including benefits and taxes) is
$19.78 per hour.
Weekly firstline worker
time savings due to
improved tools and
information:
140 minutes per user
“Giving firstline workers Office
licenses increases employee
engagement and
collaboration.”
CIO, IT services

16 | The Total Economic Impact™ Of The Microsoft 365 E5 Solutions
› Compared to the previous information worker example, a higher
productivity capture rate of 50% is used because firstline workers are
often doing transactional work and in front of customers.
Firstline worker performance improvements may vary with the type of
tools that were initially used and which activities have become
streamlined.
To account for these risks, Forrester adjusted this benefit downward by
10%, yielding a three-year risk-adjusted total PV of $3.29 million.
Improved Business Processes And Outcomes
Microsoft 365 provides better collaboration solutions and analytics to
both information workers and firstline workers. Utilizing these solutions
improves how teams work with each other as well as with their partners,
suppliers, and customers. These solutions enable organizations to
streamline and transform business processes, leading to an overall
improvement in business outcomes. SharePoint, Teams, Skype for
Business, Power BI Pro, and MyAnalytics create improvements via better
collaboration, decreased time spent on key tasks, improved
effectiveness, and improved efficiency. Organizations are using Microsoft
365 solutions to create agility in their processes, to respond to changing
market and customer trends faster, and to generate competitive
advantages in the process.
From a survey, Forrester learned that:
› Fifty-six percent of respondents find improved collaboration from
Skype for Business, 49% from SharePoint, and 43% from Teams.
› The live, visual dashboards that provide a 360-degree view of the
business in Power BI Pro enables 73% of organizations to improve
business outcomes.
In interviews, Forrester heard:
› “Teams has definitely helped our time-to-market.”
› “Collaboration with external partners creating products for us is easier
and faster compared to using an FTP (File Transfer Protocol) solution.”
Improved Firstline Worker Performance: Calculation Table
Ref. Metric Calculation Year 1 Year 2 Year 3
B1 Number of firstline workers 1,500 1,500 1,500
B2 Annual hours saved (28 minutes*5 days)/
60 minutes [50% in Year 1]
1.165 2.33 2.33
B3 Hourly fully burdened cost B1*B2*$19.78*52 weeks
(rounded) [50% in Year 1]
$1,797,409 $3,594,817 $3,594,817
B4 Productivity capture 50% 50% 50%
Bt Improved firstline worker performance
B3*B4 $898,704.30 $1,797,408.60 $1,797,408.60
Risk adjustment ↓10%
Btr Improved firstline worker performance (risk-adjusted)
$808,834 $1,617,668 $1,617,668
“On the sales side, we have
been able to define solutions
for customers and get quotes
out faster. This is because of
Skype for Business and
Presence.”
CIO, manufacturer

17 | The Total Economic Impact™ Of The Microsoft 365 E5 Solutions
› At one company, discovering business insights with Power BI and
sharing them with the teamwork solutions saved 50,000 hours of
warehouse labor each year.
› “Skype for Business has definitely helped out our time-to-market.”
› “Yammer helps for lead sharing and closing deals faster. Things move
from a lead to an opportunity, to closing faster. One person said that
they generated $1.9 million in new opportunities because of these
tools.”
› “New product development teams are able to better deal with
documents that require multiple authors to input items. Also, since
these individuals are typically not at the same site, the revision history
increases collaboration because we do not need to focus on the
documents but rather on the discussions and the content to be
created.”
For the composite organization financial analysis, Forrester included the
warehouse and product development examples and assumes that:
› Total warehouse labor savings from Power BI insights and
disseminating them with Microsoft Teams total 12,500 hours per year
(scaled down to reflect the composite size). This benefit begins in Year
2 when employees are more familiar with Power BI and the teamwork
solutions.
› The fully loaded cost of warehouse workers is $19.78 per hour.
› With Microsoft 365, employees can reduce product development time
by 13.9%. Half of this benefit is realized in Year 1 as users become
used to working with Microsoft 365 eventually incorporate the solution
more into their product development process.
› Based on feedback from the survey and interviews, the average cost of
development per day is $2,000. This may vary greatly depending on
industry and/or product size/effort.
There are many other business processes that can be streamlined and
transformed. The reader should consider specific opportunities at their
organization to improve processes which are likely to deliver more
financial benefits and improved business outcomes than the examples
included here. As noted earlier, these can vary based on industry and a
company’s individual circumstances. Some examples shared by
interviewees:
› A healthcare organization achieved better patient care.
› Manufacturers drove increased product innovation and streamlined
supply chain management.
› Financial services companies improved customer retention through
better customer service and product innovation.
This savings may be lower depending on which processes are
transformed with Microsoft 365 solutions. To account for these risks,
Forrester adjusted this benefit downward by 5%, yielding a three-year
risk-adjusted total PV of $1.97 million.
Product development
time savings:
14.18 days per product
development effort

18 | The Total Economic Impact™ Of The Microsoft 365 E5 Solutions
Efficient And Effective Online Meetings
Information workers, including the executive team, make heavy, daily
use of the online meeting tools within Microsoft 365. Prior to meetings,
employees at surveyed organizations can check peers’ availability and
easily schedule meetings using Outlook and Teams. Respondents even
reduce time spent walking to meeting rooms, decreasing the likelihood
that a meeting starts late. With the intuitive nature and integration of
Skype for Business and Teams, meetings are easier to start on time, as
opposed to struggling with other technology. Employees, from the
highest levels on down, also find that the meetings themselves are more
effective, with the ability to easily share documents and screens and see
each other face-to-face. With Microsoft 365, respondents can better
achieve the desired outcomes of their meetings.
From the survey, Forrester learned that:
› Eighty-three percent of respondents experience improved
effectiveness and efficiency from easier-to-manage document
revisions.
› Seventy-eight percent have more secure communication.
› Seventy-seven percent find it easier to text, meet, and call across
devices.
› Seventy-five percent of respondents see improved efficiency from
improved calendaring.
From our interviews and surveys, Forrester heard the following:
› “Skype for Business saves me at least 20% of my day. Across the
organization, I would say the average is 10%. For every 10 people,
it’s like getting an extra person.”
› “Our meetings are much faster. We no longer are waiting around for 5
minutes at the start of every meeting. We typically have 20 people in
our meetings, so it really adds up.”
› “We have improved how we conduct our meetings, and this has
improved our production rate, which has improved our motivation and
overall morale.”
Weekly time savings due
to efficient and effective
online meetings:
104 minutes per week
Improved Business Processes: Calculation Table
REF. METRIC CALC. YEAR 1 YEAR 2 YEAR 3
C1 Distribution activity savings 12,500 hours*$19.78 [0%
in Year 1] $0 $247,250 $247,250
C2 Number of product development efforts each year
10 30 40
C3 Hours saved per effort 102 days*13.9% reduction
[50% in Year 1] 7.09 14.18 14.18
C4 Product development cost savings
C2*C3*$2,000 per day $141,800 $850,800 $1,134,400
Ct Improved business processes C1+C4 $141,800 $1,098,050 $1,381,650
Risk adjustment ↓5%
Ctr Improved business processes (risk-adjusted)
$134,710 $1,043,148 $1,312,568

19 | The Total Economic Impact™ Of The Microsoft 365 E5 Solutions
From the survey, Forrester found that respondents previously spent 11.5
hours per week in in-person meetings and that Microsoft 365 reduced
this by 15%. For the composite organization, Forrester assumes that:
› All 3,500 information workers regularly participate in meetings and
realize efficiencies from improved online meetings.
› Half of this benefit is realized in Year 1 as users become used to
working with online meetings and bring it more into their day-to-day
activities.
› The same fully burdened cost of $45.63 per hour is used.
› Again, as not all time saved translates into additional, value-add work,
only 25% of this benefit is realized.
The time savings due to online meetings will vary with:
› The number of in-person meetings being replaced with online
meetings.
› Average salary.
› The number of employees involved.
To account for these risks, Forrester adjusted this benefit downward by
10%, yielding a three-year risk-adjusted total PV of $6.56 million.
Secure Access To Work From Anywhere
One of the user groups that benefits the most from Microsoft 365 is
mobile workers, which can include firstline workers. By using EMS with
Azure AD and Microsoft Cloud App Security, companies can manage the
risks associated with increased mobility while still providing secure
access to information, systems, and people from any device at the time
and place of the user’s choosing. The tightly integrated security
components across Office 365, Windows 10, and EMS mean that users
can have a level of access that previously was only available when at an
office location. From a survey, Forrester learned that these workers are
saving 24 minutes per day because of secure, anytime, anywhere
access.
Mobile workers are typically some of the most valuable to an
organization — salespeople, senior managers, consultants, etc.
Therefore, any improvements they experience in collaboration and
Efficient And Effective Online Meetings: Calculation Table
Ref. Metric Calculation Year 1 Year 2 Year 3
D1 Number of information workers affected
3,500 3,500 3,500
D2 Weekly time savings (hours) 11.5 hours previously*15%
(50% in Year 1) 0.86 1.73 1.73
D3 Savings from total reduced time
D1*D2*52 weeks*$45.63 (rounded)
[50% in Year 1] $7,142,008 $14,367,062 $14,367,062
D4 Productivity capture 25% 25% 25%
Dt Efficient and effective online meetings
D3*D4 $1,785,501 $3,591,765 $3,591,765
Risk adjustment ↓10%
Dtr Efficient and effective online meetings (risk-adjusted)
$1,606,952 $3,232,589 $3,232,589
“Mobile workers have
absolutely benefited from
Microsoft 365. Being able to
share a document from
anywhere is the world is
tremendous for my sales
people.”
CIO, IT services

20 | The Total Economic Impact™ Of The Microsoft 365 E5 Solutions
productivity have an exceedingly large impact on the organization. In
general, these are employees who can easily find jobs at other
companies and are willing to move around. Microsoft 365 delivers an
increased user satisfaction that helps organizations retain their valuable
workforce. Some of what Forrester heard includes:
› “[Microsoft 365] is very useful for mobile workers. They don’t need to
go to a desktop to access SharePoint. Instead, they can do most of
what they need securely on a mobile device. They probably save 10%
to 15% of their day.”
› “Mobile workers see big benefits with [Microsoft 365]. They travel from
property to property and can sign on from wherever they want. This is
a tremendous advantage they didn’t have before.”
› “Connectivity via [Microsoft 365] is much better than with a virtual
private network (VPN). I used to get complaints from the head of retail
lending that their team was having all sorts of problems when on the
road. Now I get zero complaints.”
› “This is a very welcome change. People are very happy to have all the
new mobile solutions, especially Outlook and SharePoint. Employee
satisfaction has improved.”
For the financial analysis, Forrester assumes that:
› Seven hundred users are highly mobile workers who experience this
benefit. Half of these users experience the benefit in Year 1.
› Twenty-four minutes (0.4 hours) per day are saved.
› For simplicity and to be conservative, the same $45.63 fully burdened
information worker hourly salary is used, even though many of these
mobile workers would be paid more.
› A higher 75% productivity capture is applied because these workers
tend to be executives, account managers, and other senior resources
who make effective and efficient use of their time.
This benefit will vary based on:
› The number of mobile users.
› How employees previously accessed systems and information.
› The extent to which remote access is central to employee’s jobs.
To account for these risks, Forrester adjusted this benefit downward by
5%, yielding a three-year risk-adjusted total PV of $4.81 million.
Secure Access To Work From Anywhere: Calculation Table
REF. METRIC CALC. YEAR 1 YEAR 2 YEAR 3
E1 Time savings (hours) .4 hours*260 days 104 104 104
E2 Number of affected users A1*20% [50% in Year 1] 350 700 700
E3 Total time savings E1*E2*$45.63 $1,660,932 $3,321,864 $3,321,864
E4 Productivity capture 75% 75% 75%
Et Secure access to work from anywhere E3*E4 $1,245,699 $2,491,398 $2,491,398
Risk adjustment ↓5%
Etr Secure access to work from anywhere (risk-adjusted)
$1,183,414 $2,366,828 $2,366,828
“Mobile workers see big
benefits with [Microsoft 365
Enterprise]. They travel from
property to property and can
sign on from wherever they
want. This is a tremendous
advantage they didn’t have
before.”
Infrastructure operations team
lead, real estate

21 | The Total Economic Impact™ Of The Microsoft 365 E5 Solutions
Reduced User Downtime
With secure access to information, systems, and people from any device,
whenever and wherever it is needed, each of the 5,000 Microsoft 365
users, across both information workers and firstline workers, can reduce
the impact of downtime due to a crashed device (security event-related
downtime is discussed later in the study). Our interviews uncovered that
downtime due to security events, broken computers, or lost laptops can
greatly reduce productivity. With Microsoft 365, employees have access
to each of their important documents and applications to stay productive
during these incidents. Furthermore, providing Windows 10S devices to
firstline workers greatly improves reliability and uptime.
From the survey, Forrester learned that:
› Eighty-four percent of respondents agreed that Microsoft 365 ensures
they have secure access to work from anywhere.
› Seventy-eight percent benefit from access to documents in an
optimized mobile format.
› Access to Microsoft 365 from any device reduces employee downtime
and productivity loss for 49% of respondents.
› Thirty-two percent experience improved productivity due to anytime,
anywhere access to documents and files with Microsoft 365.
During our interviews, Forrester heard the following:
› “Office 365 provides us with the confidence that we will not have
wasted time or downtime, which helps overall spirit and work
production.”
› “We have had no downtime since going to the cloud. We used to have
two to three days per year. When you don’t have email for one day,
you just get crazy.”
From the survey, Forrester learned that a user was previously affected by
an average of 4.5 events per year, which led to about 3.5 hours of
downtime for each event. For the composite organization, Forrester
assumes that:
› Each of the 5,000 Microsoft 365 users was previously affected by
downtime, with information workers experiencing more downtime than
firstline workers.
› With Microsoft 365, the composite organization avoids this downtime.
› An average hourly fully loaded salary of $40 represents a blended rate
across information workers and firstline workers.
› Again, as not all time saved translates into additional, value-add work,
only 25% of this benefit is realized.
Reduced user downtime will be affected by:
› The number of users.
› The number of downtime events in the previous environment.
› The average length of each downtime event.
› The average salary of affected users.
To account for these risks, Forrester adjusted this benefit downward by
5%, yielding a three-year risk-adjusted total PV of $1.86 million.
Avoided downtime per
employee:
15.75 hours per year

22 | The Total Economic Impact™ Of The Microsoft 365 E5 Solutions
Faster Time-To-Decision
Across executives and key decision makers, the Microsoft 365 solutions
improve decision making. For instance, Power BI Pro enables decision
makers to quickly discover important trends and valuable insights that
directly impact the decisions they make. With improved data analytics
and improved reporting, these decision makers have better access and
visibility into key data and are able to make the right decision faster. In
addition, workers can more quickly contact and communicate with other
individuals across the organization to gain approvals or get opinions, and
firstline workers can more easily share data based on customer
feedback. With these solutions, users can more easily find what they
need, collaborate with their peers, and make informed decisions faster
than before.
From the survey, Forrester learned that:
› Seventy-eight percent of respondents benefit from Power BI Pro’s
ability to quickly analyze millions of rows of data.
› The charting feature in Power BI Pro enables 72% of organizations to
better visualize trends and relationships.
› Thirty-two percent experience improved productivity due to anytime,
anywhere access to documents and files with Microsoft 365.
During our interviews, Forrester heard the following:
Reduced User Downtime: Calculation Table
Ref. Metric Calculation Year 1 Year 2 Year 3
F1 Number of Microsoft 365 users affected
5,000 5,000 5,000
F2 Average salary across Microsoft 365 users
$40 $40 $40
F3 Average avoided downtime due to Microsoft 365 (hours)
4.5 events per year per user* 3.5 hours of downtime
15.75 15.75 15.75
F4 Annual cost savings from reduced user downtime
F1*F2*F3 $3,150,000 $3,150,000 $3,150,000
F5 Productivity capture 25% 25% 25%
Ft Reduced user downtime F3*F4 $787,500 $787,500 $787,500
Risk adjustment ↓5%
Ftr Reduced user downtime (risk-adjusted)
$748,125 $748,125 $748,125
“We use Power BI for any type
of report that we would have
done in a spreadsheet before.
It has very good data
visualization tools, and it helps
us with our manufacturing
productivity analysis.”
Director of classified operations,
aerospace

23 | The Total Economic Impact™ Of The Microsoft 365 E5 Solutions
› “It is much easier to get and find information, and it is much easier to
mine that information. The benefits have been significant.”
› “With the improved business intelligence features, we are better able to
evaluate our services, products, and the user impact they have.”
› “Decisions are made faster and better. There is no fear that someone
doesn’t understand what others are telling them.”
› “Each user can now easily do a deep dive into relevant data for their
area and tease out important aspects of the data. This improves their
productivity and positively impacts our ability to review business
processes on the fly.”
› “More analytics results are more easily shareable, so staff are sharing,
communicating, and using more data together. This is seen in better
communication and collaboration.”
› “[Microsoft 365] enables us to have a rapid dissemination of data to all
15 sites of our global business.”
For the composite organization, Forrester assumes that:
› In Year 1, 350 decision makers are impacted by Microsoft 365. By Year
3, this number increases as decision makers become more engaged
with Microsoft 365.
› In the previous environment, these decision makers spent many hours
per week on decision-making tasks; while more hours were likely
spent, Forrester conservatively estimates about 5 of these hours are
impacted by Microsoft 365. Half of this benefit is realized in Year 1 as
users become used to working with Microsoft 365 and bring it more
into their decision-making activities.
› With Microsoft 365, employees can make decisions 15.6% faster than
before.
› For the purposes of this calculation, the same fully burdened cost of
$45.63 per hour assigned to information workers is used; however,
executive salaries may be higher.
› Again, as not all time saved translates into additional, value-add
work, only 25% of this benefit is realized.
Faster time-to-decision will be affected by:
› The number of Microsoft 365 users engaged in decision making.
› Which Microsoft 365 solutions they make use of.
› The average salary of affected users.
To account for these risks, Forrester adjusted this benefit downward by
5%, yielding a three-year risk-adjusted total PV of $581,806.
Weekly time savings in
decision making:
47 minutes per user
“Probably 25% to 30% of
people are using Power BI and
spending 20% less time than
they used to. In the past we
might have had three or four
people prepare a report that
took one and a half weeks.
Now it takes one person an
afternoon.”
Director of classified operations,
aerospace
24 | The Total Economic Impact™ Of The Microsoft 365 E5 Solutions
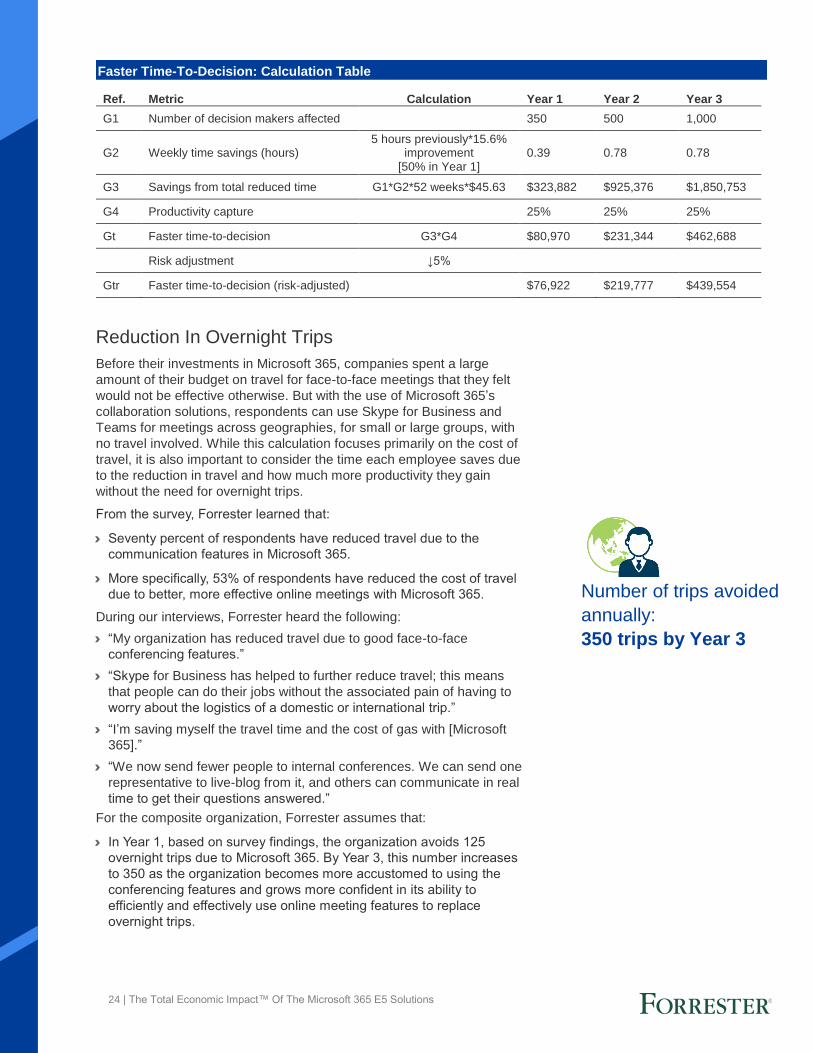
Reduction In Overnight Trips
Before their investments in Microsoft 365, companies spent a large
amount of their budget on travel for face-to-face meetings that they felt
would not be effective otherwise. But with the use of Microsoft 365’s
collaboration solutions, respondents can use Skype for Business and
Teams for meetings across geographies, for small or large groups, with
no travel involved. While this calculation focuses primarily on the cost of
travel, it is also important to consider the time each employee saves due
to the reduction in travel and how much more productivity they gain
without the need for overnight trips.
From the survey, Forrester learned that:
› Seventy percent of respondents have reduced travel due to the
communication features in Microsoft 365.
› More specifically, 53% of respondents have reduced the cost of travel
due to better, more effective online meetings with Microsoft 365.
During our interviews, Forrester heard the following:
› “My organization has reduced travel due to good face-to-face
conferencing features.”
› “Skype for Business has helped to further reduce travel; this means
that people can do their jobs without the associated pain of having to
worry about the logistics of a domestic or international trip.”
› “I’m saving myself the travel time and the cost of gas with [Microsoft
365].”
› “We now send fewer people to internal conferences. We can send one
representative to live-blog from it, and others can communicate in real
time to get their questions answered.”
For the composite organization, Forrester assumes that:
› In Year 1, based on survey findings, the organization avoids 125
overnight trips due to Microsoft 365. By Year 3, this number increases
to 350 as the organization becomes more accustomed to using the
conferencing features and grows more confident in its ability to
efficiently and effectively use online meeting features to replace
overnight trips.
Number of trips avoided
annually:
350 trips by Year 3
Faster Time-To-Decision: Calculation Table
Ref. Metric Calculation Year 1 Year 2 Year 3
G1 Number of decision makers affected 350 500 1,000
G2 Weekly time savings (hours) 5 hours previously*15.6%
improvement [50% in Year 1]
0.39 0.78 0.78
G3 Savings from total reduced time G1*G2*52 weeks*$45.63 $323,882 $925,376 $1,850,753
G4 Productivity capture 25% 25% 25%
Gt Faster time-to-decision G3*G4 $80,970 $231,344 $462,688
Risk adjustment ↓5%
Gtr Faster time-to-decision (risk-adjusted) $76,922 $219,777 $439,554

25 | The Total Economic Impact™ Of The Microsoft 365 E5 Solutions
› Based on feedback from the survey and interviews, the average cost of
an overnight trip is $1,000. This may vary depending on length and
distance of travel.
The reduction in overnight trips will be affected by:
› The number of trips replaced by Microsoft 365 online meetings.
› The average cost of a trip.
To account for these risks, Forrester adjusted this benefit downward by
10%, yielding a three-year risk-adjusted total PV of $524,887.
Improved Security And Compliance Benefits
Organizations overwhelmingly cite improved security and compliance as
a top benefit of moving to Microsoft 365 Enterprise E5. The suite of
security tools across Office 365, Windows 10, and EMS improves
security across four main areas:
1. Identity and access management (IDAM).
2. Information protection.
3. Threat protection.
4. Security management.
Together, these solutions reduce the time it takes to detect security-
related anomalies, which in turn reduces the number of end user-related
security events, the time it takes IT to remediate the issues, and the
business impact, e.g., lost customers. In some past instances, with
Microsoft 365 ,organizations saw a 100% reduction in the number of end
user security incidents they previously experienced. For other
organizations, faster identification and remediation of threats reduced the
number and severity of successful attacks, which can greatly reduce the
hours spent on repairing the situation.
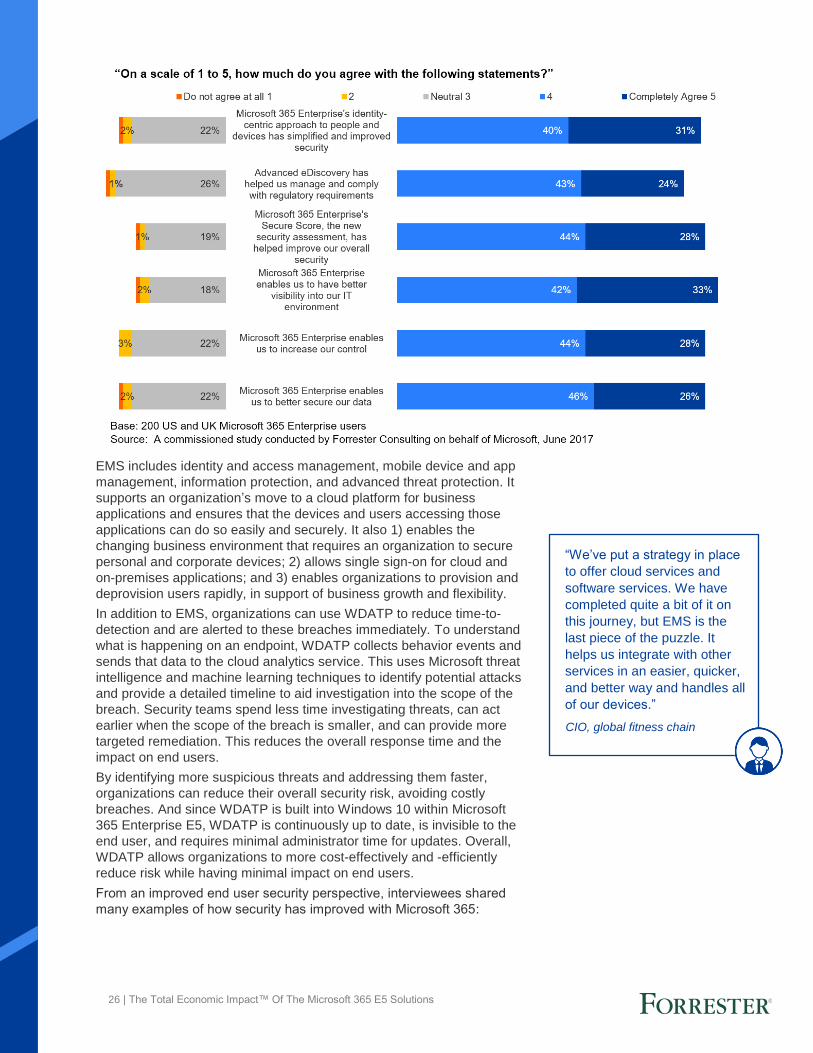
Survey respondents overwhelmingly agree that Microsoft 365 Enterprise
E5 improves security in a myriad of ways. EMS (including Azure ATP)
and WDATP were the two solutions that provide automated detection
and remediation called out most frequently.
Reduction In Overnight Trips: Calculation Table
Ref. Metric Calculation Year 1 Year 2 Year 3
H1 Number of avoided trips 125 250 350
H2 Average cost $1,000 $1,000 $1,000
Ht Reduction in overnight trips H1*H2 $125,000 $250,000 $350,000
Risk adjustment ↓10%
Htr Reduction in overnight trips (risk-adjusted)
$112,500 $225,000 $315,000
“Advanced protection against
security threats and better risk
compliance are the major wins
for our organization as a result
of implementing [Microsoft 365
Enterprise].”
Survey respondent
26 | The Total Economic Impact™ Of The Microsoft 365 E5 Solutions
EMS includes identity and access management, mobile device and app
management, information protection, and advanced threat protection. It
supports an organization’s move to a cloud platform for business
applications and ensures that the devices and users accessing those
applications can do so easily and securely. It also 1) enables the
changing business environment that requires an organization to secure
personal and corporate devices; 2) allows single sign-on for cloud and
on-premises applications; and 3) enables organizations to provision and
deprovision users rapidly, in support of business growth and flexibility.
In addition to EMS, organizations can use WDATP to reduce time-to-
detection and are alerted to these breaches immediately. To understand
what is happening on an endpoint, WDATP collects behavior events and
sends that data to the cloud analytics service. This uses Microsoft threat
intelligence and machine learning techniques to identify potential attacks
and provide a detailed timeline to aid investigation into the scope of the
breach. Security teams spend less time investigating threats, can act
earlier when the scope of the breach is smaller, and can provide more
targeted remediation. This reduces the overall response time and the
impact on end users.
By identifying more suspicious threats and addressing them faster,
organizations can reduce their overall security risk, avoiding costly
breaches. And since WDATP is built into Windows 10 within Microsoft
365 Enterprise E5, WDATP is continuously up to date, is invisible to the
end user, and requires minimal administrator time for updates. Overall,
WDATP allows organizations to more cost-effectively and -efficiently
reduce risk while having minimal impact on end users.
From an improved end user security perspective, interviewees shared
many examples of how security has improved with Microsoft 365:
“We’ve put a strategy in place
to offer cloud services and
software services. We have
completed quite a bit of it on
this journey, but EMS is the
last piece of the puzzle. It
helps us integrate with other
services in an easier, quicker,
and better way and handles all
of our devices.”
CIO, global fitness chain

27 | The Total Economic Impact™ Of The Microsoft 365 E5 Solutions
› “[Microsoft 365] has significantly improved security. You have better
end-to-end monitoring of what is going on from the admin center.
Because of that, you can definitely be a lot more confident in what is
happening on the platform.”
› “With EMS, the big benefit is its integration with Active Directory. That
gives you a lot of security in a very critical area.”
› “Previously, there was no security if a device was lost. Now we can
remote wipe it, which has helped with compliance.”
› “Unified management under [Microsoft 365 Enterprise] makes it easy
to know if data is moving out of the organization.”
› “By getting more data and visibility, we are able to identify problem
areas that we didn’t know we had.”
› “Data is secured better since user access is limited with [Microsoft 365
Enterprise].”
› “With controlled, uniform access to data, we can control its access
much better. Also, by organizing the data through a single interface, we
have much better visibility into it.”
› “The security that is provided with the encryption software in E5 makes
us much safer.”
› “The functionality in Exchange Online to report on phishing is a
significant upgrade from when we were on-premises.”
› “We have seen a decreased level of expressed concerns and actual
cases of malware incidents as opposed to the continual escalation
prior to adoption [of Microsoft 365].”
› “We have had no security problems to date.”
› “By using Exchange Online Protection and Advanced Threat
Protection, we can see malware campaigns being removed from our
email with Safe Attachments.”
› “We can now better monitor and identify risks such as people signing
in from unknown places. We are more protected on end user identity
and on devices since everything is on ATP.”
› “Everyone is using ADFS to connect to the Microsoft solutions and for
other corporate authentication. This strengthens our security.”
› “I feel more protected in Microsoft’s data center than having to host
email and documents myself.”
› “The security team has done a very good job using Yammer to drive
awareness. The functionality in Exchange Online to report on phishing
is a significant upgrade from when we were on-premises.”
› “By using Exchange Online Protection and Advanced Threat
Protection, we can see malware campaigns being removed from our
email with Safe Attachments.”
For the financial analysis, Forrester includes three security-related
benefits, tied to fewer security events and reduced severity, for those
that still take place — business impact, time-to-remediation, and end
user impact.
Reduced Risk Of A Security Breach — Business Impact
“Before, any antivirus alerts would
have to be integrated to a
software where the software
would then have to correlate with
things like our prior EDR tool to
get an overall view, whereas now,
Microsoft is using ATP much more
as a reporting agent for all ATP-
and malware-type threats. So, you
get everything through the one
portal, and you get a much better
view of the client machine.”
Senior enterprise architect, security,
energy company
“We use the Enterprise Mobility
Suite to help our increasingly
mobile workforce access and
share data in a secure fashion on
up-to-date devices, so they can
work more productively.”
Manager of information technology,
automotive company

28 | The Total Economic Impact™ Of The Microsoft 365 E5 Solutions
For this benefit, Forrester looks specifically at the business costs
associated with a successful security breach. In the 2017 Ponemon
Institute’s research into the “Cost of Data Breach Study,” the average
lost customer business from a breach across North America, four
Western European countries, and Japan was $1.69 million.3 The average
cost across these same countries to communicate with affected third-
parties was $205,000. Together the cost is nearly $1.95 million per
incident in business impact. The Ponemon Institute study also found that
the annual likelihood of a major security breach is 13.85%.
For the composite organization, Forrester assumes that:
› The average business impact is over $1.89 million.
› The likelihood of a major breach occurring is 13.85% each year.
› Once all of the Microsoft 365 E5 security solutions are in place, the
likelihood of a user-related security event is reduced by 75%. This is
lower in Year 1 as the last endpoints are secured and the remaining
security solutions are fully put into place.
This benefit may vary because:
› The Ponemon Institute data represents global average figures. An
organization’s actual risk level may differ from these figures based on
size, industry, region, and other factors.
› The ability for Microsoft 365 security solutions to detect threats is
partially based on visibility into events on the endpoint and the ability to
correlate those behaviors. Organizations can choose how long data is
retained for analytics.
› Interviewees noted that most threats are introduced via user behavior.
Organizations that prioritize security training for users may see lower
incident rates and therefore lower risk levels.
› The faster these solutions are deployed, the faster risk reduction will
be achieved.
To account for these risks, Forrester adjusted this benefit downward by
5%, yielding a three-year risk-adjusted total PV of $408,531.
Reduced Risk Of A Security Breach — Faster Time-To-Remediate
The security solutions within Microsoft 365 greatly reduce the number of
successful end user security attacks. Attacks that are successful are
usually found faster when the impact is less severe. That means easier
remediation. To calculate the value of this benefit, Forrester assumes
that:
Reduced Risk Of A Security Breach — Business Impact: Calculation Table
Ref. Metric Calculation Year 1 Year 2 Year 3
I1 Average cost of breach — business impact
$1,895,714 $1,895,714 $1,895,714
I2 Average probability of breach 13.85% 13.85% 13.85%
I3 Reduction in risk due to Microsoft 365
50% 75% 75%
It Reduced risk of a security breach — business impact
I1*I2*I3 $131,278 $196,917 $196,917
Risk adjustment ↓5%
Itr Reduced risk of a security breach — business impact (risk-adjusted)
$124,714 $187,071 $187,071
“Internal audit looks at 15% of
the employees every year. By
having the data readily
available, what might have
taken five days now takes
one.”
Director of classified operations,
aerospace

29 | The Total Economic Impact™ Of The Microsoft 365 E5 Solutions
› Based on survey results, the composite organization experienced 720
end user security events prior to its investment in Microsoft 365. Based
on the survey results of companies using Microsoft 365 and/or Office
365, Forrester estimates that this can be reduced to 150 events with
the use of all security tools within Microsoft 365. This results in the
elimination of 570 security events annually.
› Before Microsoft 365, the organization spent 129 hours per end user
security event on remediation. With Microsoft 365, the composite
organization reduces the hours spent on remediation to 40 hours per
event, resulting in a time savings of 89 hours per security event.
› To understand the total benefit associated with the reduction in end
user security incidents, Forrester calculates out the time saved from
completely avoided security incidents, as well as the time saved on
remediation for remaining security events. In Year 1, the organization
realizes 75% of this benefit as IT becomes more accustomed to
leveraging Microsoft 365 security features and they are rolled out to all
users and endpoints.
› An average hourly fully loaded salary of $68.75 is used for IT FTEs.
› As not all time saved translates into additional, value-add work, 75% of
this benefit is realized. This is higher than the productivity capture for
general information worker productivity improvements because IT
security employees tend to already be overworked and very focused
on their job.
The reduction in security events will be affected by:
› The number and severity of attacks.
› The average hourly salary of IT.
To account for these risks, Forrester adjusted this benefit downward by
5%, yielding a three-year risk-adjusted total PV of $4.00 million.
Reduced Risk Of A Security Breach — End User Impact
The last security impact calculated and associated with fewer and less
severe end user-related breaches is end user downtime. Forrester found
that:
Number of end user
security events eliminated:
570 events each year
Reduced Risk Of A Security Breach — Faster Time-To-Remediate: Calculation Table
Ref. Metric Calculation Year 1 Year 2 Year 3
J1 Eliminated security events 720-150 570 570 570
J2 IT time savings per event (hours) 129-40 89 89 89
J3 Time saved from avoided security events
J1*40 hours [75% in Year 1] 17,100 22,800 22,800
J4 Time saved on remaining security events
150 events*J2 [75% in Year 1] 10,012.5 13,350 13,350
J5 Total IT savings (J3+J4)*$68.75 $1,863,984 $2,485,313 $2,485,313
J6 Productivity capture 75% 75% 75%
Jt Recued risk of a security breach — faster time-to-remediate
J5*J6 $1,397,988 $1,863,984 $1,863,984
Risk adjustment ↓5%
Jtr Recued risk of a security breach — faster time-to-remediate (risk-adjusted)
$1,328,089 $1,770,785 $1,770,785

30 | The Total Economic Impact™ Of The Microsoft 365 E5 Solutions
› Prior to using WDATP and other Microsoft 365 security solutions,
organizations struggled to identify the scope of an attack once it had
happened. This would lead to more time spent on remediation,
including running scans on computers and reimaging machines more
often. When machines are reimaged, users lose access to their
devices and have to spend time reinstalling settings and recreating lost
data.
› With Microsoft 365 security solutions, organizations have visibility into
the changes that an attacker has made, allowing the security team to
methodically address those specific changes without the need to run
scans or reimage machines, reducing the productivity impact for end
users.
› Because WDATP is built into the Windows 10 OS, users report fewer
performance issues or interruptions. One organization mentioned a
dramatic reduction in help desk calls, and another mentioned that
updates to its prior endpoint detection and response (EDR) tool would
often cause issues that could affect users.
› “One of the big driving factors for moving to Microsoft 365 was the
configuration manager for endpoint security. We haven’t had a major
security event since migrating and can use System Center to reimage
badly infected machines if there is a problem.”
For the composite organization, Forrester assumes that:
› Most end user downtime is related to reimaging of machines, including
the time without a machine and the time spent on customizing
reimaged machines and recreating lost data.
› With its prior EDR tool, the composite had less visibility and addressed
fewer detections, but threats took longer to identify and therefore more
often resulted in reimaging machines. Even when machines weren’t
reimaged, the organization would spend more time investigating
threats, scanning machines, and taking other response actions. On
average, users would lose 5 hours of productive time per threat.
› With Microsoft 365, threats are caught earlier, and the response time is
shorter. Security teams can identify specific changes that attackers
make on affected machines, reducing the need to reimage a machine
and allowing for faster remediation and minimal impact to users. On
average, each threat results in 1 hour of lost productivity with the
Microsoft 365 security solutions.
The reduction in security events will be affected by:
› A range of remediation processes and impacts in both their prior
environments and with Microsoft 365, depending on visibility into the
impact of threats, user behavior, and corporate policy.
To account for these risks, Forrester adjusted this benefit downward by
5%, yielding a three-year risk-adjusted total PV of $245,787.
“Our expectation is that a main
benefit will be that WDATP is
more of an integrated stack, and
so the benefit comes from less
impact on the end user in terms
of the client OS; less complexity
on the endpoint.”
Senior enterprise architect, energy
company

31 | The Total Economic Impact™ Of The Microsoft 365 E5 Solutions
Reduced Compliance Costs
Microsoft 365 helps interviewed and surveyed companies improve
compliance in several ways. These include more comprehensive risk
audits, better policy enforcement, and better eDiscovery for internal and
external investigations. Additionally, companies said that compliance-
related costs were reduced to both build/deploy compliance solutions
and ongoing compliance activities.
From the survey, Forrester learned:
› Compliance-related costs were reduced by 13.6%.
› Time spent on eDiscovery activities decreased by 12.3%.
› Seventy-eight percent of respondents reported “improved enforcement
of data retention policies with Microsoft Office 365.”
› Sixty-seven percent benefit from “using Customer Lockbox to meet
compliance obligation for data access.”
› Seventy-four percent have “improved audit tracking.”
› Healthcare organizations saw an “18% reduced risk of HIPAA,
GDPR, and other regulatory compliance violations and fines,” and
“24% increased compliance management efficiencies.”
› Manufacturers saw a “20% improved safety and compliance
monitoring and reporting efficiencies.”
Interviewees said:
› “We had a policy where you couldn’t email out any sensitive
information. Now with the security in [Microsoft 365], we can be less
restrictive because the system intelligently encrypts and sends it and
ensures compliance. That is a big value to the business users.”
› “We are using [Microsoft 365] for data loss prevention and rights
management. It makes sure that if a document contains sensitive
information, it puts rights management against the document and locks
it.”
› “Security-related audit points have gone down a lot since we moved to
[Microsoft 365], and the severity levels are lower. We used to have a
lot of issues when we were on-premises because we had to take
shortcuts for speed-to-market.”
Included Compliance Solutions
• Advanced Data Governance
• Advanced eDiscovery
• Customer Lockbox
• Customer Key
• Compliance Manager • Office Message Encryption
• Privileged Access Management
• GDPR capabilities, such as Data Service Requests
Reduced Risk Of A Security Breach — End User Impact: Calculation Table
Ref. Metric Calculation Year 1 Year 2 Year 3
K1 Security events before Microsoft 365 Forrester estimate 720 720 720
K2 Remediation time before Microsoft 365 (hours) 5 5 5
K3 Security events after Microsoft 365 Forrester estimate 150 150 150
K4 Remediation time after Microsoft 365 (hours) 1 1 1
K5 Average information worker fully burdened cost (hourly)
$45.63 $45.63 $45.63
Kt Reduced risk of a security breach — end user impact
((K1-K3)*(K2-K4))*K5 $104,036 $104,036 $104,036
Risk adjustment ↓5%
Ktr Reduced risk of a security breach — end user impact (risk-adjusted)
$98,835 $98,835 $98,835
“We have realized some huge
benefits for governance,
eDiscovery, and search. Being
able to easily handle litigation
holds has been invaluable.”
CIO, IT services

32 | The Total Economic Impact™ Of The Microsoft 365 E5 Solutions
› “We now have consistent data retention and compliance policies. It is
automated, which saves a lot of time and effort.”
› “SOX, DLP, GDPR, and email governance compliance has all
improved greatly.”
› “Audit is happy that these solutions integrate with their audit tools.”
For the financial analysis, Forrester included cost savings from not
having to build out compliance solutions that are included in Microsoft
365 and from a reduction in ongoing compliance effort and costs.
Forrester assumes that:
› The composite organization would have needed additional IT efforts to
build out compliance solutions, including encrypted email, data
leakage protection, eDiscovery tools, and rights management.
› The organization previously spent $500,000 per year on IT compliance
and eDiscovery activities; this is reduced by 13.6%.
Device Provisioning IT Time Savings
Intune and other device management solutions in EMS make
administering devices faster and automate the provisioning of new
devices. The IT organization no longer needs to touch each device. This
frees up the IT organization’s time and greatly improves end user
productivity, especially in the case of new hires and firstline workers who
are remote. Additionally, the EMS solutions make “bring-your-own -
device” policies more readily enforceable, efficient, and secure. From
interviews, Forrester heard:
› “We manage the entire fleet with Intune, including deploying software
and pushing security policies.”
› “It used to take 3 hours to get a computer ready to ship; now it takes
just 21 minutes.”
Reduced Compliance Costs: Calculation Table
Ref. Metric Calculation Year 1 Year 2 Year 3
L1 Eliminated encrypted email project (person-months)
2 months*1.5 FTEs 3.0
L2 Eliminated data leakage project (person-months)
1 month*1.5 FTEs 1.5
L3 Eliminated eDiscovery project (person-months)
2 months*1.5 FTEs 3.0
L4 Eliminated rights management project (person-months)
1 month*2.0 FTEs 2.0
L5 Eliminated compliance projects (L1+L2+L3+L4)*($130,000/12
months) $102,917
L6 Reduced IT compliance and eDiscovery costs $500,000*13.6% [50% in
Year 1] $34,000 $68,000 $68,000
Lt Reduced compliance costs L5+L6 $136,917 $68,000 $68,000
Risk adjustment ↓5%
Ltr Reduced compliance costs (risk-adjusted) $130,071 $64,600 $64,600
“[Microsoft 365] definitely
helps us with GDPR
compliance. Otherwise,
nothing would be indexed, and
we couldn’t find it.”
IT architect, consumer products

33 | The Total Economic Impact™ Of The Microsoft 365 E5 Solutions
› “We have multiple groups with different categories of students. We can
deploy packages based on what a teacher is needing. For example,
dictation software for three kids in the southwest corner of the state.
We created a group, assigned it, downloaded the software and
licenses from [the vendor], and then had Intune deploy it. If we didn’t
have Intune, students would have had to ship the devices back, or we
would contract locally with a mobile device management company to
touch the machines.”
For the financial analysis, Forrester assumes that:
› Each information worker has 1.2 devices, which are replaced on a
three-year refresh schedule. There are 700 shared devices and kiosks
for firstline workers, primarily in the call center, replaced on the same
schedule.
› Fewer hours (2.5) are spent setting up and delivering a new device.
The savings from streamlined device provisioning will vary with:
› The number of devices being provisioned.
› Any previous outsourcing of new device provisioning activities and/or
other provision solutions already in place.
To account for these risks, Forrester adjusted this benefit downward by
5%, yielding a three-year risk-adjusted total PV of $663,225.
Application Provisioning And Testing Savings
Application Provisioning
Windows 10 and EMS provide self-service and automation tools for
application provisioning. That means users have faster access to the
resources they need, and the IT organization does not have to spend as
much time working on provisioning activities.
Windows 10
Windows 10 integrates with tools and services such as System Center
Configuration Manager (SCCM), Microsoft Intune, the Windows App
Store, and the Windows Store for Business. In conjunction with Windows
Update for Business, that ensures corporate standards include the latest
patches and updates, and end users can search and install many
applications when they need them. “It’s all about the application,” said
the senior manager of end user technology for a global food and
beverage conglomerate. With Windows 10, users can access the right
applications from their app store or other catalogs, and with Azure Active
Device Provisioning IT Savings: Calculation Table
Ref. Metric Calculation Year 1 Year 2 Year 3
M1 Number of devices added/replaced
((3,500 information workers*1.2 devices)+700 firstline worker devices)/3
years
1,633 1,633 1,633
M2 Savings per device 2.5 hours*$68.75 $171.88 $171.88 $171.88
Mt Device provisioning IT time savings M1*M2
(rounded) $280,729 $280,729 $280,729
Risk adjustment ↓5%
Mtr Device provisioning IT time savings (risk-adjusted)
$266,693 $266,693 $266,693
“Previously, device
management was entirely
manual. That meant we had to
touch all the devices. Now we
are using Intune for inventory
management and pushing out
software. It saves us a lot of
time. We only have four
technicians to support all
students and employees.”
Director of technology, education

34 | The Total Economic Impact™ Of The Microsoft 365 E5 Solutions
Directory and SCCM integration, users can ensure they are installing the
right versions of the right applications based on their role, team, and
department.
With self-service tools, the organization saves significant employee time.
End users do not need to wait for IT to respond to their requests, and
issues such as downloading the wrong version are greatly reduced.
EMS
Interviewed and surveyed organizations indicated that a key benefit from
the EMS implementation is an improvement in end user productivity
accessing software-as-a-service (SaaS) applications, including gaining
access to and logging into SaaS applications. Previously, companies did
not have an easy way to provision groups of users in bulk across
thousands of SaaS applications. As a result, business users experienced
significant delays in gaining access to the business applications they
needed to get their work done. In addition, the IT administrators could
leverage existing groups and assign them to SaaS applications using
Azure Active Directory Premium.
Following the EMS implementation, the average completion of requests
for access to SaaS applications was reduced from five days to
immediate access. Before EMS, new employees would have to wait
several days from when they started at a company to get access to the
proper applications in cases where their managers had not submitted
requests on time. With EMS, new employees get immediate access to
business applications. In cases where the requests are delayed by the
manager, the IT administrator can easily add a new user with appropriate
access. Furthermore, EMS eliminates the typical time delay logging into
SaaS applications, which hurts the daily productivity of many users.
For the financial analysis, Forrester assumes that:
› On average, each information worker makes four application requests
in Year 1 across EMS and Windows 10. This grows to 11 requests by
Year 3 as more applications are integrated into the Microsoft 365
solution.
› On average, each firstline worker makes one application request in
Year 1. This grows to two requests beginning in Year 2.
› The wait time is reduced from 150 minutes to 15 minutes (a savings of
2.25 hours).
› A $45.63 fully burdened hourly cost is used across the board.
› Twenty-five percent of the total benefit is realized because most users
could work on other tasks while waiting for provisioning to complete,
even if it meant they were less productive.
Application Testing
Additionally, the standard application testing time required for every
major operating system release can be significantly reduced. With the
Modern Desktop Windows 10-as-a-service, OS releases are no longer
the major, every two- or three-year undertakings that come with new and
updated features in virtually every area. Instead, operating system
updates come incrementally, around twice a year, and include focused
feature updates and additions. Applications that don’t interact with a new
or updated feature likely don’t need significant testing.
The IT systems engineer at a global technology company said: “We’re
starting to change our approach; instead of telling our application team,
‘Here is the list of things to test,’ they can focus just on their applications
Application request time
reduced from 150 to 15
minutes.
Seventy-five percent
reduction in OS-related
application testing time
with Windows 10-as-a-
service

35 | The Total Economic Impact™ Of The Microsoft 365 E5 Solutions
that interact with a new or updated operating system module. Otherwise,
you’re probably good to go.”
For the financial analysis, Forrester assumes:
› The number of applications included in the apps portfolio grows from
200 to 250 from Year 1 to Year 3.
› The original testing time was 40 hours. Now, 50% of the apps can
experience shortened testing time as part of the Modern Desktop
services. In these instances, the testing time is reduced by 75%.
These benefits will vary based on the several factors:
› The previous tools and automation in place for application provisioning.
› The number of application provisioning requests.
› The number of applications in the portfolio eligible for testing.
› The previous time testing took and savings possible.
To account for these risks, Forrester adjusted this benefit downward by
5%, yielding a three-year risk-adjusted total PV of $2.27 million.
Application Provisioning And Testing Savings: Calculation Table
REF. METRIC CALC. YEAR 1 YEAR 2 YEAR 3
N1 Number of affected information workers A1 3,500 3,500 3,500
N2 Average requests per information worker 4 8 11
N3 Number of affected firstline workers B1 1,500 1,500 1,500
N4 Average requests per firstline worker 1 2 2
N5 Application requests N1*N2+N3*N4 15,500 31,000 41,500
N6 Time savings (hours) (150 minutes-15 minutes)/60 minutes
2.25 2.25 2.25
N7 Total savings N5*N6*$45.63 $1,591,346 $3,182,693 $4,260,701
N8 Productivity capture 25% 25% 25%
N9 Information worker savings N7*N8 $397,837 $795,673 $1,065,175
N10 Number of apps in portfolio 200 225 250
N11 App testing time per application per year (average in hours)
40 40 40
N12 IT fully burdened cost (hourly) $68.75 $68.75 $68.75
N13 Percentage of apps that can shorten testing with Windows 10-as-a-service
50% 50% 50%
N14 Percentage of time saved with shortened testing
75% 75% 75%
N15 IT savings N10*N11*N12*N13*N14
$206,250 $232,031 $257,813
Nt Application provisioning and testing savings N9+N15 $604,087 $1,027,704 $1,322,988
Risk adjustment ↓5%
Ntr Application provisioning and testing savings (risk-adjusted)
$573,882 $976,319 $1,256,838

36 | The Total Economic Impact™ Of The Microsoft 365 E5 Solutions
Reduced Help Desk Calls
The interviewed and surveyed companies indicated that a key benefit
from the EMS implementation was a reduction in call volume to the help
desk, specifically for password resets. Prior to EMS, the organizations
typically did not provide the option for users to reset their own passwords
through a self-service option. As a result, the help desk team spent as
much as 25% of its time handling password reset requests. Furthermore,
this time delay for password resets also hurt the productivity of the
business users who were locked out of their devices and applications
while waiting for a response from the help desk. With Microsoft EMS,
employees can reset their own passwords, reducing help desk calls and
improving user efficiency.
For the financial analysis, Forrester assumes that:
› Each information worker user made six help desk calls a year, 25% of
which were password-related.
› Seventy-five percent of the password-related calls can now be
resolved using self-service tools.
› The average help desk call cost is $20.
This benefit may be lower if self-service tools already exist. To account
for this risk, Forrester adjusted this benefit downward by 5%, yielding a
three-year risk-adjusted total PV of $186,048.
Reduced Security Solution Costs
Windows 10, EMS, and Office 365 Advanced Security Workloads such
as WDATP provide a lot of the technology solutions that all talk to each
other. Organizations previously had to purchase these from multiple
vendors and struggled to tie them together. This improves security, as
discussed above, and lowers costs by eliminating these third-party
solutions and reducing IT support required to integrate and manage the
solutions. Having fewer solutions also means that the deployment and
integration efforts are lower.
Windows 10 includes new and enhanced features that can replace
applications that were purchased from a third-party vendor in the past.
“We are using Windows Defender now,” said the senior IT manager for a
food and beverage conglomerate. Several interviewed organizations
identified both drive encryption and antivirus utilities, along with other
applications.
Reduced Help Desk Calls: Calculation Table
REF. METRIC CALC. YEAR 1 YEAR 2 YEAR 3
O1 Number of password-related calls A1*6*25% 5,250 5,250 5,250
O2 Number of reduced calls O1*75% 3,938 3,938 3,938
O3 Cost per call $20.00 $20.00 $20.00
Ot Reduced help desk calls O2*O3 $78,750 $78,750 $78,750
Risk adjustment ↓5%
Otr Reduced help desk calls (risk-adjusted) $74,813 $74,813 $74,813

37 | The Total Economic Impact™ Of The Microsoft 365 E5 Solutions
Interviewed and surveyed organizations also indicated that a benefit from the EMS implementation was the reduction in legacy license and infrastructure costs. Prior to EMS, they often had an on-premises, point mobile device management solution, which cost more money to purchase and host than EMS. Because the legacy point solution was not fully SaaS-based, the composite organization also had to spend money on the infrastructure to support it. As a result, the composite organization did not have the efficiencies of an all-SaaS mobility management solution provided by one vendor. With Microsoft EMS, the entire solution is SaaS-based and integrated with Azure Active Directory so that all security and access between applications, devices, and users is seamless.
There are additional advanced security workloads within Microsoft 365
E5, including Windows Defender Advanced Threat Protection, Exchange
Online Advanced Threat Protection, Office 365 Cloud App Security,
Advanced Security Management, Customer Lockbox, Advanced
eDiscovery, Microsoft Advanced Threat Analytics, and Advanced Data
Governance solutions. These provide a wide range of benefits across the
organization and can replace many third-party solutions and costs.
For the financial analysis, Forrester assumes:
› Each of the 3,500 information workers has on average 1.2 devices.
There are another 700 shared computers and kiosk for firstline
workers, predominantly in call centers.
› The composite was using a similar EDR tool prior to WDATP, which
cost $50 per endpoint per year.
› Hardware and infrastructure costs related to mobile device
management (MDM) are reduced by 40%.
› The previous MDM maintenance and license costs of $18 are reduced
by 75%.
› For each of the 5,000 users, $30 in desktop/laptop licenses are
eliminated.
› Only 75% of the EDR and antivirus savings are realized in Year 1 to
allow for previous contracts to be closed out.
This benefit will vary based on several factors, including:
› The previous solutions and negotiated pricing.
› The desire to move to Microsoft 365 security solutions.
› The ability to get out of existing contracts.
To account for these risks, Forrester adjusted this benefit downward by
5%, yielding a three-year risk-adjusted total PV of $1.05 million.
“We use the Enterprise Mobility
+ Security to help our
increasingly mobile workforce
access and share data in a
secure fashion on up-to-date
devices, so they can work
more productively.”
Chief technical architect, facility
management service provider

38 | The Total Economic Impact™ Of The Microsoft 365 E5 Solutions
Eliminated Collaboration Solution Costs
Both the interviews and surveys revealed that companies can greatly
reduce or eliminate many cost types associated with their previous
collaboration solutions by moving to the integrated Microsoft solution.
Specifically, organizations can retire third-party collaboration software,
including the required on-premises hardware and telecom costs related
to mobile and long distance, and minimize the risk of shadow IT often
associated with both information workers and firstline workers. With
Microsoft 365 solutions like Skype for Business, Teams, Yammer, and
IM, organizations no longer must rely on third-party solutions and can
save on telecom costs.
From the survey, Forrester learned that:
› Fifty-four percent of respondents reduced expenses related to other
associated communication and collaboration technology costs.
› Fifty-two percent of respondents reduced telecom usage charges, such
as long-distance calling, line rental, and mobile phone charges.
› Respondents saw a 14.1% reduction in communication and
collaboration technology costs.
› Respondents saw a 14.6% reduction in telecom charges.
During our interviews, Forrester heard that:
› “Skype for Business has become our corporate communication
channel, and all our field agents are now using it. We have
dramatically decreased mobile roaming expenses by at least 70%.”
› “We are saving $50,000 to $100,000 per year on our previous video
hosting solution alone.”
› “All the maintenance costs associated with collaboration solutions go
away because it’s in the cloud.”
Reduced Security Solution Costs: Calculation Table
REF. METRIC CALC. YEAR 1 YEAR 2 YEAR 3
P1 Number of endpoint devices A1*1.2+700 4,900 4,900 4,900
P2 Annual prior EDR solution cost Per device $50 $50 $50
P3 EDR savings from WDATP P1*P2 [75% in Year 1]
$183,750 $245,000 $245,000
P4 MDM solution infrastructure savings $228,000*40% [75% in Year 1]
$68,400 $91,200 $91,200
P5 MDM solution license savings 3,500 users*$18*75% [75% in Year 1]
$35,438 $47,250 $47,250
P6 MDM savings from EMS P4+P5 $103,838 $138,450 $138,450
P7 Desktop/laptop/kiosk antivirus savings 3,600 devices*$30 [75% in Year 1]
$81,000 $108,000 $108,000
Pt Reduced security solution costs P3+P6+P7 $368,588 $491,450 $491,450
Risk adjustment ↓5%
Ptr Reduced security solution costs (risk-adjusted) $350,158 $466,878 $466,878
“We will save from $500,000 to
$1,000,000 each year in other
communication solutions by
replacing them with [Microsoft
365].”
VP, financial services

39 | The Total Economic Impact™ Of The Microsoft 365 E5 Solutions
Forrester assumes that:
› The composite organization saves $250,000 for an on-premises
collaboration solution refresh and upgrades, along with 18%
maintenance savings in subsequent years.
› The organization replaces its $80,000-per-year webconferencing
solution with Microsoft 365. In Year 1, only 50% of the benefits are
realized as the previous solution is phased out.
› The organization spends $50,000 less in Year 1 on long-distance and
mobile phone calls by moving them to Microsoft 365 solutions like
Skype for Business and Teams. This number increases to $125,000 by
Year 3 as employees become more comfortable with the Microsoft 365
offerings.
The savings from eliminated collaboration solution costs will vary with:
› The number and cost of solutions previously in place.
› The geographic reach and number of locations where mobile calls are
reduced.
To account for these risks, Forrester adjusted this benefit downward by
5%, yielding a three-year risk-adjusted total PV of $648,727.
Technology Cost Reductions
Organizations experience total cost of ownership savings when moving
from their on-premises solutions to Microsoft 365. They also find value in
consolidating and eliminating solutions from multiple vendors onto a
single platform and by reducing the necessary IT support for this
solution. Microsoft provides a range of FastTrack services that can
reduce deployment cost and effort; these services can also help with
adoption of best practices and configuration optimization.
From the survey, Forrester learned that:
› Fifty-two percent of respondents experienced a reduced total cost of
ownership.
› The elimination of third-party hardware and software reduced IT and
help desk support costs for 49% of respondents.
› Forty-seven percent of respondents saw a reduction in Microsoft
licensing costs.
Eliminated Collaboration Solution Costs: Calculation Table
Ref. Metric Calculation Year 1 Year 2 Year 3
Q1 Eliminated on-premises hardware Maintenance at 18% for
years 2 and 3 $250,000 $45,000 $45,000
Q2 Eliminated webconferencing solution [50% in Year 1] $40,000 $80,000 $80,000
Q3 Reduced telephony costs [50% in Year 1, 125% in Year 3] $50,000 $100,000 $125,000
Qt Eliminated collaboration solution costs Q1+Q2+Q3 $340,000 $225,000 $250,000
Risk adjustment ↓5%
Qtr Eliminated collaboration solution costs (risk-adjusted)
$323,000 $213,750 $237,500

40 | The Total Economic Impact™ Of The Microsoft 365 E5 Solutions
› Thirty-five percent saw savings from the reduction in on-premises
hardware required.
During our interviews, Forrester heard the following:
› “The fact that we manage less of our own hardware is significant. We
are probably saving $500,000 per year.”
› “We have reduced our system administrators and engineers from 10
down to four by moving off-premises.”
› “Our goal is to get out of the data center business. We spend around
$90,000 on our colocation facility, and that doesn’t even include
telecoms. I want to get that down to zero over the next five years by
moving to SaaS solutions.”
Forrester assumes that:
› The composite organization reduces the cost of equivalent on-
premises licenses covering all the functionality of Microsoft 365
Enterprise E5 from $975 per year down to $680 ($57x12 months) for
the Microsoft 365 Enterprise E5 license. This reduction in licenses only
accounts for information workers’ licenses, as the firstline workers are
added as part of the Microsoft 365 implementation. The Analysis Of
Costs section includes the costs associated with Microsoft 365
licensing.
› The organization eliminates the need for $500,000 in hardware that
would have been needed at the time of the implementation of Microsoft
365; it also eliminates the ongoing 18% maintenance costs.
› Compared to the on-premises environment, the required headcount is
reduced by six FTEs to support and manage the various on-premises
hardware and software solutions that are now part of Microsoft 365.
The Analysis Of Costs section includes the ongoing IT support costs
required for support of Microsoft 365.
› The initial deployment effort for Microsoft 365 is less taxing than the
effort for the new on-premises environment that would have been
required to replace the previous end-of-life one. As a result, both
internal and professional services costs are reduced by 35% for
standing up, rolling out, and testing the new solutions. The deployment
efforts required for Microsoft 365 are considered in the Analysis Of
Costs section.
› There is an additional deployment savings from using Microsoft’s
FastTrack services to migrate mailboxes and files. An average mailbox
migration cost of $40 per information worker is included. For file
migration, cost savings include eliminated third-party migration tools
($10,000), Azure servers dedicated to the migration ($10,000), and
internal IT effort to set up and manage the third-party migration tool
(three IT resources for one month = $35,475). The remainder of
internal effort is included in the 35% reduction in deployment costs
discussed above.
The savings from technology costs will vary with:
› The reduction in license costs.
› Required on-premises hardware and support.
To account for these risks, Forrester adjusted this benefit downward by
5%, yielding a three-year risk-adjusted total PV of $6.94 million.
“However you look at it,
moving to [Microsoft 365
Enterprise] drastically reduces
costs.”
CTO, financial services
“The FastTrack migration service
was very helpful and flexible. We
moved the largest amount of
data at the fastest rate that
Microsoft had gone — we
pushed them to go very fast, and
they worked with us on our
problems, instead of sticking with
their schedule. They had bounds
they were supposed to stay in
but quickly worked outside of
them so that they could meet our
goals.”
Director of service operations,
managed cloud computing company

41 | The Total Economic Impact™ Of The Microsoft 365 E5 Solutions
Flexibility, as defined by TEI, represents an investment in additional capacity or capability that could be turned into business benefit for a future additional investment. This provides an organization with the "right" or the ability to engage in future initiatives but not the obligation to do so.
Flexibility
The value of flexibility is clearly unique to each customer, and the
measure of its value varies from organization to organization. There are
multiple scenarios in which a customer might choose to implement
Microsoft 365 solutions and later realize additional uses and business
opportunities, including:
› Utilizing the newest offerings from Microsoft 365, such as Stream.
Microsoft is continually innovating on new product offerings added to
Microsoft 365 solutions. One example is the recent addition of
Microsoft Stream. Stream allows users to upload video, and the
solution automatically adds captions. Each word is scripted out on the
page, so users can search for specific words and fast-forward to the
exact spot in the video they are looking for. It also has facial
recognition for speakers in the video, which creates a timeline based
on the people who speak in the video. With this, users can go directly
to the point in the video with the person they are interested in.
Solutions such as this will help users maximize their business impacts
and save time.
› Utilizing the accessibility features with Office 365. Along with
innovations around product offerings, Microsoft is also planning to
provide inclusive tools for diverse teams, ensuring that digital
experiences are accessible to all employees. Leveraging a wide range
of assistive technologies, Microsoft is working to enable productivity,
collaboration and innovation across all employees with different
accessibility needs. For example, Microsoft has a built-in Accessibility
Checker in apps like Word, Excel, PowerPoint and Outlook to help
employees author accessible content and offers a Presentation
Translator add-in for PowerPoint, enabling real-time subtitles with
presentations. Leveraging these technologies helps to ensure a
productive, inclusive and compliant work environment.
› Increased adoption of Microsoft 365 security solution. Microsoft is
regularly updating and adding security features to Microsoft 365 E5.
Organizations may adopt these features in the future even if they were
Technology Cost Reductions: Calculation Table
Ref. Metric Calculation Initial Year 1 Year 2 Year 3
R1 Reduced licenses 3,500 users*($975-$684) $933,625 $1,018,500 $1,018,500 $1,018,500
R2 Eliminated on-premises costs — hardware and data center hosting
Maintenance following years at 18%
$500,000 $90,000 $90,000 $90,000
R3 Reduced IT ongoing support 6 FTEs*$130,000
[50% realized in Year 1] $390,000 $780,000 $780,000
R4 Reduced initial deployment costs
(St+Tt)*35% $1,331,843
R5 FastTrack savings — email migration
A1*$40 $140,000
R6 FastTrack savings — file migration
3 FTEs*$11,825+ $10,000+$10,000
$55,475
Rt Technology cost reductions R1+R2+R3+R4+R5+R6 $2,960,943 $1,498,500 $1,888,500 $1,888,500
Risk adjustment ↓5%
Rtr Technology cost reductions (risk-adjusted)
$2,812,896 $1,423,575 $1,794,075 $1,794,075

42 | The Total Economic Impact™ Of The Microsoft 365 E5 Solutions
not viewed as a good fit at the time of the original Microsoft 365
migration.
› Increasing the user base and focusing on adoption. Organizations
can further improve the business value they receive by adding
additional users or focusing on adoption to gain more traction and see
wider efficiency and effectiveness throughout the organization.
Flexibility would also be quantified when evaluated as part of a specific
project (described in more detail in Appendix A). None of these flexibility
opportunities are included in the financial analysis.

43 | The Total Economic Impact™ Of The Microsoft 365 E5 Solutions
The table above shows the total of all costs across the areas listed below, as well as present values (PVs) discounted at 10%. Over three years, the composite organization expects risk-adjusted total costs to be a PV of nearly $19.1 million.
Implementation risk is the risk that a proposed investment may deviate from the original or expected requirements, resulting in higher costs than anticipated. The greater the uncertainty, the wider the potential range of outcomes for cost estimates.
Analysis Of Costs
QUANTIFIED COST DATA AS APPLIED TO THE COMPOSITE
Planning, Implementation, And Ongoing Support
The planning and implementation of Microsoft 365 varied greatly
depending on the size and complexity of the rollout. The main variables
around this complexity involve the number of users and locations. For
the 5,000-user composite organization:
› Initial planning and deployment takes 11 months and includes 10
internal FTE resources to support the project. The first 11-month phase
consists of standing up the various Microsoft 365 solutions and
completing early deployments and migrations. In the following year,
four FTEs continue to work on SharePoint migrations, further rolling
out Teams and other communication solutions.
› Ongoing support requires six FTEs for each of the following years (five
in Year 1). Their roles are largely to support and configure Microsoft
365 solutions, to set up and manage user accounts, and to roll out new
solution components. Some of the interviewed and surveyed
organizations chose to use managed services from a Microsoft partner
for these activities, but the in-house scenario is included as part of this
calculation.
› Forrester assumes an average fully burdened annual salary of
$130,000 for these IT resources.
These costs can vary with:
› The size of the deployment and the number of locations and solutions
included.
› The number of FTEs required for initial deployment and ongoing
support.
To account for these risks, Forrester adjusted this cost upward by 10%,
yielding a three-year risk-adjusted total PV of $3.83 million.
Total Costs
Ref. Cost Initial Year 1 Year 2 Year 3 Total Present Value
Str Planning, implementation, and ongoing support
$1,310,833 $1,287,000 $858,000 $858,000 $4,313,833 $3,834,552
Ttr Deployment and managed services
$2,874,960 $1,668,920 $1,072,720 $1,402,720 $7,019,320 $6,332,590
Utr Training $210,875 $203,700 $187,950 $187,950 $790,475 $692,597
Vtr Licensing costs $1,197,000 $2,574,000 $2,574,000 $2,574,000 $8,919,000 $7,598,157
Wtr Additional technology costs $484,050 $61,425 $61,425 $61,425 $668,325 $636,805
Total costs (risk-adjusted) $6,077,718 $5,795,045 $4,754,095 $5,084,095 $21,710,953 $19,094,701

44 | The Total Economic Impact™ Of The Microsoft 365 E5 Solutions
Deployment And Managed Services
The amount of reported professional services varied widely based on
company size and the solutions being deployed. The composite
organization uses professional services to stand up and configure the
solutions and then integrate them with other systems. The professional
services partner brings best practices and template solutions to speed up
the deployment time.
The organization also uses ongoing deployment services to migrate
SharePoint sites and assist with future deployments. Additionally, there
is a managed services contract to manage existing SharePoint sites from
the partner’s offshore support center, and these services grow over time
to include security and help desk.
For the composite organization:
› The number of consultants differs by year and effort, with nine FTEs
involved with initial deployment, dropping to one and a half by years 2
and 3 of analysis.
› The cost per consultant is $1,200 per day and assumes a total of 22
working days per month.
› Managed services increase over time as additional services are added.
The costs associated with deployment and managed services can differ
greatly depending on the required support, size of the organization, and
internal IT skills and capacity. To account for these risks, Forrester
adjusted this cost upward by 10%, yielding a three-year risk-adjusted
total PV of $6.33 million.
Planning, Implementation, And Ongoing Support: Calculation Table
Ref. Metric Calculation Initial Year 1 Year 2 Year 3
S1 Number of months Months 11 12 12 12
S2 FTEs involved in planning and implementation
10 4
S3 FTEs involved in ongoing support
5 6 6
S4 Annual fully burdened salary $130,000 $130,000 $130,000 $130,000
St Planning, implementation, and ongoing support
(S2+S3)*S4/(S1/12) $1,191,667 $1,170,000 $780,000 $780,000
Risk adjustment ↑10%
Str Planning, implementation, and ongoing support (risk-adjusted)
$1,310,833 $1,287,000 $858,000 $858,000

45 | The Total Economic Impact™ Of The Microsoft 365 E5 Solutions
Training
The interviews and survey revealed that organizations sought training for
two reasons: First, the IT department needed training on managing and
using the Microsoft 365 solutions; second, training was required for end
users to teach them how to use the new Microsoft 365 solutions, teach
them the benefits of utilizing the solutions, and drive adoption across the
organization.
For the composite organization, Forrester assumes:
› An outside professional services organization provides IT training at an
average cost of $300 per day of training.
› Two internal FTEs create end user training. These FTEs are
responsible for creating company-specific training content, setting up a
learning portal in SharePoint, and providing “training the trainer”
training to local champions. This is an ongoing effort to ensure that
users are comfortable using all features of the Microsoft 365 solution.
Costs associated with training will vary with:
› The size of the IT team and existing information on the solutions.
› The number of FTEs involved with creating end user training.
To account for these risks, Forrester adjusted this cost upward by 5%,
yielding a three-year risk-adjusted total PV of $692,597.
Deployment And Managed Services: Calculation Table
Ref. Metric Calculation Initial Year 1 Year 2 Year 3
T1 Number of months 11 12 12 12
T2 Number of consultants (FTEs)
9.0 4.0 1.5 1.5
T3 Monthly cost of consultant $1,200 per day*22
working days per month $26,400 $26,400 $26,400 $26,400
T4 Managed services cost $250,000 $500,000 $800,000
Tt Deployment and managed services
(T1*T2*T3)+T4 $2,613,600 $1,517,200 $975,200 $1,275,200
Risk adjustment ↑10%
Ttr Deployment and managed services (risk-adjusted)
$2,874,960 $1,668,920 $1,072,720 $1,402,720
Training: Calculation Table
Ref. Metric Calculation Initial Year 1 Year 2 Year 3
U1 Number of person-days IT user training
150 80 30 30
U2 Cost per day $300 $300 $300 $300
U3 End user training 2 FTEs*85,000
[prorated in Initial period] $155,833 $170,000 $170,000 $170,000
Ut Training (U1*U2)+U3 $200,833 $194,000 $179,000 $179,000
Risk adjustment ↑5%
Utr Training (risk-adjusted) $210,875 $203,700 $187,950 $187,950

46 | The Total Economic Impact™ Of The Microsoft 365 E5 Solutions
Licensing Costs
These represent costs paid to Microsoft for the use of the Microsoft 365
solutions.
For the composite organization, Forrester assumes that:
› The 3,500 information workers receive Microsoft 365 Enterprise E5
licenses at a cost of $57/month per user. In the Initial period, the
average length of usage is six months since there is an upfront period
of testing and deployment, and then users are migrated over time.
› The 1,500 firstline workers receive Microsoft 365 Enterprise F1
licenses at a cost of $10/month per user.
As list price was used, Forrester made no risk adjustment. The three-
year risk-adjusted total PV is $7.60 million.
Additional Technology Costs
In addition to the costs already listed, interviewed and surveyed
respondents needed to replace some computers outside of the normal
refresh schedule and add bandwidth for the increased video and voice
traffic, as well as the upload and retrieval of documents in the cloud.
Many organizations also added ADFS servers to streamline
authentication and single sign-on.
For the composite organization, Forrester assumes that:
› Four hundred computers were added out of cycle in the Initial period at
an average cost of $1,000
› Incremental bandwidth costs $4,500 per month, prorated during the
Initial period.
› The ADFS servers cost $25,000, with a maintenance cost of 18% for
subsequent years.
The amount of additional bandwidth required will vary with existing
bandwidth, the number of solutions, and the extent to which high-
bandwidth solutions such as video conferencing are used. The need to
add additional computers outside of the normal refresh schedule will vary
depending on how old the existing estate is.
To account for these risks, Forrester adjusted this cost upward by 5%,
yielding a three-year risk-adjusted total PV of $636,805.
Licensing Costs: Calculation Table
Ref. Metric Calculation Initial Year 1 Year 2 Year 3
V1 Microsoft 365 Enterprise E5 license cost
$57/month*12 months [6 months in Initial
period] $342 $684 $684 $684
V2 Number of users 3,500 3,500 3,500 3,500
V3 Microsoft 365 F1 license cost $10/month*12 months $120 $120 $120
V4 Number of users 1,500 1,500 1,500
Vt Licensing costs (V1*V2)+(V3*V4) $1,197,000 $2,574,000 $2,574,000 $2,574,000
Risk adjustment 0%
Vtr Licensing costs (risk-adjusted) $1,197,000 $2,574,000 $2,574,000 $2,574,000

47 | The Total Economic Impact™ Of The Microsoft 365 E5 Solutions
Additional Technology Costs: Calculation Table
Ref. Metric Calculation Initial Year 1 Year 2 Year 3
W1 Out-of-cycle computer refresh 400 computers*$1,000 $400,000
W2 Incremental bandwidth $4,500 per month
[prorated in Initial period] $36,000 $54,000 $54,000 $54,000
W3 ADFS servers Maintenance at 18% $25,000 $4,500 $4,500 $4,500
Wt Additional technology costs W1+W2+W3 $461,000 $58,500 $58,500 $58,500
Risk adjustment ↑5%
Wtr Additional technology costs (risk-adjusted)
$484,050 $61,425 $61,425 $61,425

48 | The Total Economic Impact™ Of The Microsoft 365 E5 Solutions
The financial results calculated in the Benefits and Costs sections can be used to determine the ROI, NPV, and payback period for the composite organization’s investment. Forrester assumes a yearly discount rate of 10% for this analysis.
Financial Summary
CONSOLIDATED THREE-YEAR RISK-ADJUSTED METRICS
Cash Flow Chart (Risk-Adjusted)
These risk-adjusted ROI,
IRR, NPV, and payback
period values are
determined by applying
risk-adjustment factors to
the unadjusted results in
each Benefit and Cost
section.
Cash Flow Table (Risk-Adjusted)
INITIAL YEAR 1 YEAR 2 YEAR 3 TOTAL PRESENT VALUE
Total costs ($6,077,718) ($5,795,045) ($4,754,095) ($5,084,095) ($21,710,953) ($19,094,701)
Total benefits $2,812,896 $10,916,181 $18,468,743 $19,352,209 $51,550,029 $42,539,722
Net benefits ($3,264,822) $5,121,136 $13,714,648 $14,268,114 $29,839,076 $23,445,021
ROI/IRR 123%/227%
Payback period after “go-live” 10 months

49 | The Total Economic Impact™ Of The Microsoft 365 E5 Solutions
Microsoft 365 Enterprise E5 solutions: Overview
The following information is provided by Microsoft. Forrester has not validated any claims and does not endorse
Microsoft or its offerings.
Microsoft 365 Enterprise is a complete, intelligent solution that brings together the best of Office 365, Windows
10 Enterprise, and Enterprise Mobility + Security, and empowers everyone to be creative and work securely
together.
Unlocks creativity
› Create compelling content with Intelligent apps.
› Work naturally with ink, voice, and touch.
› Visualize information in new ways.
› Connect the experience across devices.
Built for teamwork
› Email and calendar with Exchange.
› Connect to people, content, and apps with SharePoint.
› Voice, video, and chat with Skype for Business and Microsoft Teams.
› Network across the organization with Yammer.
› Coauthor with Office 365 ProPlus.
Integrated for simplicity
› Modern desktop experience.
› Flexible device management.
› Integrated administration tools and insights.
› Built-in compliance solutions.
Intelligent security
› Identity and access management.
› Information protection.
› Threat protection.
› Security management.
› Accelerate GDPR compliance.

50 | The Total Economic Impact™ Of The Microsoft 365 E5 Solutions
Appendix A: Total Economic Impact
Total Economic Impact is a methodology developed by Forrester
Research that enhances a company’s technology decision-making
processes and assists vendors in communicating the value proposition
of their products and services to clients. The TEI methodology helps
companies demonstrate, justify, and realize the tangible value of IT
initiatives to both senior management and other key business
stakeholders.
Total Economic Impact Approach
Benefits represent the value delivered to the business by the
product. The TEI methodology places equal weight on the
measure of benefits and the measure of costs, allowing for a
full examination of the effect of the technology on the entire
organization.
Costs consider all expenses necessary to deliver the
proposed value, or benefits, of the product. The cost category
within TEI captures incremental costs over the existing
environment for ongoing costs associated with the solution.
Flexibility represents the strategic value that can be
obtained for some future additional investment building on
top of the initial investment already made. Having the ability
to capture that benefit has a PV that can be estimated.
Risks measure the uncertainty of benefit and cost estimates
given: 1) the likelihood that estimates will meet original
projections and 2) the likelihood that estimates will be
tracked over time. TEI risk factors are based on “triangular
distribution.”
The initial investment column contains costs incurred at “time 0” or at the
beginning of Year 1 that are not discounted. All other cash flows are discounted
using the discount rate at the end of the year. PV calculations are calculated for
each total cost and benefit estimate. NPV calculations in the summary tables are
the sum of the initial investment and the discounted cash flows in each year.
Sums and present value calculations of the Total Benefits, Total Costs, and
Cash Flow tables may not exactly add up, as some rounding may occur.
Present value (PV)
The present or current value of (discounted) cost and benefit estimates given at an interest rate (the discount rate). The PV of costs and benefits feed into the total NPV of cash flows.
Net present value (NPV)
The present or current value of (discounted) future net cash flows given an interest rate (the discount rate). A positive project NPV normally indicates that the investment should be made, unless other projects have higher NPVs.
Return on investment (ROI)
A project’s expected return in percentage terms. ROI is calculated by dividing net benefits (benefits less costs) by costs.
Discount rate
The interest rate used in cash flow analysis to take into account the time value of money. Organizations typically use discount rates between 8% and 16%.
Payback period
The breakeven point for an investment. This is the point in time at which net benefits (benefits minus costs) equal initial investment or cost.

51 | The Total Economic Impact™ Of The Microsoft 365 E5 Solutions
Appendix B: Supplemental Material
In addition to the new information collected for this study, from additional customer interviews, data points, and
quotes, the following studies were also included in this study:
Related Forrester Research
› “The Total Economic Impact™ Of Office 365 Enterprise E5 Solutions,” Forrester Consulting report prepared for
Microsoft, July 2018.
› “The Total Economic Impact™ Of Microsoft 365 Teamwork Solutions,” Forrester Consulting report prepared for
Microsoft, July 2018.
› “The Total Economic Impact™ Of Microsoft 365 Education,” Forrester Consulting report prepared for Microsoft,
January 2018.
› “Improving Firstline Worker Performance With Microsoft Office 365: A Forrester Total Economic Impact™
Analysis,” Forrester Consulting report prepared for Microsoft, September 2017.
› “Achieving Digital Business Transformation With Microsoft 365 Enterprise E5: A Total Economic Impact™
Analysis,” Forrester Consulting report prepared for Microsoft, September 2017.
› “The Total Economic Impact™ Of Microsoft Windows Defender Advanced Threat Protection,” Forrester
Consulting report prepared for Microsoft. July 2017.
› “The Total Economic Impact™ Of Microsoft Windows 10,” Forrester Consulting report prepared for Microsoft,
December 2016.
› “The Total Economic Impact™ Of Microsoft’s Enterprise Mobility Suite,” Forrester Consulting report prepared
for Microsoft. July 2015.

52 | The Total Economic Impact™ Of The Microsoft 365 E5 Solutions
Appendix C: Endnotes
1 Source: Forrester Analytics Global Business Technographics® Priorities and Journey Survey, 2017. 2 Source: Forrester Analytics Global Business Technographics Applications And Collaboration Workforce Survey, 2016. 3 Source: “2017 Cost of Data Breach Study,” Ponemon Institute, June 2017.